Embed Size (px)
Citation preview
Surrendering Control to Gain Advantage: Reconciling Openness and the Resource-based View of the Firm
Oliver Alexy
Technische Universität München TUM School of Management
Arcisstr. 21, 80333 Munich, Germany T: +49-89-289-25741 – E: [email protected]
Joel West Keck Graduate Institute
School of Applied Life Sciences 535 Watson Drive, Claremont, CA 91711
T: +1-909-293-8550 – E: [email protected]
Helge Klapper University of Vienna
Department of Business, Strategic Management Oskar-Morgenstern-Platz 1, 1090 Vienna, Austria
T: +43-1-4277-37975 – E: [email protected]
Markus Reitzig University of Vienna
Department of Business, Strategic Management Oskar-Morgenstern-Platz 1, 1090 Vienna, Austria
T: +43-1-4277-37970 – E: [email protected]
September 23, 2016
Forthcoming in Strategic Management Journal
Special issue on “New Theory in Strategic Management”
Guest Editors: Jay B. Barney, Richard M. Burton, Donald C. Hambrick, Richard Makadok, and Edward J. Zajac
- 1 -
SURRENDERING CONTROL TO GAIN ADVANTAGE:
RECONCILING OPENNESS AND THE RESOURCE-BASED VIEW OF THE FIRM
ABSTRACT
Research Summary: Strategic openness—firms voluntary forfeiting of control over resources—seemingly challenges the premise of the resource-based view (RBV), which posits that firms should control valuable, rare, and inimitable (VRI) resources. We reconcile this apparent paradox by formalizing whether and when firms—consisting of resource bundles and deriving competitive advantage from exploiting selected VRI resources—may maximize profitability by opening parts of their resource base. As such, our paper refines RBV-related thinking while supporting the theory’s core tenets. Notably, we illustrate how a common-pool resource can become a source of competitive advantage and how firms may use openness to shape inter-firm competition. Managerial Summary: Conventional wisdom holds that firms must control scarce and valuable resources to obtain competitive advantage. That being said, over the past decade many firms – amongst them Computer Associates, IBM, and Nokia – embarked on open strategies and made parts of their valuable resources available for free. These decisions pose an obvious conundrum, which we solve in our paper. We use a mathematical model, grounded in principles of the resource-based view, to show why and under what conditions open strategies will succeed. Firms significantly improve their performance when (1) opening resources reduces their cost base while (2) strongly increasing demand for their still-proprietary resource(s). We also explain how openness can reshape markets by weakening competitors, particularly in highly rivalrous environments.
Running Head: Reconciling Openness and the Resource-based View of the Firm
Keywords: resource-based view, competitive advantage, strategic openness, resource value, complementary assets
- 2 -
“Occam’s Razor has a double edge. … In whichever way we interpret Occam’s principle, parsimony can be only a secondary consideration in choosing between theories, unless those theories make identical predictions”
From Herbert Simon’s Nobel Lecture (Simon, 1979: 495)
Novel empirical phenomena provide a testing ground for extant theories, and sometimes put the
latter on trial. The field of strategy is no exception to this. Here, given its centrality in the
strategy domain, the resource-based view (RBV) (e.g., Barney, 1991; Barney & Arikan, 2001;
Peteraf, 1993; Wernerfelt, 2013) has often been at the receiving end of calls for extensions, either
explicitly (e.g., Priem & Butler, 2001; Priem, Butler, & Li, 2013) or implicitly. Over the past two
decades, one of these implicit calls has been made so eloquently and repeatedly that it can no
longer be dismissed offhand. This is the assertion that the emergence of strategic openness
(Henkel, 2006; Varian & Shapiro, 1999; West, 2003)—firms voluntarily forfeiting control over
resources—would require modifications to current thinking, as theories in their extant form,
including the RBV, would stop short of both predicting observable behavior and linking
competitive advantage to ceding resource ownership (e.g., Alexy & Dahlander, 2014; Baldwin &
von Hippel, 2011; Boudreau, 2010; Chesbrough & Appleyard, 2007; Dahlander & Gann, 2010;
Laursen & Salter, 2006; Vanhaverbeke & Cloodt, 2014; West & Bogers, 2014; West et al.,
2014).
As with Simon’s metaphor on Occam’s razor, such requests for modifications to theory
would be legitimate if and only if the RBV in its extant form actually fails to explain strategic
openness. Absent such compelling need, the potential costs are high for inappropriately risking
the parsimony of one of the core theories in our field (Barney & Arikan, 2001), and would have
potentially far-reaching implications for inferences drawn from prior studies. We contend that
whether strategic openness necessitates novel theory is a question that cannot be conclusively
resolved by the ongoing verbal debate over whether competitive advantage requires resource
- 3 -
control, as seeming discrepancies between extant theory and empirics could both be attributed to
misconceptions in the RBV about resource control or to misguided inferences drawn from the
RBV by its critics.
To assess whether strategic openness truly necessitates modifications to the RBV, we suggest
making the discussion more tractable by clearly re-defining core constructs and unpacking
original assumptions of the RBV (see also Adner et al., 2009). We then formally rebuild RBV
arguments to see whether the different facets of strategic openness can be predicted by the
theory’s core assumptions, or whether extensions appear truly necessary.
We follow a three-pronged research strategy. First, we conceptually disentangle the notions
of customer value created and the firm-level value (or profit) captured from the same resource,
elucidating the potential two-edged effect of openness on firm profitability. Second, we return to
modeling firms as bundles of complementary resources as envisioned in the original RBV
contributions (e.g., Barney, 1988; Penrose, 1959; Rumelt, 1984; Wernerfeld, 1984). Elaborating
on an earlier formalization (Economides & Katsamakas, 2006), we delineate how the complex
interplay between inimitability and value between two different but complementary resources
held by one firm may have an impact on firm profitability. Here, one focal player can choose to
endogenously waive control over a resource to make it imitable, when such opening increases
firm profitability. Third, we extend our model to include varying numbers of rival multi-resource
firms that compete for profits in a Cournot game, and we parameterize important factors that to
delineate the boundary conditions under which strategic openness can potentially be profit-
maximizing within a formal RBV framework. Eventually, we deploy our formalization as a lens
to explain a series of observable forms of resource deployment through strategic openness.
Our main finding is that the better-known forms of firms voluntarily forfeiting control over
- 4 -
valuable assets can be explained by our model that builds on core assumptions of the RBV. In
particular, we show how for a monopolist, strategic openness is a rational decision when it
reduces the costs to produce the bundle of resources, or increases the value captured from the
still-proprietary complement. In oligopoly competition, the decision to strategically open a
resource is further determined by the substitutability of the open resource in the firm bundle, as
well as by the number of rivals in the market.
Our analysis allows us to make four contributions to the strategy and innovation literature.
First, by building on the intrinsic assumption of the RBV to analyze firms as bundles of
resources and modeling their complex interplay on firm profitability, we reconcile empirical
observations of strategic openness with extant theory. Second, our formalization allows us to
derive new insights for strategy research. Here, we point to the need to adopt a less ownership-
centric definition of control than often applied. Taking such a broader perspective allows us not
only to explain openness within the RBV but also to gain new understanding of strategic factor
markets, as when firms derive competitive advantage by creating common-pool resources open
to their rivals. Third, we provide a new lens to study some of the dynamics driving the choice of
capability-building over resource-picking strategies (Makadok, 2001). Finally, for openness
researchers, we unpack the importance of complementarity and the competitive dynamics of
value creation and capture unleashed by openness in the face of multi-player competition —
suggesting when openness will help or hurt the focal firm, its rivals, or both.
The rest of the paper follows the three-pronged approach delineated above: we introduce the
core constructs of openness, value-creation through and value-capture from resources, before we
formalize their complex interplay and compare resulting predictions to the known universe of
instances of strategic openness.
- 5 -
STRATEGIC OPENNESS
This century has brought increasing evidence of a world of openness, in both practice and
management research (e.g., Chesbrough, 2003; Dahlander & Gann, 2010; Laursen & Salter,
2006; von Hippel & von Krogh, 2003). Here, “open” and “closed” (i.e., “proprietary”)
approaches to generating and retaining value are usually conceived of as antonyms, with
proprietary approaches representing the traditional (default) case of running a business (e.g.,
Economides & Katsamakas, 2006) and hybrid strategies combining proprietary and open
elements (West, 2003). The dictionary definition of “open” emphasizes reducing or eliminating
access restrictions (OED Online, 2013)—in our case those resulting from proprietary control.
This means that the firm grants other parties access to aspects of one or more of its resources.
Such openness seems more common for knowledge, information goods, and other intangible
resources, which can be more easily reconfigured by firms seeking competitive advantage (e.g.,
Miller & Shamsie, 1996), but is also found in historical contexts such as blast furnaces in 19th-
century England (Allen, 1983) as well as in today’s furniture (Füller, 2010) and construction
industries (Dodgson, Gann, & Salter, 2007). Along these lines, a large body of literature (for
recent reviews, see Chesbrough & Bogers, 2014; West & Bogers, 2014) has emerged describing
to whom firms may be open (rivals, customers, suppliers, etc.), what can be made open (past
outputs, current processes, or inputs for future production), how firms can be open (governance,
legal and organizational structure), just why firms should be open, and how much.
What is common to all forms of strategic openness is surrendering at least partial control
over a portion of a firm’s current or future asset base (Boudreau, 2010). Without further
qualification, this devolution of control is clearly at odds with the core tenet of the RBV, holding
that companies should try to control valuable, rare, inimitable, and non-substitutable (VRIN)
- 6 -
resources (e.g., Barney & Arikan, 2001) and organize (VRIO) to capture value (e.g., Barney,
2007). Although ownership is not the only means of control (e.g., Pfeffer & Salancik, 1978: pp.
47–50), notions of control in the RBV largely center on ownership (e.g., Hsu & Ziedonis, 2013;
Wernerfelt, 2013)—that companies must build or acquire resources, and only if protected from
competitors can they be a source of competitive advantage. Importantly, this logic even includes
situations in which firms are encouraged to partner with others to create competitive advantage,
when the assumption is that those partners own their respective resources (e.g., Lavie, 2006).
Openness, in contrast, implies a purposive reduction or even elimination of inimitability
(“I”). While the firm may still seek to retain advantage by controlling further development of the
opened resource (Garud & Kumaraswamy, 1993; West & O'Mahony, 2008), almost by definition
whatever is opened may be imitated, and any resource that is imitable will soon be less rare.1
To explain why and when firms employ strategic openness within the RBV, we must thus
understand how firms mitigate losing control of a VRIO resource and the competitive advantage
attained from such control. To that end, we proceed by analyzing in turn the effects of openness
on value creation and value appropriation.
CREATING AND APPROPRIATING VALUE THROUGH OPENNESS
Openness and resource value: The effects on consumer surplus
How does openness affect resource value? We start from a customer-centric definition of value,
by which resource value is equivalent to the consumer surplus it creates—the difference between
the use value consumers can extract and the price they are charged for it (Bowman & Ambrosini,
2000; Hoopes, Madsen, & Walker, 2003; Priem & Butler, 2001; Priem et al., 2013). Following
1 Firms may offer partial openness in hopes of retaining inimitability: for example, the firm may release the
blueprints of a product but not disclose its specific method of producing the output. It might also hope to deter imitation through complexity and causal ambiguity (Ryall, 2009). However, rivals may infer a way to replace the missing information, even if not the exact approach used by the opening firm. We will return to this point when discussing the conditions under which openness may turn out to be detrimental to the focal firm.
- 7 -
that definition, openness may increase resource value in three distinct but related ways: price
reduction, customizability benefits, and improvements in coordination. First, if openness allows
for imitation, it can be produced by existing rivals, new entrants, or the end customer; reducing
lock-in, increasing competition, and thus reducing price (Farrell & Gallini, 1988; Varian &
Shapiro, 1999), quite likely to zero (Henkel, 2004). Second, customers or third parties can
customize an open resource to meet their individual needs. This seems particularly value-
enhancing for modular product designs (Baldwin & Clark, 2000), where customization of one
component comes at low integration costs.
Finally, openness may allow firms to better coordinate on jointly creating novel, complex
value propositions, such as platforms and ecosystems (e.g., Adner, 2012; Baldwin & Woodard,
2007; Pisano & Teece, 2007). In particular when several of these emerging complex value-
propositions compete, customers may shy away from committing to a proprietary technology
because they fear being orphaned if the technology fails (Varian & Shapiro, 1999). A common
example is cooperative inter-firm standardization, where dominant firms share technology that
enables both cooperation and entry by others—as when Tesla opened its proprietary technology
for electric car charging (Moritz et al., 2015).
Openness and value capture: The importance of the bundle as the level of analysis
While openness can thus plausibly enhance the value of a resource, it is unclear whether these
effects alone can rationalize a firm’s decision to waive control over its assets, as firms care about
the value they can appropriate rather than the value they generate for customers (MacDonald &
Ryall, 2004). With the price of the opened resource decreasing (usually to zero), for strategic
openness to be a reasonable firm choice from an RBV perspective, the resulting losses from
waiving inimitability must be offset by other benefits. However, for RBV research that focuses
- 8 -
on the role of individual resources (e.g., Costa, Cool, & Dierickx, 2013; see also Kraaijenbrink,
Spender, & Groen, 2010), this seems hardly plausible, which is the key concern voiced regarding
RBV’s explanatory power over openness (e.g., Alexy & Dahlander, 2014; Vanhaverbeke &
Cloodt, 2014): even if the open resource were more valuable per our above argument, how could
the same firm capture this value at a zero price?
To address this point, we propose to return to the bundle of resources as the appropriate level
of analysis (e.g., Armstrong & Shimizu, 2007; Barney, 1988; Kraaijenbrink et al., 2010;
Newbert, 2007; Penrose, 1959; Rumelt, 1984; Wernerfeld, 1984). At this level, we not only
demonstrate that less control may increase the profitability of the firm by being open, but also
when it will do so. As we propose and formalize below, opening a resource can improve
profitability either through saving costs, or by capturing more value from complementarity with
other resources the firm controls (Barney, 1988), rendering those other resources more VRI than
they would otherwise be.2 Here, cost savings may realistically result in the form of resource
retrenchment, when firms manage to lower the costs of production of the focal resource by
collaborating with customers, complementors, or rivals. Complementarity benefits may
realistically arise through value migration, when firms leverage synergies between the open
resource and its still-proprietary complement to increase the profits accruing from the sales of the
latter, to a level that is higher than created from the fully closed resource bundle before.
Exactly when strategically opening a focal resource increases the value captured in the
complementary resource enough to maximize the focal firm’s overall profits has eluded verbal
theorizing (e.g., Bresnahan & Greenstein, 1999; Garud & Kumaraswamy, 1993; Varian &
2 To be more precise, our argument focuses on the increase in value, given that the complement should likely be as
rare and inimitable as it was before.
- 9 -
Shapiro, 1999; West, 2003), and thus requires a formal analysis.3 To that end, we begin from the
game-theoretical work of Economides and Katsamakas (2006) to ensure comparability with prior
assumptions and results, but we focus on parameter inter-relations and comparative statics
pertaining to resource costs and resource complementarity not previously examined by these
authors. This approach allows us to delineate the conditions under which monopolists fare better
opening a part of their resource bundle than keeping their entire asset base proprietary.
Modeling openness: the monopoly case
Mathematical modeling has a long tradition in the literature on the competitive effects of
openness (e.g., Axelrod et al., 1995; Baldwin & von Hippel, 2011; Casadesus-Masanell &
Ghemawat, 2006; Farrell & Saloner, 1992; Parker & Van Alstyne, 2014). Our baseline model
parallels earlier work of Economides and Katsamakas (2006), who formalize the competition
between two platforms, one open (e.g., Linux) and one proprietary (e.g., Windows), each of
which features one proprietary application.
To build a parsimonious model fully conforming to the RBV (shown in Appendix 1), we
include only a minimum of parameters: one profit-maximizing firm, producing a bundle of two
complementary resources (denoted by asymmetric complementarity parameters k1 and k2),
incurring fixed costs (c1 and c2) to produce each. The basic model compares the profits for a
given firm for two states of the world: one closed, and one in which the firm chooses to open a
part of its resource base. In the closed state, the monopolist produces a product from two
complementary resources, each of which faces a negative linearly sloping demand curve (see
Equations (1)–(6) in Appendix 1). In the open state of the world, the firm produces only the
complement (q1), whereas the focal resource (q2) is produced at least partly by the public
(providing the firm with a cost reduction ∆c) (Equations (7) and (8)). The firm then chooses
3 We are grateful to an anonymous reviewer for suggesting this approach.
- 10 -
optimal output quantities for the resource it produces, with marginal costs of zero (Equations
(9)–(12)). Accordingly, in the open case, the monopolist can also no longer set the price of the
open resource, which goes to zero (p2 = 0), an assumption we will relax later when looking at
openness in a multi-firm setting.
As is easily shown, the mechanics of our model are consistent with our aforementioned
arguments pertaining to the effects of opening a resource on customer value: if the two resources
are complements, a positive change in demand in the focal resource will shift the demand curve
up for the complement. In turn, whether the monopolist can benefit by choosing openness will
depend on how much of its production costs ∆c it can eliminate by going open, and how much
demand q1 increases because of complementarity k1.
The results of the baseline model are summarized in Figure 1, which shows that both higher
cost reduction and complementarity strictly increase the value a monopolist may capture from a
bundle that includes the opened resource. We next take each of these parameters in turn. First,
we formalize their effect based on our model results. Second, we study whether the formal RBV-
based logic we derived can explain a range of real-world manifestations of strategic openness.
—Insert Figure 1 about here—
Cost reduction through resource retrenchment
We first focus on the benefits the focal firm may obtain from employing openness to reduce its
production cost for the focal resource within the framework of our assumptions. Analogously to
Helfat and Peteraf’s (2003) “capability retrenchment,” we term this approach resource
retrenchment. At the bundle level, resource retrenchment may substantially lower the costs of
production, thus directly affecting the profits the firm may generate. This intuition is illustrated
in Figure 1. Here, the cost axis can be interpreted as change in fixed cost between the closed and
- 11 -
open cases, with performance improving with increasing cost reduction ∆c; for a sufficiently
large cost reduction ∆c, openness is strictly beneficial (see also Equation (13)): We thus posit:
Proposition 1: According to the RBV, in order to capture value from resource retrenchment, fixed-cost savings in the focal resource must be sufficiently high.
We maintain that this proposition accurately captures the logic underlying resource
retrenchment, and that it fully explains examples from practice: in general, the literature has
identified a series of conditions under which individual as well as corporate actors would support
a focal firm in reducing its costs by co-developing the open resource (e.g., von Hippel & von
Krogh, 2003). Individual actors have diverse motivations, ranging from the desire to work on
interesting problems, to the need for a specific derivative product, to the wish for status in a
community or recognition by employers (for a recent review, see von Krogh et al., 2012).
Corporate actors may participate if joint production of the open source reduces their own cost,
too, analogous to the logic of research consortia (Grindley, Mowery, & Silverman, 1994). A
point in case is IBM, which invested an estimated $100 million fixed costs annually to support
development of the Linux operating system—20% of the cost needed to sustain a comparable
proprietary one (Abreu, 2001). Finally, volunteers taking over parts of the production process
may not only decrease corporate costs, but also help increase resource quality in the long run
(Henkel, 2004, 2006). In turn, we see three types of resource retrenchment that firms may engage
in by opening up a focal resource and that are fully reconcilable with our model.
The first case denotes a situation where the resource itself is being produced at prohibitively
high costs, threatening the firm’s ability to deploy the complement. By opening up the focal
resource, the firm may reasonably expect reduced costs and higher customer value. This logic
corresponds to Netscape’s 1998 decision to open-source its browser to fight back against
Microsoft’s bundling of its own browser with the Windows operating system (Windrum, 2004).
- 12 -
While Netscape had already given away the browser at zero price in hopes of selling more of its
complementary server product, Microsoft had integrated its browser with its operating system,
and in this way established a (temporary) quasi-monopoly on the web browser market which it
could also use to improve the competitive position of its complementary server product. In
opening its browser, Netscape sought to improve both its cost position thanks to volunteer
developers and its web browser market share because of its increased use value for customers.
Second, firms may use resource retrenchment to coordinate on joint production: if a group of
firms expects to attain no competitive advantage from a focal open resource, but all seek to
exploit proprietary complements, then joint production of the focal open resource should be
attractive to all firms in the group (Katz, 1986; Katz & Ordover, 1990). This explains why IBM
donated 500 patents to the open source community (Alexy & Reitzig, 2013), prompting other
firms (such as Computer Associates and Nokia) that also draw on the open source operating
system Linux to provide proprietary complements to follow their example.
Finally, firms may open up a resource in the hope of trading it on the strategic factor market
for another resource of greater value. In particular, being open may help reduce the (fixed) costs
of acquiring human capital or intangible assets. Here, firms essentially gain symbolic advantages
from openness, leading to improved brand image (Füller, 2010), reputation for innovativeness
(Schreier, Fuchs, & Dahl, 2012), or labor market position. This logic explains, for example, why
Germany’s Dresdner Bank released internally developed software as open source—to signal to
IT professionals that it was a “cool” employer (Henkel, 2004).4
Shifting value capture through value migration
Second, our formalization shows how openness is a way to exploit complementarities between
4 This logic includes the idea of openness as a “marketing stunt”—revealing a resource that no longer is of any use
to the company, just to get good press—as IBM did with its Jikes compiler for Java (West & Gallagher, 2006).
- 13 -
two resources. Firms have long used strategies of reducing value capture from one resource to try
and extract more value from another using “razor & blades” business models (Tripsas & Gavetti,
2000). We use the term value migration (Jacobides, MacDuffie, & Tae, 2016; Jacobides & Tae,
2015; Slywotzky, 1996) to describe such targeted strategies for abandoning proprietary control
over resources. Its logic is formalized via the complementarity parameter k1, which captures a
shift in the demand curve of the proprietary resource enabling the firm to capture customers’
(increased) willingness to pay for the bundle entirely via the proprietary resource.5 From Figure
1 and Equation (13), we can infer that the value of open strategies strictly increases with k1. We
thus posit:
Proposition 2: According to the RBV, in order to capture value from value migration, complementarity between the focal resource and the proprietary complement in the bundle need to be sufficiently high.
Empirically speaking, the hopes for realizing gains from value migration resemble a gamble by
which an increase in diffusion of an open resource will be rewarded by increased profits in a
complement (Jacobides, Knudsen, & Augier, 2006; Simcoe, 2006; Varian & Shapiro, 1999).
Such approaches are well known in the literature on platform competition and two-sided
markets, where the provision of free resources creates an installed base that is the starting point
for direct or indirect network effects (e.g., Conner & Rumelt, 1991; Parker & Van Alstyne, 2005;
Zhu & Iansiti, 2012). Here, openness becomes a competitive weapon to establish standards or
platforms (Brandenburger & Nalebuff, 1996; Varian & Shapiro, 1999).6 To leverage network
effects from openness (Eisenmann, Parker, & Van Alstyne, 2009; Varian & Shapiro, 1999),
particularly in the early stages of a technology (Alexy, George, & Salter, 2013), firms attempt to
5 We make the conservative assumption that the slope of the demand curve does not shift, so that it benefits the firm. 6 Cooperative standardization has strong welfare benefits if it promotes adoption or provision of complements. It
increases ex post competition while reducing ex ante competition. The net effect on competition is usually positive unless the standard is designed to generate intellectual property royalties for its sponsors (Shapiro, 2001).
- 14 -
attract customers with an open platform and appropriate value through proprietary complements,
or vice versa (Boudreau, 2010; West & Gallagher, 2006). The former includes Google’s free
Android operating system for mobile phones; the latter corresponds to video game modifications,
when customers modify and add value to existing games (Jeppesen & Molin, 2003).
Value migration as captured by our model hence describes purposive strategies by which the
firm, or a group of firms, tries to commoditize one market (segment) by opening up a resource
and shifting profits and competition entirely to the complement (West, 2003). Yet, following our
definitions, benefiting from the proprietary complement requires continued access to the open
resource. Being irrevocable, strategic openness can ensure this access and freedom-to-operate
reliably, inexpensively, and permanently (Alexy & Reitzig, 2013). Consider IBM’s release of its
Eclipse framework, originally an attempt to foster a standard in IBM’s in-house software
development: by providing customers a free, unified platform, Eclipse rapidly diffused to
become the de facto standard for programmers around the globe (Abreu, 2001). To this day, IBM
benefits from its intimate knowledge of Eclipse and its strong compatibility with IBM’s tightly
integrated set of related proprietary products and services.
Finally, to ensure continuous downstream compatibility, firms may also retain some control
over the production process. An example is the Structural Genomics Consortium, where several
firms collaborate with leading universities to map proteins that the firms then separately use to
identify drug candidates (Perkmann & Schildt, 2015). In a clearly defined process for prioritizing
proteins to be researched, participants ensure cheaper access to pre-competitive R&D, which
they can leverage with proprietary assets in drug development, testing, and distribution.
WHEN DOES OPENNESS LEAD TO COMPETITIVE ADVANTAGE?
Until now, we have largely disregarded the role of competition in assessing whether openness
- 15 -
benefits the firm. Taking the monopolist’s perspective allowed us to focus—in the terminology
of the VRIO framework of the RBV—on the question of how openness may increase the value
created (“V”) in the eyes of customers and the value captured (“O”) by firms. At the same time,
the single-case firm prevented us from studying the competitive effects of opening a resource in
terms of making it less inimitable (“I”) and rare (“R”). This section explicates the competitive
dimension of openness.
We look at the effects of strategic openness on the competitive landscape for four distinct
scenarios, reflected in the sectors of Table 1. These depict situations in which (I) both the firm
opening the resource and its competitors benefit, (II) the open firm benefits while competitors do
not, (III) the converse case, and (IV) both lose profits compared to a purely proprietary strategy.
These four scenarios, so we argue, capture the first-order considerations strategic managers
contemplate when thinking about opening their resource base in a competitive environment. As
with the earlier model results, we begin by formalizing our arguments. Then, we map empirical
observations for each of these scenarios to our model, both to corroborate our formal logic and to
suggest more generally which firms will profit or lose as a consequence of strategic openness.
—Insert Table 1 about here—
Modeling competition between open and closed rivals
To develop a parsimonious RBV-based model suited to predicting firms’ seemingly
counterintuitive behavior to forfeit resource control, we introduce only two additional and
uncritical parameters for the multi-firm case: the number of competitors n and substitutability s
between resources to enable competition. Specifically, as before, the firm and each of its n
competitors produce a bundle of two resources each, one focal and one complementary, with
quantity q1i/j and q2i/j, and price p1i/j and p2i/j. Each complementary resource features a
- 16 -
complementarity factor k denoting the degree to which its demand is driven by the demand for
the focal resource held by the same firm (i.e., within-firm complementarity).7 Each focal
resource features a substitution factor s denoting the substitutability between the open firm’s
focal resource and that of rivals (i.e., between-firm substitution), where only the open firm may
decide to open its focal resource (Equations (14)–(19)). All firms then simultaneously maximize
profits by adjusting their produced quantities for both resources (Equations (20)–(25)).
Figure 2a provides the comparative statics for the duopoly case. We assume a change in costs
(∆c = 0.1) for the open firm (Equations (26)–(29)), which can no longer charge for the open
resource (p2i = 0) (Equations (30) and (31)). For sufficiently low levels of substitutability, we see
that increases in within-firm complementarity increase the performance of the open firm. We
also see that for sufficiently high levels of s (≈0.4), profits for the open firm increase with
increasing k up to a point where they start to decrease again (Equations (32)–(38)). This is the
result of an assumption of our model: given that the firm cannot set prices on the open resource,
in these regions the closed competitors can regain some ground (and eventually outperform the
open firm) via cross-subsidization (i.e., they accept a negative price on their respective second
resources), consistent with related work (Economides & Katsamakas, 2006). If the open firm is
also allowed to cross-subsidize the open resource, it no longer loses market share to cross-
subsidizing competitors (as shown in Figure 2b; see also Appendix 1C).
Summing up these insights, we see how openness benefits the different duopolists
conditional on the parameters k and s. The topology displayed in the figures shifts linearly with
costs ∆c, indicating that higher cost reductions decrease the necessary levels of
complementarities and substitution factors to make openness profitable.
7 We assume that the focal firm enjoys at least the same level of within-firm complementarity as any other firm.
Otherwise, rivals might gain a competitive advantage when opening their resources.
- 17 -
—Insert Figure 2a, 2b, 2c, and 2d about here—
Concerning the number of competitors, as we see in Figures 2c and 2d (with the difference again
being whether the open firm can also cross-subsidize or not), the focal firm usually benefits from
an increasing number of rivals n. The intuition is that with more rivals, the profits to be made
originally from the focal resource decrease, and so less is lost by going open.
When we jointly consider ∆c, k, and n, we arrive at Figure 3, which shows us the relative
effects of openness on the focal firm and its rivals. Looking at the two-player case first, we see
that all outcomes described in the four sectors of Table 1 have a match in Figure 3a: above the
continuous curved line, openness leads to higher profits for the open firm, and to the right of the
vertical (dotted) line, the focal firm’s openness benefits rivals (and vice versa).
The reasons the focal firm profits from openness are as described earlier. Rivals may profit
from the focal firm’s opening by recapturing some of the quantities produced by the focal firm.
For high values of k, they produce the focal resource at a negative price, since it increases the
profits of the complementary resource disproportionately. If the focal firm opens the focal
resource and sets its price at zero, it also precludes the option of subsidizing, hence decreasing its
output. In that case, the rivals can increase the profits from their focal resource. However, as
shown in Figure 3d, for sufficiently large n (>4),8 the vertical line shifts toward the right to a
value of k > 1, indicating that rivals are unable to benefit from openness.
If we allow the focal firm to cross-subsidize as well (i.e., set p2i ≤ 0), the location of the four
sectors remains as described above (Equations (45)–(51)). As before, for low values of k rivals
will be worse off, because the focal firm’s open resource is produced in greater quantities than it
would be in closed competition. If k is sufficiently high (corresponding to Sectors I and III in
8 The number of rivals (n) and the substitution factor (s) have similar effects: both parameters lead to an increase in
“competition” and reduce profits on the focal resource. Please refer to Appendix 2 for details.
- 18 -
Figure 3), with cross-subsidization all quantities produced (and also rivals’ profits) are identical
between the open and closed states of the world. Focal firm and rivals both overproduce the focal
resource to subsidize the complement. Therefore, in price-setting scenarios, rivals will be either
worse off from or indifferent to the focal firm’s decision to open.
—Insert Figure 3a, 3b, 3c, and 3d about here—
Guided by Figure 3 and Table 1, we now take a closer look at the conditions that foster an
increase or decrease of competitive advantage for the firm and its rivals (Equations (39) and
(40)). In doing so, we hope to again show that a model rooted in RBV logic can reasonably
capture the empirical reality of openness, now in competition.9 In addition, we venture into
predictions for hitherto unobserved phenomena that are likely to be witnessed in the future.
Notably, for this analysis we focus on the case in which the focal firm cannot set negative prices
and cross-subsidize.10
Sector I: Firm better off—rivals better off
Proposition 3a: The likelihood that a firm opening a resource improves performance for both itself and its rivals increases (a) when openness strongly reduces the firm’s fixed costs for providing the focal resource and the firm enjoys high intra-firm complementarity with a residual inimitable resource or (b) when the firm has few rivals (Equation 41).
In our model, both the open firm and its rivals profit from openness under conditions of high
complementarities and high fixed-cost reduction. This outcome corresponds to the often-
observed examples of proprietary versus open competition (Casadesus-Masanell & Ghemawat,
2006). However, this logic only applies when the number of closed players is small; otherwise,
9 Admittedly, firm strategies in practice will differ in their specifics, such as the level of openness. Nonetheless, we
expect that this variance can still be captured by our general model. To illustrate this point, we show in Appendix 2 the level of cost reduction ∆c that would be required, for varying values of the other model parameters, so that the open firm would still attain a competitive advantage. We also note how the respective threshold may both move up and down compared to the value of 0.1 we have used in the model results presented here.
10 However, we note that from a competitive perspective, if the firm can reasonably expect to find itself in Sector I or III, it may improve its competitive performance relative to rivals by designing openness in a way that allows for cross-subsidization.
- 19 -
the market for the second resource is saturated before a sufficiently high quantity of the second
resource is produced that can be translated into profitable complements.
Conceptually, we expect that firms in more crowded markets would embrace competitive
responses not captured by our model: for example, rivals may benefit by abandoning their
proprietary strategy and joining forces with the open firm or offering their own open alternative
(Eisenmann et al., 2009). The former is consistent with our conceptual arguments about rivals
coordinating to modularize formerly integrated processes of value creation and capture.11
Establishing a competing open platform should prove more challenging, as the cost-reduction
opportunities crucial to our model are fewer if there is limited availability of volunteers donating
expertise. For example, in the browser market, we would expect Mozilla (Firefox) to attract more
donated labor if the WebKit (shared by Safari and Chrome) library ceased to exist, or vice versa.
Similarly, Nokia’s belated strategy to offer Symbian as an open smartphone platform would have
been more successful had Google not established Android first (West & Wood, 2013).
Sector II: Firm better off—rivals worse off
Proposition 3b: The likelihood that a firm opening a resource improves performance for itself while reducing that of its rivals increases (a) when openness strongly reduces the firm’s fixed costs for providing the focal resource and the firm suffers low intra-firm complementarity with a residual inimitable resource, or (b) when the firm has many rivals (Equation (42)).
Generally, the focal firm gains a competitive advantage over the rest of the industry when
complementarities are low and fixed-cost reduction is high. In addition, with an increasing
number of closed competitors, Sector II takes over the entire part above the focal firm’s zero
isoprofit curve and Sector I disappears: the firm choosing openness always wins.
11 Despite the obvious benefits that would accrue to firms, Colfer and Baldwin (2010) suggest that such coordinated
modularization is difficult to achieve, and requires what they call “actionable transparency” to align the actions and interests of the disparate actors.
- 20 -
We expect this to occur in complex industries where the open firm differs from its rivals in
valuing the focal resource: the focal firm thinks of it as a potential commodity, its rivals consider
it important—the same cognitive difference that Christensen (1997) describes as being at the
heart of disruptive innovation. In RBV terms, Christensen’s model suggests that when firms
increase use value faster than customer expectations, the resource may be replaced by something
that is “good enough” on a once-crucial performance dimension but that offers novel benefits.
Under these conditions, firms that accurately anticipate this shift in consumer perceptions of use
value will be the ones that benefit (Priem, Li, & Carr, 2012).
As such, we expect that firms will draw on openness to exploit opportunities for disruptive
innovation. Indeed, Linux’s lower price was a major attraction (West, 2003). Increased
customizability of open resources can provide other benefits. For example, when the enterprise
telephony industry shifted from integrated closed systems to open standards, customers could
combine phone and data networks into one, saving costs and easing administration. This created
an opportunity for de alio entrants such as IBM and Cisco to enter this originally high-fixed-cost
industry by using the open standard and their complementary proprietary resources to displace
long-established incumbents who struggled to adapt to these technological changes.
Sector III: Firm worse off—rivals better off
Proposition 3c: The likelihood that a firm opening a resource reduces performance for itself while improving that of its rivals increases (a) when openness weakly reduces the firm’s fixed costs for providing the focal resource and the firm enjoys high intra-firm complementarity with a residual inimitable resource, or (b) when the firm has few rivals (Equation (43)).
Proposition 3c denotes the opposite case of that depicted in Proposition 3b: the open firm is
outperformed by its closed rivals, which happens under conditions of low fixed-cost reduction
and high complementarity. The logic behind this effect is quite intuitive: with low fixed-cost
reduction on the to-be-opened resource, the key benefit of openness is simply not there. Further,
- 21 -
closed competitors can outcompete the focal firm via cross-subsidizing strategies. When the
number of competitors increases, this sector disappears: then, openness hurts everyone.
We expect firms to lose from openness particularly when they overestimate how well they
can protect their remaining proprietary complement from imitation or substitution and rivals can
enjoy similar cost-reduction benefits from openness. For example, Digium entered the PBX
market with a business model of providing its Asterisk open source telephony software for free
and selling related proprietary hardware. However, that meant that other companies could also
quickly enter the market, bundling Asterisk with off-the-shelf hardware, and even incumbents
were able to combine Asterisk with their equipment to improve performance or reduce costs. To
increase control, Digium re-focused its business model on services, introducing a subscription-
based, certified turnkey solution focusing initially on small firms (e.g., Keating, 2005). In turn,
the story of the IBM PC highlights that it need not be the size of the player choosing openness
that drives these mechanisms: when IBM created the IBM PC using external and internal open
components, it retained as the proprietary complement one piece it considered essential—the
BIOS. When expected technical and legal barriers failed to protect the BIOS from imitation,
IBM was increasingly unable to compete in the market it had created (Porac, 1997).
Second, if openness does not lead to increased diffusion, closed rivals may draw on the
disclosed resource as if it were a knowledge spillover. For example, over 400,000 open source
projects have been created by individuals and firms on SourceForge.Net, but the vast majority
failed to achieve significant product or market success (e.g., David & Rullani, 2008). Similarly,
SAP struggled when opening its MaxDB database: it tried to partner with the established open
source company MySQL but created confusion among customers and collaborators—which led
to SAP’s eventually ending the collaboration. In fact, open source firms have found that if buyers
- 22 -
are unaware of (or uncertain about) open alternatives, openness does not create customer value
(Stam, 2009). Thus, even if openness reduces the fixed costs of producing a resource, conditions
may exist in which barriers to adoption nullify any benefit to the opening firm.
Sector IV: Firm worse off—rivals worse off
Proposition 3d: The likelihood that a firm opening a resource reduces performance for both itself and its rivals increases (a) when openness weakly reduces the firm’s fixed costs for providing the focal resource and the firm suffers low intra-firm complementarity with a residual inimitable resource, or (b) when the firm has many rivals (Equation (44)).
The final case is the one where openness leads both parties to lose. This case exists under
conditions of low complementarities and low fixed-cost reduction. However, as stated before,
with larger values of 𝑛 in this context, this case completely displaces Sector III, in which rivals
would have outperformed the focal firm, so that no one benefits.
Conceptually, we would expect this case to occur when firms are unable or unwilling to
coordinate, and thus cannot agree on how to modularize existing integrated value creation and
value capture activities. Then, because openness may eliminate profits from the focal resource,
firms will be dragged into a price war, with each firm desperately hoping that its complements
will sustain it through the increased competition. The decreasing price and increasing
commoditization will dismantle existing barriers to entry, further increasing competition.
Lacking differentiation, competitive advantage accrues to cost leadership and scale—transferring
most of the value realized to the customer in form of lower prices.
A first cause of such negative performance consequences may be the result of firms opening
up due to desperate competitive pressure. In such cases, firms may be particularly prone to
overestimating the degree of complementarity between the focal resource and the complement.
Strong firm rivalries and communication barriers may hinder firms from coordinating to at least
ensure joint fixed-cost reduction. For example, when Netscape open-sourced its browser, it
- 23 -
primarily sought to undercut Microsoft. Only later did it realize that Internet browsers and
servers were too weakly connected. However, by then Netscape had largely destroyed the
existing paid desktop browser market essential to companies such as the Norwegian firm Opera.
Second, firms may find themselves forced to be open. For example, when carelessly working
with open source software, firms may become legally required to open up their own resources, as
happened to Cisco and Microsoft, among others. Bottom-up initiatives, in which individuals
engage in openness locally to solve technical problems, may be a likely source of such problems,
highlighting the need to coordinate such activities in the firm (Baldwin & Henkel, 2015).
DISCUSSION AND IMPLICATIONS
This paper was motivated by the apparent tension between the RBV’s assertion of control being
a necessary condition for competitive advantage, and the empirical observation of successful
firm strategies to voluntarily surrender control. We argue that reconciling this tension is
structurally equivalent to explaining why firms, entities that achieve competitive advantages by
exploiting VRI resources, can rationally allow for the imitation of such valuable resources.
Our first contribution addresses this tension, building on the (frequently overlooked) RBV
assumption that firms consist of bundles of complementary resources (e.g., Armstrong &
Shimizu, 2007; Kraaijenbrink et al., 2010; Newbert, 2007; Sirmon, Hitt, & Ireland, 2007). We
argue that by endogenously making a resource less VRIO through strategic openness, the firm
may make a bundle of resources more VRIO in turn. Our formal model shows how opening parts
of a resource base may be a profit-maximizing move in line with extant theory, depending on
customer preferences, resource maintenance costs, or competitive dynamics. One of our key
messages is thus that strategic openness does not require modifying or extending fundamental
assumptions or axioms of the RBV. Rather, a largely rational decision-making process, captured
- 24 -
by a set of formal models and depicted in Figure 4, can explain the firm’s choice of openness.
—Insert Figure 4 about here—
Second, we believe that revisiting the assumptions of RBV and explicating the workings of
strategic openness with the help of a formal model has been non-trivial ex ante, highlighting
important hidden assumptions and complexities (see also Adner et al., 2009; Simon, 1996: 15)
within the RBV that help refine our thinking more broadly—our next contribution.
More specifically, prior RBV research has strongly emphasized the role of proprietary
control, in particular through ownership (e.g., Hsu & Ziedonis, 2013; Wernerfelt, 2013), even
when considering resource complementarity (e.g., Lavie, 2006).12 We extend this work by re-
emphasizing the importance of resource access (see also Pfeffer & Salancik, 1978): having
access to an open resource part of a bundle can provide control without ownership, and strategic
openness may continuously and inexpensively ensure that access (Alexy & Reitzig, 2013).
Even more, we argue that the firm may still derive competitive advantage from the open
resource if it has firm-idiosyncratic features, that is, if the firm has superior information about
and/or superior complementarities with the open resource a priori (vs. a posteriori, see, e.g.,
Makadok & Barney, 2001; Schmidt & Keil, 2013): the open resource may be available to
everyone, but because the firm created the focal resource prior to release, it should hold superior
information about what the resource can do and superior complementarities to leverage it with
other proprietary resources. In such cases, we show that the firm may gain by establishing the
focal resource on the strategic factor market and making it freely available to rivals.
Together, our arguments on resources as bundles and access as a source of control suggest
that supposedly common-pool resources may well be a source of competitive advantage,
contrary to established logic in the RBV (e.g., Barney & Arikan, 2001). It is precisely by the
12 Our arguments will apply analogously for all cases in which firms relax control, even if not waiving ownership.
- 25 -
open resource becoming common—through rivals adopting it and substituting it for their own—
that firms may particularly enjoy the benefits of superior information and complementarities.
Openness may thus become a “Trojan horse,” by which the focal firm makes available to others,
via the strategic factor market, a resource that will continue to make an idiosyncratic contribution
to the firm’s competitive advantage, while being open.
Third, we introduce a new perspective to debates about resource value and control as they
pertain to competitive dynamics. Makadok (2001) argues that firms should obtain competitive
advantage either by building superior resources or by picking superior capabilities. We posit that
strategic openness may weigh heavily in favor of capability-building strategies. Specifically,
following Amit and Schoemaker (1993; also see Mahoney & Pandian, 1992; Miller & Shamsie,
1996), we define capabilities as the ‘firm’s capacity to deploy resources’ (p. 35),13 thus thinking
of them as largely information-based, intangible resources that are either invisible, socially
complex, and/or causally ambiguous, and thus well protected against imitation (e.g., Barney &
Arikan, 2001; Itami & Roehl, 1987; Nelson & Winter, 1982; Penrose, 1959; Rumelt, 1984;
Winter, 1987). Such capabilities, however, require that the resources they operate upon be in
place; otherwise they cannot contribute to the firm’s competitive advantage (Makadok, 2001).
Because openness ensures continuous resource access, open firms may be better positioned
to exercise their (often more profitable) capabilities. A firm’s purposive choice to be open may
even allow it to exploit lower entry barriers (through fixed-cost reduction) and existing within-
firm complementarities, enabling de alio entrants to conquer established industries without any
significant pre-existing resources and capabilities specific to that industry, as happened in the
enterprise telephony market.
13 We are agnostic as to whether the respective capabilities are static or dynamic (Helfat & Peteraf, 2003; Teece,
Pisano, & Shuen, 1997; Winter, 2003), or context-specific or universally valuable (Helfat & Lieberman, 2002).
- 26 -
More generally, we expect that firms well-endowed in capabilities may draw on strategic
openness to enforce a shift in the nature of competition away from owning resources toward
ensuring they have access to the resources they need to be able to deploy pre-existing superior
capabilities. At the extreme, if openness were to help a firm to commoditize, step-by-step, all
key resources in an industry, firms would be forced to compete solely on their deployment.
However, even if all resources presented to customers are open, buyers should still be willing to
pay for services such as integration or maintenance. Such a shift in the domain of competition
may be particularly applicable to digital or digitized industries, where commoditization of once-
valuable technology rewards firms that have strong integration and services capabilities (D'Aveni
& Gunther, 1994; Lee et al., 2010). These ideas reflect an ongoing discussion in the marketing
literature that emphasizes the increased importance of service delivery as the basis of
competition (Vargo & Lusch, 2004, 2008). In line with those arguments, we expect that the more
open industries become, the more value migrates from existing resources and activities to
customer-centric service provision and integration efforts.
Our fourth and final contribution is that our RBV-based model provides a precise and
rigorous theoretical basis for openness scholars to systematically and theoretically rigorously
analyze firm openness strategies and their success. The arguments we introduce are a first step in
generalizing across multiple strategies, resource configurations, and industry contexts to a much-
needed general theory of the origins and competitive impacts of firm openness (see Alexy &
Dahlander, 2014; Vanhaverbeke & Cloodt, 2014; West et al., 2014), in order to answer a key
question faced by researchers and practitioners alike: when should firms be open? We offer
testable predictions about how costs, complementarities, substitution effects, and the number of
competitors will shape the success of openness strategies.
- 27 -
In so doing, we also contribute directly to existing debates in this literature. For example, we
suggest an extended perspective on the role of industry structure and competition to study the
effects of openness. Going beyond prior research that looks at open versus closed duopolies (e.g.,
Economides & Katsamakas, 2006), we show how oligopolistic competition increases the impact
of openness on industry profitability and structure, raising the pressures on proprietary firms to
respond to (even potential) openness by competitors. We thus suggest that openness may drive
out a lot of competition before a market stabilizes around dynamic mixed duopolies (Casadesus-
Masanell & Ghemawat, 2006) or similar structures, and present strategies firms may choose to
achieve this. As such, we suggest that the work on openness may actually find its impact to be
much higher in nascent markets and that current research—often focusing on later stages due to
data availability—may be understating the full competitive impact of such strategies. We hope
that by linking to RBV and complementarity, this study suggests how openness scholars can
demonstrate this impact in areas such as research consortia and cooperative standardization.
For managers, our results provide both a warning and an encouragement. The warning is that
others may consider entering the firm’s industry using openness, a line of attack against which
traditional defensive barriers may prove useless. We cannot offer a winning response to such
attacks, beyond Christensen’s (1997) suggestions for isolating mechanisms to respond to
disruptive innovations. At the same time, our model suggests how a wide variety of firms may
find openness attractive, particularly under difficult competitive situations. It also shows why
even firms in stable competitive situations should consider the potential benefits of openness for
competitive advantage.
Limitations
Whereas our model assumptions are derived from real-world phenomena and our findings are
- 28 -
consistent with observed practice, as with any model we have simplified reality—including
assumptions about firms’ abilities to benefit from cost advantages and price-setting as a
consequence of opening a focal resource. Our results remain qualitatively unchanged when we
explicitly add variable cost to the model, and we show the effects of relaxing assumptions about
firm cross-subsidization and fixed-cost reduction. Furthermore, our current analysis does not
consider the possibility of competitors reacting to a firm’s open strategy by opening up
themselves. In such cases, we would expect outcomes similar to Propositions 3a–3d: newly open
competitors may profit from opening resources if the resulting cost reductions are high, and the
focal firm can only gain additional profits if complementarities are sufficiently high. Still, there
is a need for further simulation and empirical work to tackle these and related questions, such as
when to enter an already ‘open’ industry (see, e.g., Fosfuri, Giarratana, & Luzzi, 2008; Henkel,
Schöberl, & Alexy, 2014).
To re-examine other key assumptions, our model does not feature uncertainty. In line with
our discussion of Sectors III and IV, adding incomplete information about rivals and demand can
explain how firms may rationally open a resource and not benefit from it. Also, we have not
looked at scenarios in which firms position themselves within a market by differentiating their
product, which may be achieved using a Hotelling-type model (on horizontal differentiation) or
by adding investment costs (vertical differentiation). We further assumed quantity instead of
price competition (Bertrand model). We also did not specifically look at network effects, which
may be an important driver of profitability. We expect (within-resource) network externalities to
have an effect similar to (across-resource) complementarities, strengthening a decision to open
resources in order to profit elsewhere.
We also do not explicitly model different types of openness, which might vary in how well
- 29 -
the firm can steer them to align with its existing resource portfolio, in how well it may ensure
that its complement cannot be replaced, and possibly in the costs of setting up new governance
structures. For example, different types of openness may bring different types of communication
structures, incentives, and property rights, which thus render them better suited to certain types
of contexts than to others (e.g., Felin & Zenger, 2014). However, we can at least approximate
these and many other considerations with our model by choosing varying starting parameters for
k, s, n, and Δc (see also Appendix 2). We thus believe that none of these scenarios would
drastically change the basic mechanisms of the current model, causing little need to extend its
parsimonious setup. Similarly, the effect of other potentially important variables, such as the
appropriability regime, can be captured by modifying the degree of complementarity or
substitutability, and thus be anticipated without adjustments to the basic model.
Finally, although our model captures competition in the focal resource, it does not yet capture
competition in the complement or the resource bundle. While this assumption is valid for some
platforms, such as gaming consoles, other platforms may be intentionally designed to allow the
use of applications developed for competing platforms: for example, Apple, Commodore, and
Radio Shack offered CP/M emulation options in their 8-bit personal computers (Langlois, 1992).
Incorporating research on such one-way compatibility (e.g., Farrell & Simcoe, 2012) into our
model could thus significantly enhance its realism.
Suggestions for future research
Our framework and predictions can be directly tested to see how accurately they explain the
reasons behind firms’ choices of openness. Consistent with earlier work summarizing empirical
tests of the RBV (e.g., Armstrong & Shimizu, 2007; Newbert, 2007), our focus is on the joint
deployment of open resources and closed capabilities. These arguments also suggest a
- 30 -
configurational logic for openness (also see Fjeldstad et al., 2012)—that openness is beneficial
only when the firm chooses the correct and concomitant configuration of both the open and the
closed resource, as with the value migration strategies we presented. Such a logic would
naturally lend itself to testing using qualitative comparative analysis (Ragin, 1987), with firms’
business models, organizational design, or product architectures being possible units of analysis.
Using such tests, future work should examine whether the parameters we have identified
indeed predict whether openness brings higher value creation and value capture, and whether this
translates into competitive advantage. While some model parameters (such as complementarity)
may seem harder to quantify, methods such as qualitative comparative analysis may capture
them with relative ease. Researchers may further extend these arguments to classify closed
industries or strategic groups to predict the emergence of openness, for example in the form of
open platforms. We consider industries with high fixed costs to be likely candidates, as
illustrated by the examples we have given of high-fixed-cost industries such as automotive,
pharmaceuticals, software, semiconductors, or software, where open strategies seem on the rise
(see also Alexy & Reitzig, 2012).
Additionally, researchers could investigate other firm- or environmental-level factors that
may moderate the effect of openness on competitive advantage. For example, because an
openness strategy often depends on cross-subsidization, openness may disproportionally benefit
large firms (which are also more likely to benefit from fixed-cost reduction). Second, we would
expect environmental factors such as uncertainty or resource scarcity to further encourage the
use of openness as well as enhance the benefits of openness strategies, as these conditions would
amplify the benefits of customization and coordination. Moreover, we would encourage fellow
scholars to investigate the potential dynamic implications arising from strategic openness,
- 31 -
notably its effect as an entry deterrent (e.g., Polidoro & Theeke, 2012; Polidoro & Toh, 2011).
Depending on how these researchers extend our formalization, we would expect deterrence to
manifest itself in different ways. New entrants operating business models drawing on substitute
resources for the open resource may be hindered from entering the market; moreover, strategic
openness may signal superior hidden capabilities of the incumbent firm that discourage firms
more broadly from entering.
Finally, beyond our (rationality-based) arguments, researchers should consider the cognitive
elements of an openness decision. We would expect that in existing industries with established
strategic groups, firms share largely homogeneous cognitions and resource configurations (Reger
& Huff, 1993). If those groups are stable, firms should conclude that they benefit from
participating in the existing proprietary industry equilibrium, and should exhibit collective inertia
(Abrahamson & Fombrun, 1994) against openness. This suggests a promising opportunity for
studying the links between openness, managerial cognition, and the resulting industrial dynamics
(e.g., Marcel, Barr, & Duhaime, 2011) to shed light on the processes through which managers
learn to appreciate openness, see its strategic importance, and choose to enact it (or not).
ACKNOWLEDGEMENTS
We thank guest editor Jay Barney and two anonymous reviewers for their valuable comments.
Earlier versions of this paper greatly benefitted from suggestions received at the 2014 DRUID
Summer Conference, École Polytechnique Fédérale de Lausanne (EPFL), Santa Clara
University, Technische Universität München, and UC Irvine, as well as comments from Linus
Dahlander, Johanna Glauber, Marc Gruber, Thomas Keil, Tobias Kretschmer, Hart Posen,
Steven Postrel, Tammy Madsen, and Margarethe Wiersema. The usual disclaimers apply.
REFERENCES
Abrahamson E, Fombrun CJ. 1994. Macrocultures: Determinants and consequences. Academy of Management Review 19(4): 728–755.
Abreu E. 2001. Behind the big blue wall. Industry Standard Magazine January 22.
- 32 -
http://www.postfix.org/standard.200101/0_1902_21395-0_00.html [April 21, 2006]. Adner R. 2012. The wide lens: What successful innovators see that others miss.
Portfolio/Penguin: New York. Adner R, Pólos L, Ryall M, Sorenson O. 2009. The case for formal theory. Academy of
Management Review 34(2): 201–208. Alexy O, Dahlander L. 2014. Managing open innovation. In M Dodgson, D Gann, N Phillips
(Eds.), Handbook of innovation management: 442–461. Oxford University Press: Oxford, UK. Alexy O, George G, Salter A. 2013. Cui bono? The selective revealing of knowledge and its
implications for innovative activity. Academy of Management Review 38(2): 270–291. Alexy O, Reitzig M. 2012. Managing the business risks of open innovation. McKinsey
Quarterly(1): 17–21. Alexy O, Reitzig M. 2013. Private–collective innovation, competition, and firms’
counterintuitive appropriation strategies. Research Policy 42(4): 895–913. Allen RC. 1983. Collective invention. Journal of Economic Behavior & Organization 4(1): 1–
24. Amit R, Schoemaker PJH. 1993. Strategic assets and organizational rent. Strategic Management
Journal 14(1): 33–46. Armstrong CE, Shimizu K. 2007. A review of approaches to empirical research on the resource-
based view of the firm†. Journal of Management 33(6): 959–986. Axelrod R, Mitchell W, Thomas RE, Bennett DS, Bruderer E. 1995. Coalition formation in
standard-setting alliances. Management Science 41(9): 1493–1508. Baldwin C, Clark K. 2000. Design rules: The power of modularity. The MIT Press: Cambridge,
Massachusetts. Baldwin CY, Henkel J. 2015. Modularity and intellectual property protection. Strategic
Management Journal 36(11): 1637–1655. Baldwin CY, von Hippel E. 2011. Modeling a paradigm shift: From producer innovation to user
and open collaborative innovation. Organization Science 22(6): 1399–1417. Baldwin CY, Woodard CJ. 2007. Competition in modular clusters. Harvard Business School
Working Paper December 20. http://www.hbs.edu/research/pdf/08-042.pdf [October 2, 2014]. Barney JB. 1988. Returns to bidding firms in mergers and acquisitions: Reconsidering the
relatedness hypothesis. Strategic Management Journal 9(S1): 71–78. Barney JB. 1991. Firm resources and sustained competitive advantage Journal of Management
17(1): 99–120. Barney JB. 2007. Gaining and sustaining competitive advantage. Addison-Wesley. Barney JB, Arikan AM. 2001. The resource–based view: Origins and implications. In MA Hitt,
RE Freeman, JS Harrison (Eds.), The Blackwell handbook of strategic management: 124–188. Blackwell: Oxford, UK.
Boudreau K. 2010. Open platform strategies and innovation: Granting access vs. Devolving control. Management Science 56(10): 1849–1872.
Bowman C, Ambrosini V. 2000. Value creation versus value capture: Towards a coherent definition of value in strategy. British Journal of Management 11(1): 1–15.
Brandenburger AM, Nalebuff BJ. 1996. Co-opetition. Doubleday: New York. Bresnahan TF, Greenstein S. 1999. Technological competition and the structure of the computer
industry. The Journal of Industrial Economics 47(1): 1–40. Casadesus-Masanell R, Ghemawat P. 2006. Dynamic mixed duopoly: A model motivated by
Linux vs. Windows. Management Science 52(7): 1072–1084.
- 33 -
Chesbrough HW. 2003. Open innovation: The new imperative for creating and profiting from technology. Harvard Business School Press: Boston.
Chesbrough HW, Appleyard MM. 2007. Open innovation and strategy. California Management Review 50(1): 57–74.
Chesbrough HW, Bogers M. 2014. Explicating open innovation: Clarifying an emerging paradigm for understanding innovation. In HW Chesbrough, W Vanhaverbeke, J West (Eds.), New frontiers in open innovation: 3–28. Oxford University Press: Oxford, UK.
Christensen CM. 1997. The innovator's dilemma: When new technologies cause great firms to fail. Harvard Business School Press: Cambridge, MA.
Colfer L, Baldwin CY. 2010. The mirroring hypothesis: Theory, evidence and exceptions. SSRN Working Paper June 4. http://ssrn.com/abstract=1539592 [February 6, 2011].
Conner KR, Rumelt RP. 1991. Software piracy: An analysis of protection strategies. Management Science 37(2): 125–139.
Costa LA, Cool K, Dierickx I. 2013. The competitive implications of the deployment of unique resources. Strategic Management Journal 34(4): 445–463.
D'Aveni RA, Gunther RE. 1994. Hypercompetition: Managing the dynamics of strategic maneuvering. The Free Press: New York.
Dahlander L, Gann DM. 2010. How open is innovation? Research Policy 39(6): 699–709. David PA, Rullani F. 2008. Dynamics of innovation in an “open source” collaboration
environment: Lurking, laboring, and launching FLOSS projects on SourceForge. Industrial and Corporate Change 17(4): 647–710.
Dodgson M, Gann DM, Salter A. 2007. "In case of fire, please use the elevator": Simulation technology and organization in fire engineering. Organization Science 18(5): 849–864.
Economides N, Katsamakas E. 2006. Two-sided competition of proprietary vs. Open source technology platforms and the implications for the software industry. Management Science 52(7): 1057–1071.
Eisenmann TR, Parker G, Van Alstyne M. 2009. Opening platforms: How, when and why? In A Gawer (Ed.), Platforms, markets and innovation: 131–162. Edward Elgar: Cheltenham, UK.
Farrell J, Gallini NT. 1988. Second-sourcing as a commitment: Monopoly incentives to attract competition. Quarterly Journal of Economics 103(4): 673–694.
Farrell J, Saloner G. 1992. Converters, compatibility, and the control of interfaces. Journal of Industrial Economics 40(1): 9–35.
Farrell J, Simcoe T. 2012. Four paths to compatibility. In M Peitz, J Waldfogel (Eds.), Oxford handbook of the digital economy: 34–58. Oxford University Press: Oxford, UK.
Felin T, Zenger TR. 2014. Closed or open innovation? Problem solving and the governance choice. Research Policy 43(5): 914–925.
Fjeldstad ØD, Snow CC, Miles RE, Lettl C. 2012. The architecture of collaboration. Strategic Management Journal 33(6): 734–750.
Fosfuri A, Giarratana MS, Luzzi A. 2008. The penguin has entered the building: The commercialization of open source products. Organization Science 19(2): 292–305.
Füller J. 2010. Refining virtual co-creation from a consumer perspective. California Management Review 52(2): 98–122.
Garud R, Kumaraswamy A. 1993. Changing competitive dynamics in network industries: An exploration of Sun Microsystems' open systems strategy. Strategic Management Journal 14(5): 351–369.
Grindley P, Mowery DC, Silverman B. 1994. Sematech and collaborative research: Lessons in
- 34 -
the design of high-technology consortia. Journal of Policy Analysis and Management 13(4): 723–758.
Helfat CE, Lieberman MB. 2002. The birth of capabilities: Market entry and the importance of pre-history. Industrial and Corporate Change 11(4): 725–760.
Helfat CE, Peteraf MA. 2003. The dynamic resource-based view: Capability lifecycles. Strategic Management Journal 24(10): 997–1010.
Henkel J. 2004. Open source software from commercial firms – tools, complements, and collective invention. ZfB-Ergänzungsheft 74(4): 1–23.
Henkel J. 2006. Selective revealing in open innovation processes: The case of Embedded Linux. Research Policy 35(7): 953–969.
Henkel J, Schöberl S, Alexy O. 2014. The emergence of openness: How and why firms adopt selective revealing in open innovation. Research Policy 43(5): 879–890.
Hoopes DG, Madsen TL, Walker G. 2003. Guest editors' introduction to the special issue: Why is there a resource-based view? Toward a theory of competitive heterogeneity. Strategic Management Journal 24(10): 889–902.
Hsu DH, Ziedonis RH. 2013. Resources as dual sources of advantage: Implications for valuing entrepreneurial-firm patents. Strategic Management Journal 34(7): 761–781.
Itami H, Roehl TW. 1987. Mobilizing invisible assets. Harvard University Press: Cambridge, MA.
Jacobides MG, Knudsen T, Augier M. 2006. Benefiting from innovation: Value creation, value appropriation and the role of industry architectures. Research Policy 35(8): 1200–1221.
Jacobides MG, MacDuffie JP, Tae CJ. 2016. Agency, structure, and the dominance of oems: Change and stability in the automotive sector. Strategic Management Journal 37(9): 1942–1967.
Jacobides MG, Tae CJ. 2015. Kingpins, bottlenecks, and value dynamics along a sector. Organization Science 26(3): 889–907.
Jeppesen LB, Molin MJ. 2003. Consumers as co-developers: Learning and innovation outside the firm. Technology Analysis & Strategic Management 15(3): 363–383.
Katz ML. 1986. An analysis of cooperative research and development. RAND Journal of Economics 17(4): 527–543.
Katz ML, Ordover JA. 1990. R and d cooperation and competition. Brookings Papers on Economic Activity. Microeconomics 1990: 137–203.
Keating T. 2005. Interview with Asterisk guru Mark Spencer. September 16. http://blog.tmcnet.com/blog/tom-keating/asterisk/interview-with-asterisk-guru-mark-spencer.asp [September 17, 2016].
Kraaijenbrink J, Spender J-C, Groen AJ. 2010. The resource-based view: A review and assessment of its critiques. Journal of Management 36(1): 349–372.
Langlois RN. 1992. External economies and economic progress: The case of the microcomputer industry. Business History Review 66(1): 1–50.
Laursen K, Salter AJ. 2006. Open for innovation: The role of openness in explaining innovation performance among U.K. Manufacturing firms. Strategic Management Journal 27(2): 131–150.
Lavie D. 2006. The competitive advantage of interconnected firms: An extension of the resource-based view. Academy of Management Review 31(3): 638–658.
Lee C-H, Venkatraman N, Tanriverdi H, Iyer B. 2010. Complementarity-based hypercompetition in the software industry: Theory and empirical test, 1990–2002. Strategic Management Journal
- 35 -
31(13): 1431–1456. MacDonald G, Ryall MD. 2004. How do value creation and competition determine whether a
firm appropriates value? Management Science 50(10): 1319–1333. Mahoney JT, Pandian JR. 1992. The resource-based view within the conversation of strategic
management. Strategic Management Journal 13(5): 363–380. Makadok R. 2001. Toward a synthesis of the resource-based and dynamic-capability views of
rent creation. Strategic Management Journal 22(5): 387–401. Makadok R, Barney JB. 2001. Strategic factor market intelligence: An application of information
economics to strategy formulation and competitor intelligence. Management Science 47(12): 1621–1638.
Marcel JJ, Barr PS, Duhaime IM. 2011. The influence of executive cognition on competitive dynamics. Strategic Management Journal 32(2): 115–138.
Miller D, Shamsie J. 1996. The resource-based view of the firm in two environments: The Hollywood film studios from 1936 to 1965. Academy of Management Journal 39(3): 519–543.
Moritz M, Redlich T, Krenz P, Buxbaum-Conradi S, Wulfsberg JP. 2015. Tesla motors, inc.: Pioneer towards a new strategic approach in the automobile industry along the open source movement?, Management of Engineering and Technology (PICMET), 2015 Portland International Conference on: 85–92.
Nelson RR, Winter SG. 1982. An evolutionary theory of economic change. Harvard University Press: Cambridge, MA.
Newbert SL. 2007. Empirical research on the resource-based view of the firm: An assessment and suggestions for future research. Strategic Management Journal 28(2): 121–146.
OED Online. 2013. Open, adj. http://www.oed.com/viewdictionaryentry/Entry/131699 [February 15, 2014].
Parker G, Van Alstyne M. 2014. Innovation, openness, and platform control. October 3. http://ssrn.com/abstract=1079712 [July 2, 2015].
Parker GG, Van Alstyne MW. 2005. Two-sided network effects: A theory of information product design. Management Science 51(10): 1494–1504.
Penrose ET. 1959. The theory of the growth of the firm. Basil Blackwell: Oxford. Perkmann M, Schildt H. 2015. Open data partnerships between firms and universities: The role
of boundary organizations. Research Policy 44(5): 1133–1143. Peteraf MA. 1993. The cornerstones of competitive advantage: A resource-based view. Strategic
Management Journal 14: 179–191. Pfeffer J, Salancik GR. 1978. The external control of organizations: A resource dependence
perspective (2003 classic ed.). Stanford University Press: Stanford, CA. Pisano GP, Teece DJ. 2007. How to capture value from innovation: Shaping intellectual property
and industry architecture. California Management Review 50(1): 278–296. Polidoro F, Theeke M. 2012. Getting competition down to a science: The effects of technological
competition on firms' scientific publications. Organization Science 23(4): 1135–1153. Polidoro F, Toh PK. 2011. Letting rivals come close or warding them off? The effects of
substitution threat on imitation deterrence. Academy of Management Journal 54(2): 369–392. Porac JF. 1997. Local rationality, global blunders, and the boundaries of technological choice:
Lessons from IBM and dos. In R Garud, PR Nayyar, ZB Shapira (Eds.), Technological innovations: Oversights and foresights: 129–146. Cambridge, UK: Cambridge University Press.
Priem RL, Butler JE. 2001. Is the resource-based “view” a useful perspective for strategic
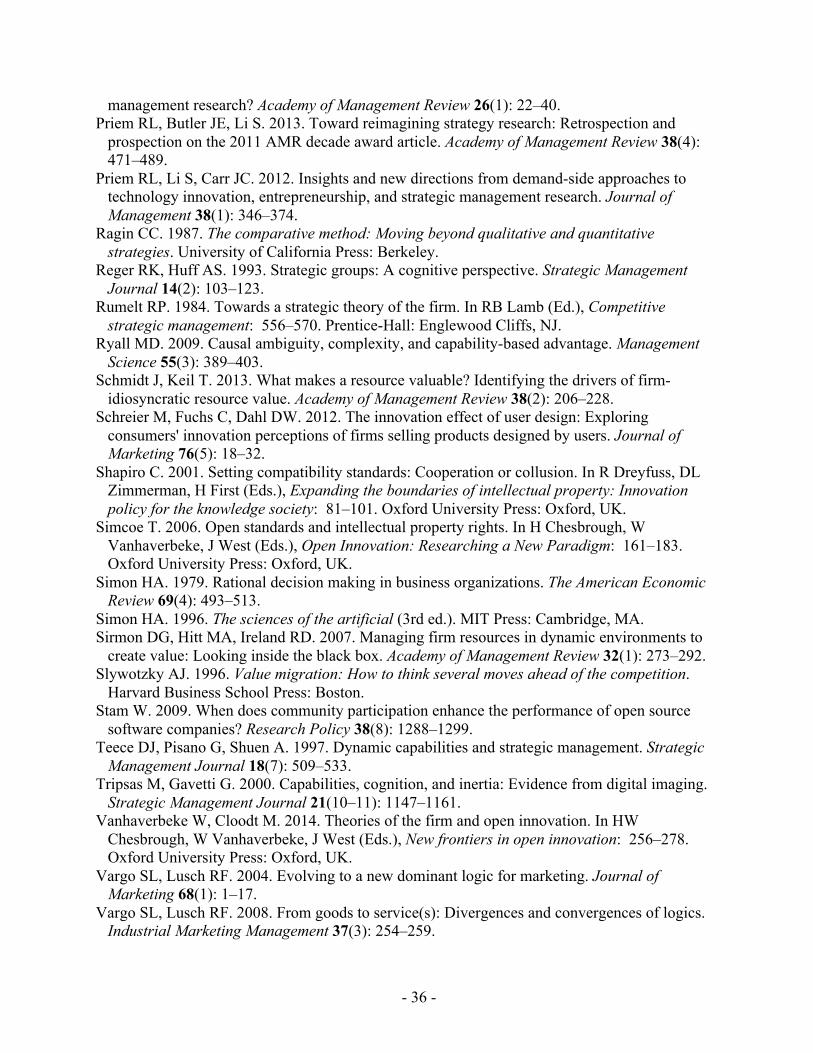
- 36 -
management research? Academy of Management Review 26(1): 22–40. Priem RL, Butler JE, Li S. 2013. Toward reimagining strategy research: Retrospection and
prospection on the 2011 AMR decade award article. Academy of Management Review 38(4): 471–489.
Priem RL, Li S, Carr JC. 2012. Insights and new directions from demand-side approaches to technology innovation, entrepreneurship, and strategic management research. Journal of Management 38(1): 346–374.
Ragin CC. 1987. The comparative method: Moving beyond qualitative and quantitative strategies. University of California Press: Berkeley.
Reger RK, Huff AS. 1993. Strategic groups: A cognitive perspective. Strategic Management Journal 14(2): 103–123.
Rumelt RP. 1984. Towards a strategic theory of the firm. In RB Lamb (Ed.), Competitive strategic management: 556–570. Prentice-Hall: Englewood Cliffs, NJ.
Ryall MD. 2009. Causal ambiguity, complexity, and capability-based advantage. Management Science 55(3): 389–403.
Schmidt J, Keil T. 2013. What makes a resource valuable? Identifying the drivers of firm-idiosyncratic resource value. Academy of Management Review 38(2): 206–228.
Schreier M, Fuchs C, Dahl DW. 2012. The innovation effect of user design: Exploring consumers' innovation perceptions of firms selling products designed by users. Journal of Marketing 76(5): 18–32.
Shapiro C. 2001. Setting compatibility standards: Cooperation or collusion. In R Dreyfuss, DL Zimmerman, H First (Eds.), Expanding the boundaries of intellectual property: Innovation policy for the knowledge society: 81–101. Oxford University Press: Oxford, UK.
Simcoe T. 2006. Open standards and intellectual property rights. In H Chesbrough, W Vanhaverbeke, J West (Eds.), Open Innovation: Researching a New Paradigm: 161–183. Oxford University Press: Oxford, UK.
Simon HA. 1979. Rational decision making in business organizations. The American Economic Review 69(4): 493–513.
Simon HA. 1996. The sciences of the artificial (3rd ed.). MIT Press: Cambridge, MA. Sirmon DG, Hitt MA, Ireland RD. 2007. Managing firm resources in dynamic environments to
create value: Looking inside the black box. Academy of Management Review 32(1): 273–292. Slywotzky AJ. 1996. Value migration: How to think several moves ahead of the competition.
Harvard Business School Press: Boston. Stam W. 2009. When does community participation enhance the performance of open source
software companies? Research Policy 38(8): 1288–1299. Teece DJ, Pisano G, Shuen A. 1997. Dynamic capabilities and strategic management. Strategic
Management Journal 18(7): 509–533. Tripsas M, Gavetti G. 2000. Capabilities, cognition, and inertia: Evidence from digital imaging.
Strategic Management Journal 21(10–11): 1147–1161. Vanhaverbeke W, Cloodt M. 2014. Theories of the firm and open innovation. In HW
Chesbrough, W Vanhaverbeke, J West (Eds.), New frontiers in open innovation: 256–278. Oxford University Press: Oxford, UK.
Vargo SL, Lusch RF. 2004. Evolving to a new dominant logic for marketing. Journal of Marketing 68(1): 1–17.
Vargo SL, Lusch RF. 2008. From goods to service(s): Divergences and convergences of logics. Industrial Marketing Management 37(3): 254–259.
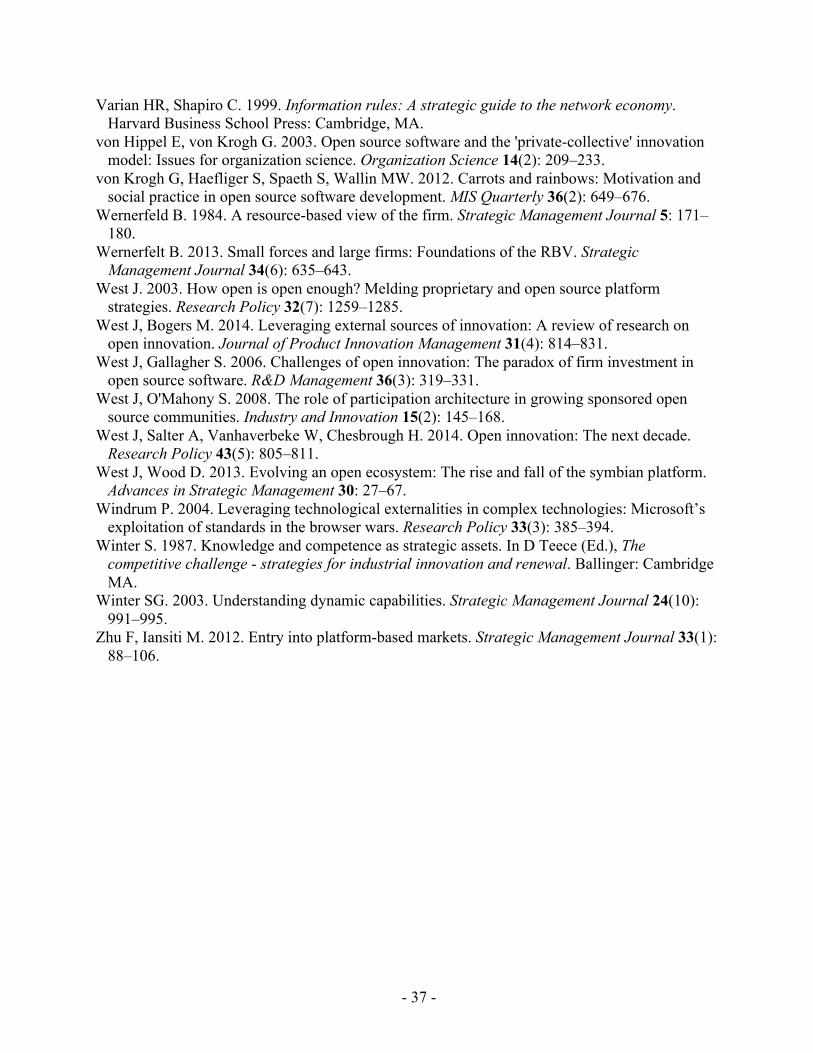
- 37 -
Varian HR, Shapiro C. 1999. Information rules: A strategic guide to the network economy. Harvard Business School Press: Cambridge, MA.
von Hippel E, von Krogh G. 2003. Open source software and the 'private-collective' innovation model: Issues for organization science. Organization Science 14(2): 209–233.
von Krogh G, Haefliger S, Spaeth S, Wallin MW. 2012. Carrots and rainbows: Motivation and social practice in open source software development. MIS Quarterly 36(2): 649–676.
Wernerfeld B. 1984. A resource-based view of the firm. Strategic Management Journal 5: 171–180.
Wernerfelt B. 2013. Small forces and large firms: Foundations of the RBV. Strategic Management Journal 34(6): 635–643.
West J. 2003. How open is open enough? Melding proprietary and open source platform strategies. Research Policy 32(7): 1259–1285.
West J, Bogers M. 2014. Leveraging external sources of innovation: A review of research on open innovation. Journal of Product Innovation Management 31(4): 814–831.
West J, Gallagher S. 2006. Challenges of open innovation: The paradox of firm investment in open source software. R&D Management 36(3): 319–331.
West J, O'Mahony S. 2008. The role of participation architecture in growing sponsored open source communities. Industry and Innovation 15(2): 145–168.
West J, Salter A, Vanhaverbeke W, Chesbrough H. 2014. Open innovation: The next decade. Research Policy 43(5): 805–811.
West J, Wood D. 2013. Evolving an open ecosystem: The rise and fall of the symbian platform. Advances in Strategic Management 30: 27–67.
Windrum P. 2004. Leveraging technological externalities in complex technologies: Microsoft’s exploitation of standards in the browser wars. Research Policy 33(3): 385–394.
Winter S. 1987. Knowledge and competence as strategic assets. In D Teece (Ed.), The competitive challenge - strategies for industrial innovation and renewal. Ballinger: Cambridge MA.
Winter SG. 2003. Understanding dynamic capabilities. Strategic Management Journal 24(10): 991–995.
Zhu F, Iansiti M. 2012. Entry into platform-based markets. Strategic Management Journal 33(1): 88–106.
- 38 -
TABLES AND FIGURES
Figure 1: Outcome of openness for the monopolist
Notes: ∆𝑐 = fixed-cost reduction, 𝑘! = complementarities of R2 on R1 for the monopolist; 𝑘! is set to 0.5; shading illustrates change in profits for monopolist when going from closed to open state of the world given the respective parameters. The lighter the area, the more profitable opening the focal resource is to the monopolist. The thick black line shows the isoprofit curve for which the open state of the world yields the same profit as the closed one to the monopolist.
- 39 -
Figure 2: Outcome of openness in a duopoly (n = 1) and an oligopoly (n ≥ 1)
Figure 2a: duopoly; open firm cannot cross-subsidize
Figure 2b: duopoly; open firm can cross-subsidize
Figure 2c: oligopoly; open firm cannot cross-subsidize
Figure 2d: oligopoly; open firm can cross-subsidize
Notes: 𝑘 = complementarities of R2 and R1 (symmetric between firms), 𝑠 = substitutability of R2 across firms; ∆𝑐 is set to 0.1 in all cases, s is set to 0.1 for the oligopoly cases. The areas represent the profit difference for the focal firm between the open and closed state. The lighter the area, the more profitable opening the focal resource is to the focal firm. The thick black line shows the isoprofit curve for which the open state of the world yields the same profit as the closed one to the focal firm.
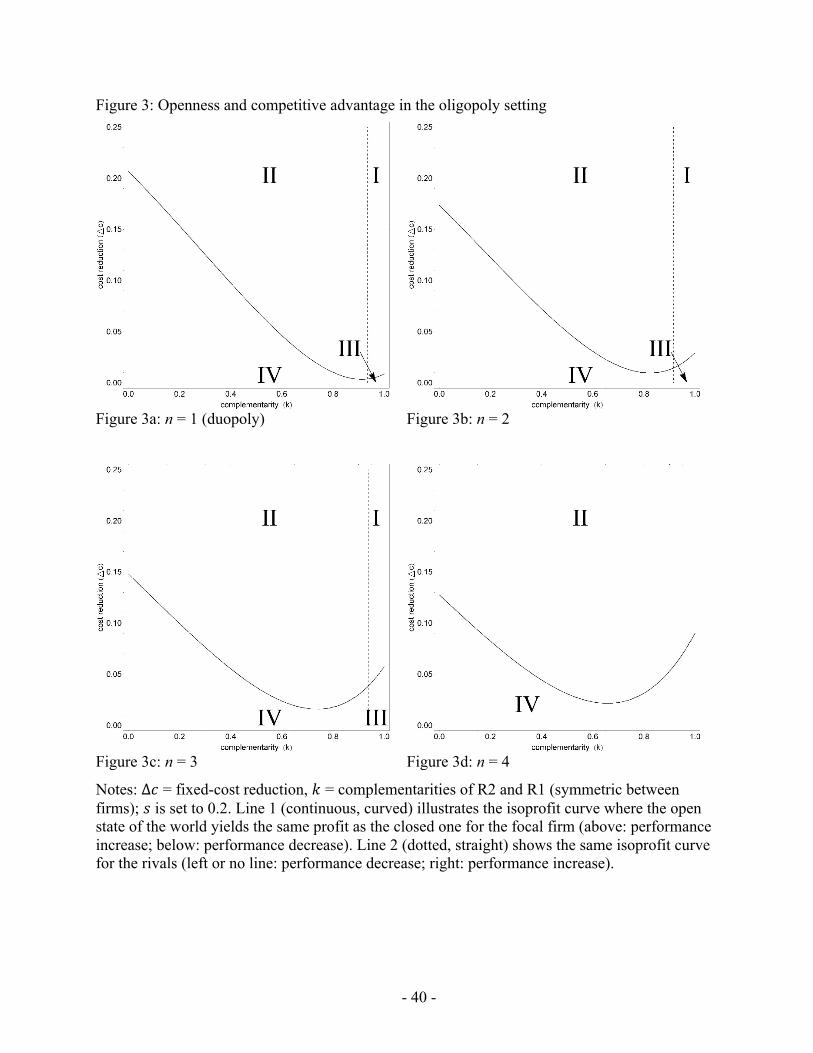
- 40 -
Figure 3: Openness and competitive advantage in the oligopoly setting
Figure 3a: n = 1 (duopoly)
Figure 3b: n = 2
Figure 3c: n = 3
Figure 3d: n = 4
Notes: ∆𝑐 = fixed-cost reduction, 𝑘 = complementarities of R2 and R1 (symmetric between firms); 𝑠 is set to 0.2. Line 1 (continuous, curved) illustrates the isoprofit curve where the open state of the world yields the same profit as the closed one for the focal firm (above: performance increase; below: performance decrease). Line 2 (dotted, straight) shows the same isoprofit curve for the rivals (left or no line: performance decrease; right: performance increase).
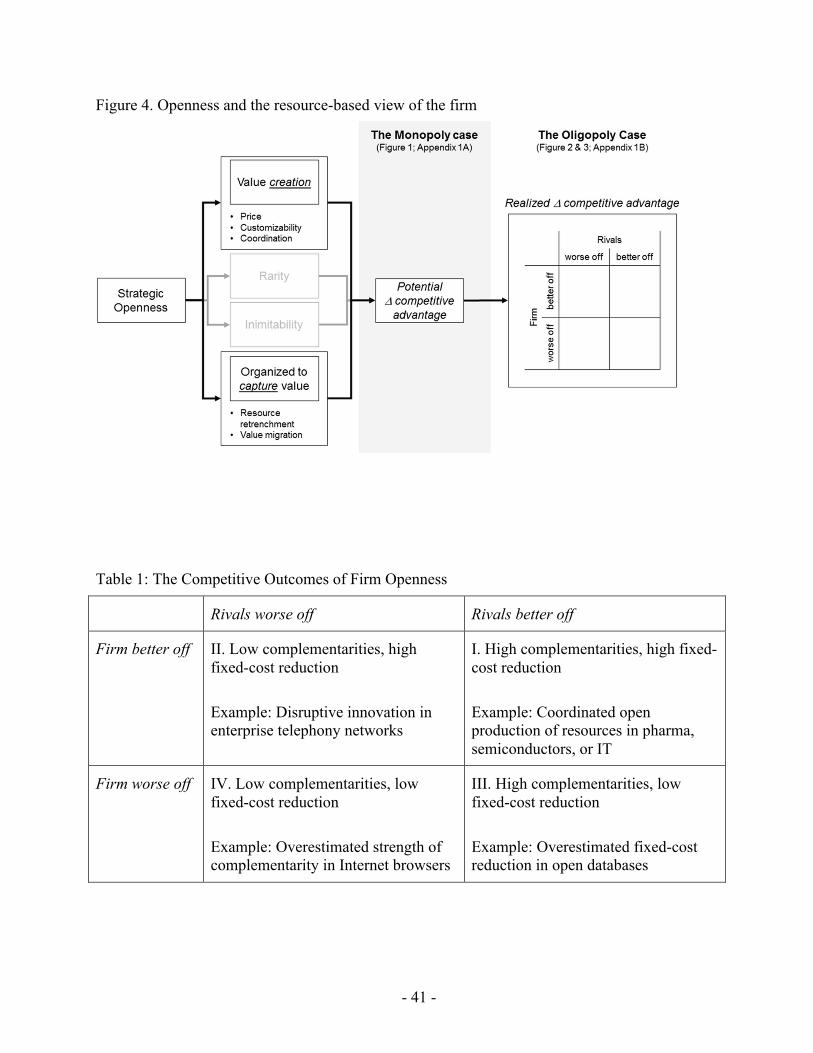
- 41 -
Figure 4. Openness and the resource-based view of the firm
Table 1: The Competitive Outcomes of Firm Openness
Rivals worse off Rivals better off
Firm better off II. Low complementarities, high fixed-cost reduction
Example: Disruptive innovation in enterprise telephony networks
I. High complementarities, high fixed-cost reduction
Example: Coordinated open production of resources in pharma, semiconductors, or IT
Firm worse off IV. Low complementarities, low fixed-cost reduction
Example: Overestimated strength of complementarity in Internet browsers
III. High complementarities, low fixed-cost reduction
Example: Overestimated fixed-cost reduction in open databases
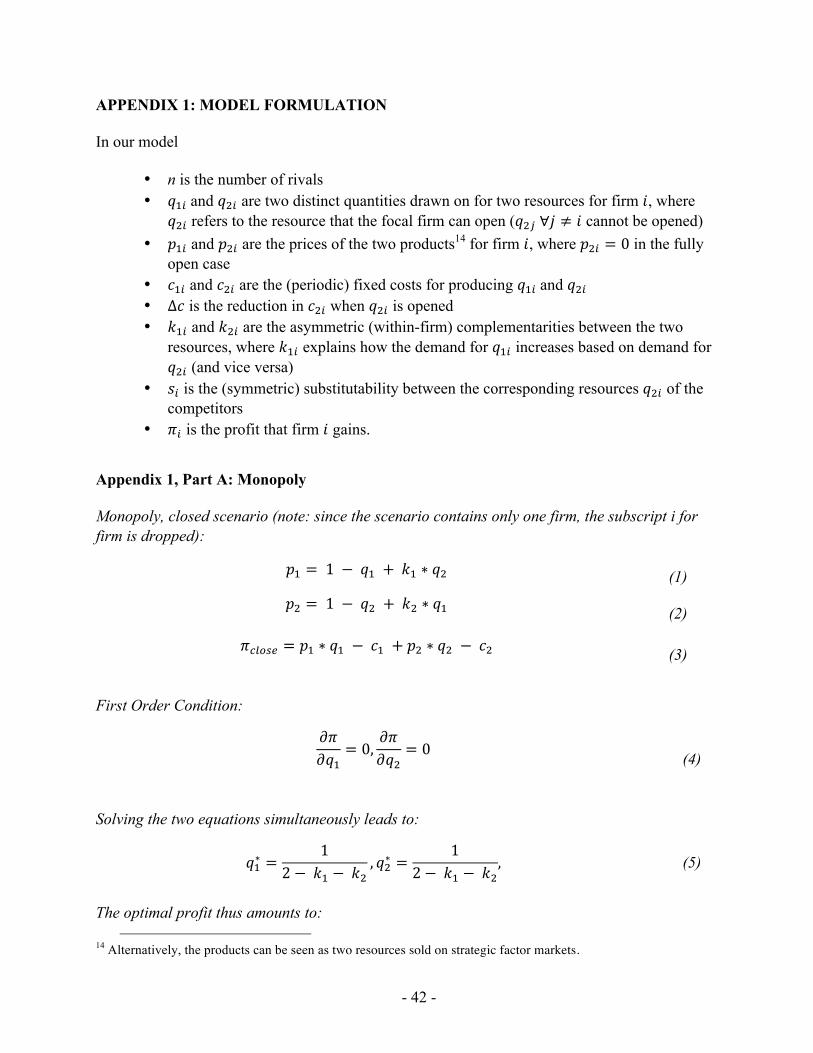
- 42 -
APPENDIX 1: MODEL FORMULATION
In our model
• n is the number of rivals • 𝑞!! and 𝑞!! are two distinct quantities drawn on for two resources for firm 𝑖, where
𝑞!! refers to the resource that the focal firm can open (𝑞!! ∀𝑗 ≠ 𝑖 cannot be opened) • 𝑝!! and 𝑝!! are the prices of the two products14 for firm 𝑖, where 𝑝!! = 0 in the fully
open case • 𝑐!! and 𝑐!! are the (periodic) fixed costs for producing 𝑞!! and 𝑞!! • ∆𝑐 is the reduction in 𝑐!! when 𝑞!! is opened • 𝑘!! and 𝑘!! are the asymmetric (within-firm) complementarities between the two
resources, where 𝑘!! explains how the demand for 𝑞!! increases based on demand for 𝑞!! (and vice versa)
• 𝑠! is the (symmetric) substitutability between the corresponding resources 𝑞!! of the competitors
• 𝜋! is the profit that firm 𝑖 gains.
Appendix 1, Part A: Monopoly
Monopoly, closed scenario (note: since the scenario contains only one firm, the subscript i for firm is dropped):
𝑝! = 1 − 𝑞! + 𝑘! ∗ 𝑞! (1)
𝑝! = 1 − 𝑞! + 𝑘! ∗ 𝑞! (2)
𝜋!"#$% = 𝑝! ∗ 𝑞! − 𝑐! + 𝑝! ∗ 𝑞! − 𝑐!
(3)
First Order Condition:
𝜕𝜋𝜕𝑞!
= 0,𝜕𝜋𝜕𝑞!
= 0
(4)
Solving the two equations simultaneously leads to:
𝑞!∗ =1
2− 𝑘! − 𝑘!, 𝑞!∗ =
12− 𝑘! − 𝑘!
, (5)
The optimal profit thus amounts to:
14 Alternatively, the products can be seen as two resources sold on strategic factor markets.
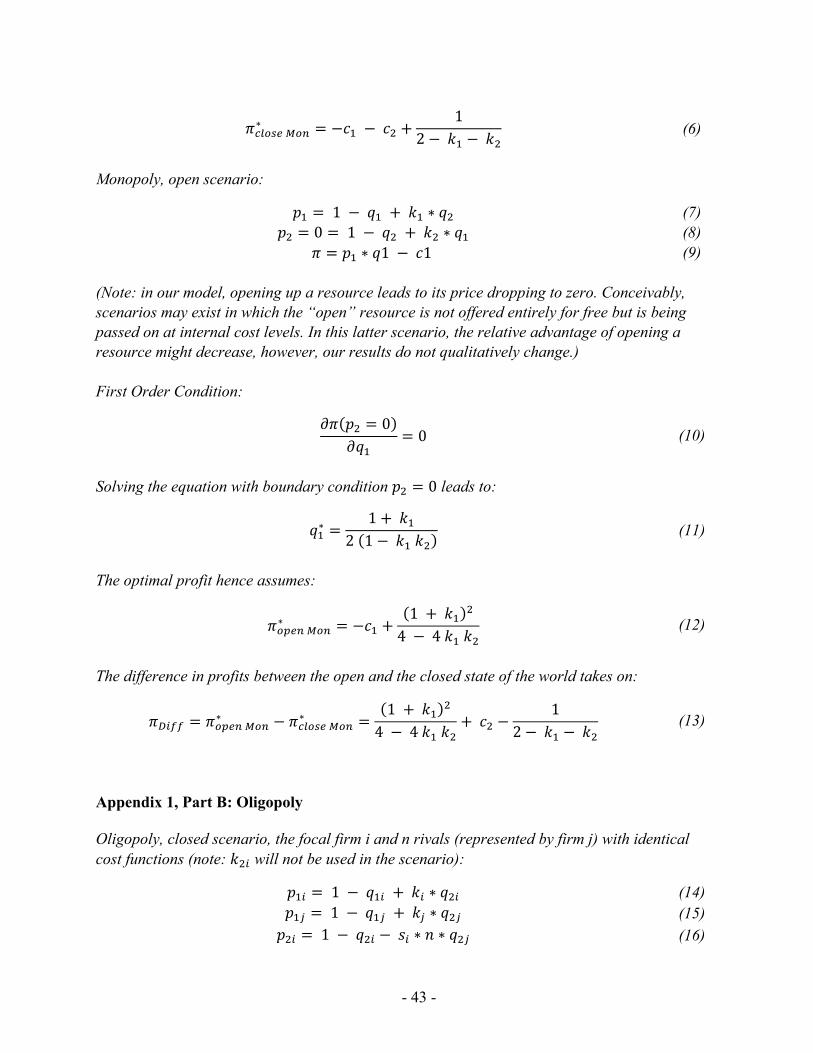
- 43 -
𝜋!"#$% !"#∗ = −𝑐! − 𝑐! +1
2− 𝑘! − 𝑘! (6)
Monopoly, open scenario:
𝑝! = 1 − 𝑞! + 𝑘! ∗ 𝑞! (7) 𝑝! = 0 = 1 − 𝑞! + 𝑘! ∗ 𝑞! (8)
𝜋 = 𝑝! ∗ 𝑞1 − 𝑐1 (9) (Note: in our model, opening up a resource leads to its price dropping to zero. Conceivably, scenarios may exist in which the “open” resource is not offered entirely for free but is being passed on at internal cost levels. In this latter scenario, the relative advantage of opening a resource might decrease, however, our results do not qualitatively change.) First Order Condition:
𝜕𝜋 𝑝! = 0𝜕𝑞!
= 0 (10)
Solving the equation with boundary condition 𝑝! = 0 leads to:
𝑞!∗ =1+ 𝑘!
2 1− 𝑘! 𝑘! (11)
The optimal profit hence assumes:
𝜋!"#$ !"#∗ = −𝑐! +1 + 𝑘! !
4 − 4 𝑘! 𝑘! (12)
The difference in profits between the open and the closed state of the world takes on:
𝜋!"## = 𝜋!"#$ !"#∗ − 𝜋!"#$% !"#∗ =1 + 𝑘! !
4 − 4 𝑘! 𝑘!+ 𝑐! −
12− 𝑘! − 𝑘!
(13)
Appendix 1, Part B: Oligopoly
Oligopoly, closed scenario, the focal firm i and n rivals (represented by firm j) with identical cost functions (note: 𝑘!! will not be used in the scenario):
𝑝!! = 1 − 𝑞!! + 𝑘! ∗ 𝑞!! (14) 𝑝!! = 1 − 𝑞!! + 𝑘! ∗ 𝑞!! (15) 𝑝!! = 1 − 𝑞!! − 𝑠! ∗ 𝑛 ∗ 𝑞!! (16)
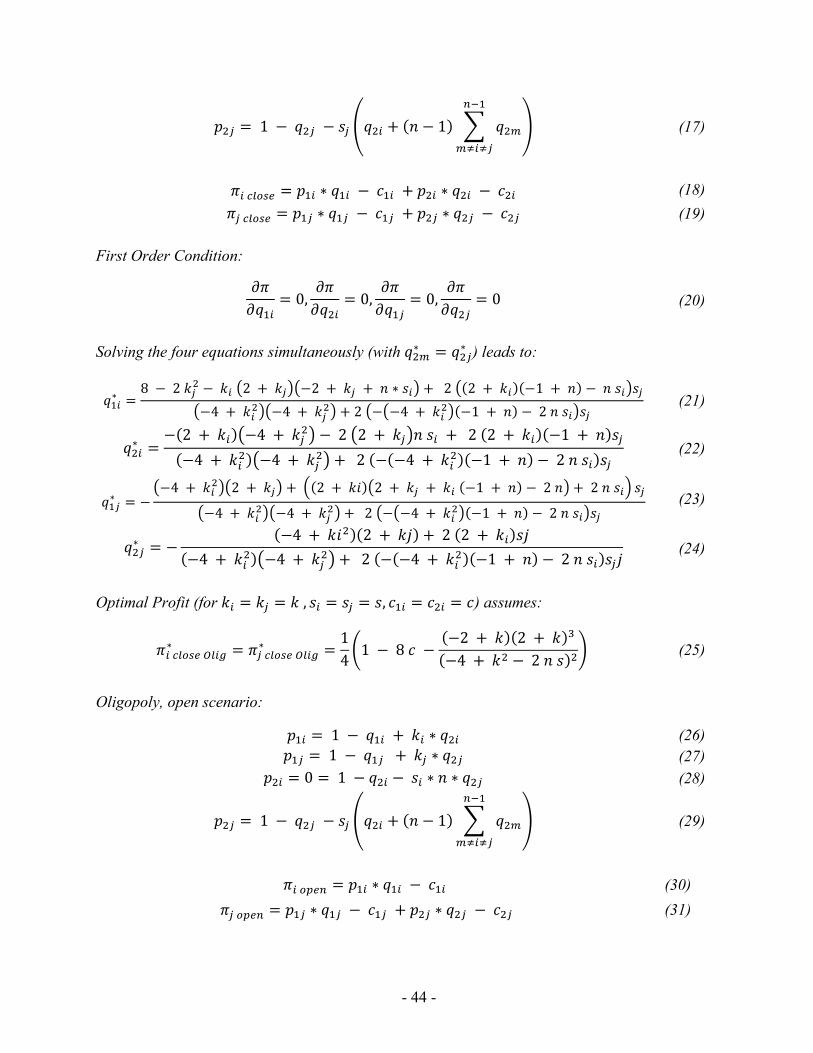
- 44 -
𝑝!! = 1 − 𝑞!! − 𝑠! 𝑞!! + 𝑛 − 1 𝑞!!
!!!
!!!!!
(17)
𝜋! !"#$% = 𝑝!! ∗ 𝑞!! − 𝑐!! + 𝑝!! ∗ 𝑞!! − 𝑐!! (18) 𝜋! !"#$% = 𝑝!! ∗ 𝑞!! − 𝑐!! + 𝑝!! ∗ 𝑞!! − 𝑐!! (19)
First Order Condition:
𝜕𝜋𝜕𝑞!!
= 0,𝜕𝜋𝜕𝑞!!
= 0,𝜕𝜋𝜕𝑞!!
= 0,𝜕𝜋𝜕𝑞!!
= 0 (20)
Solving the four equations simultaneously (with 𝑞!!∗ = 𝑞!!∗ ) leads to:
𝑞!!∗ =8 − 2 𝑘!! − 𝑘! 2 + 𝑘! −2 + 𝑘! + 𝑛 ∗ 𝑠! + 2 2 + 𝑘! −1 + 𝑛 − 𝑛 𝑠! 𝑠!
−4 + 𝑘!! −4 + 𝑘!! + 2 − −4 + 𝑘!! −1 + 𝑛 − 2 𝑛 𝑠! 𝑠! (21)
𝑞!!∗ =− 2 + 𝑘! −4 + 𝑘!! − 2 2 + 𝑘! 𝑛 𝑠! + 2 2 + 𝑘! −1 + 𝑛 𝑠!−4 + 𝑘!! −4 + 𝑘!! + 2 − −4 + 𝑘!! −1 + 𝑛 − 2 𝑛 𝑠! 𝑠!
(22)
𝑞!!∗ = −−4 + 𝑘!! 2 + 𝑘! + 2 + 𝑘𝑖 2 + 𝑘! + 𝑘! −1 + 𝑛 − 2 𝑛 + 2 𝑛 𝑠! 𝑠!
−4 + 𝑘!! −4 + 𝑘!! + 2 − −4 + 𝑘!! −1 + 𝑛 − 2 𝑛 𝑠! 𝑠! (23)
𝑞!!∗ = −−4 + 𝑘𝑖! 2 + 𝑘𝑗 + 2 2 + 𝑘! 𝑠𝑗
−4 + 𝑘!! −4 + 𝑘!! + 2 − −4 + 𝑘!! −1 + 𝑛 − 2 𝑛 𝑠! 𝑠!𝑗 (24)
Optimal Profit (for 𝑘! = 𝑘! = 𝑘 , 𝑠! = 𝑠! = 𝑠, 𝑐!! = 𝑐!! = 𝑐) assumes:
𝜋! !"#$% !"#$∗ = 𝜋! !"#$% !"#$∗ =14 1 − 8 𝑐 −
−2 + 𝑘 2 + 𝑘 !
−4 + 𝑘! − 2 𝑛 𝑠 ! (25)
Oligopoly, open scenario:
𝑝!! = 1 − 𝑞!! + 𝑘! ∗ 𝑞!! (26) 𝑝!! = 1 − 𝑞!! + 𝑘! ∗ 𝑞!! (27)
𝑝!! = 0 = 1 − 𝑞!! − 𝑠! ∗ 𝑛 ∗ 𝑞!! (28)
𝑝!! = 1 − 𝑞!! − 𝑠! 𝑞!! + 𝑛 − 1 𝑞!!
!!!
!!!!!
(29)
𝜋! !"#$ = 𝑝!! ∗ 𝑞!! − 𝑐!! (30)
𝜋! !"#$ = 𝑝!! ∗ 𝑞!! − 𝑐!! + 𝑝!! ∗ 𝑞!! − 𝑐!! (31)
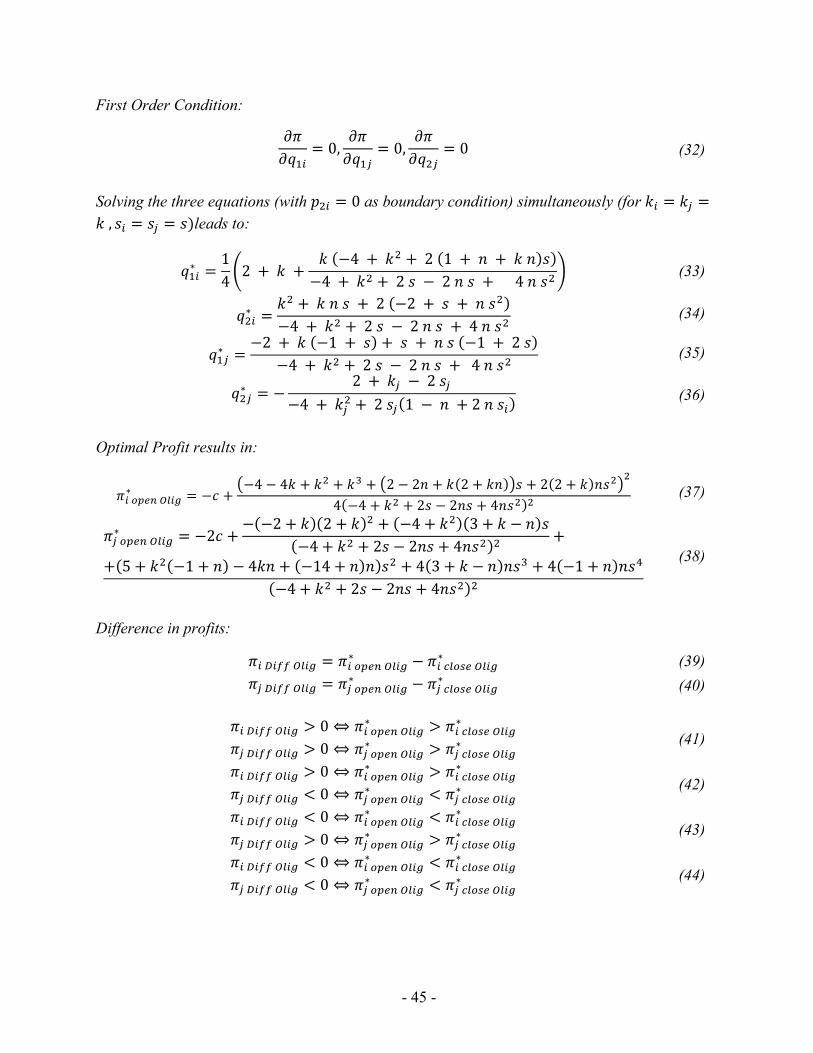
- 45 -
First Order Condition:
𝜕𝜋𝜕𝑞!!
= 0,𝜕𝜋𝜕𝑞!!
= 0,𝜕𝜋𝜕𝑞!!
= 0 (32)
Solving the three equations (with 𝑝!! = 0 as boundary condition) simultaneously (for 𝑘! = 𝑘! =𝑘 , 𝑠! = 𝑠! = 𝑠)leads to:
𝑞!!∗ =14 2 + 𝑘 +
𝑘 −4 + 𝑘! + 2 1 + 𝑛 + 𝑘 𝑛 𝑠−4 + 𝑘! + 2 𝑠 − 2 𝑛 𝑠 + 4 𝑛 𝑠! (33)
𝑞!!∗ =𝑘! + 𝑘 𝑛 𝑠 + 2 −2 + 𝑠 + 𝑛 𝑠!
−4 + 𝑘! + 2 𝑠 − 2 𝑛 𝑠 + 4 𝑛 𝑠! (34)
𝑞!!∗ =−2 + 𝑘 −1 + 𝑠 + 𝑠 + 𝑛 𝑠 −1 + 2 𝑠
−4 + 𝑘! + 2 𝑠 − 2 𝑛 𝑠 + 4 𝑛 𝑠! (35)
𝑞!!∗ = −2 + 𝑘! − 2 𝑠!
−4 + 𝑘!! + 2 𝑠! 1 − 𝑛 + 2 𝑛 𝑠! (36)
Optimal Profit results in:
𝜋! !"#$ !"#$∗ = −𝑐 +−4 − 4𝑘 + 𝑘! + 𝑘! + 2 − 2𝑛 + 𝑘 2 + 𝑘𝑛 𝑠 + 2 2 + 𝑘 𝑛𝑠! !
4 −4 + 𝑘! + 2𝑠 − 2𝑛𝑠 + 4𝑛𝑠! ! (37)
𝜋! !"#$ !"#$∗ = −2𝑐 +− −2+ 𝑘 2+ 𝑘 ! + −4+ 𝑘! 3+ 𝑘 − 𝑛 𝑠
−4+ 𝑘! + 2𝑠 − 2𝑛𝑠 + 4𝑛𝑠! ! +
+ 5+ 𝑘! −1+ 𝑛 − 4𝑘𝑛 + −14+ 𝑛 𝑛 𝑠! + 4 3+ 𝑘 − 𝑛 𝑛𝑠! + 4 −1+ 𝑛 𝑛𝑠!
−4+ 𝑘! + 2𝑠 − 2𝑛𝑠 + 4𝑛𝑠! ! (38)
Difference in profits:
𝜋! !"## !"#$ = 𝜋! !"#$ !"#$∗ − 𝜋! !"#$% !"#$∗ (39) 𝜋! !"## !"#$ = 𝜋! !"#$ !"#$∗ − 𝜋! !"#$% !"#$∗ (40)
𝜋! !"## !"#$ > 0⇔ 𝜋! !"#$ !"#$∗ > 𝜋! !"#$% !"#$∗ 𝜋! !"## !"#$ > 0⇔ 𝜋! !"#$ !"#$∗ > 𝜋! !"#$% !"#$∗ (41)
𝜋! !"## !"#$ > 0⇔ 𝜋! !"#$ !"#$∗ > 𝜋! !"#$% !"#$∗ 𝜋! !"## !"#$ < 0⇔ 𝜋! !"#$ !"#$∗ < 𝜋! !"#$% !"#$∗ (42)
𝜋! !"## !"#$ < 0⇔ 𝜋! !"#$ !"#$∗ < 𝜋! !"#$% !"#$∗ 𝜋! !"## !"#$ > 0⇔ 𝜋! !"#$ !"#$∗ > 𝜋! !"#$% !"#$∗ (43)
𝜋! !"## !"#$ < 0⇔ 𝜋! !"#$ !"#$∗ < 𝜋! !"#$% !"#$∗ 𝜋! !"## !"#$ < 0⇔ 𝜋! !"#$ !"#$∗ < 𝜋! !"#$% !"#$∗ (44)
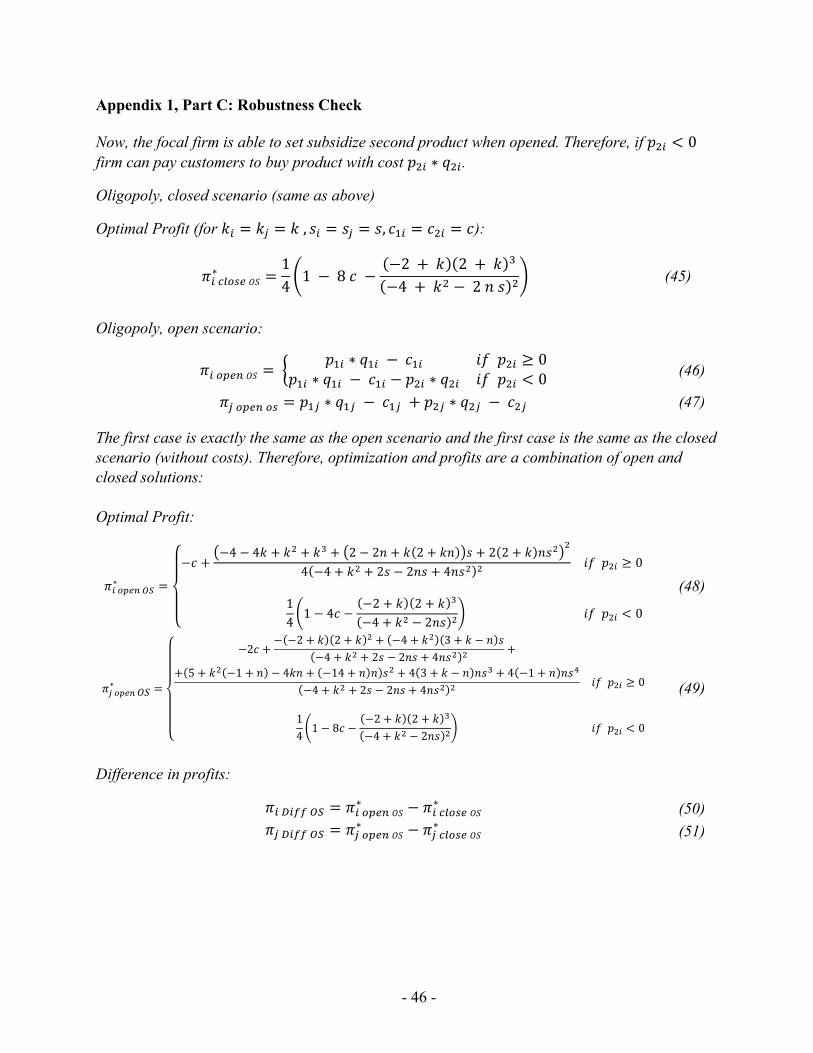
- 46 -
Appendix 1, Part C: Robustness Check
Now, the focal firm is able to set subsidize second product when opened. Therefore, if 𝑝!! < 0 firm can pay customers to buy product with cost 𝑝!! ∗ 𝑞!!.
Oligopoly, closed scenario (same as above)
Optimal Profit (for 𝑘! = 𝑘! = 𝑘 , 𝑠! = 𝑠! = 𝑠, 𝑐!! = 𝑐!! = 𝑐):
𝜋! !"#$% 𝑂𝑆∗ =14 1 − 8 𝑐 −
−2 + 𝑘 2 + 𝑘 !
−4 + 𝑘! − 2 𝑛 𝑠 ! (45)
Oligopoly, open scenario:
𝜋! !"#$ 𝑂𝑆 = 𝑝!! ∗ 𝑞!! − 𝑐!! 𝑖𝑓 𝑝!! ≥ 0
𝑝!! ∗ 𝑞!! − 𝑐!! − 𝑝!! ∗ 𝑞!! 𝑖𝑓 𝑝!! < 0 (46)
𝜋! !"#$ !" = 𝑝!! ∗ 𝑞!! − 𝑐!! + 𝑝!! ∗ 𝑞!! − 𝑐!! (47)
The first case is exactly the same as the open scenario and the first case is the same as the closed scenario (without costs). Therefore, optimization and profits are a combination of open and closed solutions: Optimal Profit:
𝜋! !"#$ !"∗ =
−𝑐 +−4 − 4𝑘 + 𝑘! + 𝑘! + 2 − 2𝑛 + 𝑘 2 + 𝑘𝑛 𝑠 + 2 2 + 𝑘 𝑛𝑠!
!
4 −4 + 𝑘! + 2𝑠 − 2𝑛𝑠 + 4𝑛𝑠! ! 𝑖𝑓 𝑝!! ≥ 0
141 − 4𝑐 −
−2 + 𝑘 2 + 𝑘 !
−4 + 𝑘! − 2𝑛𝑠 ! 𝑖𝑓 𝑝!! < 0
(48)
𝜋! !"#$ 𝑂𝑆∗ =
−2𝑐 +− −2 + 𝑘 2 + 𝑘 ! + −4 + 𝑘! 3 + 𝑘 − 𝑛 𝑠
−4 + 𝑘! + 2𝑠 − 2𝑛𝑠 + 4𝑛𝑠! ! +
+ 5 + 𝑘! −1 + 𝑛 − 4𝑘𝑛 + −14 + 𝑛 𝑛 𝑠! + 4 3 + 𝑘 − 𝑛 𝑛𝑠! + 4 −1 + 𝑛 𝑛𝑠!
−4 + 𝑘! + 2𝑠 − 2𝑛𝑠 + 4𝑛𝑠! ! 𝑖𝑓 𝑝!! ≥ 0
141 − 8𝑐 −
−2 + 𝑘 2 + 𝑘 !
−4 + 𝑘! − 2𝑛𝑠 ! 𝑖𝑓 𝑝!! < 0
(49)
Difference in profits:
𝜋! !"## !" = 𝜋! !"#$ 𝑂𝑆∗ − 𝜋! !"#$% 𝑂𝑆∗ (50) 𝜋! !"## !" = 𝜋! !"#$ 𝑂𝑆∗ − 𝜋! !"#$% 𝑂𝑆∗ (51)
- 47 -
APPENDIX 2: THE CONDITIONALITY OF THE BENEFITS OF OPENNESS
In the following, we show for which parameter spaces openness leads to competitive advantage
in our models. These varying parameter configurations may for example be thought of firms
choosing different types of openness—varying in their cost structure and potential to save costs,
complementary, substitutability, and applicability to different competitive surrounding—to solve
different problems (e.g., Felin & Zenger, 2014). Specifically, we draw on our oligopoly model
and will produce three sets of results for (i) n =1, (ii) n = 2, and (iii) n = 3. For each of these
models, we will calculate the minimum cost reduction Δ𝑐 that needs to arise from opening the
focal resource so that the focal firm can benefit from openness, given specific values of
complementarity 𝑘 and substitutability 𝑠 (see Tables A2.1–A2.3 and Figures A2.1–A2.3 on next
page). If Δ𝑐 is higher than the values in the respective cells, then openness is beneficial.
These results illustrate for example:
• If there is no substitutability between the open and closed resource, then it does not matter
how many rivals compete with the focal firm.
• For high levels of 𝑘, 𝑠, or 𝑛, openness requires a lower level of cost reduction Δ𝑐 to be
beneficial to the focal firm.
• The effect of increased complementarity k appears to be stronger than the same increase in
substitutability s.
• An increase in 𝑘, 𝑠, or 𝑛 is always strictly beneficial to the open firm (assuming the open
firm can choose set negative prices on the open resource following a logic of cross-
subsidization). Accordingly, the values Δ𝑐 below represent lower bounds, and the minimum
Δ𝑐 needed for the open firm to improve its profit will strictly decrease for higher values of
𝑘, 𝑠, or 𝑛.
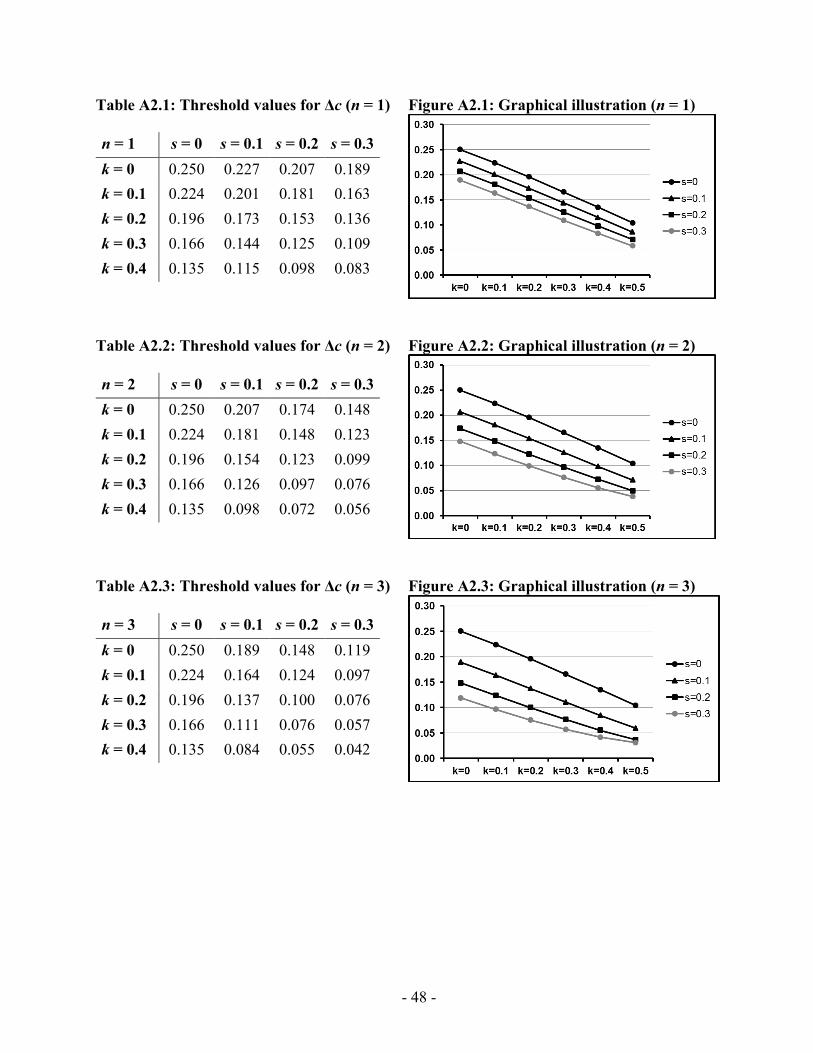
- 48 -
Table A2.1: Threshold values for !c (n = 1)
n = 1 s = 0 s = 0.1 s = 0.2 s = 0.3 k = 0 0.250 0.227 0.207 0.189 k = 0.1 0.224 0.201 0.181 0.163 k = 0.2 0.196 0.173 0.153 0.136 k = 0.3 0.166 0.144 0.125 0.109 k = 0.4 0.135 0.115 0.098 0.083
Figure A2.1: Graphical illustration (n = 1)
Table A2.2: Threshold values for !c (n = 2)
n = 2 s = 0 s = 0.1 s = 0.2 s = 0.3 k = 0 0.250 0.207 0.174 0.148k = 0.1 0.224 0.181 0.148 0.123 k = 0.2 0.196 0.154 0.123 0.099 k = 0.3 0.166 0.126 0.097 0.076 k = 0.4 0.135 0.098 0.072 0.056
Figure A2.2: Graphical illustration (n = 2)
Table A2.3: Threshold values for !c (n = 3)
n = 3 s = 0 s = 0.1 s = 0.2 s = 0.3 k = 0 0.250 0.189 0.148 0.119 k = 0.1 0.224 0.164 0.124 0.097 k = 0.2 0.196 0.137 0.100 0.076 k = 0.3 0.166 0.111 0.076 0.057 k = 0.4 0.135 0.084 0.055 0.042
Figure A2.3: Graphical illustration (n = 3)