Embed Size (px)
Citation preview
Survey Data Analysis in Stata
Jeff PitbladoAssociate Director, Statistical Software
StataCorp LP
Stata Conference DC 2009
J. Pitblado (StataCorp) Survey Data Analysis DC 2009 1 / 44
Outline
1 Types of data
2 Survey data characteristics
3 Variance estimation
4 Estimation for subpopulations
5 Summary
J. Pitblado (StataCorp) Survey Data Analysis DC 2009 2 / 44
Why survey data?
Collecting data can be expensive and time consuming.Consider how you would collect the following data:
Smoking habits of teenagersBirth weights for expectant mothers with high blood pressure
Using stages of clustered sampling can help cut down on theexpense and time.
J. Pitblado (StataCorp) Survey Data Analysis DC 2009 3 / 44
Types of data
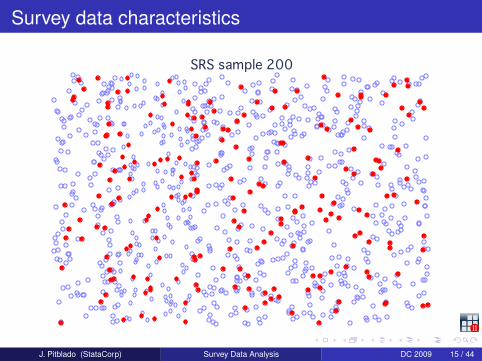
Simple random sample (SRS) dataObservations are "independently" sampled from a data generatingprocess.
Typical assumption: independent and identically distributed (iid)Make inferences about the data generating processSample variability is explained by the statistical model attributed tothe data generating process
Standard dataWe’ll use this term to distinguish this data from survey data.
J. Pitblado (StataCorp) Survey Data Analysis DC 2009 4 / 44
Types of data
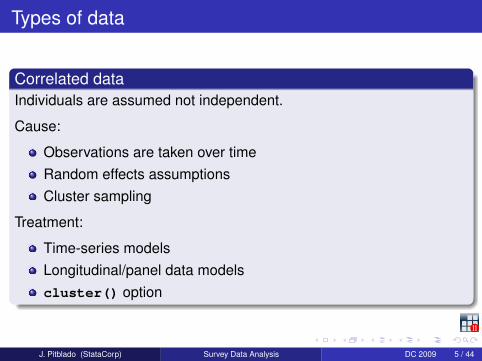
Correlated dataIndividuals are assumed not independent.
Cause:
Observations are taken over timeRandom effects assumptionsCluster sampling
Treatment:
Time-series modelsLongitudinal/panel data modelscluster() option
J. Pitblado (StataCorp) Survey Data Analysis DC 2009 5 / 44
Types of data
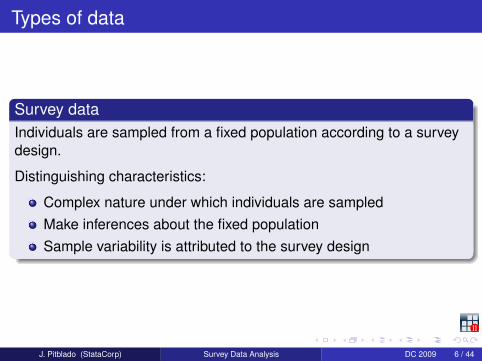
Survey dataIndividuals are sampled from a fixed population according to a surveydesign.
Distinguishing characteristics:
Complex nature under which individuals are sampledMake inferences about the fixed populationSample variability is attributed to the survey design
J. Pitblado (StataCorp) Survey Data Analysis DC 2009 6 / 44
Types of data
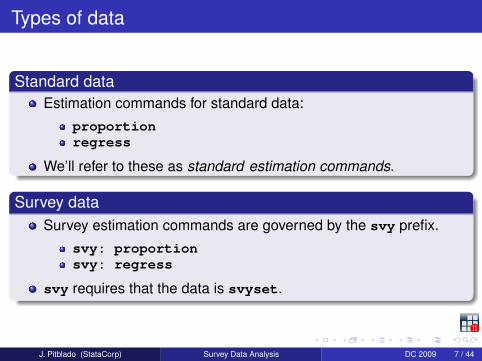
Standard dataEstimation commands for standard data:
proportionregress
We’ll refer to these as standard estimation commands.
Survey dataSurvey estimation commands are governed by the svy prefix.
svy: proportionsvy: regress
svy requires that the data is svyset.
J. Pitblado (StataCorp) Survey Data Analysis DC 2009 7 / 44
Survey data characteristics
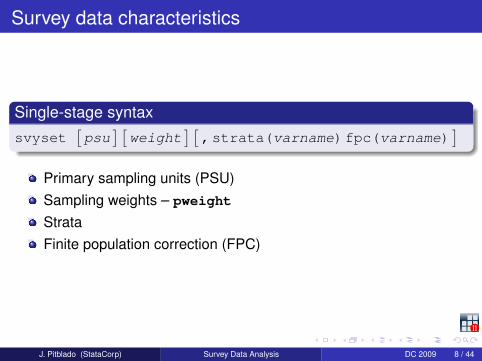
Single-stage syntaxsvyset
[psu
] [weight
] [,strata(varname)fpc(varname)
]Primary sampling units (PSU)Sampling weights – pweight
StrataFinite population correction (FPC)
J. Pitblado (StataCorp) Survey Data Analysis DC 2009 8 / 44
Survey data characteristics
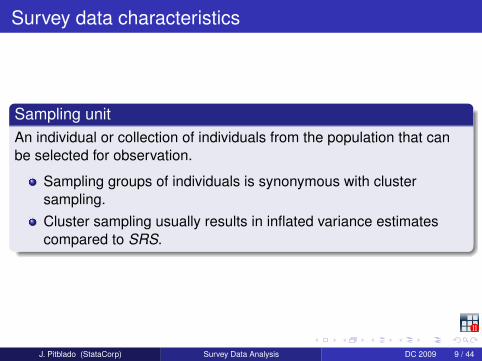
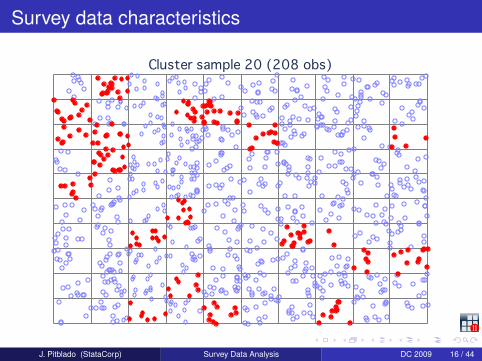
Sampling unitAn individual or collection of individuals from the population that canbe selected for observation.
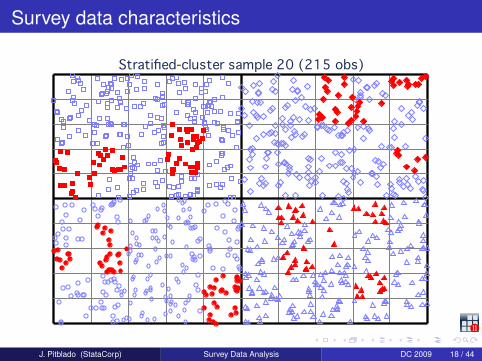
Sampling groups of individuals is synonymous with clustersampling.Cluster sampling usually results in inflated variance estimatescompared to SRS.
J. Pitblado (StataCorp) Survey Data Analysis DC 2009 9 / 44
Survey data characteristics
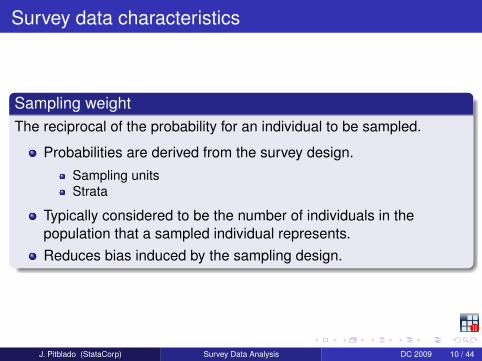
Sampling weightThe reciprocal of the probability for an individual to be sampled.
Probabilities are derived from the survey design.
Sampling unitsStrata
Typically considered to be the number of individuals in thepopulation that a sampled individual represents.Reduces bias induced by the sampling design.
J. Pitblado (StataCorp) Survey Data Analysis DC 2009 10 / 44
Survey data characteristics
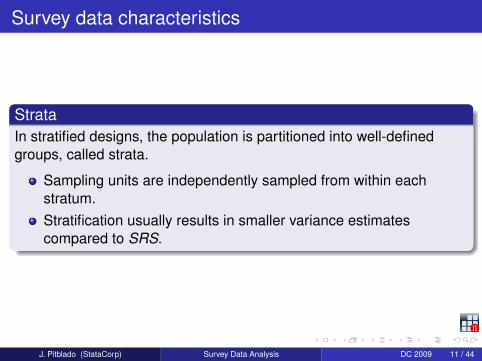
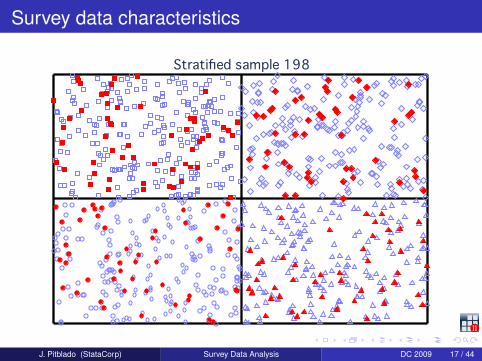
StrataIn stratified designs, the population is partitioned into well-definedgroups, called strata.
Sampling units are independently sampled from within eachstratum.Stratification usually results in smaller variance estimatescompared to SRS.
J. Pitblado (StataCorp) Survey Data Analysis DC 2009 11 / 44
Survey data characteristics
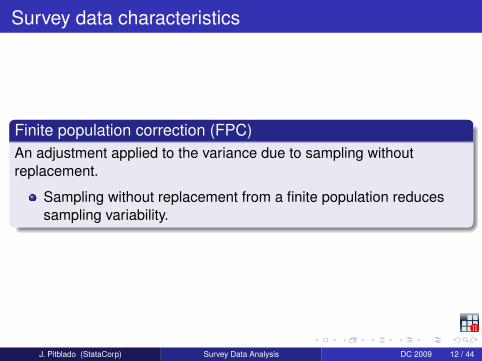
Finite population correction (FPC)An adjustment applied to the variance due to sampling withoutreplacement.
Sampling without replacement from a finite population reducessampling variability.
J. Pitblado (StataCorp) Survey Data Analysis DC 2009 12 / 44
Survey data characteristics
Example: svyset for single-stage designs
J. Pitblado (StataCorp) Survey Data Analysis DC 2009 13 / 44
Survey data characteristics
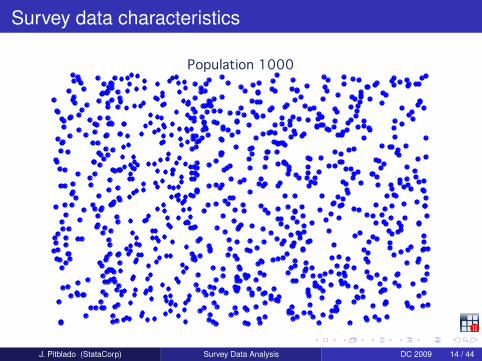
Population 1000
J. Pitblado (StataCorp) Survey Data Analysis DC 2009 14 / 44
Survey data characteristics
SRS sample 200
J. Pitblado (StataCorp) Survey Data Analysis DC 2009 15 / 44
Survey data characteristics
Cluster sample 20 (208 obs)
J. Pitblado (StataCorp) Survey Data Analysis DC 2009 16 / 44
Survey data characteristics
Stratified sample 198
J. Pitblado (StataCorp) Survey Data Analysis DC 2009 17 / 44
Survey data characteristics
Stratified-cluster sample 20 (215 obs)
J. Pitblado (StataCorp) Survey Data Analysis DC 2009 18 / 44
Survey data characteristics
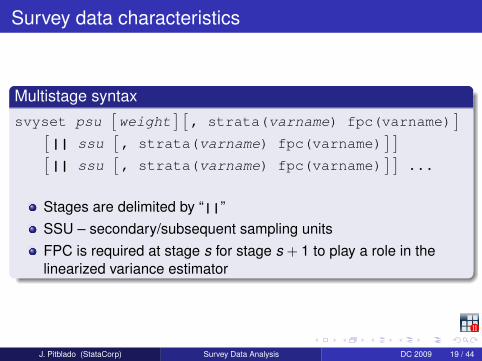
Multistage syntaxsvyset psu
[weight
] [, strata(varname) fpc(varname)
][|| ssu
[, strata(varname) fpc(varname)
] ][|| ssu
[, strata(varname) fpc(varname)
] ]...
Stages are delimited by “||”SSU – secondary/subsequent sampling unitsFPC is required at stage s for stage s + 1 to play a role in thelinearized variance estimator
J. Pitblado (StataCorp) Survey Data Analysis DC 2009 19 / 44
Survey data characteristics
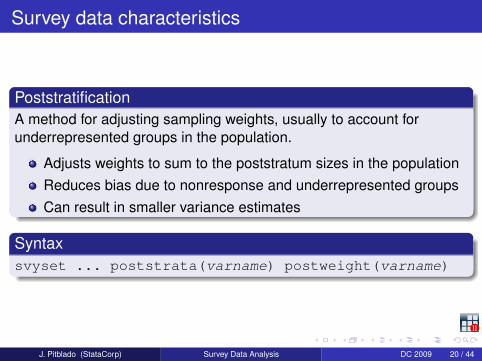
PoststratificationA method for adjusting sampling weights, usually to account forunderrepresented groups in the population.
Adjusts weights to sum to the poststratum sizes in the populationReduces bias due to nonresponse and underrepresented groupsCan result in smaller variance estimates
Syntaxsvyset ... poststrata(varname) postweight(varname)
J. Pitblado (StataCorp) Survey Data Analysis DC 2009 20 / 44
Survey data characteristics
Example: svyset for poststratification
J. Pitblado (StataCorp) Survey Data Analysis DC 2009 21 / 44
Strata with a single sampling unit
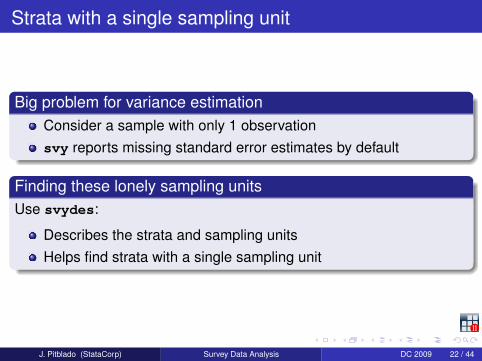
Big problem for variance estimationConsider a sample with only 1 observationsvy reports missing standard error estimates by default
Finding these lonely sampling unitsUse svydes:
Describes the strata and sampling unitsHelps find strata with a single sampling unit
J. Pitblado (StataCorp) Survey Data Analysis DC 2009 22 / 44
Strata with a single sampling unit
Example: svydes
J. Pitblado (StataCorp) Survey Data Analysis DC 2009 23 / 44
Strata with a single sampling unit
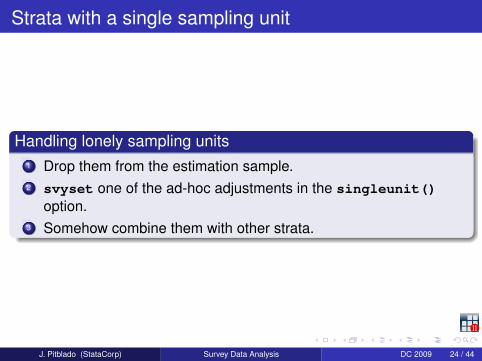
Handling lonely sampling units1 Drop them from the estimation sample.2 svyset one of the ad-hoc adjustments in the singleunit()
option.3 Somehow combine them with other strata.
J. Pitblado (StataCorp) Survey Data Analysis DC 2009 24 / 44
Certainty units
Sampling units that are guaranteed to be chosen by the design.Certainty units are handled by treating each one as its ownstratum with an FPC of 1.
J. Pitblado (StataCorp) Survey Data Analysis DC 2009 25 / 44
Variance estimation
Stata has three variance estimation methods for survey data:
LinearizationBalanced repeated replicationThe jackknife
J. Pitblado (StataCorp) Survey Data Analysis DC 2009 26 / 44
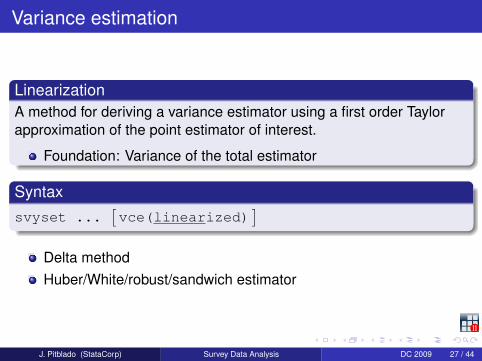
Variance estimation
LinearizationA method for deriving a variance estimator using a first order Taylorapproximation of the point estimator of interest.
Foundation: Variance of the total estimator
Syntaxsvyset ...
[vce(linearized)
]Delta methodHuber/White/robust/sandwich estimator
J. Pitblado (StataCorp) Survey Data Analysis DC 2009 27 / 44
Variance estimation
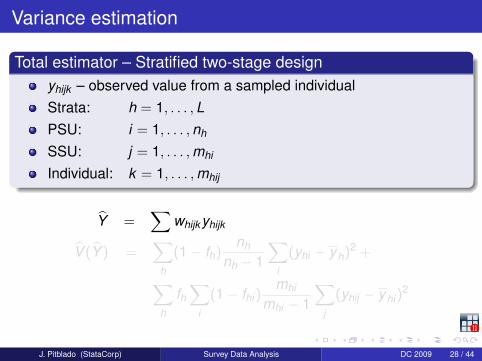
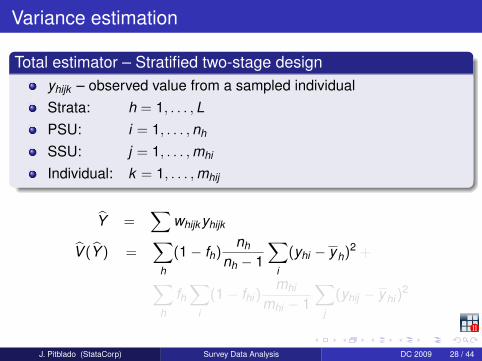
Total estimator – Stratified two-stage designyhijk – observed value from a sampled individualStrata: h = 1, . . . ,LPSU: i = 1, . . . ,nh
SSU: j = 1, . . . ,mhi
Individual: k = 1, . . . ,mhij
Y =∑
whijkyhijk
V (Y ) =∑
h
(1− fh)nh
nh − 1
∑i
(yhi − yh)2 +
∑h
fh∑
i
(1− fhi)mhi
mhi − 1
∑j
(yhij − yhi)2
J. Pitblado (StataCorp) Survey Data Analysis DC 2009 28 / 44
Variance estimation
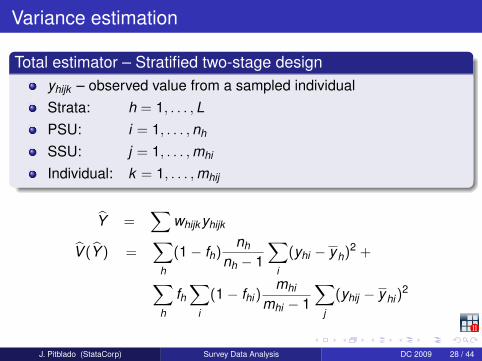
Example: svy: total
J. Pitblado (StataCorp) Survey Data Analysis DC 2009 29 / 44
Variance estimation
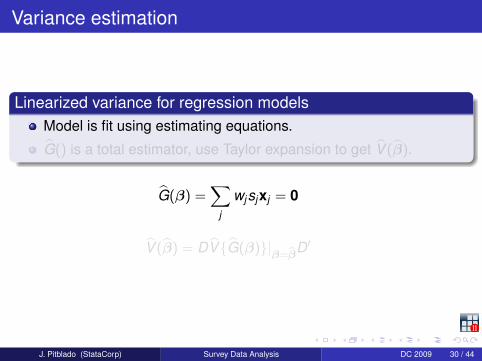
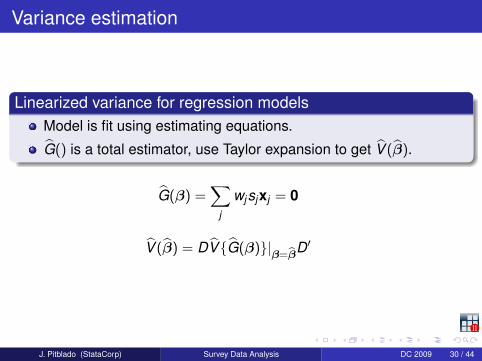
Linearized variance for regression modelsModel is fit using estimating equations.
G() is a total estimator, use Taylor expansion to get V (β).
G(β) =∑
j
wjsjxj = 0
V (β) = DV{G(β)}|β=bβD′
J. Pitblado (StataCorp) Survey Data Analysis DC 2009 30 / 44
Variance estimation
Linearized variance for regression modelsModel is fit using estimating equations.
G() is a total estimator, use Taylor expansion to get V (β).
G(β) =∑
j
wjsjxj = 0
V (β) = DV{G(β)}|β=bβD′
J. Pitblado (StataCorp) Survey Data Analysis DC 2009 30 / 44
Variance estimation
Example: svy: logit
J. Pitblado (StataCorp) Survey Data Analysis DC 2009 31 / 44
Variance estimation
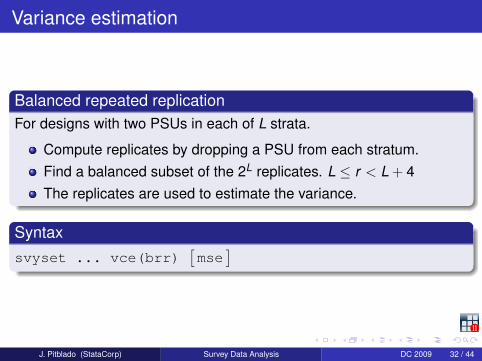
Balanced repeated replicationFor designs with two PSUs in each of L strata.
Compute replicates by dropping a PSU from each stratum.Find a balanced subset of the 2L replicates. L ≤ r < L + 4The replicates are used to estimate the variance.
Syntaxsvyset ... vce(brr)
[mse
]
J. Pitblado (StataCorp) Survey Data Analysis DC 2009 32 / 44
Variance estimation
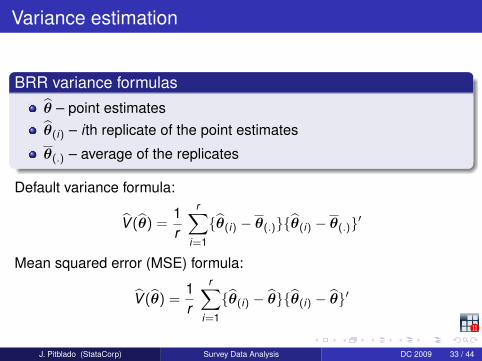
BRR variance formulas
θ – point estimatesθ(i) – i th replicate of the point estimates
θ(.) – average of the replicates
Default variance formula:
V (θ) =1r
r∑i=1
{θ(i) − θ(.)}{θ(i) − θ(.)}′
Mean squared error (MSE) formula:
V (θ) =1r
r∑i=1
{θ(i) − θ}{θ(i) − θ}′
J. Pitblado (StataCorp) Survey Data Analysis DC 2009 33 / 44
Variance estimation
Example: svy brr: logit
J. Pitblado (StataCorp) Survey Data Analysis DC 2009 34 / 44
Variance estimation
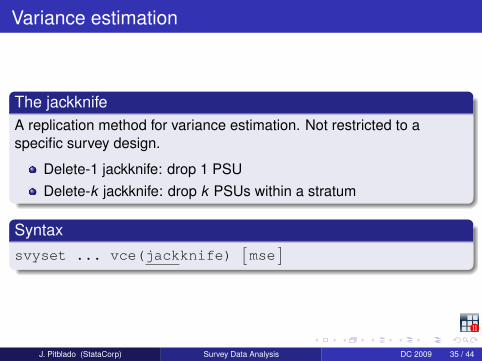
The jackknifeA replication method for variance estimation. Not restricted to aspecific survey design.
Delete-1 jackknife: drop 1 PSUDelete-k jackknife: drop k PSUs within a stratum
Syntaxsvyset ... vce(jackknife)
[mse
]
J. Pitblado (StataCorp) Survey Data Analysis DC 2009 35 / 44
Variance estimation
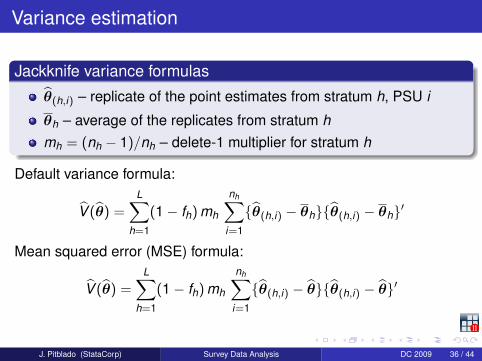
Jackknife variance formulas
θ(h,i) – replicate of the point estimates from stratum h, PSU i
θh – average of the replicates from stratum hmh = (nh − 1)/nh – delete-1 multiplier for stratum h
Default variance formula:
V (θ) =L∑
h=1
(1− fh) mh
nh∑i=1
{θ(h,i) − θh}{θ(h,i) − θh}′
Mean squared error (MSE) formula:
V (θ) =L∑
h=1
(1− fh) mh
nh∑i=1
{θ(h,i) − θ}{θ(h,i) − θ}′
J. Pitblado (StataCorp) Survey Data Analysis DC 2009 36 / 44
Variance estimation
Example: svy jackknife: logit
J. Pitblado (StataCorp) Survey Data Analysis DC 2009 37 / 44
Variance estimation
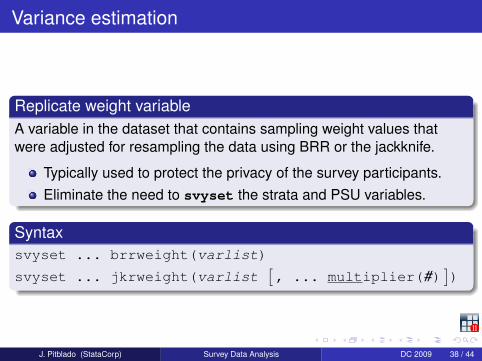
Replicate weight variableA variable in the dataset that contains sampling weight values thatwere adjusted for resampling the data using BRR or the jackknife.
Typically used to protect the privacy of the survey participants.Eliminate the need to svyset the strata and PSU variables.
Syntaxsvyset ... brrweight(varlist)
svyset ... jkrweight(varlist[, ... multiplier(#)
])
J. Pitblado (StataCorp) Survey Data Analysis DC 2009 38 / 44
Estimation for subpopulations
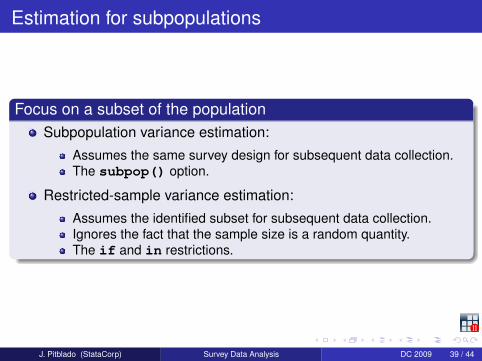
Focus on a subset of the populationSubpopulation variance estimation:
Assumes the same survey design for subsequent data collection.The subpop() option.
Restricted-sample variance estimation:
Assumes the identified subset for subsequent data collection.Ignores the fact that the sample size is a random quantity.The if and in restrictions.
J. Pitblado (StataCorp) Survey Data Analysis DC 2009 39 / 44
Estimation for subpopulations
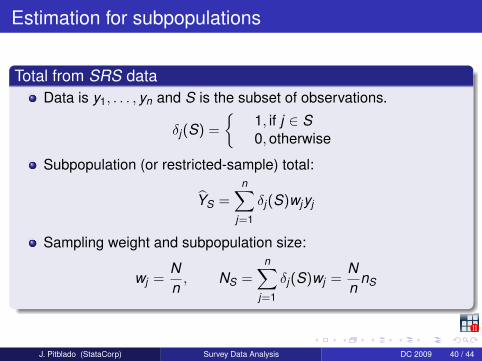
Total from SRS dataData is y1, . . . , yn and S is the subset of observations.
δj(S) =
{1, if j ∈ S0,otherwise
Subpopulation (or restricted-sample) total:
YS =n∑
j=1
δj(S)wjyj
Sampling weight and subpopulation size:
wj =Nn, NS =
n∑j=1
δj(S)wj =Nn
nS
J. Pitblado (StataCorp) Survey Data Analysis DC 2009 40 / 44
Estimation for subpopulations
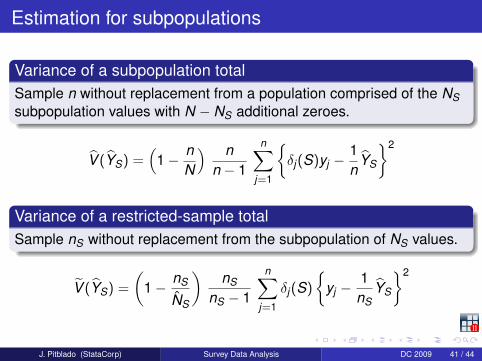
Variance of a subpopulation totalSample n without replacement from a population comprised of the NSsubpopulation values with N − NS additional zeroes.
V (YS) =(
1− nN
) nn − 1
n∑j=1
{δj(S)yj −
1n
YS
}2
Variance of a restricted-sample totalSample nS without replacement from the subpopulation of NS values.
V (YS) =
(1− nS
NS
)nS
nS − 1
n∑j=1
δj(S)
{yj −
1nS
YS
}2
J. Pitblado (StataCorp) Survey Data Analysis DC 2009 41 / 44

Estimation for subpopulations
Example: svy, subpop()
J. Pitblado (StataCorp) Survey Data Analysis DC 2009 42 / 44
Summary
1 Use svyset to specify the survey design for your data.2 Use svydes to find strata with a single PSU.3 Choose your variance estimation method; you can svyset it.4 Use the svy prefix with estimation commands.5 Use subpop() instead of if and in.
J. Pitblado (StataCorp) Survey Data Analysis DC 2009 43 / 44
References
Levy, P. and S. Lemeshow. 1999.Sampling of Populations. 3rd ed.New York: Wiley.
StataCorp. 2009.Survey Data Reference Manual: Release 11.College Station, TX: StataCorp LP.
J. Pitblado (StataCorp) Survey Data Analysis DC 2009 44 / 44


![[ME] Multilevel Mixed Effects - Survey Design · 2016. 2. 16. · Stata, , Stata Press, Mata, , and NetCourse are registered trademarks of StataCorp LP. Stata and Stata Press are](https://img.pdfslide.net/doc/110x75/6119d35ebac5e41ff76887ce/me-multilevel-mixed-effects-survey-design-2016-2-16-stata-stata-press.jpg)


![[PSS] Power and Sample Size - Stata · PDF fileSTATAPOWERANDSAMPLE-SIZE REFERENCEMANUAL RELEASE13 ¨ A Stata Press Publication StataCorp LP College Station, Texas ¨](https://img.pdfslide.net/doc/110x75/5a9962877f8b9ad96f8d6efc/pss-power-and-sample-size-stata-referencemanual-release13-a-stata-press-publication.jpg)

