Embed Size (px)
Citation preview
Survey Toolkit

Foreword
In order to pay a tribute to Mahatma Gandhi
on his 150th birth anniversary, India has
pledged to become Open Defecation Free
and clean by 2nd October 2019. Urban India
is now poised at the cross roads of a major
turnaround in its ‘swachhata’ status. In less
than 2 months, we will be beginning our last
lap of the Swachh Bharat 5-year marathon
– the last year of the Mission to achieve our
twin objectives of an Open Defecation Free
(ODF) and clean India.
When the results of the Swachh Survekshan
2018 survey were announced, the excitement
and anticipation among cities was palpable
– a testimony to the way the survey has
captured the mind space of cities and citizens
alike.
Given the spirit of healthy competition that
has been generated among cities around
‘swachhata’, it is a matter of pride for me to
release this toolkit for Swachh Survekshan
2019. Given that the survey this year will
cover all Urban Local Bodies in the country,
this early release of survey indicators will
help cities immensely in not only preparing
themselves well ahead of the actual survey in
January 2019 but also help in improving the
overall quality of life for their citizens through
enhanced service levels towards sanitation
and cleanliness.
I wish all cities the very best of luck for
Swachh Suvekshan 2018, and look forward to
another healthy competition to take forward
the mandate of ‘swachhata’ in Urban India.
Hardeep S puri
Hon’ble Minister of State (Independent Charge)
Ministry of Housing & Urban Affairs
Hardeep S puriHon’ble Minister of State (Independent Charge)Ministry of Housing & Urban Affairs

The objective of the Swachh Survekshan
survey is to encourage citizen participation,
increase city capacities for sustainable ODF
and sanitation measures and to create
awareness amongst all sections of society
about the importance of collective action
to contribute in India’s journey towards a
‘Swachh Bharat’.
The success of Swachh Survekshan in 2016
covering 73 million plus population cities
followed by Swachh Survekshan 2017
covering 434 cities and Swachh Survekshan
2018 covering 4,203 cities have made us
more determined to actively work with
cities to build their capacities and improve
their service delivery to citizens for Swachh
Survekshan 2019. The survey methodology
and indicators have been designed in a
way as to not only ensure sustainability of
achieved outcomes but also garner additional
engagement from citizens.
Swachh Survekshan has become a significant
measure of India’s sanitation status and
I believe these guidelines will help the
participating cities adequately prepare for the
2019 Swachh Survekshan.
Foreword
durga SHanker MiSHra
Secretary
Ministry of Housing & Urban Affairs
durga SHanker MiSHraSecretaryMinistry of Housing & Urban Affairs

SWACHH SURVEKSHAN 2019 | 7
The Swachh Survekshan - a survey conducted
to rank cities on various sanitation and
cleanliness parameters - was launched
by my Ministry under Swachh Bharat
Mission (Urban) in January 2016, with the
intention of enthusing cities with a spirit of
healthy competition towards the concept
of ‘swachhata’. In its first round in 2016,
the ‘Swachh Survekshan’ was conducted
among 73 million plus cities and state / UT
capitals of India. Given the excitement and
enthusiasm, alongwith a spirit of healthy
competition that was generated among cities
in the first round, the Swachh Survekshan
2017 was scaled up to cover 434 cities with
population of 1 lakh and above. The third
round of Swachh Survekshan in 2018 was a
quantum leap of scale - conducted across
4,203 cities, in a record time of 66 days, and
became the largest ever Pan India Sanitation
Survey in the world, impacting around 40
crore people.
The Swachh Survekshan 2019 will be
conducted across all cities and towns across
the country between 4th – 31st January
2019. The distinctive features of the survey
are geared towards encouraging large scale
citizen participation, ensuring sustainability
of initiatives taken towards garbage free and
open defecation free cities, providing credible
outcomes which would be validated by third
party certification, institutionalizing existing
systems through online processes and creating
awareness amongst all sections of society
about the importance of working together
towards making towns and cities a better
place to live in
It is my pleasure to release the Swachh
Survekshan 2019 toolkit covering survey
methodology and assessment parameters
serving as a guiding document and ready
reckoner to help cities prepare well and step
up their service delivery levels to get a high
score during the survey.
I wish all participating cities the very best of
luck in preparing themselves for the Swachh
Survekshan 2019, and hope that they are
able to make the best possible use of these
guidelines to build up their capacities.
Foreword
Vinod kuMar Jindal
Joint Secretary & National Mission Director
Swachh Bharat Mission (Urban)
Ministry of Housing & Urban Affairs

executive Summary 10
Survey Methodology 11
evolution of Swachh Survekshan 14
Swachh Survekshan 2019 ranking Criteria 15
Change in assessment Weightage 16
‘Service level progress’ Weightage distribution 17
part-1: Service level progress 19
• Collection and Transportation (7 indicators) 20
• Processing and Disposal (8 indicators) 28
• Sustainable Sanitation (7 indicators) 37
• IEC & Behavior Change (3 indicators) 45
• Capacity Building (2 indicators) 49
• Bye-Laws/Regulation (4 indicators) 52
• Innovation and Best Practices (2 indicators) 57
Part-1A: Independent Validation of Service Level Progress 61
Part 2 : Certification 63
Part 3 : Direct Observation 66
part 4 : Citizen Feedback 75
Table of Contents
10 | SWACHH SURVEKSHAN 2019
As a prelude to encouraging cities to improve
urban sanitation, Minister of Housing and
Urban Affairs (MoHUA) had conducted ‘Swachh
Survekshan-2016’ survey for the rating of 73
cities in January 2016 followed by ‘Swachh
Survekshan-2017’ conducted in January-
February 2017 ranking 434 cities and recently
concluded Swachh Survekshan 2018 for ranking
4,203 Cities. In a bid to scale up the coverage of
the ranking exercise and encourage towns and
cities to actively implement mission initiatives
in a timely and innovative manner, MoHUA now
proposes to conduct its fourth survey to rank
all cities under Swachh Bharat Mission-Urban
(SBM-U).
The objective of the survey is to encourage large
scale citizen participation, ensure sustainability
of initiatives taken towards garbage free and
open defecation free cities, provide credible
outcomes which would be validated by third
party certification, institutionalize existing
systems through online processes and create
awareness amongst all sections of society about
the importance of working together towards
making towns and cities a better place to live in.
Additionally, the survey also intends to foster a
spirit of healthy competition among towns and
cities to improve their service delivery to citizens,
towards creating cleaner cities.
In order for cities to reap the maximum
developmental benefits from the survey,
concerted efforts are being taken to design
sustainable solutions and strengthen the
capacities of the cities to understand the
Executive Summary
modalities and spirit of the survey. This year,
MoHUA aims to complete the survey of all ULBs
in total 4 weeks - between 4th January to
31st January, 2019. Further, to claim indicator
wise marks, ULBs will have to update their
monthly on-line MIS on SBM(U) portal, upload
indicator wise supporting documents on Swachh
Survekshan-2019 portal by 15th December,
2018 along with uploading City profile by 30th
November, 2018. This would ensure systematic
reporting of facts which shall be validated during
the survey
The MoHUA will conduct intensive interactions
through Swachh Survekshan-2019 regional
workshops to familiarize ULBs with the survey
methodology, survey process and indicators, and
also clarifying their expectations from the survey.
Since citizen participation is a very crucial
component of this survey, this year’s indicators
have marks for innovations led by citizens
and their contribution to overall reduction of
the city’s solid waste generated. Social media
and other traditional media channels will be
used strategically at both national through the
‘Swachh Manch’- a platform for citizens to
connect and contribute to the overall cleanliness
of the city. State and city levels campaigns are
being promoted in order to educate citizens
about the objectives of the survey and survey
methodology, as well as to reinforce the
importance of their participation in the survey,
in order to ensure significantly higher levels of
participation from all citizens.
SWACHH SURVEKSHAN 2019 | 11
Sources and Methods of data Collection
The data to be collected for ranking of the
cities shall be segregated into 4 main areas:
1. Collection of data from online MIS portal of
MoHUA for Service Level Progress
2. Collection of data from Direct Observation
3. Collection of data from Citizen Feedback
4. Certifications for Garbage Free Cities and
Open Defecation Free Cities
Survey Methodology
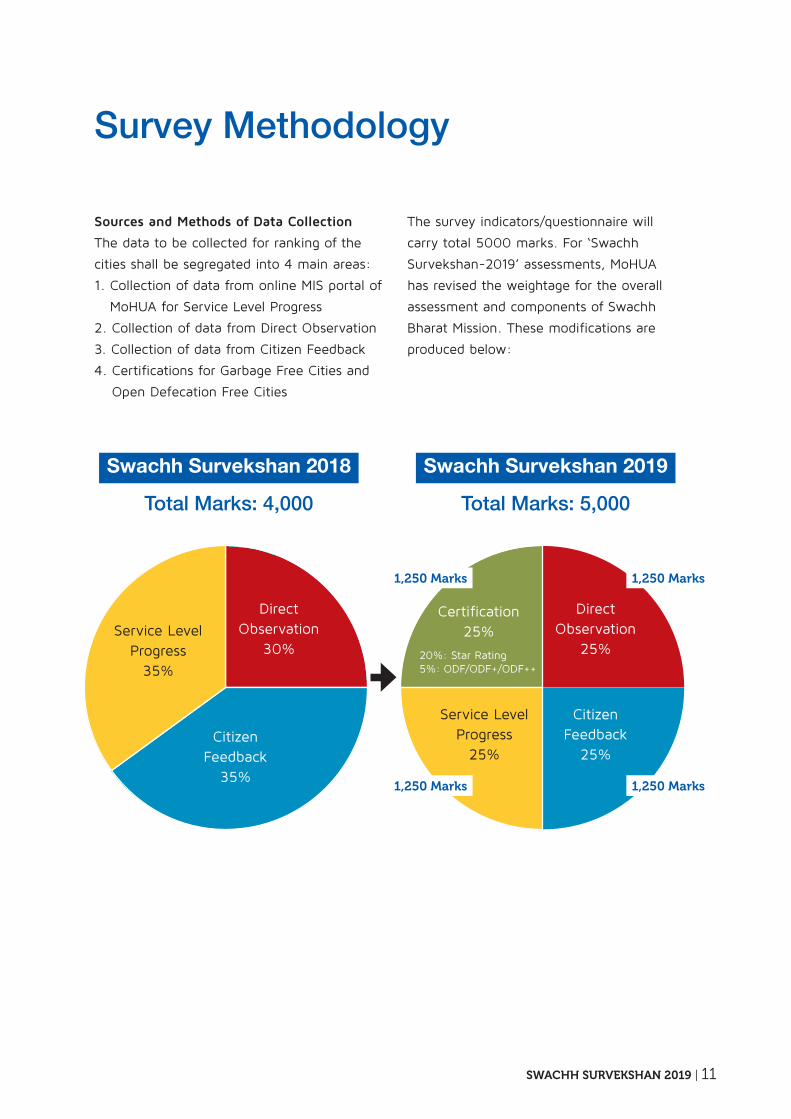
The survey indicators/questionnaire will
carry total 5000 marks. For ‘Swachh
Survekshan-2019’ assessments, MoHUA
has revised the weightage for the overall
assessment and components of Swachh
Bharat Mission. These modifications are
produced below:
Swachh Survekshan 2018 Swachh Survekshan 2019
Total Marks: 4,000 Total Marks: 5,000
20%: Star Rating5%: ODF/ODF+/ODF++
Citizen Feedback
25%Citizen
Feedback35%
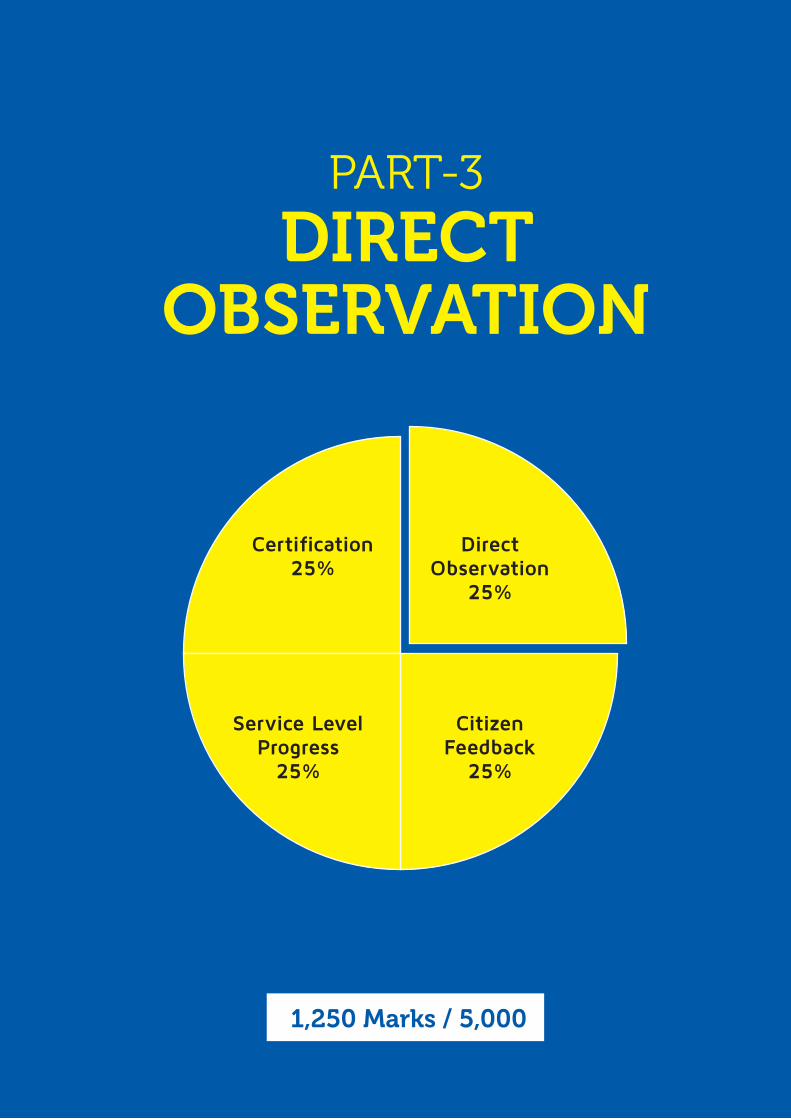
Direct Observation
25%
Direct Observation
30%
Certification 25%
Service Level Progress
25%
Service Level Progress
35%
1,250 Marks1,250 Marks
1,250 Marks1,250 Marks
12 | SWACHH SURVEKSHAN 2019
MetHodology For City ranking• part-1: Service level progress: (Verification
of data submitted by the Urban Local
Bodies on the online MIS portal of MoHUA):
The ULBs have to fill the online MIS portal
which would holistically capture indicators
of Swachh Survekshan 2019. Further, The
Municipal Commissioner/Nodal Officer will
also self-assess the performance of the city
as per survey indicators/questions. The
assessor/survey agency will verify each
and every detail entered on the online
MIS. As per operational design of Swachh
Survekshan-2019, the assessors would not
interact in person with ULB officials for
data verification. The latest data entered by
the cities by 15th December, 2018, on the
online MIS prior to the assessment, would
only be considered for evaluation
• Part –2: Certification (Star Rating of
Garbage Free Cities and Open Defecation
Free Protocols): MoHUA has introduced an
important component of ‘Certification’ of
the city on two different aspects:
a) Star rating of garbage Free Cities: The
cities would be assessed on the basis a
third party certification for achieving a 1,2,
3, 4, 5 or 7 Star rating as per the protocol
released by MoHUA. The protocol has
measures for ensuring cities have managed
their solid waste in a sustainable manner.
Citizen feedback and validation is also an
integral part of this protocol.
b) open defecation Free protocols: While
majority of the cities have made progress
on the ODF protocol adherence, this
year the Ministry has launched ODF+
and ODF ++ protocols which focus on
sustaining Community/Public toilet usage
by ensuring their functionality, cleanliness
and maintenance (Improved Standards)
and achieving sanitation sustainability by
addressing complete sanitation value chain
i.e. Faecal Sludge Management.
Collection & Transportation
30%
Processing & Disposal
25%
ODF 30%
IEC 5%CB 5%
Innova
tion
5%
Collection & Transportation
27%
Processing & Disposal
30%
Sustainable Sanitation
25%
CB 3%
Innova
tion
5%
Bye-Law
s 5%
Solid Waste ManagementSolid Waste Management
IEC 5%
Swachh Survekshan 2018 Swachh Survekshan 2019
Total Marks: 1,400 Total Marks: 1,250
SWACHH SURVEKSHAN 2019 | 13
• Part-3: Direct Observation (On-field
independent observation and Collection of
data): The collection of data from Direct
Observation shall be based on physical
observation of the survey agency. The
questionnaire shall be used as the tool for
observation and data entered by the ULBs
on MIS portal of MoHUA. The survey agency
will use maps and simple handheld device/
recording formats to record their observations
and findings along with Photographs/videos,
wherever necessary. The survey agency will
systematically collect photos as evidence for
field observations. These must be properly
documented with date/ time/ location
parameters and presented to the MoHUA as
a part of their contractual submissions, along
with data and reports for each of the cities. As
a part of direct observation, the survey agency
shall be visiting the following places: in each
zone in each city.
• Residential and Commercial areas: Slum/Old
City/Unplanned Area/ Planned Area, informal
settlements and urban villages across the
different parts of the city. (Slum settlement
to be randomly picked in each zone i.e.
North, South, East and West). The assessor
would observe whether Wall paintings/
murals/Artifacts, Plantation has been done
to enhance the aesthetic aspect of the city.
Whether covered drainage is there, No water
logging, No broken footpath/ pavement, No
solid waste in water bodies/storm water drains
– filtration/screening system in place to check
solid waste flowing etc. is being practiced/
adhered.
• Public and Community toilets randomly
picked in each zone i.e. North, South, East
and West according to population to check if
they are connected with onsite safe disposal
system (Septic tank with no overflow) or
sewer network – no open drainage. The
assessor would also check if the toilets are
user friendly for all citizens
• Vegetable/Fruit and Meat/Fish markets
in the city shall be visited to ascertain the
cleanliness and overall management of waste
generated from these areas.
• Catchment areas of biggest railway Stations,
Bus Stations/Depots and Airport of city to
ensure there is no litter and open defecation
being practiced in the vicinity
• Bulk waste generators viz. hotels, banquet
halls, weekly vegetable market areas (one of
them) (Bulk generator in each zone i.e. North,
South, East and West to be randomly picked)
• Part-4: Citizen Feedback (to be collected
from Citizens directly (face to face), through
Outbound Calls, 1969, Swachhata App/Swachh
Manch and through Swachh Survekshan-2019
portal) – Sample size to be 0.1% of city’s
population or minimum 1000 feedbacks from
cities with more than 1 lakh population. For
cities with less than 1 lakh population, the
minimum sample size would be 250 citizens
feedback. Discussions with local citizens to
be carried out to ascertain and confirm data
on certain indicators. The questionnaire shall
be used as the tool for data collection. The
database of phone numbers shall be provided
by the ULB. In absence of sufficient data from
ULB, a third party vendor’s database may be
used for the town / city.
14 | SWACHH SURVEKSHAN 2019
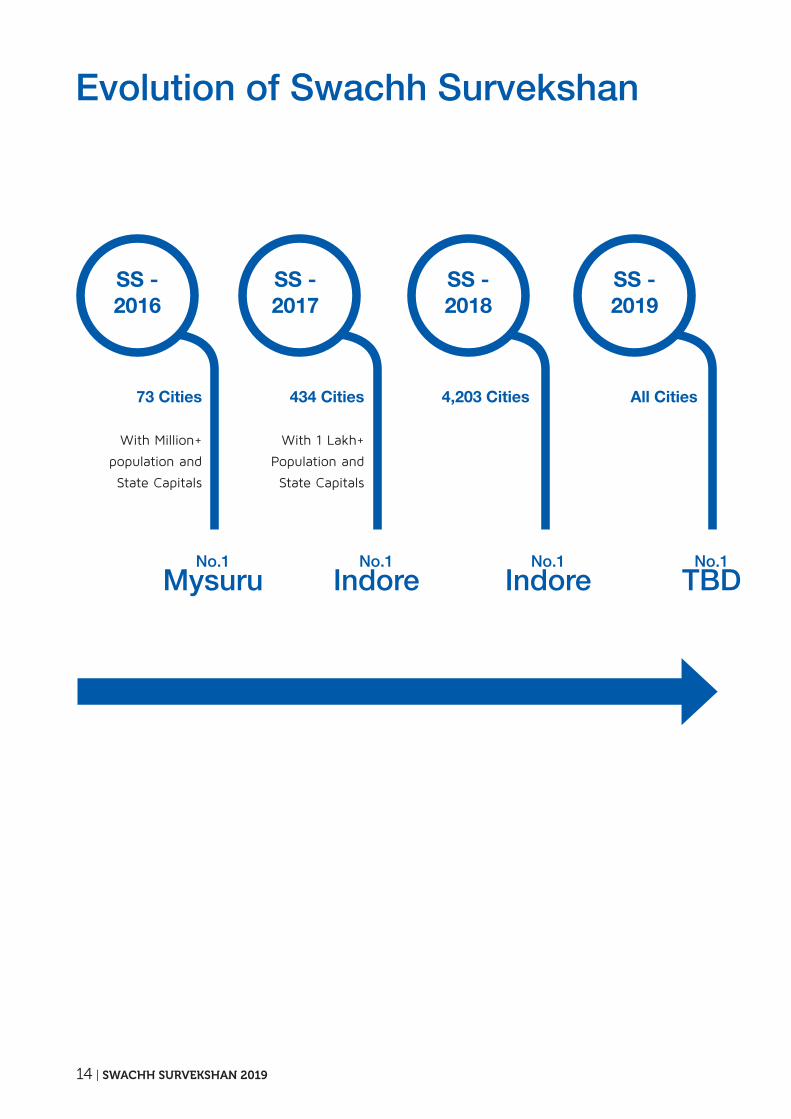
73 Cities
With Million+
population and
State Capitals
434 Cities
With 1 Lakh+
Population and
State Capitals
4,203 Cities All Cities
Evolution of Swachh Survekshan
No.1
MysuruNo.1
IndoreNo.1
IndoreNo.1
TBD
SS - 2016
SS - 2017
SS - 2018
SS - 2019
SWACHH SURVEKSHAN 2019 | 15
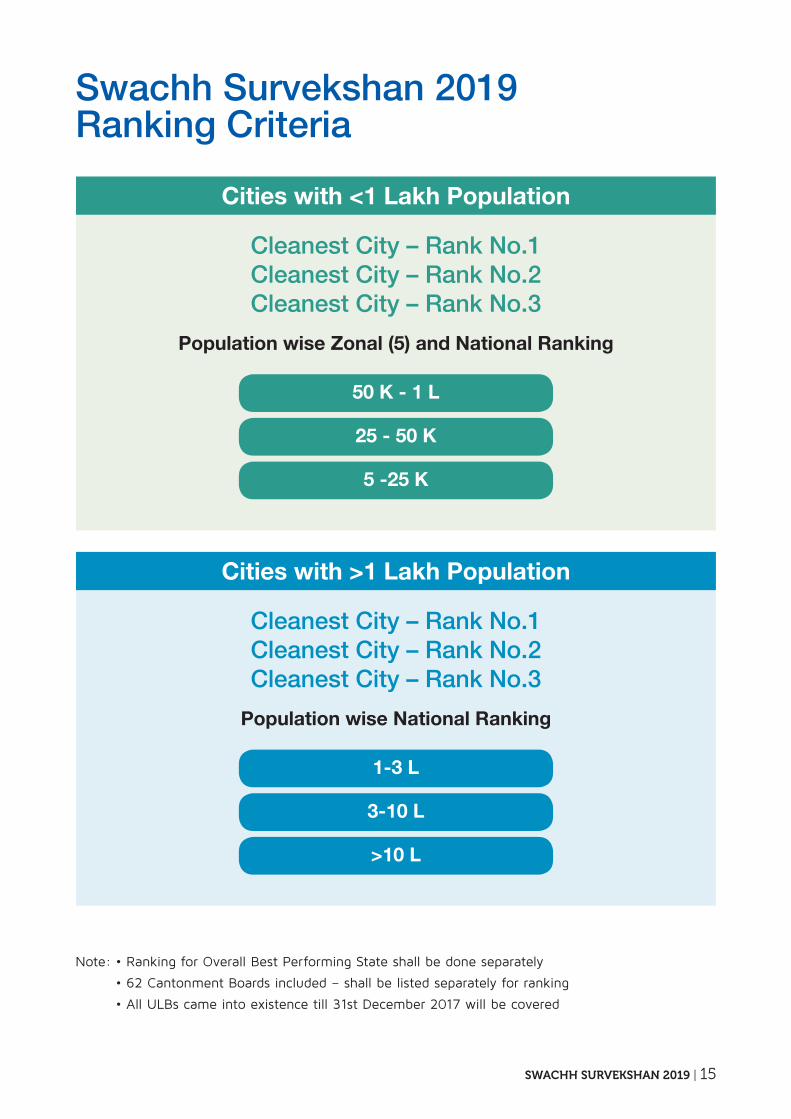
Swachh Survekshan 2019Ranking Criteria
Cities with <1 Lakh Population
Cities with >1 Lakh Population
Cleanest City – Rank No.1Cleanest City – Rank No.2Cleanest City – Rank No.3
Cleanest City – Rank No.1Cleanest City – Rank No.2Cleanest City – Rank No.3
Population wise Zonal (5) and National Ranking
Population wise National Ranking
50 K - 1 L
1-3 L
25 - 50 K
3-10 L
5 -25 K
>10 L
Note: • Ranking for Overall Best Performing State shall be done separately
• 62 Cantonment Boards included – shall be listed separately for ranking
• All ULBs came into existence till 31st December 2017 will be covered
16 | SWACHH SURVEKSHAN 2019
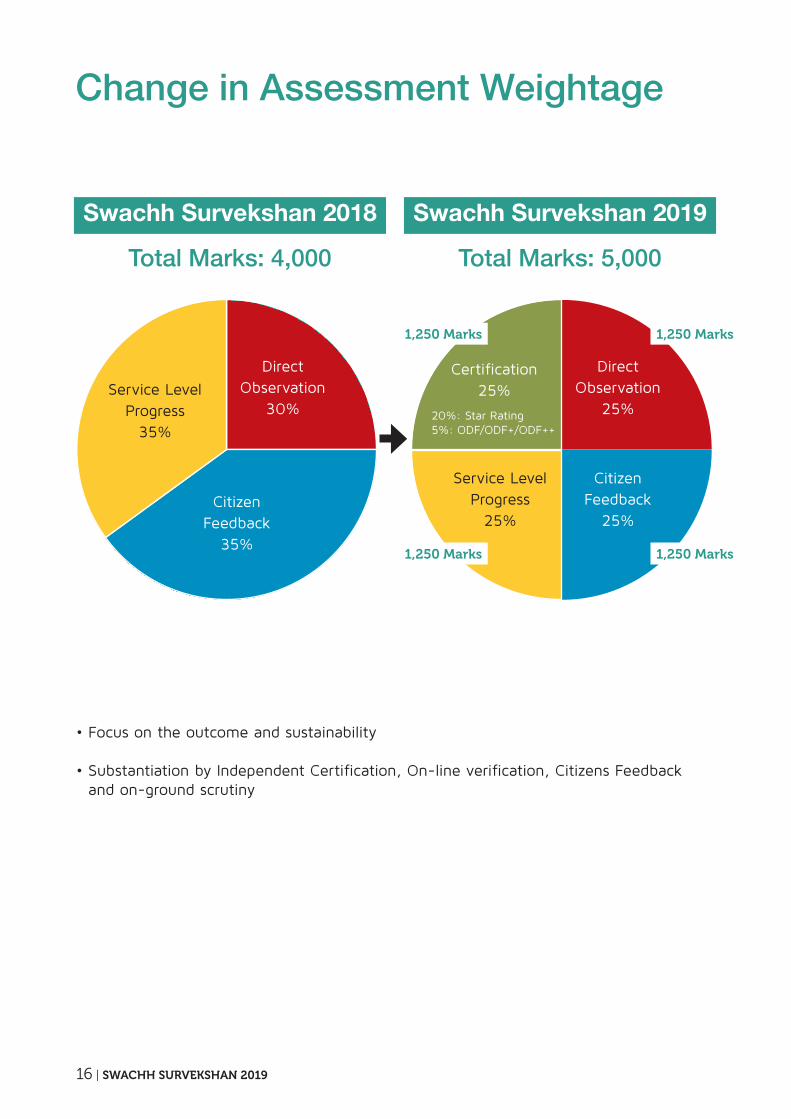
Change in Assessment Weightage
• Focus on the outcome and sustainability
• Substantiation by Independent Certification, On-line verification, Citizens Feedback and on-ground scrutiny
Swachh Survekshan 2018 Swachh Survekshan 2019
Total Marks: 4,000 Total Marks: 5,000
20%: Star Rating5%: ODF/ODF+/ODF++
Citizen Feedback
25%Citizen
Feedback35%
Direct Observation
25%
Direct Observation
30%
Certification 25%
Service Level Progress
25%
Service Level Progress
35%
1,250 Marks1,250 Marks
1,250 Marks1,250 Marks
SWACHH SURVEKSHAN 2019 | 17
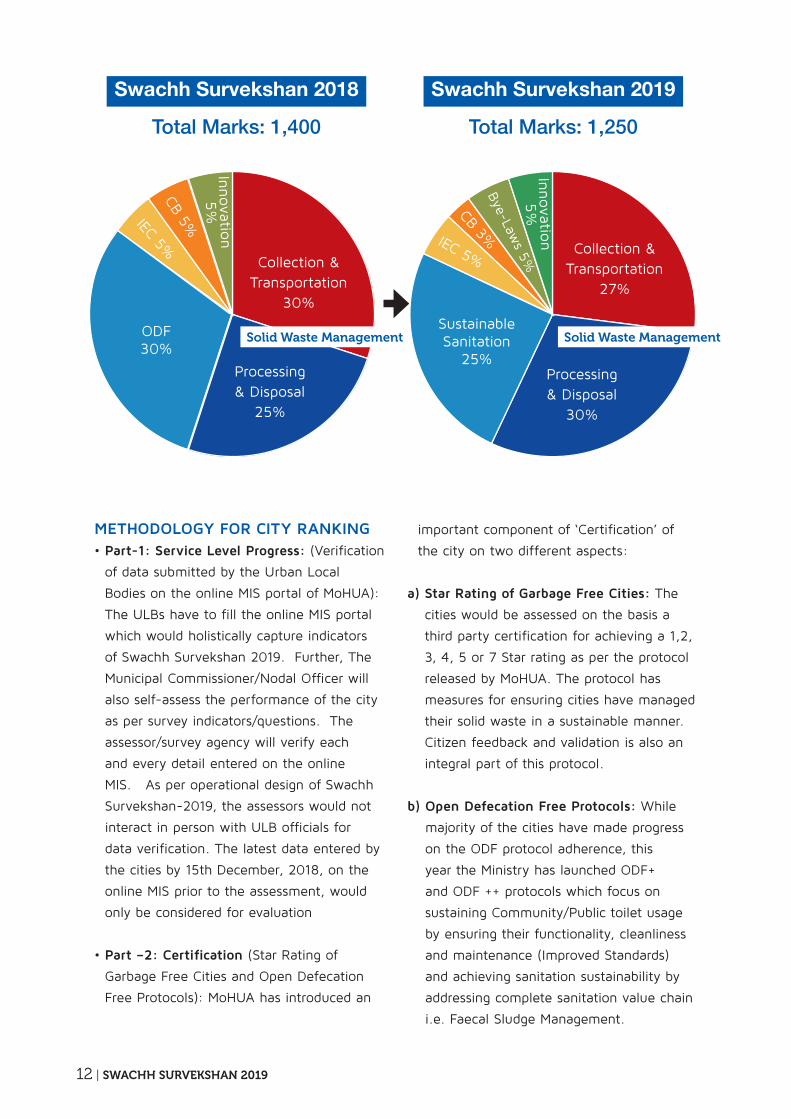
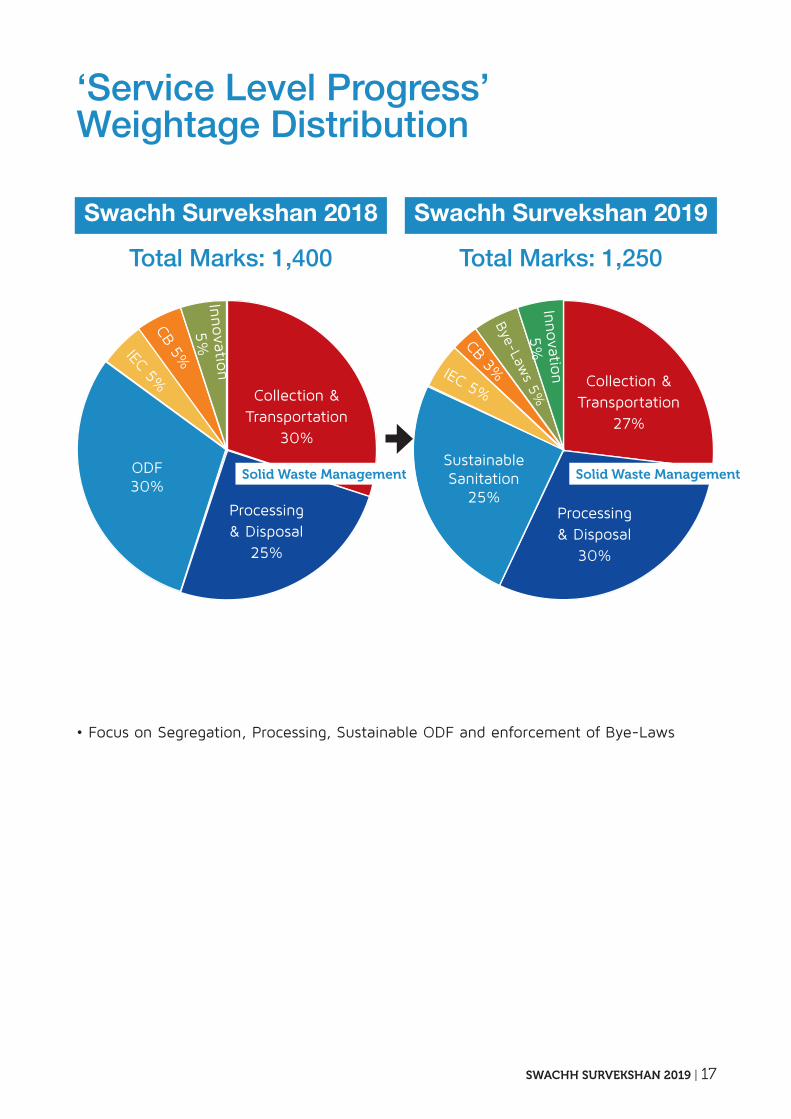
‘Service Level Progress’ Weightage Distribution
• Focus on Segregation, Processing, Sustainable ODF and enforcement of Bye-Laws
Swachh Survekshan 2018 Swachh Survekshan 2019
Total Marks: 1,400 Total Marks: 1,250
Collection & Transportation
30%
Processing & Disposal
25%
ODF 30%
IEC 5%CB 5%
Innova
tion
5%
Collection & Transportation
27%
Processing & Disposal
30%
Sustainable Sanitation
25%
CB 3%
Innovatio
n
5%
Bye-Law
s 5%
Solid Waste ManagementSolid Waste Management
IEC 5%

18 | SWACHH SURVEKSHAN 2019
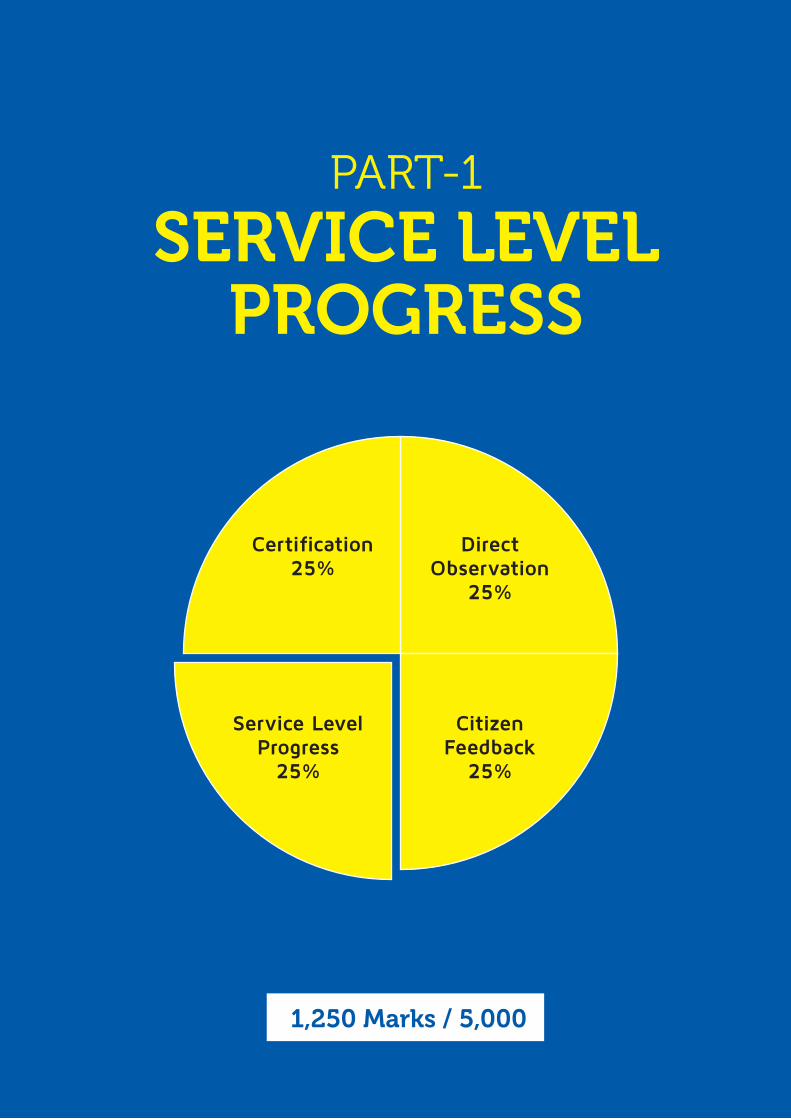
SWACHH SURVEKSHAN 2019 | 19
direct observation
25%
Certification 25%
Citizen Feedback
25%
Service level progress
25%
1,250 Marks / 5,000
PART-1
SERViCE LEVEL PRogRESS
20 | SWACHH SURVEKSHAN 2019
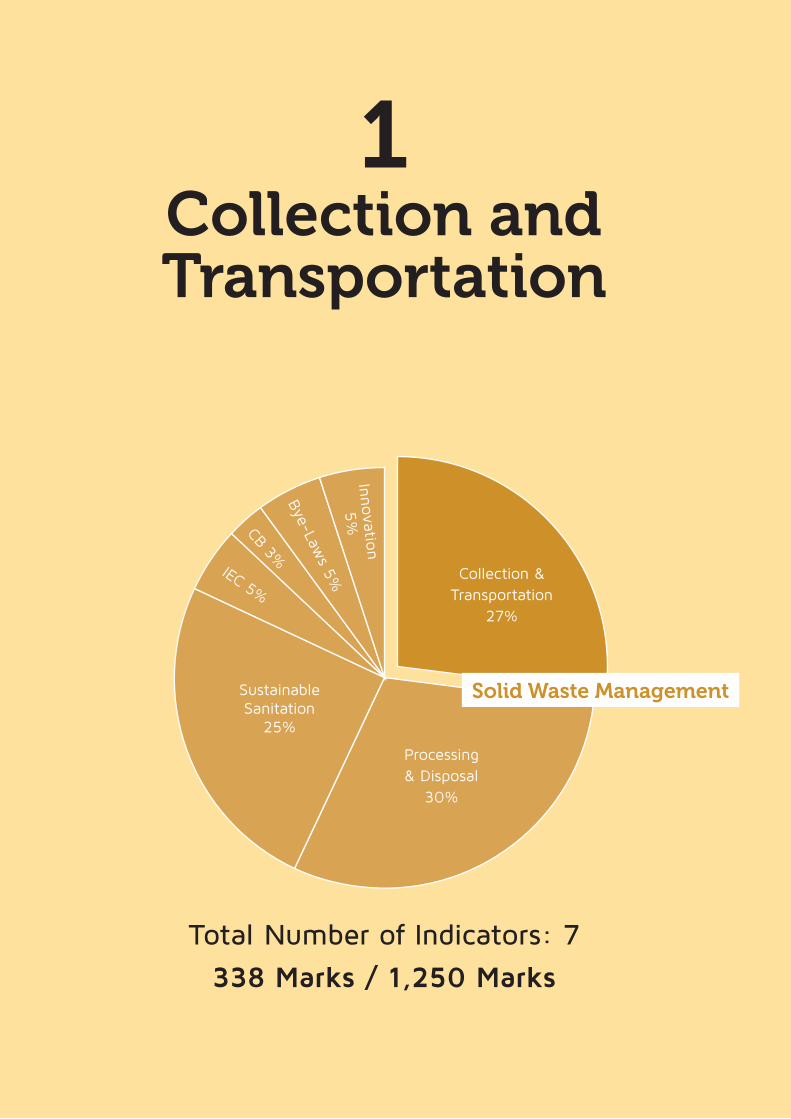
Collection and Transportation
1
Total Number of Indicators: 7
338 Marks / 1,250 Marks
Collection & Transportation
27%
Processing & Disposal
30%
Sustainable Sanitation
25%
IEC 5%
CB 3%
Innova
tion
5%
Bye-Law
s 5%
Solid Waste Management
SWACHH SURVEKSHAN 2019 | 21
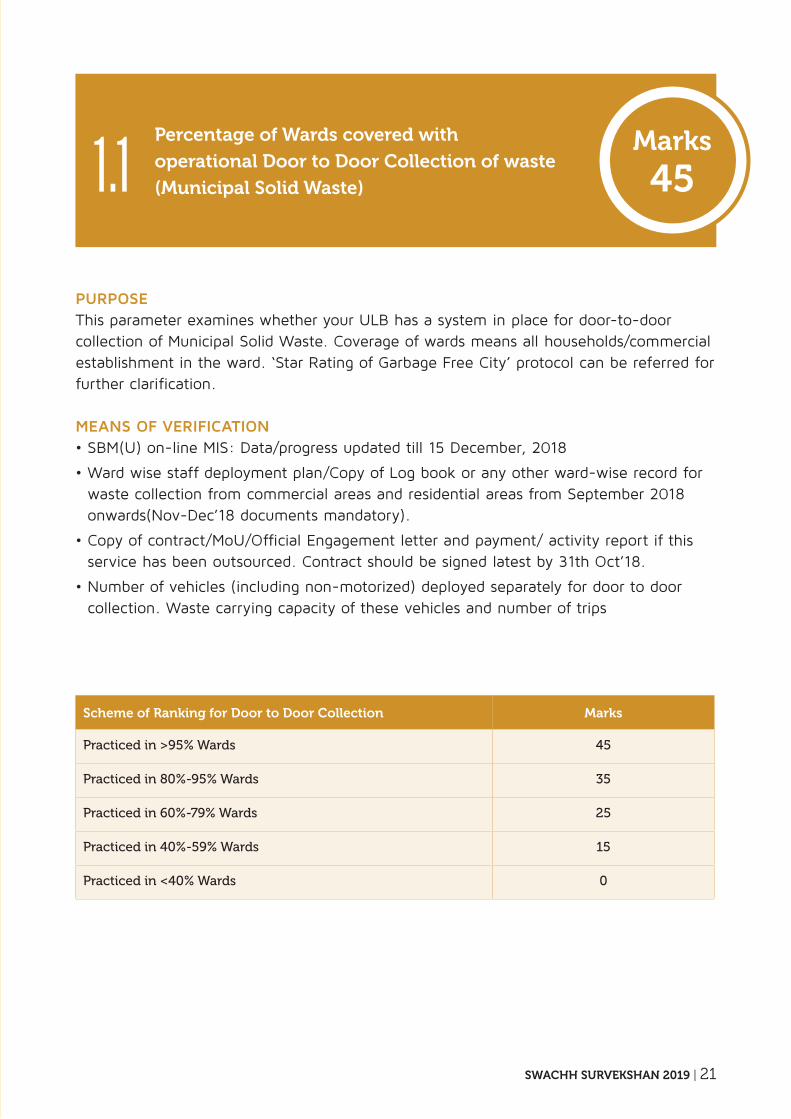
Scheme of Ranking for Door to Door Collection Marks
Practiced in >95% Wards 45
Practiced in 80%-95% Wards 35
Practiced in 60%-79% Wards 25
Practiced in 40%-59% Wards 15
Practiced in <40% Wards 0
Percentage of Wards covered with
operational Door to Door Collection of waste
(Municipal Solid Waste)
purpoSeThis parameter examines whether your ULB has a system in place for door-to-door collection of Municipal Solid Waste. Coverage of wards means all households/commercial establishment in the ward. ‘Star Rating of Garbage Free City’ protocol can be referred for further clarification.
MeanS oF VeriFiCation• SBM(U) on-line MIS: Data/progress updated till 15 December, 2018
• Ward wise staff deployment plan/Copy of Log book or any other ward-wise record for waste collection from commercial areas and residential areas from September 2018 onwards(Nov-Dec’18 documents mandatory).
• Copy of contract/MoU/Official Engagement letter and payment/ activity report if this service has been outsourced. Contract should be signed latest by 31th Oct’18.
• Number of vehicles (including non-motorized) deployed separately for door to door collection. Waste carrying capacity of these vehicles and number of trips
1.1Marks
45
22 | SWACHH SURVEKSHAN 2019
Scheme of Ranking for Door to Door Collection Marks
Practiced in >95% Wards 65
Practiced in 80%-95% Wards 45
Practiced in 60%-79% Wards 25
Practiced in 40%-59% Wards 15
Practiced in <40% Wards 0
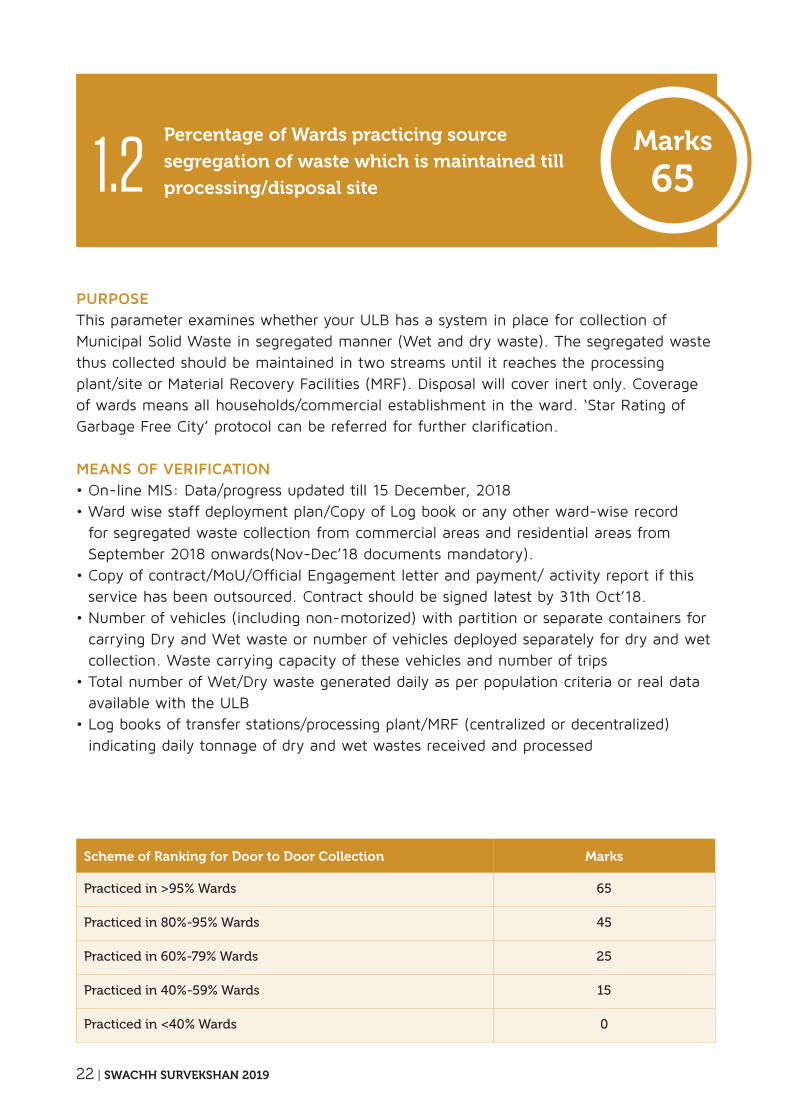
Percentage of Wards practicing source
segregation of waste which is maintained till
processing/disposal site
purpoSeThis parameter examines whether your ULB has a system in place for collection of Municipal Solid Waste in segregated manner (Wet and dry waste). The segregated waste thus collected should be maintained in two streams until it reaches the processing plant/site or Material Recovery Facilities (MRF). Disposal will cover inert only. Coverage of wards means all households/commercial establishment in the ward. ‘Star Rating of Garbage Free City’ protocol can be referred for further clarification.
MeanS oF VeriFiCation• On-line MIS: Data/progress updated till 15 December, 2018• Ward wise staff deployment plan/Copy of Log book or any other ward-wise record
for segregated waste collection from commercial areas and residential areas from September 2018 onwards(Nov-Dec’18 documents mandatory).
• Copy of contract/MoU/Official Engagement letter and payment/ activity report if this service has been outsourced. Contract should be signed latest by 31th Oct’18.
• Number of vehicles (including non-motorized) with partition or separate containers for carrying Dry and Wet waste or number of vehicles deployed separately for dry and wet collection. Waste carrying capacity of these vehicles and number of trips
• Total number of Wet/Dry waste generated daily as per population criteria or real data available with the ULB
• Log books of transfer stations/processing plant/MRF (centralized or decentralized) indicating daily tonnage of dry and wet wastes received and processed
1.2Marks
65
SWACHH SURVEKSHAN 2019 | 23
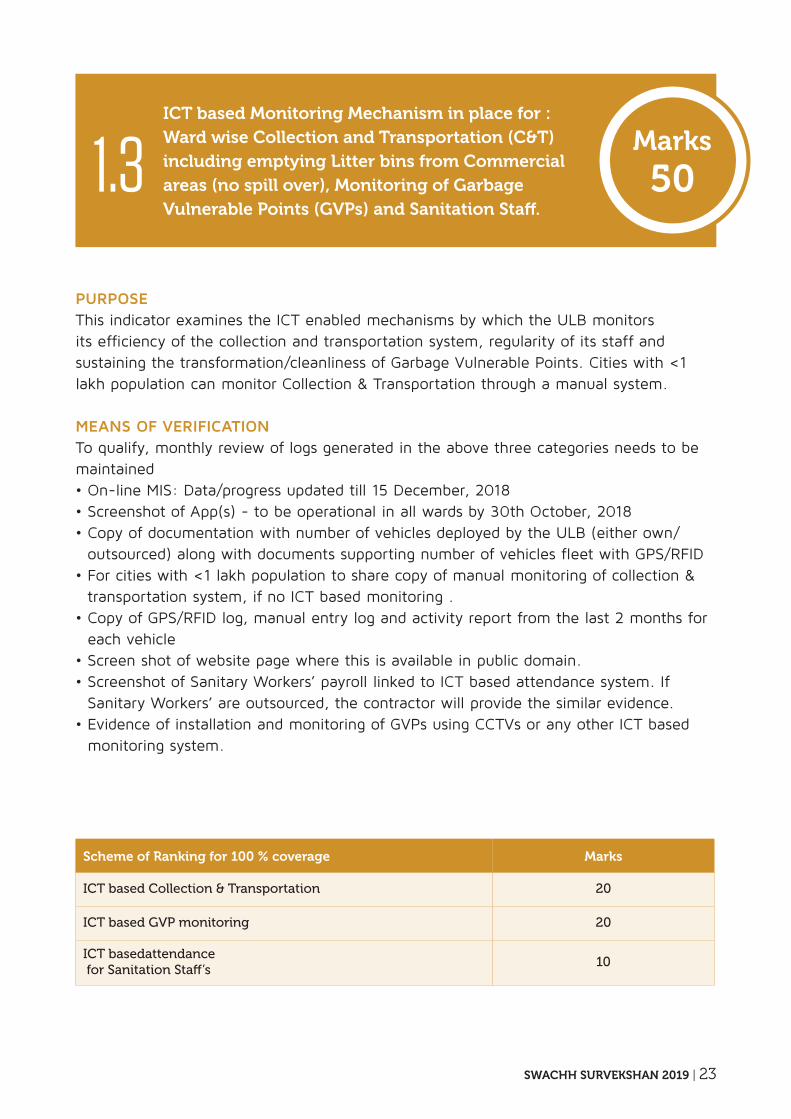
Scheme of Ranking for 100 % coverage Marks
ICT based Collection & Transportation 20
ICT based GVP monitoring 20
ICT basedattendance for Sanitation Staff’s
10
iCT based Monitoring Mechanism in place for : Ward wise Collection and Transportation (C&T) including emptying Litter bins from Commercial areas (no spill over), Monitoring of garbage Vulnerable Points (gVPs) and Sanitation Staff.
purpoSeThis indicator examines the ICT enabled mechanisms by which the ULB monitors its efficiency of the collection and transportation system, regularity of its staff and sustaining the transformation/cleanliness of Garbage Vulnerable Points. Cities with <1 lakh population can monitor Collection & Transportation through a manual system.
MeanS oF VeriFiCationTo qualify, monthly review of logs generated in the above three categories needs to be maintained• On-line MIS: Data/progress updated till 15 December, 2018• Screenshot of App(s) - to be operational in all wards by 30th October, 2018• Copy of documentation with number of vehicles deployed by the ULB (either own/
outsourced) along with documents supporting number of vehicles fleet with GPS/RFID• For cities with <1 lakh population to share copy of manual monitoring of collection &
transportation system, if no ICT based monitoring .• Copy of GPS/RFID log, manual entry log and activity report from the last 2 months for
each vehicle • Screen shot of website page where this is available in public domain.• Screenshot of Sanitary Workers’ payroll linked to ICT based attendance system. If
Sanitary Workers’ are outsourced, the contractor will provide the similar evidence.• Evidence of installation and monitoring of GVPs using CCTVs or any other ICT based
monitoring system.
1.3Marks
50
24 | SWACHH SURVEKSHAN 2019
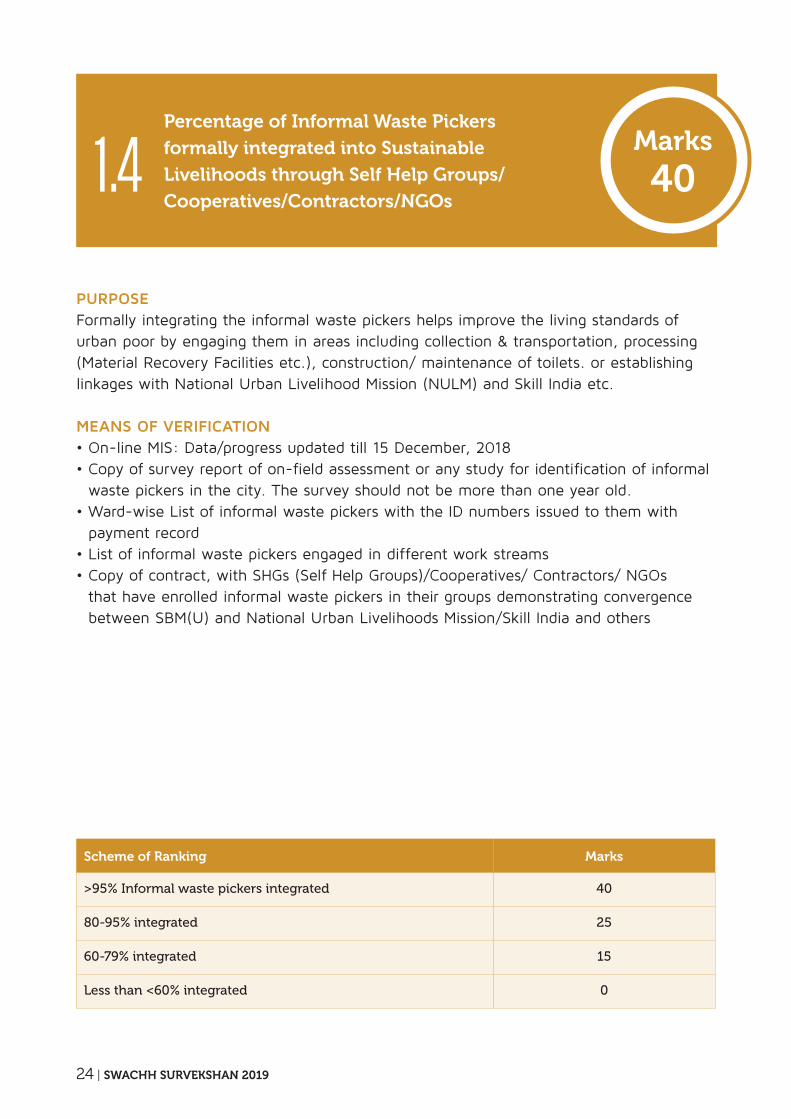
Scheme of Ranking Marks
>95% Informal waste pickers integrated 40
80-95% integrated 25
60-79% integrated 15
Less than <60% integrated 0
Percentage of informal Waste Pickers
formally integrated into Sustainable
Livelihoods through Self Help groups/
Cooperatives/Contractors/Ngos
purpoSeFormally integrating the informal waste pickers helps improve the living standards of urban poor by engaging them in areas including collection & transportation, processing (Material Recovery Facilities etc.), construction/ maintenance of toilets. or establishing linkages with National Urban Livelihood Mission (NULM) and Skill India etc.
MeanS oF VeriFiCation• On-line MIS: Data/progress updated till 15 December, 2018• Copy of survey report of on-field assessment or any study for identification of informal
waste pickers in the city. The survey should not be more than one year old.• Ward-wise List of informal waste pickers with the ID numbers issued to them with
payment record• List of informal waste pickers engaged in different work streams• Copy of contract, with SHGs (Self Help Groups)/Cooperatives/ Contractors/ NGOs
that have enrolled informal waste pickers in their groups demonstrating convergence between SBM(U) and National Urban Livelihoods Mission/Skill India and others
1.4Marks
40
SWACHH SURVEKSHAN 2019 | 25
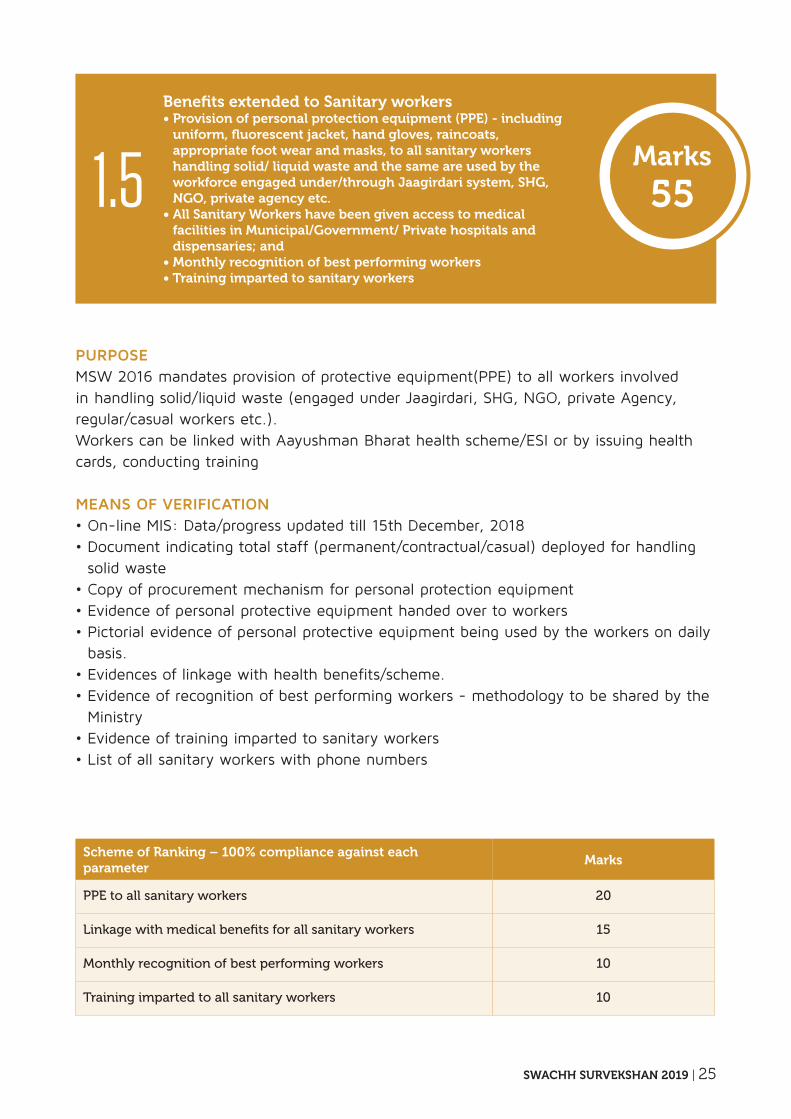
Scheme of Ranking – 100% compliance against each parameter
Marks
PPE to all sanitary workers 20
Linkage with medical benefits for all sanitary workers 15
Monthly recognition of best performing workers 10
Training imparted to all sanitary workers 10
Benefits extended to Sanitary workers • Provision of personal protection equipment (PPE) - including
uniform, fluorescent jacket, hand gloves, raincoats, appropriate foot wear and masks, to all sanitary workers handling solid/ liquid waste and the same are used by the workforce engaged under/through Jaagirdari system, SHg, Ngo, private agency etc.
• All Sanitary Workers have been given access to medical facilities in Municipal/government/ Private hospitals and dispensaries; and
• Monthly recognition of best performing workers• Training imparted to sanitary workers
purpoSeMSW 2016 mandates provision of protective equipment(PPE) to all workers involved in handling solid/liquid waste (engaged under Jaagirdari, SHG, NGO, private Agency, regular/casual workers etc.). Workers can be linked with Aayushman Bharat health scheme/ESI or by issuing health cards, conducting training
MeanS oF VeriFiCation• On-line MIS: Data/progress updated till 15th December, 2018• Document indicating total staff (permanent/contractual/casual) deployed for handling
solid waste• Copy of procurement mechanism for personal protection equipment• Evidence of personal protective equipment handed over to workers• Pictorial evidence of personal protective equipment being used by the workers on daily
basis.• Evidences of linkage with health benefits/scheme.• Evidence of recognition of best performing workers - methodology to be shared by the
Ministry• Evidence of training imparted to sanitary workers• List of all sanitary workers with phone numbers
1.5Marks
55
26 | SWACHH SURVEKSHAN 2019
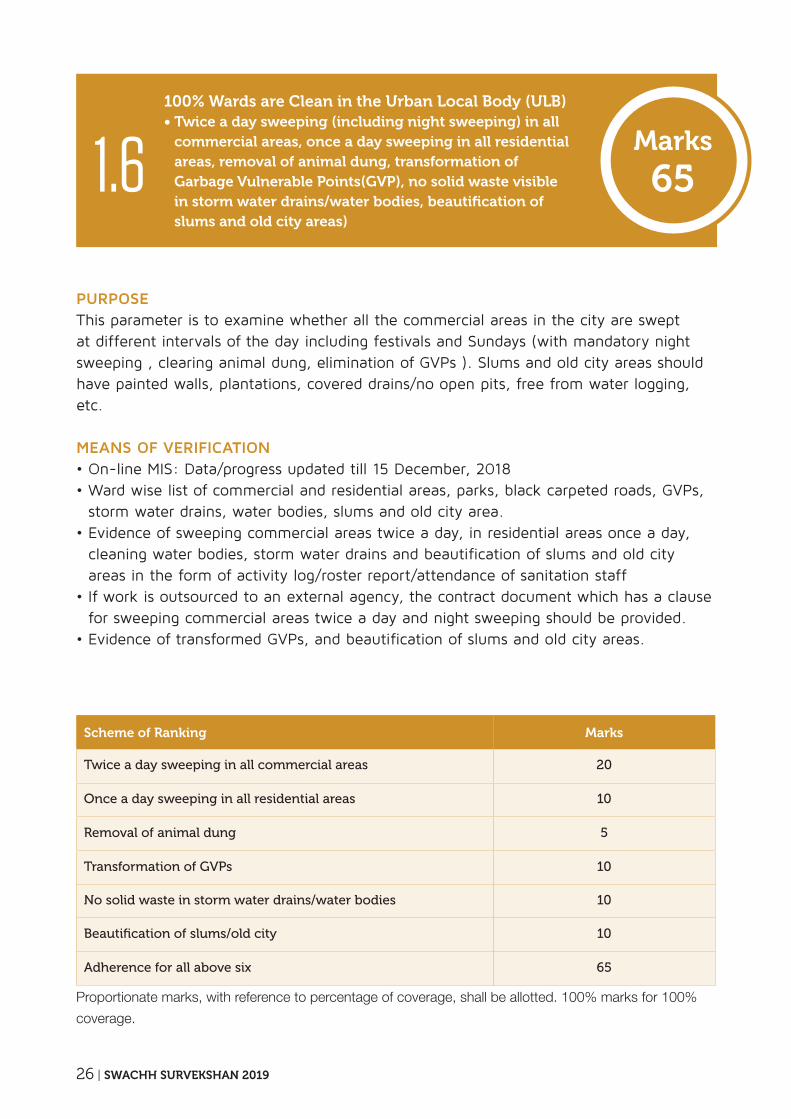
Scheme of Ranking Marks
Twice a day sweeping in all commercial areas 20
Once a day sweeping in all residential areas 10
Removal of animal dung 5
Transformation of GVPs 10
No solid waste in storm water drains/water bodies 10
Beautification of slums/old city 10
Adherence for all above six 65
Proportionate marks, with reference to percentage of coverage, shall be allotted. 100% marks for 100%
coverage.
100% Wards are Clean in the Urban Local Body (ULB)• Twice a day sweeping (including night sweeping) in all
commercial areas, once a day sweeping in all residential areas, removal of animal dung, transformation of garbage Vulnerable Points(gVP), no solid waste visible in storm water drains/water bodies, beautification of slums and old city areas)
purpoSeThis parameter is to examine whether all the commercial areas in the city are swept at different intervals of the day including festivals and Sundays (with mandatory night sweeping , clearing animal dung, elimination of GVPs ). Slums and old city areas should have painted walls, plantations, covered drains/no open pits, free from water logging, etc.
MeanS oF VeriFiCation• On-line MIS: Data/progress updated till 15 December, 2018• Ward wise list of commercial and residential areas, parks, black carpeted roads, GVPs,
storm water drains, water bodies, slums and old city area.• Evidence of sweeping commercial areas twice a day, in residential areas once a day,
cleaning water bodies, storm water drains and beautification of slums and old city areas in the form of activity log/roster report/attendance of sanitation staff
• If work is outsourced to an external agency, the contract document which has a clause for sweeping commercial areas twice a day and night sweeping should be provided.
• Evidence of transformed GVPs, and beautification of slums and old city areas.
1.6Marks
65
SWACHH SURVEKSHAN 2019 | 27
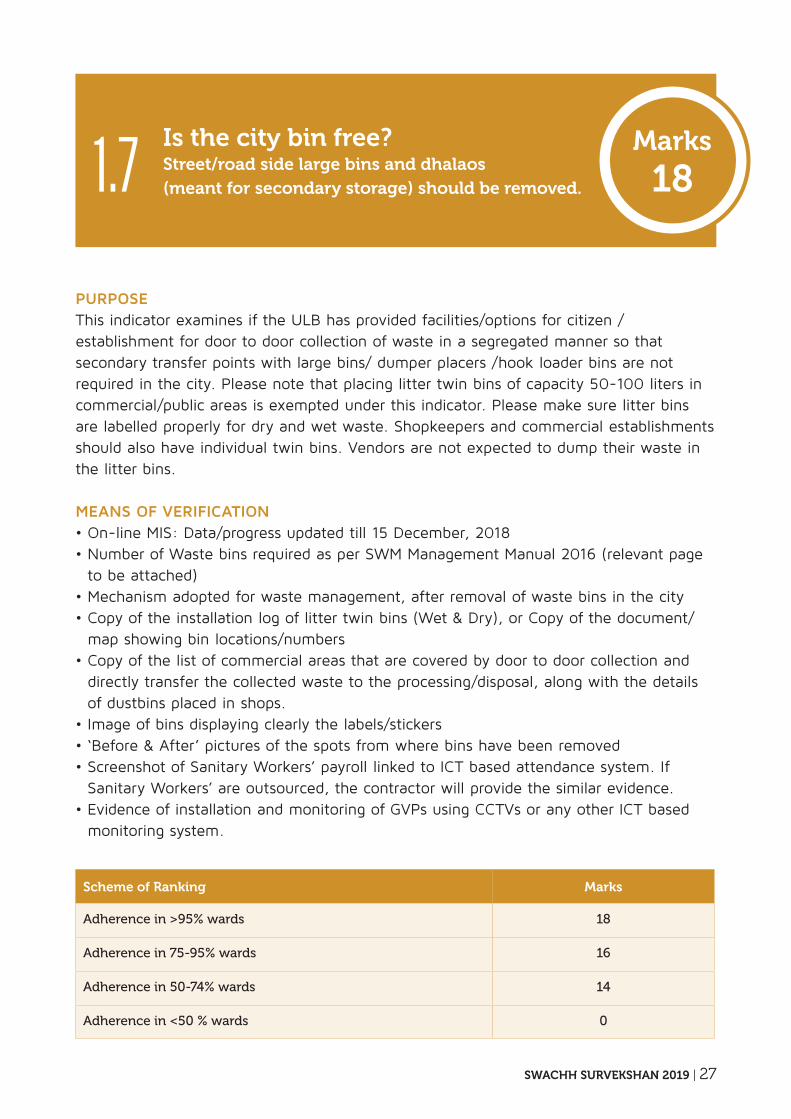
Scheme of Ranking Marks
Adherence in >95% wards 18
Adherence in 75-95% wards 16
Adherence in 50-74% wards 14
Adherence in <50 % wards 0
is the city bin free?Street/road side large bins and dhalaos (meant for secondary storage) should be removed.
purpoSeThis indicator examines if the ULB has provided facilities/options for citizen /establishment for door to door collection of waste in a segregated manner so that secondary transfer points with large bins/ dumper placers /hook loader bins are not required in the city. Please note that placing litter twin bins of capacity 50-100 liters in commercial/public areas is exempted under this indicator. Please make sure litter bins are labelled properly for dry and wet waste. Shopkeepers and commercial establishments should also have individual twin bins. Vendors are not expected to dump their waste in the litter bins.
MeanS oF VeriFiCation• On-line MIS: Data/progress updated till 15 December, 2018 • Number of Waste bins required as per SWM Management Manual 2016 (relevant page
to be attached)• Mechanism adopted for waste management, after removal of waste bins in the city• Copy of the installation log of litter twin bins (Wet & Dry), or Copy of the document/
map showing bin locations/numbers• Copy of the list of commercial areas that are covered by door to door collection and
directly transfer the collected waste to the processing/disposal, along with the details of dustbins placed in shops.
• Image of bins displaying clearly the labels/stickers • ‘Before & After’ pictures of the spots from where bins have been removed• Screenshot of Sanitary Workers’ payroll linked to ICT based attendance system. If
Sanitary Workers’ are outsourced, the contractor will provide the similar evidence.• Evidence of installation and monitoring of GVPs using CCTVs or any other ICT based
monitoring system.
1.7Marks
18
28 | SWACHH SURVEKSHAN 2019
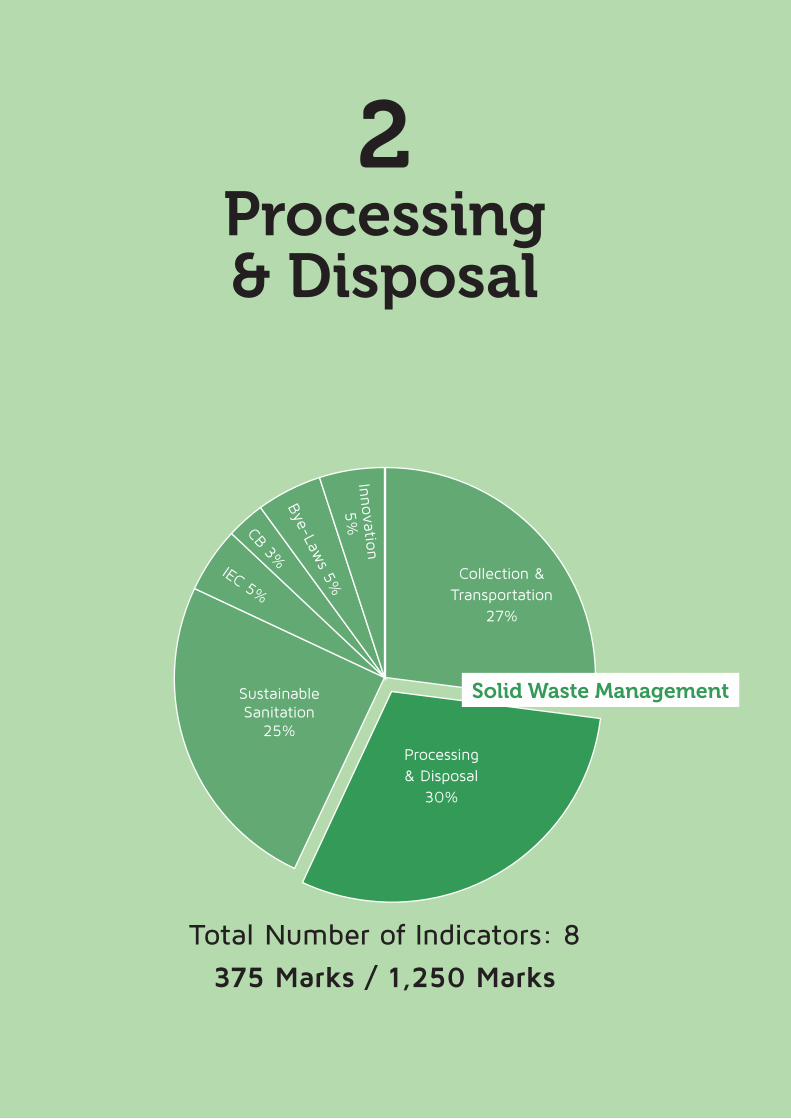
Processing & Disposal
2
Total Number of Indicators: 8
375 Marks / 1,250 Marks
Collection & Transportation
27%
Processing & Disposal
30%
CB 3%
Innova
tion
5%
Solid Waste ManagementSustainable Sanitation
25%
Bye-Law
s 5%
IEC 5%
SWACHH SURVEKSHAN 2019 | 29
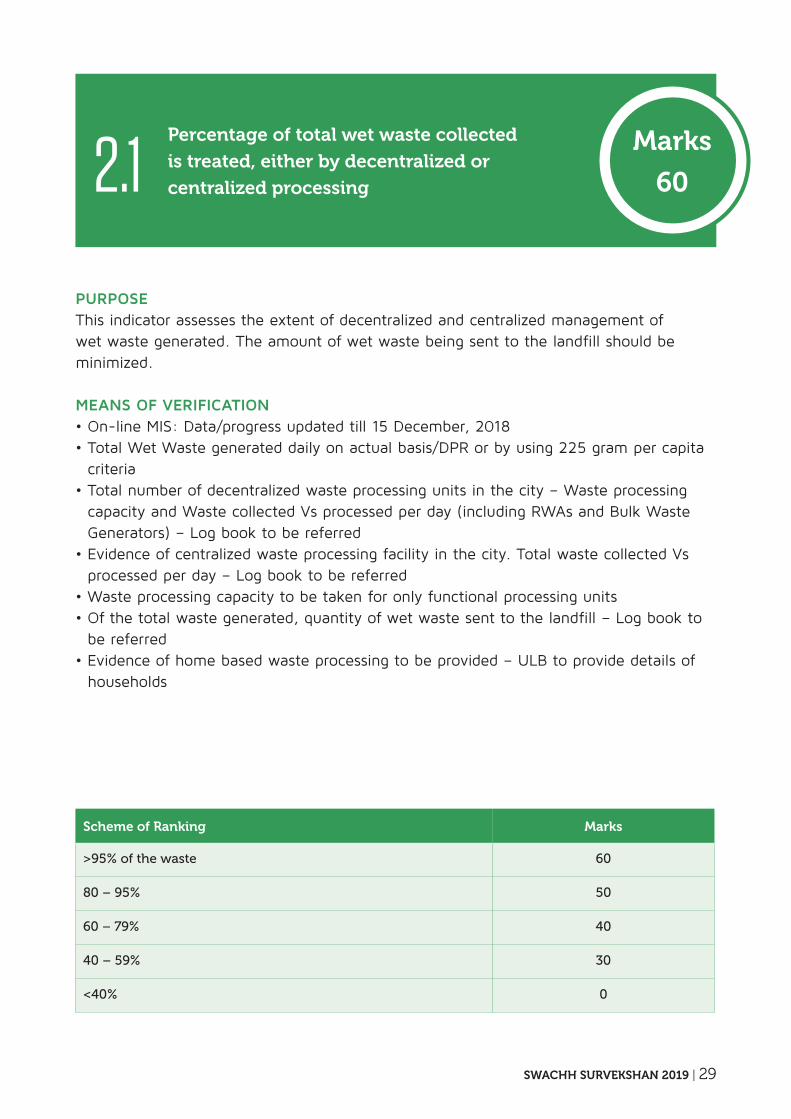
Scheme of Ranking Marks
>95% of the waste 60
80 – 95% 50
60 – 79% 40
40 – 59% 30
<40% 0
Percentage of total wet waste collected
is treated, either by decentralized or
centralized processing
purpoSeThis indicator assesses the extent of decentralized and centralized management of wet waste generated. The amount of wet waste being sent to the landfill should be minimized.
MeanS oF VeriFiCation• On-line MIS: Data/progress updated till 15 December, 2018• Total Wet Waste generated daily on actual basis/DPR or by using 225 gram per capita
criteria • Total number of decentralized waste processing units in the city – Waste processing
capacity and Waste collected Vs processed per day (including RWAs and Bulk Waste Generators) – Log book to be referred
• Evidence of centralized waste processing facility in the city. Total waste collected Vs processed per day – Log book to be referred
• Waste processing capacity to be taken for only functional processing units• Of the total waste generated, quantity of wet waste sent to the landfill – Log book to
be referred• Evidence of home based waste processing to be provided – ULB to provide details of
households
2.1Marks
60
30 | SWACHH SURVEKSHAN 2019
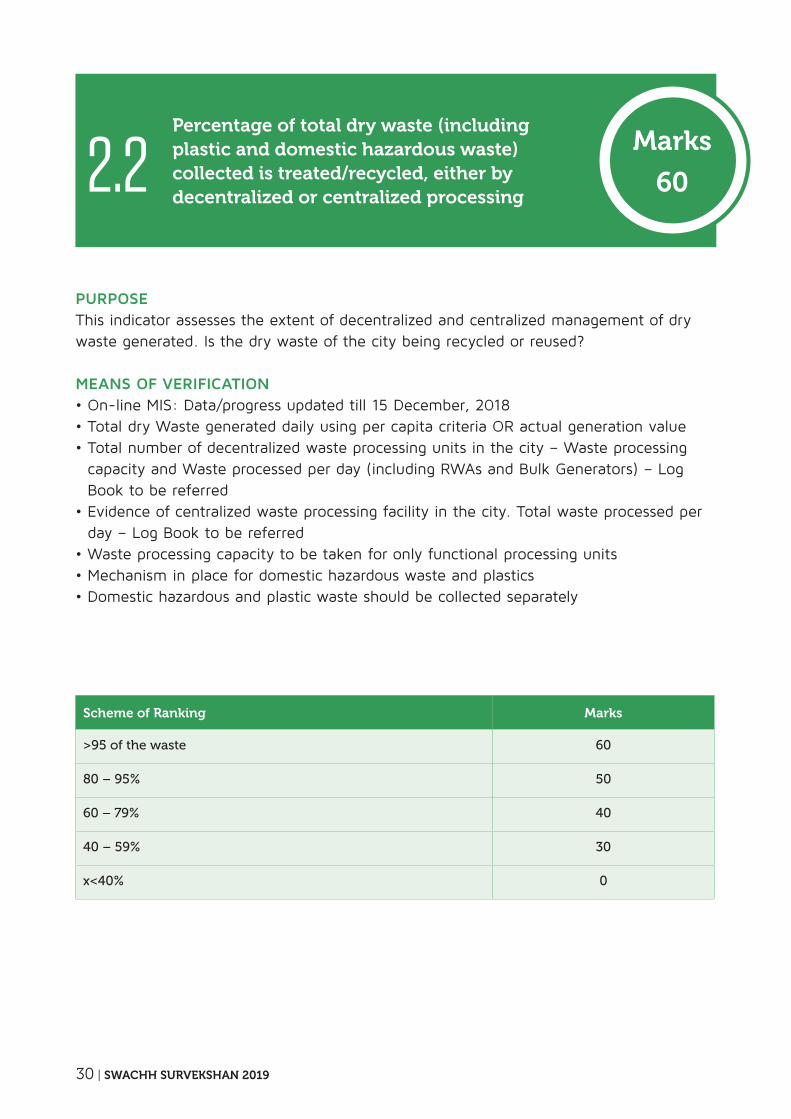
Scheme of Ranking Marks
>95 of the waste 60
80 – 95% 50
60 – 79% 40
40 – 59% 30
x<40% 0
Percentage of total dry waste (including plastic and domestic hazardous waste) collected is treated/recycled, either by decentralized or centralized processing
purpoSeThis indicator assesses the extent of decentralized and centralized management of dry waste generated. Is the dry waste of the city being recycled or reused?
MeanS oF VeriFiCation• On-line MIS: Data/progress updated till 15 December, 2018• Total dry Waste generated daily using per capita criteria OR actual generation value • Total number of decentralized waste processing units in the city – Waste processing
capacity and Waste processed per day (including RWAs and Bulk Generators) – Log Book to be referred
• Evidence of centralized waste processing facility in the city. Total waste processed per day – Log Book to be referred
• Waste processing capacity to be taken for only functional processing units• Mechanism in place for domestic hazardous waste and plastics• Domestic hazardous and plastic waste should be collected separately
2.2Marks
60
SWACHH SURVEKSHAN 2019 | 31
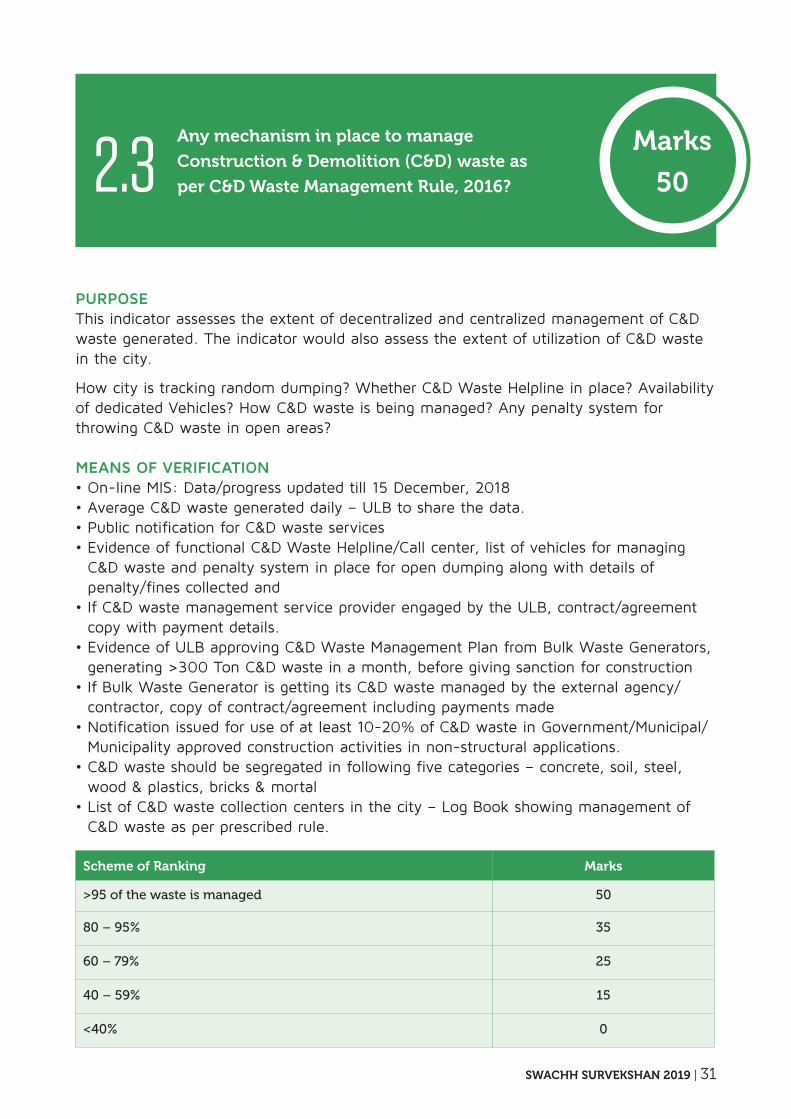
Scheme of Ranking Marks
>95 of the waste is managed 50
80 – 95% 35
60 – 79% 25
40 – 59% 15
<40% 0
Any mechanism in place to manage
Construction & Demolition (C&D) waste as
per C&D Waste Management Rule, 2016?
purpoSeThis indicator assesses the extent of decentralized and centralized management of C&D waste generated. The indicator would also assess the extent of utilization of C&D waste in the city.
How city is tracking random dumping? Whether C&D Waste Helpline in place? Availability of dedicated Vehicles? How C&D waste is being managed? Any penalty system for throwing C&D waste in open areas?
MeanS oF VeriFiCation• On-line MIS: Data/progress updated till 15 December, 2018• Average C&D waste generated daily – ULB to share the data.• Public notification for C&D waste services• Evidence of functional C&D Waste Helpline/Call center, list of vehicles for managing
C&D waste and penalty system in place for open dumping along with details of penalty/fines collected and
• If C&D waste management service provider engaged by the ULB, contract/agreement copy with payment details.
• Evidence of ULB approving C&D Waste Management Plan from Bulk Waste Generators, generating >300 Ton C&D waste in a month, before giving sanction for construction
• If Bulk Waste Generator is getting its C&D waste managed by the external agency/contractor, copy of contract/agreement including payments made
• Notification issued for use of at least 10-20% of C&D waste in Government/Municipal/Municipality approved construction activities in non-structural applications.
• C&D waste should be segregated in following five categories – concrete, soil, steel, wood & plastics, bricks & mortal
• List of C&D waste collection centers in the city – Log Book showing management of C&D waste as per prescribed rule.
2.3Marks
50
32 | SWACHH SURVEKSHAN 2019
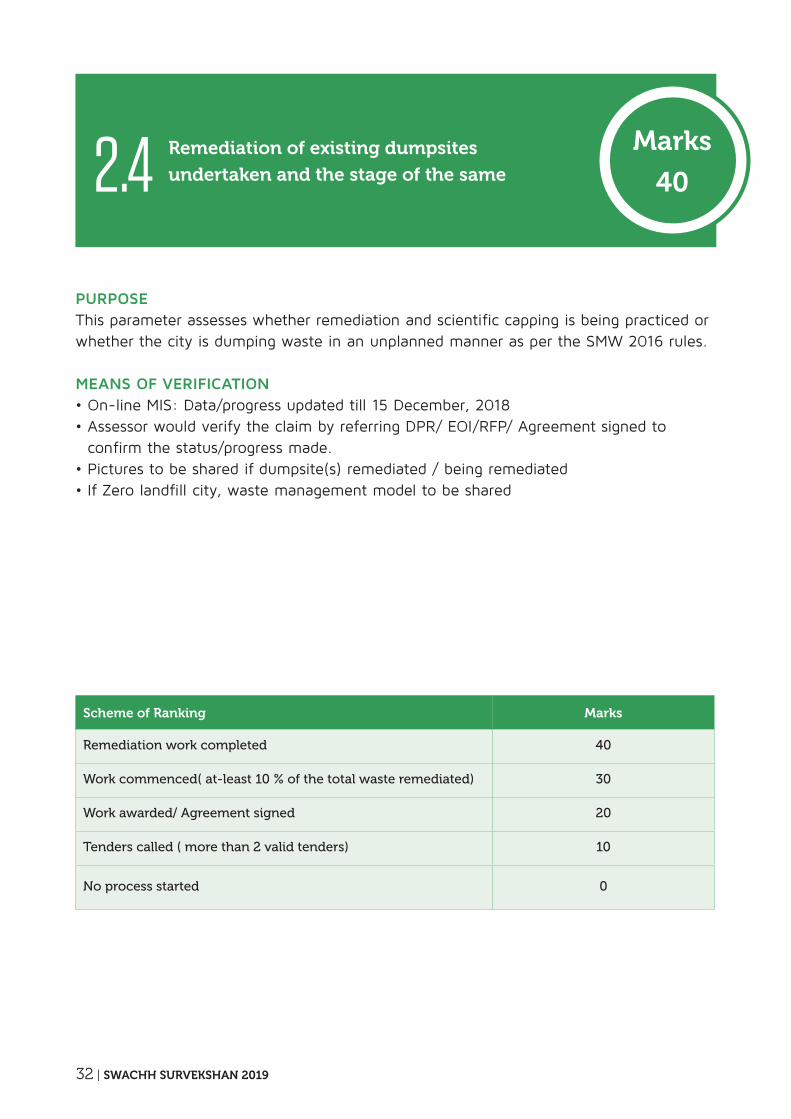
Scheme of Ranking Marks
Remediation work completed 40
Work commenced( at-least 10 % of the total waste remediated) 30
Work awarded/ Agreement signed 20
Tenders called ( more than 2 valid tenders) 10
No process started 0
Remediation of existing dumpsites
undertaken and the stage of the same
purpoSeThis parameter assesses whether remediation and scientific capping is being practiced or whether the city is dumping waste in an unplanned manner as per the SMW 2016 rules.
MeanS oF VeriFiCation• On-line MIS: Data/progress updated till 15 December, 2018• Assessor would verify the claim by referring DPR/ EOI/RFP/ Agreement signed to
confirm the status/progress made.• Pictures to be shared if dumpsite(s) remediated / being remediated• If Zero landfill city, waste management model to be shared
2.4Marks
40
SWACHH SURVEKSHAN 2019 | 33
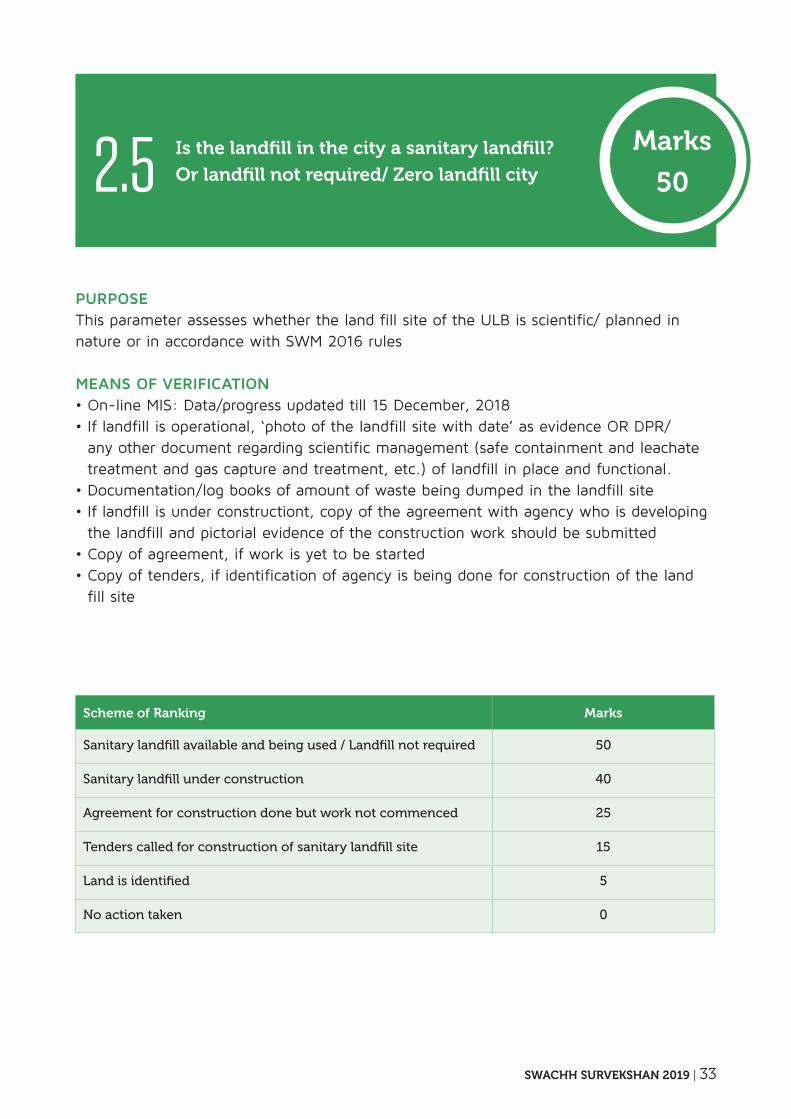
Scheme of Ranking Marks
Sanitary landfill available and being used / Landfill not required 50
Sanitary landfill under construction 40
Agreement for construction done but work not commenced 25
Tenders called for construction of sanitary landfill site 15
Land is identified 5
No action taken 0
is the landfill in the city a sanitary landfill?
Or landfill not required/ Zero landfill city
purpoSeThis parameter assesses whether the land fill site of the ULB is scientific/ planned in nature or in accordance with SWM 2016 rules
MeanS oF VeriFiCation• On-line MIS: Data/progress updated till 15 December, 2018• If landfill is operational, ‘photo of the landfill site with date’ as evidence OR DPR/
any other document regarding scientific management (safe containment and leachate treatment and gas capture and treatment, etc.) of landfill in place and functional.
• Documentation/log books of amount of waste being dumped in the landfill site• If landfill is under constructiont, copy of the agreement with agency who is developing
the landfill and pictorial evidence of the construction work should be submitted• Copy of agreement, if work is yet to be started• Copy of tenders, if identification of agency is being done for construction of the land
fill site
2.5Marks
50
34 | SWACHH SURVEKSHAN 2019
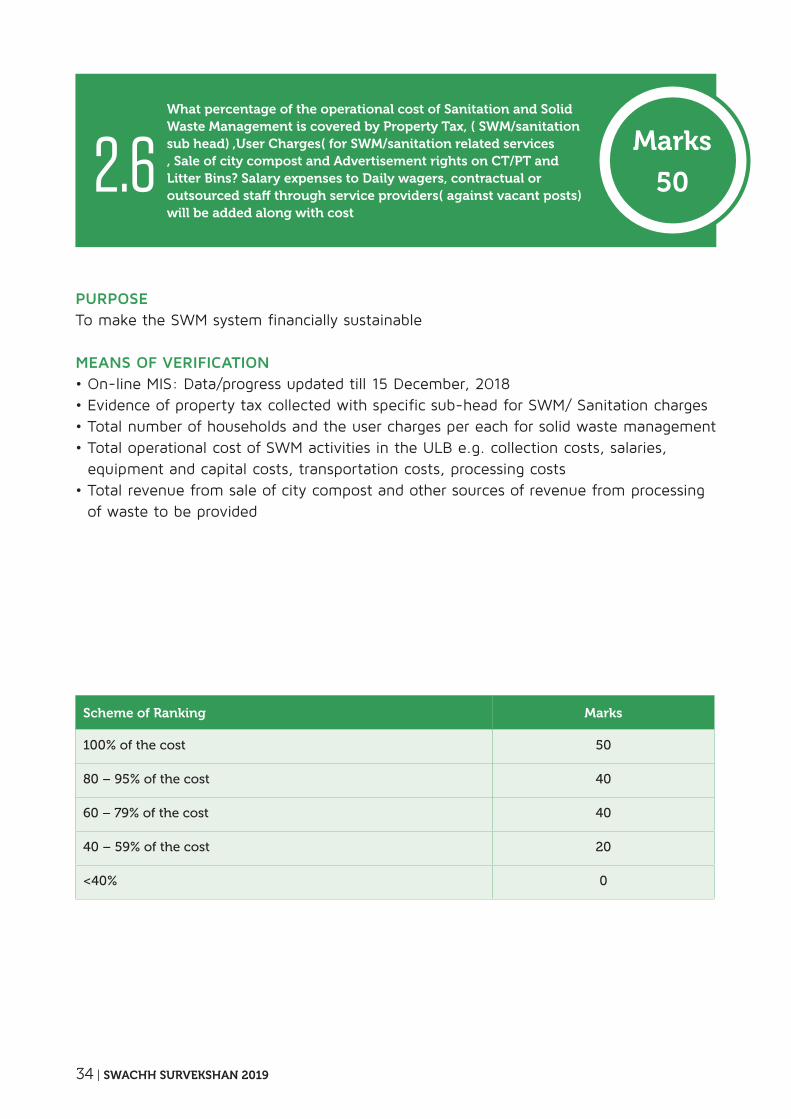
Scheme of Ranking Marks
100% of the cost 50
80 – 95% of the cost 40
60 – 79% of the cost 40
40 – 59% of the cost 20
<40% 0
What percentage of the operational cost of Sanitation and Solid Waste Management is covered by Property Tax, ( SWM/sanitation sub head) ,User Charges( for SWM/sanitation related services , Sale of city compost and Advertisement rights on CT/PT and Litter Bins? Salary expenses to Daily wagers, contractual or outsourced staff through service providers( against vacant posts) will be added along with cost
purpoSeTo make the SWM system financially sustainable
MeanS oF VeriFiCation• On-line MIS: Data/progress updated till 15 December, 2018• Evidence of property tax collected with specific sub-head for SWM/ Sanitation charges• Total number of households and the user charges per each for solid waste management• Total operational cost of SWM activities in the ULB e.g. collection costs, salaries,
equipment and capital costs, transportation costs, processing costs• Total revenue from sale of city compost and other sources of revenue from processing
of waste to be provided
2.6Marks
50
SWACHH SURVEKSHAN 2019 | 35
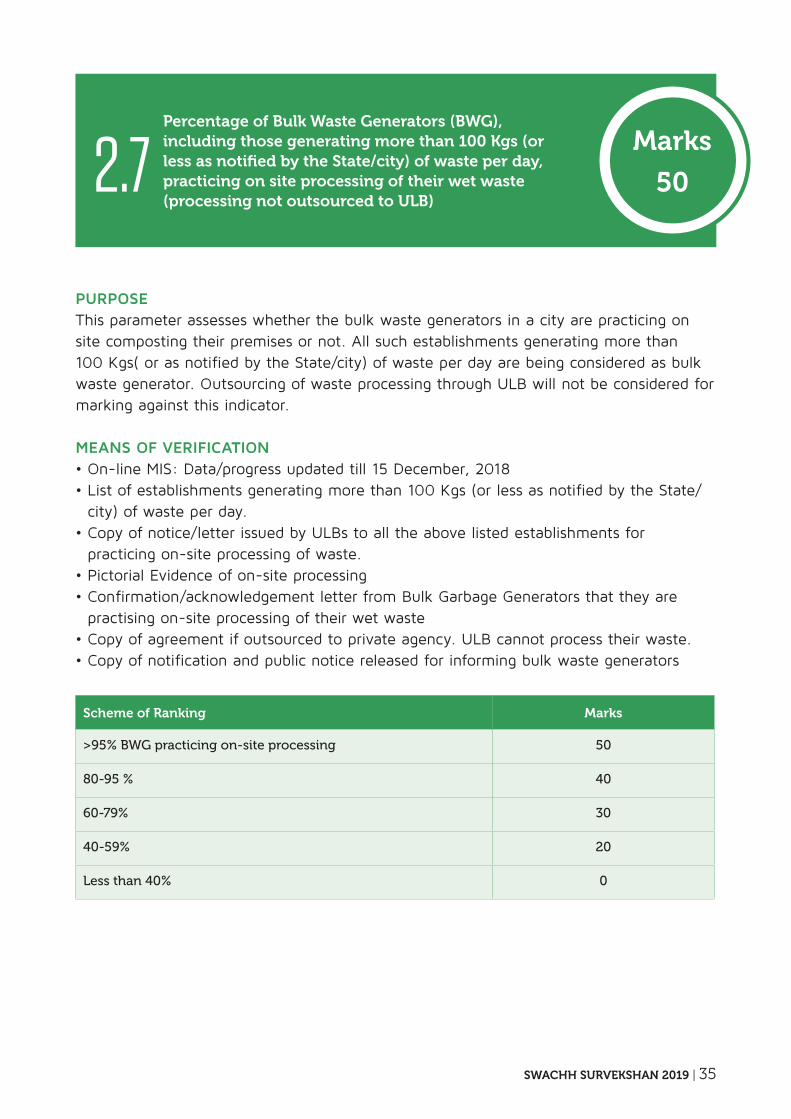
Scheme of Ranking Marks
>95% BWG practicing on-site processing 50
80-95 % 40
60-79% 30
40-59% 20
Less than 40% 0
Percentage of Bulk Waste generators (BWg), including those generating more than 100 Kgs (or less as notified by the State/city) of waste per day, practicing on site processing of their wet waste (processing not outsourced to ULB)
purpoSeThis parameter assesses whether the bulk waste generators in a city are practicing on site composting their premises or not. All such establishments generating more than 100 Kgs( or as notified by the State/city) of waste per day are being considered as bulk waste generator. Outsourcing of waste processing through ULB will not be considered for marking against this indicator.
MeanS oF VeriFiCation• On-line MIS: Data/progress updated till 15 December, 2018• List of establishments generating more than 100 Kgs (or less as notified by the State/
city) of waste per day.• Copy of notice/letter issued by ULBs to all the above listed establishments for
practicing on-site processing of waste.• Pictorial Evidence of on-site processing • Confirmation/acknowledgement letter from Bulk Garbage Generators that they are
practising on-site processing of their wet waste• Copy of agreement if outsourced to private agency. ULB cannot process their waste.• Copy of notification and public notice released for informing bulk waste generators
2.7Marks
50
36 | SWACHH SURVEKSHAN 2019
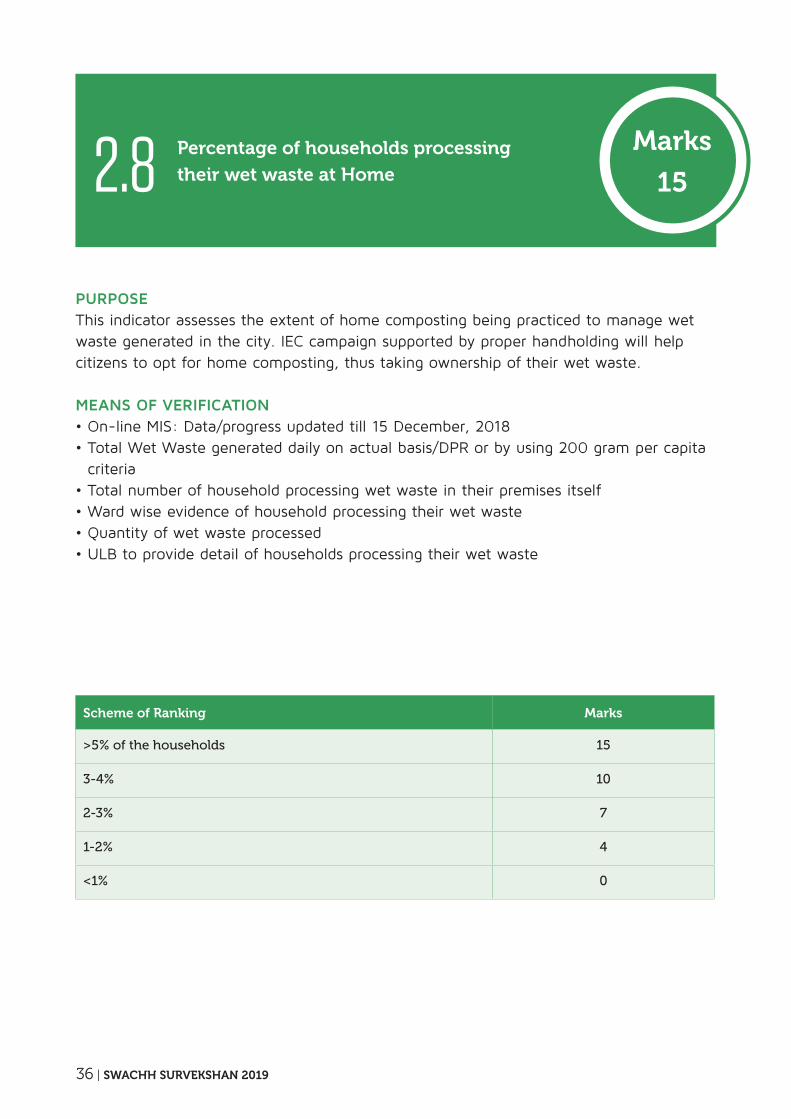
Scheme of Ranking Marks
>5% of the households 15
3-4% 10
2-3% 7
1-2% 4
<1% 0
Percentage of households processing
their wet waste at Home
purpoSeThis indicator assesses the extent of home composting being practiced to manage wet waste generated in the city. IEC campaign supported by proper handholding will help citizens to opt for home composting, thus taking ownership of their wet waste.
MeanS oF VeriFiCation• On-line MIS: Data/progress updated till 15 December, 2018• Total Wet Waste generated daily on actual basis/DPR or by using 200 gram per capita
criteria• Total number of household processing wet waste in their premises itself• Ward wise evidence of household processing their wet waste • Quantity of wet waste processed• ULB to provide detail of households processing their wet waste
2.8Marks
15
SWACHH SURVEKSHAN 2019 | 37
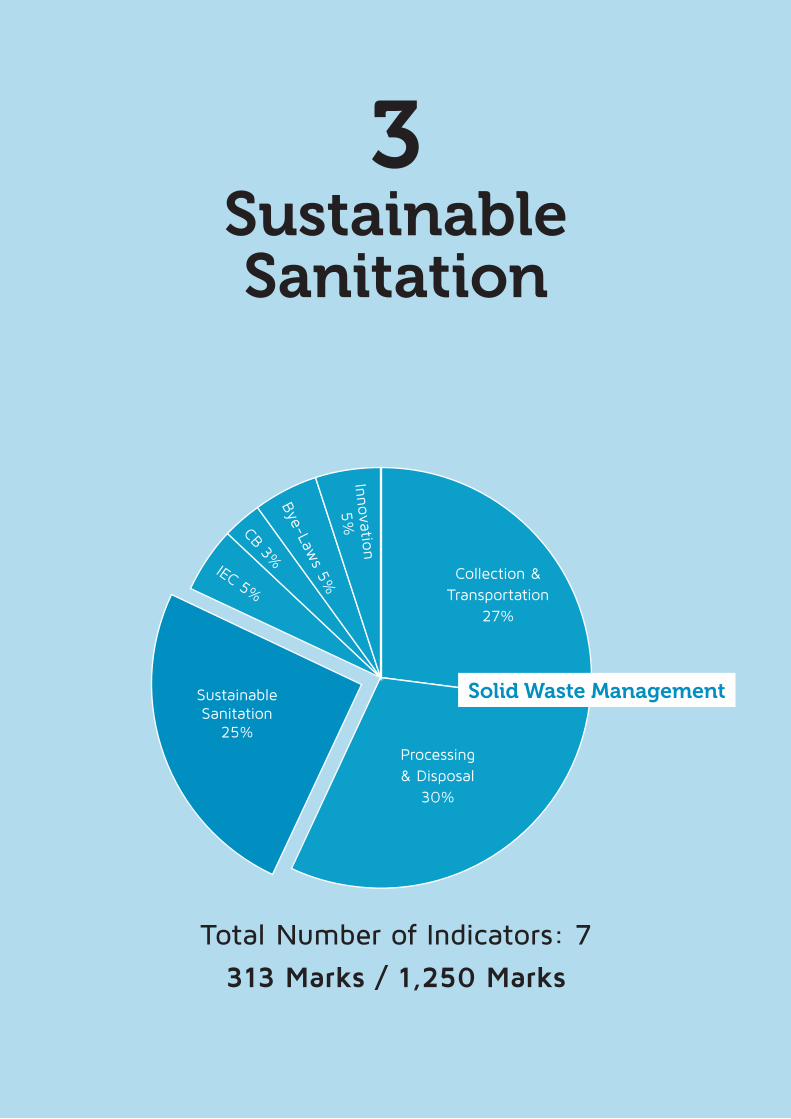
Total Number of Indicators: 7
313 Marks / 1,250 Marks
Sustainable Sanitation
3
Collection & Transportation
27%
Processing & Disposal
30%
CB 3%
Innova
tion
5%
Solid Waste ManagementSustainable Sanitation
25%
Bye-Law
s 5%
IEC 5%
38 | SWACHH SURVEKSHAN 2019
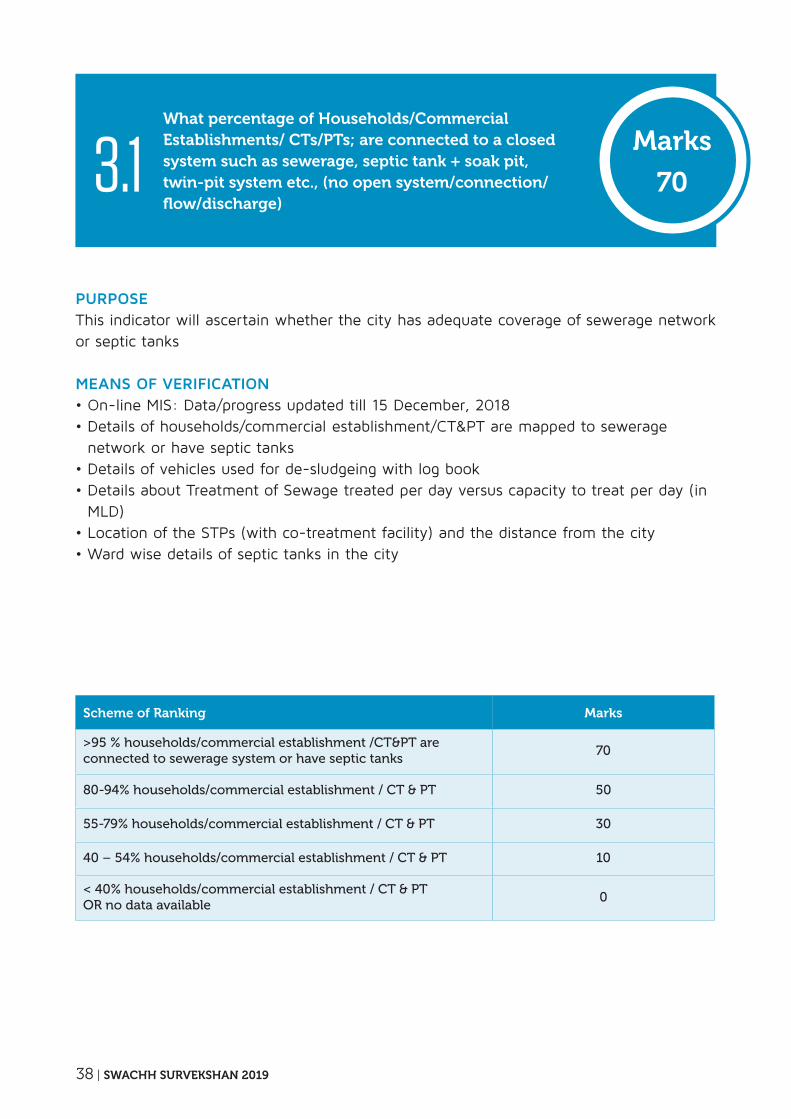
Scheme of Ranking Marks
>95 % households/commercial establishment /CT&PT are connected to sewerage system or have septic tanks
70
80-94% households/commercial establishment / CT & PT 50
55-79% households/commercial establishment / CT & PT 30
40 – 54% households/commercial establishment / CT & PT 10
< 40% households/commercial establishment / CT & PT OR no data available
0
What percentage of Households/Commercial Establishments/ CTs/PTs; are connected to a closed system such as sewerage, septic tank + soak pit, twin-pit system etc., (no open system/connection/flow/discharge)
purpoSeThis indicator will ascertain whether the city has adequate coverage of sewerage network or septic tanks
MeanS oF VeriFiCation• On-line MIS: Data/progress updated till 15 December, 2018• Details of households/commercial establishment/CT&PT are mapped to sewerage
network or have septic tanks• Details of vehicles used for de-sludgeing with log book • Details about Treatment of Sewage treated per day versus capacity to treat per day (in
MLD) • Location of the STPs (with co-treatment facility) and the distance from the city • Ward wise details of septic tanks in the city
3.1Marks
70
SWACHH SURVEKSHAN 2019 | 39
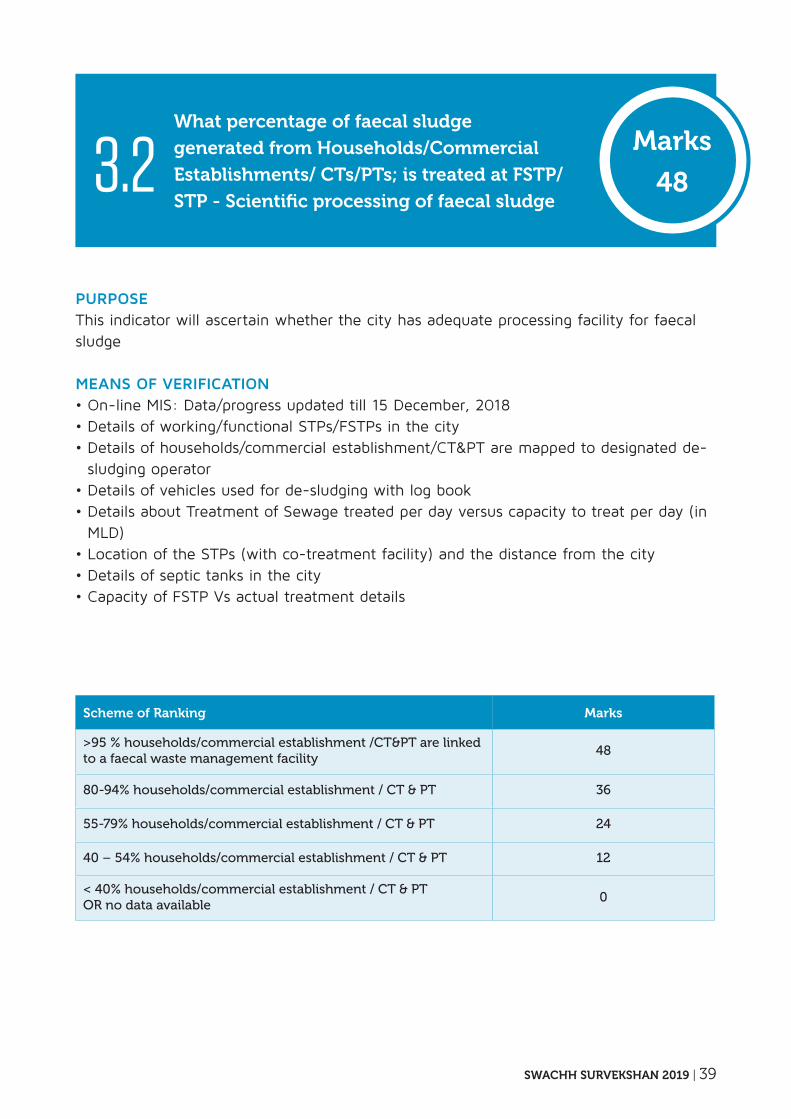
Scheme of Ranking Marks
>95 % households/commercial establishment /CT&PT are linked to a faecal waste management facility
48
80-94% households/commercial establishment / CT & PT 36
55-79% households/commercial establishment / CT & PT 24
40 – 54% households/commercial establishment / CT & PT 12
< 40% households/commercial establishment / CT & PT OR no data available
0
What percentage of faecal sludge
generated from Households/Commercial
Establishments/ CTs/PTs; is treated at FSTP/
STP - Scientific processing of faecal sludge
purpoSeThis indicator will ascertain whether the city has adequate processing facility for faecal sludge
MeanS oF VeriFiCation• On-line MIS: Data/progress updated till 15 December, 2018• Details of working/functional STPs/FSTPs in the city• Details of households/commercial establishment/CT&PT are mapped to designated de-
sludging operator• Details of vehicles used for de-sludging with log book • Details about Treatment of Sewage treated per day versus capacity to treat per day (in
MLD) • Location of the STPs (with co-treatment facility) and the distance from the city • Details of septic tanks in the city• Capacity of FSTP Vs actual treatment details
3.2Marks
48
40 | SWACHH SURVEKSHAN 2019
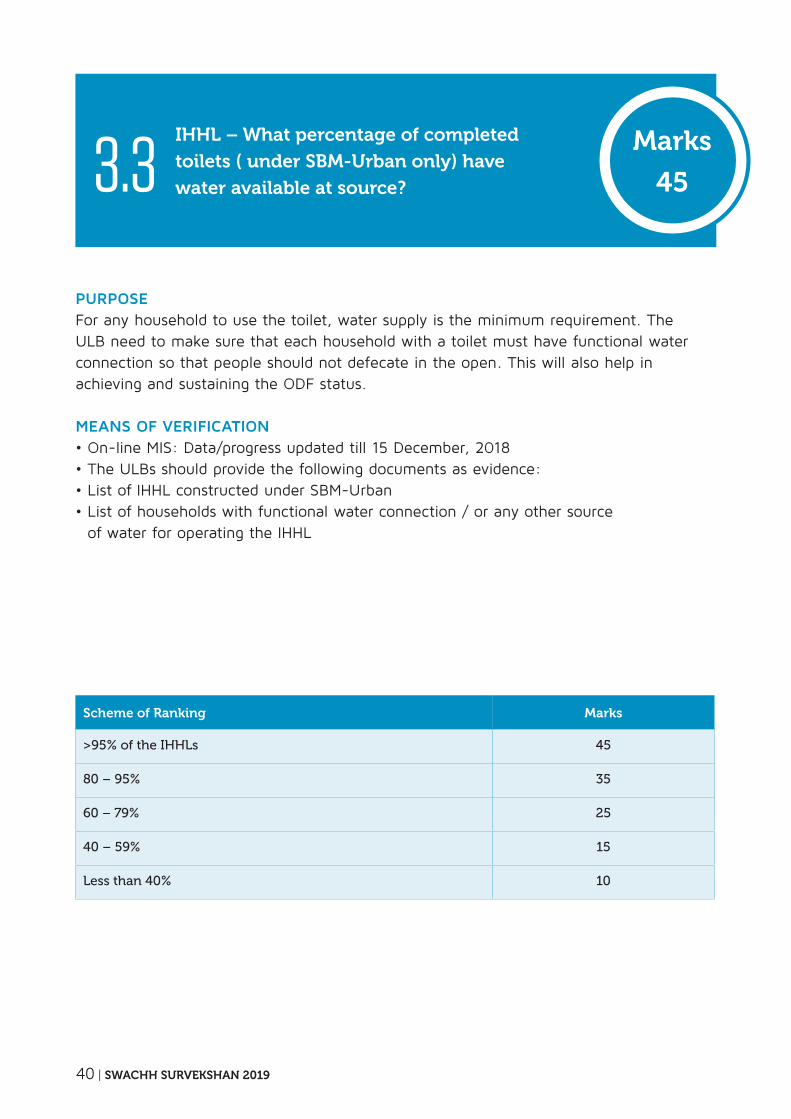
Scheme of Ranking Marks
>95% of the IHHLs 45
80 – 95% 35
60 – 79% 25
40 – 59% 15
Less than 40% 10
iHHL – What percentage of completed
toilets ( under SBM-Urban only) have
water available at source?
purpoSeFor any household to use the toilet, water supply is the minimum requirement. The ULB need to make sure that each household with a toilet must have functional water connection so that people should not defecate in the open. This will also help in achieving and sustaining the ODF status.
MeanS oF VeriFiCation• On-line MIS: Data/progress updated till 15 December, 2018• The ULBs should provide the following documents as evidence:• List of IHHL constructed under SBM-Urban• List of households with functional water connection / or any other source
of water for operating the IHHL
3.3Marks
45
SWACHH SURVEKSHAN 2019 | 41
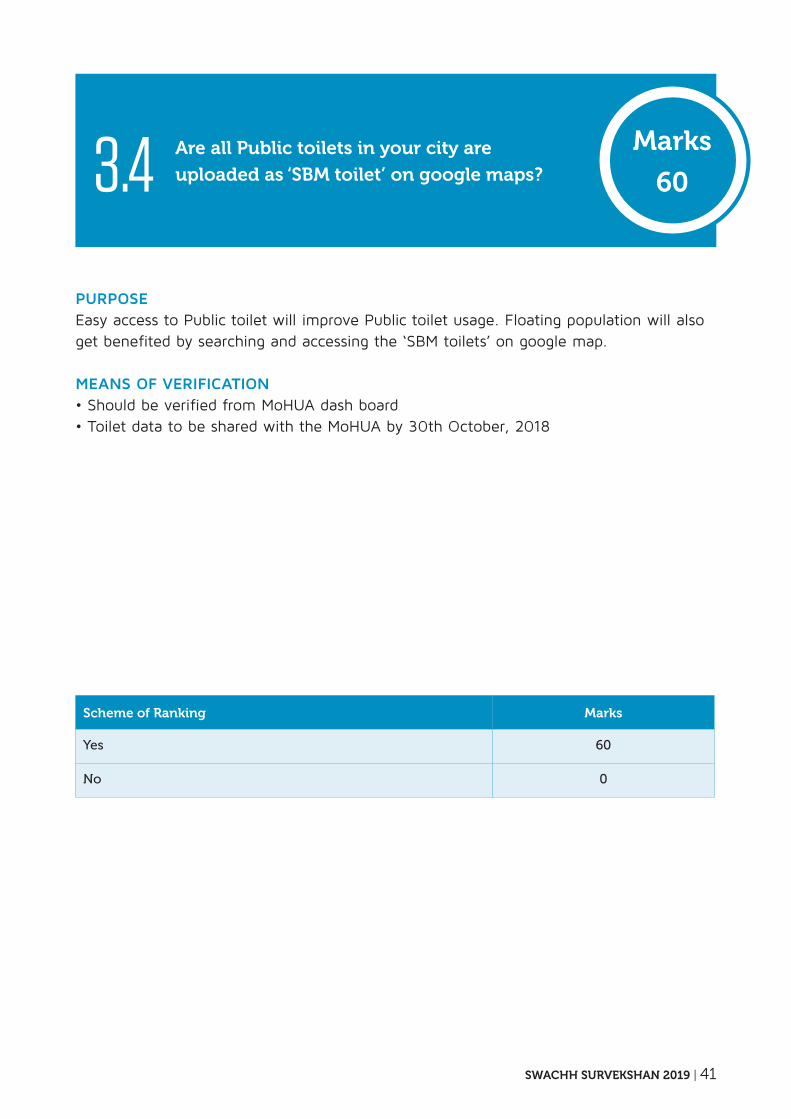
Scheme of Ranking Marks
Yes 60
No 0
Are all Public toilets in your city are
uploaded as ‘SBM toilet’ on google maps?
purpoSeEasy access to Public toilet will improve Public toilet usage. Floating population will also get benefited by searching and accessing the ‘SBM toilets’ on google map.
MeanS oF VeriFiCation• Should be verified from MoHUA dash board • Toilet data to be shared with the MoHUA by 30th October, 2018
3.4Marks
60
42 | SWACHH SURVEKSHAN 2019
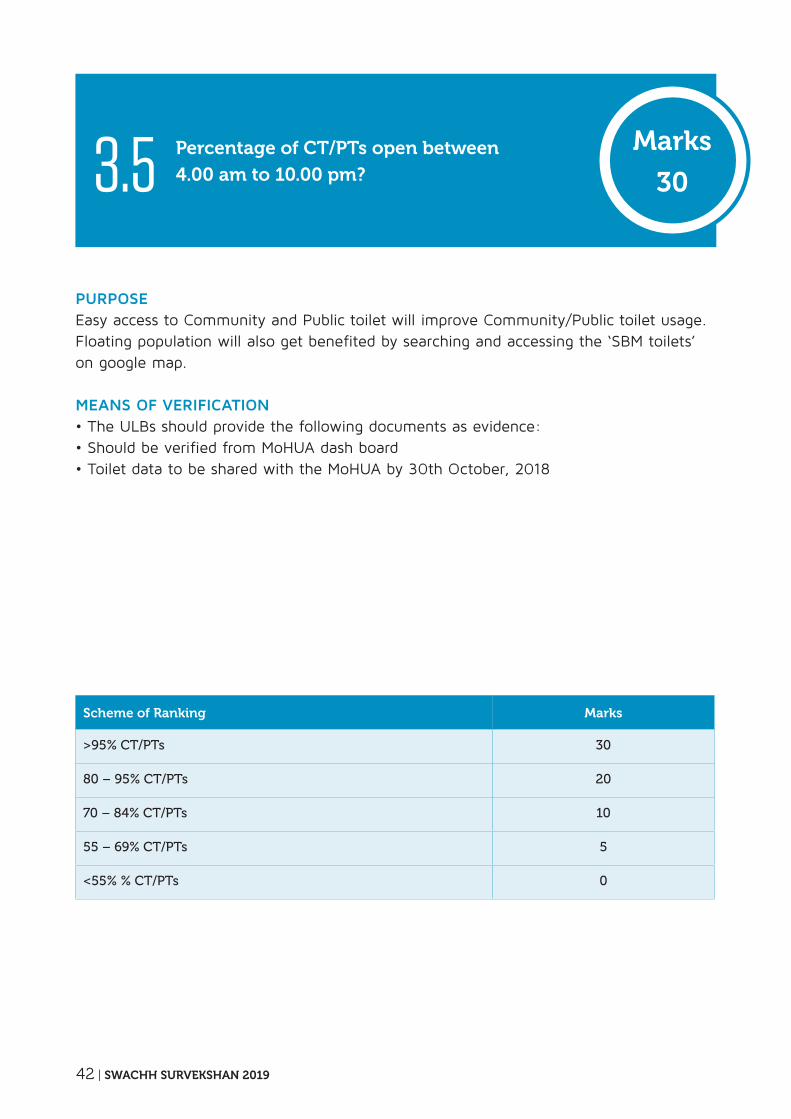
Scheme of Ranking Marks
>95% CT/PTs 30
80 – 95% CT/PTs 20
70 – 84% CT/PTs 10
55 – 69% CT/PTs 5
<55% % CT/PTs 0
Percentage of CT/PTs open between
4.00 am to 10.00 pm?
purpoSeEasy access to Community and Public toilet will improve Community/Public toilet usage. Floating population will also get benefited by searching and accessing the ‘SBM toilets’ on google map.
MeanS oF VeriFiCation• The ULBs should provide the following documents as evidence:• Should be verified from MoHUA dash board • Toilet data to be shared with the MoHUA by 30th October, 2018
3.5Marks
30
SWACHH SURVEKSHAN 2019 | 43
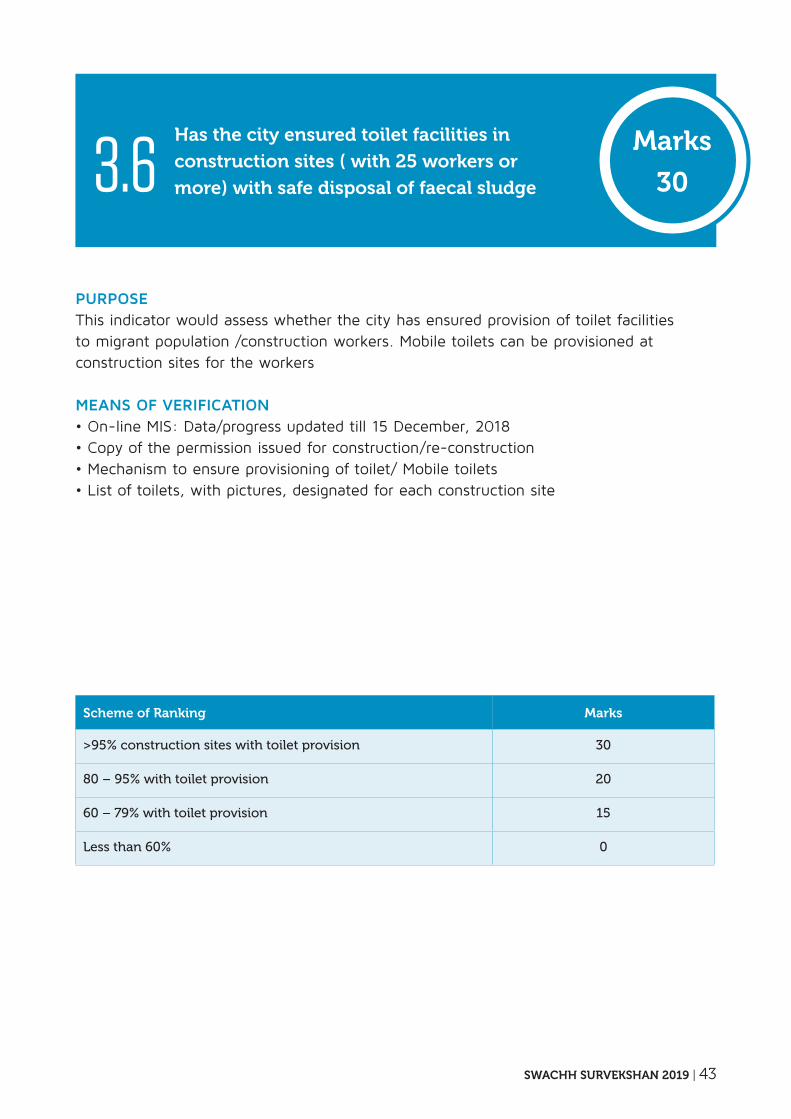
Scheme of Ranking Marks
>95% construction sites with toilet provision 30
80 – 95% with toilet provision 20
60 – 79% with toilet provision 15
Less than 60% 0
Has the city ensured toilet facilities in
construction sites ( with 25 workers or
more) with safe disposal of faecal sludge
purpoSeThis indicator would assess whether the city has ensured provision of toilet facilities to migrant population /construction workers. Mobile toilets can be provisioned at construction sites for the workers
MeanS oF VeriFiCation• On-line MIS: Data/progress updated till 15 December, 2018• Copy of the permission issued for construction/re-construction• Mechanism to ensure provisioning of toilet/ Mobile toilets• List of toilets, with pictures, designated for each construction site
3.6Marks
30
44 | SWACHH SURVEKSHAN 2019
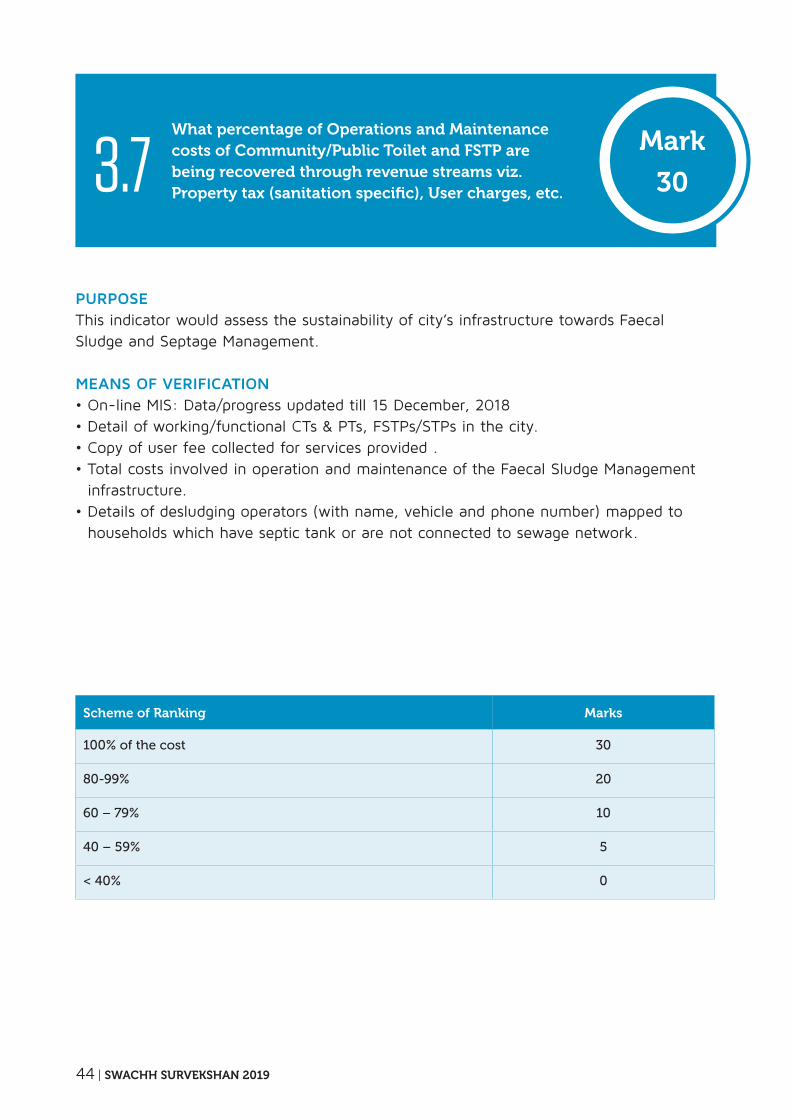
Scheme of Ranking Marks
100% of the cost 30
80-99% 20
60 – 79% 10
40 – 59% 5
< 40% 0
What percentage of operations and Maintenance costs of Community/Public Toilet and FSTP are being recovered through revenue streams viz. Property tax (sanitation specific), User charges, etc.
purpoSeThis indicator would assess the sustainability of city’s infrastructure towards Faecal Sludge and Septage Management.
MeanS oF VeriFiCation• On-line MIS: Data/progress updated till 15 December, 2018• Detail of working/functional CTs & PTs, FSTPs/STPs in the city. • Copy of user fee collected for services provided .• Total costs involved in operation and maintenance of the Faecal Sludge Management
infrastructure.• Details of desludging operators (with name, vehicle and phone number) mapped to
households which have septic tank or are not connected to sewage network.
3.7Mark
30
SWACHH SURVEKSHAN 2019 | 45
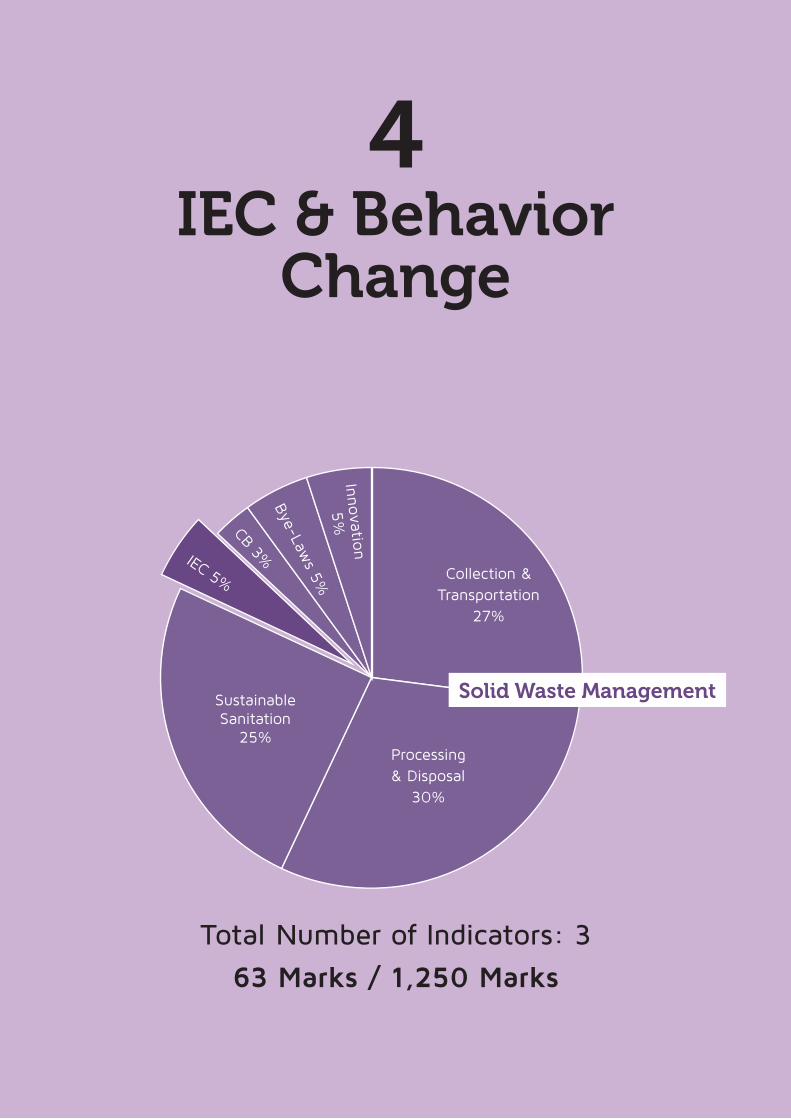
Total Number of Indicators: 3
63 Marks / 1,250 Marks
iEC & Behavior Change
4
Collection & Transportation
27%
Processing & Disposal
30%
CB 3%
Innova
tion
5%
Solid Waste ManagementSustainable Sanitation
25%
Bye-Law
s 5%
IEC 5%
46 | SWACHH SURVEKSHAN 2019
Scheme of Ranking Marks
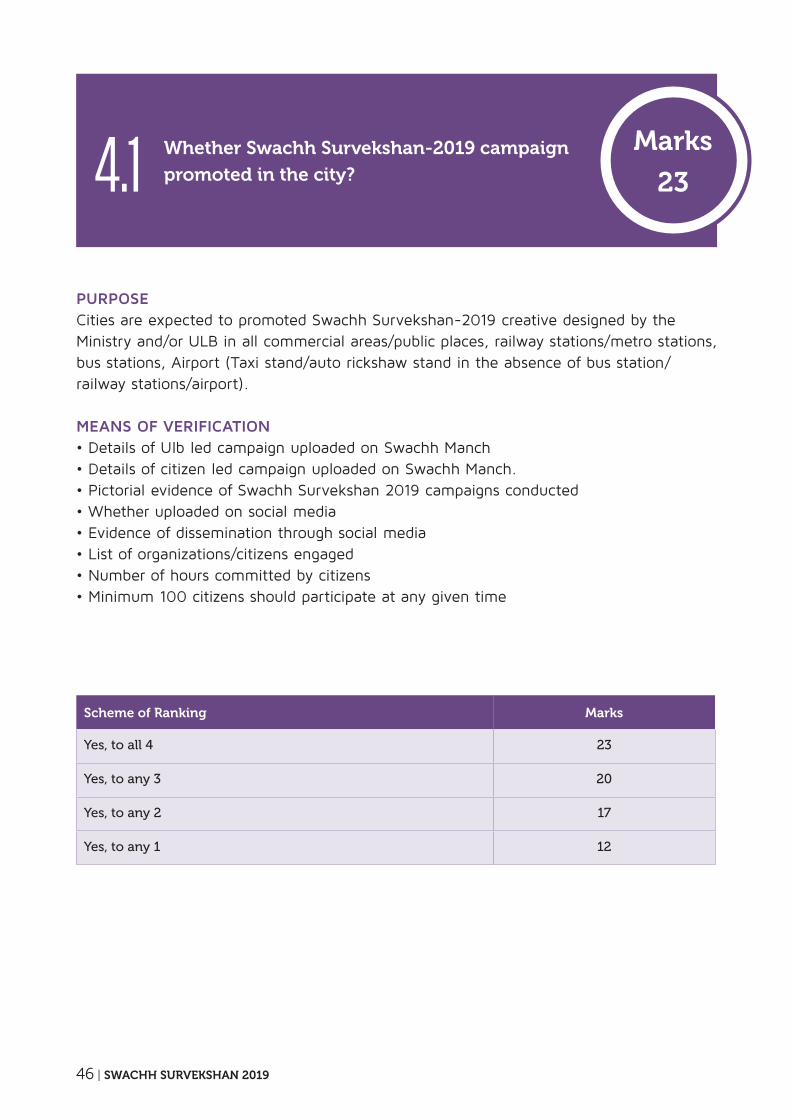
Yes, to all 4 23
Yes, to any 3 20
Yes, to any 2 17
Yes, to any 1 12
Whether Swachh Survekshan-2019 campaign
promoted in the city?
purpoSeCities are expected to promoted Swachh Survekshan-2019 creative designed by the Ministry and/or ULB in all commercial areas/public places, railway stations/metro stations, bus stations, Airport (Taxi stand/auto rickshaw stand in the absence of bus station/railway stations/airport).
MeanS oF VeriFiCation• Details of Ulb led campaign uploaded on Swachh Manch• Details of citizen led campaign uploaded on Swachh Manch.• Pictorial evidence of Swachh Survekshan 2019 campaigns conducted• Whether uploaded on social media• Evidence of dissemination through social media• List of organizations/citizens engaged• Number of hours committed by citizens• Minimum 100 citizens should participate at any given time
4.1Marks
23
SWACHH SURVEKSHAN 2019 | 47
Scheme of Ranking Marks
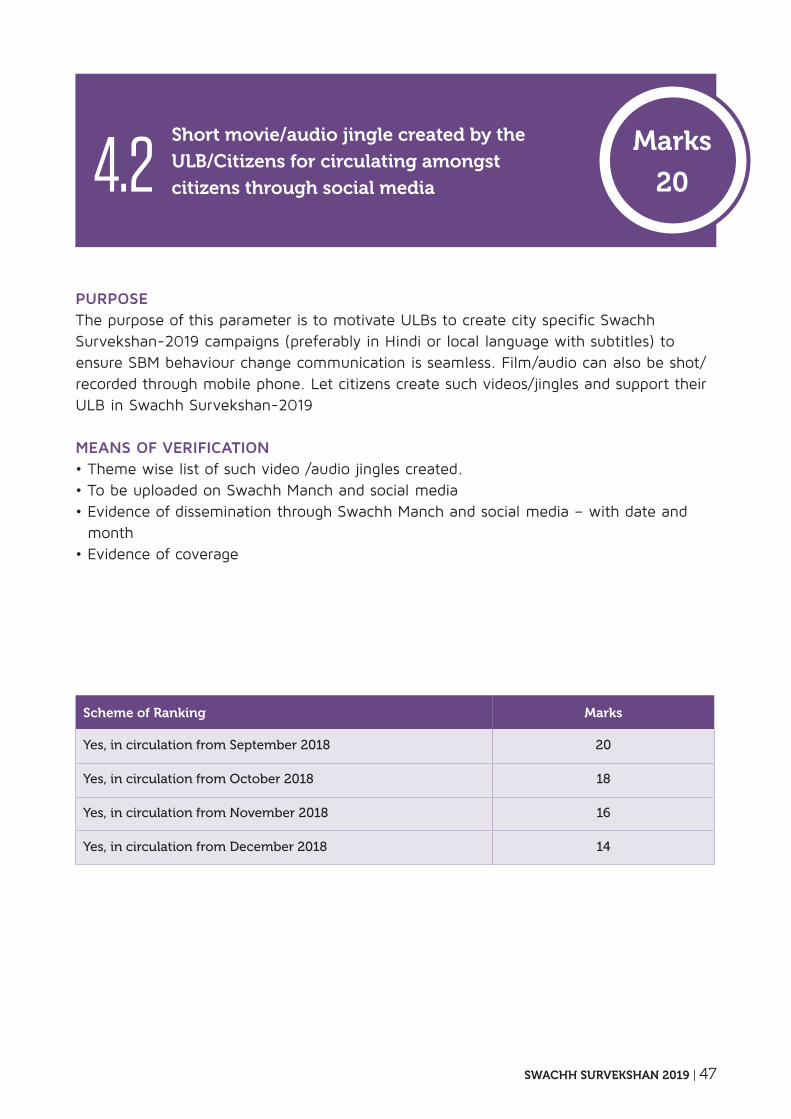
Yes, in circulation from September 2018 20
Yes, in circulation from October 2018 18
Yes, in circulation from November 2018 16
Yes, in circulation from December 2018 14
Short movie/audio jingle created by the
ULB/Citizens for circulating amongst
citizens through social media
purpoSeThe purpose of this parameter is to motivate ULBs to create city specific Swachh Survekshan-2019 campaigns (preferably in Hindi or local language with subtitles) to ensure SBM behaviour change communication is seamless. Film/audio can also be shot/recorded through mobile phone. Let citizens create such videos/jingles and support their ULB in Swachh Survekshan-2019
MeanS oF VeriFiCation• Theme wise list of such video /audio jingles created.• To be uploaded on Swachh Manch and social media• Evidence of dissemination through Swachh Manch and social media – with date and
month• Evidence of coverage
4.2Marks
20
48 | SWACHH SURVEKSHAN 2019
Scheme of Ranking Marks
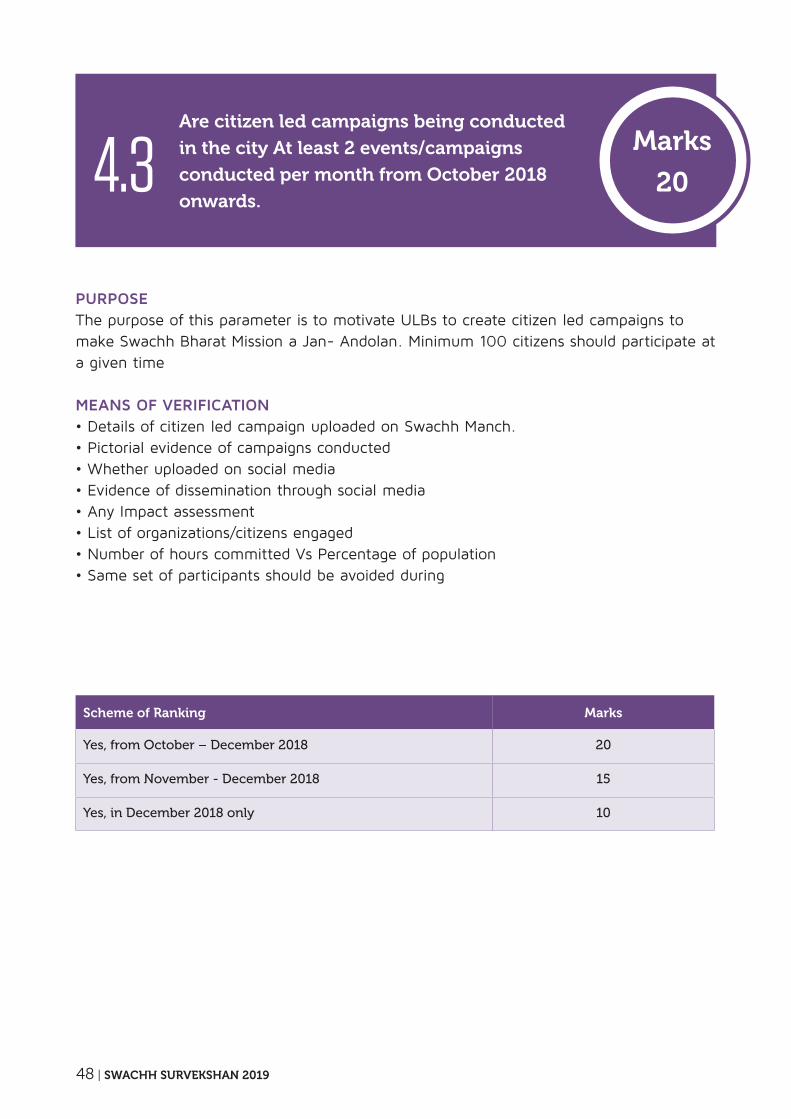
Yes, from October – December 2018 20
Yes, from November - December 2018 15
Yes, in December 2018 only 10
Are citizen led campaigns being conducted
in the city At least 2 events/campaigns
conducted per month from october 2018
onwards.
purpoSeThe purpose of this parameter is to motivate ULBs to create citizen led campaigns to make Swachh Bharat Mission a Jan- Andolan. Minimum 100 citizens should participate at a given time
MeanS oF VeriFiCation• Details of citizen led campaign uploaded on Swachh Manch.• Pictorial evidence of campaigns conducted• Whether uploaded on social media• Evidence of dissemination through social media• Any Impact assessment • List of organizations/citizens engaged• Number of hours committed Vs Percentage of population• Same set of participants should be avoided during
4.3Marks
20
SWACHH SURVEKSHAN 2019 | 49
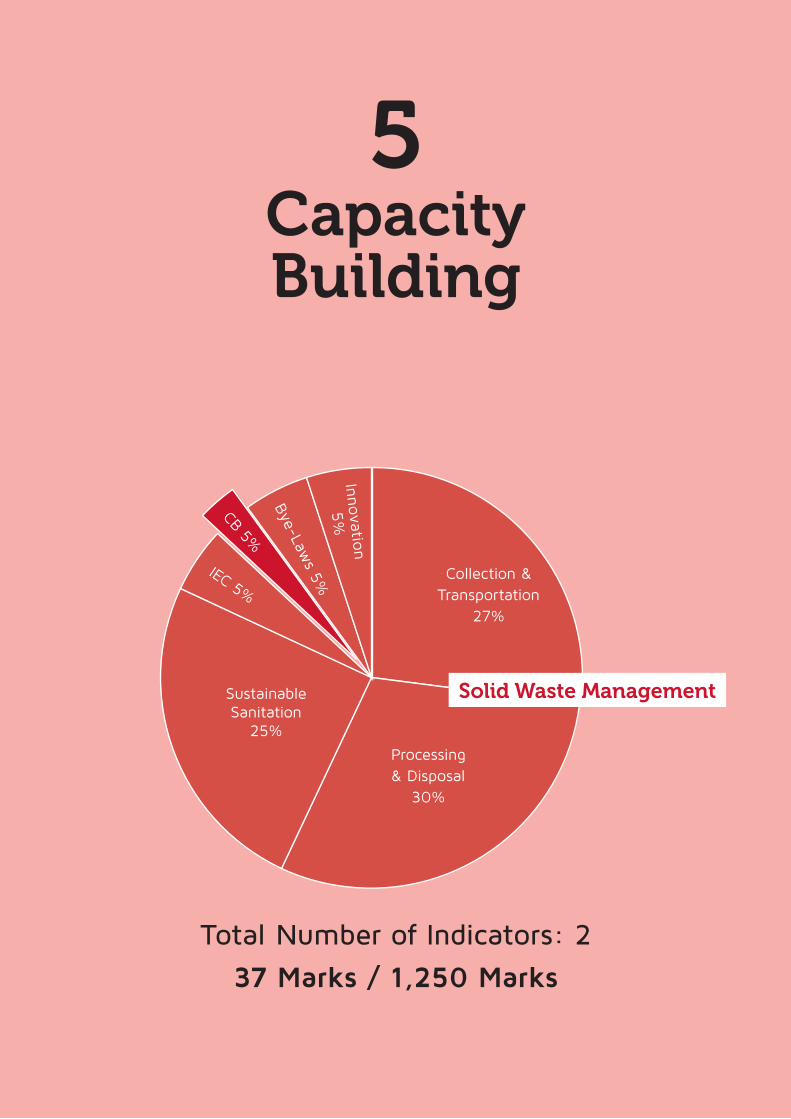
Total Number of Indicators: 2
37 Marks / 1,250 Marks
CapacityBuilding
5
Collection & Transportation
27%
Processing & Disposal
30%
CB 5%
Innova
tion
5%
Solid Waste ManagementSustainable Sanitation
25%
Bye-Law
s 5%
IEC 5%
50 | SWACHH SURVEKSHAN 2019
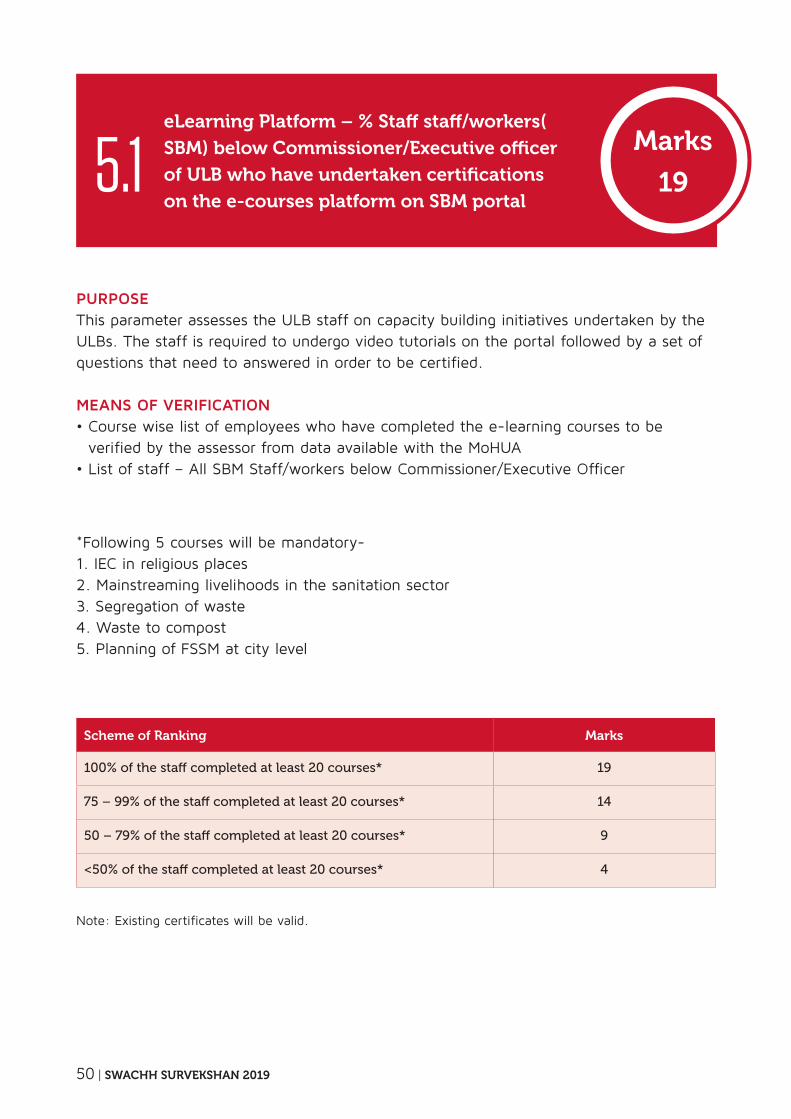
Scheme of Ranking Marks
100% of the staff completed at least 20 courses* 19
75 – 99% of the staff completed at least 20 courses* 14
50 – 79% of the staff completed at least 20 courses* 9
<50% of the staff completed at least 20 courses* 4
Note: Existing certificates will be valid.
eLearning Platform – % Staff staff/workers(
SBM) below Commissioner/Executive officer
of ULB who have undertaken certifications
on the e-courses platform on SBM portal
purpoSeThis parameter assesses the ULB staff on capacity building initiatives undertaken by the ULBs. The staff is required to undergo video tutorials on the portal followed by a set of questions that need to answered in order to be certified.
MeanS oF VeriFiCation• Course wise list of employees who have completed the e-learning courses to be
verified by the assessor from data available with the MoHUA • List of staff – All SBM Staff/workers below Commissioner/Executive Officer
5.1Marks
19
*Following 5 courses will be mandatory-1. IEC in religious places2. Mainstreaming livelihoods in the sanitation sector3. Segregation of waste4. Waste to compost5. Planning of FSSM at city level
SWACHH SURVEKSHAN 2019 | 51
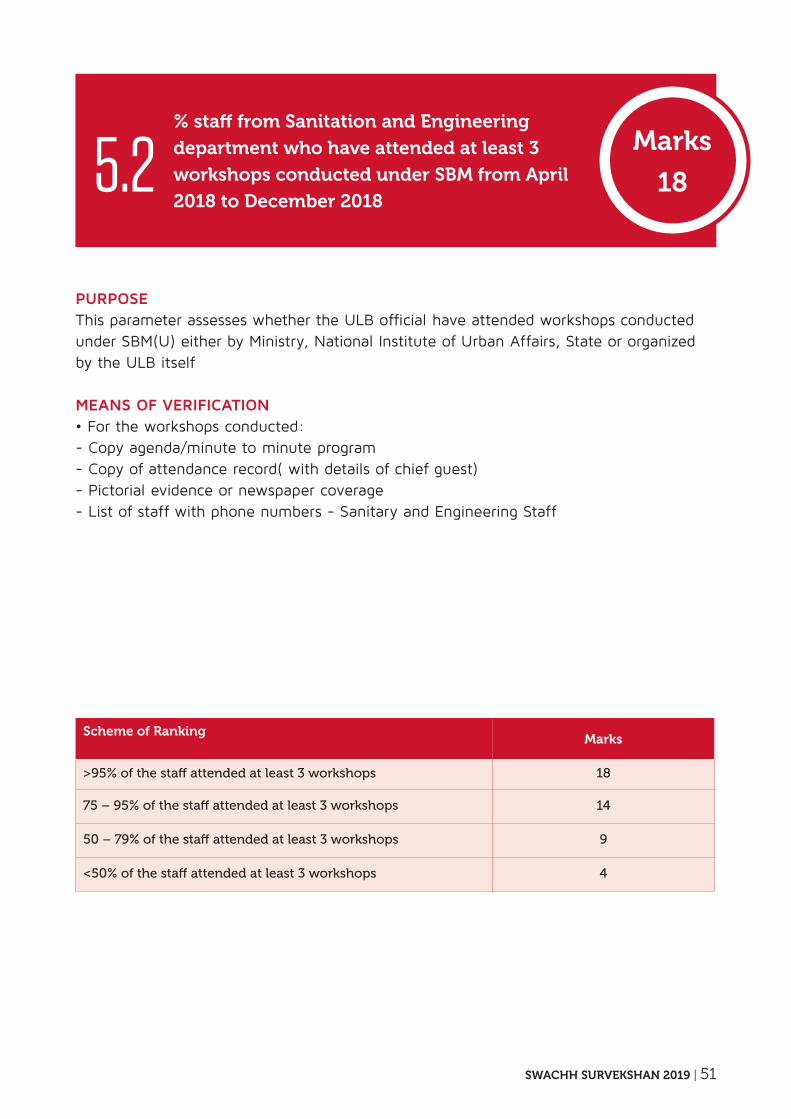
Scheme of RankingMarks
>95% of the staff attended at least 3 workshops 18
75 – 95% of the staff attended at least 3 workshops 14
50 – 79% of the staff attended at least 3 workshops 9
<50% of the staff attended at least 3 workshops 4
% staff from Sanitation and Engineering
department who have attended at least 3
workshops conducted under SBM from April
2018 to December 2018
purpoSeThis parameter assesses whether the ULB official have attended workshops conducted under SBM(U) either by Ministry, National Institute of Urban Affairs, State or organized by the ULB itself
MeanS oF VeriFiCation• For the workshops conducted:- Copy agenda/minute to minute program- Copy of attendance record( with details of chief guest)- Pictorial evidence or newspaper coverage- List of staff with phone numbers - Sanitary and Engineering Staff
5.2Marks
18
52 | SWACHH SURVEKSHAN 2019
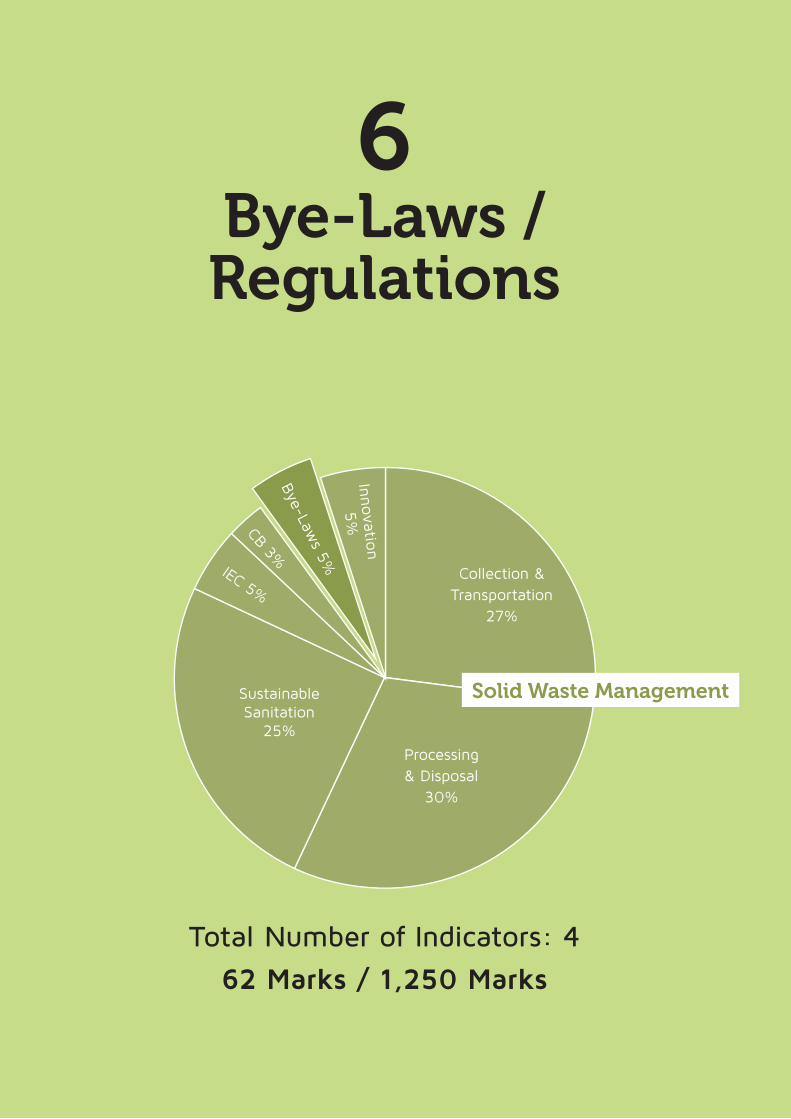
Total Number of Indicators: 4
62 Marks / 1,250 Marks
Bye-Laws / Regulations
6
Collection & Transportation
27%
Processing & Disposal
30%
CB 3%
Innova
tion
5%
Solid Waste ManagementSustainable Sanitation
25%
Bye-Law
s 5%
IEC 5%
SWACHH SURVEKSHAN 2019 | 53
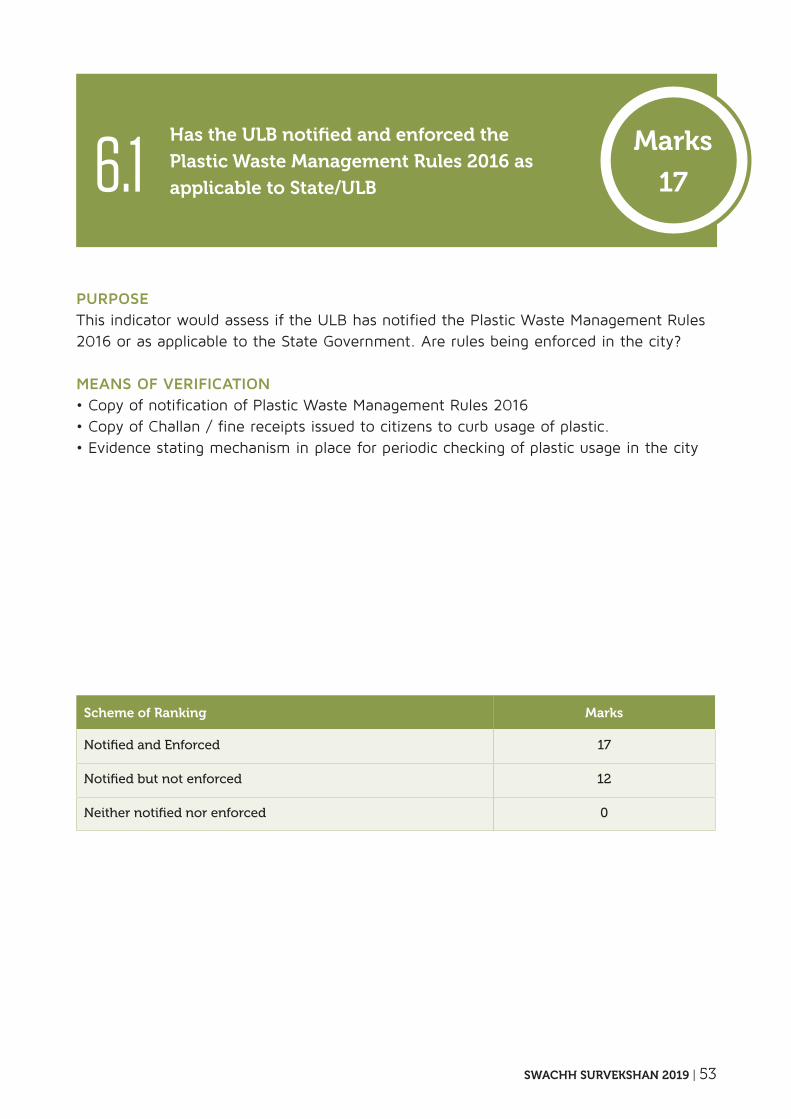
Scheme of Ranking Marks
Notified and Enforced 17
Notified but not enforced 12
Neither notified nor enforced 0
Has the ULB notified and enforced the
Plastic Waste Management Rules 2016 as
applicable to State/ULB
purpoSeThis indicator would assess if the ULB has notified the Plastic Waste Management Rules 2016 or as applicable to the State Government. Are rules being enforced in the city?
MeanS oF VeriFiCation• Copy of notification of Plastic Waste Management Rules 2016• Copy of Challan / fine receipts issued to citizens to curb usage of plastic.• Evidence stating mechanism in place for periodic checking of plastic usage in the city
6.1Marks
17
54 | SWACHH SURVEKSHAN 2019
Scheme of Ranking Marks
Notified and Enforced 15
Notified but not enforced 10
Neither notified nor enforced 0
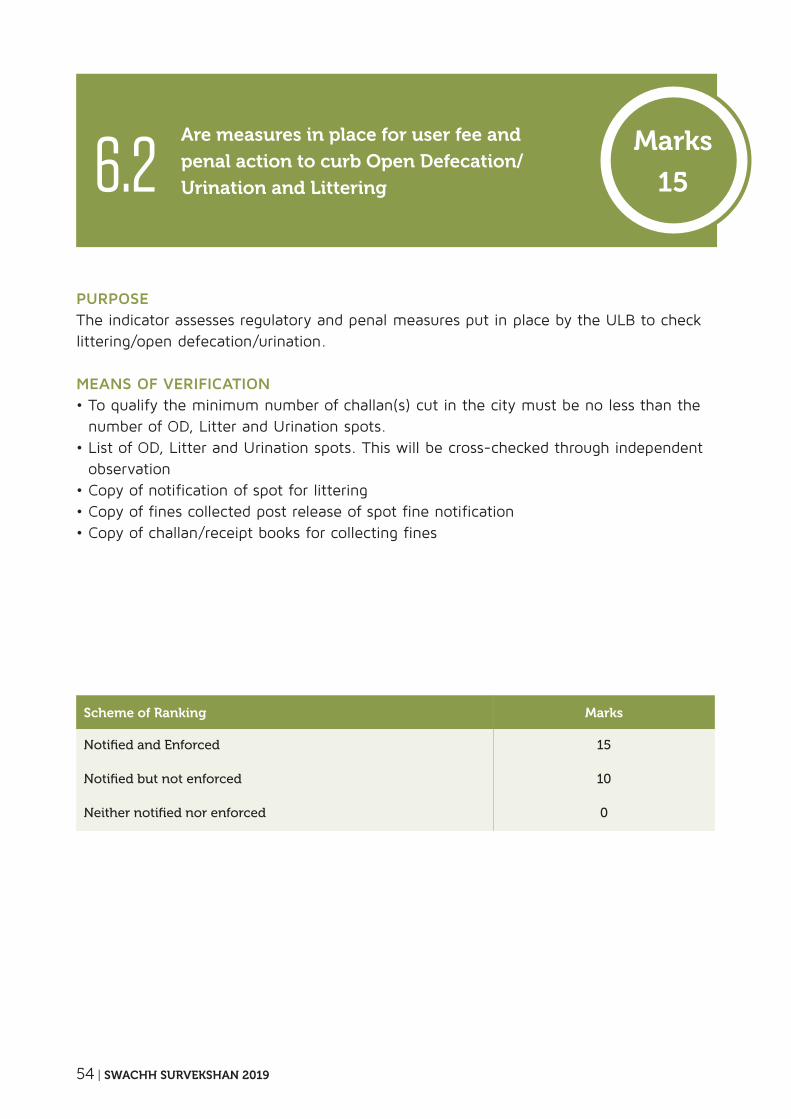
Are measures in place for user fee and
penal action to curb open Defecation/
Urination and Littering
purpoSeThe indicator assesses regulatory and penal measures put in place by the ULB to check littering/open defecation/urination.
MeanS oF VeriFiCation• To qualify the minimum number of challan(s) cut in the city must be no less than the
number of OD, Litter and Urination spots. • List of OD, Litter and Urination spots. This will be cross-checked through independent
observation• Copy of notification of spot for littering• Copy of fines collected post release of spot fine notification• Copy of challan/receipt books for collecting fines
6.2Marks
15
SWACHH SURVEKSHAN 2019 | 55
Scheme of Ranking Marks
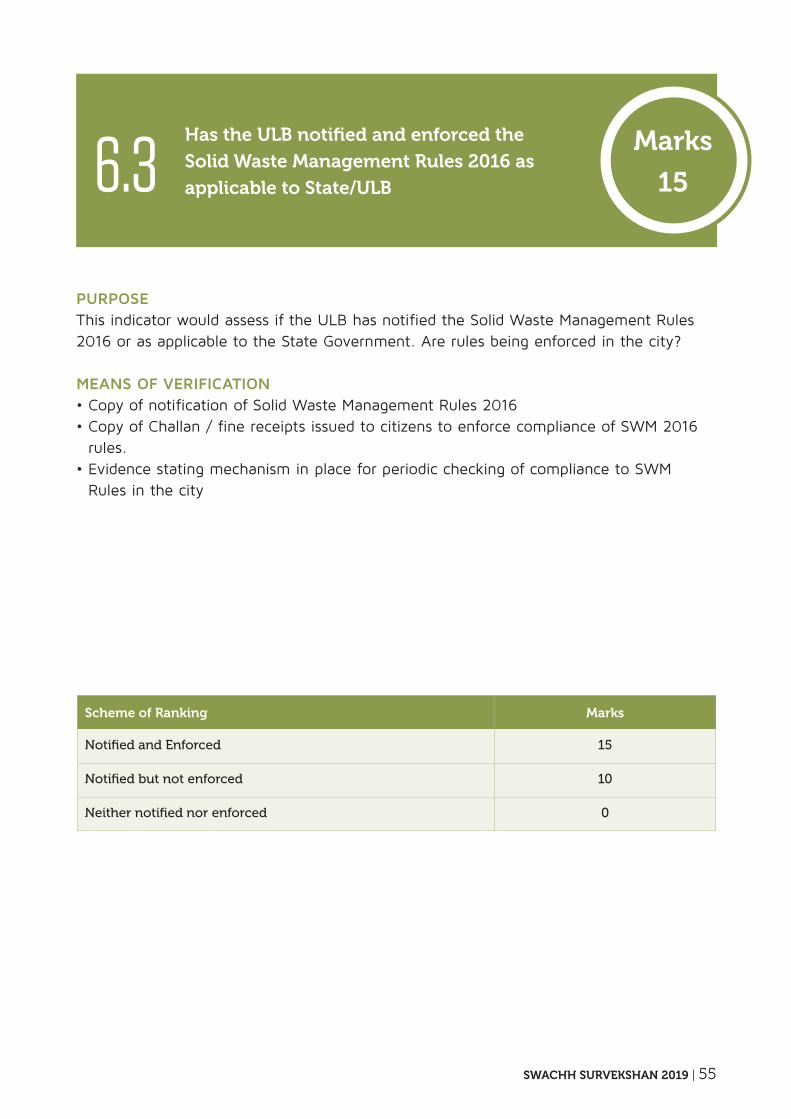
Notified and Enforced 15
Notified but not enforced 10
Neither notified nor enforced 0
Has the ULB notified and enforced the
Solid Waste Management Rules 2016 as
applicable to State/ULB
purpoSeThis indicator would assess if the ULB has notified the Solid Waste Management Rules 2016 or as applicable to the State Government. Are rules being enforced in the city?
MeanS oF VeriFiCation• Copy of notification of Solid Waste Management Rules 2016• Copy of Challan / fine receipts issued to citizens to enforce compliance of SWM 2016
rules.• Evidence stating mechanism in place for periodic checking of compliance to SWM
Rules in the city
6.3Marks
15
56 | SWACHH SURVEKSHAN 2019
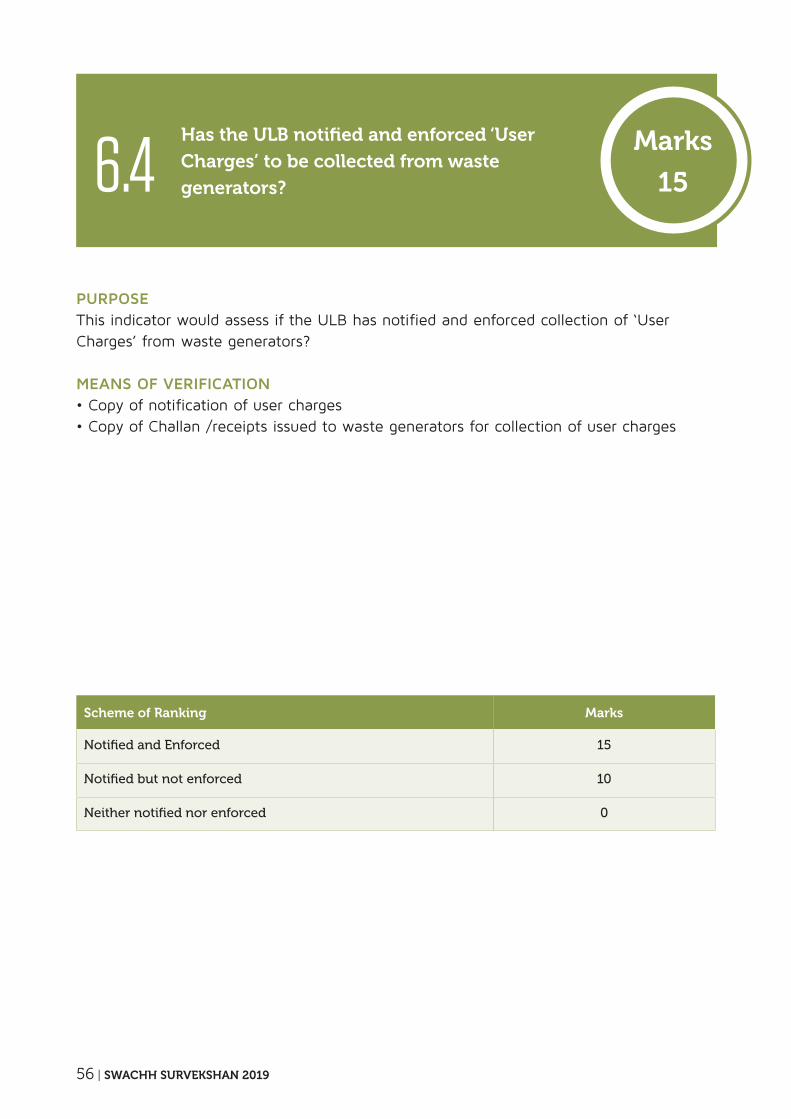
Has the ULB notified and enforced ‘User
Charges’ to be collected from waste
generators?
purpoSeThis indicator would assess if the ULB has notified and enforced collection of ‘User Charges’ from waste generators?
MeanS oF VeriFiCation• Copy of notification of user charges• Copy of Challan /receipts issued to waste generators for collection of user charges
6.4Marks
15
Scheme of Ranking Marks
Notified and Enforced 15
Notified but not enforced 10
Neither notified nor enforced 0
SWACHH SURVEKSHAN 2019 | 57
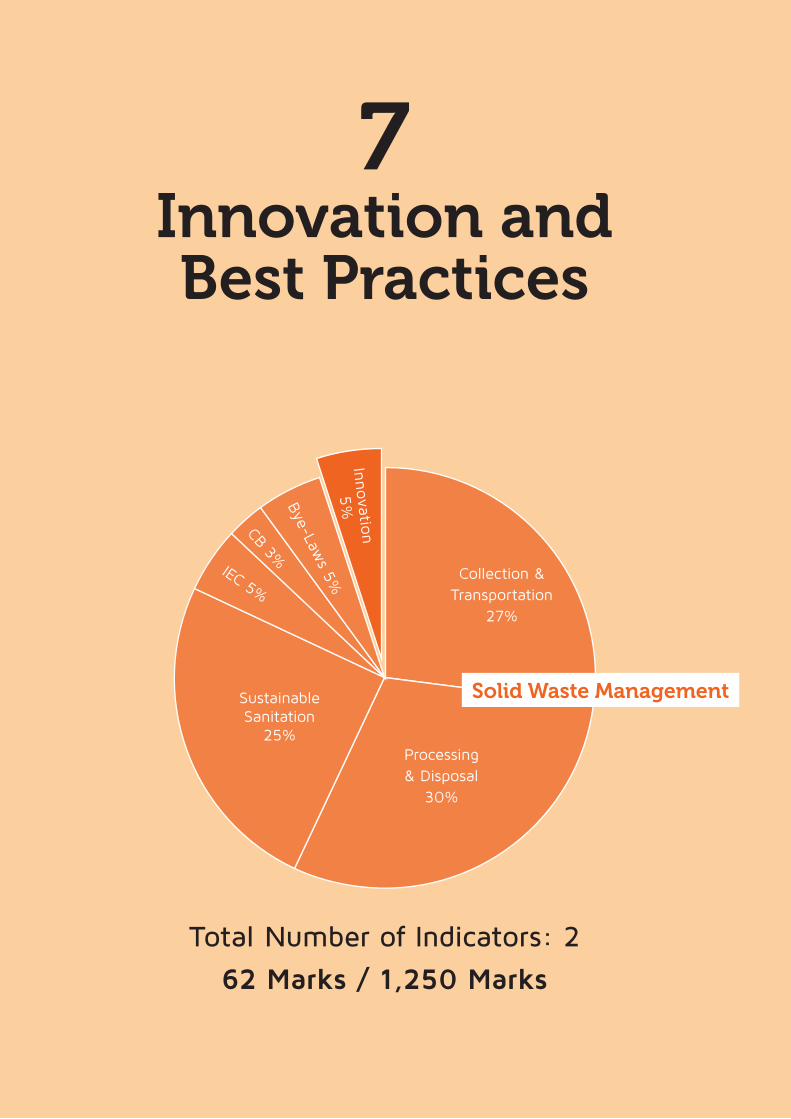
Total Number of Indicators: 2
62 Marks / 1,250 Marks
innovation and Best Practices
7
Collection & Transportation
27%
Processing & Disposal
30%
Sustainable Sanitation
25%
CB 3%
Innova
tion
5%
Solid Waste Management
Bye-Law
s 5%
IEC 5%
58 | SWACHH SURVEKSHAN 2019
Scheme of Ranking Max. Marks
Implementation 8
Novelty (Is your idea original or unique?) 8
Scalability 8
Financial Sustainability 8
Impact 8
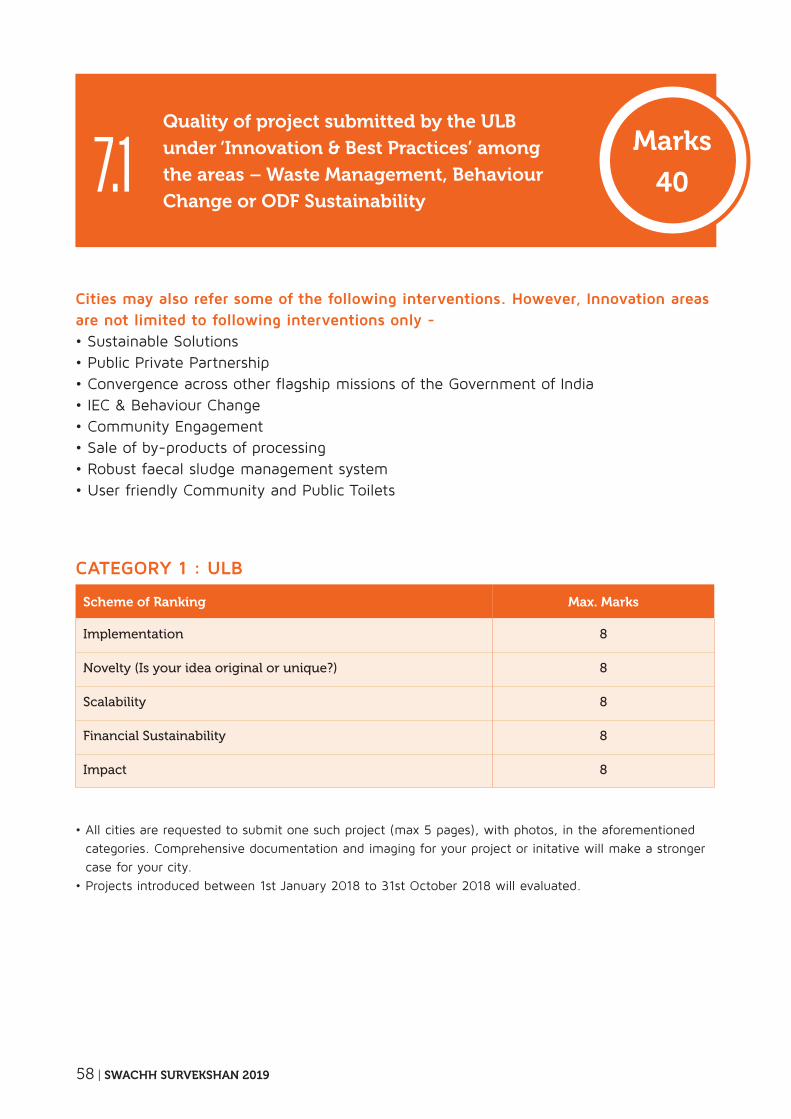
Quality of project submitted by the ULB
under ‘innovation & Best Practices’ among
the areas – Waste Management, Behaviour
Change or oDF Sustainability
Cities may also refer some of the following interventions. However, innovation areas are not limited to following interventions only - • Sustainable Solutions• Public Private Partnership• Convergence across other flagship missions of the Government of India• IEC & Behaviour Change• Community Engagement• Sale of by-products of processing • Robust faecal sludge management system• User friendly Community and Public Toilets
• All cities are requested to submit one such project (max 5 pages), with photos, in the aforementioned
categories. Comprehensive documentation and imaging for your project or initative will make a stronger
case for your city.
• Projects introduced between 1st January 2018 to 31st October 2018 will evaluated.
Category 1 : ulB
7.1Marks
40
SWACHH SURVEKSHAN 2019 | 59
Scheme of Ranking Max. Marks
Implementation 6
Novelty (Is your idea original or unique?) 6
Scalability 5
Impact 5
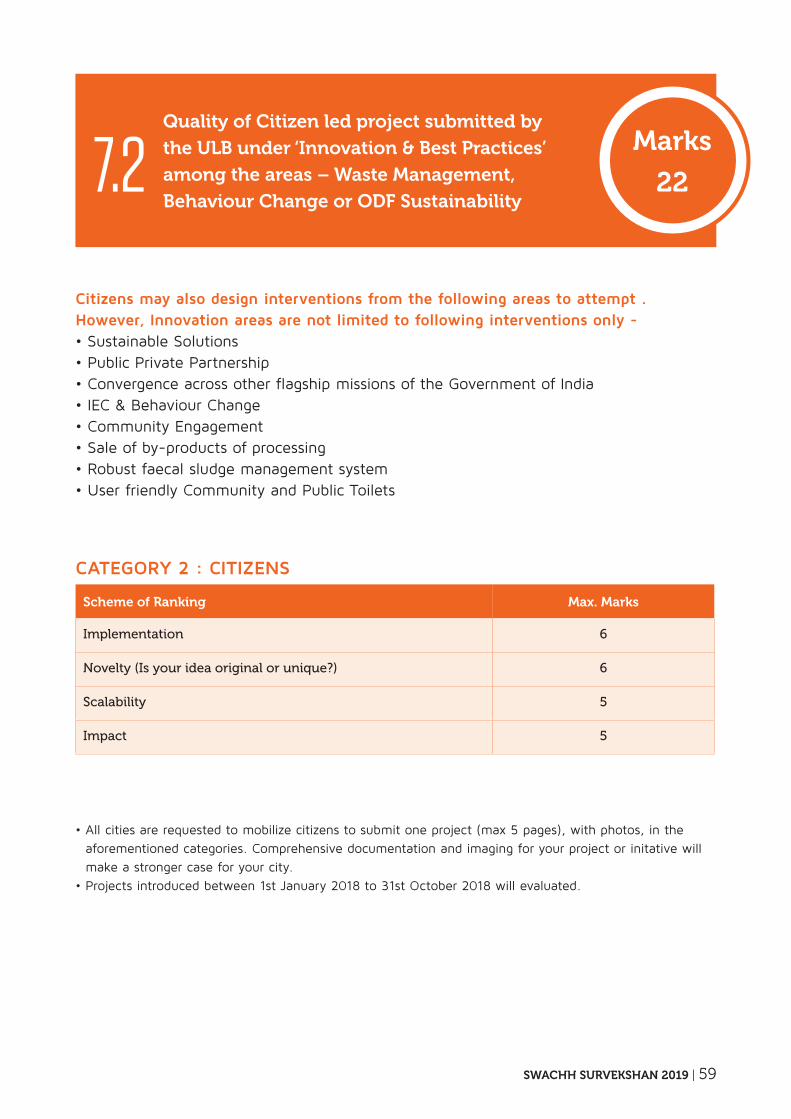
Quality of Citizen led project submitted by
the ULB under ‘innovation & Best Practices’
among the areas – Waste Management,
Behaviour Change or oDF Sustainability
Citizens may also design interventions from the following areas to attempt . However, innovation areas are not limited to following interventions only - • Sustainable Solutions• Public Private Partnership• Convergence across other flagship missions of the Government of India• IEC & Behaviour Change• Community Engagement• Sale of by-products of processing • Robust faecal sludge management system• User friendly Community and Public Toilets
• All cities are requested to mobilize citizens to submit one project (max 5 pages), with photos, in the
aforementioned categories. Comprehensive documentation and imaging for your project or initative will
make a stronger case for your city.
• Projects introduced between 1st January 2018 to 31st October 2018 will evaluated.
Category 2 : CitizenS
7.2Marks
22
60 | SWACHH SURVEKSHAN 2019
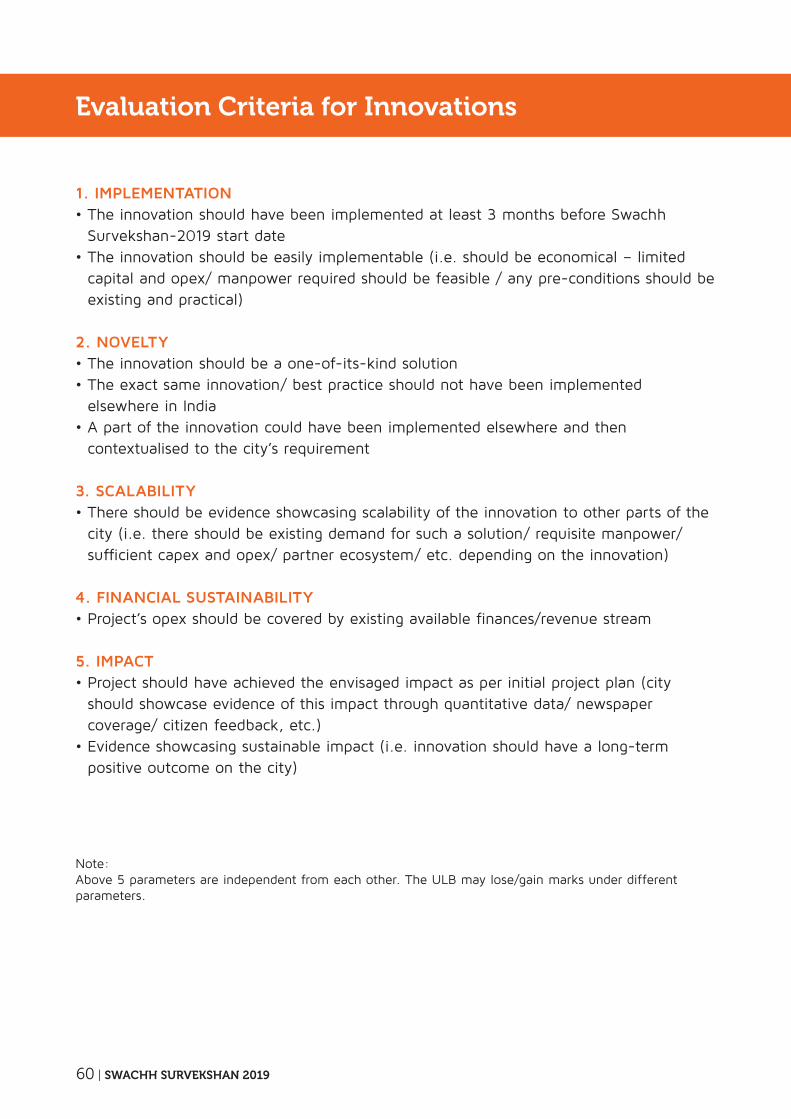
1. iMpleMentation• The innovation should have been implemented at least 3 months before Swachh
Survekshan-2019 start date• The innovation should be easily implementable (i.e. should be economical – limited
capital and opex/ manpower required should be feasible / any pre-conditions should be existing and practical)
2. noVelty • The innovation should be a one-of-its-kind solution• The exact same innovation/ best practice should not have been implemented
elsewhere in India• A part of the innovation could have been implemented elsewhere and then
contextualised to the city’s requirement
3. SCAlABility • There should be evidence showcasing scalability of the innovation to other parts of the
city (i.e. there should be existing demand for such a solution/ requisite manpower/ sufficient capex and opex/ partner ecosystem/ etc. depending on the innovation)
4. FinanCial SuStainaBility • Project’s opex should be covered by existing available finances/revenue stream
5. iMpaCt • Project should have achieved the envisaged impact as per initial project plan (city
should showcase evidence of this impact through quantitative data/ newspaper coverage/ citizen feedback, etc.)
• Evidence showcasing sustainable impact (i.e. innovation should have a long-term positive outcome on the city)
Note: Above 5 parameters are independent from each other. The ULB may lose/gain marks under different parameters.
Evaluation Criteria for innovations
SWACHH SURVEKSHAN 2019 | 61
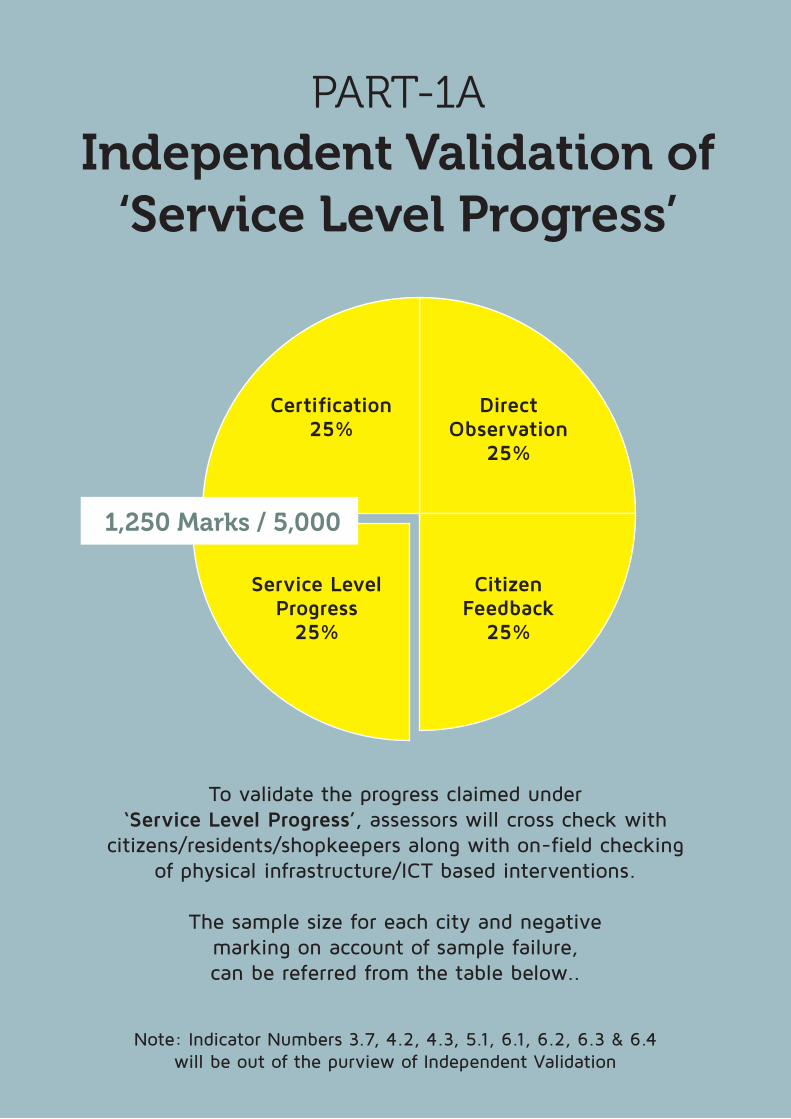
To validate the progress claimed under ‘Service level progress’, assessors will cross check with
citizens/residents/shopkeepers along with on-field checking of physical infrastructure/ICT based interventions.
The sample size for each city and negative marking on account of sample failure, can be referred from the table below..
Note: Indicator Numbers 3.7, 4.2, 4.3, 5.1, 6.1, 6.2, 6.3 & 6.4 will be out of the purview of Independent Validation
direct observation
25%
Certification 25%
Citizen Feedback
25%
Service level progress
25%
1,250 Marks / 5,000
PART-1Aindependent Validation of
‘Service Level Progress’
62 | SWACHH SURVEKSHAN 2019
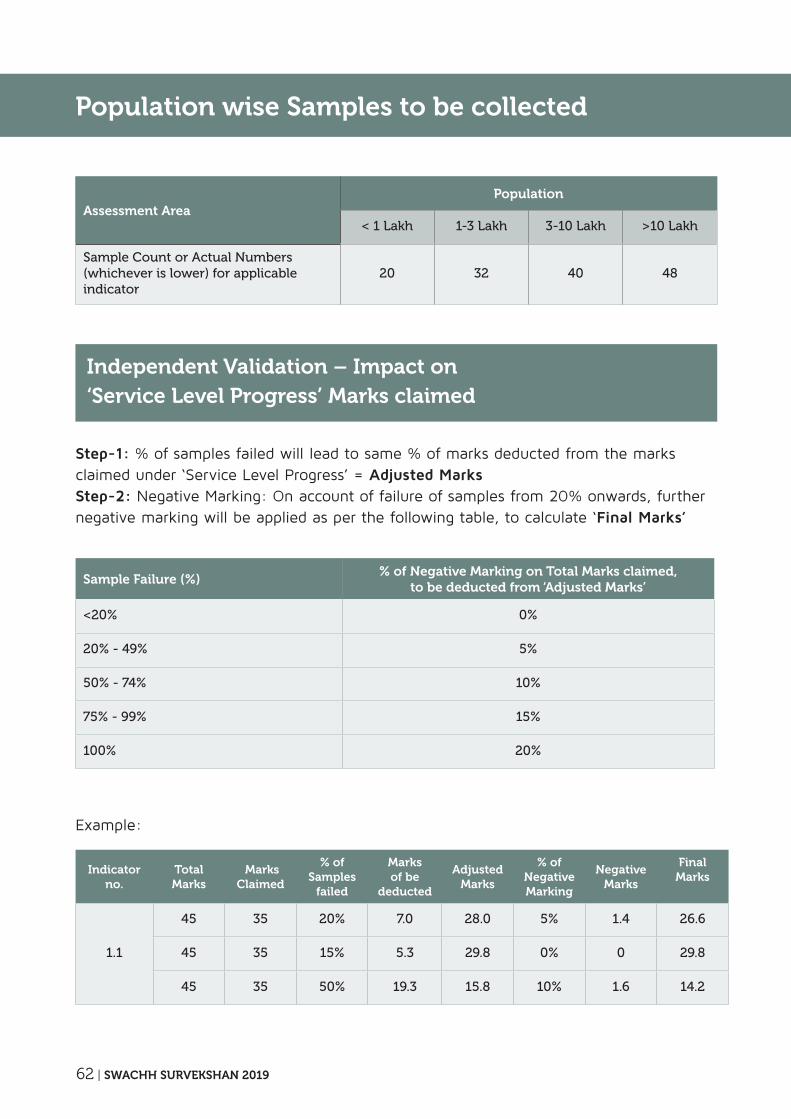
Population wise Samples to be collected
independent Validation – impact on ‘Service Level Progress’ Marks claimed
Step-1: % of samples failed will lead to same % of marks deducted from the marks claimed under ‘Service Level Progress’ = adjusted Marks Step-2: Negative Marking: On account of failure of samples from 20% onwards, further negative marking will be applied as per the following table, to calculate ‘Final Marks’
Assessment AreaPopulation
< 1 Lakh 1-3 Lakh 3-10 Lakh >10 Lakh
Sample Count or Actual Numbers (whichever is lower) for applicable indicator
20 32 40 48
Example:
indicatorno.
Total Marks
Marks Claimed
% of Samples
failed
Marks of be
deducted
AdjustedMarks
% of Negative Marking
Negative Marks
Final Marks
1.1
45 35 20% 7.0 28.0 5% 1.4 26.6
45 35 15% 5.3 29.8 0% 0 29.8
45 35 50% 19.3 15.8 10% 1.6 14.2
Sample Failure (%)% of Negative Marking on Total Marks claimed,
to be deducted from ‘Adjusted Marks’
<20% 0%
20% - 49% 5%
50% - 74% 10%
75% - 99% 15%
100% 20%
SWACHH SURVEKSHAN 2019 | 63
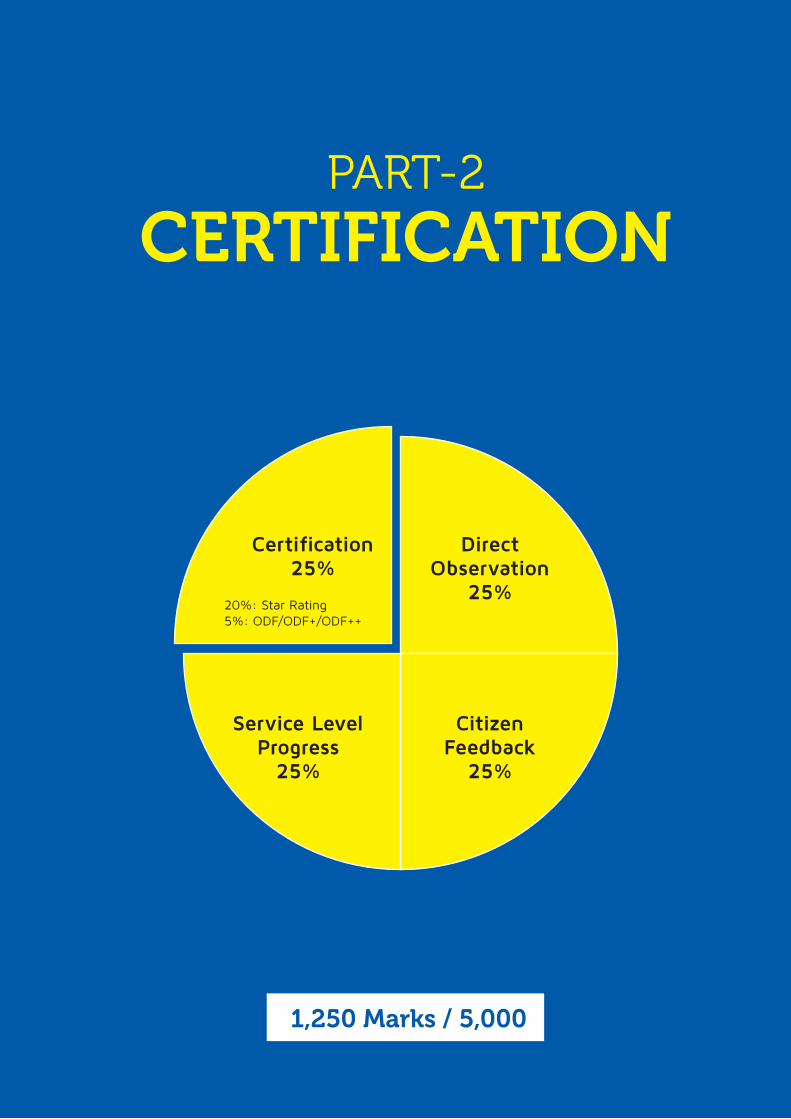
PART-2
CERTiFiCATioN
direct observation
25%
Certification 25%
Citizen Feedback
25%
Service level progress
25%
1,250 Marks / 5,000
20%: Star Rating5%: ODF/ODF+/ODF++
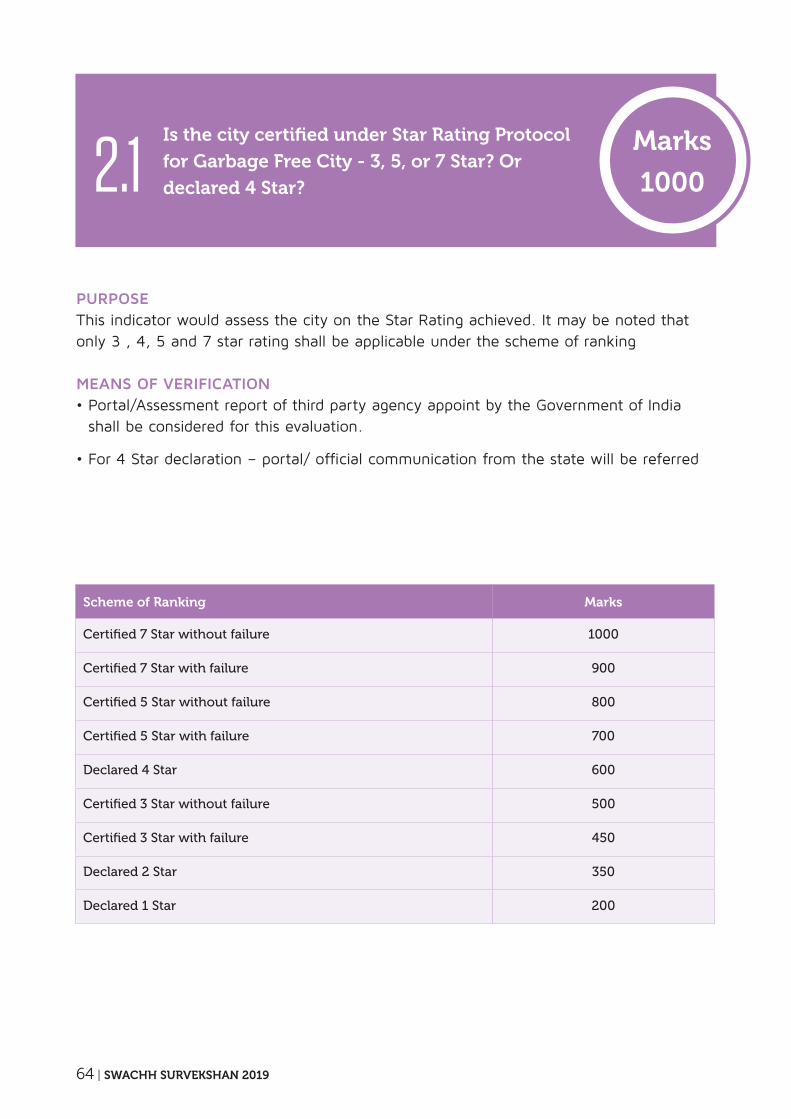
64 | SWACHH SURVEKSHAN 2019
Scheme of Ranking Marks
Certified 7 Star without failure 1000
Certified 7 Star with failure 900
Certified 5 Star without failure 800
Certified 5 Star with failure 700
Declared 4 Star 600
Certified 3 Star without failure 500
Certified 3 Star with failure 450
Declared 2 Star 350
Declared 1 Star 200
is the city certified under Star Rating Protocol
for Garbage Free City - 3, 5, or 7 Star? Or
declared 4 Star?2.1Marks
1000
purpoSeThis indicator would assess the city on the Star Rating achieved. It may be noted that only 3 , 4, 5 and 7 star rating shall be applicable under the scheme of ranking
MeanS oF VeriFiCation• Portal/Assessment report of third party agency appoint by the Government of India
shall be considered for this evaluation.
• For 4 Star declaration – portal/ official communication from the state will be referred
SWACHH SURVEKSHAN 2019 | 65
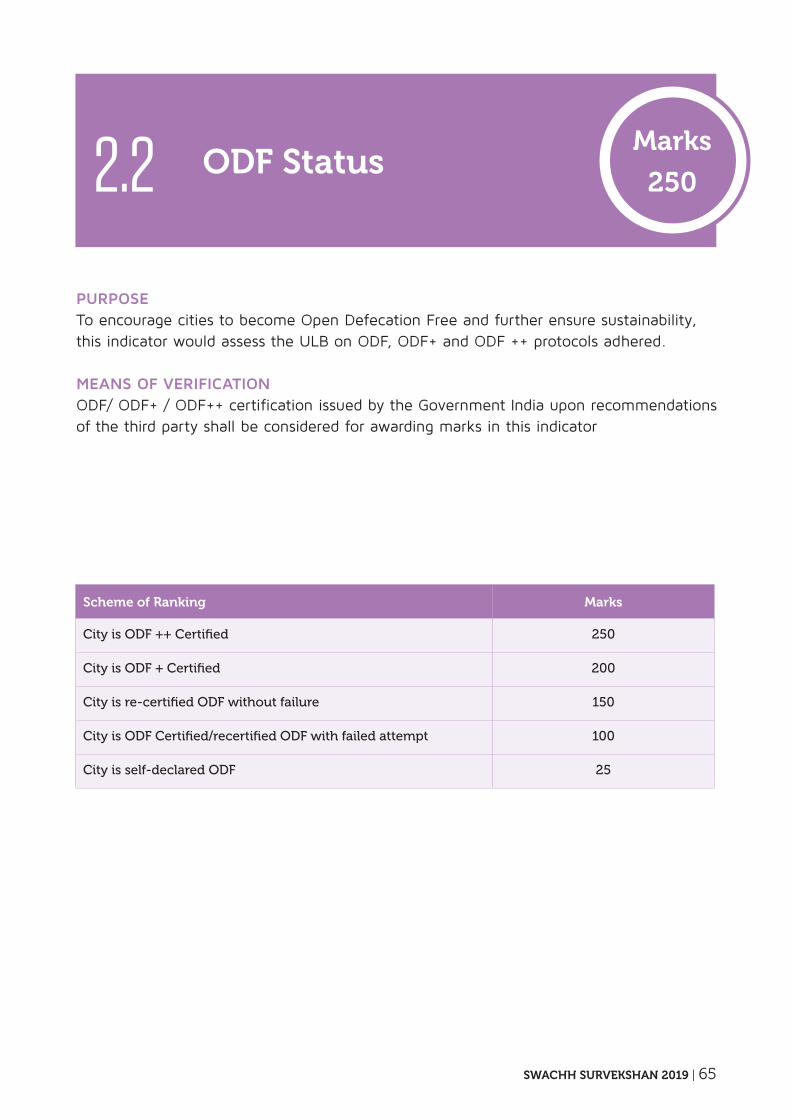
Scheme of Ranking Marks
City is ODF ++ Certified 250
City is ODF + Certified 200
City is re-certified ODF without failure 150
City is ODF Certified/recertified ODF with failed attempt 100
City is self-declared ODF 25
oDF Status2.2Marks
250
purpoSeTo encourage cities to become Open Defecation Free and further ensure sustainability, this indicator would assess the ULB on ODF, ODF+ and ODF ++ protocols adhered.
MeanS oF VeriFiCationODF/ ODF+ / ODF++ certification issued by the Government India upon recommendations of the third party shall be considered for awarding marks in this indicator
66 | SWACHH SURVEKSHAN 2019
PART-3
DiRECT oBSERVATioN
direct observation
25%
Certification 25%
Citizen Feedback
25%
Service level progress
25%
1,250 Marks / 5,000
SWACHH SURVEKSHAN 2019 | 67
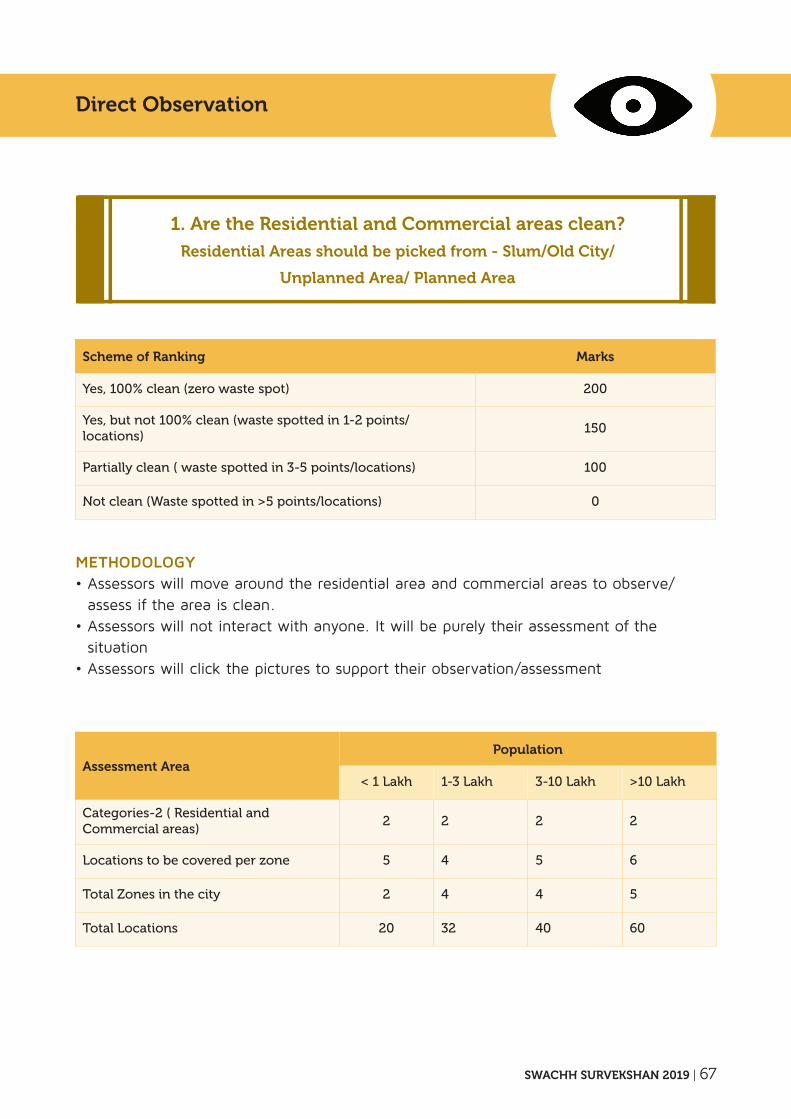
MetHodology• Assessors will move around the residential area and commercial areas to observe/
assess if the area is clean. • Assessors will not interact with anyone. It will be purely their assessment of the
situation• Assessors will click the pictures to support their observation/assessment
Assessment AreaPopulation
< 1 Lakh 1-3 Lakh 3-10 Lakh >10 Lakh
Categories-2 ( Residential and Commercial areas)
2 2 2 2
Locations to be covered per zone 5 4 5 6
Total Zones in the city 2 4 4 5
Total Locations 20 32 40 60
Scheme of Ranking Marks
Yes, 100% clean (zero waste spot) 200
Yes, but not 100% clean (waste spotted in 1-2 points/locations)
150
Partially clean ( waste spotted in 3-5 points/locations) 100
Not clean (Waste spotted in >5 points/locations) 0
1. Are the Residential and Commercial areas clean?
Residential Areas should be picked from - Slum/Old City/
Unplanned Area/ Planned Area
Direct observation
68 | SWACHH SURVEKSHAN 2019
Direct observation
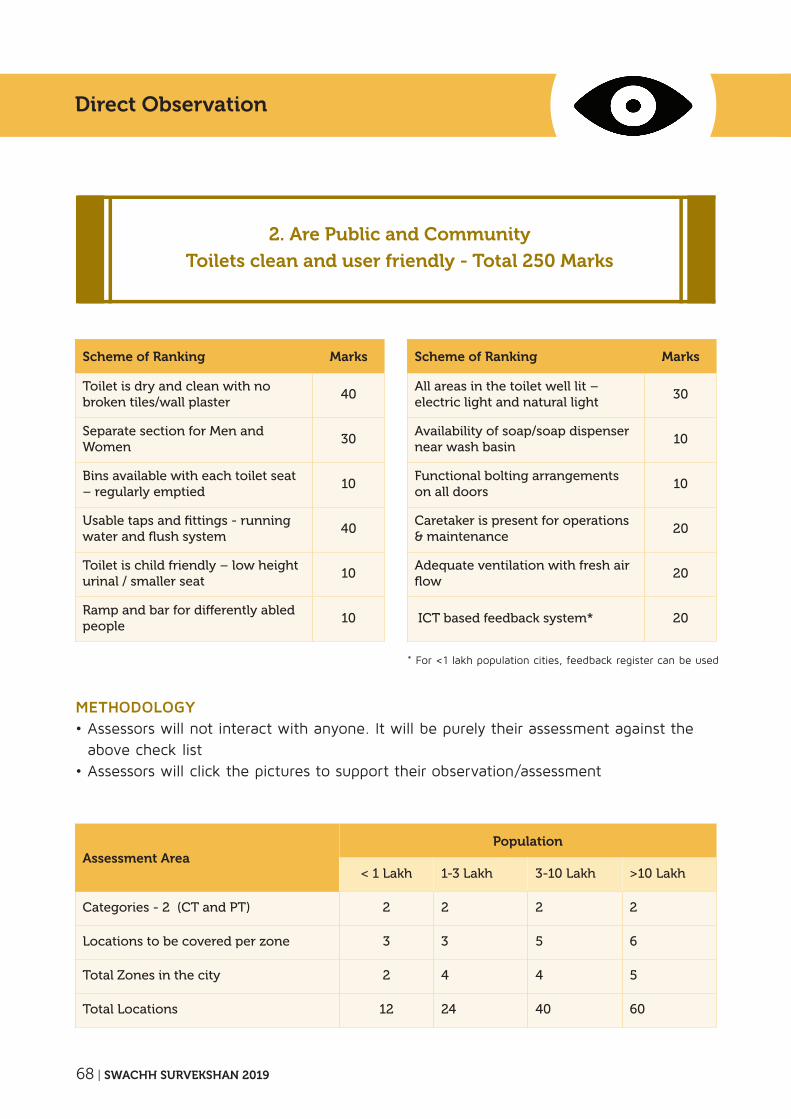
MetHodology• Assessors will not interact with anyone. It will be purely their assessment against the
above check list• Assessors will click the pictures to support their observation/assessment
* For <1 lakh population cities, feedback register can be used
Assessment AreaPopulation
< 1 Lakh 1-3 Lakh 3-10 Lakh >10 Lakh
Categories - 2 (CT and PT) 2 2 2 2
Locations to be covered per zone 3 3 5 6
Total Zones in the city 2 4 4 5
Total Locations 12 24 40 60
Scheme of Ranking Marks
Toilet is dry and clean with no broken tiles/wall plaster
40
Separate section for Men and Women
30
Bins available with each toilet seat – regularly emptied
10
Usable taps and fittings - running water and flush system
40
Toilet is child friendly – low height urinal / smaller seat
10
Ramp and bar for differently abled people
10
Scheme of Ranking Marks
All areas in the toilet well lit – electric light and natural light
30
Availability of soap/soap dispenser near wash basin
10
Functional bolting arrangements on all doors
10
Caretaker is present for operations & maintenance
20
Adequate ventilation with fresh air flow
20
ICT based feedback system* 20
2. Are Public and Community
Toilets clean and user friendly - Total 250 Marks
SWACHH SURVEKSHAN 2019 | 69
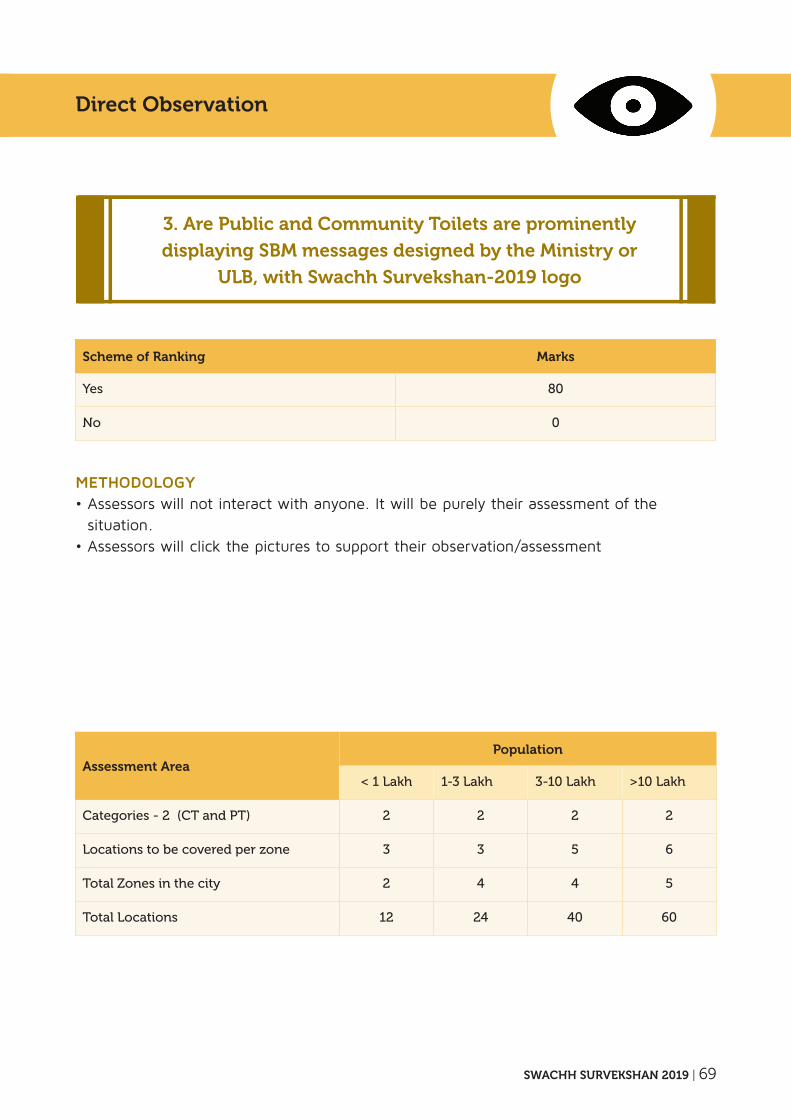
MetHodology• Assessors will not interact with anyone. It will be purely their assessment of the
situation.• Assessors will click the pictures to support their observation/assessment
Assessment AreaPopulation
< 1 Lakh 1-3 Lakh 3-10 Lakh >10 Lakh
Categories - 2 (CT and PT) 2 2 2 2
Locations to be covered per zone 3 3 5 6
Total Zones in the city 2 4 4 5
Total Locations 12 24 40 60
Scheme of Ranking Marks
Yes 80
No 0
3. Are Public and Community Toilets are prominently
displaying SBM messages designed by the Ministry or
ULB, with Swachh Survekshan-2019 logo
Direct observation
70 | SWACHH SURVEKSHAN 2019
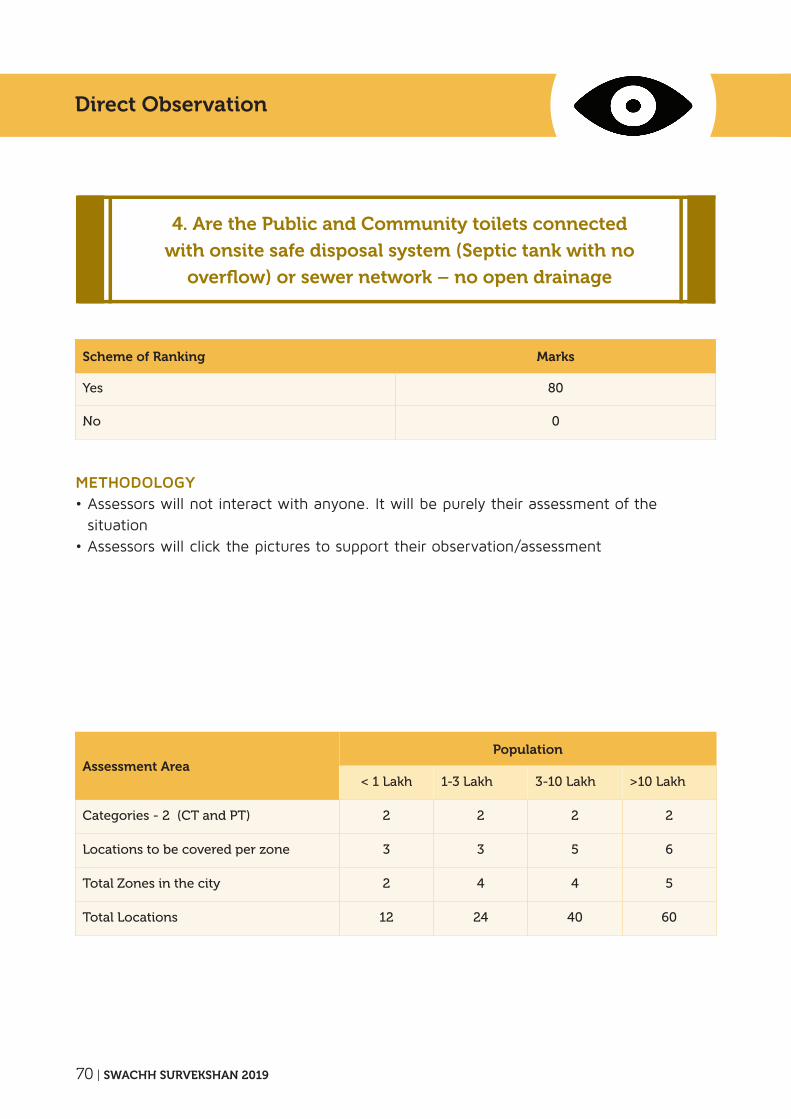
Direct observation
MetHodology• Assessors will not interact with anyone. It will be purely their assessment of the
situation• Assessors will click the pictures to support their observation/assessment
Assessment AreaPopulation
< 1 Lakh 1-3 Lakh 3-10 Lakh >10 Lakh
Categories - 2 (CT and PT) 2 2 2 2
Locations to be covered per zone 3 3 5 6
Total Zones in the city 2 4 4 5
Total Locations 12 24 40 60
Scheme of Ranking Marks
Yes 80
No 0
4. Are the Public and Community toilets connected
with onsite safe disposal system (Septic tank with no
overflow) or sewer network – no open drainage
SWACHH SURVEKSHAN 2019 | 71
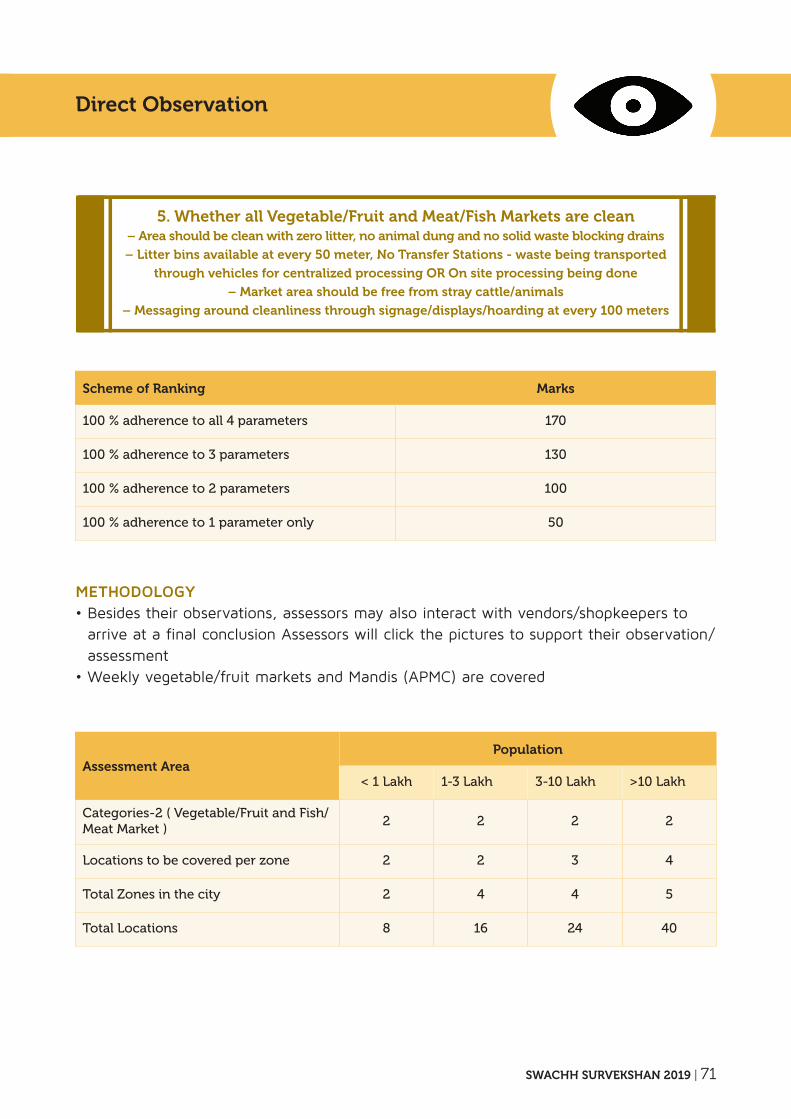
MetHodology• Besides their observations, assessors may also interact with vendors/shopkeepers to
arrive at a final conclusion Assessors will click the pictures to support their observation/assessment
• Weekly vegetable/fruit markets and Mandis (APMC) are covered
Assessment AreaPopulation
< 1 Lakh 1-3 Lakh 3-10 Lakh >10 Lakh
Categories-2 ( Vegetable/Fruit and Fish/Meat Market )
2 2 2 2
Locations to be covered per zone 2 2 3 4
Total Zones in the city 2 4 4 5
Total Locations 8 16 24 40
Scheme of Ranking Marks
100 % adherence to all 4 parameters 170
100 % adherence to 3 parameters 130
100 % adherence to 2 parameters 100
100 % adherence to 1 parameter only 50
5. Whether all Vegetable/Fruit and Meat/Fish Markets are clean – Area should be clean with zero litter, no animal dung and no solid waste blocking drains
– Litter bins available at every 50 meter, No Transfer Stations - waste being transported
through vehicles for centralized processing oR on site processing being done
– Market area should be free from stray cattle/animals
– Messaging around cleanliness through signage/displays/hoarding at every 100 meters
Direct observation
72 | SWACHH SURVEKSHAN 2019
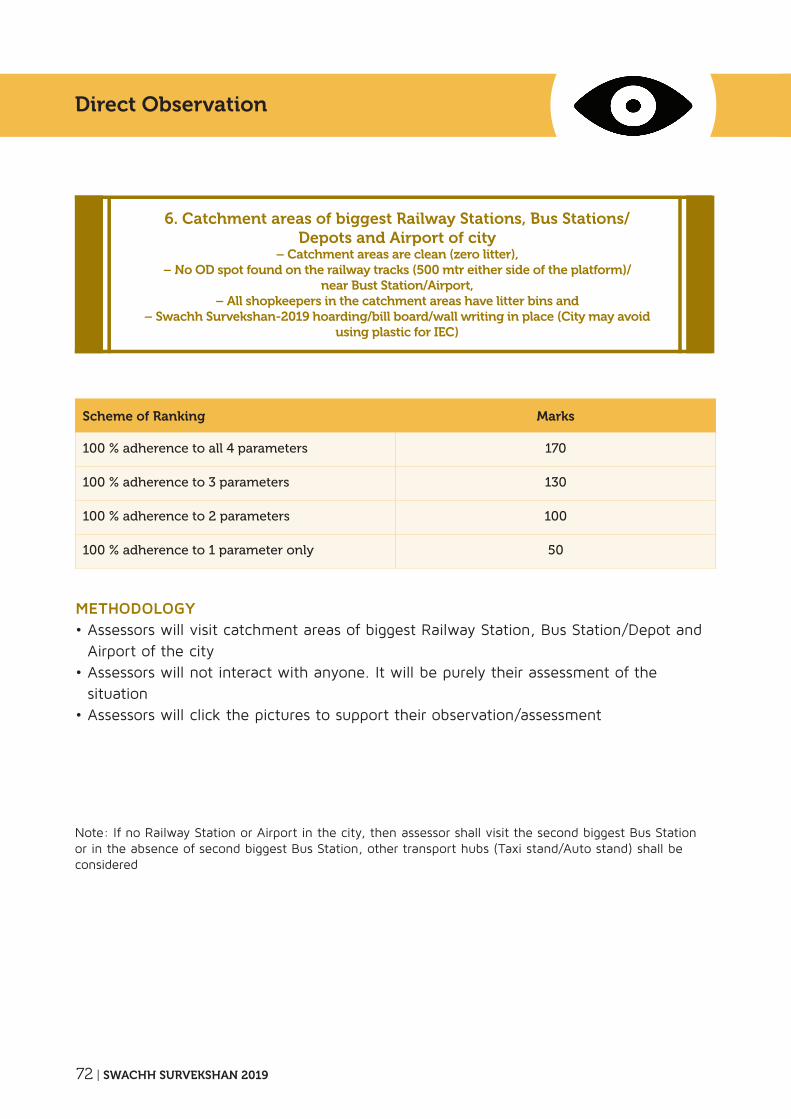
Direct observation
MetHodology• Assessors will visit catchment areas of biggest Railway Station, Bus Station/Depot and
Airport of the city• Assessors will not interact with anyone. It will be purely their assessment of the
situation• Assessors will click the pictures to support their observation/assessment
Scheme of Ranking Marks
100 % adherence to all 4 parameters 170
100 % adherence to 3 parameters 130
100 % adherence to 2 parameters 100
100 % adherence to 1 parameter only 50
Note: If no Railway Station or Airport in the city, then assessor shall visit the second biggest Bus Station or in the absence of second biggest Bus Station, other transport hubs (Taxi stand/Auto stand) shall be considered
6. Catchment areas of biggest Railway Stations, Bus Stations/Depots and Airport of city
– Catchment areas are clean (zero litter), – No oD spot found on the railway tracks (500 mtr either side of the platform)/
near Bust Station/Airport, – All shopkeepers in the catchment areas have litter bins and
– Swachh Survekshan-2019 hoarding/bill board/wall writing in place (City may avoid using plastic for iEC)
SWACHH SURVEKSHAN 2019 | 73
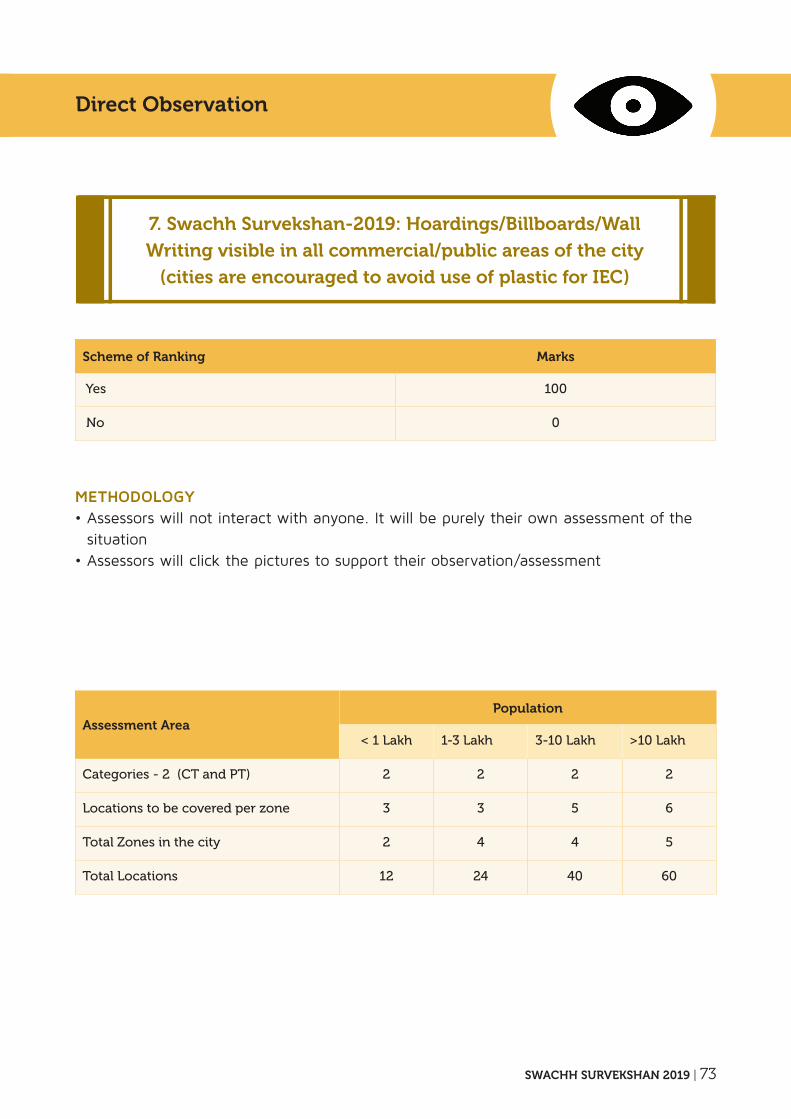
MetHodology• Assessors will not interact with anyone. It will be purely their own assessment of the
situation• Assessors will click the pictures to support their observation/assessment
Assessment AreaPopulation
< 1 Lakh 1-3 Lakh 3-10 Lakh >10 Lakh
Categories - 2 (CT and PT) 2 2 2 2
Locations to be covered per zone 3 3 5 6
Total Zones in the city 2 4 4 5
Total Locations 12 24 40 60
Scheme of Ranking Marks
Yes 100
No 0
Direct observation
7. Swachh Survekshan-2019: Hoardings/Billboards/Wall
Writing visible in all commercial/public areas of the city
(cities are encouraged to avoid use of plastic for iEC)
74 | SWACHH SURVEKSHAN 2019
Direct observation
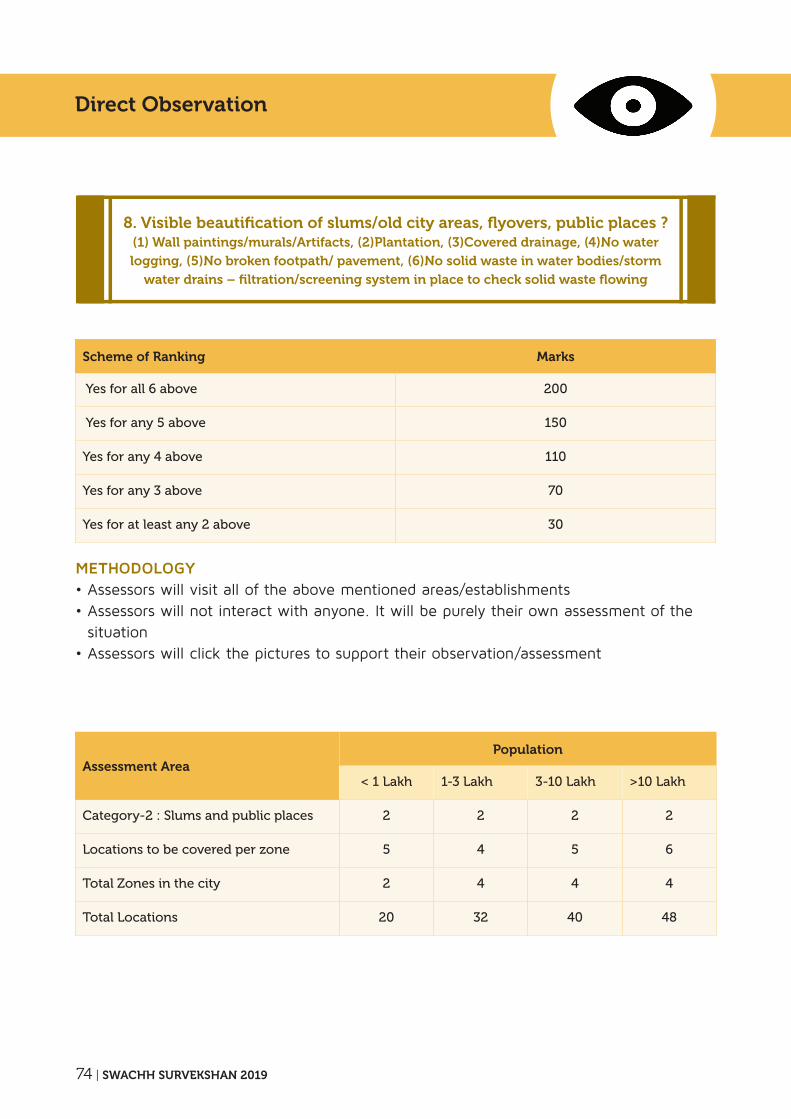
MetHodology• Assessors will visit all of the above mentioned areas/establishments• Assessors will not interact with anyone. It will be purely their own assessment of the
situation• Assessors will click the pictures to support their observation/assessment
Scheme of Ranking Marks
Yes for all 6 above 200
Yes for any 5 above 150
Yes for any 4 above 110
Yes for any 3 above 70
Yes for at least any 2 above 30
8. Visible beautification of slums/old city areas, flyovers, public places ? (1) Wall paintings/murals/Artifacts, (2)Plantation, (3)Covered drainage, (4)No water logging, (5)No broken footpath/ pavement, (6)No solid waste in water bodies/storm
water drains – filtration/screening system in place to check solid waste flowing
Assessment AreaPopulation
< 1 Lakh 1-3 Lakh 3-10 Lakh >10 Lakh
Category-2 : Slums and public places 2 2 2 2
Locations to be covered per zone 5 4 5 6
Total Zones in the city 2 4 4 4
Total Locations 20 32 40 48
SWACHH SURVEKSHAN 2019 | 75
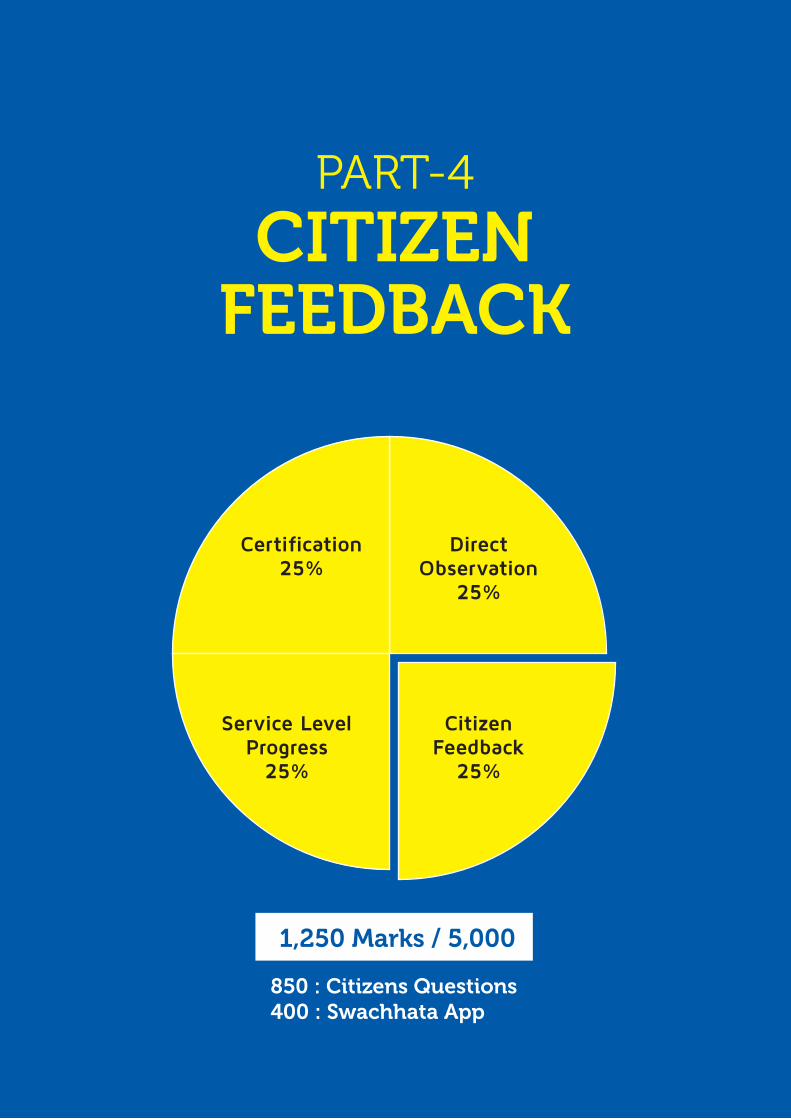
PART-4
CiTiZEN FEEDBACK
direct observation
25%
Certification 25%
Citizen Feedback
25%
Service level progress
25%
1,250 Marks / 5,000
850 : Citizens Questions 400 : Swachhata App
76 | SWACHH SURVEKSHAN 2019
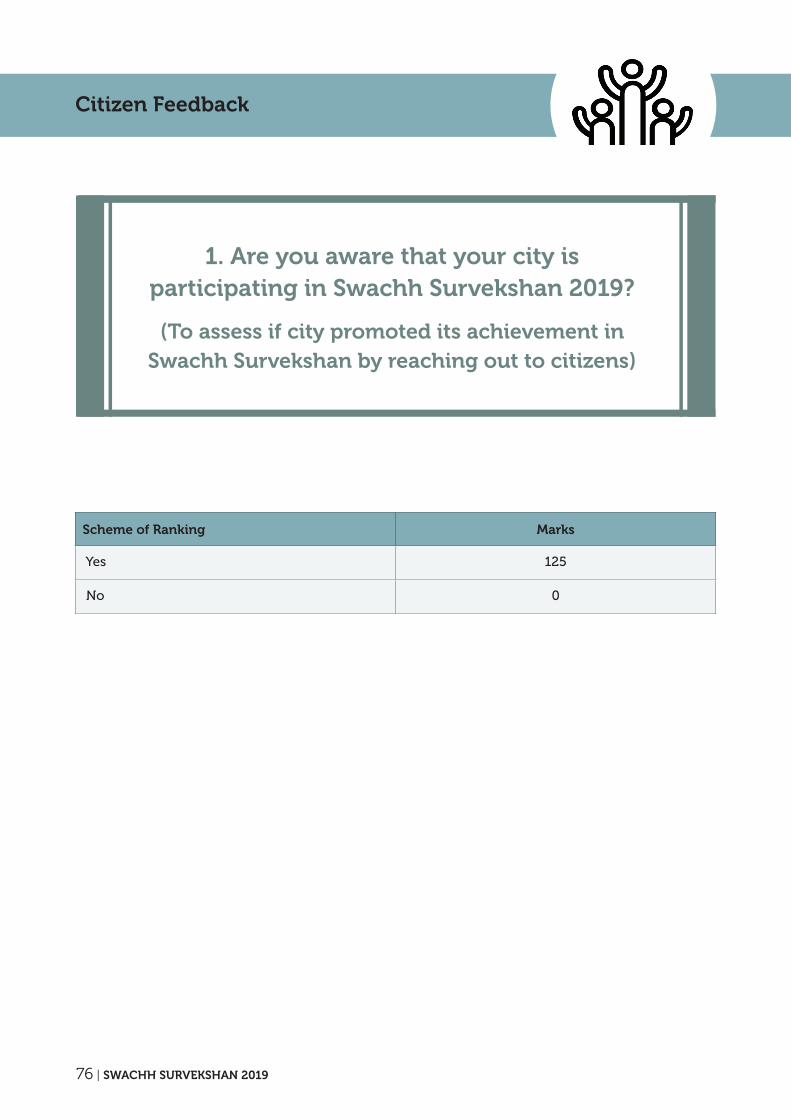
Scheme of Ranking Marks
Yes 125
No 0
1. Are you aware that your city is participating in Swachh Survekshan 2019?
(To assess if city promoted its achievement in Swachh Survekshan by reaching out to citizens)
Citizen Feedback

SWACHH SURVEKSHAN 2019 | 77
Citizen Feedback
Scheme of Ranking Marks
Yes - very clean or no complaints 125
Not really - but better than last year 100
No change – status quo 50
No, worse than last year 0
2. Are you satisfied with the cleanliness level in your city?
(To assess if citizens feel the visible improvement in cleanliness)
78 | SWACHH SURVEKSHAN 2019
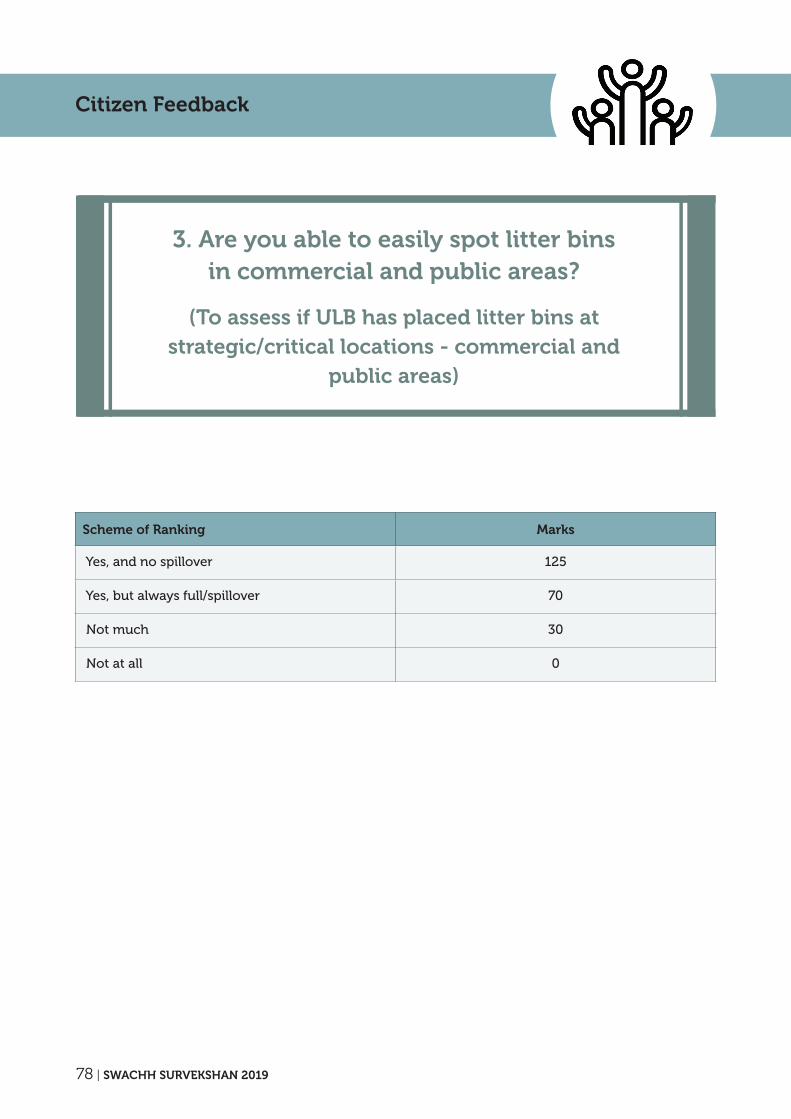
Scheme of Ranking Marks
Yes, and no spillover 125
Yes, but always full/spillover 70
Not much 30
Not at all 0
3. Are you able to easily spot litter bins in commercial and public areas?
(To assess if ULB has placed litter bins at strategic/critical locations - commercial and
public areas)
Citizen Feedback
SWACHH SURVEKSHAN 2019 | 79
Citizen Feedback
Scheme of Ranking Marks
Yes 125
No 0
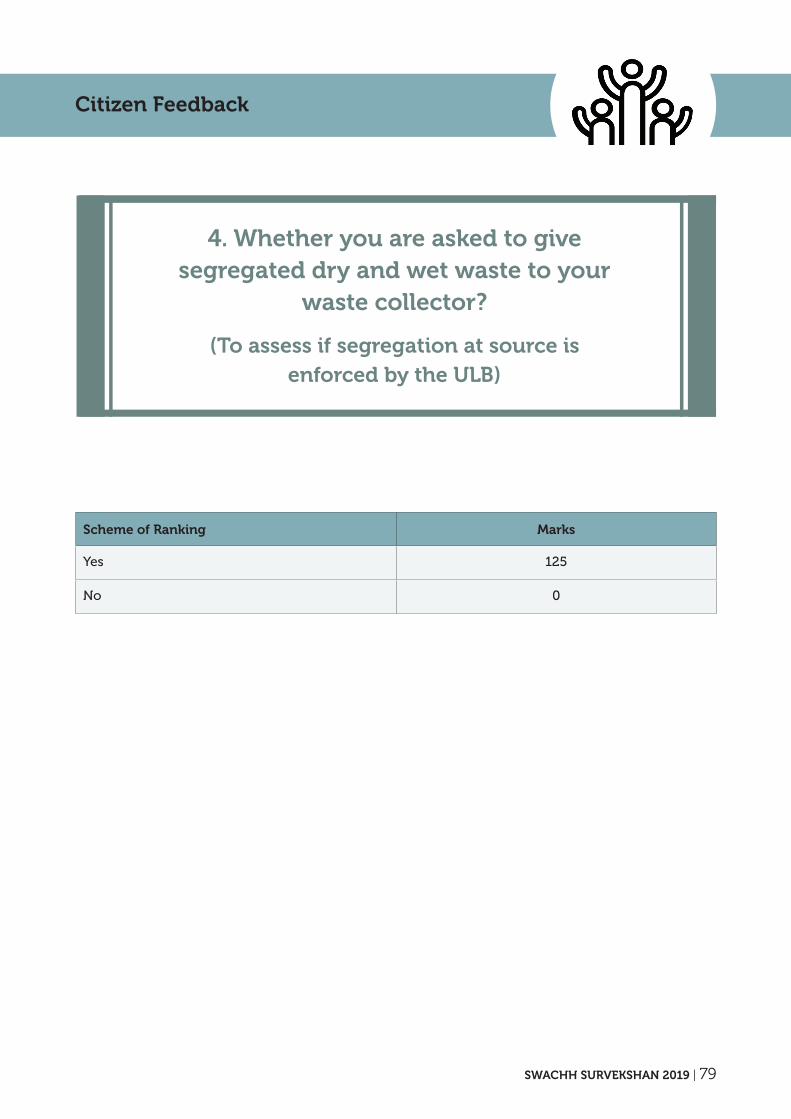
4. Whether you are asked to give segregated dry and wet waste to your
waste collector?
(To assess if segregation at source is enforced by the ULB)
80 | SWACHH SURVEKSHAN 2019
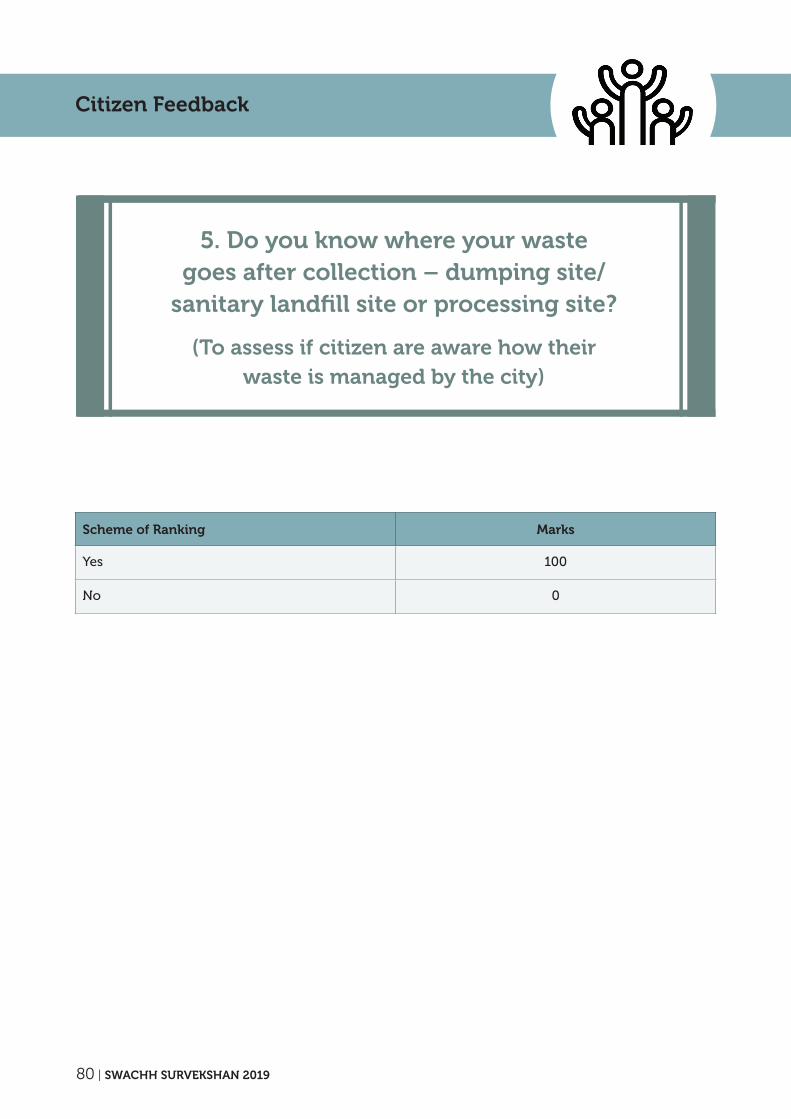
Scheme of Ranking Marks
Yes 100
No 0
5. Do you know where your waste goes after collection – dumping site/
sanitary landfill site or processing site?
(To assess if citizen are aware how their waste is managed by the city)
Citizen Feedback

SWACHH SURVEKSHAN 2019 | 81
Citizen Feedback
Scheme of Ranking Marks
Yes 125
No 0
6. Do you find urinals/toilets are accessible and clean now
(To assess if citizens are accessible to clean urinals/toilets in public places)
82 | SWACHH SURVEKSHAN 2019
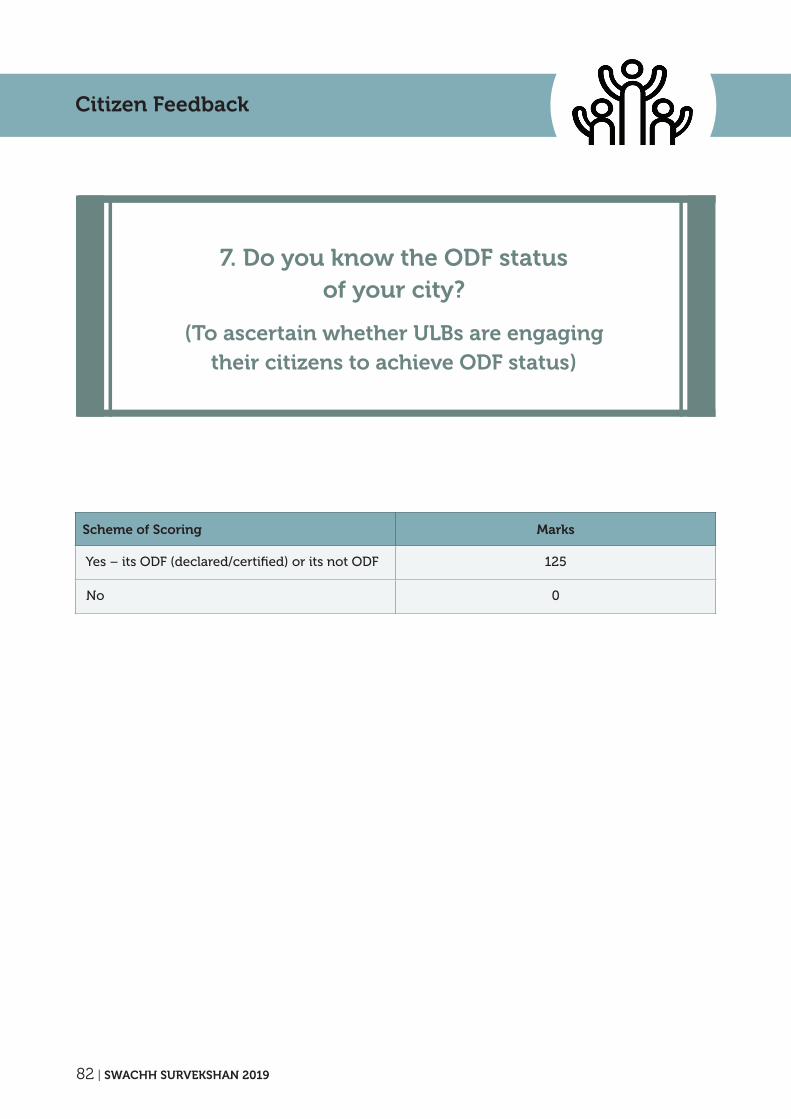
Scheme of Scoring Marks
Yes – its ODF (declared/certified) or its not ODF 125
No 0
7. Do you know the oDF status of your city?
(To ascertain whether ULBs are engaging their citizens to achieve oDF status)
Citizen Feedback
SWACHH SURVEKSHAN 2019 | 83
Citizen Feedback
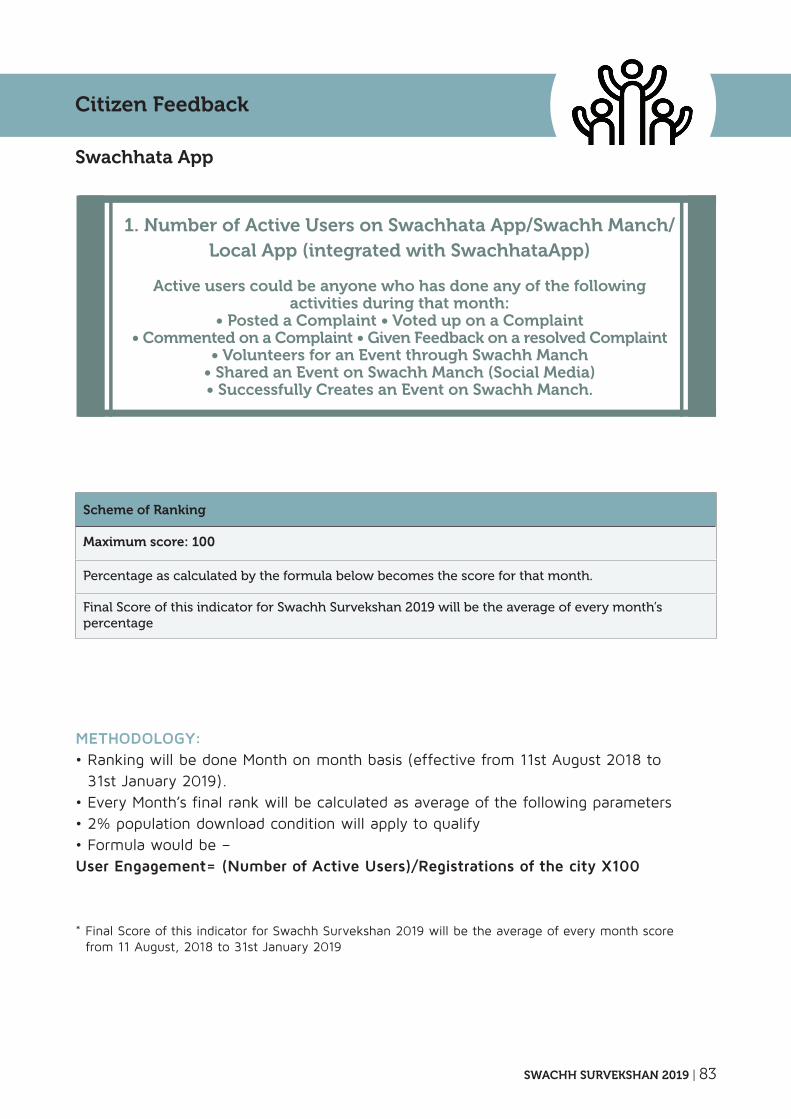
Swachhata App
Scheme of Ranking
Maximum score: 100
Percentage as calculated by the formula below becomes the score for that month.
Final Score of this indicator for Swachh Survekshan 2019 will be the average of every month’s percentage
1. Number of Active Users on Swachhata App/Swachh Manch/Local App (integrated with SwachhataApp)
Active users could be anyone who has done any of the following activities during that month:
• Posted a Complaint • Voted up on a Complaint• Commented on a Complaint • Given Feedback on a resolved Complaint
• Volunteers for an Event through Swachh Manch• Shared an Event on Swachh Manch (Social Media)• Successfully Creates an Event on Swachh Manch.
MetHodology:• Ranking will be done Month on month basis (effective from 11st August 2018 to
31st January 2019).• Every Month’s final rank will be calculated as average of the following parameters• 2% population download condition will apply to qualify• Formula would be –User Engagement= (Number of Active Users)/Registrations of the city X100
* Final Score of this indicator for Swachh Survekshan 2019 will be the average of every month score from 11 August, 2018 to 31st January 2019
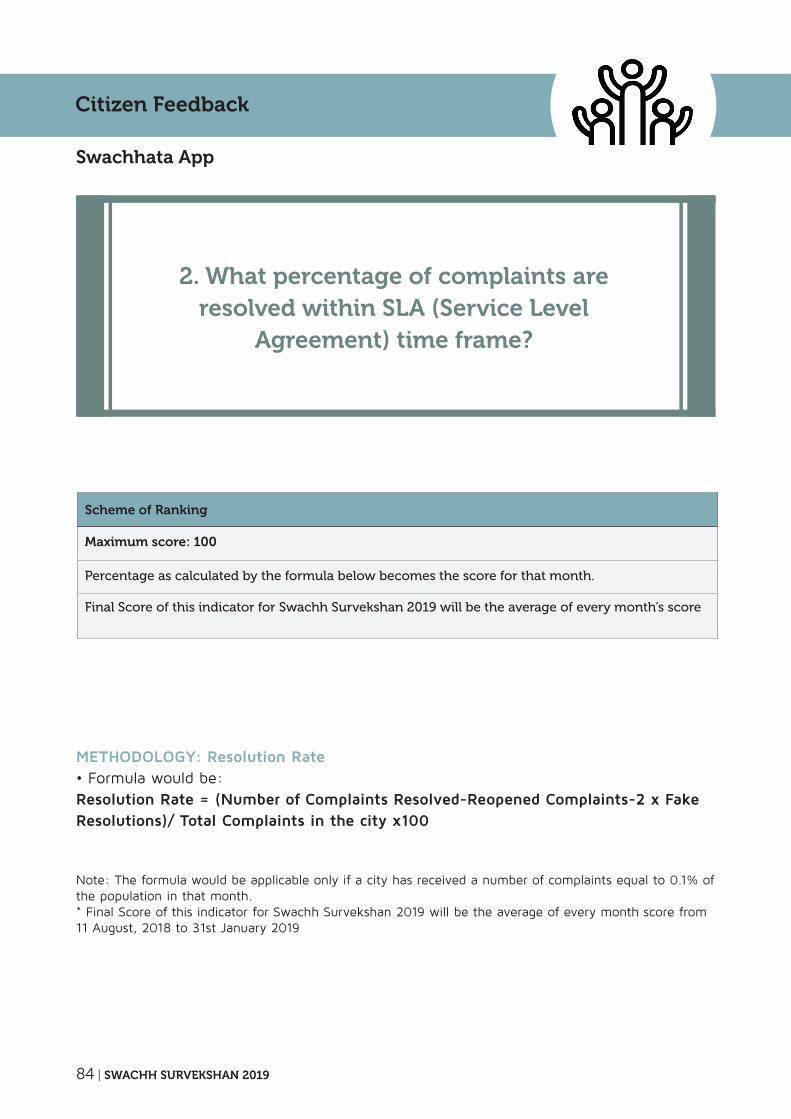
84 | SWACHH SURVEKSHAN 2019
Swachhata App
2. What percentage of complaints are resolved within SLA (Service Level
Agreement) time frame?
Citizen Feedback
MetHodology: resolution rate• Formula would be:resolution rate = (number of Complaints resolved-reopened Complaints-2 x Fake Resolutions)/ total Complaints in the city x100
Note: The formula would be applicable only if a city has received a number of complaints equal to 0.1% of the population in that month.* Final Score of this indicator for Swachh Survekshan 2019 will be the average of every month score from 11 August, 2018 to 31st January 2019
Scheme of Ranking
Maximum score: 100
Percentage as calculated by the formula below becomes the score for that month.
Final Score of this indicator for Swachh Survekshan 2019 will be the average of every month’s score
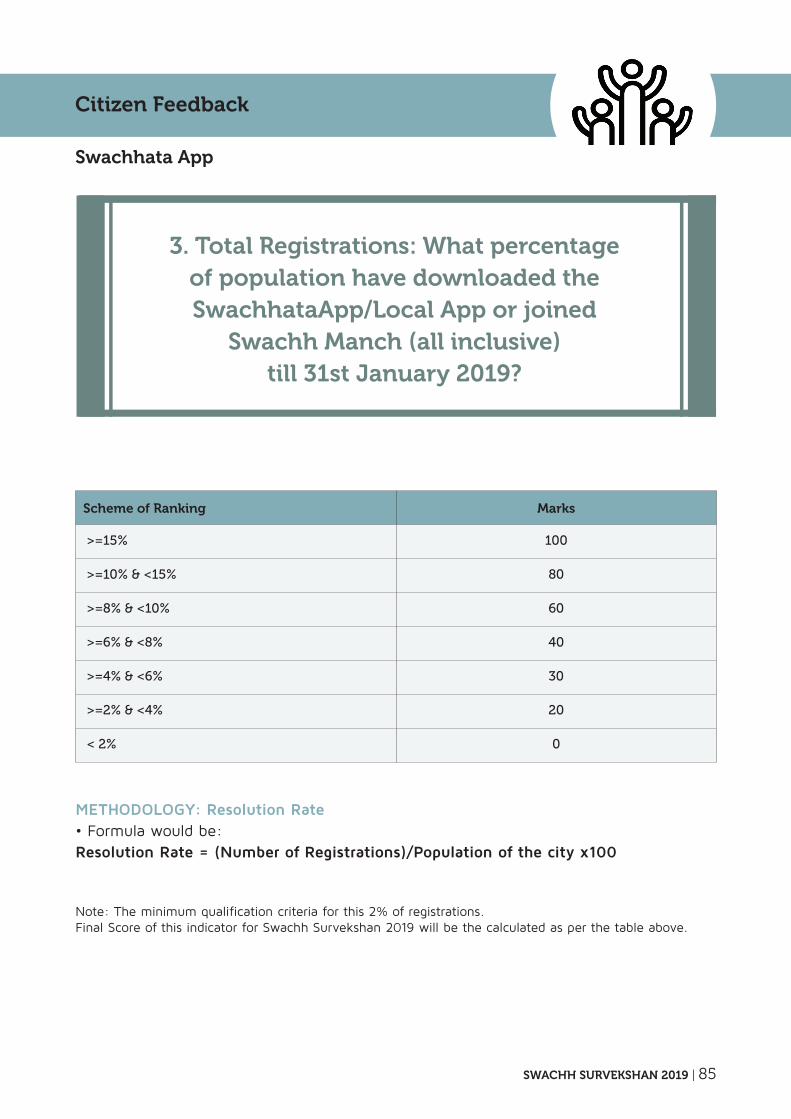
SWACHH SURVEKSHAN 2019 | 85
Citizen Feedback
Scheme of Ranking Marks
>=15% 100
>=10% & <15% 80
>=8% & <10% 60
>=6% & <8% 40
>=4% & <6% 30
>=2% & <4% 20
< 2% 0
3. Total Registrations: What percentage of population have downloaded the SwachhataApp/Local App or joined
Swachh Manch (all inclusive) till 31st January 2019?
MetHodology: resolution rate• Formula would be:Resolution Rate = (Number of Registrations)/Population of the city x100
Note: The minimum qualification criteria for this 2% of registrations.Final Score of this indicator for Swachh Survekshan 2019 will be the calculated as per the table above.
Swachhata App
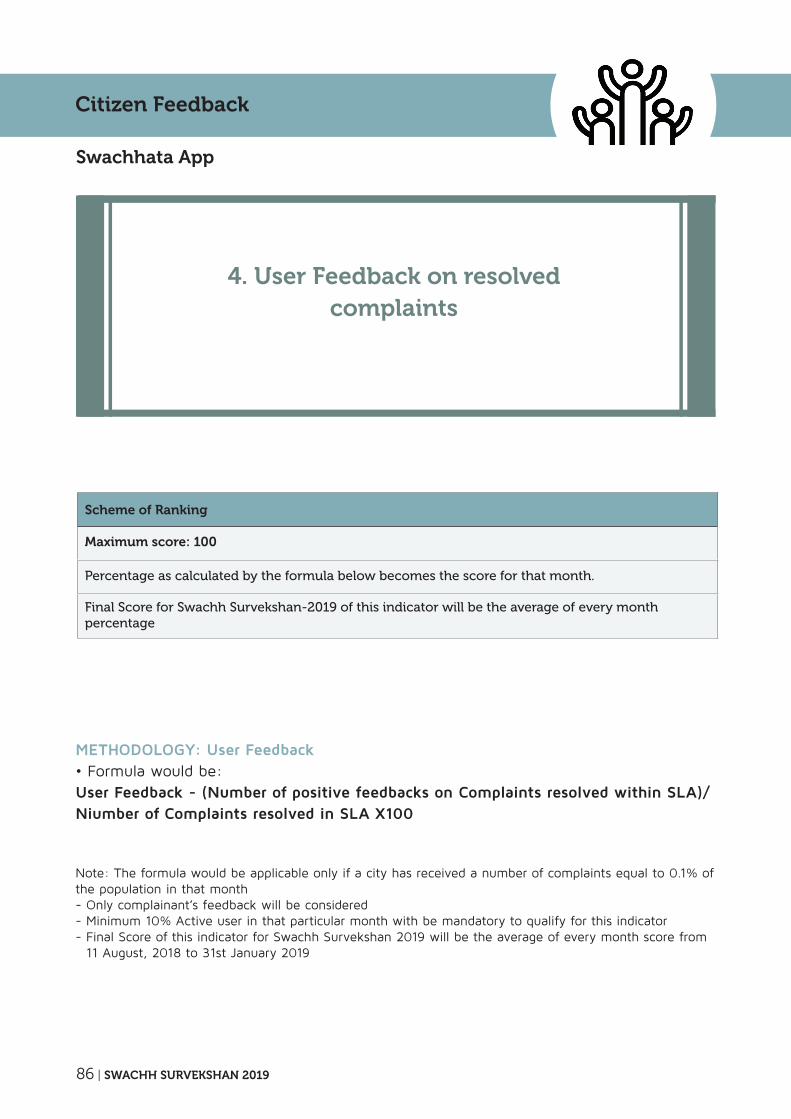
86 | SWACHH SURVEKSHAN 2019
4. User Feedback on resolved complaints
Citizen Feedback
MetHodology: user Feedback• Formula would be:User Feedback - (Number of positive feedbacks on Complaints resolved within SlA)/ Niumber of Complaints resolved in SlA X100
Note: The formula would be applicable only if a city has received a number of complaints equal to 0.1% of the population in that month- Only complainant’s feedback will be considered- Minimum 10% Active user in that particular month with be mandatory to qualify for this indicator- Final Score of this indicator for Swachh Survekshan 2019 will be the average of every month score from
11 August, 2018 to 31st January 2019
Swachhata App
Scheme of Ranking
Maximum score: 100
Percentage as calculated by the formula below becomes the score for that month.
Final Score for Swachh Survekshan-2019 of this indicator will be the average of every month percentage