Embed Size (px)
Citation preview
2013Malcolm BaldrigeNational Quality Award Application
Sutter Davis Hospital
Sutter Davis Hospital 2000 Sutter Place Davis, CA 95616 (530) 757-5108
Sutter Davis Hospital
Table of Contents Glossary of Terms and Abbreviations……………………………………………………………………………………………G1
Organizational Profile ……………..………………………………………………………………………………………………. i
Responses to all Criteria Items
Category 1: Leadership ………………………………………………………………………………………………………. 1
1.1 Senior Leadership ……………………………………………………………………………………………………….1
1.2 Governance and Societal Responsibilities …………………………………………………………………………….6
Category 2: Strategic Planning ……………………………………………………………………………………………… 8
2.1 Strategy Development ………………………………………………………………………………………………….8
2.2 Strategy Implementation……………………………………………………………………………………………….11
Category 3: Customer Focus ……………………………………..…………………………………………………………. 13
3.1 Voice of the Customer …………………………………………………………………………………………………13
3.2 Customer Engagement ………………………………………………………………………………………………...15
Category 4: Measurement, Analysis, and Knowledge Management …………………………………………………….. 18
4.1 Measurement, Analysis, and Improvement of Organizational Performance …………………………………………18
4.2 Management of Information, Knowledge, and Information Technology ……………………………………………..19
Category 5: Workforce Focus ……………………………………………………………………………………………… 21
5.1 Workforce Environment ………………………………………………………………………………………………21
5.2 Workforce Engagement ……………………………………………………………………………………………….23
Category 6: Operations Focus …...…………………………………………………………………………………………. 25
6.1 Work Processes ………………………………………………………………………………………………………..25
6.2 Operational Effectiveness ……………………………………………………………………………………………..28
Category 7: Results ………………………………………………………………………………………………………….. 30
7.1 Health Care and Process Outcomes ………………………………………………………………………………….30
7.2 Customer-Focused Outcomes …………………………………………………………………………………………36
7.3 Workforce-Focused Outcomes ……………………………………………………………………………………….39
7.4 Leadership and Governance Outcomes ……………………………………………………………………………….44
7.5 Financial and Market Outcomes ………………………………………………………………………………………47
Sutter Davis Hospital
G-1
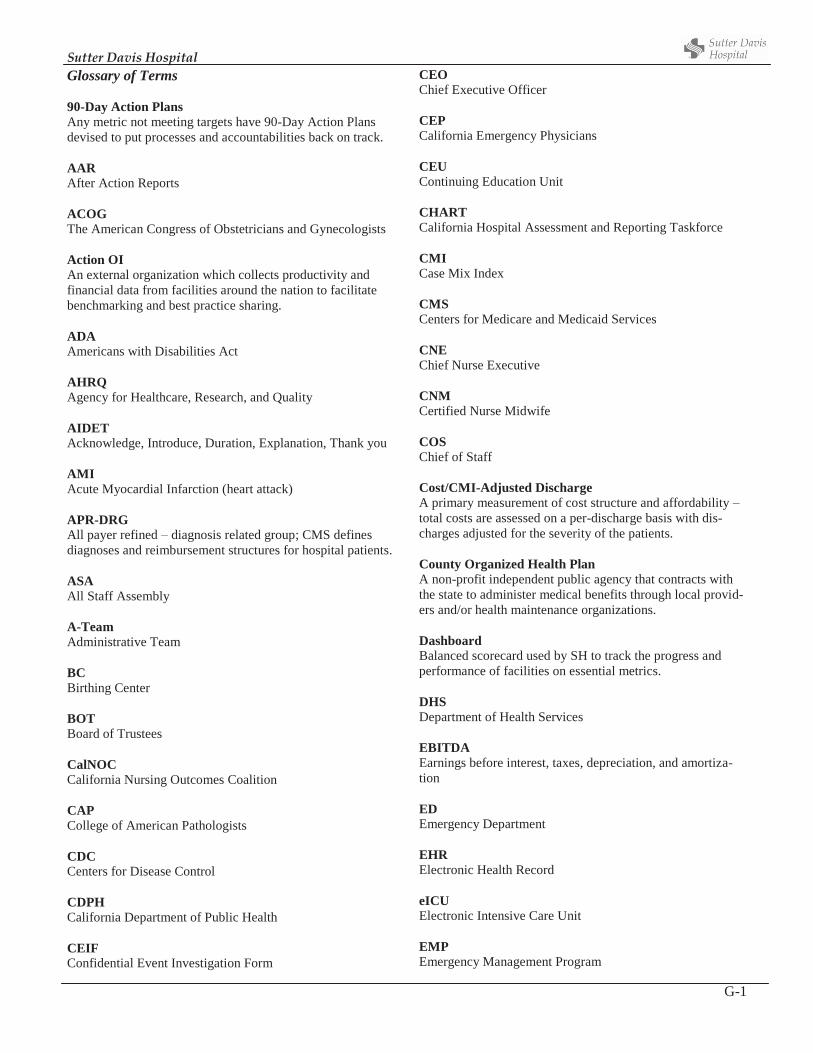
Glossary of Terms 90-Day Action Plans Any metric not meeting targets have 90-Day Action Plans devised to put processes and accountabilities back on track. AAR After Action Reports ACOG The American Congress of Obstetricians and Gynecologists Action OI An external organization which collects productivity and financial data from facilities around the nation to facilitate benchmarking and best practice sharing. ADA Americans with Disabilities Act AHRQ Agency for Healthcare, Research, and Quality AIDET Acknowledge, Introduce, Duration, Explanation, Thank you AMI Acute Myocardial Infarction (heart attack) APR-DRG All payer refined – diagnosis related group; CMS defines diagnoses and reimbursement structures for hospital patients. ASA All Staff Assembly A-Team Administrative Team BC Birthing Center BOT Board of Trustees CalNOC California Nursing Outcomes Coalition CAP College of American Pathologists CDC Centers for Disease Control CDPH California Department of Public Health CEIF Confidential Event Investigation Form
CEO Chief Executive Officer CEP California Emergency Physicians CEU Continuing Education Unit CHART California Hospital Assessment and Reporting Taskforce CMI Case Mix Index CMS Centers for Medicare and Medicaid Services CNE Chief Nurse Executive CNM Certified Nurse Midwife COS Chief of Staff Cost/CMI-Adjusted Discharge A primary measurement of cost structure and affordability – total costs are assessed on a per-discharge basis with dis-charges adjusted for the severity of the patients. County Organized Health Plan A non-profit independent public agency that contracts with the state to administer medical benefits through local provid-ers and/or health maintenance organizations. Dashboard Balanced scorecard used by SH to track the progress and performance of facilities on essential metrics. DHS Department of Health Services EBITDA Earnings before interest, taxes, depreciation, and amortiza-tion ED Emergency Department EHR Electronic Health Record eICU Electronic Intensive Care Unit EMP Emergency Management Program
Sutter Davis Hospital
G-2
EOC Environment of Care EVS Environmental Services – housekeeping department HAC CMS Hospital Acquired Condition HCAHPS Hospital Consumer Assessment of Healthcare Provider and Systems HF Heart failure HICS Hospital Incident Command System HML High, medium, low – one of the primary tools used by man-agers to give job performance feedback to employees. HVA Hazard Vulnerability Analysis IPC Interdisciplinary Practice Councils IS Information Systems ISMP Institute for Safe Medication Practices Joint A-Team A combination of the administrative (senior leader) teams of SDH, SMG, and SMF. LDI Leadership Development Institute LWOBS Left Without Being Seen MCE Management and Clinical Excellence – a leadership devel-opment course focusing on process improvement and meas-urement MEC Medical Executive Committee MIDAS Software used for tracking, trending patient quality of care data MOU Memorandum of Understanding
MPC Medical Policy Committee MVV Mission, Vision, Values NACRS National Ambulatory Care Reporting System NLI New Leaders Intensive OFI Opportunity for Improvement OSHA Occupational Safety and Health Administration OSHPD Office of Statewide Hospital Planning & Development (CA) PACS Picture archival computer system PACU Post Anesthesia Care Unit Partnership Health plan County Organized Health Plan provider in Yolo County. PDSA Plan, Do, Study, Act PG Press-Ganey PI Physician Performance Improvement – peer review physician committee Pillars of Excellence Sutter Health and Sutter Davis Hospital focus on the five Pillars of Excellence: Quality, Service, Finance, Growth, and People. PIIT Crew Process Improvement and Innovation Team PMS Performance Management System PNE Pneumonia POP Pulse on the Pillars, a weekly meeting of A-Team and man-agement discussing patient satisfaction and brief overviews of each Pillar.
Sutter Davis Hospital
G-3
Product Review Committee An interdisciplinary team that reviews new products and product quality. PSR Patient Safety Record PT Physical therapy PTSV Primary Term Singleton Vertex RCA Root Cause Analysis ROI Return on Investment RT Respiratory Therapy SBP State Board of Pharmacy SCIP Surgical Care Improvement Project SDD The Sutter Davis Difference. The culture of caring at SDH, defined as our culture of outstanding care to our patients, families, and each other. SDH Sutter Davis Hospital SH Sutter Health SharePoint Online collaboration sites used by various groups and teams to share information quickly SHEW Sutter Health enterprise warehouse SHSSR Sutter Health Sacramento-Sierra Region SHU Sutter Health University SL Senior Leaders SMART Objective A process improvement target that is Specific, Measureable, Attainable, Relevant, and Time-bound.
SMG Sutter Medical Group SMT System Management Team SS Surgical Services Staff/Employees RN/Non-RN Work Segments Standards of Behavior Developed by front line staff, the Standards of Behavior out-line the importance of personal accountability, attitude, cour-tesy, caring, communication, and teamwork. SWOT Strength Weaknesses Opportunities and Threats TAT Turnaround Time TJC The Joint Commission Turtle Times Weekly poster showing segmented patient satisfaction data, and positive comments from patients. Turtle Transparency Website SharePoint website that all staff have access to view, giving transparency to Dashboards, Department Profiles, PIT Crew, best practices, and action plans. Value Analysis Team An interdisciplinary team monitors compliance. VBA Value Based Purchasing Vendor Credentialing Services Internet-based software which tracks vendor and supplier compliance. VOC Voice of the Customer VOW Voice of the Workforce WI Wage Index Workforce RN, Non-RN, Physician, and Volunteer work segments
Sutter Davis Hospital
i
CAPE AwardGold Level
ThomsonReuters Top100 Hospital
Truven HealthAnalytics 100Top HospitalCAPE AwardGold LevelMalcolm
Baldrige SiteVisit
CA Governor’s Award for
PerformanceExcellence
CHARTCertificate ofExcellence
Farmers MarketLifelong
Wellness Award
U.S. CongressCertificate of
SpecialCongressionalRecognition
CHARTCertificate ofExcellence
WHO BabyFriendly
Designation
Yolo CountyBoard of
SupervisorsRecognition
ACOG one oftwo nationalwinners for
publication onCollaborative
MaternityPractice
Excellence inHealthcareLeadershipAward from
VHA
SH BestDashboard
PatientSatisfaction
ModernHealthcare BestPlace to Work
Press GaneyPhysicians
Best Place toPractice
Studer GroupFire Starter
Organization ofthe Month
SH BestDashboard
PatientSatisfaction
SH President’s Award for TopPerformance in
PatientSatisfaction
SH President’s Award for TopPerformance in
Quality
TJC TopPerformer onKey QualityMeasures
ModernHealthcare
Best Place toWork
Leapfrog Survey“A” Grade
OutstandingPatient
ExperienceAward Health
Grades forObstetrics
Best Hospital forPatient
Experience byWomen Certified
SH President’s Award forOverall
Performance
Studer GroupFire Starter
Award
SH President’s Award for
OverallPerormance
SH BestDashboard
PatientSatisfaction
2007
SH BestDashboard
Clinical Quality
CHARTCertificate ofExcellence
2008
CHARTCertificate ofExcellence
2009 2010 2011
CAPE AwardBronze Level
CAPE AwardBronze Level
CAPE AwardGold Level
WHO BabyFriendly
Designation
WHO BabyFriendly
Designation
WHO BabyFriendly
Designation
SH BestDashboard
Clinical Quality
SH BestDashboardAffordability SH Best
DashboardPatient
Satisfaction
SWEL BestPlaces to Work
ModernHealthcare BestPlace to Work
ModernHealthcare BestPlace to Work
Press GaneyPhysicians Best
Place toPractice
Press GaneyPhysicians Best
Place toPractice
California TaskForce on Youthand WorkplaceWellness Award
SacramentoMagazine Best"Best Hot Tub"(Birthing Tubs)
ED Press-Ganey
Excellence inPatient Care
Award
Figure P.1-1 – SDH Awards and Recognitions
SH BestDashboard
PatientSatisfaction
2012
SH BestDashboardAffordability
ThomsonReuters Top100 Hospital
SH BestDashboard
Clinical Quality
SH BestDashboardAffordability
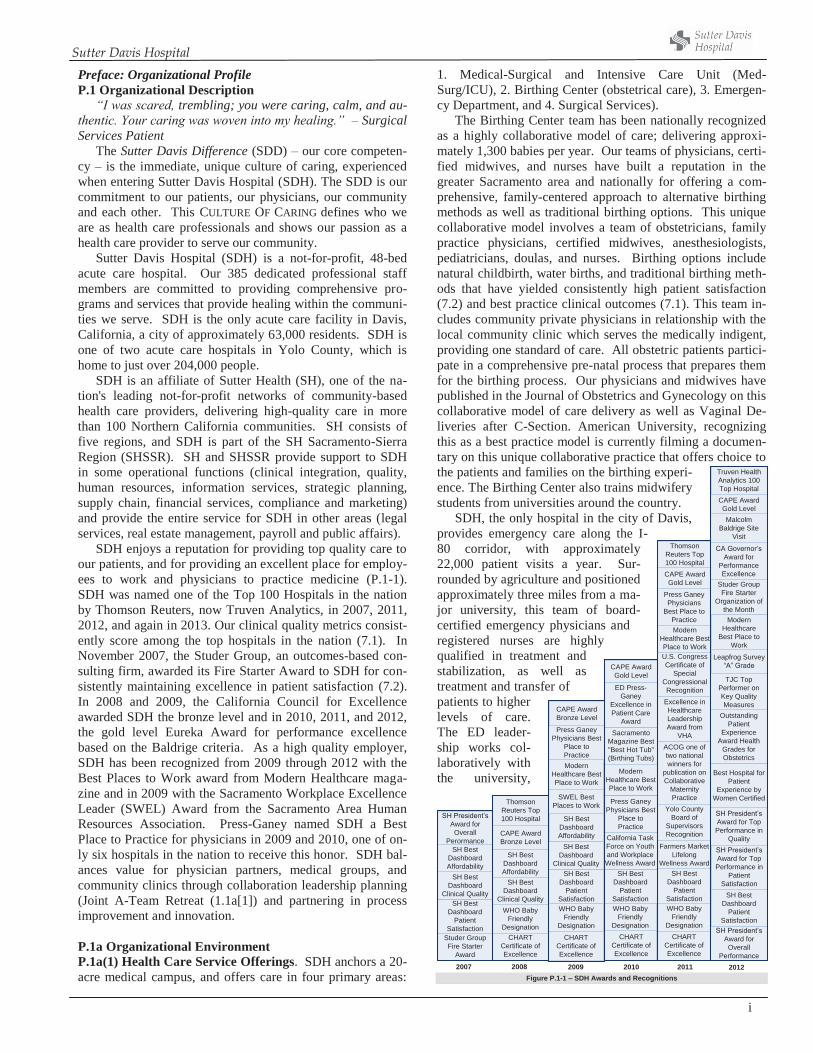
Preface: Organizational Profile P.1 Organizational Description “I was scared, trembling; you were caring, calm, and au-thentic. Your caring was woven into my healing.” – Surgical Services Patient The Sutter Davis Difference (SDD) – our core competen-cy – is the immediate, unique culture of caring, experienced when entering Sutter Davis Hospital (SDH). The SDD is our commitment to our patients, our physicians, our community and each other. This CULTURE OF CARING defines who we are as health care professionals and shows our passion as a health care provider to serve our community. Sutter Davis Hospital (SDH) is a not-for-profit, 48-bed acute care hospital. Our 385 dedicated professional staff members are committed to providing comprehensive pro-grams and services that provide healing within the communi-ties we serve. SDH is the only acute care facility in Davis, California, a city of approximately 63,000 residents. SDH is one of two acute care hospitals in Yolo County, which is home to just over 204,000 people. SDH is an affiliate of Sutter Health (SH), one of the na-tion's leading not-for-profit networks of community-based health care providers, delivering high-quality care in more than 100 Northern California communities. SH consists of five regions, and SDH is part of the SH Sacramento-Sierra Region (SHSSR). SH and SHSSR provide support to SDH in some operational functions (clinical integration, quality, human resources, information services, strategic planning, supply chain, financial services, compliance and marketing) and provide the entire service for SDH in other areas (legal services, real estate management, payroll and public affairs). SDH enjoys a reputation for providing top quality care to our patients, and for providing an excellent place for employ-ees to work and physicians to practice medicine (P.1-1). SDH was named one of the Top 100 Hospitals in the nation by Thomson Reuters, now Truven Analytics, in 2007, 2011, 2012, and again in 2013. Our clinical quality metrics consist-ently score among the top hospitals in the nation (7.1). In November 2007, the Studer Group, an outcomes-based con-sulting firm, awarded its Fire Starter Award to SDH for con-sistently maintaining excellence in patient satisfaction (7.2). In 2008 and 2009, the California Council for Excellence awarded SDH the bronze level and in 2010, 2011, and 2012, the gold level Eureka Award for performance excellence based on the Baldrige criteria. As a high quality employer, SDH has been recognized from 2009 through 2012 with the Best Places to Work award from Modern Healthcare maga-zine and in 2009 with the Sacramento Workplace Excellence Leader (SWEL) Award from the Sacramento Area Human Resources Association. Press-Ganey named SDH a Best Place to Practice for physicians in 2009 and 2010, one of on-ly six hospitals in the nation to receive this honor. SDH bal-ances value for physician partners, medical groups, and community clinics through collaboration leadership planning (Joint A-Team Retreat (1.1a[1]) and partnering in process improvement and innovation. P.1a Organizational Environment P.1a(1) Health Care Service Offerings. SDH anchors a 20-acre medical campus, and offers care in four primary areas:
1. Medical-Surgical and Intensive Care Unit (Med-Surg/ICU), 2. Birthing Center (obstetrical care), 3. Emergen-cy Department, and 4. Surgical Services). The Birthing Center team has been nationally recognized as a highly collaborative model of care; delivering approxi-mately 1,300 babies per year. Our teams of physicians, certi-fied midwives, and nurses have built a reputation in the greater Sacramento area and nationally for offering a com-prehensive, family-centered approach to alternative birthing methods as well as traditional birthing options. This unique collaborative model involves a team of obstetricians, family practice physicians, certified midwives, anesthesiologists, pediatricians, doulas, and nurses. Birthing options include natural childbirth, water births, and traditional birthing meth-ods that have yielded consistently high patient satisfaction (7.2) and best practice clinical outcomes (7.1). This team in-cludes community private physicians in relationship with the local community clinic which serves the medically indigent, providing one standard of care. All obstetric patients partici-pate in a comprehensive pre-natal process that prepares them for the birthing process. Our physicians and midwives have published in the Journal of Obstetrics and Gynecology on this collaborative model of care delivery as well as Vaginal De-liveries after C-Section. American University, recognizing this as a best practice model is currently filming a documen-tary on this unique collaborative practice that offers choice to the patients and families on the birthing experi-ence. The Birthing Center also trains midwifery students from universities around the country. SDH, the only hospital in the city of Davis, provides emergency care along the I-80 corridor, with approximately 22,000 patient visits a year. Sur-rounded by agriculture and positioned approximately three miles from a ma-jor university, this team of board-certified emergency physicians and registered nurses are highly qualified in treatment and stabilization, as well as treatment and transfer of patients to higher levels of care. The ED leader-ship works col-laboratively with the university,
Sutter Davis Hospital
ii
community clinics, and the county. Our hospital is a Joint Commission certified stroke center (7.1-5). The Ambulatory Surgery department pro-vides primary backup to the ED for surgical emergencies, in addition to providing both same-day surgery and inpatient complex cases.
Another unique competitive ad-vantage SDH has in the inpatient are-na is our Electronic ICU (eICU). The eICU offers the ICU staff immediate access to critical care physicians. Sut-ter was the first system on the west coast to implement the eICU. This innovative technology provides the ICU staff and patients with continuous oversight, clinical support and im-mediate responsiveness to any clinical change in a patient’s status. The eICU physicians are also available for consulta-tion with the nursing staff and local physicians. This elec-tronic system supports our ability to achieve top decile clini-cal results (7.1).
The medical surgical unit has a comprehensive palliative care team which includes a geriatric nurse practitioner, board certified palliative care physician, social worker, case man-ger, dietician and Chaplin. This team is available to assist patients and families in chronic disease management and end of life care.
The medical surgical unit and birthing center unit are also the hub of activity for the Family Practice Residents, a teach-ing track emanating from our sister tertiary center in Sacra-mento.
SDH delivers care through a patient and family-centered approach; integrating with our physicians and our community partners is crucial in providing a comprehensive continuum of care for our patients and our community. P.1a(2) Vision and Mission. Our core competency aligns the organizational culture of caring with our MVV (P.1-2). Senior leaders and workforce members continuously renew and reinforce the Sutter Davis Difference throughout the or-ganization in a continuous journey towards our MVV, and everyone is held accountable to safe patient care. This is ac-complished through the STANDARDS OF BEHAVIOR (1.1a[1]), the STANDARDS OF BUSINESS CONDUCT (1.1a[2]), annual ALL STAFF ASSEMBLY (5.2a[2]), quarterly CULTURE OF CAR-ING CLASS (5.2a[2]), and quarterly ROUND-THE-CLOCKS (5.2a[2]). The CULTURE OF CARING also reflects how we care for each other, and is represented in workforce engage-ment processes and results (7.3-11 thru 7.3-20). Leadership
development further builds upon our workforce engagement and our success relative to our competitors (7.3-27). A continuous focus on process improve-ment and innovation through the mech-anisms listed in 6.2-2 creates a contin-uous learning environment.
Uniquely, the symbol of the turtle helps SDH staff identify with the or-ganizational CULTURE OF CARING. Adopting the turtle as a mascot is a way for employees to identify with the qualities symbolic of this enduring
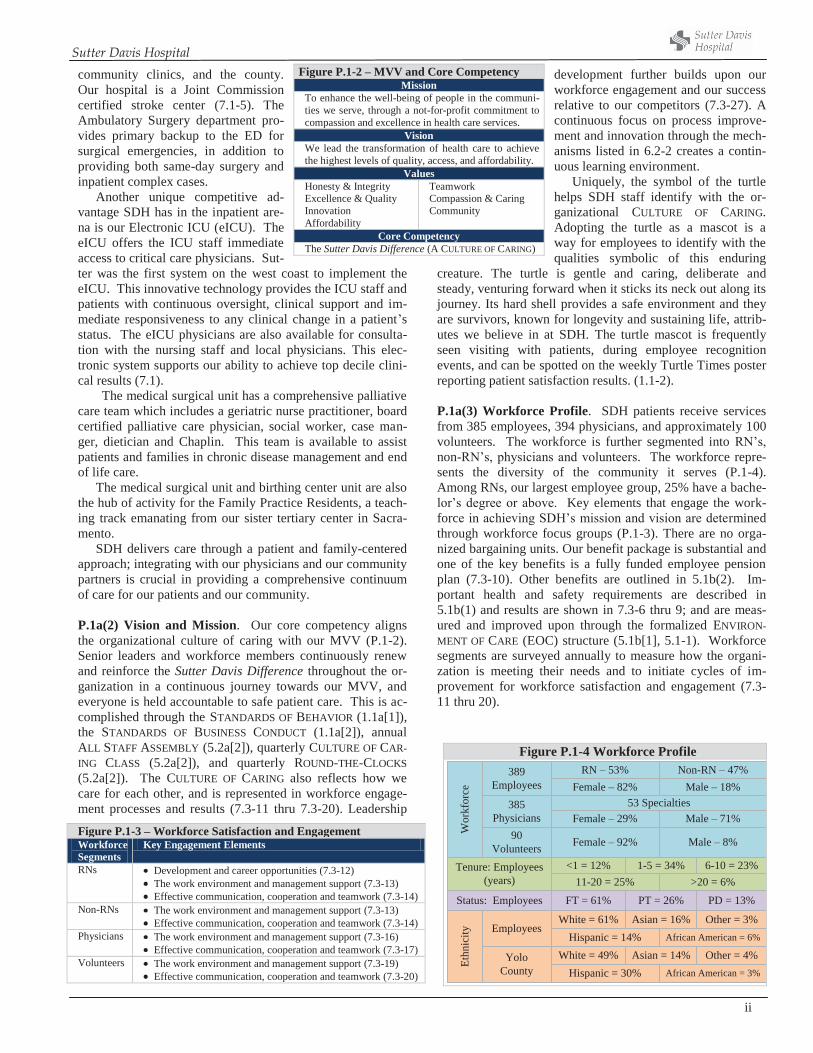
creature. The turtle is gentle and caring, deliberate and steady, venturing forward when it sticks its neck out along its journey. Its hard shell provides a safe environment and they are survivors, known for longevity and sustaining life, attrib-utes we believe in at SDH. The turtle mascot is frequently seen visiting with patients, during employee recognition events, and can be spotted on the weekly Turtle Times poster reporting patient satisfaction results. (1.1-2). P.1a(3) Workforce Profile. SDH patients receive services from 385 employees, 394 physicians, and approximately 100 volunteers. The workforce is further segmented into RN’s, non-RN’s, physicians and volunteers. The workforce repre-sents the diversity of the community it serves (P.1-4). Among RNs, our largest employee group, 25% have a bache-lor’s degree or above. Key elements that engage the work-force in achieving SDH’s mission and vision are determined through workforce focus groups (P.1-3). There are no orga-nized bargaining units. Our benefit package is substantial and one of the key benefits is a fully funded employee pension plan (7.3-10). Other benefits are outlined in 5.1b(2). Im-portant health and safety requirements are described in 5.1b(1) and results are shown in 7.3-6 thru 9; and are meas-ured and improved upon through the formalized ENVIRON-MENT OF CARE (EOC) structure (5.1b[1], 5.1-1). Workforce segments are surveyed annually to measure how the organi-zation is meeting their needs and to initiate cycles of im-provement for workforce satisfaction and engagement (7.3-11 thru 20).
Figure P.1-2 – MVV and Core Competency Mission
To enhance the well-being of people in the communi-ties we serve, through a not-for-profit commitment to compassion and excellence in health care services.
Vision We lead the transformation of health care to achieve the highest levels of quality, access, and affordability.
Values Honesty & Integrity Excellence & Quality Innovation Affordability
Teamwork Compassion & Caring Community
Core Competency The Sutter Davis Difference (A CULTURE OF CARING)
Figure P.1-4 Workforce Profile
Figure P.1-3 – Workforce Satisfaction and Engagement Workforce Segments
Key Engagement Elements
RNs Development and career opportunities (7.3-12) The work environment and management support (7.3-13) Effective communication, cooperation and teamwork (7.3-14)
Non-RNs The work environment and management support (7.3-13) Effective communication, cooperation and teamwork (7.3-14)
Physicians The work environment and management support (7.3-16) Effective communication, cooperation and teamwork (7.3-17)
Volunteers The work environment and management support (7.3-19) Effective communication, cooperation and teamwork (7.3-20)
385Physicians
Employees
RN – 53%389Employees
Tenure: Employees(years)
90Volunteers
YoloCounty
Wor
kfor
ce
Status: Employees
Ethn
icity
Non-RN – 47%Female – 82% Male – 18%
Female – 29% Male – 71%53 Specialties
Male – 8%Female – 92%
<1 = 12% 1-5 = 34%11-20 = 25%
6-10 = 23%>20 = 6%
FT = 61% PT = 26% PD = 13%
White = 61% Asian = 16%Hispanic = 14% African American = 6%
Other = 3%
White = 49% Asian = 14%Hispanic = 30% African American = 3%
Other = 4%
Sutter Davis Hospital
iii
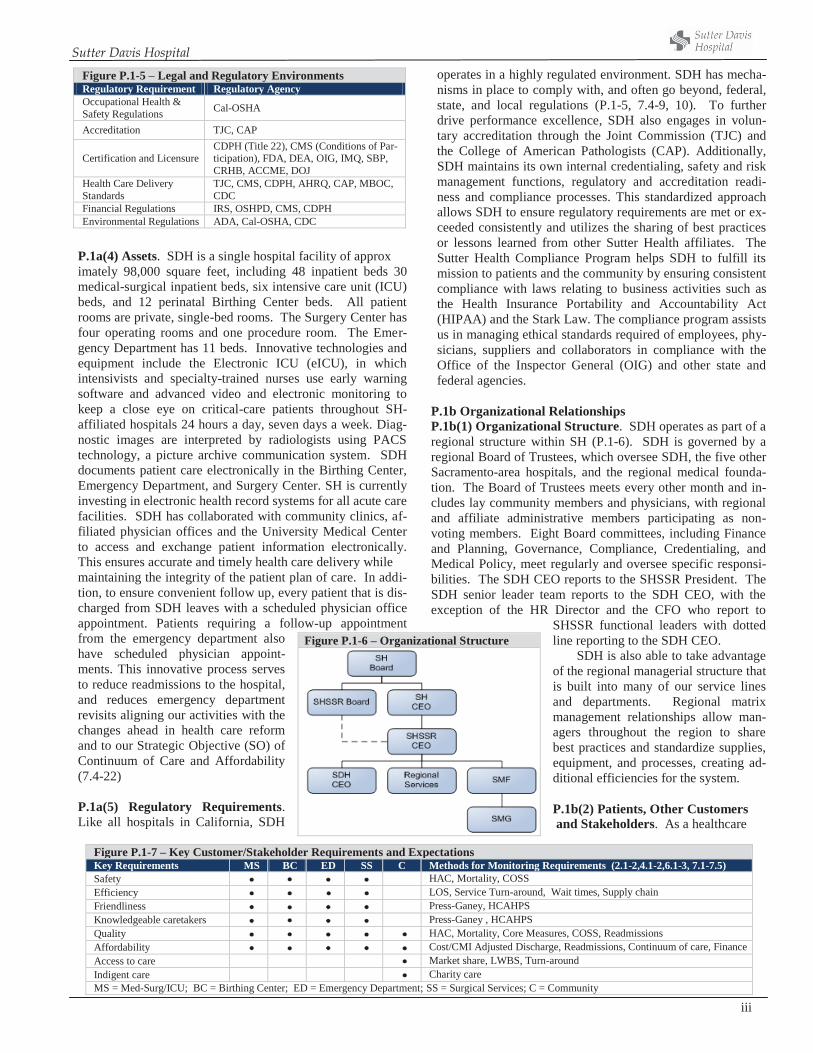
P.1a(4) Assets. SDH is a single hospital facility of approx imately 98,000 square feet, including 48 inpatient beds 30 medical-surgical inpatient beds, six intensive care unit (ICU) beds, and 12 perinatal Birthing Center beds. All patient rooms are private, single-bed rooms. The Surgery Center has four operating rooms and one procedure room. The Emer-gency Department has 11 beds. Innovative technologies and equipment include the Electronic ICU (eICU), in which intensivists and specialty-trained nurses use early warning software and advanced video and electronic monitoring to keep a close eye on critical-care patients throughout SH-affiliated hospitals 24 hours a day, seven days a week. Diag-nostic images are interpreted by radiologists using PACS technology, a picture archive communication system. SDH documents patient care electronically in the Birthing Center, Emergency Department, and Surgery Center. SH is currently investing in electronic health record systems for all acute care facilities. SDH has collaborated with community clinics, af-filiated physician offices and the University Medical Center to access and exchange patient information electronically. This ensures accurate and timely health care delivery while maintaining the integrity of the patient plan of care. In addi-tion, to ensure convenient follow up, every patient that is dis-charged from SDH leaves with a scheduled physician office appointment. Patients requiring a follow-up appointment from the emergency department also have scheduled physician appoint-ments. This innovative process serves to reduce readmissions to the hospital, and reduces emergency department revisits aligning our activities with the changes ahead in health care reform and to our Strategic Objective (SO) of Continuum of Care and Affordability (7.4-22) P.1a(5) Regulatory Requirements. Like all hospitals in California, SDH
operates in a highly regulated environment. SDH has mecha-nisms in place to comply with, and often go beyond, federal, state, and local regulations (P.1-5, 7.4-9, 10). To further drive performance excellence, SDH also engages in volun-tary accreditation through the Joint Commission (TJC) and the College of American Pathologists (CAP). Additionally, SDH maintains its own internal credentialing, safety and risk management functions, regulatory and accreditation readi-ness and compliance processes. This standardized approach allows SDH to ensure regulatory requirements are met or ex-ceeded consistently and utilizes the sharing of best practices or lessons learned from other Sutter Health affiliates. The Sutter Health Compliance Program helps SDH to fulfill its mission to patients and the community by ensuring consistent compliance with laws relating to business activities such as the Health Insurance Portability and Accountability Act (HIPAA) and the Stark Law. The compliance program assists us in managing ethical standards required of employees, phy-sicians, suppliers and collaborators in compliance with the Office of the Inspector General (OIG) and other state and federal agencies.
P.1b Organizational Relationships P.1b(1) Organizational Structure. SDH operates as part of a regional structure within SH (P.1-6). SDH is governed by a regional Board of Trustees, which oversee SDH, the five other Sacramento-area hospitals, and the regional medical founda-tion. The Board of Trustees meets every other month and in-cludes lay community members and physicians, with regional and affiliate administrative members participating as non-voting members. Eight Board committees, including Finance and Planning, Governance, Compliance, Credentialing, and Medical Policy, meet regularly and oversee specific responsi-bilities. The SDH CEO reports to the SHSSR President. The SDH senior leader team reports to the SDH CEO, with the exception of the HR Director and the CFO who report to
SHSSR functional leaders with dotted line reporting to the SDH CEO.
SDH is also able to take advantage of the regional managerial structure that is built into many of our service lines and departments. Regional matrix management relationships allow man-agers throughout the region to share best practices and standardize supplies, equipment, and processes, creating ad-ditional efficiencies for the system. P.1b(2) Patients, Other Customers and Stakeholders. As a healthcare
Figure P.1-5 – Legal and Regulatory EnvironmentsRegulatory Requirement Regulatory Agency Occupational Health & Safety Regulations Cal-OSHA
Accreditation TJC, CAP
Certification and Licensure CDPH (Title 22), CMS (Conditions of Par-ticipation), FDA, DEA, OIG, IMQ, SBP, CRHB, ACCME, DOJ
Health Care Delivery Standards
TJC, CMS, CDPH, AHRQ, CAP, MBOC, CDC
Financial Regulations IRS, OSHPD, CMS, CDPH Environmental Regulations ADA, Cal-OSHA, CDC
Figure P.1-6 – Organizational Structure
Figure P.1-7 – Key Customer/Stakeholder Requirements and Expectations Key Requirements MS BC ED SS C Methods for Monitoring Requirements (2.1-2,4.1-2,6.1-3, 7.1-7.5) Safety HAC, Mortality, COSS Efficiency LOS, Service Turn-around, Wait times, Supply chain Friendliness Press-Ganey, HCAHPS Knowledgeable caretakers Press-Ganey , HCAHPS Quality HAC, Mortality, Core Measures, COSS, Readmissions Affordability Cost/CMI Adjusted Discharge, Readmissions, Continuum of care, Finance Access to care Market share, LWBS, Turn-around Indigent care Charity care MS = Med-Surg/ICU; BC = Birthing Center; ED = Emergency Department; SS = Surgical Services; C = Community
Sutter Davis Hospital
iv
provider, SDH maintains focus on two main health care mar-ket segments: patients and the community. Patients are further segmented into our core service groups: Med-Surg/ICU, Birth-ing Center, Emergency, and Ambulatory Surgery. Key cus-tomer requirements and expectations are outlined in P.1-7, and are determined by our MVV (P.1-2) and are assessed, and improved upon using the Listening, Interacting, and Observa-tion Methods described in 3.1a(1) and 3.1-1. Requirements do not vary across segments.
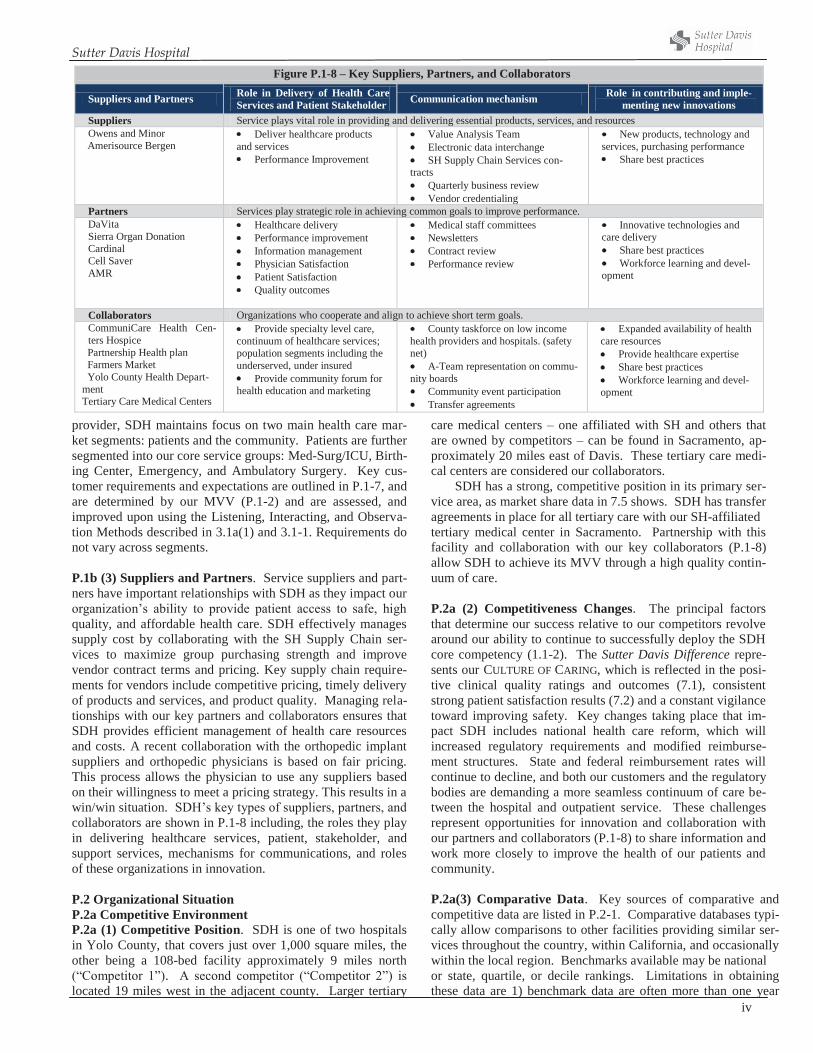
P.1b (3) Suppliers and Partners. Service suppliers and part-ners have important relationships with SDH as they impact our organization’s ability to provide patient access to safe, high quality, and affordable health care. SDH effectively manages supply cost by collaborating with the SH Supply Chain ser-vices to maximize group purchasing strength and improve vendor contract terms and pricing. Key supply chain require-ments for vendors include competitive pricing, timely delivery of products and services, and product quality. Managing rela-tionships with our key partners and collaborators ensures that SDH provides efficient management of health care resources and costs. A recent collaboration with the orthopedic implant suppliers and orthopedic physicians is based on fair pricing. This process allows the physician to use any suppliers based on their willingness to meet a pricing strategy. This results in a win/win situation. SDH’s key types of suppliers, partners, and collaborators are shown in P.1-8 including, the roles they play in delivering healthcare services, patient, stakeholder, and support services, mechanisms for communications, and roles of these organizations in innovation.
P.2 Organizational Situation P.2a Competitive Environment P.2a (1) Competitive Position. SDH is one of two hospitals in Yolo County, that covers just over 1,000 square miles, the other being a 108-bed facility approximately 9 miles north (“Competitor 1”). A second competitor (“Competitor 2”) is located 19 miles west in the adjacent county. Larger tertiary
care medical centers – one affiliated with SH and others that are owned by competitors – can be found in Sacramento, ap-proximately 20 miles east of Davis. These tertiary care medi-cal centers are considered our collaborators.
SDH has a strong, competitive position in its primary ser-vice area, as market share data in 7.5 shows. SDH has transfer agreements in place for all tertiary care with our SH-affiliated tertiary medical center in Sacramento. Partnership with this facility and collaboration with our key collaborators (P.1-8) allow SDH to achieve its MVV through a high quality contin-uum of care. P.2a (2) Competitiveness Changes. The principal factors that determine our success relative to our competitors revolve around our ability to continue to successfully deploy the SDH core competency (1.1-2). The Sutter Davis Difference repre-sents our CULTURE OF CARING, which is reflected in the posi-tive clinical quality ratings and outcomes (7.1), consistent strong patient satisfaction results (7.2) and a constant vigilance toward improving safety. Key changes taking place that im-pact SDH includes national health care reform, which will increased regulatory requirements and modified reimburse-ment structures. State and federal reimbursement rates will continue to decline, and both our customers and the regulatory bodies are demanding a more seamless continuum of care be-tween the hospital and outpatient service. These challenges represent opportunities for innovation and collaboration with our partners and collaborators (P.1-8) to share information and work more closely to improve the health of our patients and community.
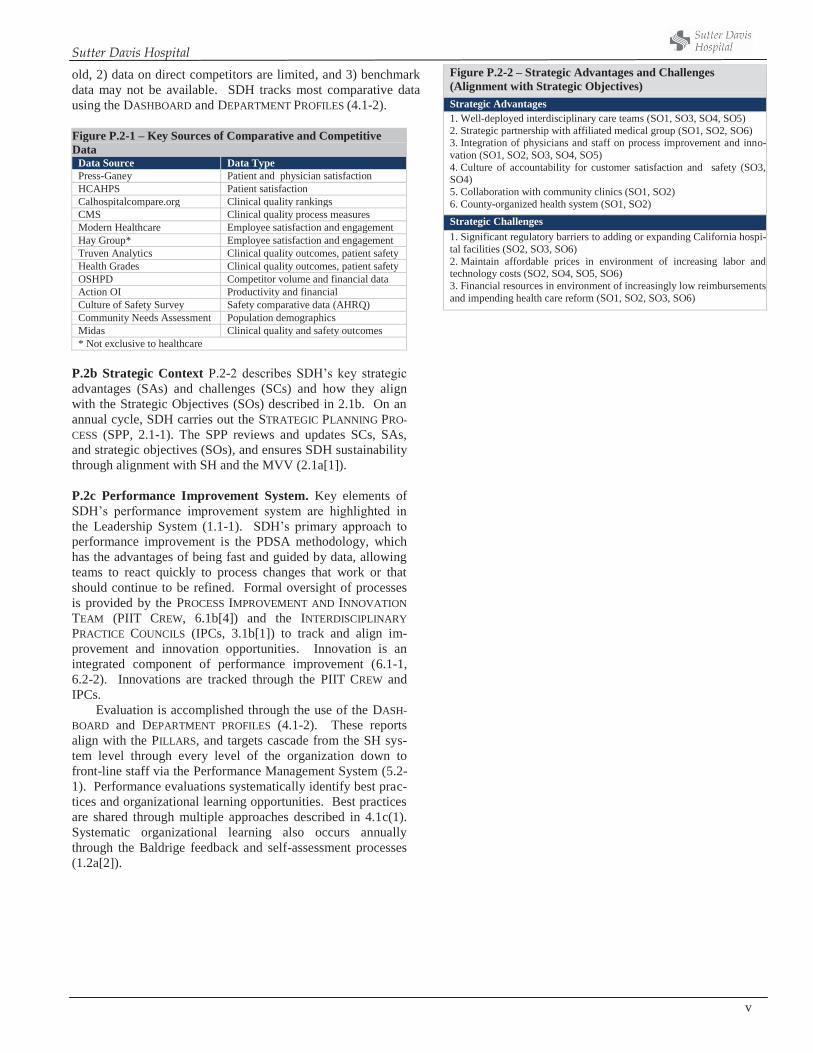
P.2a(3) Comparative Data. Key sources of comparative and competitive data are listed in P.2-1. Comparative databases typi-cally allow comparisons to other facilities providing similar ser-vices throughout the country, within California, and occasionally within the local region. Benchmarks available may be national or state, quartile, or decile rankings. Limitations in obtaining these data are 1) benchmark data are often more than one year
Figure P.1-8 – Key Suppliers, Partners, and Collaborators
Suppliers and Partners Role in Delivery of Health Care Services and Patient Stakeholder Communication mechanism Role in contributing and imple-
menting new innovations Suppliers Service plays vital role in providing and delivering essential products, services, and resources Owens and Minor
Amerisource Bergen Deliver healthcare products
and services Performance Improvement
Value Analysis Team Electronic data interchange SH Supply Chain Services con-
tracts Quarterly business review Vendor credentialing
New products, technology and services, purchasing performance Share best practices
Partners Services play strategic role in achieving common goals to improve performance. DaVita Sierra Organ Donation Cardinal Cell Saver AMR
Healthcare delivery Performance improvement Information management Physician Satisfaction Patient Satisfaction Quality outcomes
Medical staff committees Newsletters Contract review Performance review
Innovative technologies and care delivery Share best practices Workforce learning and devel-
opment
Collaborators Organizations who cooperate and align to achieve short term goals. CommuniCare Health Cen-ters Hospice
Partnership Health plan Farmers Market Yolo County Health Depart-ment Tertiary Care Medical Centers
Provide specialty level care, continuum of healthcare services; population segments including the underserved, under insured Provide community forum for
health education and marketing
County taskforce on low income health providers and hospitals. (safety net) A-Team representation on commu-
nity boards Community event participation Transfer agreements
Expanded availability of health care resources Provide healthcare expertise Share best practices Workforce learning and devel-
opment
Sutter Davis Hospital
v
old, 2) data on direct competitors are limited, and 3) benchmark data may not be available. SDH tracks most comparative data using the DASHBOARD and DEPARTMENT PROFILES (4.1-2). Figure P.2-1 – Key Sources of Comparative and Competitive Data
Data Source Data Type Press-Ganey Patient and physician satisfaction HCAHPS Patient satisfaction Calhospitalcompare.org Clinical quality rankings CMS Clinical quality process measures Modern Healthcare Employee satisfaction and engagement Hay Group* Employee satisfaction and engagement Truven Analytics Clinical quality outcomes, patient safety Health Grades Clinical quality outcomes, patient safety OSHPD Competitor volume and financial data Action OI Productivity and financial Culture of Safety Survey Safety comparative data (AHRQ) Community Needs Assessment Population demographics Midas Clinical quality and safety outcomes * Not exclusive to healthcare
P.2b Strategic Context P.2-2 describes SDH’s key strategic advantages (SAs) and challenges (SCs) and how they align with the Strategic Objectives (SOs) described in 2.1b. On an annual cycle, SDH carries out the STRATEGIC PLANNING PRO-CESS (SPP, 2.1-1). The SPP reviews and updates SCs, SAs, and strategic objectives (SOs), and ensures SDH sustainability through alignment with SH and the MVV (2.1a[1]). P.2c Performance Improvement System. Key elements of SDH’s performance improvement system are highlighted in the Leadership System (1.1-1). SDH’s primary approach to performance improvement is the PDSA methodology, which has the advantages of being fast and guided by data, allowing teams to react quickly to process changes that work or that should continue to be refined. Formal oversight of processes is provided by the PROCESS IMPROVEMENT AND INNOVATION TEAM (PIIT CREW, 6.1b[4]) and the INTERDISCIPLINARY PRACTICE COUNCILS (IPCs, 3.1b[1]) to track and align im-provement and innovation opportunities. Innovation is an integrated component of performance improvement (6.1-1, 6.2-2). Innovations are tracked through the PIIT CREW and IPCs. Evaluation is accomplished through the use of the DASH-BOARD and DEPARTMENT PROFILES (4.1-2). These reports align with the PILLARS, and targets cascade from the SH sys-tem level through every level of the organization down to front-line staff via the Performance Management System (5.2-1). Performance evaluations systematically identify best prac-tices and organizational learning opportunities. Best practices are shared through multiple approaches described in 4.1c(1). Systematic organizational learning also occurs annually through the Baldrige feedback and self-assessment processes (1.2a[2]).
Figure P.2-2 – Strategic Advantages and Challenges (Alignment with Strategic Objectives) Strategic Advantages 1. Well-deployed interdisciplinary care teams (SO1, SO3, SO4, SO5) 2. Strategic partnership with affiliated medical group (SO1, SO2, SO6) 3. Integration of physicians and staff on process improvement and inno-vation (SO1, SO2, SO3, SO4, SO5) 4. Culture of accountability for customer satisfaction and safety (SO3, SO4) 5. Collaboration with community clinics (SO1, SO2) 6. County-organized health system (SO1, SO2) Strategic Challenges 1. Significant regulatory barriers to adding or expanding California hospi-tal facilities (SO2, SO3, SO6) 2. Maintain affordable prices in environment of increasing labor and technology costs (SO2, SO4, SO5, SO6) 3. Financial resources in environment of increasingly low reimbursements and impending health care reform (SO1, SO2, SO3, SO6)
Sutter Davis Hospital
1
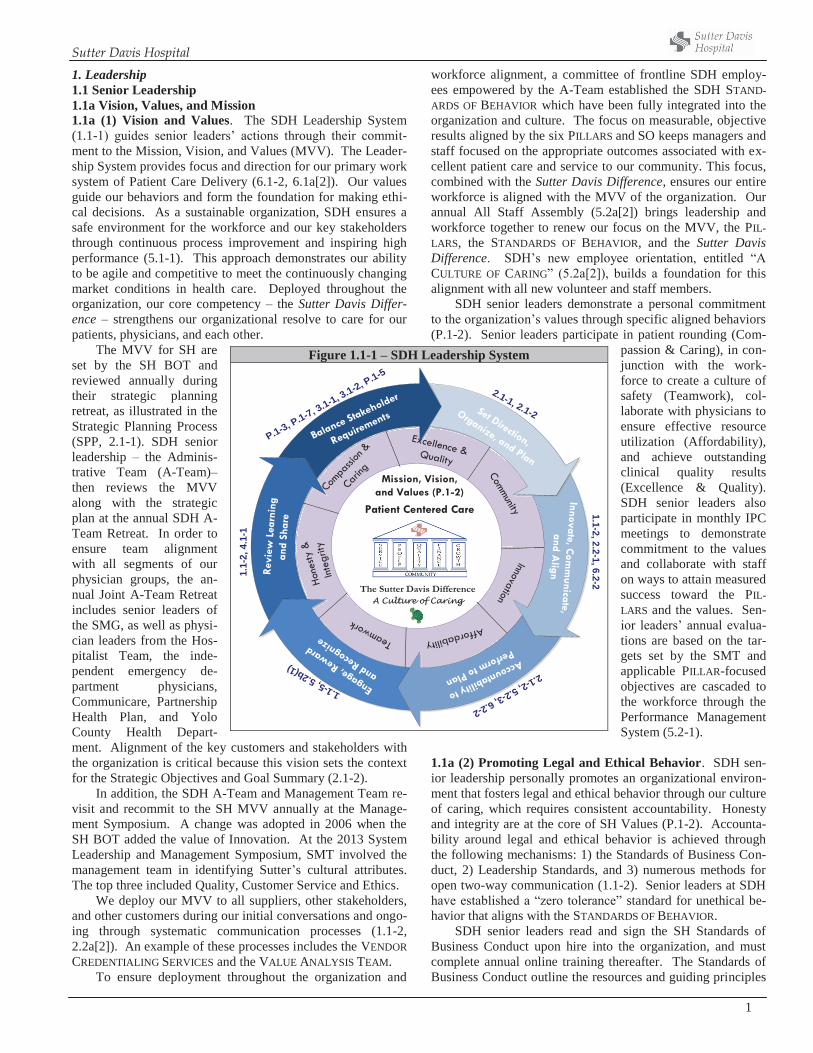
1. Leadership 1.1 Senior Leadership 1.1a Vision, Values, and Mission 1.1a (1) Vision and Values. The SDH Leadership System (1.1-1) guides senior leaders’ actions through their commit-ment to the Mission, Vision, and Values (MVV). The Leader-ship System provides focus and direction for our primary work system of Patient Care Delivery (6.1-2, 6.1a[2]). Our values guide our behaviors and form the foundation for making ethi-cal decisions. As a sustainable organization, SDH ensures a safe environment for the workforce and our key stakeholders through continuous process improvement and inspiring high performance (5.1-1). This approach demonstrates our ability to be agile and competitive to meet the continuously changing market conditions in health care. Deployed throughout the organization, our core competency – the Sutter Davis Differ-ence – strengthens our organizational resolve to care for our patients, physicians, and each other.
The MVV for SH are set by the SH BOT and reviewed annually during their strategic planning retreat, as illustrated in the Strategic Planning Process (SPP, 2.1-1). SDH senior leadership – the Adminis-trative Team (A-Team)– then reviews the MVV along with the strategic plan at the annual SDH A-Team Retreat. In order to ensure team alignment with all segments of our physician groups, the an-nual Joint A-Team Retreat includes senior leaders of the SMG, as well as physi-cian leaders from the Hos-pitalist Team, the inde-pendent emergency de-partment physicians, Communicare, Partnership Health Plan, and Yolo County Health Depart-ment. Alignment of the key customers and stakeholders with the organization is critical because this vision sets the context for the Strategic Objectives and Goal Summary (2.1-2).
In addition, the SDH A-Team and Management Team re-visit and recommit to the SH MVV annually at the Manage-ment Symposium. A change was adopted in 2006 when the SH BOT added the value of Innovation. At the 2013 System Leadership and Management Symposium, SMT involved the management team in identifying Sutter’s cultural attributes. The top three included Quality, Customer Service and Ethics.
We deploy our MVV to all suppliers, other stakeholders, and other customers during our initial conversations and ongo-ing through systematic communication processes (1.1-2, 2.2a[2]). An example of these processes includes the VENDOR CREDENTIALING SERVICES and the VALUE ANALYSIS TEAM.
To ensure deployment throughout the organization and
workforce alignment, a committee of frontline SDH employ-ees empowered by the A-Team established the SDH STAND-ARDS OF BEHAVIOR which have been fully integrated into the organization and culture. The focus on measurable, objective results aligned by the six PILLARS and SO keeps managers and staff focused on the appropriate outcomes associated with ex-cellent patient care and service to our community. This focus, combined with the Sutter Davis Difference, ensures our entire workforce is aligned with the MVV of the organization. Our annual All Staff Assembly (5.2a[2]) brings leadership and workforce together to renew our focus on the MVV, the PIL-LARS, the STANDARDS OF BEHAVIOR, and the Sutter Davis Difference. SDH’s new employee orientation, entitled “A CULTURE OF CARING” (5.2a[2]), builds a foundation for this alignment with all new volunteer and staff members.
SDH senior leaders demonstrate a personal commitment to the organization’s values through specific aligned behaviors (P.1-2). Senior leaders participate in patient rounding (Com-
passion & Caring), in con-junction with the work-force to create a culture of safety (Teamwork), col-laborate with physicians to ensure effective resource utilization (Affordability), and achieve outstanding clinical quality results (Excellence & Quality). SDH senior leaders also participate in monthly IPC meetings to demonstrate commitment to the values and collaborate with staff on ways to attain measured success toward the PIL-LARS and the values. Sen-ior leaders’ annual evalua-tions are based on the tar-gets set by the SMT and applicable PILLAR-focused objectives are cascaded to the workforce through the Performance Management System (5.2-1).
1.1a (2) Promoting Legal and Ethical Behavior. SDH sen-ior leadership personally promotes an organizational environ-ment that fosters legal and ethical behavior through our culture of caring, which requires consistent accountability. Honesty and integrity are at the core of SH Values (P.1-2). Accounta-bility around legal and ethical behavior is achieved through the following mechanisms: 1) the Standards of Business Con-duct, 2) Leadership Standards, and 3) numerous methods for open two-way communication (1.1-2). Senior leaders at SDH have established a “zero tolerance” standard for unethical be-havior that aligns with the STANDARDS OF BEHAVIOR.
SDH senior leaders read and sign the SH Standards of Business Conduct upon hire into the organization, and must complete annual online training thereafter. The Standards of Business Conduct outline the resources and guiding principles
Figure 1.1-1 – SDH Leadership System
1.1-5,5.2b(1)
Mission, Vision, and Values (P.1-2)
CommunityInnovation
AffordabilityTeamwork
Compa
ssion
&
Caring
Hone
sty &
Inte
grity
Excellence & Quality
xcxcBalance Stakeholder
Requirements
CC
Revi
ew L
earn
ing
and
Shar
e
Engage, Reward
and Recognize
Accountability to
Perform to Plan
Innovate, Comm
unicate, and A
lign
Set Direction,
Organize, and Plan
The Sutter Davis DifferenceA Culture of Caring
Patient Centered Care
P.1-3, P.1-7, 3.1-1, 3.1-2, P.1-5
2.1-1, 2.1-2
1.1-2,2.2-1,6.2-2
2.1-2,5.2-3,6.2-2
1.1-
2,4.
1-1
Sutter Davis Hospital
2
for ethical conduct, patient care and treatment, workplace conduct, employment practices, financial integrity, physician services, and health and safety concerns (7.4).
Leadership Standards are defined and rated on an annual basis within Performance Management System. Leadership Standards include engendering respect and trust, breakthrough critical thinking, process transformation, customer service excellence, innovation, and leading people and teams. The Performance Management System (5.2-1) allows for easy de-ployment of the Standards from SH senior leadership to re-gional senior leadership to SDH senior leadership, and also to the entire SDH Management Team, all of whom are rated on the Leadership Standards within their annual evaluation. Each year, the regional HR leaders review the Leadership Standards
for relevance and as a cycle of improvement, Innovation and Leading People and Teams were added. VENDOR CREDEN-TIALING SERVICES ensures partner/vendor knowledge of SDH ethical practice requirements.
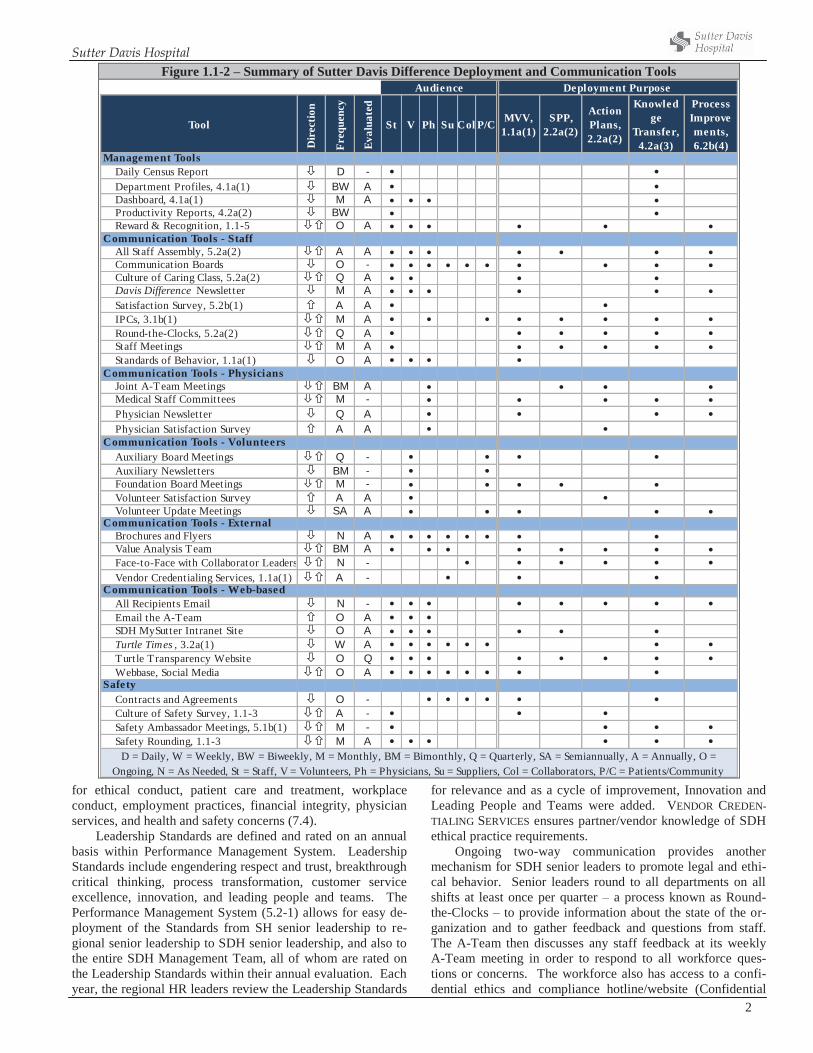
Ongoing two-way communication provides another mechanism for SDH senior leaders to promote legal and ethi-cal behavior. Senior leaders round to all departments on all shifts at least once per quarter – a process known as Round-the-Clocks – to provide information about the state of the or-ganization and to gather feedback and questions from staff. The A-Team then discusses any staff feedback at its weekly A-Team meeting in order to respond to all workforce ques-tions or concerns. The workforce also has access to a confi-dential ethics and compliance hotline/website (Confidential
Figure 1.1-2 – Summary of Sutter Davis Difference Deployment and Communication Tools
Tool
Dir
ectio
n
Freq
uenc
y
Eval
uate
d
St V Ph Su Col P/C MVV, 1.1a(1)
SPP, 2.2a(2)
Action Plans, 2.2a(2)
Knowledge
Transfer, 4.2a(3)
Process Improvements, 6.2b(4)
Management ToolsDaily Census Report D -Department Profiles, 4.1a(1) BW ADashboard, 4.1a(1) M AProductivity Reports, 4.2a(2) BWReward & Recognition, 1.1-5 O A
Communication Tools - StaffAll Staff Assembly, 5.2a(2) A ACommunication Boards O -Culture of Caring Class, 5.2a(2) Q ADavis Difference Newsletter M ASatisfaction Survey, 5.2b(1) A AIPCs, 3.1b(1) M ARound-the-Clocks, 5.2a(2) Q AStaff Meetings M AStandards of Behavior, 1.1a(1) O A
Communication Tools - PhysiciansJoint A-Team Meetings BM AMedical Staff Committees M -Physician Newsletter Q APhysician Satisfaction Survey A A
Communication Tools - VolunteersAuxiliary Board Meetings Q -Auxiliary Newsletters BM -Foundation Board Meetings M -Volunteer Satisfaction Survey A AVolunteer Update Meetings SA A
Communication Tools - ExternalBrochures and Flyers N AValue Analysis Team BM AFace-to-Face with Collaborator Leaders N -Vendor Credentialing Services, 1.1a(1) A -
Communication Tools - Web-basedAll Recipients Email N -Email the A-Team O ASDH MySutter Intranet Site O ATurtle Times , 3.2a(1) W ATurtle Transparency Website O QWebbase, Social Media O A
SafetyContracts and Agreements O -Culture of Safety Survey, 1.1-3 A -Safety Ambassador Meetings, 5.1b(1) M -Safety Rounding, 1.1-3 M A
D = Daily, W = Weekly, BW = Biweekly, M = Monthly, BM = Bimonthly, Q = Quarterly, SA = Semiannually, A = Annually, O = Ongoing, N = As Needed, St = Staff, V = Volunteers, Ph = Physicians, Su = Suppliers, Col = Collaborators, P/C = Patients/Community
Audience Deployment Purpose
Sutter Davis Hospital
3
Message Line), a confidential “Email the A-Team” link on our intranet, the Patient Safety Record (PSR) process, and an A-Team open door policy. Another systematic process for dis-cussing and preventing ethical issues is the physician-led Eth-ics Committee (1.2b[2]). In an annual review of the compli-ance program, a compliance officer was added to SDH work-force along with monthly compliance meetings to review or-ganizational processes and educate the workforce on compli-ance. SDH senior leaders also solicit feedback from staff through annual questionnaires, from workforce satisfaction surveys and Culture of Safety (7.4-3 thru 7), where staff are asked to what extent “I feel my organization is ethical” (7.4-12) and “I feel comfortable reporting an error or concern,” respectively.
1.1a(3) Creating a Sustainable Organization. SDH senior leaders create a sustainable organization by role modeling the Leadership System (1.1-1). Organizational sustainability is accomplished through alignment with our physicians, stake-holders, customers, and community partners. This group comprises the Joint A-team. The Joint A-team approach in-cludes strategic planning sessions annually and bi-monthly meetings. This process allows SDH to meet strategic chal-lenges, remain agile and competitive in the market place while achieving our MVV. This collaborative model has created a learning platform that allows our leaders to continuously im-prove the health care delivery model thus improving care to our communities through population management (7.1).
Performance improvement. Senior leaders personally create an organizational environment of performance im-provement first by executing the leadership system and then systematically evaluating the leadership system effectiveness. (4.1-3) Senior leaders involvement in improvement efforts serves as a inspiration that fosters innovation within the work-forces.
The deployment of the PIIT CREW ensures continuous improvement at the department level (6.1b[4]). The PIIT CREW acts as a central repository for all process-related oppor-tunities for improvement throughout SDH that are identified through feedback from the Baldrige process or by any member of the workforce. Senior leaders review and prioritize the opportunities on a quarterly basis, communicate successes and best practices via the hospital e-newsletter which is updated daily, in coaching sessions, and at MEC, and on a quarterly basis via Round-the-Clocks. Senior leaders track the results of the current PIIT CREW results monthly at A-Team. Senior leaders ensure that PIIT CREW process improvements and in-novations are aligned with the PILLARS and deploy process improvements and innovations through various mechanisms (1.1-2). The Rewards and Recognition Team (1.1b[1]) recog-nizes departments and teams that sustain results for six months or greater Senior Leaders further recognize high per-formers and innovative processes by selecting these individu-als to speak at state and national conferences to share their innovations and best practices.
Accomplishment of MVV and strategic objectives. Achievement of the MVV is cascaded throughout SH via the DASHBOARD (4.1-1) and the PILLARS. Strategic objectives are aligned with the DASHBOARD and the PILLARS (2.1-2) by sen-ior leadership and cascaded to the Management Team, and from the Management Team to the workforce (2.2-1). Senior leaders maintain a focus on accomplishing these metrics throughout the year using tools such as the DEPARTMENT PRO-FILES (4.1a[1]), PILLAR Goals, the Turtle Times, and the IPCs (3.1b[1]). Strategic objectives and their alignment with the MVV and the PILLARS are reviewed and revised annually as part of the SPP (2.1-1).
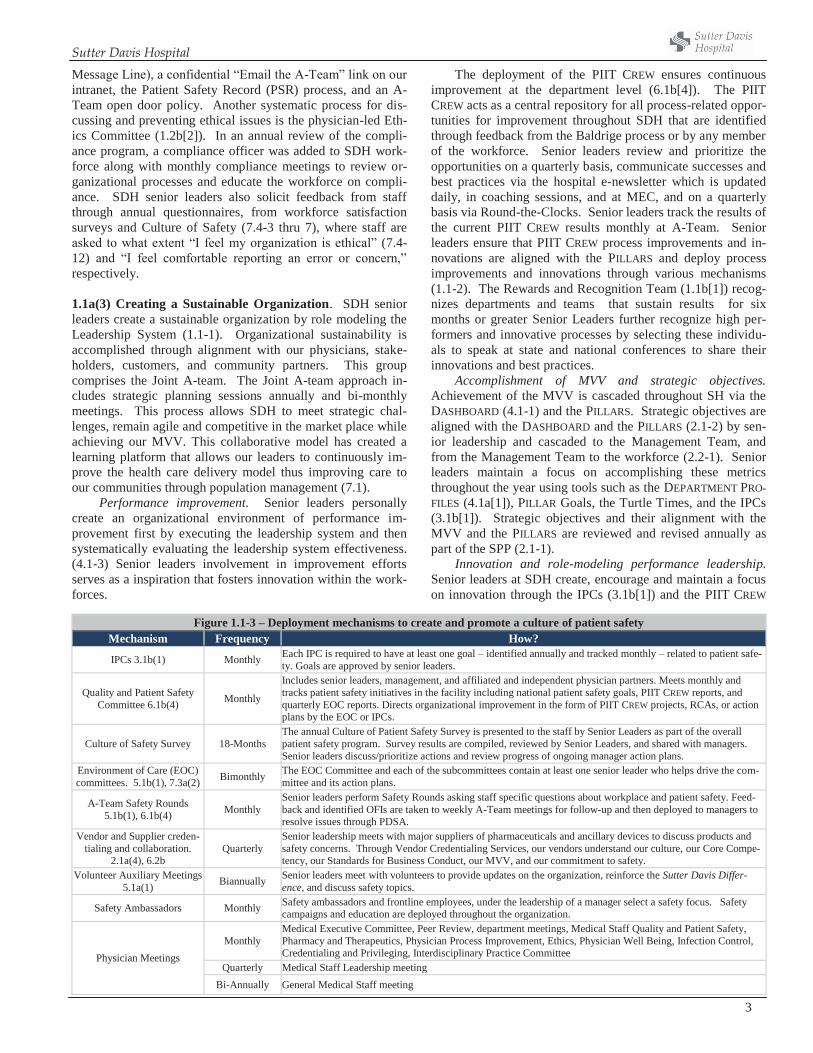
Innovation and role-modeling performance leadership. Senior leaders at SDH create, encourage and maintain a focus on innovation through the IPCs (3.1b[1]) and the PIIT CREW
Figure 1.1-3 – Deployment mechanisms to create and promote a culture of patient safety Mechanism Frequency How?
IPCs 3.1b(1) Monthly Each IPC is required to have at least one goal – identified annually and tracked monthly – related to patient safe-ty. Goals are approved by senior leaders.
Quality and Patient Safety Committee 6.1b(4) Monthly
Includes senior leaders, management, and affiliated and independent physician partners. Meets monthly and tracks patient safety initiatives in the facility including national patient safety goals, PIIT CREW reports, and quarterly EOC reports. Directs organizational improvement in the form of PIIT CREW projects, RCAs, or action plans by the EOC or IPCs.
Culture of Safety Survey 18-Months The annual Culture of Patient Safety Survey is presented to the staff by Senior Leaders as part of the overall patient safety program. Survey results are compiled, reviewed by Senior Leaders, and shared with managers. Senior leaders discuss/prioritize actions and review progress of ongoing manager action plans.
Environment of Care (EOC) committees. 5.1b(1), 7.3a(2) Bimonthly The EOC Committee and each of the subcommittees contain at least one senior leader who helps drive the com-
mittee and its action plans.
A-Team Safety Rounds 5.1b(1), 6.1b(4) Monthly
Senior leaders perform Safety Rounds asking staff specific questions about workplace and patient safety. Feed-back and identified OFIs are taken to weekly A-Team meetings for follow-up and then deployed to managers to resolve issues through PDSA.
Vendor and Supplier creden-tialing and collaboration.
2.1a(4), 6.2b Quarterly
Senior leadership meets with major suppliers of pharmaceuticals and ancillary devices to discuss products and safety concerns. Through Vendor Credentialing Services, our vendors understand our culture, our Core Compe-tency, our Standards for Business Conduct, our MVV, and our commitment to safety.
Volunteer Auxiliary Meetings 5.1a(1) Biannually Senior leaders meet with volunteers to provide updates on the organization, reinforce the Sutter Davis Differ-
ence, and discuss safety topics.
Safety Ambassadors Monthly Safety ambassadors and frontline employees, under the leadership of a manager select a safety focus. Safety campaigns and education are deployed throughout the organization.
Physician Meetings Monthly
Medical Executive Committee, Peer Review, department meetings, Medical Staff Quality and Patient Safety, Pharmacy and Therapeutics, Physician Process Improvement, Ethics, Physician Well Being, Infection Control, Credentialing and Privileging, Interdisciplinary Practice Committee
Quarterly Medical Staff Leadership meeting Bi-Annually General Medical Staff meeting
Sutter Davis Hospital
4
(6.1b[4], 6.2b). These forums engage workforce from all dis-ciplines. In addition, the IPCs meet with patients to identify opportunities for innovation. The four IPCs and the PIIT CREW each meets on a monthly basis. SDH has become a role model in the SH system and the SHSSR for some of its inno-vations, such as the PIIT CREW, the Department Profile tool, and the High-Medium-Low (5.2-3) process as part of the per-formance review process. These innovations contribute to SDH’s ability to react quickly to market changes, remain mar-ket competitive and keep the workforce agile and open to change
Organizational agility, intelligent risk taking and innova-tion. Organizational agility is a focus of SDH senior leaders at both a strategic level and an operational level. Strategic agility is achieved through the SPP (2.1-1) by the A-Team and the Joint A-Team, where planning and objective setting are done annually; deployment and tracking are done at weekly A-Team and bimonthly Joint A-Team meetings. Operational agility is achieved through a constant focus by senior leader-ship on workforce capacity and community need. For exam-ple, when reviewing physician capacity, a strategic and opera-tional goal to recruit a second tier of specialists (GI and Urol-ogy) was identified to better serve the needs of our communi-ty. Plans were put in place to expand both of these services while continuing collaboration with our tertiary medical center in Sacramento. These decisions are based on community need, physician succession planning, and population planning. This type of planning ensures our ability to remain competi-tive and agile in the market. Long term plans include: pur-chase of free standing surgery center, one management team for our geographic area encompassing the full continuum of care, and ED observations beds. These plans demonstrate significant market intelligence that leads to future sustainabil-ity as we transition how we provide care within the new guide-lines of Healthcare Reform.
Workforce culture that fosters engagement. Engagement of the workforce begins with senior leadership’s commitment to deploy and reinforce the Sutter Davis Difference, our CUL-TURE OF CARING (1.1-1). Senior leadership promotes a culture that fosters engagement by setting the proper strategy and identifying PILLAR metrics that drive accountability (P.2-2). The IPCs and PIIT CREW engage workforce members from all disciplines by identifying opportunities for innovation to meet the PILLAR metrics.
Workforce and organizational learning. SDH senior leaders identify needs for employee education and develop-ment through the Learning and Development System (5.2-2). Senior leaders ensure continued employee learning by provid-ing education days for course work. Being a learning organi-zation is central to sustainability and success. High perform-ers, identified through the HML evaluation process (5.2-3), are offered further development courses through SHU, in addition to being provided paid continuing education hours. A special endowment in memory of one of our ICU nurses was estab-lished by the staff at SDH for continuing clinical education. This fund is specifically used to pay for the costs associated with educational opportunities for our front-line staff.
Senior leaders at SDH participate in organizational learn-ing through various evaluation and improvement cycles, work-force input, partner input, patient and community inputs,
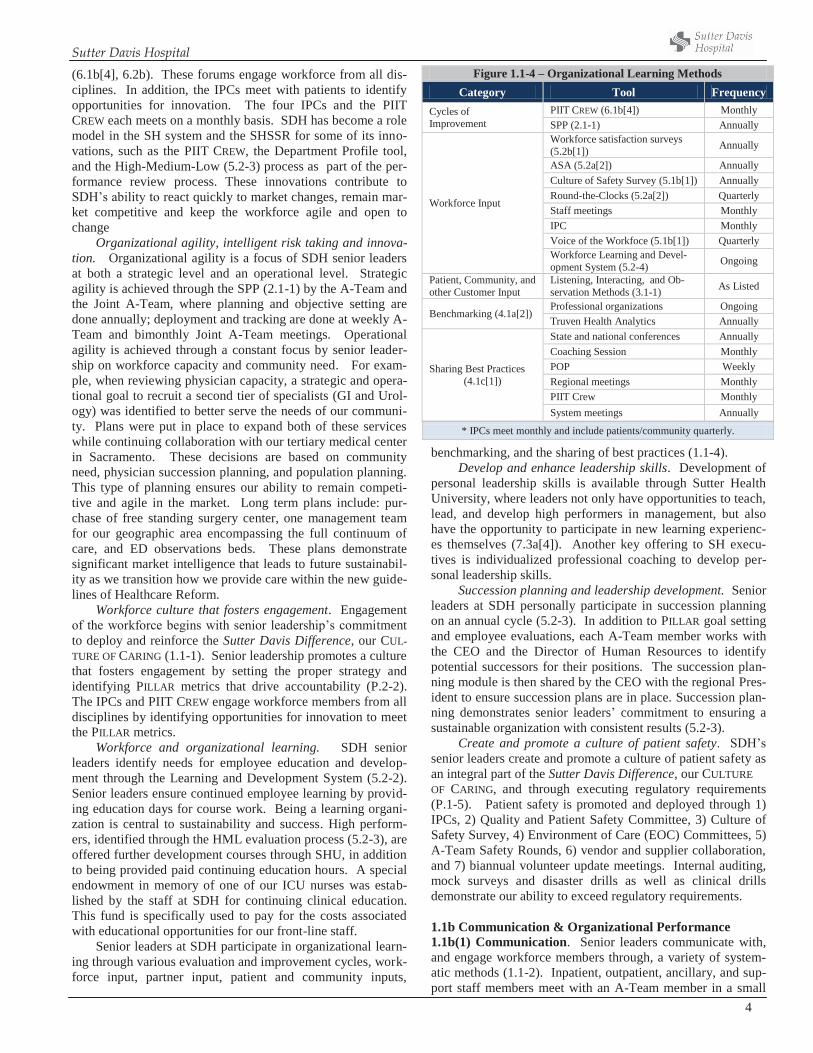
benchmarking, and the sharing of best practices (1.1-4). Develop and enhance leadership skills. Development of
personal leadership skills is available through Sutter Health University, where leaders not only have opportunities to teach, lead, and develop high performers in management, but also have the opportunity to participate in new learning experienc-es themselves (7.3a[4]). Another key offering to SH execu-tives is individualized professional coaching to develop per-sonal leadership skills.
Succession planning and leadership development. Senior leaders at SDH personally participate in succession planning on an annual cycle (5.2-3). In addition to PILLAR goal setting and employee evaluations, each A-Team member works with the CEO and the Director of Human Resources to identify potential successors for their positions. The succession plan-ning module is then shared by the CEO with the regional Pres-ident to ensure succession plans are in place. Succession plan-ning demonstrates senior leaders’ commitment to ensuring a sustainable organization with consistent results (5.2-3).
Create and promote a culture of patient safety. SDH’s senior leaders create and promote a culture of patient safety as an integral part of the Sutter Davis Difference, our CULTURE OF CARING, and through executing regulatory requirements (P.1-5). Patient safety is promoted and deployed through 1) IPCs, 2) Quality and Patient Safety Committee, 3) Culture of Safety Survey, 4) Environment of Care (EOC) Committees, 5) A-Team Safety Rounds, 6) vendor and supplier collaboration, and 7) biannual volunteer update meetings. Internal auditing, mock surveys and disaster drills as well as clinical drills demonstrate our ability to exceed regulatory requirements. 1.1b Communication & Organizational Performance 1.1b(1) Communication. Senior leaders communicate with, and engage workforce members through, a variety of system-atic methods (1.1-2). Inpatient, outpatient, ancillary, and sup-port staff members meet with an A-Team member in a small
Figure 1.1-4 – Organizational Learning Methods Category Tool Frequency
Cycles of Improvement
PIIT CREW (6.1b[4]) Monthly SPP (2.1-1) Annually
Workforce Input
Workforce satisfaction surveys (5.2b[1]) Annually
ASA (5.2a[2]) Annually Culture of Safety Survey (5.1b[1]) Annually Round-the-Clocks (5.2a[2]) Quarterly Staff meetings Monthly IPC Monthly Voice of the Workfoce (5.1b[1]) Quarterly Workforce Learning and Devel-opment System (5.2-4) Ongoing
Patient, Community, and other Customer Input
Listening, Interacting, and Ob-servation Methods (3.1-1) As Listed
Benchmarking (4.1a[2]) Professional organizations Ongoing Truven Health Analytics Annually
Sharing Best Practices (4.1c[1])
State and national conferences Annually Coaching Session Monthly POP Weekly Regional meetings Monthly PIIT Crew Monthly System meetings Annually
* IPCs meet monthly and include patients/community quarterly.
Sutter Davis Hospital
5
group setting on a quarterly basis through Round-the-Clocks (5.2a[2]). As a recent example of effective two-way commu-nication through Round-the-Clocks, the ED nurses and regis-tration staff requested removal of a decorative wall in the ED waiting room. This improvement would allow the triage nurse to visually monitor all the patients in the waiting room, thus improving patient safety.
If a message or decision is urgent and cannot wait for the quarterly Round-the-Clock, it is added to the agenda at the monthly department managers meeting. Key messages are made clear at the end of each managers meeting, and each manager is responsible for communicating those messages to their staff. Senior leaders hold managers accountable for Key Message delivery through staff meeting minutes and attend-ance at staff meetings. Messages that have an immediate ur-gency are sent out via a facility-wide email (all staff members have their own email account and access to a computer) and placed on department communication boards. Additional two-way communication methods are described in 1.1-2 and 1.1a(2).
Senior leaders provide frank, two-way communication with our volunteer workforce members by attending their monthly board meetings and by being available at all times for questions or concerns. Both our affiliated and independent physicians interact with SDH senior leaders in monthly medi-cal staff committee meetings. In addition, workforce satisfac-tion surveys and Culture of Safety survey provide annual op-portunities for every segment of the workforce and our key partners to provide feedback to senior leadership. Senior leadership then creates action plans based on the results of each of these and rounds back with the group to make im-provements. Results from the surveys are measured and tracked as part of the People PILLAR.
Technology has offered several mediums for Senior Leaders to hear from our patients, families and customers. Social media has effectively enhanced our communication by increasing real time communication with our patients, families and the community. One example is “My Sutter on Line” where patients can make appointments, email their physicians or look up their diagnositic results. We learn from the variety of social medias what our patients prefer, things that work or do not work for them as patients, and ideas for improving our systems. (3.1-1)
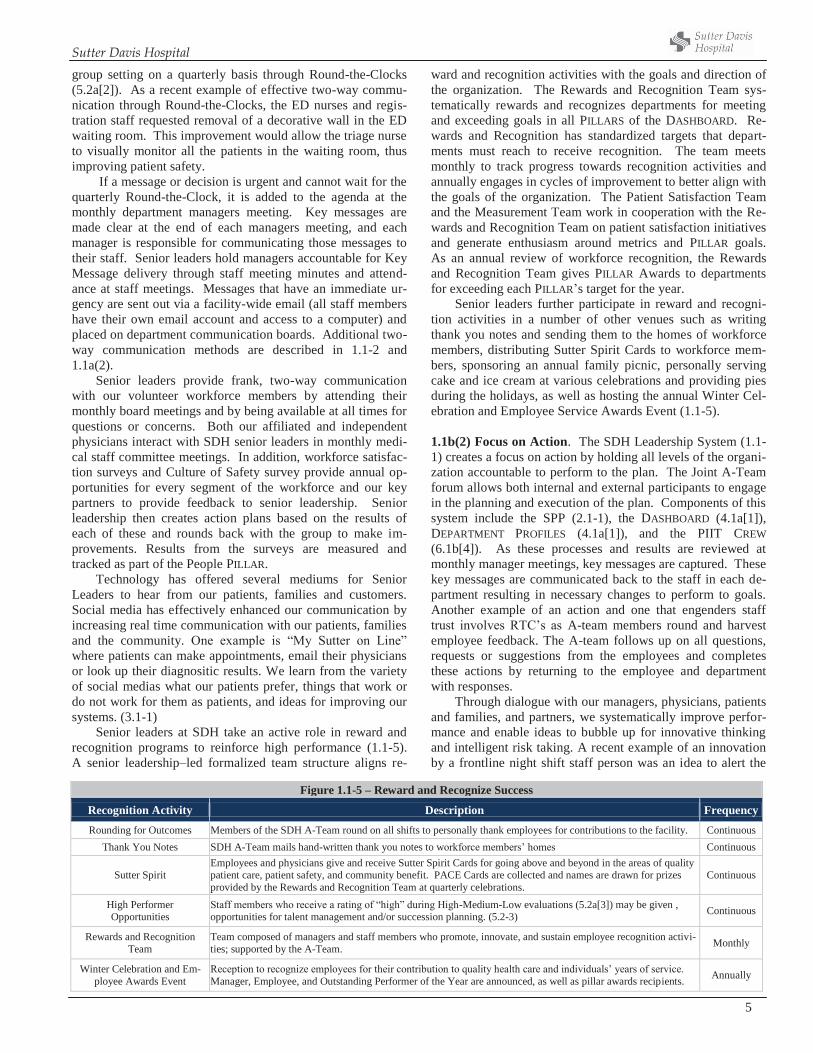
Senior leaders at SDH take an active role in reward and recognition programs to reinforce high performance (1.1-5). A senior leadership–led formalized team structure aligns re-
ward and recognition activities with the goals and direction of the organization. The Rewards and Recognition Team sys-tematically rewards and recognizes departments for meeting and exceeding goals in all PILLARS of the DASHBOARD. Re-wards and Recognition has standardized targets that depart-ments must reach to receive recognition. The team meets monthly to track progress towards recognition activities and annually engages in cycles of improvement to better align with the goals of the organization. The Patient Satisfaction Team and the Measurement Team work in cooperation with the Re-wards and Recognition Team on patient satisfaction initiatives and generate enthusiasm around metrics and PILLAR goals. As an annual review of workforce recognition, the Rewards and Recognition Team gives PILLAR Awards to departments for exceeding each PILLAR’s target for the year.
Senior leaders further participate in reward and recogni-tion activities in a number of other venues such as writing thank you notes and sending them to the homes of workforce members, distributing Sutter Spirit Cards to workforce mem-bers, sponsoring an annual family picnic, personally serving cake and ice cream at various celebrations and providing pies during the holidays, as well as hosting the annual Winter Cel-ebration and Employee Service Awards Event (1.1-5).
1.1b(2) Focus on Action. The SDH Leadership System (1.1-1) creates a focus on action by holding all levels of the organi-zation accountable to perform to the plan. The Joint A-Team forum allows both internal and external participants to engage in the planning and execution of the plan. Components of this system include the SPP (2.1-1), the DASHBOARD (4.1a[1]), DEPARTMENT PROFILES (4.1a[1]), and the PIIT CREW (6.1b[4]). As these processes and results are reviewed at monthly manager meetings, key messages are captured. These key messages are communicated back to the staff in each de-partment resulting in necessary changes to perform to goals. Another example of an action and one that engenders staff trust involves RTC’s as A-team members round and harvest employee feedback. The A-team follows up on all questions, requests or suggestions from the employees and completes these actions by returning to the employee and department with responses.
Through dialogue with our managers, physicians, patients and families, and partners, we systematically improve perfor-mance and enable ideas to bubble up for innovative thinking and intelligent risk taking. A recent example of an innovation by a frontline night shift staff person was an idea to alert the
Figure 1.1-5 – Reward and Recognize Success
Recognition Activity Description Frequency Rounding for Outcomes Members of the SDH A-Team round on all shifts to personally thank employees for contributions to the facility. Continuous
Thank You Notes SDH A-Team mails hand-written thank you notes to workforce members’ homes Continuous
Sutter Spirit Employees and physicians give and receive Sutter Spirit Cards for going above and beyond in the areas of quality patient care, patient safety, and community benefit. PACE Cards are collected and names are drawn for prizes provided by the Rewards and Recognition Team at quarterly celebrations.
Continuous
High Performer Opportunities
Staff members who receive a rating of “high” during High-Medium-Low evaluations (5.2a[3]) may be given , opportunities for talent management and/or succession planning. (5.2-3) Continuous
Rewards and Recognition Team
Team composed of managers and staff members who promote, innovate, and sustain employee recognition activi-ties; supported by the A-Team. Monthly
Winter Celebration and Em-ployee Awards Event
Reception to recognize employees for their contribution to quality health care and individuals’ years of service. Manager, Employee, and Outstanding Performer of the Year are announced, as well as pillar awards recipients. Annually
Sutter Davis Hospital
6
Medicaid third party administrator when a member was in the ED electronically. This creative idea improved care delivery community collaboration and improved the health of whole population by decreasing ED visits and improving outpatient management (7.1-8).
To identify needed actions, each month senior leaders re-view the DASHBOARD (4.1a[1]), which contains our key per-formance measures, along with any PILLAR-specific DASH-BOARDS that have been created either from at-risk PILLAR met-rics or from the SPP. For example, the Affordability metric, a SDH SO, is at-risk on the DASHBOARD and therefore has an action plan, its own DASHBOARD, and weekly meetings led by senior leadership (2.2a[1]). Through market intelligence and feedback from our patients and families we created a Palliative Care team to assist families with end of life planning. This was a needed action that was identified through community need and population management. The growing results in this area support the strategic action (7.1-7). Direct feedback from our patients in the Birthing center on their experience and what would enhance their birthing experience lead to a fund-raising partnership with the community to renovate the Birth-ing Center. 1.2 Governance and Societal Responsibilities 1.2a Organizational Governance 1.2a (1) Governance System. The SH governance structure (P.1-6) provides regional oversight that requires local ac-countability. The SDH CEO reports to the Regional President and the SHSSR Board of Trustees (BOT), which includes community, physician, and administrative membership.
Accountability for management’s actions. The BOT pro-vides responsible oversight of management’s actions by monthly reviewing SDH and other regional performance data on the DASHBOARD. Strategic objectives and progress on the strategic plan are reviewed at quarterly Governance Forums and annual board retreats. On a scheduled timeline throughout the year, the board receives expanded updates on strategic goals demonstrating improvements and accomplishments in areas such as program implementations, ROI on new equip-ment, or new building projects. BOT performance on its ac-complishments is reviewed annually per the process outlined in 1.2a(2).
Fiscal accountability. To ensure fiscal accountability, the BOT employs an annual external financial audit (7.4-8). The Finance and Planning Committee of the BOT meets monthly to review all financial metrics and guide action plans written to address at-risk areas. In addition, this committee has regularly scheduled in-depth reviews of system initiatives; one example is Medicare Affordability. With a growing popu-lation of Medicare recipients, the board ensures that manage-ment is executing processes to meet the health care needs of this population while overseeing efficiencies in these process-es (7.5-9).
Transparency in operations. The organization maintains operational transparency and governance disclosure through BOT members signing the organization’s Code of Conduct and Conflict of Interest Statements. The Governance and Compliance Committee of the BOT annually assesses the board’s conduct and policies and has ongoing compliance au-dits. The annual external audit provides an additional level of
scrutiny to expose evidence of organizational misconduct. In addition, the Planning and Finance Committee oversees an annual external financial audit.
Independence in audits. The BOT ensures independence in internal and external audits by hiring external auditors to perform regional financial and accounting audits and by par-ticipating in numerous independent external audits from or-ganizations such as TJC and CDPH. Internal audits include SH internal auditors and do not include any members of the SDH team, thus ensuring both internal and external audit ef-fectiveness (7.4-9, 10).
Protection of stakeholder interests. The BOT protects stakeholder interest by including all stakeholder segments in membership of the BOT, including administration, community members, independent physicians, affiliated physicians, nurs-ing leadership, and a geographical mix of members covering all communities served in the region. The stakeholder seg-ments are all included as part of the SPP (2.1-1).
Succession planning for senior leaders. Each year Senior Leaders participate in a succession planning exercise to identify potential successors. As successors are identified a plan is formulated to begin the grooming process. These indi-viduals are selected for Sutter Health Leadership Academy and are appointed to lead system initiatives or major system projects. Over 85 percent of senior leader positions are filled from interally developed senior leaders. Sutter Health is na-tionally recognized for outcomes and this is largly due to the internal leadership development and succession planning with-in the organization. Sutter Davis Hospital has the same rich history. The Governing Board at the system level and the re-gional levels have the opportunity to see the work of those identified as High Performers and see the results of their work presented at Board meetings (5.2-3).
1.2a (2) Performance Evaluation. Senior leaders are evalu-ated annually. The SDH CEO is evaluated by the Regional President, while all other SDH senior leaders are evaluated by the SDH CEO and regional leaders. All evaluations are aligned with the six PILLARS and are completed within PSDP (5.2a[3]). The Regional President meets monthly with the SDH CEO to review performance and regional collaboration. The CEO compensation is based on DASHBOARD performance results as well as alignment with system strategic objectives. The SDH CEO meets weekly with the SDH senior leadership team (A-Team), and monthly with each member to assess pro-gress on their PILLAR goals and assist with 90-Day Action Plans. A-Team members use these reviews and the PSDP system to create development goals to improve their leader-ship effectiveness. To assess the SDH senior leadership system, the A-Team annually self-assesses its strengths and opportunities as a team. The systematic self-evaluation processes include the Studer Evidence-Based Leadership tool, the Baldrige Self-Assessment tool, and feedback from a survey of the SDH Management Team.
The BOT performs its own self-assessment annually. The Governance Committee of the board has the responsibility to ensure board education, annual board self-assessment, board participation, and follow-up. The Chairman of the Board then follows up with individual board members on the self-
Sutter Davis Hospital
7
assessment results and uses those performance reviews to cre-ate PILLAR-based actions and goals for the coming year to improve governance effectiveness, as appropriate.
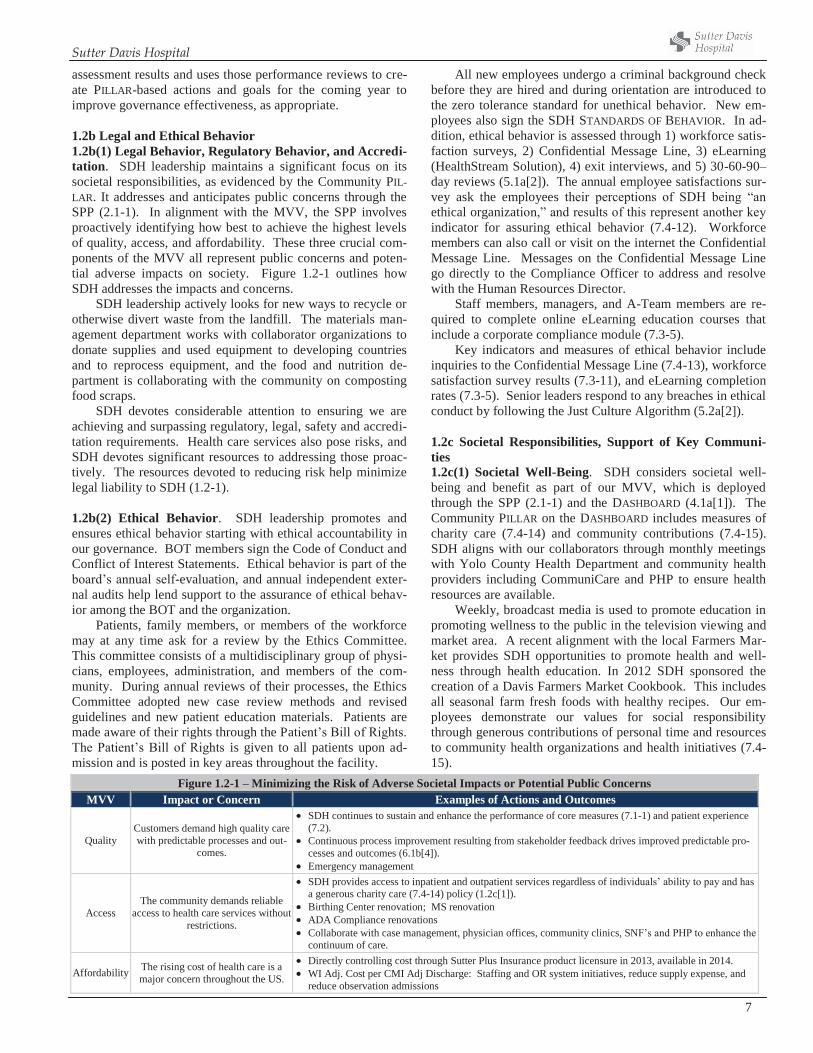
1.2b Legal and Ethical Behavior 1.2b(1) Legal Behavior, Regulatory Behavior, and Accredi-tation. SDH leadership maintains a significant focus on its societal responsibilities, as evidenced by the Community PIL-LAR. It addresses and anticipates public concerns through the SPP (2.1-1). In alignment with the MVV, the SPP involves proactively identifying how best to achieve the highest levels of quality, access, and affordability. These three crucial com-ponents of the MVV all represent public concerns and poten-tial adverse impacts on society. Figure 1.2-1 outlines how SDH addresses the impacts and concerns.
SDH leadership actively looks for new ways to recycle or otherwise divert waste from the landfill. The materials man-agement department works with collaborator organizations to donate supplies and used equipment to developing countries and to reprocess equipment, and the food and nutrition de-partment is collaborating with the community on composting food scraps.
SDH devotes considerable attention to ensuring we are achieving and surpassing regulatory, legal, safety and accredi-tation requirements. Health care services also pose risks, and SDH devotes significant resources to addressing those proac-tively. The resources devoted to reducing risk help minimize legal liability to SDH (1.2-1).
1.2b(2) Ethical Behavior. SDH leadership promotes and ensures ethical behavior starting with ethical accountability in our governance. BOT members sign the Code of Conduct and Conflict of Interest Statements. Ethical behavior is part of the board’s annual self-evaluation, and annual independent exter-nal audits help lend support to the assurance of ethical behav-ior among the BOT and the organization.
Patients, family members, or members of the workforce may at any time ask for a review by the Ethics Committee. This committee consists of a multidisciplinary group of physi-cians, employees, administration, and members of the com-munity. During annual reviews of their processes, the Ethics Committee adopted new case review methods and revised guidelines and new patient education materials. Patients are made aware of their rights through the Patient’s Bill of Rights. The Patient’s Bill of Rights is given to all patients upon ad-mission and is posted in key areas throughout the facility.
All new employees undergo a criminal background check before they are hired and during orientation are introduced to the zero tolerance standard for unethical behavior. New em-ployees also sign the SDH STANDARDS OF BEHAVIOR. In ad-dition, ethical behavior is assessed through 1) workforce satis-faction surveys, 2) Confidential Message Line, 3) eLearning (HealthStream Solution), 4) exit interviews, and 5) 30-60-90–day reviews (5.1a[2]). The annual employee satisfactions sur-vey ask the employees their perceptions of SDH being “an ethical organization,” and results of this represent another key indicator for assuring ethical behavior (7.4-12). Workforce members can also call or visit on the internet the Confidential Message Line. Messages on the Confidential Message Line go directly to the Compliance Officer to address and resolve with the Human Resources Director.
Staff members, managers, and A-Team members are re-quired to complete online eLearning education courses that include a corporate compliance module (7.3-5).
Key indicators and measures of ethical behavior include inquiries to the Confidential Message Line (7.4-13), workforce satisfaction survey results (7.3-11), and eLearning completion rates (7.3-5). Senior leaders respond to any breaches in ethical conduct by following the Just Culture Algorithm (5.2a[2]). 1.2c Societal Responsibilities, Support of Key Communi-ties 1.2c(1) Societal Well-Being. SDH considers societal well-being and benefit as part of our MVV, which is deployed through the SPP (2.1-1) and the DASHBOARD (4.1a[1]). The Community PILLAR on the DASHBOARD includes measures of charity care (7.4-14) and community contributions (7.4-15). SDH aligns with our collaborators through monthly meetings with Yolo County Health Department and community health providers including CommuniCare and PHP to ensure health resources are available.
Weekly, broadcast media is used to promote education in promoting wellness to the public in the television viewing and market area. A recent alignment with the local Farmers Mar-ket provides SDH opportunities to promote health and well-ness through health education. In 2012 SDH sponsored the creation of a Davis Farmers Market Cookbook. This includes all seasonal farm fresh foods with healthy recipes. Our em-ployees demonstrate our values for social responsibility through generous contributions of personal time and resources to community health organizations and health initiatives (7.4-15).
Figure 1.2-1 – Minimizing the Risk of Adverse Societal Impacts or Potential Public Concerns MVV Impact or Concern Examples of Actions and Outcomes
Quality Customers demand high quality care with predictable processes and out-
comes.
SDH continues to sustain and enhance the performance of core measures (7.1-1) and patient experience (7.2).
Continuous process improvement resulting from stakeholder feedback drives improved predictable pro-cesses and outcomes (6.1b[4]).
Emergency management
Access The community demands reliable
access to health care services without restrictions.
SDH provides access to inpatient and outpatient services regardless of individuals’ ability to pay and has a generous charity care (7.4-14) policy (1.2c[1]).
Birthing Center renovation; MS renovation ADA Compliance renovations Collaborate with case management, physician offices, community clinics, SNF’s and PHP to enhance the
continuum of care.
Affordability The rising cost of health care is a major concern throughout the US.
Directly controlling cost through Sutter Plus Insurance product licensure in 2013, available in 2014. WI Adj. Cost per CMI Adj Discharge: Staffing and OR system initiatives, reduce supply expense, and
reduce observation admissions
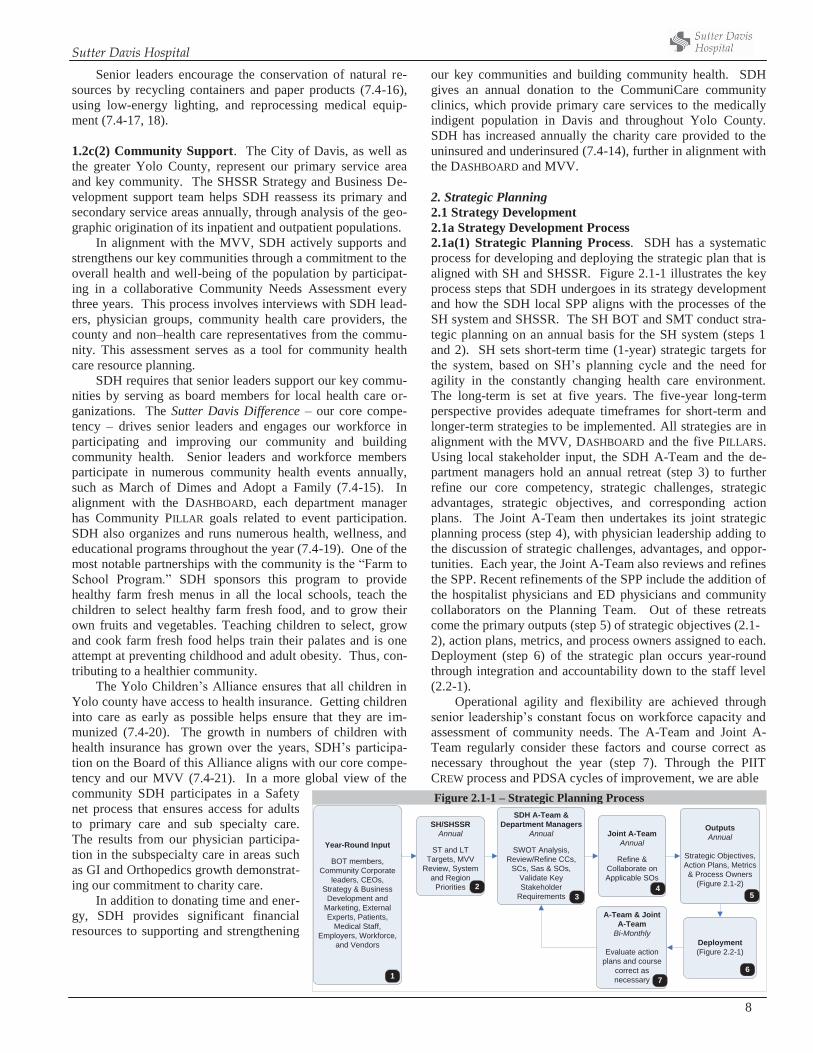
Sutter Davis Hospital
8
Senior leaders encourage the conservation of natural re-sources by recycling containers and paper products (7.4-16), using low-energy lighting, and reprocessing medical equip-ment (7.4-17, 18). 1.2c(2) Community Support. The City of Davis, as well as the greater Yolo County, represent our primary service area and key community. The SHSSR Strategy and Business De-velopment support team helps SDH reassess its primary and secondary service areas annually, through analysis of the geo-graphic origination of its inpatient and outpatient populations.
In alignment with the MVV, SDH actively supports and strengthens our key communities through a commitment to the overall health and well-being of the population by participat-ing in a collaborative Community Needs Assessment every three years. This process involves interviews with SDH lead-ers, physician groups, community health care providers, the county and non–health care representatives from the commu-nity. This assessment serves as a tool for community health care resource planning.
SDH requires that senior leaders support our key commu-nities by serving as board members for local health care or-ganizations. The Sutter Davis Difference – our core compe-tency – drives senior leaders and engages our workforce in participating and improving our community and building community health. Senior leaders and workforce members participate in numerous community health events annually, such as March of Dimes and Adopt a Family (7.4-15). In alignment with the DASHBOARD, each department manager has Community PILLAR goals related to event participation. SDH also organizes and runs numerous health, wellness, and educational programs throughout the year (7.4-19). One of the most notable partnerships with the community is the “Farm to School Program.” SDH sponsors this program to provide healthy farm fresh menus in all the local schools, teach the children to select healthy farm fresh food, and to grow their own fruits and vegetables. Teaching children to select, grow and cook farm fresh food helps train their palates and is one attempt at preventing childhood and adult obesity. Thus, con-tributing to a healthier community.
The Yolo Children’s Alliance ensures that all children in Yolo county have access to health insurance. Getting children into care as early as possible helps ensure that they are im-munized (7.4-20). The growth in numbers of children with health insurance has grown over the years, SDH’s participa-tion on the Board of this Alliance aligns with our core compe-tency and our MVV (7.4-21). In a more global view of the community SDH participates in a Safety net process that ensures access for adults to primary care and sub specialty care. The results from our physician participa-tion in the subspecialty care in areas such as GI and Orthopedics growth demonstrat-ing our commitment to charity care.
In addition to donating time and ener-gy, SDH provides significant financial resources to supporting and strengthening
our key communities and building community health. SDH gives an annual donation to the CommuniCare community clinics, which provide primary care services to the medically indigent population in Davis and throughout Yolo County. SDH has increased annually the charity care provided to the uninsured and underinsured (7.4-14), further in alignment with the DASHBOARD and MVV. 2. Strategic Planning 2.1 Strategy Development 2.1a Strategy Development Process 2.1a(1) Strategic Planning Process. SDH has a systematic process for developing and deploying the strategic plan that is aligned with SH and SHSSR. Figure 2.1-1 illustrates the key process steps that SDH undergoes in its strategy development and how the SDH local SPP aligns with the processes of the SH system and SHSSR. The SH BOT and SMT conduct stra-tegic planning on an annual basis for the SH system (steps 1 and 2). SH sets short-term time (1-year) strategic targets for the system, based on SH’s planning cycle and the need for agility in the constantly changing health care environment. The long-term is set at five years. The five-year long-term perspective provides adequate timeframes for short-term and longer-term strategies to be implemented. All strategies are in alignment with the MVV, DASHBOARD and the five PILLARS. Using local stakeholder input, the SDH A-Team and the de-partment managers hold an annual retreat (step 3) to further refine our core competency, strategic challenges, strategic advantages, strategic objectives, and corresponding action plans. The Joint A-Team then undertakes its joint strategic planning process (step 4), with physician leadership adding to the discussion of strategic challenges, advantages, and oppor-tunities. Each year, the Joint A-Team also reviews and refines the SPP. Recent refinements of the SPP include the addition of the hospitalist physicians and ED physicians and community collaborators on the Planning Team. Out of these retreats come the primary outputs (step 5) of strategic objectives (2.1- 2), action plans, metrics, and process owners assigned to each. Deployment (step 6) of the strategic plan occurs year-round through integration and accountability down to the staff level (2.2-1). Operational agility and flexibility are achieved through senior leadership’s constant focus on workforce capacity and assessment of community needs. The A-Team and Joint A-Team regularly consider these factors and course correct as necessary throughout the year (step 7). Through the PIIT CREW process and PDSA cycles of improvement, we are able Figure 2.1-1 – Strategic Planning Process
SH/SHSSRAnnual
ST and LTTargets, MVV
Review, Systemand Region
Priorities
SDH A-Team &Department Managers
Annual
SWOT Analysis,Review/Refine CCs,
SCs, Sas & SOs,Validate KeyStakeholder
Requirements
A-Team & JointA-Team
Bi-Monthly
Evaluate actionplans and course
correct asnecessary
OutputsAnnual
Strategic Objectives,Action Plans, Metrics& Process Owners
(Figure 2.1-2)
Joint A-TeamAnnual
Refine &Collaborate onApplicable SOs
Deployment(Figure 2.2-1)
Year-Round Input
BOT members,Community Corporate
leaders, CEOs,Strategy & Business
Development andMarketing, ExternalExperts, Patients,
Medical Staff,Employers, Workforce,
and Vendors
1
23
45
67
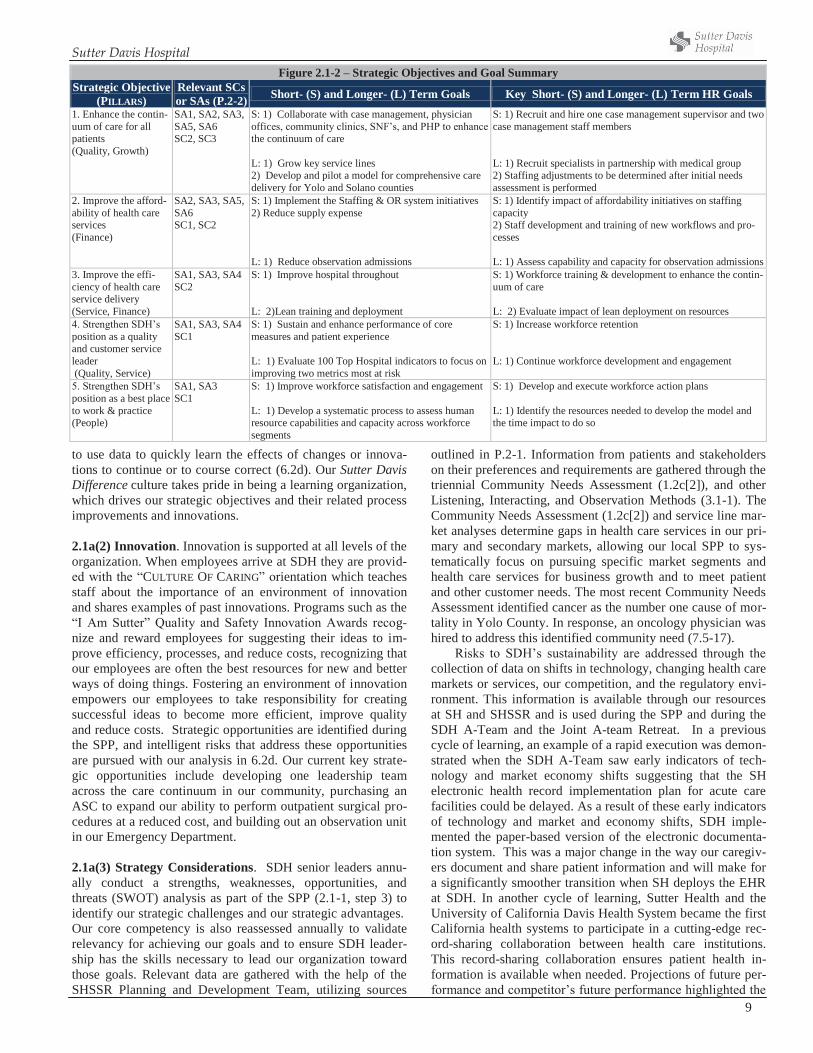
Sutter Davis Hospital
9
to use data to quickly learn the effects of changes or innova-tions to continue or to course correct (6.2d). Our Sutter Davis Difference culture takes pride in being a learning organization, which drives our strategic objectives and their related process improvements and innovations. 2.1a(2) Innovation. Innovation is supported at all levels of the organization. When employees arrive at SDH they are provid-ed with the “CULTURE OF CARING” orientation which teaches staff about the importance of an environment of innovation and shares examples of past innovations. Programs such as the “I Am Sutter” Quality and Safety Innovation Awards recog-nize and reward employees for suggesting their ideas to im-prove efficiency, processes, and reduce costs, recognizing that our employees are often the best resources for new and better ways of doing things. Fostering an environment of innovation empowers our employees to take responsibility for creating successful ideas to become more efficient, improve quality and reduce costs. Strategic opportunities are identified during the SPP, and intelligent risks that address these opportunities are pursued with our analysis in 6.2d. Our current key strate-gic opportunities include developing one leadership team across the care continuum in our community, purchasing an ASC to expand our ability to perform outpatient surgical pro-cedures at a reduced cost, and building out an observation unit in our Emergency Department. 2.1a(3) Strategy Considerations. SDH senior leaders annu-ally conduct a strengths, weaknesses, opportunities, and threats (SWOT) analysis as part of the SPP (2.1-1, step 3) to identify our strategic challenges and our strategic advantages. Our core competency is also reassessed annually to validate relevancy for achieving our goals and to ensure SDH leader-ship has the skills necessary to lead our organization toward those goals. Relevant data are gathered with the help of the SHSSR Planning and Development Team, utilizing sources
outlined in P.2-1. Information from patients and stakeholders on their preferences and requirements are gathered through the triennial Community Needs Assessment (1.2c[2]), and other Listening, Interacting, and Observation Methods (3.1-1). The Community Needs Assessment (1.2c[2]) and service line mar-ket analyses determine gaps in health care services in our pri-mary and secondary markets, allowing our local SPP to sys-tematically focus on pursuing specific market segments and health care services for business growth and to meet patient and other customer needs. The most recent Community Needs Assessment identified cancer as the number one cause of mor-tality in Yolo County. In response, an oncology physician was hired to address this identified community need (7.5-17).
Risks to SDH’s sustainability are addressed through the collection of data on shifts in technology, changing health care markets or services, our competition, and the regulatory envi-ronment. This information is available through our resources at SH and SHSSR and is used during the SPP and during the SDH A-Team and the Joint A-team Retreat. In a previous cycle of learning, an example of a rapid execution was demon-strated when the SDH A-Team saw early indicators of tech-nology and market economy shifts suggesting that the SH electronic health record implementation plan for acute care facilities could be delayed. As a result of these early indicators of technology and market and economy shifts, SDH imple-mented the paper-based version of the electronic documenta-tion system. This was a major change in the way our caregiv-ers document and share patient information and will make for a significantly smoother transition when SH deploys the EHR at SDH. In another cycle of learning, Sutter Health and the University of California Davis Health System became the first California health systems to participate in a cutting-edge rec-ord-sharing collaboration between health care institutions. This record-sharing collaboration ensures patient health in-formation is available when needed. Projections of future per-formance and competitor’s future performance highlighted the
Figure 2.1-2 – Strategic Objectives and Goal Summary Strategic Objective
(PILLARS) Relevant SCs or SAs (P.2-2) Short- (S) and Longer- (L) Term Goals Key Short- (S) and Longer- (L) Term HR Goals
1. Enhance the contin-uum of care for all patients (Quality, Growth)
SA1, SA2, SA3, SA5, SA6 SC2, SC3
S: 1) Collaborate with case management, physician offices, community clinics, SNF’s, and PHP to enhance the continuum of care L: 1) Grow key service lines 2) Develop and pilot a model for comprehensive care delivery for Yolo and Solano counties
S: 1) Recruit and hire one case management supervisor and two case management staff members L: 1) Recruit specialists in partnership with medical group 2) Staffing adjustments to be determined after initial needs assessment is performed
2. Improve the afford-ability of health care services (Finance)
SA2, SA3, SA5, SA6 SC1, SC2
S: 1) Implement the Staffing & OR system initiatives 2) Reduce supply expense L: 1) Reduce observation admissions
S: 1) Identify impact of affordability initiatives on staffing capacity 2) Staff development and training of new workflows and pro-cesses L: 1) Assess capability and capacity for observation admissions
3. Improve the effi-ciency of health care service delivery (Service, Finance)
SA1, SA3, SA4 SC2
S: 1) Improve hospital throughout L: 2)Lean training and deployment
S: 1) Workforce training & development to enhance the contin-uum of care L: 2) Evaluate impact of lean deployment on resources
4. Strengthen SDH’s position as a quality and customer service leader (Quality, Service)
SA1, SA3, SA4 SC1
S: 1) Sustain and enhance performance of core measures and patient experience L: 1) Evaluate 100 Top Hospital indicators to focus on improving two metrics most at risk
S: 1) Increase workforce retention L: 1) Continue workforce development and engagement
5. Strengthen SDH’s position as a best place to work & practice (People)
SA1, SA3 SC1
S: 1) Improve workforce satisfaction and engagement L: 1) Develop a systematic process to assess human resource capabilities and capacity across workforce segments
S: 1) Develop and execute workforce action plans L: 1) Identify the resources needed to develop the model and the time impact to do so
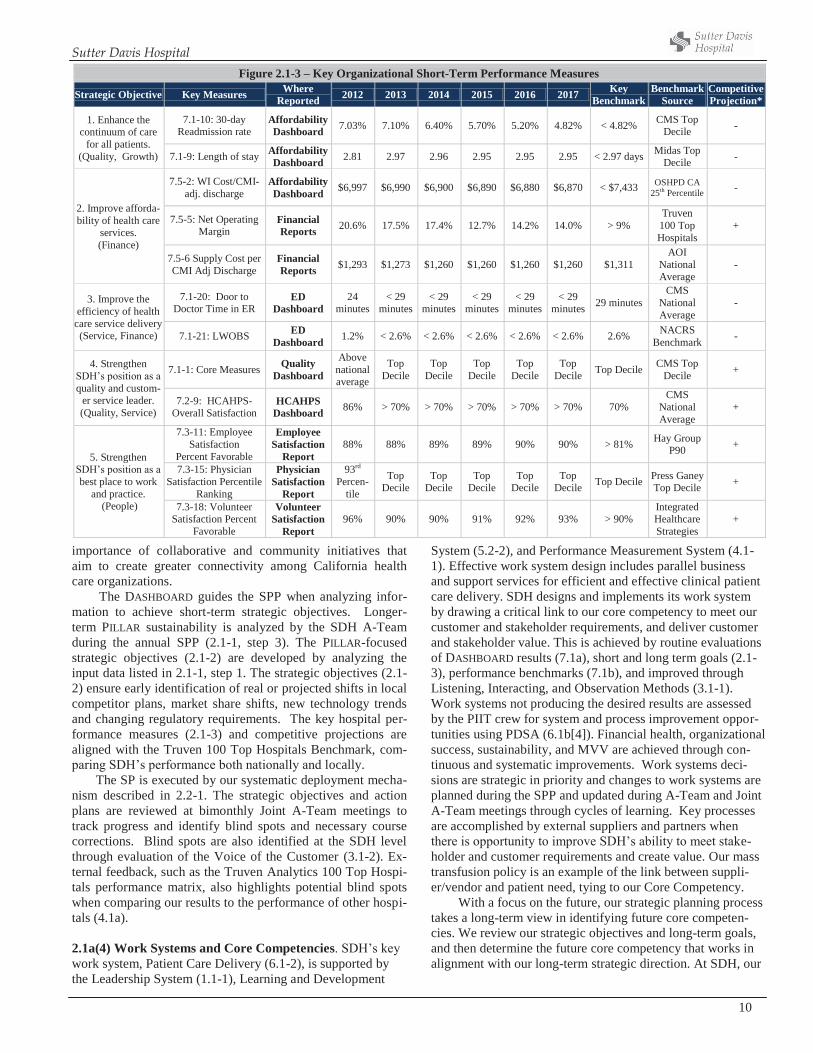
Sutter Davis Hospital
10
importance of collaborative and community initiatives that aim to create greater connectivity among California health care organizations.
The DASHBOARD guides the SPP when analyzing infor-mation to achieve short-term strategic objectives. Longer-term PILLAR sustainability is analyzed by the SDH A-Team during the annual SPP (2.1-1, step 3). The PILLAR-focused strategic objectives (2.1-2) are developed by analyzing the input data listed in 2.1-1, step 1. The strategic objectives (2.1-2) ensure early identification of real or projected shifts in local competitor plans, market share shifts, new technology trends and changing regulatory requirements. The key hospital per-formance measures (2.1-3) and competitive projections are aligned with the Truven 100 Top Hospitals Benchmark, com-paring SDH’s performance both nationally and locally.
The SP is executed by our systematic deployment mecha-nism described in 2.2-1. The strategic objectives and action plans are reviewed at bimonthly Joint A-Team meetings to track progress and identify blind spots and necessary course corrections. Blind spots are also identified at the SDH level through evaluation of the Voice of the Customer (3.1-2). Ex-ternal feedback, such as the Truven Analytics 100 Top Hospi-tals performance matrix, also highlights potential blind spots when comparing our results to the performance of other hospi-tals (4.1a).
2.1a(4) Work Systems and Core Competencies. SDH’s key work system, Patient Care Delivery (6.1-2), is supported by the Leadership System (1.1-1), Learning and Development
System (5.2-2), and Performance Measurement System (4.1-1). Effective work system design includes parallel business and support services for efficient and effective clinical patient care delivery. SDH designs and implements its work system by drawing a critical link to our core competency to meet our customer and stakeholder requirements, and deliver customer and stakeholder value. This is achieved by routine evaluations of DASHBOARD results (7.1a), short and long term goals (2.1-3), performance benchmarks (7.1b), and improved through Listening, Interacting, and Observation Methods (3.1-1). Work systems not producing the desired results are assessed by the PIIT crew for system and process improvement oppor-tunities using PDSA (6.1b[4]). Financial health, organizational success, sustainability, and MVV are achieved through con-tinuous and systematic improvements. Work systems deci-sions are strategic in priority and changes to work systems are planned during the SPP and updated during A-Team and Joint A-Team meetings through cycles of learning. Key processes are accomplished by external suppliers and partners when there is opportunity to improve SDH’s ability to meet stake-holder and customer requirements and create value. Our mass transfusion policy is an example of the link between suppli-er/vendor and patient need, tying to our Core Competency.
With a focus on the future, our strategic planning process takes a long-term view in identifying future core competen-cies. We review our strategic objectives and long-term goals, and then determine the future core competency that works in alignment with our long-term strategic direction. At SDH, our
Figure 2.1-3 – Key Organizational Short-Term Performance Measures
Strategic Objective Key Measures Where Reported 2012 2013 2014 2015 2016 2017 Key
Benchmark Benchmark
Source Competitive Projection*
1. Enhance the continuum of care
for all patients. (Quality, Growth)
7.1-10: 30-day Readmission rate
Affordability Dashboard 7.03% 7.10% 6.40% 5.70% 5.20% 4.82% < 4.82% CMS Top
Decile -
7.1-9: Length of stay Affordability Dashboard 2.81 2.97 2.96 2.95 2.95 2.95 < 2.97 days Midas Top
Decile -
2. Improve afforda-bility of health care
services. (Finance)
7.5-2: WI Cost/CMI-adj. discharge
Affordability Dashboard $6,997 $6,990 $6,900 $6,890 $6,880 $6,870 < $7,433 OSHPD CA
25th Percentile -
7.5-5: Net Operating Margin
Financial Reports 20.6% 17.5% 17.4% 12.7% 14.2% 14.0% > 9%
Truven 100 Top Hospitals
+
7.5-6 Supply Cost per CMI Adj Discharge
Financial Reports $1,293 $1,273 $1,260 $1,260 $1,260 $1,260 $1,311
AOI National Average
-
3. Improve the efficiency of health
care service delivery (Service, Finance)
7.1-20: Door to Doctor Time in ER
ED Dashboard
24 minutes
< 29 minutes
< 29 minutes
< 29 minutes
< 29 minutes
< 29 minutes 29 minutes
CMS National Average
-
7.1-21: LWOBS ED Dashboard 1.2% < 2.6% < 2.6% < 2.6% < 2.6% < 2.6% 2.6% NACRS
Benchmark -
4. Strengthen SDH’s position as a quality and custom-
er service leader. (Quality, Service)
7.1-1: Core Measures Quality Dashboard
Above national average
Top Decile
Top Decile
Top Decile
Top Decile
Top Decile Top Decile CMS Top
Decile +
7.2-9: HCAHPS- Overall Satisfaction
HCAHPS Dashboard 86% > 70% > 70% > 70% > 70% > 70% 70%
CMS National Average
+
5. Strengthen SDH’s position as a best place to work
and practice. (People)
7.3-11: Employee Satisfaction
Percent Favorable
Employee Satisfaction
Report 88% 88% 89% 89% 90% 90% > 81% Hay Group
P90 +
7.3-15: Physician Satisfaction Percentile
Ranking
Physician Satisfaction
Report
93rd Percen-
tile
Top Decile
Top Decile
Top Decile
Top Decile
Top Decile Top Decile Press Ganey
Top Decile +
7.3-18: Volunteer Satisfaction Percent
Favorable
Volunteer Satisfaction
Report 96% 90% 90% 91% 92% 93% > 90%
Integrated Healthcare Strategies
+
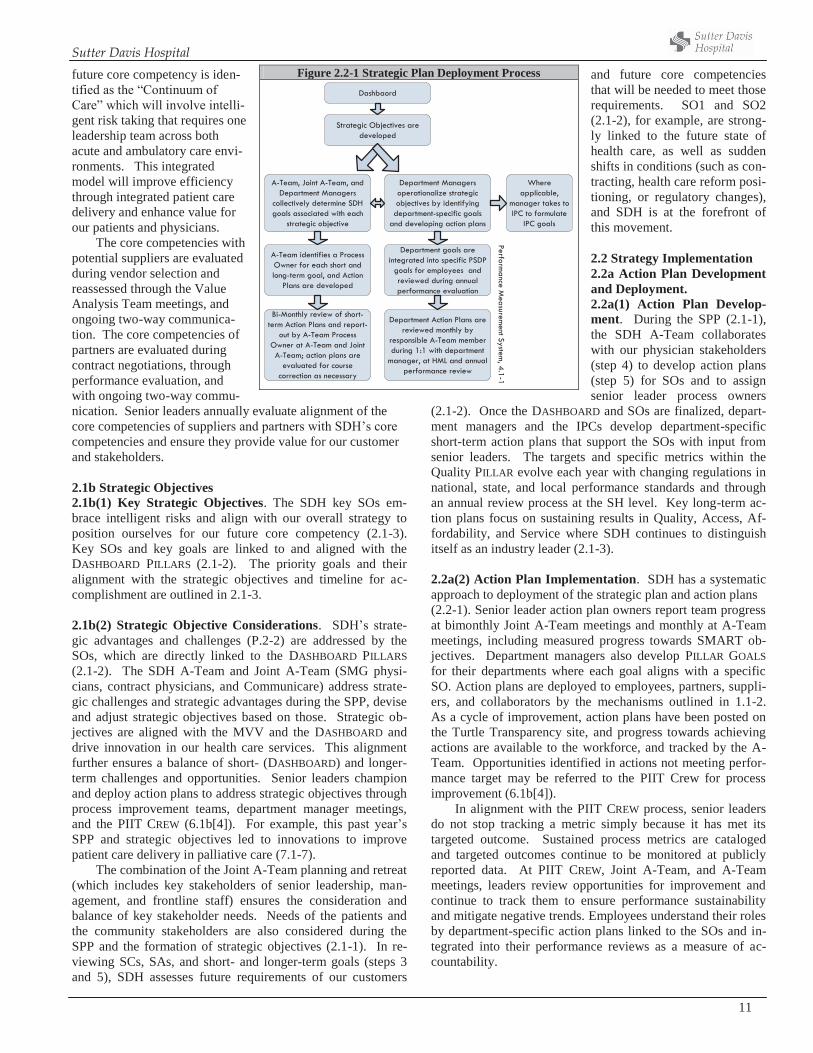
Sutter Davis Hospital
11
future core competency is iden-tified as the “Continuum of Care” which will involve intelli-gent risk taking that requires one leadership team across both acute and ambulatory care envi-ronments. This integrated model will improve efficiency through integrated patient care delivery and enhance value for our patients and physicians.
The core competencies with potential suppliers are evaluated during vendor selection and reassessed through the Value Analysis Team meetings, and ongoing two-way communica-tion. The core competencies of partners are evaluated during contract negotiations, through performance evaluation, and with ongoing two-way commu-nication. Senior leaders annually evaluate alignment of the core competencies of suppliers and partners with SDH’s core competencies and ensure they provide value for our customer and stakeholders. 2.1b Strategic Objectives 2.1b(1) Key Strategic Objectives. The SDH key SOs em-brace intelligent risks and align with our overall strategy to position ourselves for our future core competency (2.1-3). Key SOs and key goals are linked to and aligned with the DASHBOARD PILLARS (2.1-2). The priority goals and their alignment with the strategic objectives and timeline for ac-complishment are outlined in 2.1-3. 2.1b(2) Strategic Objective Considerations. SDH’s strate-gic advantages and challenges (P.2-2) are addressed by the SOs, which are directly linked to the DASHBOARD PILLARS (2.1-2). The SDH A-Team and Joint A-Team (SMG physi-cians, contract physicians, and Communicare) address strate-gic challenges and strategic advantages during the SPP, devise and adjust strategic objectives based on those. Strategic ob-jectives are aligned with the MVV and the DASHBOARD and drive innovation in our health care services. This alignment further ensures a balance of short- (DASHBOARD) and longer-term challenges and opportunities. Senior leaders champion and deploy action plans to address strategic objectives through process improvement teams, department manager meetings, and the PIIT CREW (6.1b[4]). For example, this past year’s SPP and strategic objectives led to innovations to improve patient care delivery in palliative care (7.1-7). The combination of the Joint A-Team planning and retreat (which includes key stakeholders of senior leadership, man-agement, and frontline staff) ensures the consideration and balance of key stakeholder needs. Needs of the patients and the community stakeholders are also considered during the SPP and the formation of strategic objectives (2.1-1). In re-viewing SCs, SAs, and short- and longer-term goals (steps 3 and 5), SDH assesses future requirements of our customers
and future core competencies that will be needed to meet those requirements. SO1 and SO2 (2.1-2), for example, are strong-ly linked to the future state of health care, as well as sudden shifts in conditions (such as con-tracting, health care reform posi-tioning, or regulatory changes), and SDH is at the forefront of this movement. 2.2 Strategy Implementation 2.2a Action Plan Development and Deployment. 2.2a(1) Action Plan Develop-ment. During the SPP (2.1-1), the SDH A-Team collaborates with our physician stakeholders (step 4) to develop action plans (step 5) for SOs and to assign senior leader process owners
(2.1-2). Once the DASHBOARD and SOs are finalized, depart-ment managers and the IPCs develop department-specific short-term action plans that support the SOs with input from senior leaders. The targets and specific metrics within the Quality PILLAR evolve each year with changing regulations in national, state, and local performance standards and through an annual review process at the SH level. Key long-term ac-tion plans focus on sustaining results in Quality, Access, Af-fordability, and Service where SDH continues to distinguish itself as an industry leader (2.1-3). 2.2a(2) Action Plan Implementation. SDH has a systematic approach to deployment of the strategic plan and action plans (2.2-1). Senior leader action plan owners report team progress at bimonthly Joint A-Team meetings and monthly at A-Team meetings, including measured progress towards SMART ob-jectives. Department managers also develop PILLAR GOALS for their departments where each goal aligns with a specific SO. Action plans are deployed to employees, partners, suppli-ers, and collaborators by the mechanisms outlined in 1.1-2. As a cycle of improvement, action plans have been posted on the Turtle Transparency site, and progress towards achieving actions are available to the workforce, and tracked by the A-Team. Opportunities identified in actions not meeting perfor-mance target may be referred to the PIIT Crew for process improvement (6.1b[4]).
In alignment with the PIIT CREW process, senior leaders do not stop tracking a metric simply because it has met its targeted outcome. Sustained process metrics are cataloged and targeted outcomes continue to be monitored at publicly reported data. At PIIT CREW, Joint A-Team, and A-Team meetings, leaders review opportunities for improvement and continue to track them to ensure performance sustainability and mitigate negative trends. Employees understand their roles by department-specific action plans linked to the SOs and in-tegrated into their performance reviews as a measure of ac-countability.
Figure 2.2-1 Strategic Plan Deployment Process
Performance M
easurement System
, 4.1-1
Strategic Objectives are developed
Department Managers operationalize strategic objectives by identifying
department-specific goals and developing action plans
Department goals are integrated into specific PSDP
goals for employees and reviewed during annual performance evaluation
Department Action Plans are reviewed monthly by
responsible A-Team member during 1:1 with department
manager, at HML and annual performance review
Bi-Monthly review of short-term Action Plans and report-
out by A-Team Process Owner at A-Team and Joint A-Team; action plans are
evaluated for course correction as necessary
A-Team, Joint A-Team, and Department Managers
collectively determine SDH goals associated with each
strategic objective
A-Team identifies a Process Owner for each short and long-term goal, and Action
Plans are developed
Where applicable,
manager takes to IPC to formulate
IPC goals
Dashbaord
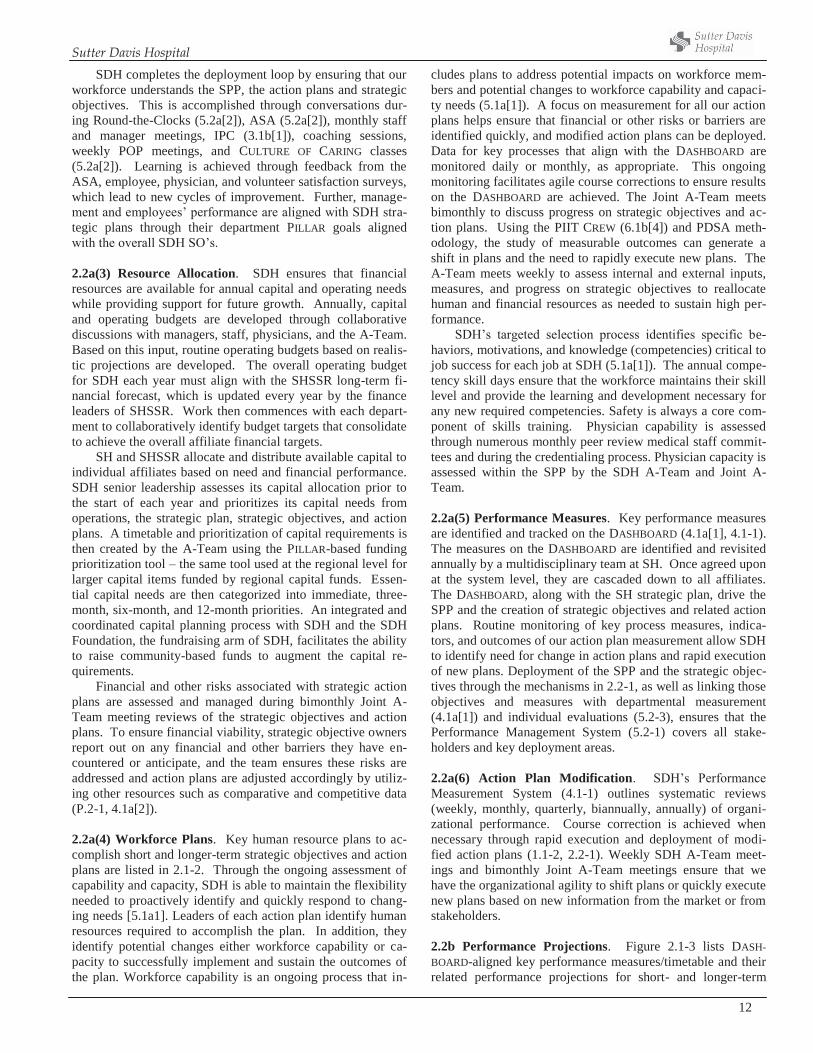
Sutter Davis Hospital
12
SDH completes the deployment loop by ensuring that our workforce understands the SPP, the action plans and strategic objectives. This is accomplished through conversations dur-ing Round-the-Clocks (5.2a[2]), ASA (5.2a[2]), monthly staff and manager meetings, IPC (3.1b[1]), coaching sessions, weekly POP meetings, and CULTURE OF CARING classes (5.2a[2]). Learning is achieved through feedback from the ASA, employee, physician, and volunteer satisfaction surveys, which lead to new cycles of improvement. Further, manage-ment and employees’ performance are aligned with SDH stra-tegic plans through their department PILLAR goals aligned with the overall SDH SO’s. 2.2a(3) Resource Allocation. SDH ensures that financial resources are available for annual capital and operating needs while providing support for future growth. Annually, capital and operating budgets are developed through collaborative discussions with managers, staff, physicians, and the A-Team. Based on this input, routine operating budgets based on realis-tic projections are developed. The overall operating budget for SDH each year must align with the SHSSR long-term fi-nancial forecast, which is updated every year by the finance leaders of SHSSR. Work then commences with each depart-ment to collaboratively identify budget targets that consolidate to achieve the overall affiliate financial targets.
SH and SHSSR allocate and distribute available capital to individual affiliates based on need and financial performance. SDH senior leadership assesses its capital allocation prior to the start of each year and prioritizes its capital needs from operations, the strategic plan, strategic objectives, and action plans. A timetable and prioritization of capital requirements is then created by the A-Team using the PILLAR-based funding prioritization tool – the same tool used at the regional level for larger capital items funded by regional capital funds. Essen-tial capital needs are then categorized into immediate, three-month, six-month, and 12-month priorities. An integrated and coordinated capital planning process with SDH and the SDH Foundation, the fundraising arm of SDH, facilitates the ability to raise community-based funds to augment the capital re-quirements.
Financial and other risks associated with strategic action plans are assessed and managed during bimonthly Joint A-Team meeting reviews of the strategic objectives and action plans. To ensure financial viability, strategic objective owners report out on any financial and other barriers they have en-countered or anticipate, and the team ensures these risks are addressed and action plans are adjusted accordingly by utiliz-ing other resources such as comparative and competitive data (P.2-1, 4.1a[2]). 2.2a(4) Workforce Plans. Key human resource plans to ac-complish short and longer-term strategic objectives and action plans are listed in 2.1-2. Through the ongoing assessment of capability and capacity, SDH is able to maintain the flexibility needed to proactively identify and quickly respond to chang-ing needs [5.1a1]. Leaders of each action plan identify human resources required to accomplish the plan. In addition, they identify potential changes either workforce capability or ca-pacity to successfully implement and sustain the outcomes of the plan. Workforce capability is an ongoing process that in-
cludes plans to address potential impacts on workforce mem-bers and potential changes to workforce capability and capaci-ty needs (5.1a[1]). A focus on measurement for all our action plans helps ensure that financial or other risks or barriers are identified quickly, and modified action plans can be deployed. Data for key processes that align with the DASHBOARD are monitored daily or monthly, as appropriate. This ongoing monitoring facilitates agile course corrections to ensure results on the DASHBOARD are achieved. The Joint A-Team meets bimonthly to discuss progress on strategic objectives and ac-tion plans. Using the PIIT CREW (6.1b[4]) and PDSA meth-odology, the study of measurable outcomes can generate a shift in plans and the need to rapidly execute new plans. The A-Team meets weekly to assess internal and external inputs, measures, and progress on strategic objectives to reallocate human and financial resources as needed to sustain high per-formance.
SDH’s targeted selection process identifies specific be-haviors, motivations, and knowledge (competencies) critical to job success for each job at SDH (5.1a[1]). The annual compe-tency skill days ensure that the workforce maintains their skill level and provide the learning and development necessary for any new required competencies. Safety is always a core com-ponent of skills training. Physician capability is assessed through numerous monthly peer review medical staff commit-tees and during the credentialing process. Physician capacity is assessed within the SPP by the SDH A-Team and Joint A-Team. 2.2a(5) Performance Measures. Key performance measures are identified and tracked on the DASHBOARD (4.1a[1], 4.1-1). The measures on the DASHBOARD are identified and revisited annually by a multidisciplinary team at SH. Once agreed upon at the system level, they are cascaded down to all affiliates. The DASHBOARD, along with the SH strategic plan, drive the SPP and the creation of strategic objectives and related action plans. Routine monitoring of key process measures, indica-tors, and outcomes of our action plan measurement allow SDH to identify need for change in action plans and rapid execution of new plans. Deployment of the SPP and the strategic objec-tives through the mechanisms in 2.2-1, as well as linking those objectives and measures with departmental measurement (4.1a[1]) and individual evaluations (5.2-3), ensures that the Performance Management System (5.2-1) covers all stake-holders and key deployment areas. 2.2a(6) Action Plan Modification. SDH’s Performance Measurement System (4.1-1) outlines systematic reviews (weekly, monthly, quarterly, biannually, annually) of organi-zational performance. Course correction is achieved when necessary through rapid execution and deployment of modi-fied action plans (1.1-2, 2.2-1). Weekly SDH A-Team meet-ings and bimonthly Joint A-Team meetings ensure that we have the organizational agility to shift plans or quickly execute new plans based on new information from the market or from stakeholders. 2.2b Performance Projections. Figure 2.1-3 lists DASH-BOARD-aligned key performance measures/timetable and their related performance projections for short- and longer-term
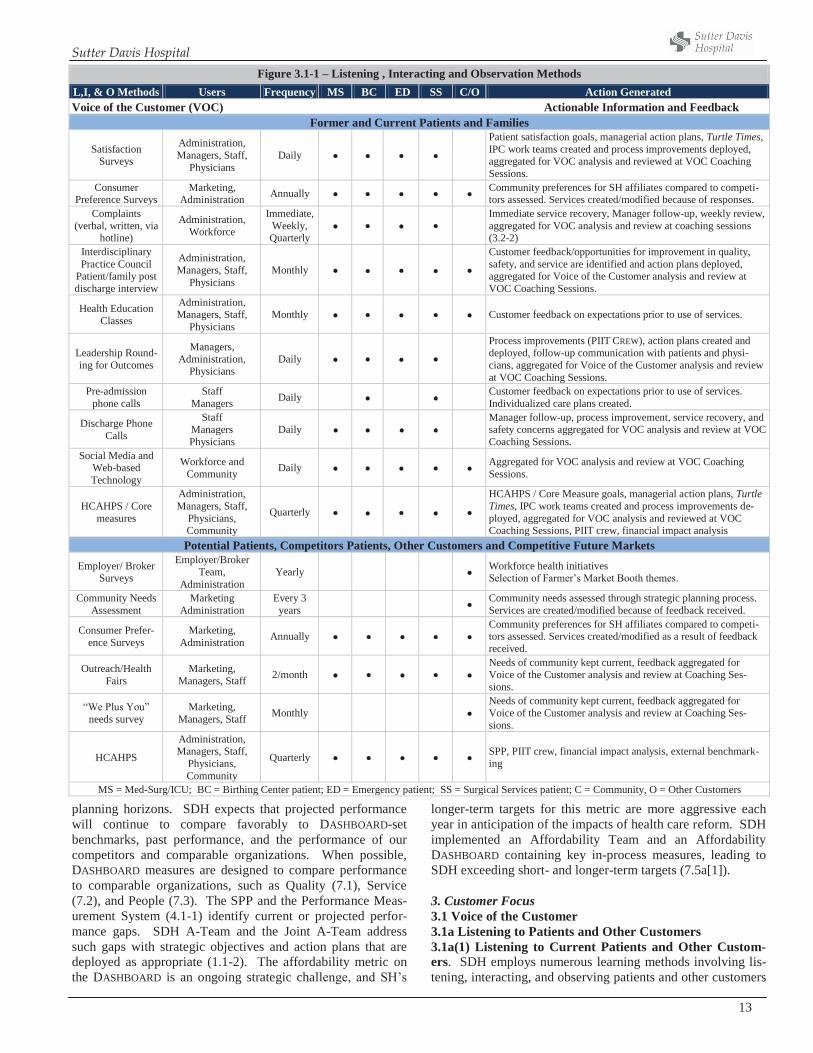
Sutter Davis Hospital
13
planning horizons. SDH expects that projected performance will continue to compare favorably to DASHBOARD-set benchmarks, past performance, and the performance of our competitors and comparable organizations. When possible, DASHBOARD measures are designed to compare performance to comparable organizations, such as Quality (7.1), Service (7.2), and People (7.3). The SPP and the Performance Meas-urement System (4.1-1) identify current or projected perfor-mance gaps. SDH A-Team and the Joint A-Team address such gaps with strategic objectives and action plans that are deployed as appropriate (1.1-2). The affordability metric on the DASHBOARD is an ongoing strategic challenge, and SH’s
longer-term targets for this metric are more aggressive each year in anticipation of the impacts of health care reform. SDH implemented an Affordability Team and an Affordability DASHBOARD containing key in-process measures, leading to SDH exceeding short- and longer-term targets (7.5a[1]). 3. Customer Focus 3.1 Voice of the Customer 3.1a Listening to Patients and Other Customers 3.1a(1) Listening to Current Patients and Other Custom-ers. SDH employs numerous learning methods involving lis-tening, interacting, and observing patients and other customers
Figure 3.1-1 – Listening , Interacting and Observation Methods L,I, & O Methods Users Frequency MS BC ED SS C/O Action Generated Voice of the Customer (VOC) Actionable Information and Feedback
Former and Current Patients and Families
Satisfaction Surveys
Administration, Managers, Staff,
Physicians Daily
Patient satisfaction goals, managerial action plans, Turtle Times, IPC work teams created and process improvements deployed, aggregated for VOC analysis and reviewed at VOC Coaching Sessions.
Consumer Preference Surveys
Marketing, Administration Annually Community preferences for SH affiliates compared to competi-
tors assessed. Services created/modified because of responses. Complaints
(verbal, written, via hotline)
Administration, Workforce
Immediate, Weekly, Quarterly
Immediate service recovery, Manager follow-up, weekly review, aggregated for VOC analysis and review at coaching sessions (3.2-2)
Interdisciplinary Practice Council
Patient/family post discharge interview
Administration, Managers, Staff,
Physicians Monthly
Customer feedback/opportunities for improvement in quality, safety, and service are identified and action plans deployed, aggregated for Voice of the Customer analysis and review at VOC Coaching Sessions.
Health Education Classes
Administration, Managers, Staff,
Physicians Monthly Customer feedback on expectations prior to use of services.
Leadership Round-ing for Outcomes
Managers, Administration,
Physicians Daily
Process improvements (PIIT CREW), action plans created and deployed, follow-up communication with patients and physi-cians, aggregated for Voice of the Customer analysis and review at VOC Coaching Sessions.
Pre-admission phone calls
Staff Managers Daily Customer feedback on expectations prior to use of services.
Individualized care plans created.
Discharge Phone Calls
Staff Managers Physicians
Daily Manager follow-up, process improvement, service recovery, and safety concerns aggregated for VOC analysis and review at VOC Coaching Sessions.
Social Media and Web-based Technology
Workforce and Community Daily Aggregated for VOC analysis and review at VOC Coaching
Sessions.
HCAHPS / Core measures
Administration, Managers, Staff,
Physicians, Community
Quarterly
HCAHPS / Core Measure goals, managerial action plans, Turtle Times, IPC work teams created and process improvements de-ployed, aggregated for VOC analysis and reviewed at VOC Coaching Sessions, PIIT crew, financial impact analysis
Potential Patients, Competitors Patients, Other Customers and Competitive Future Markets
Employer/ Broker Surveys
Employer/Broker Team,
Administration Yearly Workforce health initiatives
Selection of Farmer’s Market Booth themes.
Community Needs Assessment
Marketing Administration
Every 3 years Community needs assessed through strategic planning process.
Services are created/modified because of feedback received.
Consumer Prefer-ence Surveys
Marketing, Administration Annually
Community preferences for SH affiliates compared to competi-tors assessed. Services created/modified as a result of feedback received.
Outreach/Health Fairs
Marketing, Managers, Staff 2/month
Needs of community kept current, feedback aggregated for Voice of the Customer analysis and review at Coaching Ses-sions.
“We Plus You” needs survey
Marketing, Managers, Staff Monthly
Needs of community kept current, feedback aggregated for Voice of the Customer analysis and review at Coaching Ses-sions.
HCAHPS
Administration, Managers, Staff,
Physicians, Community
Quarterly SPP, PIIT crew, financial impact analysis, external benchmark-ing
MS = Med-Surg/ICU; BC = Birthing Center patient; ED = Emergency patient; SS = Surgical Services patient; C = Community, O = Other Customers
Sutter Davis Hospital
14
(3.1-1). SDH has a robust, systematic VOICE OF THE CUS-TOMER (VOC) process that provides actionable information on former and current patients and other customers. VOC infor-mation is gathered from many different methods, including patient comments, patient satisfaction surveys, Interdiscipli-nary Partnership Council (IPC) patient interviews, discharge phone calls, social media postings, “We plus You,” survey and community need surveys; such information is aggregated in the quarterly VOC report. The report is reviewed by the A-team, and shared with managers in coaching sessions. The VOC methods have undergone several cycles of improvement with changes to rounding, discharge phone calls, IPC inter-view format, social media monitoring and most recently the addition of the “We Plus You,” survey in 2013. SDH tailors listening, interactive and observation methods to patients and other customers during each stage of our relationship from former and current patients, to potential new patients and the community. The VOC input report categorizes the information further by providing source, HCAHPS domain and classifica-tion of Key Customer Requirements (P.1-7). The VOC output report a summary of identified OFIs (3.1-3) is presented quar-terly as described in (3.1-2). By maintaining active relation-ships with local physician groups, community clinics and pri-vate/governmental insurers, varying methods have been de-veloped to seek immediate and actionable feedback allowing follow-up strategies to be developed, as appropriate. Through the VOC, the Birthing Center identified the need to modernize rooms, create a calm environment for birthing, and provide more comfortable accommodations for dads and guests. This need was addressed through the 2011 matching grant fund, (Happy Beginnings) with the engagement of philanthropy administration and the community.
Customer information gathered through social media such as Twitter, Facebook , Yelp, and Davis Wiki are incorporated into the VOC process. The VOC process is reviewed by SDH leadership on an annual basis for relevance and effectiveness utilizing the process outlined in figure 4.1-1. In a cycle of im-provement, in order to better identify and act on patient, com-munity and other customer needs, utilizing SH’s new brand “We Plus You,” a needs survey was created and deployed through local community outreach events. Feedback is in-cluded in the VOC database. In listening to our community, a key market segment, SDH reviews the annual community preferences survey and the triennial Community Needs As-sessment (1.2c[2]) to identify the pressing needs of our com-munity.
3.1a(2) Listening to Potential Patients and Other Custom-ers. Patient satisfaction surveys and other listening methods (3.1-1) are the ways we listen to our former patients and assess their perception of our services, support, and safety. SDH participates in Hospital Consumer Assessment of Healthcare Providers and Systems (HCAHPS) a survey tool that is de-signed to solicit patient feedback. We also use this publicly reported information to gauge our performance in comparisons with other hospitals (7.2-10, 7.2-15). We listen to potential patients and patients of competitors through the SH-developed Employer Broker Program in (3.1-1). The qualitative Con-sumer Preference Survey lets us know where our brand sits in relation with our competitors. Recently SH brand was changed
to “We Plus You” as a result to listening to our current pa-tients, potential patients and other customers. Complaint data that may affect potential patients and other customers purchas-ing and engagement decisions is analyzed and acted upon (3.2b[2]). We listen to competitors’ patients through printed and social media to use as feedback into the VOC. 3.1b Determination of Patient and Other Customer Satis-faction and Engagement 3.1b(1) Satisfaction and Engagement. Patient and other cus-tomer satisfaction and engagement is assessed through survey tools described in Listening, Interacting, and Observation Methods (3.1-1). Satisfaction and engagement are assessed by results of targeted questions separated by market segment. A randomized sampling of patients from each market segment receives a satisfaction and engagement survey following dis-charge from SDH (3.1-1). The Measurement Team then uses survey results to interface with the Rewards and Recognition Team, rewarding and recognizing high performance of de-partments or individuals. The Patient Satisfaction Team uses survey results to identify opportunities for improvement and develop quarterly action items and deployment plans based on the results. Staff representatives from all departments on the Patient Satisfaction Team and the Rewards and Recognition Team ensure deployment of both recognition and actionable improvement initiatives. Managers use VOC and Turtle Times poster to discuss physician-related patient satisfaction and engagement results during regular collaborative practice meet-ings, ensuring the engagement of our physician partners in the process of exceeding patient and stakeholder expectations.
We also elicit direct face-to-face feedback on patient satis-faction and engagement through various patient feedback methods (3.1-1), such as quarterly invitations to patients who attend our INTERDISCIPLINARY PRACTICE COUNCILS (IPCs).
The IPCs are frontline staff committees with the goal of improving safety and care at the bedside. Physician partners in each of the four market segments participate in these dis-cussions as well. Each of the four IPCs invites a patient to the council meetings on a quarterly basis, giving SDH unique op-portunities to hear directly from customers about positive and negative experiences of the care they received. A-Team members participate in these patient interview sessions and help ensure that councils take actionable information away from these discussions, and have the resources they need to make any changes identified. Having a unique council for each customer segment, the Med-Surg/ICU Council, Birthing Center Council, Emergency Department Council, and Surgery Council, allows us to target deployment to each patient seg-ment. Staff members of the IPCs are responsible for deploy-ing key messages from each month’s meeting to their depart-ment coworkers through a systematic 1:1 communication pro-cess.
All survey results, lessons learned from patient IPC dis-cussions, and additional methods described in Listening, Inter-acting, and Observation Methods (3.1-1) are aggregated, sepa-rated by market segment, and in a cycle of improvement based on our annual Baldrige assessment process, presented as the Voice of the Customer (VOC, 3.1-2) by the Measurement Team quarterly at VOC POP Sessions. At these designated VOC POP Sessions, process-related opportunities for im-
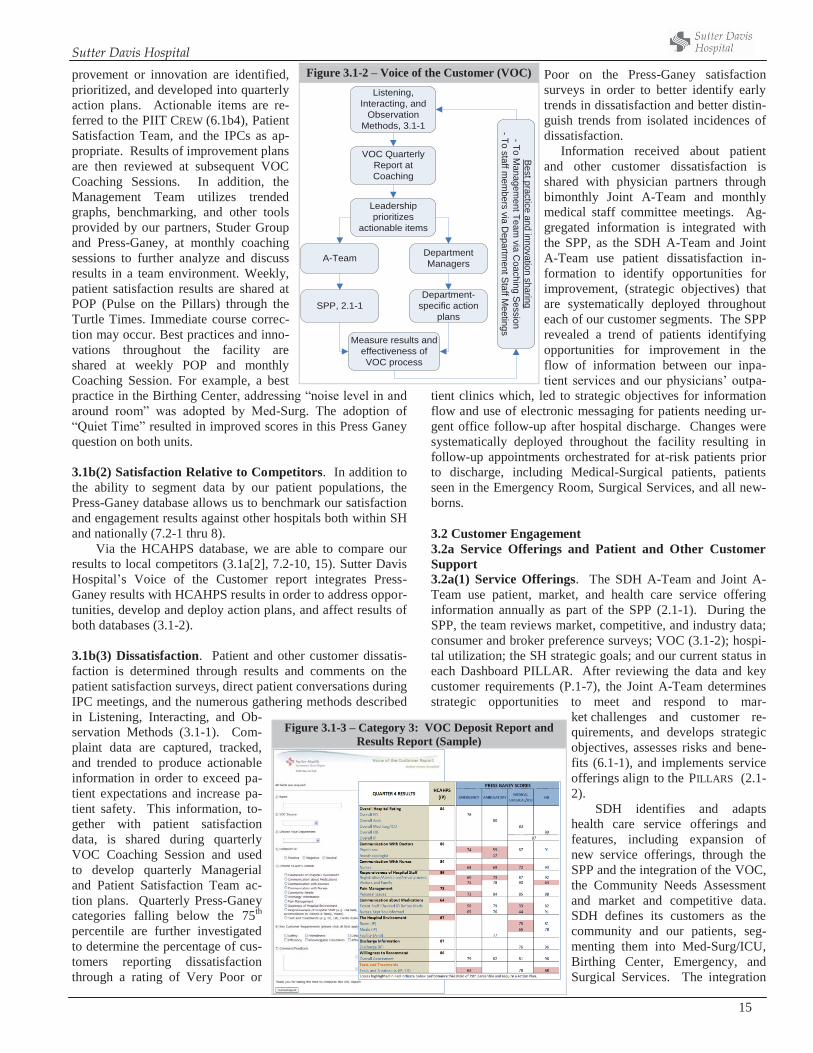
Sutter Davis Hospital
15
provement or innovation are identified, prioritized, and developed into quarterly action plans. Actionable items are re-ferred to the PIIT CREW (6.1b4), Patient Satisfaction Team, and the IPCs as ap-propriate. Results of improvement plans are then reviewed at subsequent VOC Coaching Sessions. In addition, the Management Team utilizes trended graphs, benchmarking, and other tools provided by our partners, Studer Group and Press-Ganey, at monthly coaching sessions to further analyze and discuss results in a team environment. Weekly, patient satisfaction results are shared at POP (Pulse on the Pillars) through the Turtle Times. Immediate course correc-tion may occur. Best practices and inno-vations throughout the facility are shared at weekly POP and monthly Coaching Session. For example, a best practice in the Birthing Center, addressing “noise level in and around room” was adopted by Med-Surg. The adoption of “Quiet Time” resulted in improved scores in this Press Ganey question on both units. 3.1b(2) Satisfaction Relative to Competitors. In addition to the ability to segment data by our patient populations, the Press-Ganey database allows us to benchmark our satisfaction and engagement results against other hospitals both within SH and nationally (7.2-1 thru 8).
Via the HCAHPS database, we are able to compare our results to local competitors (3.1a[2], 7.2-10, 15). Sutter Davis Hospital’s Voice of the Customer report integrates Press-Ganey results with HCAHPS results in order to address oppor-tunities, develop and deploy action plans, and affect results of both databases (3.1-2). 3.1b(3) Dissatisfaction. Patient and other customer dissatis-faction is determined through results and comments on the patient satisfaction surveys, direct patient conversations during IPC meetings, and the numerous gathering methods described in Listening, Interacting, and Ob-servation Methods (3.1-1). Com-plaint data are captured, tracked, and trended to produce actionable information in order to exceed pa-tient expectations and increase pa-tient safety. This information, to-gether with patient satisfaction data, is shared during quarterly VOC Coaching Session and used to develop quarterly Managerial and Patient Satisfaction Team ac-tion plans. Quarterly Press-Ganey categories falling below the 75th percentile are further investigated to determine the percentage of cus-tomers reporting dissatisfaction through a rating of Very Poor or
Poor on the Press-Ganey satisfaction surveys in order to better identify early trends in dissatisfaction and better distin-guish trends from isolated incidences of dissatisfaction. Information received about patient and other customer dissatisfaction is shared with physician partners through bimonthly Joint A-Team and monthly medical staff committee meetings. Ag-gregated information is integrated with the SPP, as the SDH A-Team and Joint A-Team use patient dissatisfaction in-formation to identify opportunities for improvement, (strategic objectives) that are systematically deployed throughout each of our customer segments. The SPP revealed a trend of patients identifying opportunities for improvement in the flow of information between our inpa-tient services and our physicians’ outpa-
tient clinics which, led to strategic objectives for information flow and use of electronic messaging for patients needing ur-gent office follow-up after hospital discharge. Changes were systematically deployed throughout the facility resulting in follow-up appointments orchestrated for at-risk patients prior to discharge, including Medical-Surgical patients, patients seen in the Emergency Room, Surgical Services, and all new-borns. 3.2 Customer Engagement 3.2a Service Offerings and Patient and Other Customer Support 3.2a(1) Service Offerings. The SDH A-Team and Joint A-Team use patient, market, and health care service offering information annually as part of the SPP (2.1-1). During the SPP, the team reviews market, competitive, and industry data; consumer and broker preference surveys; VOC (3.1-2); hospi-tal utilization; the SH strategic goals; and our current status in each Dashboard PILLAR. After reviewing the data and key customer requirements (P.1-7), the Joint A-Team determines strategic opportunities to meet and respond to mar-
ket challenges and customer re-quirements, and develops strategic objectives, assesses risks and bene-fits (6.1-1), and implements service offerings align to the PILLARS (2.1-2).
SDH identifies and adapts health care service offerings and features, including expansion of new service offerings, through the SPP and the integration of the VOC, the Community Needs Assessment and market and competitive data. SDH defines its customers as the community and our patients, seg-menting them into Med-Surg/ICU, Birthing Center, Emergency, and Surgical Services. The integration
Figure 3.1-2 – Voice of the Customer (VOC) Listening,
Interacting, andObservation
Methods, 3.1-1
VOC QuarterlyReport atCoaching
Leadershipprioritizes
actionable items
A-Team
SPP, 2.1-1
DepartmentManagers
Department-specific action
plans
Measure results andeffectiveness ofVOC process
Bestpracticeand
innovationsharing
-ToM
anagementTeam
viaC
oachingSession
-Tostaffm
embers
viaD
epartmentStaffM
eetings
Figure 3.1-3 – Category 3: VOC Deposit Report and Results Report (Sample)
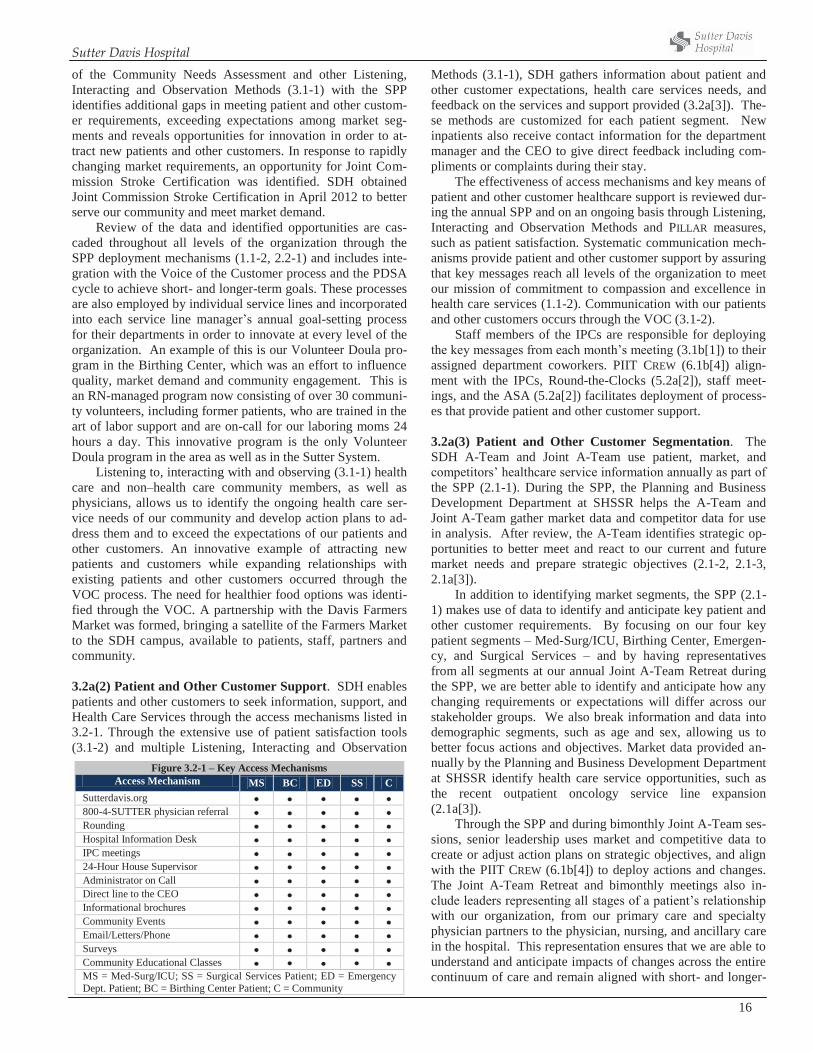
Sutter Davis Hospital
16
of the Community Needs Assessment and other Listening, Interacting and Observation Methods (3.1-1) with the SPP identifies additional gaps in meeting patient and other custom-er requirements, exceeding expectations among market seg-ments and reveals opportunities for innovation in order to at-tract new patients and other customers. In response to rapidly changing market requirements, an opportunity for Joint Com-mission Stroke Certification was identified. SDH obtained Joint Commission Stroke Certification in April 2012 to better serve our community and meet market demand.
Review of the data and identified opportunities are cas-caded throughout all levels of the organization through the SPP deployment mechanisms (1.1-2, 2.2-1) and includes inte-gration with the Voice of the Customer process and the PDSA cycle to achieve short- and longer-term goals. These processes are also employed by individual service lines and incorporated into each service line manager’s annual goal-setting process for their departments in order to innovate at every level of the organization. An example of this is our Volunteer Doula pro-gram in the Birthing Center, which was an effort to influence quality, market demand and community engagement. This is an RN-managed program now consisting of over 30 communi-ty volunteers, including former patients, who are trained in the art of labor support and are on-call for our laboring moms 24 hours a day. This innovative program is the only Volunteer Doula program in the area as well as in the Sutter System.
Listening to, interacting with and observing (3.1-1) health care and non–health care community members, as well as physicians, allows us to identify the ongoing health care ser-vice needs of our community and develop action plans to ad-dress them and to exceed the expectations of our patients and other customers. An innovative example of attracting new patients and customers while expanding relationships with existing patients and other customers occurred through the VOC process. The need for healthier food options was identi-fied through the VOC. A partnership with the Davis Farmers Market was formed, bringing a satellite of the Farmers Market to the SDH campus, available to patients, staff, partners and community.
3.2a(2) Patient and Other Customer Support. SDH enables patients and other customers to seek information, support, and Health Care Services through the access mechanisms listed in 3.2-1. Through the extensive use of patient satisfaction tools (3.1-2) and multiple Listening, Interacting and Observation
Methods (3.1-1), SDH gathers information about patient and other customer expectations, health care services needs, and feedback on the services and support provided (3.2a[3]). The-se methods are customized for each patient segment. New inpatients also receive contact information for the department manager and the CEO to give direct feedback including com-pliments or complaints during their stay.
The effectiveness of access mechanisms and key means of patient and other customer healthcare support is reviewed dur-ing the annual SPP and on an ongoing basis through Listening, Interacting and Observation Methods and PILLAR measures, such as patient satisfaction. Systematic communication mech-anisms provide patient and other customer support by assuring that key messages reach all levels of the organization to meet our mission of commitment to compassion and excellence in health care services (1.1-2). Communication with our patients and other customers occurs through the VOC (3.1-2).
Staff members of the IPCs are responsible for deploying the key messages from each month’s meeting (3.1b[1]) to their assigned department coworkers. PIIT CREW (6.1b[4]) align-ment with the IPCs, Round-the-Clocks (5.2a[2]), staff meet-ings, and the ASA (5.2a[2]) facilitates deployment of process-es that provide patient and other customer support. 3.2a(3) Patient and Other Customer Segmentation. The SDH A-Team and Joint A-Team use patient, market, and competitors’ healthcare service information annually as part of the SPP (2.1-1). During the SPP, the Planning and Business Development Department at SHSSR helps the A-Team and Joint A-Team gather market data and competitor data for use in analysis. After review, the A-Team identifies strategic op-portunities to better meet and react to our current and future market needs and prepare strategic objectives (2.1-2, 2.1-3, 2.1a[3]).
In addition to identifying market segments, the SPP (2.1-1) makes use of data to identify and anticipate key patient and other customer requirements. By focusing on our four key patient segments – Med-Surg/ICU, Birthing Center, Emergen-cy, and Surgical Services – and by having representatives from all segments at our annual Joint A-Team Retreat during the SPP, we are better able to identify and anticipate how any changing requirements or expectations will differ across our stakeholder groups. We also break information and data into demographic segments, such as age and sex, allowing us to better focus actions and objectives. Market data provided an-nually by the Planning and Business Development Department at SHSSR identify health care service opportunities, such as the recent outpatient oncology service line expansion (2.1a[3]).
Through the SPP and during bimonthly Joint A-Team ses-sions, senior leadership uses market and competitive data to create or adjust action plans on strategic objectives, and align with the PIIT CREW (6.1b[4]) to deploy actions and changes. The Joint A-Team Retreat and bimonthly meetings also in-clude leaders representing all stages of a patient’s relationship with our organization, from our primary care and specialty physician partners to the physician, nursing, and ancillary care in the hospital. This representation ensures that we are able to understand and anticipate impacts of changes across the entire continuum of care and remain aligned with short- and longer-
Figure 3.2-1 – Key Access Mechanisms Access Mechanism MS BC ED SS C
Sutterdavis.org 800-4-SUTTER physician referral Rounding Hospital Information Desk IPC meetings 24-Hour House Supervisor Administrator on Call Direct line to the CEO Informational brochures Community Events Email/Letters/Phone Surveys Community Educational Classes MS = Med-Surg/ICU; SS = Surgical Services Patient; ED = Emergency Dept. Patient; BC = Birthing Center Patient; C = Community
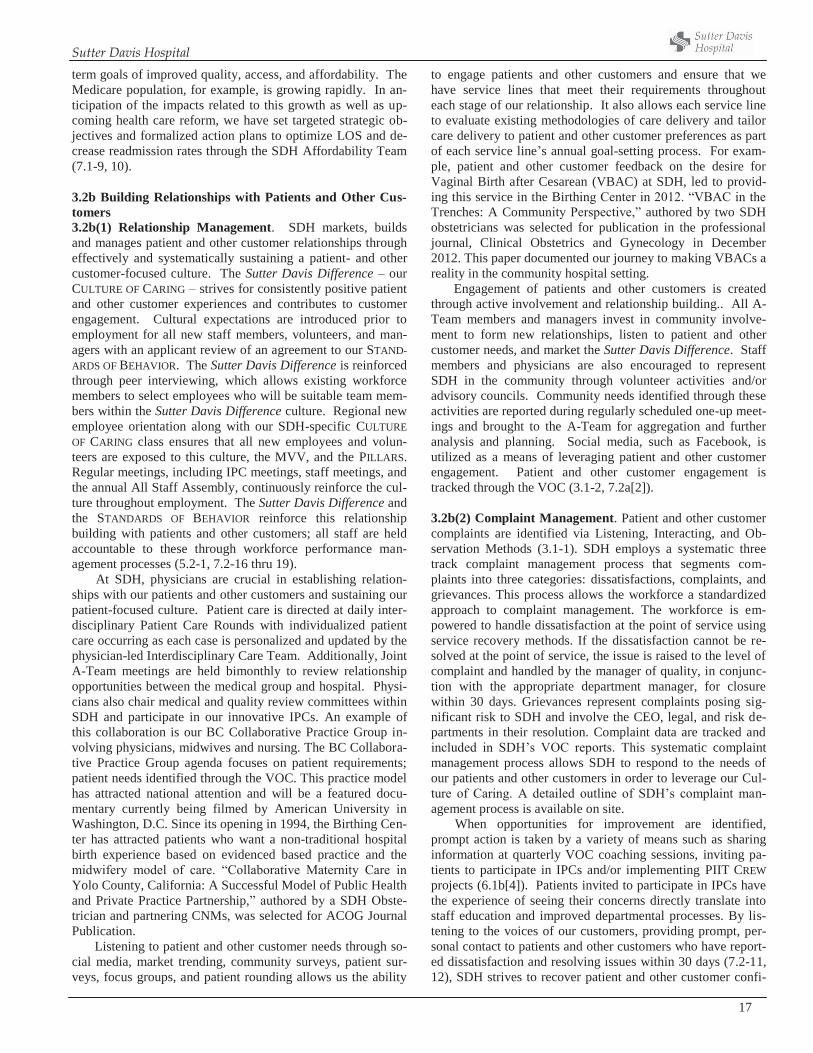
Sutter Davis Hospital
17
term goals of improved quality, access, and affordability. The Medicare population, for example, is growing rapidly. In an-ticipation of the impacts related to this growth as well as up-coming health care reform, we have set targeted strategic ob-jectives and formalized action plans to optimize LOS and de-crease readmission rates through the SDH Affordability Team (7.1-9, 10). 3.2b Building Relationships with Patients and Other Cus-tomers 3.2b(1) Relationship Management. SDH markets, builds and manages patient and other customer relationships through effectively and systematically sustaining a patient- and other customer-focused culture. The Sutter Davis Difference – our CULTURE OF CARING – strives for consistently positive patient and other customer experiences and contributes to customer engagement. Cultural expectations are introduced prior to employment for all new staff members, volunteers, and man-agers with an applicant review of an agreement to our STAND-ARDS OF BEHAVIOR. The Sutter Davis Difference is reinforced through peer interviewing, which allows existing workforce members to select employees who will be suitable team mem-bers within the Sutter Davis Difference culture. Regional new employee orientation along with our SDH-specific CULTURE OF CARING class ensures that all new employees and volun-teers are exposed to this culture, the MVV, and the PILLARS. Regular meetings, including IPC meetings, staff meetings, and the annual All Staff Assembly, continuously reinforce the cul-ture throughout employment. The Sutter Davis Difference and the STANDARDS OF BEHAVIOR reinforce this relationship building with patients and other customers; all staff are held accountable to these through workforce performance man-agement processes (5.2-1, 7.2-16 thru 19).
At SDH, physicians are crucial in establishing relation-ships with our patients and other customers and sustaining our patient-focused culture. Patient care is directed at daily inter-disciplinary Patient Care Rounds with individualized patient care occurring as each case is personalized and updated by the physician-led Interdisciplinary Care Team. Additionally, Joint A-Team meetings are held bimonthly to review relationship opportunities between the medical group and hospital. Physi-cians also chair medical and quality review committees within SDH and participate in our innovative IPCs. An example of this collaboration is our BC Collaborative Practice Group in-volving physicians, midwives and nursing. The BC Collabora-tive Practice Group agenda focuses on patient requirements; patient needs identified through the VOC. This practice model has attracted national attention and will be a featured docu-mentary currently being filmed by American University in Washington, D.C. Since its opening in 1994, the Birthing Cen-ter has attracted patients who want a non-traditional hospital birth experience based on evidenced based practice and the midwifery model of care. “Collaborative Maternity Care in Yolo County, California: A Successful Model of Public Health and Private Practice Partnership,” authored by a SDH Obste-trician and partnering CNMs, was selected for ACOG Journal Publication.
Listening to patient and other customer needs through so-cial media, market trending, community surveys, patient sur-veys, focus groups, and patient rounding allows us the ability
to engage patients and other customers and ensure that we have service lines that meet their requirements throughout each stage of our relationship. It also allows each service line to evaluate existing methodologies of care delivery and tailor care delivery to patient and other customer preferences as part of each service line’s annual goal-setting process. For exam-ple, patient and other customer feedback on the desire for Vaginal Birth after Cesarean (VBAC) at SDH, led to provid-ing this service in the Birthing Center in 2012. “VBAC in the Trenches: A Community Perspective,” authored by two SDH obstetricians was selected for publication in the professional journal, Clinical Obstetrics and Gynecology in December 2012. This paper documented our journey to making VBACs a reality in the community hospital setting.
Engagement of patients and other customers is created through active involvement and relationship building.. All A-Team members and managers invest in community involve-ment to form new relationships, listen to patient and other customer needs, and market the Sutter Davis Difference. Staff members and physicians are also encouraged to represent SDH in the community through volunteer activities and/or advisory councils. Community needs identified through these activities are reported during regularly scheduled one-up meet-ings and brought to the A-Team for aggregation and further analysis and planning. Social media, such as Facebook, is utilized as a means of leveraging patient and other customer engagement. Patient and other customer engagement is tracked through the VOC (3.1-2, 7.2a[2]).
3.2b(2) Complaint Management. Patient and other customer complaints are identified via Listening, Interacting, and Ob-servation Methods (3.1-1). SDH employs a systematic three track complaint management process that segments com-plaints into three categories: dissatisfactions, complaints, and grievances. This process allows the workforce a standardized approach to complaint management. The workforce is em-powered to handle dissatisfaction at the point of service using service recovery methods. If the dissatisfaction cannot be re-solved at the point of service, the issue is raised to the level of complaint and handled by the manager of quality, in conjunc-tion with the appropriate department manager, for closure within 30 days. Grievances represent complaints posing sig-nificant risk to SDH and involve the CEO, legal, and risk de-partments in their resolution. Complaint data are tracked and included in SDH’s VOC reports. This systematic complaint management process allows SDH to respond to the needs of our patients and other customers in order to leverage our Cul-ture of Caring. A detailed outline of SDH’s complaint man-agement process is available on site.
When opportunities for improvement are identified, prompt action is taken by a variety of means such as sharing information at quarterly VOC coaching sessions, inviting pa-tients to participate in IPCs and/or implementing PIIT CREW projects (6.1b[4]). Patients invited to participate in IPCs have the experience of seeing their concerns directly translate into staff education and improved departmental processes. By lis-tening to the voices of our customers, providing prompt, per-sonal contact to patients and other customers who have report-ed dissatisfaction and resolving issues within 30 days (7.2-11, 12), SDH strives to recover patient and other customer confi-
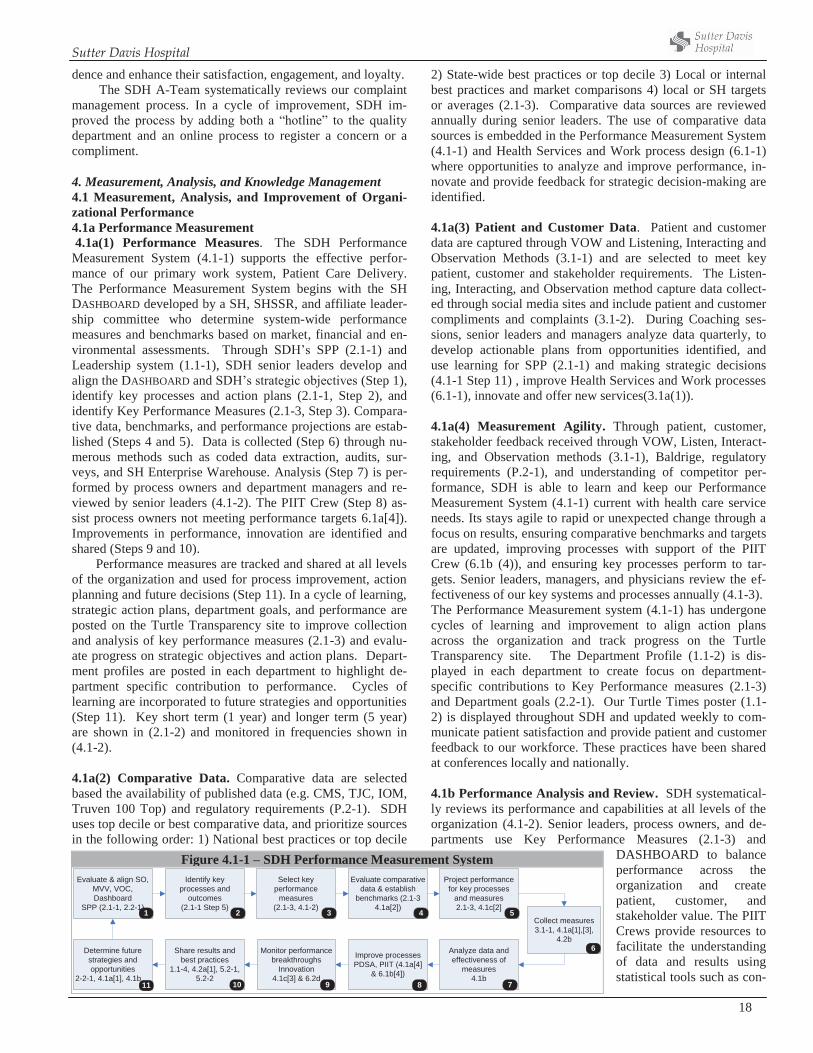
Sutter Davis Hospital
18
dence and enhance their satisfaction, engagement, and loyalty. The SDH A-Team systematically reviews our complaint
management process. In a cycle of improvement, SDH im-proved the process by adding both a “hotline” to the quality department and an online process to register a concern or a compliment. 4. Measurement, Analysis, and Knowledge Management 4.1 Measurement, Analysis, and Improvement of Organi-zational Performance 4.1a Performance Measurement 4.1a(1) Performance Measures. The SDH Performance Measurement System (4.1-1) supports the effective perfor-mance of our primary work system, Patient Care Delivery. The Performance Measurement System begins with the SH DASHBOARD developed by a SH, SHSSR, and affiliate leader-ship committee who determine system-wide performance measures and benchmarks based on market, financial and en-vironmental assessments. Through SDH’s SPP (2.1-1) and Leadership system (1.1-1), SDH senior leaders develop and align the DASHBOARD and SDH’s strategic objectives (Step 1), identify key processes and action plans (2.1-1, Step 2), and identify Key Performance Measures (2.1-3, Step 3). Compara-tive data, benchmarks, and performance projections are estab-lished (Steps 4 and 5). Data is collected (Step 6) through nu-merous methods such as coded data extraction, audits, sur-veys, and SH Enterprise Warehouse. Analysis (Step 7) is per-formed by process owners and department managers and re-viewed by senior leaders (4.1-2). The PIIT Crew (Step 8) as-sist process owners not meeting performance targets 6.1a[4]). Improvements in performance, innovation are identified and shared (Steps 9 and 10).
Performance measures are tracked and shared at all levels of the organization and used for process improvement, action planning and future decisions (Step 11). In a cycle of learning, strategic action plans, department goals, and performance are posted on the Turtle Transparency site to improve collection and analysis of key performance measures (2.1-3) and evalu-ate progress on strategic objectives and action plans. Depart-ment profiles are posted in each department to highlight de-partment specific contribution to performance. Cycles of learning are incorporated to future strategies and opportunities (Step 11). Key short term (1 year) and longer term (5 year) are shown in (2.1-2) and monitored in frequencies shown in (4.1-2). 4.1a(2) Comparative Data. Comparative data are selected based the availability of published data (e.g. CMS, TJC, IOM, Truven 100 Top) and regulatory requirements (P.2-1). SDH uses top decile or best comparative data, and prioritize sources in the following order: 1) National best practices or top decile
2) State-wide best practices or top decile 3) Local or internal best practices and market comparisons 4) local or SH targets or averages (2.1-3). Comparative data sources are reviewed annually during senior leaders. The use of comparative data sources is embedded in the Performance Measurement System (4.1-1) and Health Services and Work process design (6.1-1) where opportunities to analyze and improve performance, in-novate and provide feedback for strategic decision-making are identified. 4.1a(3) Patient and Customer Data. Patient and customer data are captured through VOW and Listening, Interacting and Observation Methods (3.1-1) and are selected to meet key patient, customer and stakeholder requirements. The Listen-ing, Interacting, and Observation method capture data collect-ed through social media sites and include patient and customer compliments and complaints (3.1-2). During Coaching ses-sions, senior leaders and managers analyze data quarterly, to develop actionable plans from opportunities identified, and use learning for SPP (2.1-1) and making strategic decisions (4.1-1 Step 11) , improve Health Services and Work processes (6.1-1), innovate and offer new services(3.1a(1)). 4.1a(4) Measurement Agility. Through patient, customer, stakeholder feedback received through VOW, Listen, Interact-ing, and Observation methods (3.1-1), Baldrige, regulatory requirements (P.2-1), and understanding of competitor per-formance, SDH is able to learn and keep our Performance Measurement System (4.1-1) current with health care service needs. Its stays agile to rapid or unexpected change through a focus on results, ensuring comparative benchmarks and targets are updated, improving processes with support of the PIIT Crew (6.1b (4)), and ensuring key processes perform to tar-gets. Senior leaders, managers, and physicians review the ef-fectiveness of our key systems and processes annually (4.1-3). The Performance Measurement system (4.1-1) has undergone cycles of learning and improvement to align action plans across the organization and track progress on the Turtle Transparency site. The Department Profile (1.1-2) is dis-played in each department to create focus on department-specific contributions to Key Performance measures (2.1-3) and Department goals (2.2-1). Our Turtle Times poster (1.1-2) is displayed throughout SDH and updated weekly to com-municate patient satisfaction and provide patient and customer feedback to our workforce. These practices have been shared at conferences locally and nationally. 4.1b Performance Analysis and Review. SDH systematical-ly reviews its performance and capabilities at all levels of the organization (4.1-2). Senior leaders, process owners, and de-partments use Key Performance Measures (2.1-3) and
DASHBOARD to balance performance across the organization and create patient, customer, and stakeholder value. The PIIT Crews provide resources to facilitate the understanding of data and results using statistical tools such as con-
Figure 4.1-1 – SDH Performance Measurement System Identify key
processes andoutcomes
(2.1-1 Step 5)
Evaluate & align SO,MVV, VOC,Dashboard
SPP (2.1-1, 2.2-1)
Evaluate comparativedata & establish
benchmarks (2.1-34.1a[2])
Select keyperformance
measures(2.1-3, 4.1-2)
Collect measures3.1-1, 4.1a[1],[3],
4.2bAnalyze data andeffectiveness of
measures4.1b
Improve processesPDSA, PIIT (4.1a[4]
& 6.1b[4])
Monitor performancebreakthroughs
Innovation4.1c[3] & 6.2d
Share results andbest practices
1.1-4, 4.2a[1], 5.2-1,5.2-2
Determine futurestrategies andopportunities
2-2-1, 4.1a[1], 4.1b
Project performancefor key processes
and measures2.1-3, 4.1c[2]
321 4 5
7891011
6
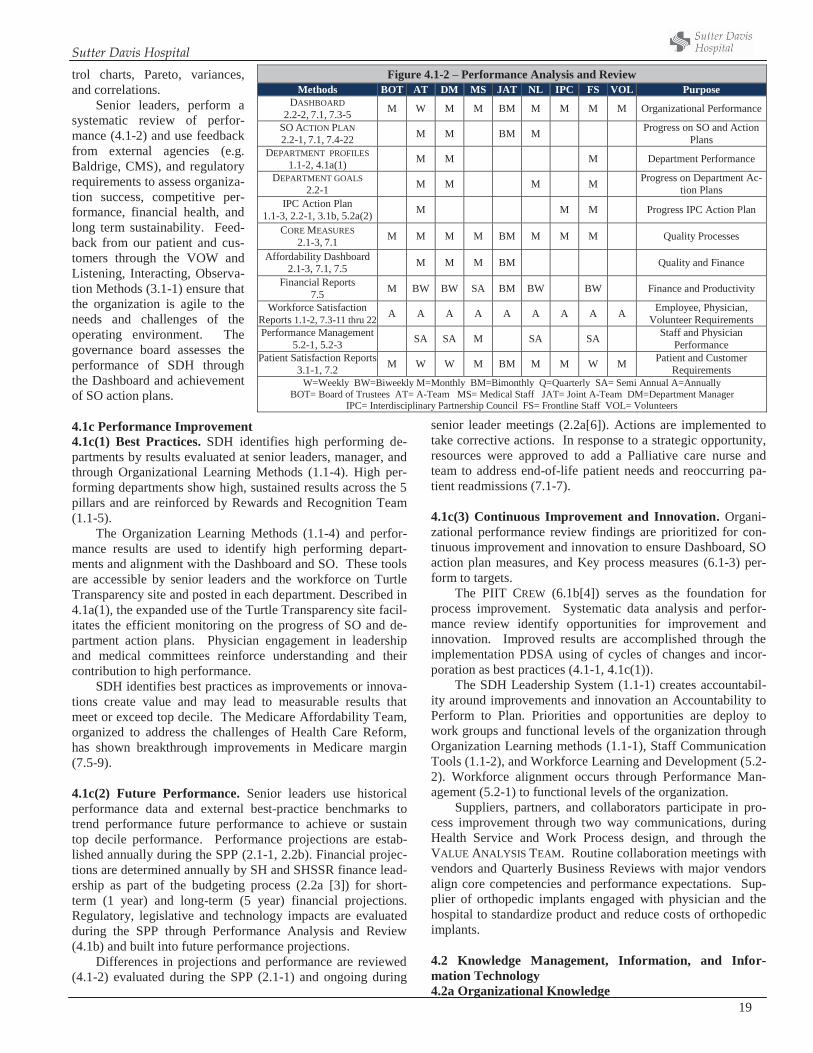
Sutter Davis Hospital
19
trol charts, Pareto, variances, and correlations.
Senior leaders, perform a systematic review of perfor-mance (4.1-2) and use feedback from external agencies (e.g. Baldrige, CMS), and regulatory requirements to assess organiza-tion success, competitive per-formance, financial health, and long term sustainability. Feed-back from our patient and cus-tomers through the VOW and Listening, Interacting, Observa-tion Methods (3.1-1) ensure that the organization is agile to the needs and challenges of the operating environment. The governance board assesses the performance of SDH through the Dashboard and achievement of SO action plans. 4.1c Performance Improvement 4.1c(1) Best Practices. SDH identifies high performing de-partments by results evaluated at senior leaders, manager, and through Organizational Learning Methods (1.1-4). High per-forming departments show high, sustained results across the 5 pillars and are reinforced by Rewards and Recognition Team (1.1-5).
The Organization Learning Methods (1.1-4) and perfor-mance results are used to identify high performing depart-ments and alignment with the Dashboard and SO. These tools are accessible by senior leaders and the workforce on Turtle Transparency site and posted in each department. Described in 4.1a(1), the expanded use of the Turtle Transparency site facil-itates the efficient monitoring on the progress of SO and de-partment action plans. Physician engagement in leadership and medical committees reinforce understanding and their contribution to high performance.
SDH identifies best practices as improvements or innova-tions create value and may lead to measurable results that meet or exceed top decile. The Medicare Affordability Team, organized to address the challenges of Health Care Reform, has shown breakthrough improvements in Medicare margin (7.5-9). 4.1c(2) Future Performance. Senior leaders use historical performance data and external best-practice benchmarks to trend performance future performance to achieve or sustain top decile performance. Performance projections are estab-lished annually during the SPP (2.1-1, 2.2b). Financial projec-tions are determined annually by SH and SHSSR finance lead-ership as part of the budgeting process (2.2a [3]) for short-term (1 year) and long-term (5 year) financial projections. Regulatory, legislative and technology impacts are evaluated during the SPP through Performance Analysis and Review (4.1b) and built into future performance projections.
Differences in projections and performance are reviewed (4.1-2) evaluated during the SPP (2.1-1) and ongoing during
senior leader meetings (2.2a[6]). Actions are implemented to take corrective actions. In response to a strategic opportunity, resources were approved to add a Palliative care nurse and team to address end-of-life patient needs and reoccurring pa-tient readmissions (7.1-7).
4.1c(3) Continuous Improvement and Innovation. Organi-zational performance review findings are prioritized for con-tinuous improvement and innovation to ensure Dashboard, SO action plan measures, and Key process measures (6.1-3) per-form to targets.
The PIIT CREW (6.1b[4]) serves as the foundation for process improvement. Systematic data analysis and perfor-mance review identify opportunities for improvement and innovation. Improved results are accomplished through the implementation PDSA using of cycles of changes and incor-poration as best practices (4.1-1, 4.1c(1)).
The SDH Leadership System (1.1-1) creates accountabil-ity around improvements and innovation an Accountability to Perform to Plan. Priorities and opportunities are deploy to work groups and functional levels of the organization through Organization Learning methods (1.1-1), Staff Communication Tools (1.1-2), and Workforce Learning and Development (5.2-2). Workforce alignment occurs through Performance Man-agement (5.2-1) to functional levels of the organization.
Suppliers, partners, and collaborators participate in pro-cess improvement through two way communications, during Health Service and Work Process design, and through the VALUE ANALYSIS TEAM. Routine collaboration meetings with vendors and Quarterly Business Reviews with major vendors align core competencies and performance expectations. Sup-plier of orthopedic implants engaged with physician and the hospital to standardize product and reduce costs of orthopedic implants. 4.2 Knowledge Management, Information, and Infor-mation Technology 4.2a Organizational Knowledge
Figure 4.1-2 – Performance Analysis and Review Methods BOT AT DM MS JAT NL IPC FS VOL Purpose
DASHBOARD 2.2-2, 7.1, 7.3-5 M W M M BM M M M M Organizational Performance
SO ACTION PLAN 2.2-1, 7.1, 7.4-22 M M BM M Progress on SO and Action
Plans DEPARTMENT PROFILES
1.1-2, 4.1a(1) M M M Department Performance
DEPARTMENT GOALS 2.2-1 M M M M Progress on Department Ac-
tion Plans IPC Action Plan
1.1-3, 2.2-1, 3.1b, 5.2a(2) M M M Progress IPC Action Plan
CORE MEASURES 2.1-3, 7.1 M M M M BM M M M Quality Processes
Affordability Dashboard 2.1-3, 7.1, 7.5 M M M BM Quality and Finance
Financial Reports 7.5 M BW BW SA BM BW BW Finance and Productivity
Workforce Satisfaction Reports 1.1-2, 7.3-11 thru 22 A A A A A A A A A Employee, Physician,
Volunteer Requirements Performance Management
5.2-1, 5.2-3 SA SA M SA SA Staff and Physician Performance
Patient Satisfaction Reports 3.1-1, 7.2 M W W M BM M M W M Patient and Customer
Requirements W=Weekly BW=Biweekly M=Monthly BM=Bimonthly Q=Quarterly SA= Semi Annual A=Annually
BOT= Board of Trustees AT= A-Team MS= Medical Staff JAT= Joint A-Team DM=Department Manager IPC= Interdisciplinary Partnership Council FS= Frontline Staff VOL= Volunteers
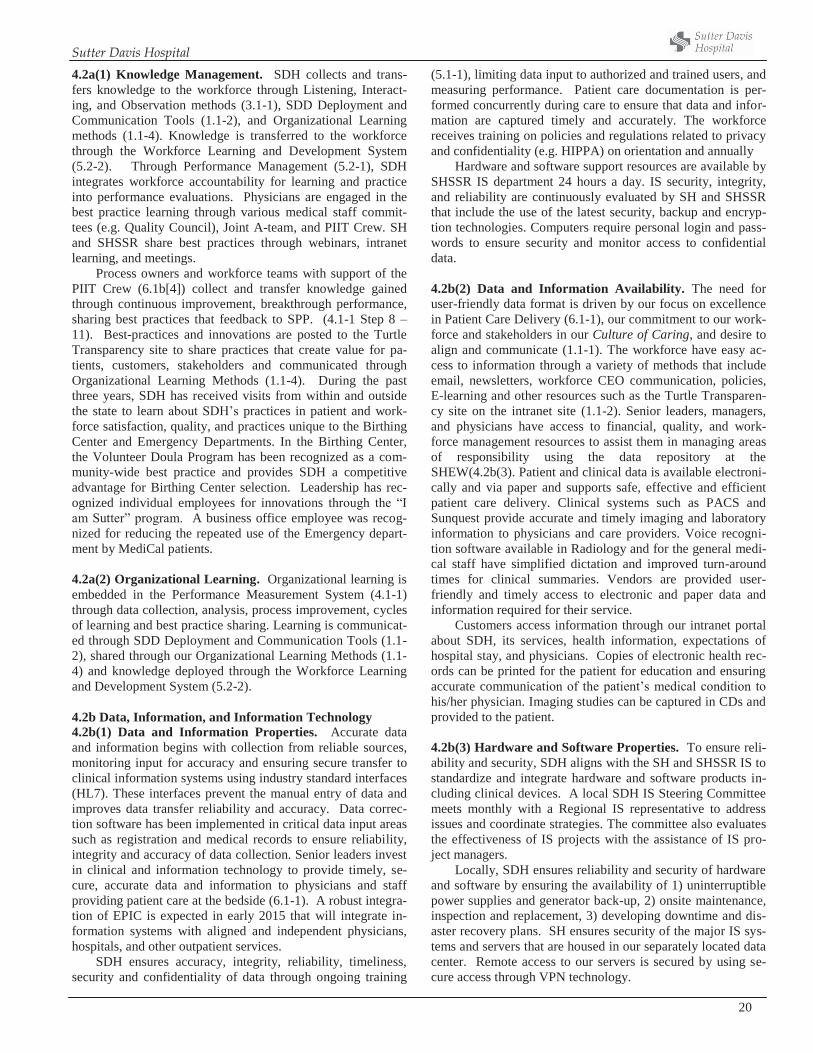
Sutter Davis Hospital
20
4.2a(1) Knowledge Management. SDH collects and trans-fers knowledge to the workforce through Listening, Interact-ing, and Observation methods (3.1-1), SDD Deployment and Communication Tools (1.1-2), and Organizational Learning methods (1.1-4). Knowledge is transferred to the workforce through the Workforce Learning and Development System (5.2-2). Through Performance Management (5.2-1), SDH integrates workforce accountability for learning and practice into performance evaluations. Physicians are engaged in the best practice learning through various medical staff commit-tees (e.g. Quality Council), Joint A-team, and PIIT Crew. SH and SHSSR share best practices through webinars, intranet learning, and meetings.
Process owners and workforce teams with support of the PIIT Crew (6.1b[4]) collect and transfer knowledge gained through continuous improvement, breakthrough performance, sharing best practices that feedback to SPP. (4.1-1 Step 8 – 11). Best-practices and innovations are posted to the Turtle Transparency site to share practices that create value for pa-tients, customers, stakeholders and communicated through Organizational Learning Methods (1.1-4). During the past three years, SDH has received visits from within and outside the state to learn about SDH’s practices in patient and work-force satisfaction, quality, and practices unique to the Birthing Center and Emergency Departments. In the Birthing Center, the Volunteer Doula Program has been recognized as a com-munity-wide best practice and provides SDH a competitive advantage for Birthing Center selection. Leadership has rec-ognized individual employees for innovations through the “I am Sutter” program. A business office employee was recog-nized for reducing the repeated use of the Emergency depart-ment by MediCal patients. 4.2a(2) Organizational Learning. Organizational learning is embedded in the Performance Measurement System (4.1-1) through data collection, analysis, process improvement, cycles of learning and best practice sharing. Learning is communicat-ed through SDD Deployment and Communication Tools (1.1-2), shared through our Organizational Learning Methods (1.1-4) and knowledge deployed through the Workforce Learning and Development System (5.2-2). 4.2b Data, Information, and Information Technology 4.2b(1) Data and Information Properties. Accurate data and information begins with collection from reliable sources, monitoring input for accuracy and ensuring secure transfer to clinical information systems using industry standard interfaces (HL7). These interfaces prevent the manual entry of data and improves data transfer reliability and accuracy. Data correc-tion software has been implemented in critical data input areas such as registration and medical records to ensure reliability, integrity and accuracy of data collection. Senior leaders invest in clinical and information technology to provide timely, se-cure, accurate data and information to physicians and staff providing patient care at the bedside (6.1-1). A robust integra-tion of EPIC is expected in early 2015 that will integrate in-formation systems with aligned and independent physicians, hospitals, and other outpatient services.
SDH ensures accuracy, integrity, reliability, timeliness, security and confidentiality of data through ongoing training
(5.1-1), limiting data input to authorized and trained users, and measuring performance. Patient care documentation is per-formed concurrently during care to ensure that data and infor-mation are captured timely and accurately. The workforce receives training on policies and regulations related to privacy and confidentiality (e.g. HIPPA) on orientation and annually
Hardware and software support resources are available by SHSSR IS department 24 hours a day. IS security, integrity, and reliability are continuously evaluated by SH and SHSSR that include the use of the latest security, backup and encryp-tion technologies. Computers require personal login and pass-words to ensure security and monitor access to confidential data. 4.2b(2) Data and Information Availability. The need for user-friendly data format is driven by our focus on excellence in Patient Care Delivery (6.1-1), our commitment to our work-force and stakeholders in our Culture of Caring, and desire to align and communicate (1.1-1). The workforce have easy ac-cess to information through a variety of methods that include email, newsletters, workforce CEO communication, policies, E-learning and other resources such as the Turtle Transparen-cy site on the intranet site (1.1-2). Senior leaders, managers, and physicians have access to financial, quality, and work-force management resources to assist them in managing areas of responsibility using the data repository at the SHEW(4.2b(3). Patient and clinical data is available electroni-cally and via paper and supports safe, effective and efficient patient care delivery. Clinical systems such as PACS and Sunquest provide accurate and timely imaging and laboratory information to physicians and care providers. Voice recogni-tion software available in Radiology and for the general medi-cal staff have simplified dictation and improved turn-around times for clinical summaries. Vendors are provided user-friendly and timely access to electronic and paper data and information required for their service. Customers access information through our intranet portal about SDH, its services, health information, expectations of hospital stay, and physicians. Copies of electronic health rec-ords can be printed for the patient for education and ensuring accurate communication of the patient’s medical condition to his/her physician. Imaging studies can be captured in CDs and provided to the patient. 4.2b(3) Hardware and Software Properties. To ensure reli-ability and security, SDH aligns with the SH and SHSSR IS to standardize and integrate hardware and software products in-cluding clinical devices. A local SDH IS Steering Committee meets monthly with a Regional IS representative to address issues and coordinate strategies. The committee also evaluates the effectiveness of IS projects with the assistance of IS pro-ject managers. Locally, SDH ensures reliability and security of hardware and software by ensuring the availability of 1) uninterruptible power supplies and generator back-up, 2) onsite maintenance, inspection and replacement, 3) developing downtime and dis-aster recovery plans. SH ensures security of the major IS sys-tems and servers that are housed in our separately located data center. Remote access to our servers is secured by using se-cure access through VPN technology.
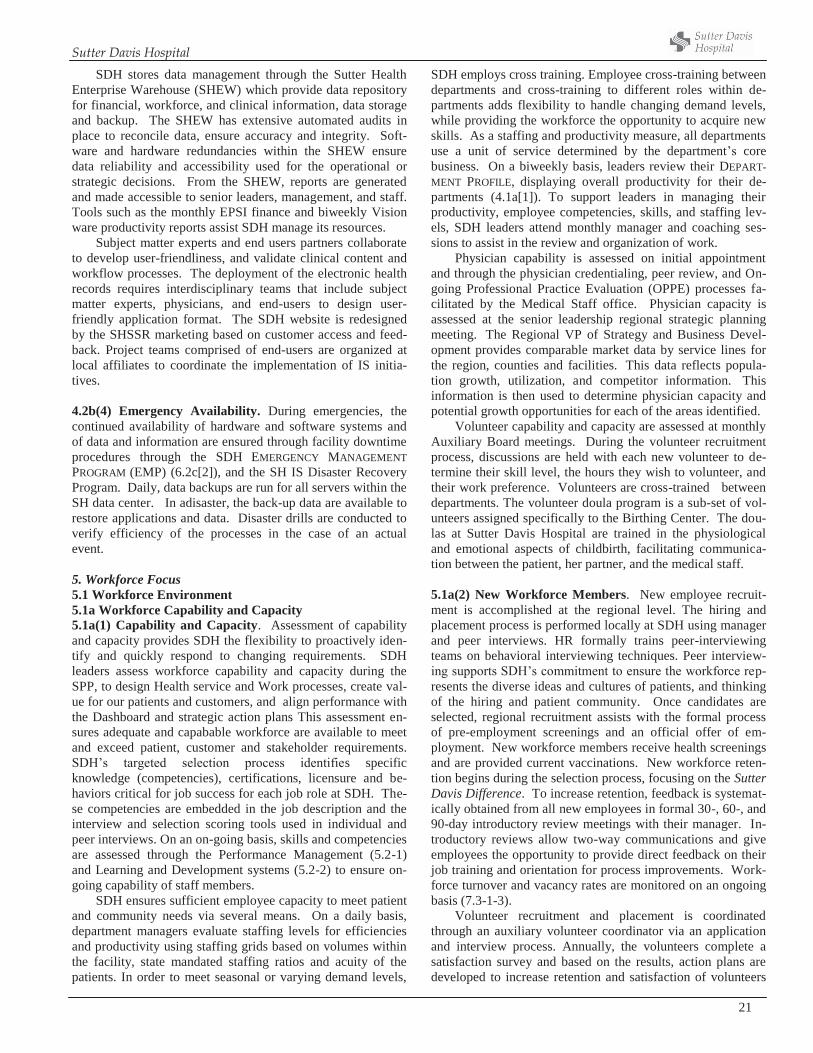
Sutter Davis Hospital
21
SDH stores data management through the Sutter Health Enterprise Warehouse (SHEW) which provide data repository for financial, workforce, and clinical information, data storage and backup. The SHEW has extensive automated audits in place to reconcile data, ensure accuracy and integrity. Soft-ware and hardware redundancies within the SHEW ensure data reliability and accessibility used for the operational or strategic decisions. From the SHEW, reports are generated and made accessible to senior leaders, management, and staff. Tools such as the monthly EPSI finance and biweekly Vision ware productivity reports assist SDH manage its resources.
Subject matter experts and end users partners collaborate to develop user-friendliness, and validate clinical content and workflow processes. The deployment of the electronic health records requires interdisciplinary teams that include subject matter experts, physicians, and end-users to design user-friendly application format. The SDH website is redesigned by the SHSSR marketing based on customer access and feed-back. Project teams comprised of end-users are organized at local affiliates to coordinate the implementation of IS initia-tives. 4.2b(4) Emergency Availability. During emergencies, the continued availability of hardware and software systems and of data and information are ensured through facility downtime procedures through the SDH EMERGENCY MANAGEMENT PROGRAM (EMP) (6.2c[2]), and the SH IS Disaster Recovery Program. Daily, data backups are run for all servers within the SH data center. In adisaster, the back-up data are available to restore applications and data. Disaster drills are conducted to verify efficiency of the processes in the case of an actual event. 5. Workforce Focus 5.1 Workforce Environment 5.1a Workforce Capability and Capacity 5.1a(1) Capability and Capacity. Assessment of capability and capacity provides SDH the flexibility to proactively iden-tify and quickly respond to changing requirements. SDH leaders assess workforce capability and capacity during the SPP, to design Health service and Work processes, create val-ue for our patients and customers, and align performance with the Dashboard and strategic action plans This assessment en-sures adequate and capabable workforce are available to meet and exceed patient, customer and stakeholder requirements. SDH’s targeted selection process identifies specific knowledge (competencies), certifications, licensure and be-haviors critical for job success for each job role at SDH. The-se competencies are embedded in the job description and the interview and selection scoring tools used in individual and peer interviews. On an on-going basis, skills and competencies are assessed through the Performance Management (5.2-1) and Learning and Development systems (5.2-2) to ensure on-going capability of staff members.
SDH ensures sufficient employee capacity to meet patient and community needs via several means. On a daily basis, department managers evaluate staffing levels for efficiencies and productivity using staffing grids based on volumes within the facility, state mandated staffing ratios and acuity of the patients. In order to meet seasonal or varying demand levels,
SDH employs cross training. Employee cross-training between departments and cross-training to different roles within de-partments adds flexibility to handle changing demand levels, while providing the workforce the opportunity to acquire new skills. As a staffing and productivity measure, all departments use a unit of service determined by the department’s core business. On a biweekly basis, leaders review their DEPART-MENT PROFILE, displaying overall productivity for their de-partments (4.1a[1]). To support leaders in managing their productivity, employee competencies, skills, and staffing lev-els, SDH leaders attend monthly manager and coaching ses-sions to assist in the review and organization of work.
Physician capability is assessed on initial appointment and through the physician credentialing, peer review, and On-going Professional Practice Evaluation (OPPE) processes fa-cilitated by the Medical Staff office. Physician capacity is assessed at the senior leadership regional strategic planning meeting. The Regional VP of Strategy and Business Devel-opment provides comparable market data by service lines for the region, counties and facilities. This data reflects popula-tion growth, utilization, and competitor information. This information is then used to determine physician capacity and potential growth opportunities for each of the areas identified.
Volunteer capability and capacity are assessed at monthly Auxiliary Board meetings. During the volunteer recruitment process, discussions are held with each new volunteer to de-termine their skill level, the hours they wish to volunteer, and their work preference. Volunteers are cross-trained between departments. The volunteer doula program is a sub-set of vol-unteers assigned specifically to the Birthing Center. The dou-las at Sutter Davis Hospital are trained in the physiological and emotional aspects of childbirth, facilitating communica-tion between the patient, her partner, and the medical staff. 5.1a(2) New Workforce Members. New employee recruit-ment is accomplished at the regional level. The hiring and placement process is performed locally at SDH using manager and peer interviews. HR formally trains peer-interviewing teams on behavioral interviewing techniques. Peer interview-ing supports SDH’s commitment to ensure the workforce rep-resents the diverse ideas and cultures of patients, and thinking of the hiring and patient community. Once candidates are selected, regional recruitment assists with the formal process of pre-employment screenings and an official offer of em-ployment. New workforce members receive health screenings and are provided current vaccinations. New workforce reten-tion begins during the selection process, focusing on the Sutter Davis Difference. To increase retention, feedback is systemat-ically obtained from all new employees in formal 30-, 60-, and 90-day introductory review meetings with their manager. In-troductory reviews allow two-way communications and give employees the opportunity to provide direct feedback on their job training and orientation for process improvements. Work-force turnover and vacancy rates are monitored on an ongoing basis (7.3-1-3).
Volunteer recruitment and placement is coordinated through an auxiliary volunteer coordinator via an application and interview process. Annually, the volunteers complete a satisfaction survey and based on the results, action plans are developed to increase retention and satisfaction of volunteers
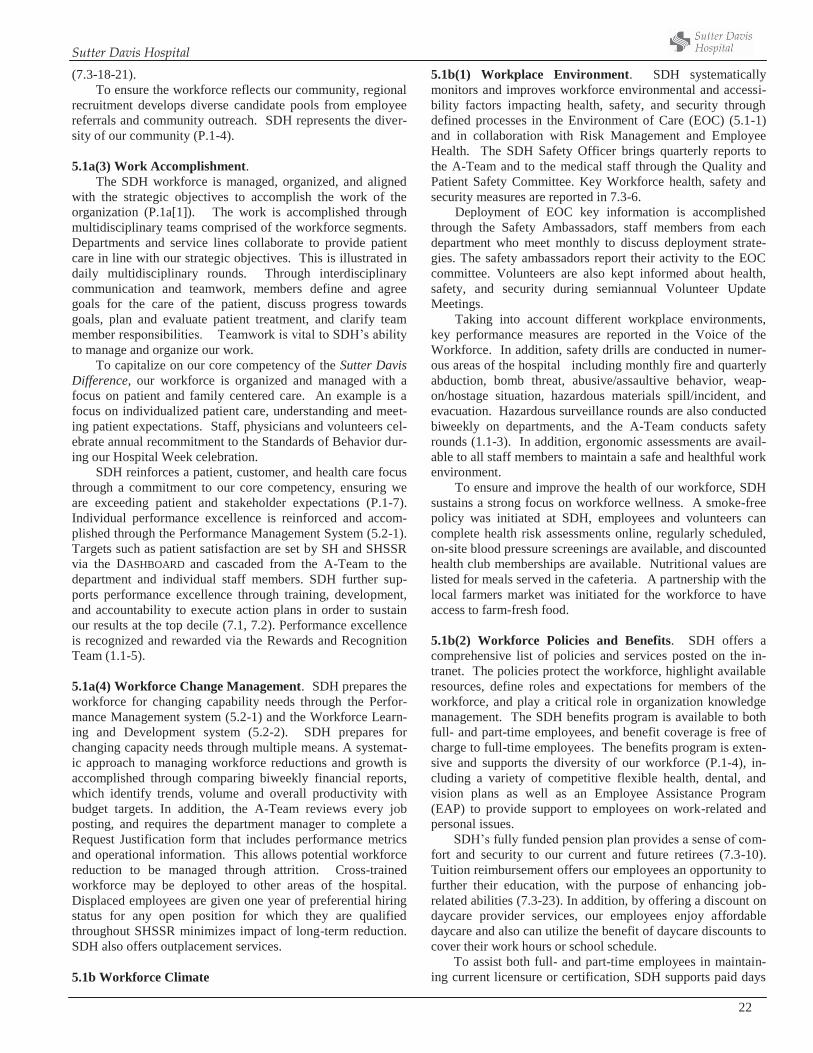
Sutter Davis Hospital
22
(7.3-18-21). To ensure the workforce reflects our community, regional
recruitment develops diverse candidate pools from employee referrals and community outreach. SDH represents the diver-sity of our community (P.1-4). 5.1a(3) Work Accomplishment.
The SDH workforce is managed, organized, and aligned with the strategic objectives to accomplish the work of the organization (P.1a[1]). The work is accomplished through multidisciplinary teams comprised of the workforce segments. Departments and service lines collaborate to provide patient care in line with our strategic objectives. This is illustrated in daily multidisciplinary rounds. Through interdisciplinary communication and teamwork, members define and agree goals for the care of the patient, discuss progress towards goals, plan and evaluate patient treatment, and clarify team member responsibilities. Teamwork is vital to SDH’s ability to manage and organize our work.
To capitalize on our core competency of the Sutter Davis Difference, our workforce is organized and managed with a focus on patient and family centered care. An example is a focus on individualized patient care, understanding and meet-ing patient expectations. Staff, physicians and volunteers cel-ebrate annual recommitment to the Standards of Behavior dur-ing our Hospital Week celebration.
SDH reinforces a patient, customer, and health care focus through a commitment to our core competency, ensuring we are exceeding patient and stakeholder expectations (P.1-7). Individual performance excellence is reinforced and accom-plished through the Performance Management System (5.2-1). Targets such as patient satisfaction are set by SH and SHSSR via the DASHBOARD and cascaded from the A-Team to the department and individual staff members. SDH further sup-ports performance excellence through training, development, and accountability to execute action plans in order to sustain our results at the top decile (7.1, 7.2). Performance excellence is recognized and rewarded via the Rewards and Recognition Team (1.1-5). 5.1a(4) Workforce Change Management. SDH prepares the workforce for changing capability needs through the Perfor-mance Management system (5.2-1) and the Workforce Learn-ing and Development system (5.2-2). SDH prepares for changing capacity needs through multiple means. A systemat-ic approach to managing workforce reductions and growth is accomplished through comparing biweekly financial reports, which identify trends, volume and overall productivity with budget targets. In addition, the A-Team reviews every job posting, and requires the department manager to complete a Request Justification form that includes performance metrics and operational information. This allows potential workforce reduction to be managed through attrition. Cross-trained workforce may be deployed to other areas of the hospital. Displaced employees are given one year of preferential hiring status for any open position for which they are qualified throughout SHSSR minimizes impact of long-term reduction. SDH also offers outplacement services. 5.1b Workforce Climate
5.1b(1) Workplace Environment. SDH systematically monitors and improves workforce environmental and accessi-bility factors impacting health, safety, and security through defined processes in the Environment of Care (EOC) (5.1-1) and in collaboration with Risk Management and Employee Health. The SDH Safety Officer brings quarterly reports to the A-Team and to the medical staff through the Quality and Patient Safety Committee. Key Workforce health, safety and security measures are reported in 7.3-6.
Deployment of EOC key information is accomplished through the Safety Ambassadors, staff members from each department who meet monthly to discuss deployment strate-gies. The safety ambassadors report their activity to the EOC committee. Volunteers are also kept informed about health, safety, and security during semiannual Volunteer Update Meetings.
Taking into account different workplace environments, key performance measures are reported in the Voice of the Workforce. In addition, safety drills are conducted in numer-ous areas of the hospital including monthly fire and quarterly abduction, bomb threat, abusive/assaultive behavior, weap-on/hostage situation, hazardous materials spill/incident, and evacuation. Hazardous surveillance rounds are also conducted biweekly on departments, and the A-Team conducts safety rounds (1.1-3). In addition, ergonomic assessments are avail-able to all staff members to maintain a safe and healthful work environment.
To ensure and improve the health of our workforce, SDH sustains a strong focus on workforce wellness. A smoke-free policy was initiated at SDH, employees and volunteers can complete health risk assessments online, regularly scheduled, on-site blood pressure screenings are available, and discounted health club memberships are available. Nutritional values are listed for meals served in the cafeteria. A partnership with the local farmers market was initiated for the workforce to have access to farm-fresh food. 5.1b(2) Workforce Policies and Benefits. SDH offers a comprehensive list of policies and services posted on the in-tranet. The policies protect the workforce, highlight available resources, define roles and expectations for members of the workforce, and play a critical role in organization knowledge management. The SDH benefits program is available to both full- and part-time employees, and benefit coverage is free of charge to full-time employees. The benefits program is exten-sive and supports the diversity of our workforce (P.1-4), in-cluding a variety of competitive flexible health, dental, and vision plans as well as an Employee Assistance Program (EAP) to provide support to employees on work-related and personal issues.
SDH’s fully funded pension plan provides a sense of com-fort and security to our current and future retirees (7.3-10). Tuition reimbursement offers our employees an opportunity to further their education, with the purpose of enhancing job-related abilities (7.3-23). In addition, by offering a discount on daycare provider services, our employees enjoy affordable daycare and also can utilize the benefit of daycare discounts to cover their work hours or school schedule.
To assist both full- and part-time employees in maintain-ing current licensure or certification, SDH supports paid days
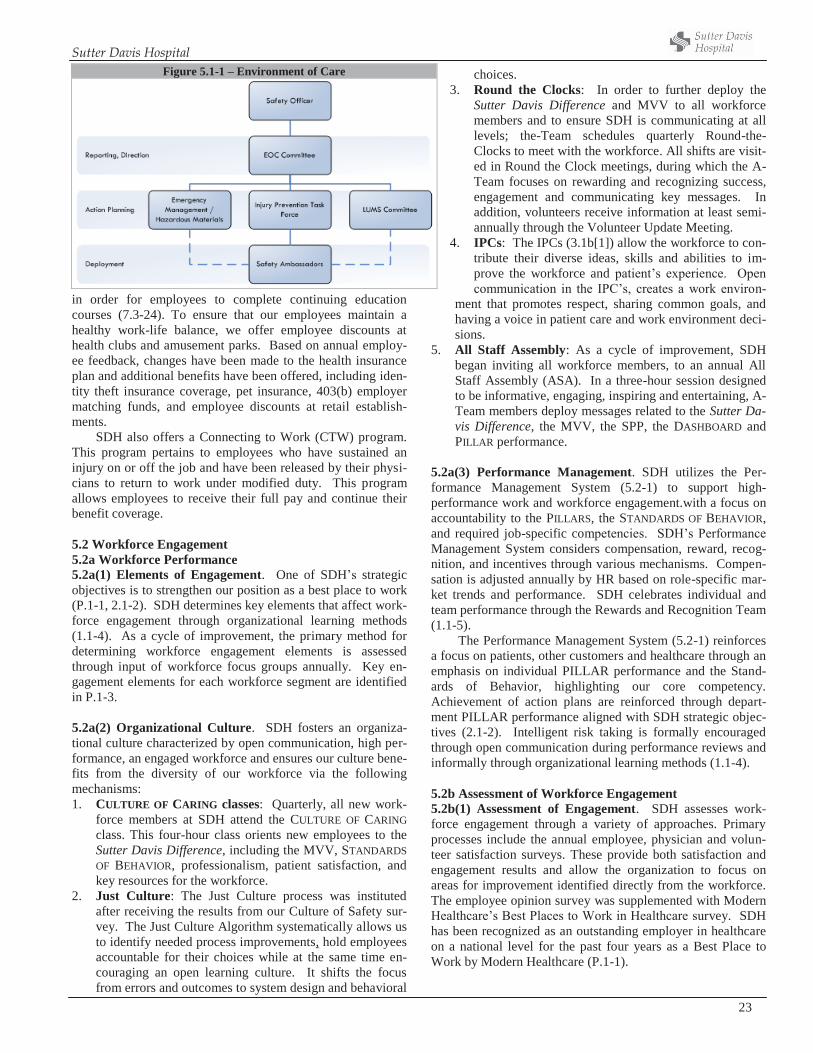
Sutter Davis Hospital
23
in order for employees to complete continuing education courses (7.3-24). To ensure that our employees maintain a healthy work-life balance, we offer employee discounts at health clubs and amusement parks. Based on annual employ-ee feedback, changes have been made to the health insurance plan and additional benefits have been offered, including iden-tity theft insurance coverage, pet insurance, 403(b) employer matching funds, and employee discounts at retail establish-ments.
SDH also offers a Connecting to Work (CTW) program. This program pertains to employees who have sustained an injury on or off the job and have been released by their physi-cians to return to work under modified duty. This program allows employees to receive their full pay and continue their benefit coverage.
5.2 Workforce Engagement 5.2a Workforce Performance 5.2a(1) Elements of Engagement. One of SDH’s strategic objectives is to strengthen our position as a best place to work (P.1-1, 2.1-2). SDH determines key elements that affect work-force engagement through organizational learning methods (1.1-4). As a cycle of improvement, the primary method for determining workforce engagement elements is assessed through input of workforce focus groups annually. Key en-gagement elements for each workforce segment are identified in P.1-3.
5.2a(2) Organizational Culture. SDH fosters an organiza-tional culture characterized by open communication, high per-formance, an engaged workforce and ensures our culture bene-fits from the diversity of our workforce via the following mechanisms: 1. CULTURE OF CARING classes: Quarterly, all new work-
force members at SDH attend the CULTURE OF CARING class. This four-hour class orients new employees to the Sutter Davis Difference, including the MVV, STANDARDS OF BEHAVIOR, professionalism, patient satisfaction, and key resources for the workforce.
2. Just Culture: The Just Culture process was instituted after receiving the results from our Culture of Safety sur-vey. The Just Culture Algorithm systematically allows us to identify needed process improvements, hold employees accountable for their choices while at the same time en-couraging an open learning culture. It shifts the focus from errors and outcomes to system design and behavioral
choices. 3. Round the Clocks: In order to further deploy the
Sutter Davis Difference and MVV to all workforce members and to ensure SDH is communicating at all levels; the-Team schedules quarterly Round-the-Clocks to meet with the workforce. All shifts are visit-ed in Round the Clock meetings, during which the A-Team focuses on rewarding and recognizing success, engagement and communicating key messages. In addition, volunteers receive information at least semi-annually through the Volunteer Update Meeting.
4. IPCs: The IPCs (3.1b[1]) allow the workforce to con-tribute their diverse ideas, skills and abilities to im-prove the workforce and patient’s experience. Open communication in the IPC’s, creates a work environ-
ment that promotes respect, sharing common goals, and having a voice in patient care and work environment deci-sions.
5. All Staff Assembly: As a cycle of improvement, SDH began inviting all workforce members, to an annual All Staff Assembly (ASA). In a three-hour session designed to be informative, engaging, inspiring and entertaining, A-Team members deploy messages related to the Sutter Da-vis Difference, the MVV, the SPP, the DASHBOARD and PILLAR performance.
5.2a(3) Performance Management. SDH utilizes the Per-formance Management System (5.2-1) to support high-performance work and workforce engagement.with a focus on accountability to the PILLARS, the STANDARDS OF BEHAVIOR, and required job-specific competencies. SDH’s Performance Management System considers compensation, reward, recog-nition, and incentives through various mechanisms. Compen-sation is adjusted annually by HR based on role-specific mar-ket trends and performance. SDH celebrates individual and team performance through the Rewards and Recognition Team (1.1-5). The Performance Management System (5.2-1) reinforces a focus on patients, other customers and healthcare through an emphasis on individual PILLAR performance and the Stand-ards of Behavior, highlighting our core competency. Achievement of action plans are reinforced through depart-ment PILLAR performance aligned with SDH strategic objec-tives (2.1-2). Intelligent risk taking is formally encouraged through open communication during performance reviews and informally through organizational learning methods (1.1-4). 5.2b Assessment of Workforce Engagement 5.2b(1) Assessment of Engagement. SDH assesses work-force engagement through a variety of approaches. Primary processes include the annual employee, physician and volun-teer satisfaction surveys. These provide both satisfaction and engagement results and allow the organization to focus on areas for improvement identified directly from the workforce. The employee opinion survey was supplemented with Modern Healthcare’s Best Places to Work in Healthcare survey. SDH has been recognized as an outstanding employer in healthcare on a national level for the past four years as a Best Place to Work by Modern Healthcare (P.1-1).
Figure 5.1-1 – Environment of Care
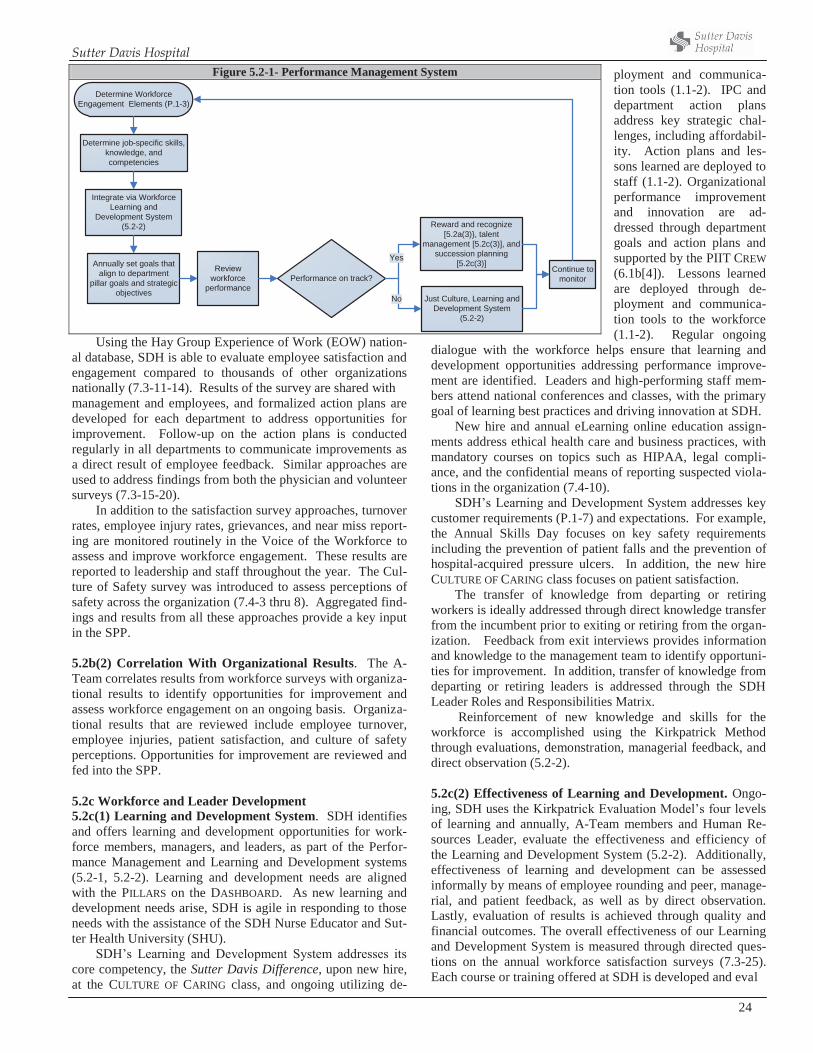
Sutter Davis Hospital
24
Using the Hay Group Experience of Work (EOW) nation-al database, SDH is able to evaluate employee satisfaction and engagement compared to thousands of other organizations nationally (7.3-11-14). Results of the survey are shared with management and employees, and formalized action plans are developed for each department to address opportunities for improvement. Follow-up on the action plans is conducted regularly in all departments to communicate improvements as a direct result of employee feedback. Similar approaches are used to address findings from both the physician and volunteer surveys (7.3-15-20).
In addition to the satisfaction survey approaches, turnover rates, employee injury rates, grievances, and near miss report-ing are monitored routinely in the Voice of the Workforce to assess and improve workforce engagement. These results are reported to leadership and staff throughout the year. The Cul-ture of Safety survey was introduced to assess perceptions of safety across the organization (7.4-3 thru 8). Aggregated find-ings and results from all these approaches provide a key input in the SPP. 5.2b(2) Correlation With Organizational Results. The A-Team correlates results from workforce surveys with organiza-tional results to identify opportunities for improvement and assess workforce engagement on an ongoing basis. Organiza-tional results that are reviewed include employee turnover, employee injuries, patient satisfaction, and culture of safety perceptions. Opportunities for improvement are reviewed and fed into the SPP. 5.2c Workforce and Leader Development 5.2c(1) Learning and Development System. SDH identifies and offers learning and development opportunities for work-force members, managers, and leaders, as part of the Perfor-mance Management and Learning and Development systems (5.2-1, 5.2-2). Learning and development needs are aligned with the PILLARS on the DASHBOARD. As new learning and development needs arise, SDH is agile in responding to those needs with the assistance of the SDH Nurse Educator and Sut-ter Health University (SHU).
SDH’s Learning and Development System addresses its core competency, the Sutter Davis Difference, upon new hire, at the CULTURE OF CARING class, and ongoing utilizing de-
ployment and communica-tion tools (1.1-2). IPC and department action plans address key strategic chal-lenges, including affordabil-ity. Action plans and les-sons learned are deployed to staff (1.1-2). Organizational performance improvement and innovation are ad-dressed through department goals and action plans and supported by the PIIT CREW (6.1b[4]). Lessons learned are deployed through de-ployment and communica-tion tools to the workforce (1.1-2). Regular ongoing
dialogue with the workforce helps ensure that learning and development opportunities addressing performance improve-ment are identified. Leaders and high-performing staff mem-bers attend national conferences and classes, with the primary goal of learning best practices and driving innovation at SDH.
New hire and annual eLearning online education assign-ments address ethical health care and business practices, with mandatory courses on topics such as HIPAA, legal compli-ance, and the confidential means of reporting suspected viola-tions in the organization (7.4-10).
SDH’s Learning and Development System addresses key customer requirements (P.1-7) and expectations. For example, the Annual Skills Day focuses on key safety requirements including the prevention of patient falls and the prevention of hospital-acquired pressure ulcers. In addition, the new hire CULTURE OF CARING class focuses on patient satisfaction.
The transfer of knowledge from departing or retiring workers is ideally addressed through direct knowledge transfer from the incumbent prior to exiting or retiring from the organ-ization. Feedback from exit interviews provides information and knowledge to the management team to identify opportuni-ties for improvement. In addition, transfer of knowledge from departing or retiring leaders is addressed through the SDH Leader Roles and Responsibilities Matrix.
Reinforcement of new knowledge and skills for the workforce is accomplished using the Kirkpatrick Method through evaluations, demonstration, managerial feedback, and direct observation (5.2-2). 5.2c(2) Effectiveness of Learning and Development. Ongo-ing, SDH uses the Kirkpatrick Evaluation Model’s four levels of learning and annually, A-Team members and Human Re-sources Leader, evaluate the effectiveness and efficiency of the Learning and Development System (5.2-2). Additionally, effectiveness of learning and development can be assessed informally by means of employee rounding and peer, manage-rial, and patient feedback, as well as by direct observation. Lastly, evaluation of results is achieved through quality and financial outcomes. The overall effectiveness of our Learning and Development System is measured through directed ques-tions on the annual workforce satisfaction surveys (7.3-25). Each course or training offered at SDH is developed and eval
Figure 5.2-1- Performance Management System
Determine Workforce Engagement Elements (P.1-3)
Determine job-specific skills, knowledge, and competencies
Integrate via Workforce Learning and
Development System (5.2-2)
Annually set goals that align to department
pillar goals and strategic objectives
Review workforce
performance
Reward and recognize [5.2a(3)}, talent
management [5.2c(3)], and succession planning
[5.2c(3)]
Just Culture, Learning and Development System
(5.2-2)
Continue to monitorPerformance on track?
Yes
No
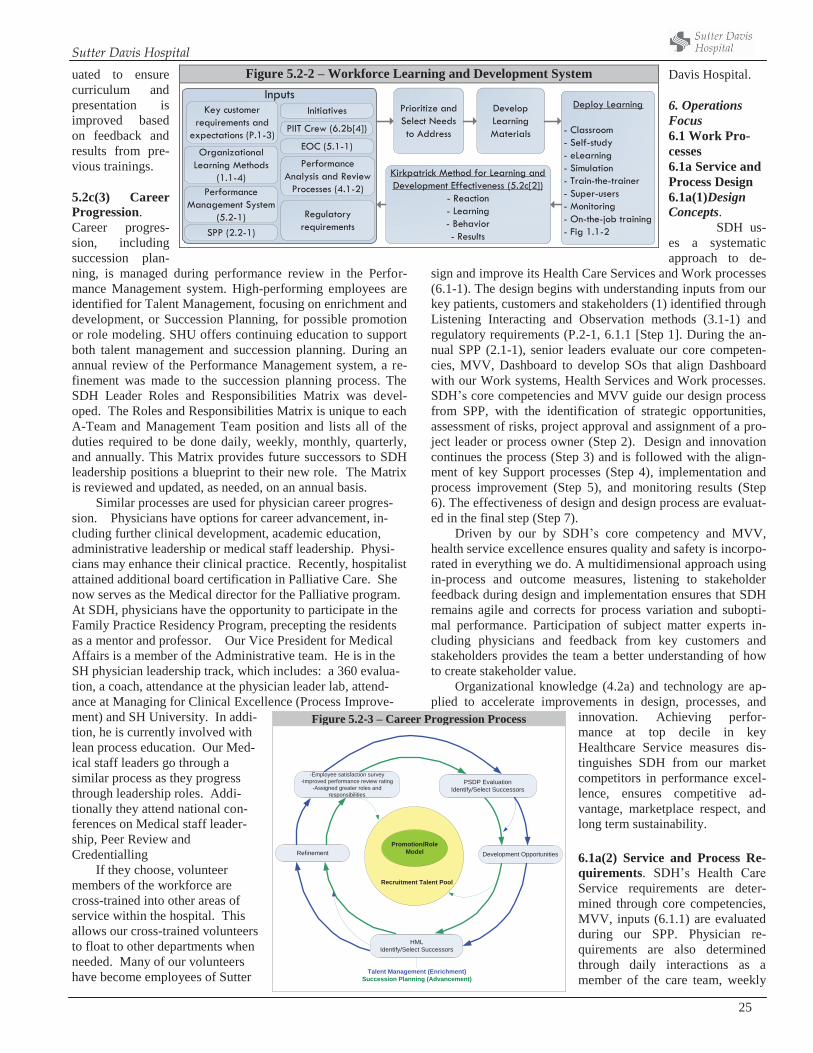
Sutter Davis Hospital
25
uated to ensure curriculum and presentation is improved based on feedback and results from pre-vious trainings. 5.2c(3) Career Progression. Career progres-sion, including succession plan-ning, is managed during performance review in the Perfor-mance Management system. High-performing employees are identified for Talent Management, focusing on enrichment and development, or Succession Planning, for possible promotion or role modeling. SHU offers continuing education to support both talent management and succession planning. During an annual review of the Performance Management system, a re-finement was made to the succession planning process. The SDH Leader Roles and Responsibilities Matrix was devel-oped. The Roles and Responsibilities Matrix is unique to each A-Team and Management Team position and lists all of the duties required to be done daily, weekly, monthly, quarterly, and annually. This Matrix provides future successors to SDH leadership positions a blueprint to their new role. The Matrix is reviewed and updated, as needed, on an annual basis. Similar processes are used for physician career progres-sion. Physicians have options for career advancement, in-cluding further clinical development, academic education, administrative leadership or medical staff leadership. Physi-cians may enhance their clinical practice. Recently, hospitalist attained additional board certification in Palliative Care. She now serves as the Medical director for the Palliative program. At SDH, physicians have the opportunity to participate in the Family Practice Residency Program, precepting the residents as a mentor and professor. Our Vice President for Medical Affairs is a member of the Administrative team. He is in the SH physician leadership track, which includes: a 360 evalua-tion, a coach, attendance at the physician leader lab, attend-ance at Managing for Clinical Excellence (Process Improve-ment) and SH University. In addi-tion, he is currently involved with lean process education. Our Med-ical staff leaders go through a similar process as they progress through leadership roles. Addi-tionally they attend national con-ferences on Medical staff leader-ship, Peer Review and Credentialling
If they choose, volunteer members of the workforce are cross-trained into other areas of service within the hospital. This allows our cross-trained volunteers to float to other departments when needed. Many of our volunteers have become employees of Sutter
Davis Hospital. 6. Operations Focus 6.1 Work Pro-cesses 6.1a Service and Process Design 6.1a(1)Design Concepts.
SDH us-es a systematic approach to de-
sign and improve its Health Care Services and Work processes (6.1-1). The design begins with understanding inputs from our key patients, customers and stakeholders (1) identified through Listening Interacting and Observation methods (3.1-1) and regulatory requirements (P.2-1, 6.1.1 [Step 1]. During the an-nual SPP (2.1-1), senior leaders evaluate our core competen-cies, MVV, Dashboard to develop SOs that align Dashboard with our Work systems, Health Services and Work processes. SDH’s core competencies and MVV guide our design process from SPP, with the identification of strategic opportunities, assessment of risks, project approval and assignment of a pro-ject leader or process owner (Step 2). Design and innovation continues the process (Step 3) and is followed with the align-ment of key Support processes (Step 4), implementation and process improvement (Step 5), and monitoring results (Step 6). The effectiveness of design and design process are evaluat-ed in the final step (Step 7).
Driven by our by SDH’s core competency and MVV, health service excellence ensures quality and safety is incorpo-rated in everything we do. A multidimensional approach using in-process and outcome measures, listening to stakeholder feedback during design and implementation ensures that SDH remains agile and corrects for process variation and subopti-mal performance. Participation of subject matter experts in-cluding physicians and feedback from key customers and stakeholders provides the team a better understanding of how to create stakeholder value. Organizational knowledge (4.2a) and technology are ap-plied to accelerate improvements in design, processes, and
innovation. Achieving perfor-mance at top decile in key Healthcare Service measures dis-tinguishes SDH from our market competitors in performance excel-lence, ensures competitive ad-vantage, marketplace respect, and long term sustainability. 6.1a(2) Service and Process Re-quirements. SDH’s Health Care Service requirements are deter-mined through core competencies, MVV, inputs (6.1.1) are evaluated during our SPP. Physician re-quirements are also determined through daily interactions as a member of the care team, weekly
Figure 5.2-2 – Workforce Learning and Development System
Key customer requirements and
expectations (P.1-3)
Regulatory requirements
Initiatives
Performance Analysis and Review
Processes (4.1-2)Performance Management System
(5.2-1)
Organizational Learning Methods
(1.1-4)
Prioritize and Select Needs to Address
Develop Learning Materials
Kirkpatrick Method for Learning and Development Effectiveness (5.2c[2])
- Reaction- Learning- Behavior- Results
Deploy Learning
- Classroom- Self-study- eLearning- Simulation- Train-the-trainer- Super-users- Monitoring- On-the-job training- Fig 1.1-2
PIIT Crew (6.2b[4])
SPP (2.2-1)
Inputs
EOC (5.1-1)
Figure 5.2-3 – Career Progression Process
Recruitment Talent Pool
Promotion/RoleModel
-Employee satisfaction survey-Improved performance review rating
-Assigned greater roles andresponsibilities
PSDP EvaluationIdentify/Select Successors
Refinement Development Opportunities
HMLIdentify/Select Successors
Talent Management (Enrichment)Succession Planning (Advancement)
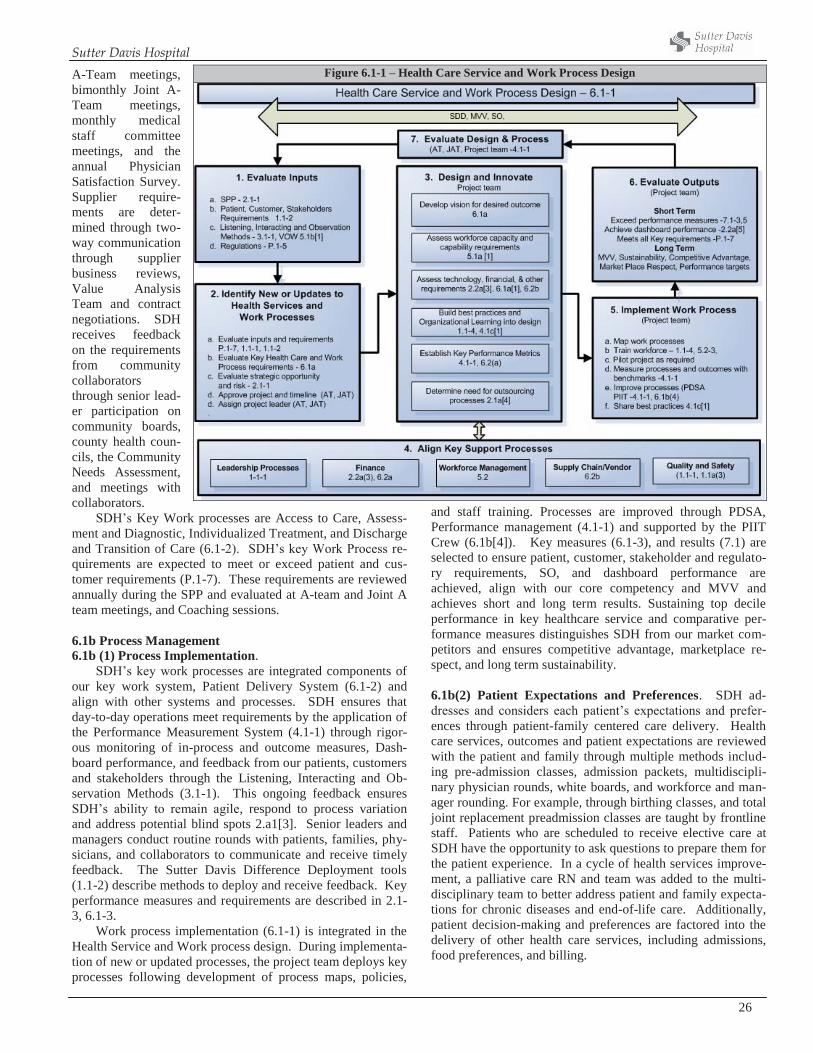
Sutter Davis Hospital
26
A-Team meetings, bimonthly Joint A-Team meetings, monthly medical staff committee meetings, and the annual Physician Satisfaction Survey. Supplier require-ments are deter-mined through two-way communication through supplier business reviews, Value Analysis Team and contract negotiations. SDH receives feedback on the requirements from community collaborators through senior lead-er participation on community boards, county health coun-cils, the Community Needs Assessment, and meetings with collaborators.
SDH’s Key Work processes are Access to Care, Assess-ment and Diagnostic, Individualized Treatment, and Discharge and Transition of Care (6.1-2). SDH’s key Work Process re-quirements are expected to meet or exceed patient and cus-tomer requirements (P.1-7). These requirements are reviewed annually during the SPP and evaluated at A-team and Joint A team meetings, and Coaching sessions. 6.1b Process Management 6.1b (1) Process Implementation.
SDH’s key work processes are integrated components of our key work system, Patient Delivery System (6.1-2) and align with other systems and processes. SDH ensures that day-to-day operations meet requirements by the application of the Performance Measurement System (4.1-1) through rigor-ous monitoring of in-process and outcome measures, Dash-board performance, and feedback from our patients, customers and stakeholders through the Listening, Interacting and Ob-servation Methods (3.1-1). This ongoing feedback ensures SDH’s ability to remain agile, respond to process variation and address potential blind spots 2.a1[3]. Senior leaders and managers conduct routine rounds with patients, families, phy-sicians, and collaborators to communicate and receive timely feedback. The Sutter Davis Difference Deployment tools (1.1-2) describe methods to deploy and receive feedback. Key performance measures and requirements are described in 2.1-3, 6.1-3.
Work process implementation (6.1-1) is integrated in the Health Service and Work process design. During implementa-tion of new or updated processes, the project team deploys key processes following development of process maps, policies,
and staff training. Processes are improved through PDSA, Performance management (4.1-1) and supported by the PIIT Crew (6.1b[4]). Key measures (6.1-3), and results (7.1) are selected to ensure patient, customer, stakeholder and regulato-ry requirements, SO, and dashboard performance are achieved, align with our core competency and MVV and achieves short and long term results. Sustaining top decile performance in key healthcare service and comparative per-formance measures distinguishes SDH from our market com-petitors and ensures competitive advantage, marketplace re-spect, and long term sustainability. 6.1b(2) Patient Expectations and Preferences. SDH ad-dresses and considers each patient’s expectations and prefer-ences through patient-family centered care delivery. Health care services, outcomes and patient expectations are reviewed with the patient and family through multiple methods includ-ing pre-admission classes, admission packets, multidiscipli-nary physician rounds, white boards, and workforce and man-ager rounding. For example, through birthing classes, and total joint replacement preadmission classes are taught by frontline staff. Patients who are scheduled to receive elective care at SDH have the opportunity to ask questions to prepare them for the patient experience. In a cycle of health services improve-ment, a palliative care RN and team was added to the multi-disciplinary team to better address patient and family expecta-tions for chronic diseases and end-of-life care. Additionally, patient decision-making and preferences are factored into the delivery of other health care services, including admissions, food preferences, and billing.
Figure 6.1-1 – Health Care Service and Work Process Design
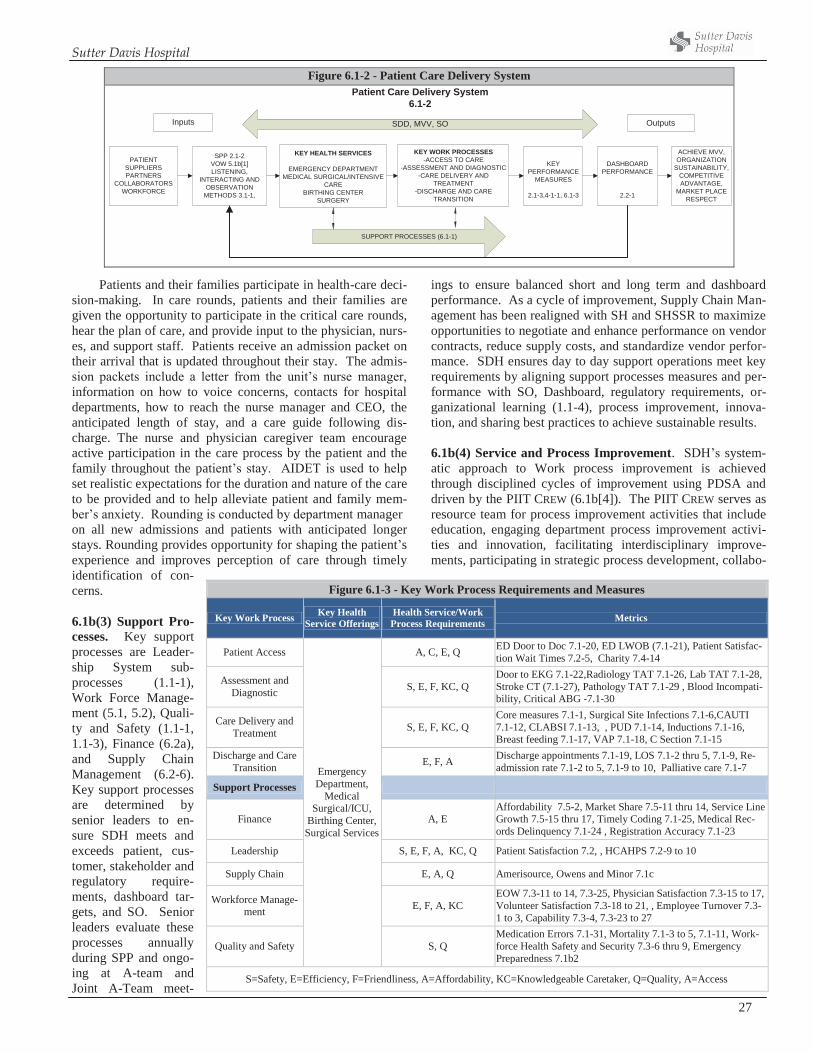
Sutter Davis Hospital
27
Patients and their families participate in health-care deci-sion-making. In care rounds, patients and their families are given the opportunity to participate in the critical care rounds, hear the plan of care, and provide input to the physician, nurs-es, and support staff. Patients receive an admission packet on their arrival that is updated throughout their stay. The admis-sion packets include a letter from the unit’s nurse manager, information on how to voice concerns, contacts for hospital departments, how to reach the nurse manager and CEO, the anticipated length of stay, and a care guide following dis-charge. The nurse and physician caregiver team encourage active participation in the care process by the patient and the family throughout the patient’s stay. AIDET is used to help set realistic expectations for the duration and nature of the care to be provided and to help alleviate patient and family mem-ber’s anxiety. Rounding is conducted by department manager on all new admissions and patients with anticipated longer stays. Rounding provides opportunity for shaping the patient’s experience and improves perception of care through timely identification of con-cerns. 6.1b(3) Support Pro-cesses. Key support processes are Leader-ship System sub-processes (1.1-1), Work Force Manage-ment (5.1, 5.2), Quali-ty and Safety (1.1-1, 1.1-3), Finance (6.2a), and Supply Chain Management (6.2-6). Key support processes are determined by senior leaders to en-sure SDH meets and exceeds patient, cus-tomer, stakeholder and regulatory require-ments, dashboard tar-gets, and SO. Senior leaders evaluate these processes annually during SPP and ongo-ing at A-team and Joint A-Team meet-
ings to ensure balanced short and long term and dashboard performance. As a cycle of improvement, Supply Chain Man-agement has been realigned with SH and SHSSR to maximize opportunities to negotiate and enhance performance on vendor contracts, reduce supply costs, and standardize vendor perfor-mance. SDH ensures day to day support operations meet key requirements by aligning support processes measures and per-formance with SO, Dashboard, regulatory requirements, or-ganizational learning (1.1-4), process improvement, innova-tion, and sharing best practices to achieve sustainable results. 6.1b(4) Service and Process Improvement. SDH’s system-atic approach to Work process improvement is achieved through disciplined cycles of improvement using PDSA and driven by the PIIT CREW (6.1b[4]). The PIIT CREW serves as resource team for process improvement activities that include education, engaging department process improvement activi-ties and innovation, facilitating interdisciplinary improve-ments, participating in strategic process development, collabo-
Figure 6.1-2 - Patient Care Delivery System
SPP 2.1-2VOW 5.1b[1]LISTENING,
INTERACTING ANDOBSERVATION
METHODS 3.1-1,
KEY HEALTH SERVICES
EMERGENCY DEPARTMENTMEDICAL SURGICAL/INTENSIVE
CAREBIRTHING CENTER
SURGERY
KEY WORK PROCESSES-ACCESS TO CARE
-ASSESSMENT AND DIAGNOSTIC-CARE DELIVERY AND
TREATMENT-DISCHARGE AND CARE
TRANSITION
DASHBOARDPERFORMANCE
2.2-1
ACHIEVE MVV,ORGANIZATION
SUSTAINABILITY,COMPETITIVEADVANTAGE,
MARKET PLACERESPECT
OutputsInputs
PATIENTSUPPLIERSPARTNERS
COLLABORATORSWORKFORCE
KEYPERFORMANCE
MEASURES
2.1-3,4-1-1, 6.1-3
SDD, MVV, SO
SUPPORT PROCESSES (6.1-1)
Patient Care Delivery System6.1-2
Figure 6.1-3 - Key Work Process Requirements and Measures
Key Work Process Key Health Service Offerings
Health Service/Work Process Requirements Metrics
Patient Access
Emergency Department,
Medical Surgical/ICU,
Birthing Center, Surgical Services
A, C, E, Q ED Door to Doc 7.1-20, ED LWOB (7.1-21), Patient Satisfac-tion Wait Times 7.2-5, Charity 7.4-14
Assessment and Diagnostic S, E, F, KC, Q
Door to EKG 7.1-22,Radiology TAT 7.1-26, Lab TAT 7.1-28, Stroke CT (7.1-27), Pathology TAT 7.1-29 , Blood Incompati-bility, Critical ABG -7.1-30
Care Delivery and Treatment S, E, F, KC, Q
Core measures 7.1-1, Surgical Site Infections 7.1-6,CAUTI 7.1-12, CLABSI 7.1-13, , PUD 7.1-14, Inductions 7.1-16, Breast feeding 7.1-17, VAP 7.1-18, C Section 7.1-15
Discharge and Care Transition E, F, A Discharge appointments 7.1-19, LOS 7.1-2 thru 5, 7.1-9, Re-
admission rate 7.1-2 to 5, 7.1-9 to 10, Palliative care 7.1-7
Support Processes
Finance A, E Affordability 7.5-2, Market Share 7.5-11 thru 14, Service Line Growth 7.5-15 thru 17, Timely Coding 7.1-25, Medical Rec-ords Delinquency 7.1-24 , Registration Accuracy 7.1-23
Leadership S, E, F, A, KC, Q Patient Satisfaction 7.2, , HCAHPS 7.2-9 to 10
Supply Chain E, A, Q Amerisource, Owens and Minor 7.1c
Workforce Manage-ment E, F, A, KC
EOW 7.3-11 to 14, 7.3-25, Physician Satisfaction 7.3-15 to 17, Volunteer Satisfaction 7.3-18 to 21, , Employee Turnover 7.3-1 to 3, Capability 7.3-4, 7.3-23 to 27
Quality and Safety S, Q Medication Errors 7.1-31, Mortality 7.1-3 to 5, 7.1-11, Work-force Health Safety and Security 7.3-6 thru 9, Emergency Preparedness 7.1b2
S=Safety, E=Efficiency, F=Friendliness, A=Affordability, KC=Knowledgeable Caretaker, Q=Quality, A=Access
Sutter Davis Hospital
28
rating with senior leaders in prioritizing strategically vital pro-jects, maintaining an intranet site for project status and sharing best practices.
OFIs may be identified and initiated through Listening, Interacting, and Observation Methods (3.1-1), VOW (5.1b[1]), Baldrige feedback, Performance Measurement System (4.1-1), and during Health care service and process design (6.1-1). Process improvement focuses on statistical methods for reduc-ing variation cycle times, accuracy, improving productivity, decreasing costs, organization learning, and enhancing service delivery and creating stakeholder value through the Perfor-mance Management System (5.2-1). OFIs are reviewed by senior leaders with the PIIT Crew, prioritized for urgency, and alignment with SDH’s MVV, strategic objectives and DASH-BOARD.
The PIIT CREW selects process owners and teams that in-clude physicians, leaders and high performing staff. The inter-disciplinary project teams use inputs (6.1-1) process maps, SMART goals, research benchmarks or best practices, internal and external best practices and information from patients and stakeholders through Listening, Interacting, and Observation Methods. Each process owner tracks progress using a one-page online PIIT Crew report. A refinement to the report in-cludes a learning section to briefly describe and outline any barriers or learning collected through the process. The results section of the PIIT CREW Report uses statistical analysis to demonstrate decrease in variation and improvements. Manag-ers, senior leaders, and high-performing staff members learn the PDSA rapid cycle approach and statistical tools at MCE and PIIT Crew.
The PIIT Crew tracks projects on the PIIT Crew’s online Turtle Transparency site and the workforce has access to the share point site. PIIT Crew improvements and lessons learned are deployed through the Workforce Learning and Develop-ment System (5.2-2). This systematic deployment ensures the organization benefits from improvements and shared learning through Organizational Learning methods (1.1-4). The PIIT Crew and A Team reevaluate the effectiveness of PIIT Crew annually. As a cycle of improvement, the PIIT Crew revised it prioritization method to align projects with strategic planning and objectives. As a cycle of learning, the project tracking program has been updated to identify and share key learning from a project. 6.2 Operational Effectiveness 6.2a Cost Control. SDH’s methods to control costs are in-corporated in the Health Care Service and Work process de-sign where cost measures are identified. Process measures such as service turn-around (efficiency), accuracy, cost per service unit, and productivity are methods used to monitor costs during service and process design and improvement. These process measures prevent errors and rework, reduce costs and maximize reimbursement. Performance is bench-marked to against top decile 4.1a[2], when available, to vali-date whether systems are effective and efficient. Measure-ments are monitored regularly to ensure processes perform to targets, are agile and responsive to changing conditions. Other methods to control costs include:
1. Implement proactive audits on regulatory requirements and actions to exceed requirements, prevent costly inspec-tions, expenses and fines.
2. RCA and FMEA to proactively assess and prevent rework from system and process failures.
3. Implement evidenced-based practices such as pneumonia protocols to improve effectiveness of healthcare processes and outcomes, and decrease cost (7.1-1, 7.1-2).
4. Incorporate technologies to accelerate improve in quality, access, affordability. The MUSE cardiology resulted in efficient physician interpretation of diagnostic cardiology tests by reducing report turn around.
5. Reduce waste, improving efficiency, and decreasing cost through the engagement of the PIIT Crew, process im-provement and innovation (6.1b[4]). The Affordability team has undertaken numerous cycles of improvements to through to decrease readmission and patient length of stay (7.1-9, 10). As part of our societal responsibility, unused medical supplies and equipment are donated to under-served countries (7.4-17)
6. Deploy a systematic review of quality database, Midas. The data is aggregated and reviewed by the medical staff committees, PIIT Crew for improvements and reduce medical errors and unintended harm to patients.
SDH balances the need for control with the needs of the Pa-tients and Customer by ensuring that requirements (P.1-7) are met through a balanced evaluation by the by senior leaders in executing the Leadership System (1.1-1). 6.2b Supply Chain Management. SH uses an integrated supply chain organizational structure that ensures all affiliates report to a single supply chain manager, allowing standardiza-tion of supplies, equipment, and services by adopting and sharing best practices and cost savings. To ensure our suppli-ers and vendors are qualified and positioned to enhance our quality, affordability, access to products and services, SDH participates in Regional and SH the Value Analysis Team. These teams have a broad and diverse input into the ven-dor/product selection. They are comprised of multi-disciplinary end users and key stakeholders including physi-cians.
The SDH Value Analysis Team is comprised of clinical and supply managers, vendors and senior leaders who monitor project/contract implementation, vendor performance metrics, evaluate alignment of core competency, and provide feedback. Additionally, the quarterly business reviews is a method for reviewing performance and alignment of key suppliers and vendors including the alignment of core competencies. Learn-ing from the shared data and performance reviews allows SDH to implement corrective actions to improve access to quality and affordability of goods and services. The team also en-sures vendor compliance, standardize practices, and pricing. The SH Supply Chain has built a Corrective Action Request (CAR) into each contract to address poor vendor performance and develop action plans for improvement. 6.2c. Safety and Emergency Preparedness 6.2c (1) Safety. Consistent with our MVV, SDH provides a safe operating environment for its workforce through a system
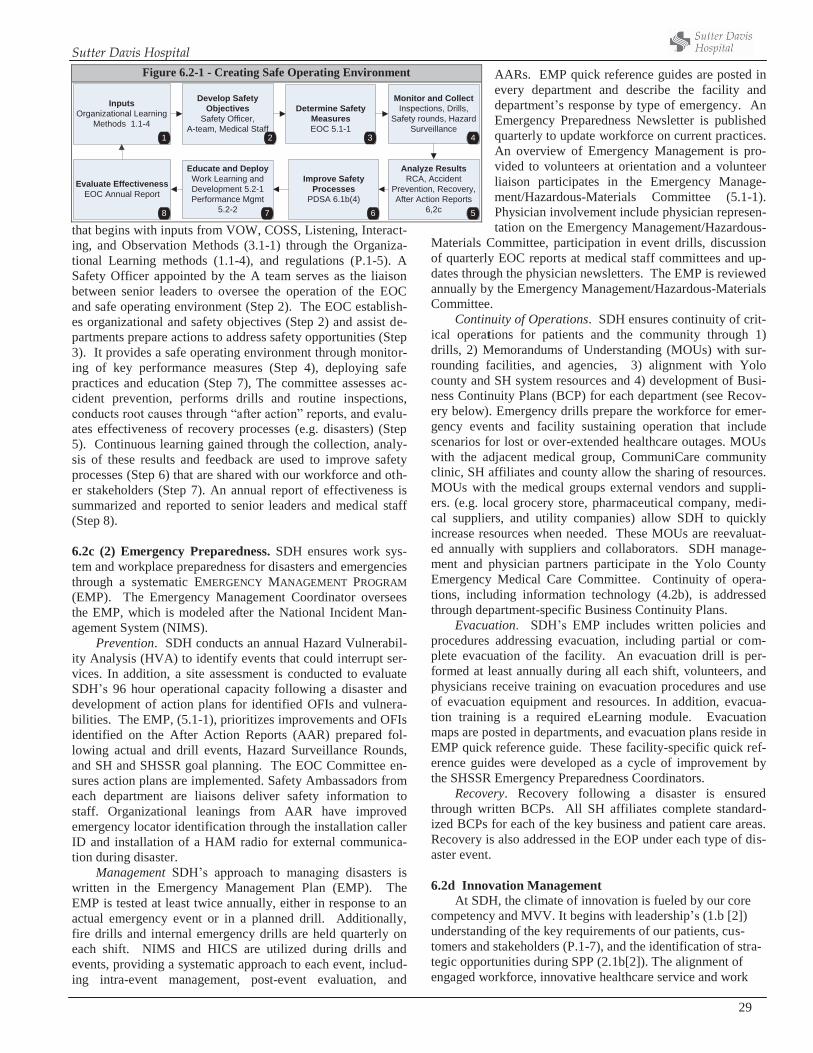
Sutter Davis Hospital
29
that begins with inputs from VOW, COSS, Listening, Interact-ing, and Observation Methods (3.1-1) through the Organiza-tional Learning methods (1.1-4), and regulations (P.1-5). A Safety Officer appointed by the A team serves as the liaison between senior leaders to oversee the operation of the EOC and safe operating environment (Step 2). The EOC establish-es organizational and safety objectives (Step 2) and assist de-partments prepare actions to address safety opportunities (Step 3). It provides a safe operating environment through monitor-ing of key performance measures (Step 4), deploying safe practices and education (Step 7), The committee assesses ac-cident prevention, performs drills and routine inspections, conducts root causes through “after action” reports, and evalu-ates effectiveness of recovery processes (e.g. disasters) (Step 5). Continuous learning gained through the collection, analy-sis of these results and feedback are used to improve safety processes (Step 6) that are shared with our workforce and oth-er stakeholders (Step 7). An annual report of effectiveness is summarized and reported to senior leaders and medical staff (Step 8). 6.2c (2) Emergency Preparedness. SDH ensures work sys-tem and workplace preparedness for disasters and emergencies through a systematic EMERGENCY MANAGEMENT PROGRAM (EMP). The Emergency Management Coordinator oversees the EMP, which is modeled after the National Incident Man-agement System (NIMS).
Prevention. SDH conducts an annual Hazard Vulnerabil-ity Analysis (HVA) to identify events that could interrupt ser-vices. In addition, a site assessment is conducted to evaluate SDH’s 96 hour operational capacity following a disaster and development of action plans for identified OFIs and vulnera-bilities. The EMP, (5.1-1), prioritizes improvements and OFIs identified on the After Action Reports (AAR) prepared fol-lowing actual and drill events, Hazard Surveillance Rounds, and SH and SHSSR goal planning. The EOC Committee en-sures action plans are implemented. Safety Ambassadors from each department are liaisons deliver safety information to staff. Organizational leanings from AAR have improved emergency locator identification through the installation caller ID and installation of a HAM radio for external communica-tion during disaster.
Management SDH’s approach to managing disasters is written in the Emergency Management Plan (EMP). The EMP is tested at least twice annually, either in response to an actual emergency event or in a planned drill. Additionally, fire drills and internal emergency drills are held quarterly on each shift. NIMS and HICS are utilized during drills and events, providing a systematic approach to each event, includ-ing intra-event management, post-event evaluation, and
AARs. EMP quick reference guides are posted in every department and describe the facility and department’s response by type of emergency. An Emergency Preparedness Newsletter is published quarterly to update workforce on current practices. An overview of Emergency Management is pro-vided to volunteers at orientation and a volunteer liaison participates in the Emergency Manage-ment/Hazardous-Materials Committee (5.1-1). Physician involvement include physician represen-tation on the Emergency Management/Hazardous-
Materials Committee, participation in event drills, discussion of quarterly EOC reports at medical staff committees and up-dates through the physician newsletters. The EMP is reviewed annually by the Emergency Management/Hazardous-Materials Committee.
Continuity of Operations. SDH ensures continuity of crit-ical operations for patients and the community through 1) drills, 2) Memorandums of Understanding (MOUs) with sur-rounding facilities, and agencies, 3) alignment with Yolo county and SH system resources and 4) development of Busi-ness Continuity Plans (BCP) for each department (see Recov-ery below). Emergency drills prepare the workforce for emer-gency events and facility sustaining operation that include scenarios for lost or over-extended healthcare outages. MOUs with the adjacent medical group, CommuniCare community clinic, SH affiliates and county allow the sharing of resources. MOUs with the medical groups external vendors and suppli-ers. (e.g. local grocery store, pharmaceutical company, medi-cal suppliers, and utility companies) allow SDH to quickly increase resources when needed. These MOUs are reevaluat-ed annually with suppliers and collaborators. SDH manage-ment and physician partners participate in the Yolo County Emergency Medical Care Committee. Continuity of opera-tions, including information technology (4.2b), is addressed through department-specific Business Continuity Plans.
Evacuation. SDH’s EMP includes written policies and procedures addressing evacuation, including partial or com-plete evacuation of the facility. An evacuation drill is per-formed at least annually during all each shift, volunteers, and physicians receive training on evacuation procedures and use of evacuation equipment and resources. In addition, evacua-tion training is a required eLearning module. Evacuation maps are posted in departments, and evacuation plans reside in EMP quick reference guide. These facility-specific quick ref-erence guides were developed as a cycle of improvement by the SHSSR Emergency Preparedness Coordinators.
Recovery. Recovery following a disaster is ensured through written BCPs. All SH affiliates complete standard-ized BCPs for each of the key business and patient care areas. Recovery is also addressed in the EOP under each type of dis-aster event.
6.2d Innovation Management
At SDH, the climate of innovation is fueled by our core competency and MVV. It begins with leadership’s (1.b [2]) understanding of the key requirements of our patients, cus-tomers and stakeholders (P.1-7), and the identification of stra-tegic opportunities during SPP (2.1b[2]). The alignment of engaged workforce, innovative healthcare service and work
Figure 6.2-1 - Creating Safe Operating Environment
Develop SafetyObjectives
Safety Officer,A-team, Medical Staff
Monitor and CollectInspections, Drills,
Safety rounds, HazardSurveillance
Analyze ResultsRCA, Accident
Prevention, Recovery,After Action Reports
6,2c
Improve SafetyProcesses
PDSA 6.1b(4)
InputsOrganizational Learning
Methods 1.1-4
Determine SafetyMeasuresEOC 5.1-1
Evaluate EffectivenessEOC Annual Report
Educate and DeployWork Learning andDevelopment 5.2-1Performance Mgmt
5.2-2
1 2 3 4
5678
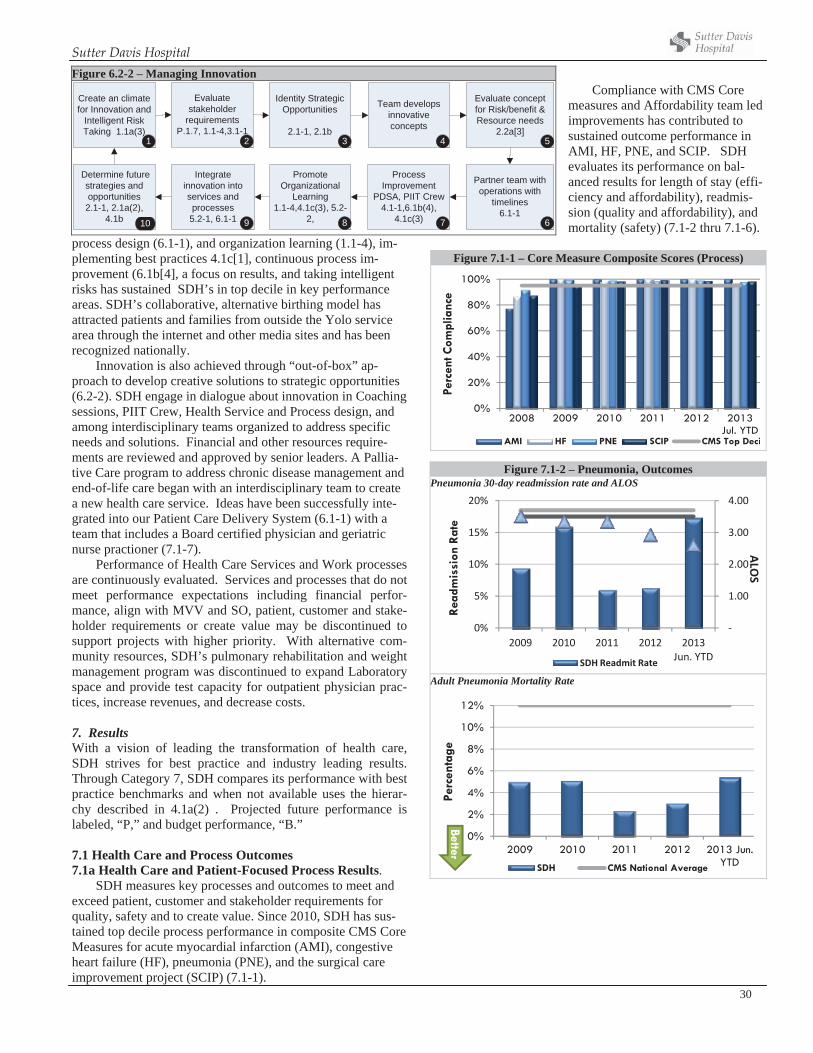
Sutter Davis Hospital
30
process design (6.1-1), and organization learning (1.1-4), im-plementing best practices 4.1c[1], continuous process im-provement (6.1b[4], a focus on results, and taking intelligent risks has sustained SDH’s in top decile in key performance areas. SDH’s collaborative, alternative birthing model has attracted patients and families from outside the Yolo service area through the internet and other media sites and has been recognized nationally.
Innovation is also achieved through “out-of-box” ap-proach to develop creative solutions to strategic opportunities (6.2-2). SDH engage in dialogue about innovation in Coaching sessions, PIIT Crew, Health Service and Process design, and among interdisciplinary teams organized to address specific needs and solutions. Financial and other resources require-ments are reviewed and approved by senior leaders. A Pallia-tive Care program to address chronic disease management and end-of-life care began with an interdisciplinary team to create a new health care service. Ideas have been successfully inte-grated into our Patient Care Delivery System (6.1-1) with a team that includes a Board certified physician and geriatric nurse practioner (7.1-7).
Performance of Health Care Services and Work processes are continuously evaluated. Services and processes that do not meet performance expectations including financial perfor-mance, align with MVV and SO, patient, customer and stake-holder requirements or create value may be discontinued to support projects with higher priority. With alternative com-munity resources, SDH’s pulmonary rehabilitation and weight management program was discontinued to expand Laboratory space and provide test capacity for outpatient physician prac-tices, increase revenues, and decrease costs.
7. ResultsWith a vision of leading the transformation of health care, SDH strives for best practice and industry leading results. Through Category 7, SDH compares its performance with best practice benchmarks and when not available uses the hierar-chy described in 4.1a(2) . Projected future performance is labeled, “P,” and budget performance, “B.”
7.1 Health Care and Process Outcomes 7.1a Health Care and Patient-Focused Process Results.
SDH measures key processes and outcomes to meet and exceed patient, customer and stakeholder requirements for quality, safety and to create value. Since 2010, SDH has sus-tained top decile process performance in composite CMS Core Measures for acute myocardial infarction (AMI), congestive heart failure (HF), pneumonia (PNE), and the surgical care improvement project (SCIP) (7.1-1).
Compliance with CMS Core measures and Affordability team led improvements has contributed to sustained outcome performance in AMI, HF, PNE, and SCIP. SDH evaluates its performance on bal-anced results for length of stay (effi-ciency and affordability), readmis-sion (quality and affordability), and mortality (safety) (7.1-2 thru 7.1-6).
Figure 7.1-1 – Core Measure Composite Scores (Process)
0%
20%
40%
60%
80%
100%
2008 2009 2010 2011 2012 2013 Jul. YTD
Perc
ent C
ompl
ianc
eAMI HF PNE SCIP CMS Top Deci
Figure 6.2-2 – Managing Innovation
Create an climate for Innovation and
Intelligent Risk Taking 1.1a(3)
Identity Strategic Opportunities
2.1-1, 2.1b
Evaluate stakeholder
requirements P.1.7, 1.1-4,3.1-1
Integrate innovation into services and processes 5.2-1, 6.1-1
Determine future strategies and opportunities2.1-1, 2.1a(2),
4.1b
Promote Organizational
Learning 1.1-4,4.1c(3), 5.2-
2,
Evaluate conceptfor Risk/benefit & Resource needs
2.2a[3]
Partner team with operations with
timelines6.1-1
Team develops innovative concepts
1 2 3 4
Process Improvement
PDSA, PIIT Crew 4.1-1,6.1b(4),
4.1c(3)
5
678910
Figure 7.1-2 – Pneumonia, Outcomes Pneumonia 30-day readmission rate and ALOS
1.00
2.00
3.00
4.00
0%
5%
10%
15%
20%
2009 2010 2011 2012 2013Jun. YTD
ALOS
Rea
dmis
sion
Rat
e
SDH Readmit Rate
Adult Pneumonia Mortality Rate
0%
2%
4%
6%
8%
10%
12%
2009 2010 2011 2012 2013 Jun. YTD
Perc
enta
ge
SDH CMS National Average
Better
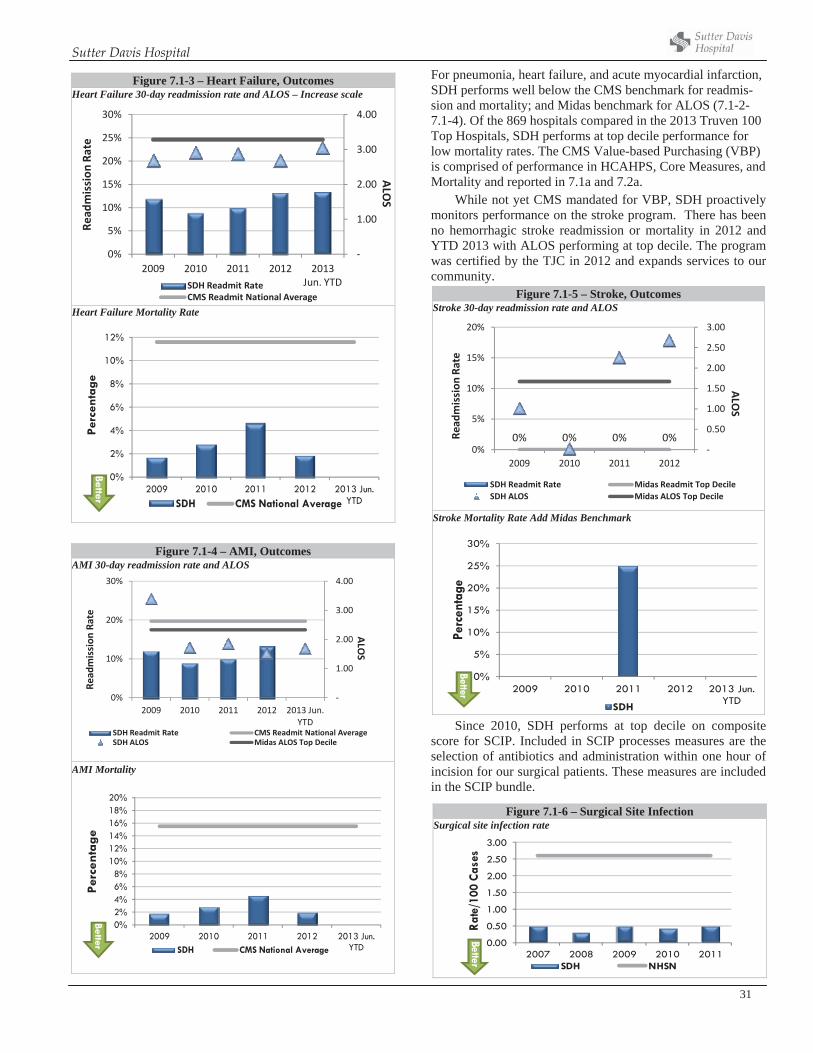
Sutter Davis Hospital
31
Figure 7.1-4 – AMI, Outcomes AMI 30-day readmission rate and ALOS
1.00
2.00
3.00
4.00
0%
10%
20%
30%
2009 2010 2011 2012 2013 Jun.YTD
ALOS
Read
mission
Rate
SDH Readmit Rate CMS Readmit National AverageSDH ALOS Midas ALOS Top Decile
AMI Mortality
0%2%4%6%8%
10%12%14%16%18%20%
2009 2010 2011 2012 2013 Jun. YTD
Perc
enta
ge
SDH CMS National Average
Better
For pneumonia, heart failure, and acute myocardial infarction, SDH performs well below the CMS benchmark for readmis-sion and mortality; and Midas benchmark for ALOS (7.1-2-7.1-4). Of the 869 hospitals compared in the 2013 Truven 100 Top Hospitals, SDH performs at top decile performance for low mortality rates. The CMS Value-based Purchasing (VBP) is comprised of performance in HCAHPS, Core Measures, and Mortality and reported in 7.1a and 7.2a.
While not yet CMS mandated for VBP, SDH proactively monitors performance on the stroke program. There has been no hemorrhagic stroke readmission or mortality in 2012 and YTD 2013 with ALOS performing at top decile. The program was certified by the TJC in 2012 and expands services to our community.
Figure 7.1-5 – Stroke, Outcomes Stroke 30-day readmission rate and ALOS
0% 0% 0% 0%0.50
1.00
1.50
2.00
2.50
3.00
0%
5%
10%
15%
20%
2009 2010 2011 2012
ALOS
Read
mission
Rate
SDH Readmit Rate Midas Readmit Top DecileSDH ALOS Midas ALOS Top Decile
Stroke Mortality Rate Add Midas Benchmark
0%
5%
10%
15%
20%
25%
30%
2009 2010 2011 2012 2013 Jun. YTD
Perc
enta
ge
SDH
Better
Since 2010, SDH performs at top decile on composite score for SCIP. Included in SCIP processes measures are the selection of antibiotics and administration within one hour of incision for our surgical patients. These measures are included in the SCIP bundle.
Figure 7.1-3 – Heart Failure, Outcomes Heart Failure 30-day readmission rate and ALOS – Increase scale
1.00
2.00
3.00
4.00
0%
5%
10%
15%
20%
25%
30%
2009 2010 2011 2012 2013Jun. YTD
ALOS
Read
mission
Rate
SDH Readmit RateCMS Readmit National Average
Heart Failure Mortality Rate
0%
2%
4%
6%
8%
10%
12%
2009 2010 2011 2012 2013 Jun. YTD
Perc
enta
ge
SDH CMS National Average
Better
Figure 7.1-6 – Surgical Site Infection Surgical site infection rate
0.00
0.50
1.00
1.50
2.00
2.50
3.00
2007 2008 2009 2010 2011
Rate
/100
Cas
es
SDH NHSN
Better
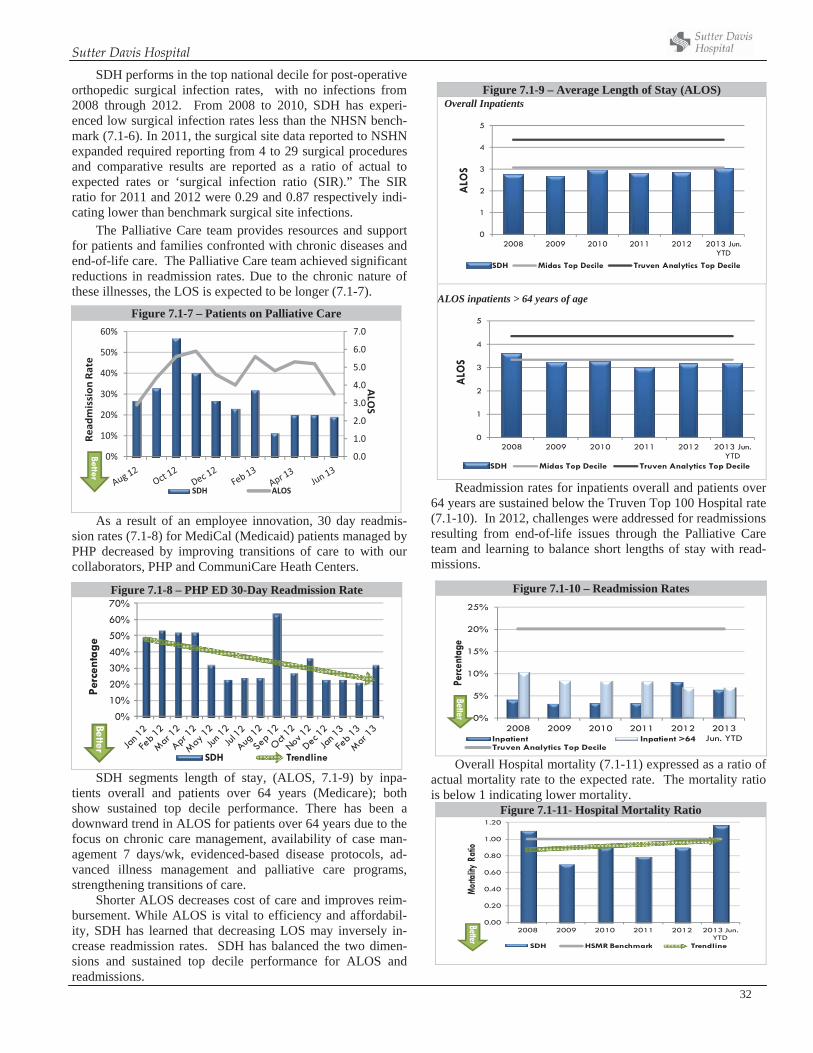
Sutter Davis Hospital
32
SDH performs in the top national decile for post-operative orthopedic surgical infection rates, with no infections from 2008 through 2012. From 2008 to 2010, SDH has experi-enced low surgical infection rates less than the NHSN bench-mark (7.1-6). In 2011, the surgical site data reported to NSHN expanded required reporting from 4 to 29 surgical procedures and comparative results are reported as a ratio of actual to expected rates or ‘surgical infection ratio (SIR).” The SIR ratio for 2011 and 2012 were 0.29 and 0.87 respectively indi-cating lower than benchmark surgical site infections.
The Palliative Care team provides resources and support for patients and families confronted with chronic diseases and end-of-life care. The Palliative Care team achieved significant reductions in readmission rates. Due to the chronic nature of these illnesses, the LOS is expected to be longer (7.1-7).
As a result of an employee innovation, 30 day readmis-sion rates (7.1-8) for MediCal (Medicaid) patients managed by PHP decreased by improving transitions of care to with our collaborators, PHP and CommuniCare Heath Centers.
SDH segments length of stay, (ALOS, 7.1-9) by inpa-tients overall and patients over 64 years (Medicare); both show sustained top decile performance. There has been a downward trend in ALOS for patients over 64 years due to the focus on chronic care management, availability of case man-agement 7 days/wk, evidenced-based disease protocols, ad-vanced illness management and palliative care programs, strengthening transitions of care.
Shorter ALOS decreases cost of care and improves reim-bursement. While ALOS is vital to efficiency and affordabil-ity, SDH has learned that decreasing LOS may inversely in-crease readmission rates. SDH has balanced the two dimen-sions and sustained top decile performance for ALOS and readmissions.
Figure 7.1-9 – Average Length of Stay (ALOS) Overall Inpatients
0
1
2
3
4
5
2008 2009 2010 2011 2012 2013 Jun. YTD
ALO
S
SDH Midas Top Decile Truven Analytics Top Decile
ALOS inpatients > 64 years of age
0
1
2
3
4
5
2008 2009 2010 2011 2012 2013 Jun. YTD
ALO
SSDH Midas Top Decile Truven Analytics Top Decile
Readmission rates for inpatients overall and patients over 64 years are sustained below the Truven Top 100 Hospital rate (7.1-10). In 2012, challenges were addressed for readmissions resulting from end-of-life issues through the Palliative Care team and learning to balance short lengths of stay with read-missions.
Overall Hospital mortality (7.1-11) expressed as a ratio of actual mortality rate to the expected rate. The mortality ratio is below 1 indicating lower mortality.
Figure 7.1-11- Hospital Mortality Ratio
0.00
0.20
0.40
0.60
0.80
1.00
1.20
2008 2009 2010 2011 2012 2013 Jun. YTD
Morta
lity R
atio
SDH HSMR Benchmark Trendline
Better
Figure 7.1-7 – Patients on Palliative Care
0.0
1.0
2.0
3.0
4.0
5.0
6.0
7.0
0%
10%
20%
30%
40%
50%
60%
ALOS
Read
mission
Rate
SDH ALOS
Better
Figure 7.1-8 – PHP ED 30-Day Readmission Rate
0%
10%
20%
30%
40%
50%
60%
70%
Perc
enta
ge
SDH Trendline
Better
Figure 7.1-10 – Readmission Rates
0%
5%
10%
15%
20%
25%
2008 2009 2010 2011 2012 2013 Jun. YTD
Perc
enta
ge
Inpatient Inpatient >64Truven Analytics Top Decile
Better
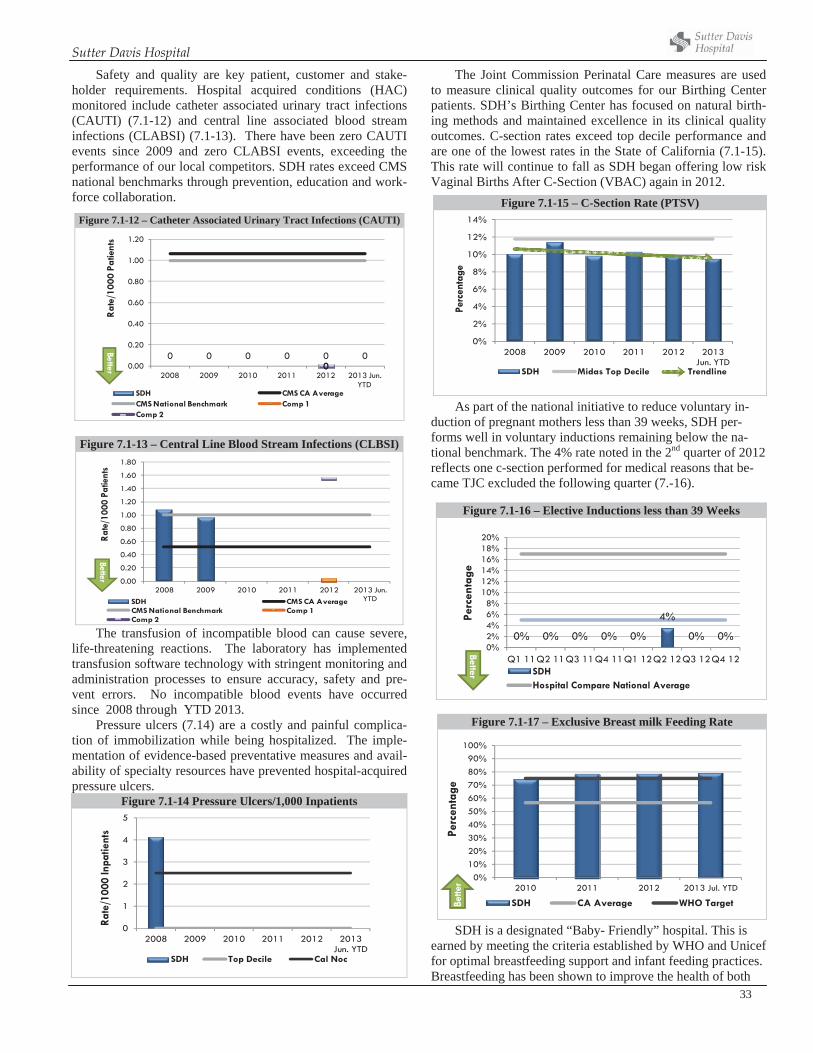
Sutter Davis Hospital
33
Safety and quality are key patient, customer and stake-holder requirements. Hospital acquired conditions (HAC) monitored include catheter associated urinary tract infections (CAUTI) (7.1-12) and central line associated blood stream infections (CLABSI) (7.1-13). There have been zero CAUTI events since 2009 and zero CLABSI events, exceeding the performance of our local competitors. SDH rates exceed CMS national benchmarks through prevention, education and work-force collaboration.
Figure 7.1-13 – Central Line Blood Stream Infections (CLBSI)
0.00
0.20
0.40
0.60
0.80
1.00
1.20
1.40
1.60
1.80
2008 2009 2010 2011 2012 2013 Jun. YTD
Rate
/100
0 Pa
tient
s
SDH CMS CA AverageCMS National Benchmark Comp 1Comp 2
Better
The transfusion of incompatible blood can cause severe, life-threatening reactions. The laboratory has implemented transfusion software technology with stringent monitoring and administration processes to ensure accuracy, safety and pre-vent errors. No incompatible blood events have occurred since 2008 through YTD 2013.
Pressure ulcers (7.14) are a costly and painful complica-tion of immobilization while being hospitalized. The imple-mentation of evidence-based preventative measures and avail-ability of specialty resources have prevented hospital-acquired pressure ulcers.
Figure 7.1-14 Pressure Ulcers/1,000 Inpatients
0
1
2
3
4
5
2008 2009 2010 2011 2012 2013 Jun. YTD
Rate
/100
0 In
patie
nts
SDH Top Decile Cal Noc
The Joint Commission Perinatal Care measures are used to measure clinical quality outcomes for our Birthing Center patients. SDH’s Birthing Center has focused on natural birth-ing methods and maintained excellence in its clinical quality outcomes. C-section rates exceed top decile performance and are one of the lowest rates in the State of California (7.1-15). This rate will continue to fall as SDH began offering low risk Vaginal Births After C-Section (VBAC) again in 2012.
As part of the national initiative to reduce voluntary in-duction of pregnant mothers less than 39 weeks, SDH per-forms well in voluntary inductions remaining below the na-tional benchmark. The 4% rate noted in the 2nd quarter of 2012 reflects one c-section performed for medical reasons that be-came TJC excluded the following quarter (7.-16).
SDH is a designated “Baby- Friendly” hospital. This is earned by meeting the criteria established by WHO and Unicef for optimal breastfeeding support and infant feeding practices. Breastfeeding has been shown to improve the health of both
Figure 7.1-12 – Catheter Associated Urinary Tract Infections (CAUTI)
0 0 0 0 0 0000.00
0.20
0.40
0.60
0.80
1.00
1.20
2008 2009 2010 2011 2012 2013 Jun. YTD
Rat
e/10
00 P
atie
nts
SDH CMS CA AverageCMS National Benchmark Comp 1Comp 2
Better
Figure 7.1-17 – Exclusive Breast milk Feeding Rate
0%10%20%30%40%50%60%70%80%90%
100%
2010 2011 2012 2013 Jul. YTD
Perc
enta
ge
SDH CA Average WHO TargetBette
r
Figure 7.1-15 – C-Section Rate (PTSV)
0%
2%
4%
6%
8%
10%
12%
14%
2008 2009 2010 2011 2012 2013 Jun. YTD
Perc
enta
ge
SDH Midas Top Decile Trendline
Figure 7.1-16 – Elective Inductions less than 39 Weeks
0% 0% 0% 0% 0%
4%
0% 0%0%2%4%6%8%
10%12%14%16%18%20%
Q1 11Q2 11Q3 11Q4 11Q1 12Q2 12Q3 12Q4 12
Perc
enta
ge
SDHHospital Compare National Average
Better
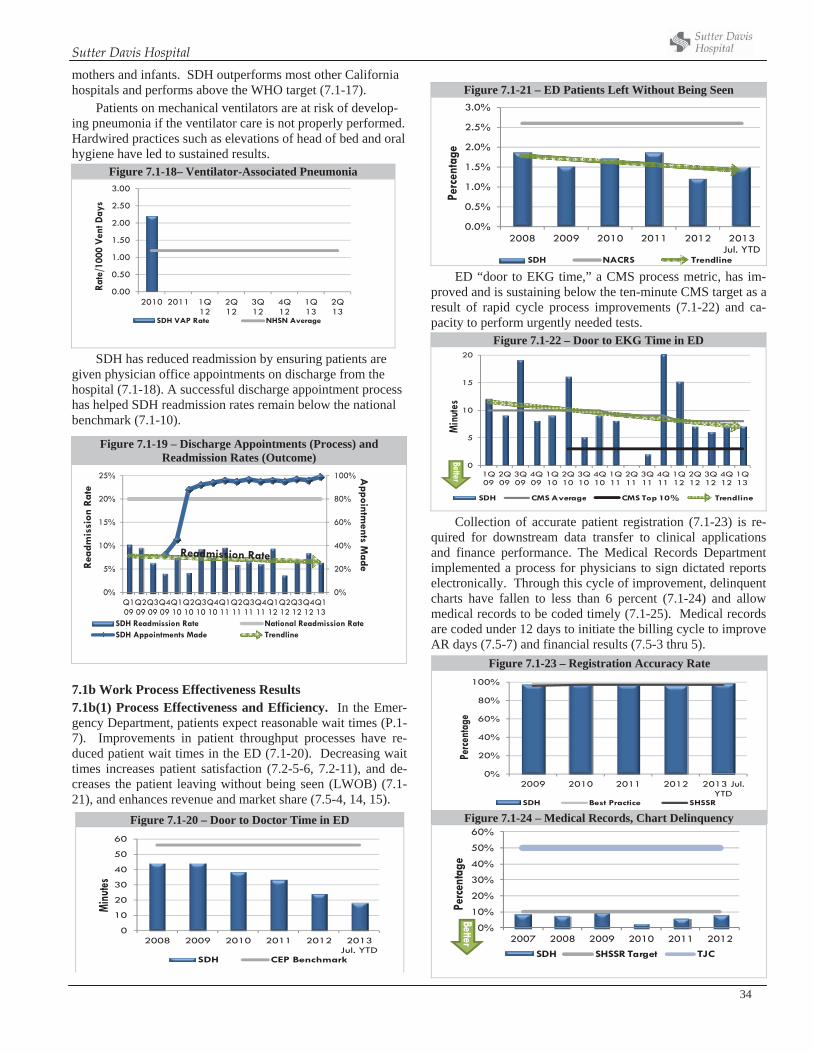
Sutter Davis Hospital
34
Figure 7.1-20 – Door to Doctor Time in ED
0
10
20
30
40
50
60
2008 2009 2010 2011 2012 2013 Jul. YTD
Min
utes
SDH CEP Benchmark
mothers and infants. SDH outperforms most other California hospitals and performs above the WHO target (7.1-17).
Patients on mechanical ventilators are at risk of develop-ing pneumonia if the ventilator care is not properly performed. Hardwired practices such as elevations of head of bed and oral hygiene have led to sustained results.
Figure 7.1-18– Ventilator-Associated Pneumonia
0.00
0.50
1.00
1.50
2.00
2.50
3.00
2010 2011 1Q 12
2Q 12
3Q 12
4Q 12
1Q 13
2Q 13
Rate
/100
0 Ve
nt D
ays
SDH VAP Rate NHSN Average
SDH has reduced readmission by ensuring patients are given physician office appointments on discharge from the hospital (7.1-18). A successful discharge appointment process has helped SDH readmission rates remain below the national benchmark (7.1-10).
7.1b Work Process Effectiveness Results 7.1b(1) Process Effectiveness and Efficiency. In the Emer-gency Department, patients expect reasonable wait times (P.1-7). Improvements in patient throughput processes have re-duced patient wait times in the ED (7.1-20). Decreasing wait times increases patient satisfaction (7.2-5-6, 7.2-11), and de-creases the patient leaving without being seen (LWOB) (7.1-21), and enhances revenue and market share (7.5-4, 14, 15).
Figure 7.1-21 – ED Patients Left Without Being Seen
0.0%
0.5%
1.0%
1.5%
2.0%
2.5%
3.0%
2008 2009 2010 2011 2012 2013 Jul. YTD
Perc
enta
ge
SDH NACRS Trendline
ED “door to EKG time,” a CMS process metric, has im-proved and is sustaining below the ten-minute CMS target as a result of rapid cycle process improvements (7.1-22) and ca-pacity to perform urgently needed tests.
Figure 7.1-22 – Door to EKG Time in ED
0
5
10
15
20
1Q 09
2Q 09
3Q 09
4Q 09
1Q 10
2Q 10
3Q 10
4Q 10
1Q 11
2Q 11
3Q 11
4Q 11
1Q 12
2Q 12
3Q 12
4Q 12
1Q 13
Min
utes
SDH CMS Average CMS Top 10% Trendline
Better
Collection of accurate patient registration (7.1-23) is re-quired for downstream data transfer to clinical applications and finance performance. The Medical Records Department implemented a process for physicians to sign dictated reports electronically. Through this cycle of improvement, delinquent charts have fallen to less than 6 percent (7.1-24) and allow medical records to be coded timely (7.1-25). Medical records are coded under 12 days to initiate the billing cycle to improve AR days (7.5-7) and financial results (7.5-3 thru 5).
Figure 7.1-19 – Discharge Appointments (Process) and Readmission Rates (Outcome)
0%
20%
40%
60%
80%
100%
0%
5%
10%
15%
20%
25%
Q1 09
Q2 09
Q3 09
Q4 09
Q1 10
Q2 10
Q3 10
Q4 10
Q1 11
Q2 11
Q3 11
Q4 11
Q1 12
Q2 12
Q3 12
Q4 12
Q1 13
Appointm
ents MadeR
eadm
issi
on R
ate
SDH Readmission Rate National Readmission RateSDH Appointments Made Trendline
Figure 7.1-23 – Registration Accuracy Rate
0%
20%
40%
60%
80%
100%
2009 2010 2011 2012 2013 Jul. YTD
Perce
ntag
e
SDH Best Practice SHSSR
Figure 7.1-24 – Medical Records, Chart Delinquency
0%
10%
20%
30%
40%
50%
60%
2007 2008 2009 2010 2011 2012
Perc
enta
ge
SDH SHSSR Target TJC
Better
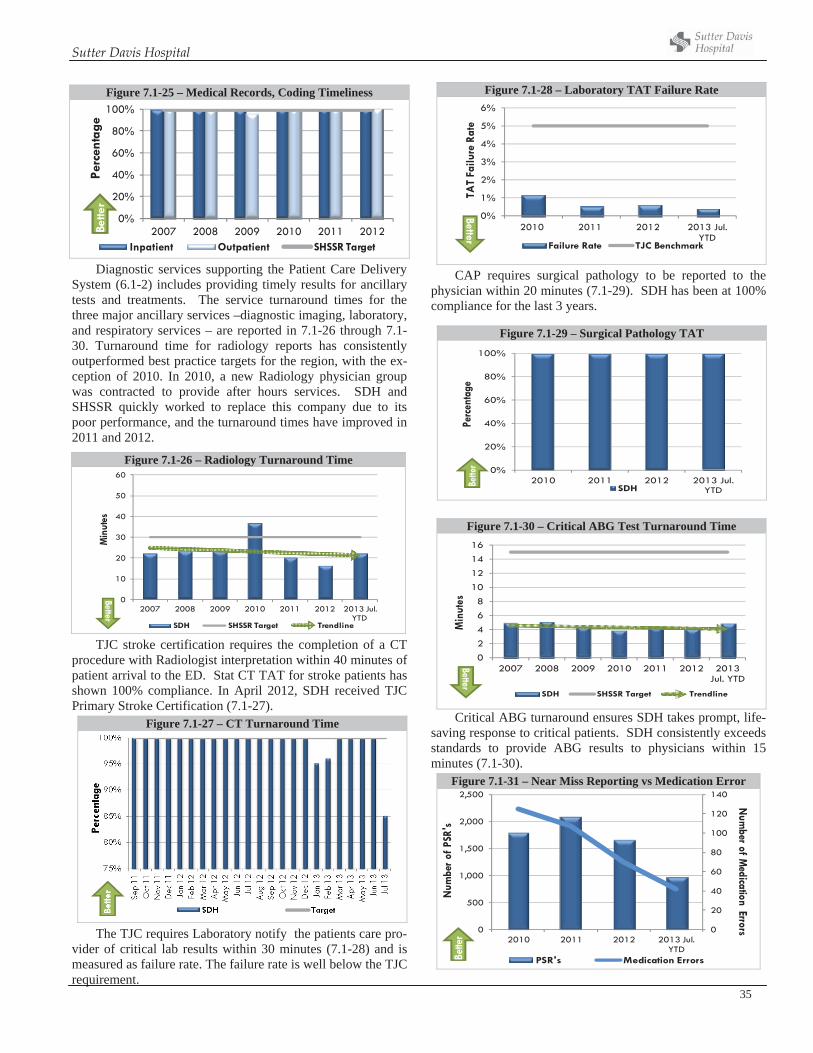
Sutter Davis Hospital
35
Figure 7.1-25 – Medical Records, Coding Timeliness
0%
20%
40%
60%
80%
100%
2007 2008 2009 2010 2011 2012
Perc
enta
ge
Inpatient Outpatient SHSSR Target
Bette
r
Diagnostic services supporting the Patient Care Delivery System (6.1-2) includes providing timely results for ancillary tests and treatments. The service turnaround times for the three major ancillary services –diagnostic imaging, laboratory, and respiratory services – are reported in 7.1-26 through 7.1-30. Turnaround time for radiology reports has consistently outperformed best practice targets for the region, with the ex-ception of 2010. In 2010, a new Radiology physician group was contracted to provide after hours services. SDH and SHSSR quickly worked to replace this company due to its poor performance, and the turnaround times have improved in 2011 and 2012.
TJC stroke certification requires the completion of a CT procedure with Radiologist interpretation within 40 minutes of patient arrival to the ED. Stat CT TAT for stroke patients has shown 100% compliance. In April 2012, SDH received TJC Primary Stroke Certification (7.1-27).
Figure 7.1-27 – CT Turnaround Time
The TJC requires Laboratory notify the patients care pro-vider of critical lab results within 30 minutes (7.1-28) and is measured as failure rate. The failure rate is well below the TJC requirement.
Figure 7.1-28 – Laboratory TAT Failure Rate
0%
1%
2%
3%
4%
5%
6%
2010 2011 2012 2013 Jul. YTD
TAT
Failu
re R
ate
Failure Rate TJC Benchmark
Better
CAP requires surgical pathology to be reported to the physician within 20 minutes (7.1-29). SDH has been at 100% compliance for the last 3 years.
Figure 7.1-30 – Critical ABG Test Turnaround Time
02468
10121416
2007 2008 2009 2010 2011 2012 2013 Jul. YTD
Min
utes
SDH SHSSR Target Trendline
Better
Critical ABG turnaround ensures SDH takes prompt, life-saving response to critical patients. SDH consistently exceeds standards to provide ABG results to physicians within 15 minutes (7.1-30).
Figure 7.1-31 – Near Miss Reporting vs Medication Error
0
20
40
60
80
100
120
140
0
500
1,000
1,500
2,000
2,500
2010 2011 2012 2013 Jul. YTD
Num
ber of Medication Errors
Num
ber o
f PSR
's
PSR's Medication ErrorsBette
rFigure 7.1-26 – Radiology Turnaround Time
0
10
20
30
40
50
60
2007 2008 2009 2010 2011 2012 2013 Jul. YTD
Min
utes
SDH SHSSR Target Trendline
Better
Figure 7.1-29 – Surgical Pathology TAT
0%
20%
40%
60%
80%
100%
2010 2011 2012 2013 Jul. YTD
Perc
enta
ge
SDHBette
r
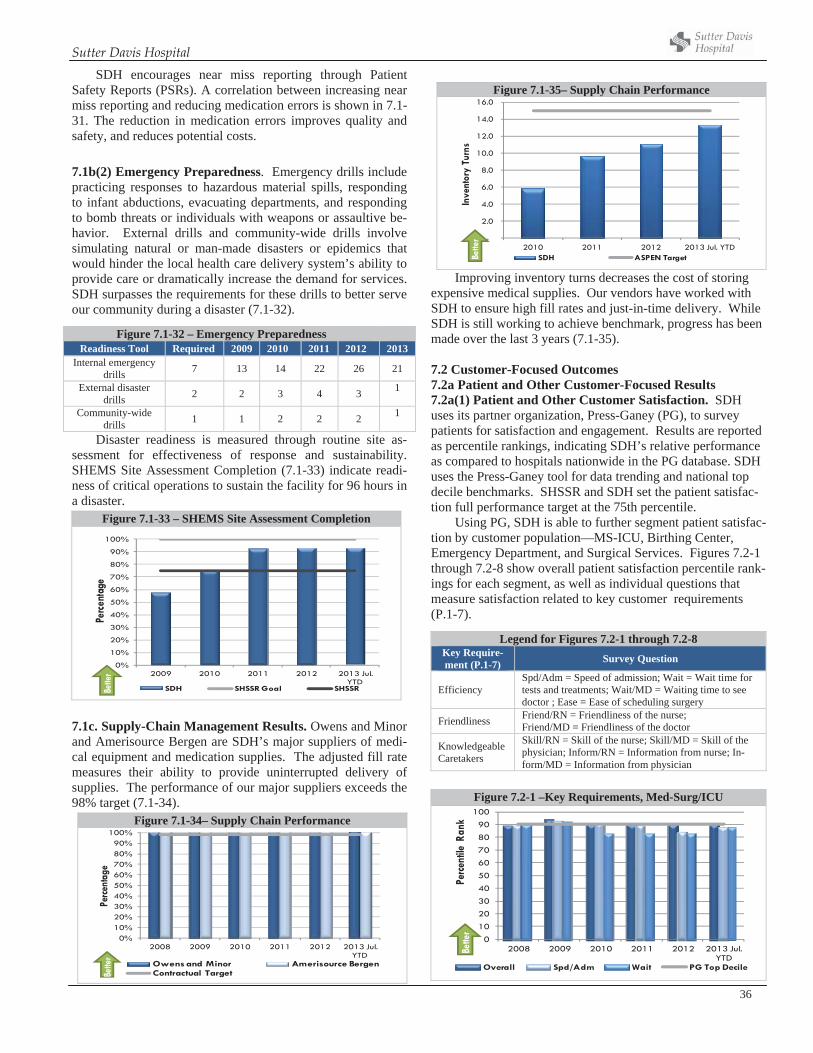
Sutter Davis Hospital
36
SDH encourages near miss reporting through Patient Safety Reports (PSRs). A correlation between increasing near miss reporting and reducing medication errors is shown in 7.1-31. The reduction in medication errors improves quality and safety, and reduces potential costs.
7.1b(2) Emergency Preparedness. Emergency drills include practicing responses to hazardous material spills, responding to infant abductions, evacuating departments, and responding to bomb threats or individuals with weapons or assaultive be-havior. External drills and community-wide drills involve simulating natural or man-made disasters or epidemics that would hinder the local health care delivery system’s ability to provide care or dramatically increase the demand for services. SDH surpasses the requirements for these drills to better serve our community during a disaster (7.1-32).
Disaster readiness is measured through routine site as-sessment for effectiveness of response and sustainability. SHEMS Site Assessment Completion (7.1-33) indicate readi-ness of critical operations to sustain the facility for 96 hours in a disaster.
Figure 7.1-33 – SHEMS Site Assessment Completion
0%
10%
20%
30%
40%
50%
60%
70%
80%
90%
100%
2009 2010 2011 2012 2013 Jul. YTD
Perce
ntag
e
SDH SHSSR Goal SHSSRBette
r
7.1c. Supply-Chain Management Results. Owens and Minor and Amerisource Bergen are SDH’s major suppliers of medi-cal equipment and medication supplies. The adjusted fill rate measures their ability to provide uninterrupted delivery of supplies. The performance of our major suppliers exceeds the 98% target (7.1-34).
Figure 7.1-34– Supply Chain Performance
0%10%20%30%40%50%60%70%80%90%
100%
2008 2009 2010 2011 2012 2013 Jul. YTD
Perce
ntag
e
Owens and Minor Amerisource BergenContractual TargetBe
tter
Figure 7.1-35– Supply Chain Performance
-
2.0
4.0
6.0
8.0
10.0
12.0
14.0
16.0
2010 2011 2012 2013 Jul. YTD
Inve
ntor
y Tu
rns
SDH ASPEN TargetBette
r
Improving inventory turns decreases the cost of storing expensive medical supplies. Our vendors have worked with SDH to ensure high fill rates and just-in-time delivery. While SDH is still working to achieve benchmark, progress has been made over the last 3 years (7.1-35).
7.2 Customer-Focused Outcomes 7.2a Patient and Other Customer-Focused Results 7.2a(1) Patient and Other Customer Satisfaction. SDH uses its partner organization, Press-Ganey (PG), to survey patients for satisfaction and engagement. Results are reported as percentile rankings, indicating SDH’s relative performance as compared to hospitals nationwide in the PG database. SDH uses the Press-Ganey tool for data trending and national top decile benchmarks. SHSSR and SDH set the patient satisfac-tion full performance target at the 75th percentile.
Using PG, SDH is able to further segment patient satisfac-tion by customer population—MS-ICU, Birthing Center, Emergency Department, and Surgical Services. Figures 7.2-1 through 7.2-8 show overall patient satisfaction percentile rank-ings for each segment, as well as individual questions that measure satisfaction related to key customer requirements (P.1-7).
Figure 7.2-1 –Key Requirements, Med-Surg/ICU
0
10
2030
40
50
6070
80
90100
2008 2009 2010 2011 2012 2013 Jul. YTD
Perce
ntile
Ran
k
Overall Spd/Adm Wait PG Top Decile
Bette
r
Figure 7.1-32 – Emergency Preparedness Readiness Tool Required 2009 2010 2011 2012 2013
Internal emergency drills 7 13 14 22 26 21
External disaster drills 2 2 3 4 3 1
Community-wide drills 1 1 2 2 2 1
Legend for Figures 7.2-1 through 7.2-8 Key Require-ment (P.1-7) Survey Question
Efficiency Spd/Adm = Speed of admission; Wait = Wait time for tests and treatments; Wait/MD = Waiting time to see doctor ; Ease = Ease of scheduling surgery
Friendliness Friend/RN = Friendliness of the nurse; Friend/MD = Friendliness of the doctor
KnowledgeableCaretakers
Skill/RN = Skill of the nurse; Skill/MD = Skill of the physician; Inform/RN = Information from nurse; In-form/MD = Information from physician
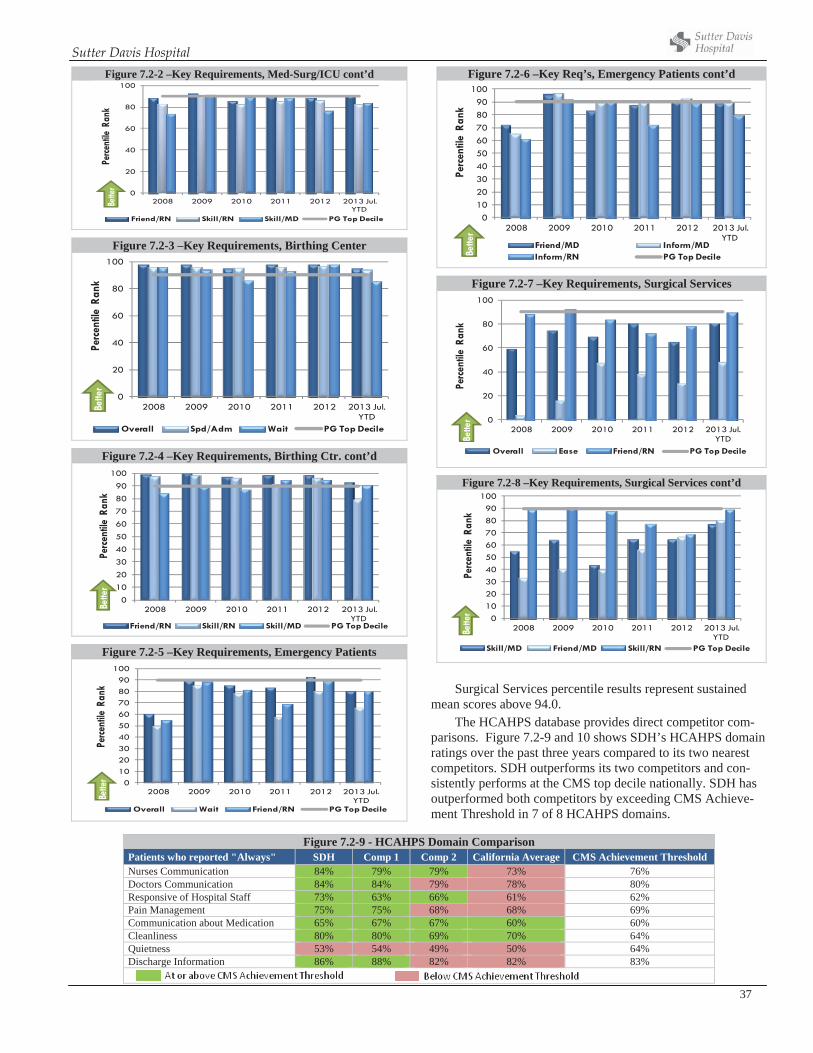
Sutter Davis Hospital
37
Figure 7.2-2 –Key Requirements, Med-Surg/ICU cont’d
0
20
40
60
80
100
2008 2009 2010 2011 2012 2013 Jul. YTD
Perce
ntile
Ran
k
Friend/RN Skill/RN Skill/MD PG Top Decile
Bette
r
Figure 7.2-3 –Key Requirements, Birthing Center
0
20
40
60
80
100
2008 2009 2010 2011 2012 2013 Jul. YTD
Perc
entil
e Ra
nk
Overall Spd/Adm Wait PG Top Decile
Bette
r
Figure 7.2-4 –Key Requirements, Birthing Ctr. cont’d
0102030405060708090
100
2008 2009 2010 2011 2012 2013 Jul. YTD
Perc
entil
e Ra
nk
Friend/RN Skill/RN Skill/MD PG Top Decile
Bette
r
Figure 7.2-5 –Key Requirements, Emergency Patients
0102030405060708090
100
2008 2009 2010 2011 2012 2013 Jul. YTD
Perce
ntile
Ran
k
Overall Wait Friend/RN PG Top Decile
Bette
r
Figure 7.2-6 –Key Req’s, Emergency Patients cont’d
0102030405060708090
100
2008 2009 2010 2011 2012 2013 Jul. YTD
Perc
entil
e Ra
nk
Friend/MD Inform/MDInform/RN PG Top DecileBe
tter
Figure 7.2-7 –Key Requirements, Surgical Services
0
20
40
60
80
100
2008 2009 2010 2011 2012 2013 Jul. YTD
Perc
entil
e Ra
nkOverall Ease Friend/RN PG Top Decile
Bette
r
Figure 7.2-8 –Key Requirements, Surgical Services cont’d
0102030405060708090
100
2008 2009 2010 2011 2012 2013 Jul. YTD
Perc
entil
e Ra
nk
Skill/MD Friend/MD Skill/RN PG Top Decile
Bette
r
Surgical Services percentile results represent sustained mean scores above 94.0.
The HCAHPS database provides direct competitor com-parisons. Figure 7.2-9 and 10 shows SDH’s HCAHPS domain ratings over the past three years compared to its two nearest competitors. SDH outperforms its two competitors and con-sistently performs at the CMS top decile nationally. SDH has outperformed both competitors by exceeding CMS Achieve-ment Threshold in 7 of 8 HCAHPS domains.
Figure 7.2-9 - HCAHPS Domain Comparison Patients who reported "Always" SDH Comp 1 Comp 2 California Average CMS Achievement Threshold Nurses Communication 84% 79% 79% 73% 76% Doctors Communication 84% 84% 79% 78% 80% Responsive of Hospital Staff 73% 63% 66% 61% 62% Pain Management 75% 75% 68% 68% 69% Communication about Medication 65% 67% 67% 60% 60% Cleanliness 80% 80% 69% 70% 64% Quietness 53% 54% 49% 50% 64% Discharge Information 86% 88% 82% 82% 83%
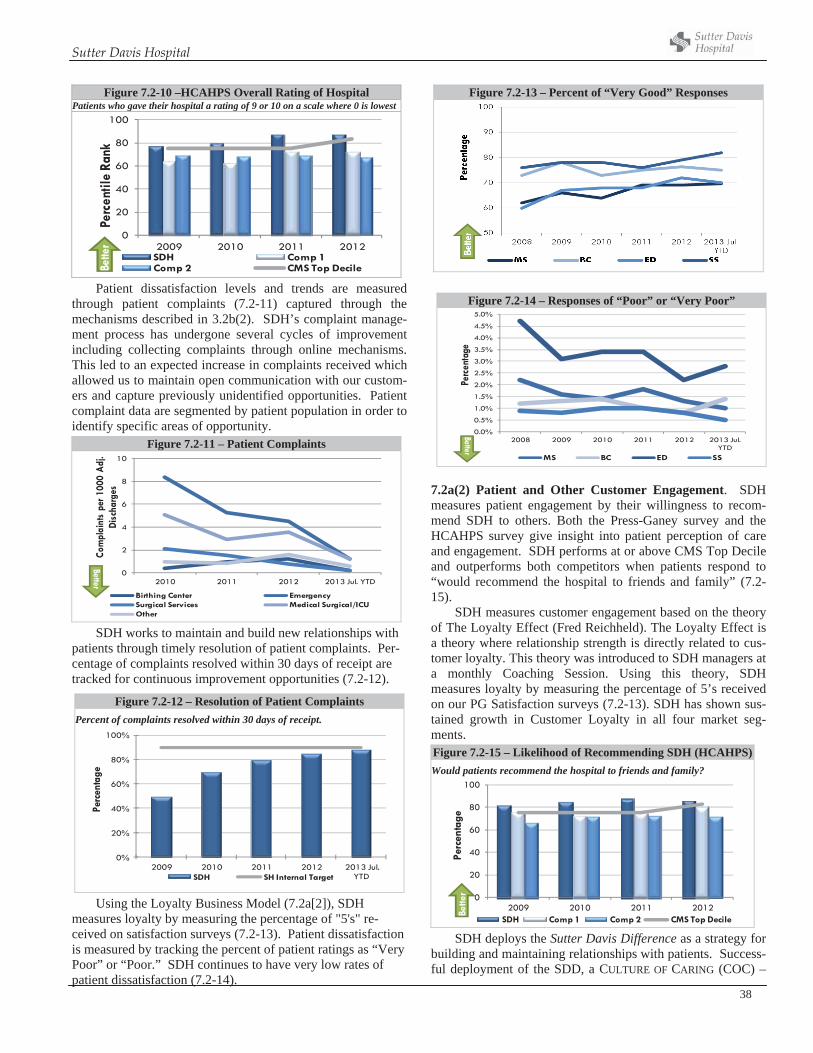
Sutter Davis Hospital
38
Figure 7.2-10 –HCAHPS Overall Rating of Hospital Patients who gave their hospital a rating of 9 or 10 on a scale where 0 is lowest
0
20
40
60
80
100
2009 2010 2011 2012
Perc
entil
e Ra
nk
SDH Comp 1Comp 2 CMS Top DecileBe
tter
Patient dissatisfaction levels and trends are measured through patient complaints (7.2-11) captured through the mechanisms described in 3.2b(2). SDH’s complaint manage-ment process has undergone several cycles of improvement including collecting complaints through online mechanisms. This led to an expected increase in complaints received which allowed us to maintain open communication with our custom-ers and capture previously unidentified opportunities. Patient complaint data are segmented by patient population in order to identify specific areas of opportunity.
Figure 7.2-11 – Patient Complaints
0
2
4
6
8
10
2010 2011 2012 2013 Jul. YTD
Com
plai
nts
per 1
000
Adj
. Di
scha
rges
Birthing Center Emergency Surgical Services Medical Surgical/ICUOther
Better
SDH works to maintain and build new relationships with patients through timely resolution of patient complaints. Per-centage of complaints resolved within 30 days of receipt are tracked for continuous improvement opportunities (7.2-12).
Using the Loyalty Business Model (7.2a[2]), SDH measures loyalty by measuring the percentage of "5's" re-ceived on satisfaction surveys (7.2-13). Patient dissatisfaction is measured by tracking the percent of patient ratings as “Very Poor” or “Poor.” SDH continues to have very low rates of patient dissatisfaction (7.2-14).
Figure 7.2-13 – Percent of “Very Good” Responses
Figure 7.2-14 – Responses of “Poor” or “Very Poor”
0.0%
0.5%
1.0%
1.5%
2.0%
2.5%
3.0%
3.5%
4.0%
4.5%
5.0%
2008 2009 2010 2011 2012 2013 Jul. YTD
Perc
enta
geMS BC ED SS
Better
7.2a(2) Patient and Other Customer Engagement. SDH measures patient engagement by their willingness to recom-mend SDH to others. Both the Press-Ganey survey and the HCAHPS survey give insight into patient perception of care and engagement. SDH performs at or above CMS Top Decile and outperforms both competitors when patients respond to “would recommend the hospital to friends and family” (7.2-15).
SDH measures customer engagement based on the theory of The Loyalty Effect (Fred Reichheld). The Loyalty Effect is a theory where relationship strength is directly related to cus-tomer loyalty. This theory was introduced to SDH managers at a monthly Coaching Session. Using this theory, SDH measures loyalty by measuring the percentage of 5’s received on our PG Satisfaction surveys (7.2-13). SDH has shown sus-tained growth in Customer Loyalty in all four market seg-ments. Figure 7.2-15 – Likelihood of Recommending SDH (HCAHPS)Would patients recommend the hospital to friends and family?
0
20
40
60
80
100
2009 2010 2011 2012
Perc
enta
ge
SDH Comp 1 Comp 2 CMS Top Decile
Bette
r
SDH deploys the Sutter Davis Difference as a strategy for building and maintaining relationships with patients. Success-ful deployment of the SDD, a CULTURE OF CARING (COC) –
Figure 7.2-12 – Resolution of Patient Complaints Percent of complaints resolved within 30 days of receipt.
0%
20%
40%
60%
80%
100%
2009 2010 2011 2012 2013 Jul. YTD
Perc
enta
ge
SDH SH Internal Target
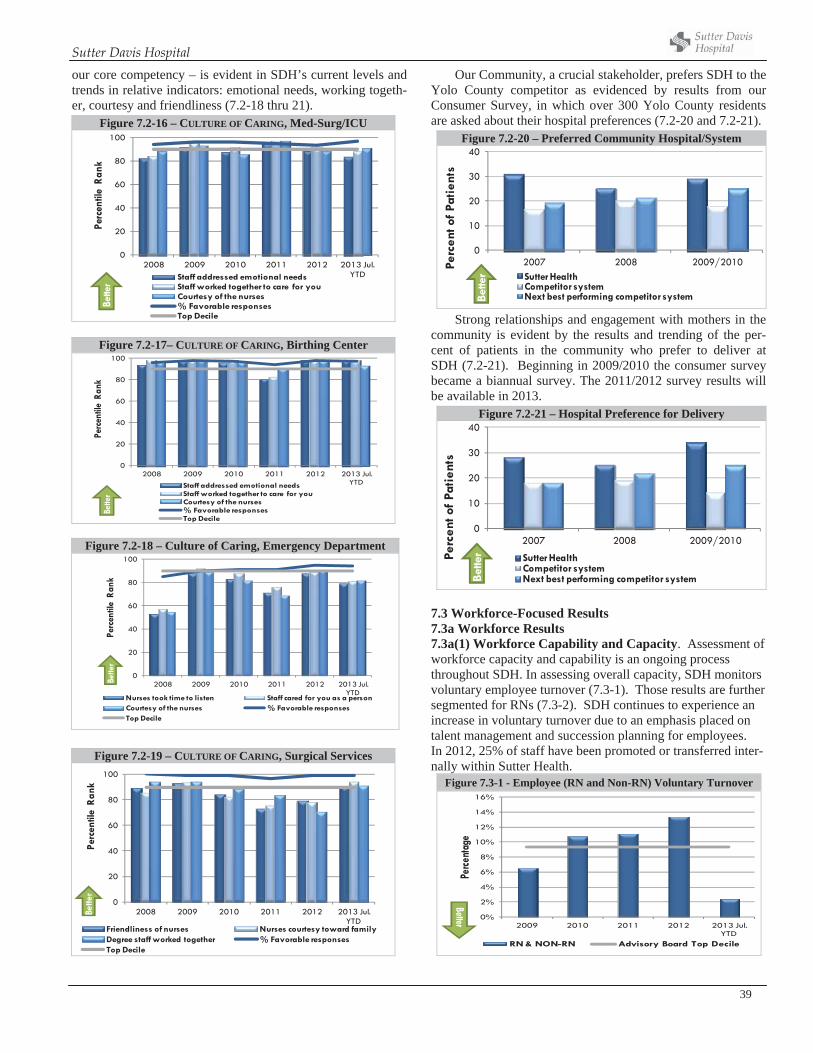
Sutter Davis Hospital
39
our core competency – is evident in SDH’s current levels and trends in relative indicators: emotional needs, working togeth-er, courtesy and friendliness (7.2-18 thru 21).
Figure 7.2-16 – CULTURE OF CARING, Med-Surg/ICU
0
20
40
60
80
100
2008 2009 2010 2011 2012 2013 Jul. YTD
Perc
entil
e Ra
nk
Staff addressed emotional needsStaff worked together to care for youCourtesy of the nurses% Favorable responsesTop Decile
Bette
r
Figure 7.2-17– CULTURE OF CARING, Birthing Center
0
20
40
60
80
100
2008 2009 2010 2011 2012 2013 Jul. YTD
Perc
entil
e Ra
nk
Staff addressed emotional needsStaff worked together to care for youCourtesy of the nurses% Favorable responsesTop Decile
Bette
r
Our Community, a crucial stakeholder, prefers SDH to the Yolo County competitor as evidenced by results from our Consumer Survey, in which over 300 Yolo County residents are asked about their hospital preferences (7.2-20 and 7.2-21).
Figure 7.2-20 – Preferred Community Hospital/System
0
10
20
30
40
2007 2008 2009/2010Perc
ent o
f Pa
tien
ts
Sutter HealthCompetitor systemNext best performing competitor systemBe
tter
Strong relationships and engagement with mothers in the community is evident by the results and trending of the per-cent of patients in the community who prefer to deliver at SDH (7.2-21). Beginning in 2009/2010 the consumer survey became a biannual survey. The 2011/2012 survey results will be available in 2013.
Figure 7.2-21 – Hospital Preference for Delivery
0
10
20
30
40
2007 2008 2009/2010
Perc
ent o
f Pa
tien
ts
Sutter HealthCompetitor systemNext best performing competitor systemBe
tter
7.3 Workforce-Focused Results 7.3a Workforce Results7.3a(1) Workforce Capability and Capacity. Assessment of workforce capacity and capability is an ongoing process throughout SDH. In assessing overall capacity, SDH monitors voluntary employee turnover (7.3-1). Those results are further segmented for RNs (7.3-2). SDH continues to experience an increase in voluntary turnover due to an emphasis placed on talent management and succession planning for employees. In 2012, 25% of staff have been promoted or transferred inter-nally within Sutter Health.
Figure 7.3-1 - Employee (RN and Non-RN) Voluntary Turnover
0%
2%
4%
6%
8%
10%
12%
14%
16%
2009 2010 2011 2012 2013 Jul. YTD
Perce
ntag
e
RN & NON-RN Advisory Board Top Decile
Better
Figure 7.2-18 – Culture of Caring, Emergency Department
0
20
40
60
80
100
2008 2009 2010 2011 2012 2013 Jul. YTD
Perc
entil
e Ra
nk
Nurses took time to listen Staff cared for you as a personCourtesy of the nurses % Favorable responsesTop Decile
Bette
r
Figure 7.2-19 – CULTURE OF CARING, Surgical Services
0
20
40
60
80
100
2008 2009 2010 2011 2012 2013 Jul. YTD
Perc
entil
e R
ank
Friendliness of nurses Nurses courtesy toward familyDegree staff worked together % Favorable responsesTop Decile
Bette
r
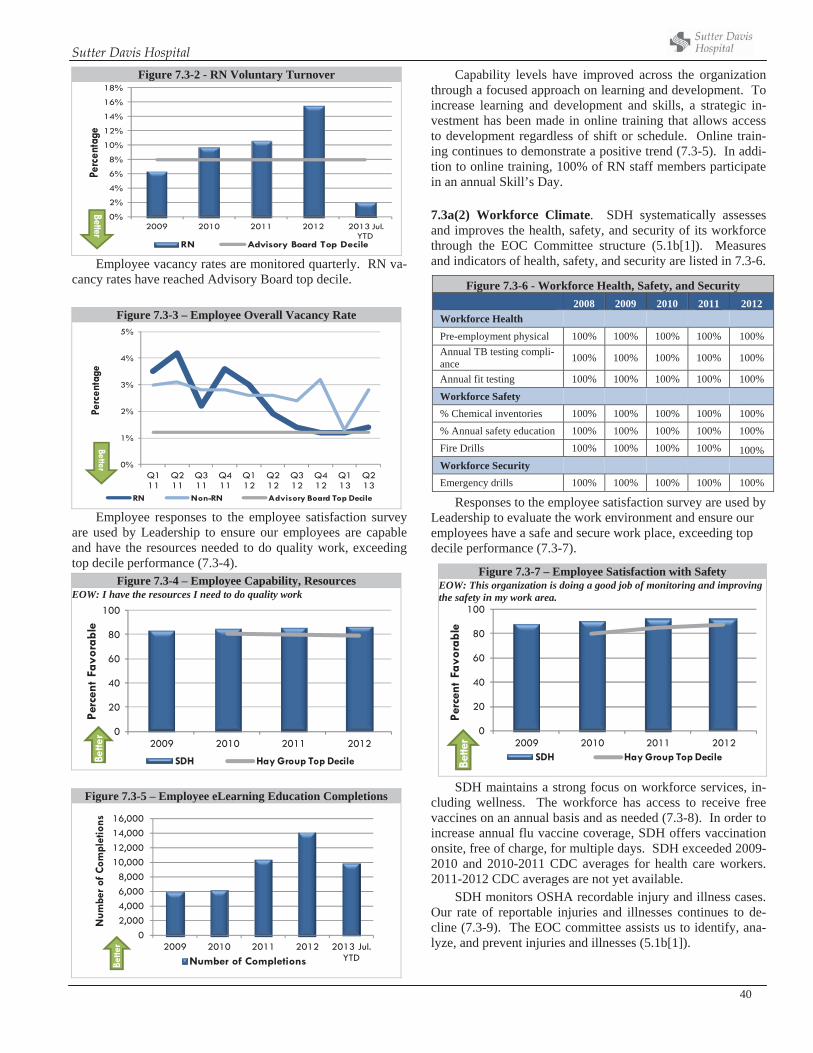
Sutter Davis Hospital
40
Employee vacancy rates are monitored quarterly. RN va-cancy rates have reached Advisory Board top decile.
Figure 7.3-3 – Employee Overall Vacancy Rate
0%
1%
2%
3%
4%
5%
Q1 11
Q2 11
Q3 11
Q4 11
Q1 12
Q2 12
Q3 12
Q4 12
Q1 13
Q2 13
Perc
enta
ge
RN Non-RN Advisory Board Top Decile
Better
Employee responses to the employee satisfaction survey are used by Leadership to ensure our employees are capable and have the resources needed to do quality work, exceeding top decile performance (7.3-4).
Figure 7.3-4 – Employee Capability, Resources EOW: I have the resources I need to do quality work
0
20
40
60
80
100
2009 2010 2011 2012
Perc
ent
Favo
rabl
e
SDH Hay Group Top DecileBette
r
Figure 7.3-5 – Employee eLearning Education Completions
02,0004,0006,0008,000
10,00012,00014,00016,000
2009 2010 2011 2012 2013 Jul. YTD
Num
ber o
f Com
plet
ions
Number of CompletionsBette
r
Capability levels have improved across the organization through a focused approach on learning and development. To increase learning and development and skills, a strategic in-vestment has been made in online training that allows access to development regardless of shift or schedule. Online train-ing continues to demonstrate a positive trend (7.3-5). In addi-tion to online training, 100% of RN staff members participate in an annual Skill’s Day.
7.3a(2) Workforce Climate. SDH systematically assesses and improves the health, safety, and security of its workforce through the EOC Committee structure (5.1b[1]). Measures and indicators of health, safety, and security are listed in 7.3-6.
Responses to the employee satisfaction survey are used by Leadership to evaluate the work environment and ensure our employees have a safe and secure work place, exceeding top decile performance (7.3-7).
SDH maintains a strong focus on workforce services, in-cluding wellness. The workforce has access to receive free vaccines on an annual basis and as needed (7.3-8). In order to increase annual flu vaccine coverage, SDH offers vaccination onsite, free of charge, for multiple days. SDH exceeded 2009-2010 and 2010-2011 CDC averages for health care workers. 2011-2012 CDC averages are not yet available.
SDH monitors OSHA recordable injury and illness cases. Our rate of reportable injuries and illnesses continues to de-cline (7.3-9). The EOC committee assists us to identify, ana-lyze, and prevent injuries and illnesses (5.1b[1]).
Figure 7.3-2 - RN Voluntary Turnover
0%
2%
4%
6%
8%
10%
12%
14%
16%
18%
2009 2010 2011 2012 2013 Jul. YTD
Perc
enta
ge
RN Advisory Board Top Decile
Better
Figure 7.3-6 - Workforce Health, Safety, and Security 2008 2009 2010 2011 2012
Workforce Health Pre-employment physical 100% 100% 100% 100% 100% Annual TB testing compli-ance 100% 100% 100% 100% 100%
Annual fit testing 100% 100% 100% 100% 100%
Workforce Safety % Chemical inventories 100% 100% 100% 100% 100% % Annual safety education 100% 100% 100% 100% 100% Fire Drills 100% 100% 100% 100% 100% Workforce Security Emergency drills 100% 100% 100% 100% 100%
Figure 7.3-7 – Employee Satisfaction with Safety EOW: This organization is doing a good job of monitoring and improving the safety in my work area.
0
20
40
60
80
100
2009 2010 2011 2012
Perc
ent
Favo
rabl
e
SDH Hay Group Top Decile
Bette
r
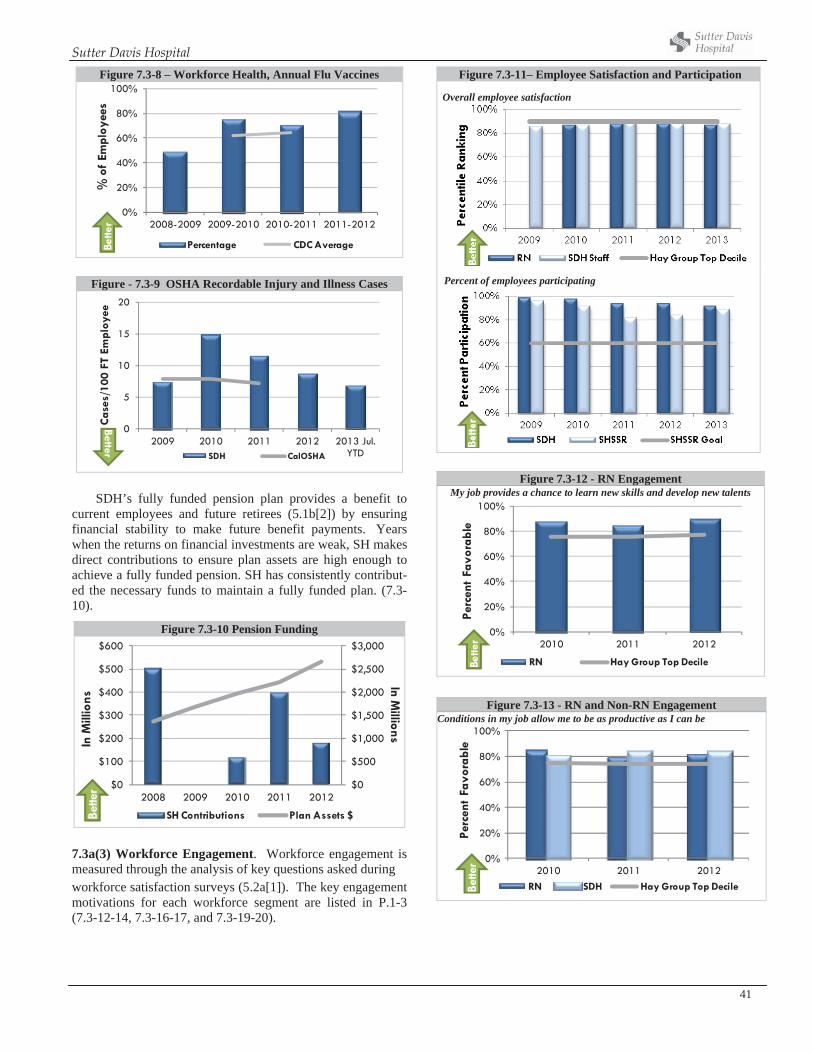
Sutter Davis Hospital
41
Figure 7.3-8 – Workforce Health, Annual Flu Vaccines
0%
20%
40%
60%
80%
100%
2008-2009 2009-2010 2010-2011 2011-2012
% o
f Em
ploy
ees
Percentage CDC AverageBette
r
SDH’s fully funded pension plan provides a benefit to current employees and future retirees (5.1b[2]) by ensuring financial stability to make future benefit payments. Years when the returns on financial investments are weak, SH makes direct contributions to ensure plan assets are high enough to achieve a fully funded pension. SH has consistently contribut-ed the necessary funds to maintain a fully funded plan. (7.3-10).
7.3a(3) Workforce Engagement. Workforce engagement is measured through the analysis of key questions asked during workforce satisfaction surveys (5.2a[1]). The key engagement motivations for each workforce segment are listed in P.1-3 (7.3-12-14, 7.3-16-17, and 7.3-19-20).
Figure 7.3-11– Employee Satisfaction and Participation
Overall employee satisfaction
Percent of employees participating
Figure 7.3-12 - RN Engagement My job provides a chance to learn new skills and develop new talents
0%
20%
40%
60%
80%
100%
2010 2011 2012
Perc
ent
Favo
rabl
e
RN Hay Group Top DecileBette
r
Figure 7.3-13 - RN and Non-RN Engagement Conditions in my job allow me to be as productive as I can be
0%
20%
40%
60%
80%
100%
2010 2011 2012
Perc
ent
Favo
rabl
e
RN SDH Hay Group Top DecileBette
r
Figure - 7.3-9 OSHA Recordable Injury and Illness Cases
0
5
10
15
20
2009 2010 2011 2012 2013 Jul. YTD
Cas
es/1
00 F
T Em
ploy
ee
SDH CalOSHA
Better
Figure 7.3-10 Pension Funding
$0
$500
$1,000
$1,500
$2,000
$2,500
$3,000
$0
$100
$200
$300
$400
$500
$600
2008 2009 2010 2011 2012
In Millions
In M
illio
ns
SH Contributions Plan Assets $Bette
r
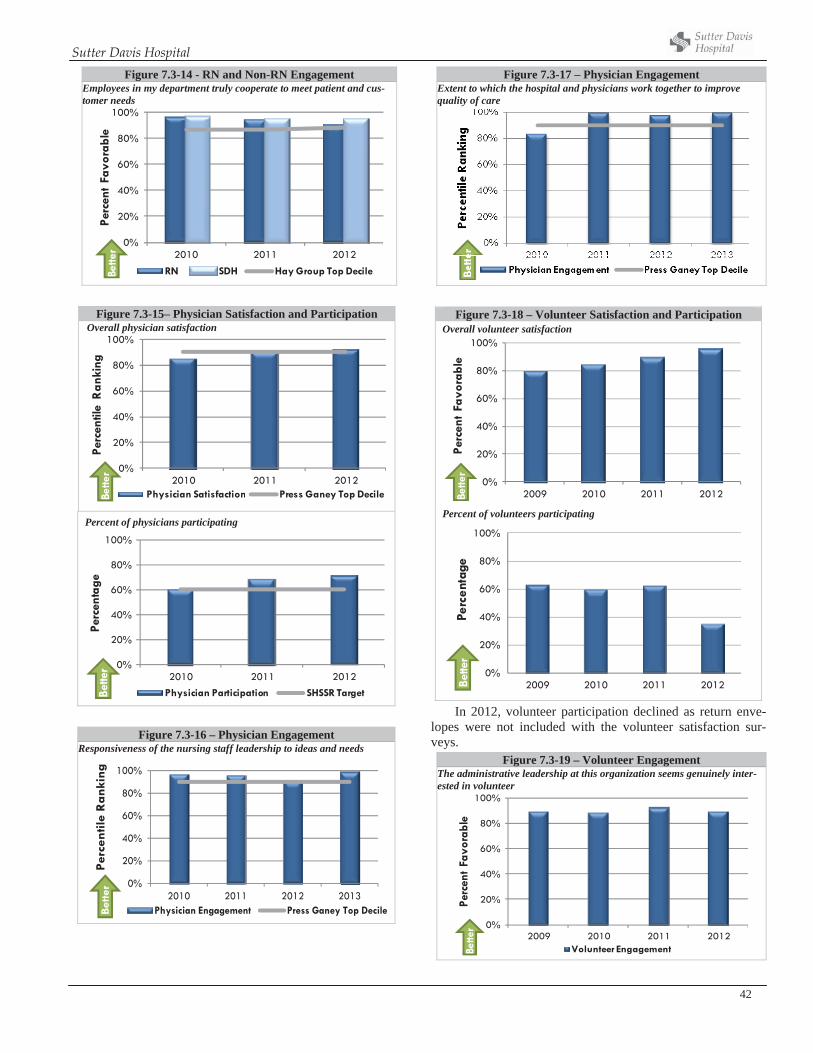
Sutter Davis Hospital
42
Figure 7.3-14 - RN and Non-RN Engagement Employees in my department truly cooperate to meet patient and cus-tomer needs
0%
20%
40%
60%
80%
100%
2010 2011 2012
Perc
ent
Favo
rabl
e
RN SDH Hay Group Top DecileBette
r
Figure 7.3-15– Physician Satisfaction and Participation Overall physician satisfaction
0%
20%
40%
60%
80%
100%
2010 2011 2012
Perc
entil
e R
anki
ng
Physician Satisfaction Press Ganey Top DecileBette
r
Percent of physicians participating
0%
20%
40%
60%
80%
100%
2010 2011 2012
Perc
enta
ge
Physician Participation SHSSR Target Bette
r
Figure 7.3-16 – Physician Engagement Responsiveness of the nursing staff leadership to ideas and needs
0%
20%
40%
60%
80%
100%
2010 2011 2012 2013
Per
cen
tile
Ran
kin
g
Physician Engagement Press Ganey Top DecileBet
ter
Figure 7.3-17 – Physician Engagement Extent to which the hospital and physicians work together to improve quality of care
Figure 7.3-18 – Volunteer Satisfaction and Participation Overall volunteer satisfaction
0%
20%
40%
60%
80%
100%
2009 2010 2011 2012
Perc
ent
Favo
rabl
eBe
tter
Percent of volunteers participating
0%
20%
40%
60%
80%
100%
2009 2010 2011 2012
Perc
enta
geBe
tter
In 2012, volunteer participation declined as return enve-lopes were not included with the volunteer satisfaction sur-veys.
Figure 7.3-19 – Volunteer Engagement The administrative leadership at this organization seems genuinely inter-ested in volunteer
0%
20%
40%
60%
80%
100%
2009 2010 2011 2012
Perc
ent
Favo
rabl
e
Volunteer Engagement Bette
r
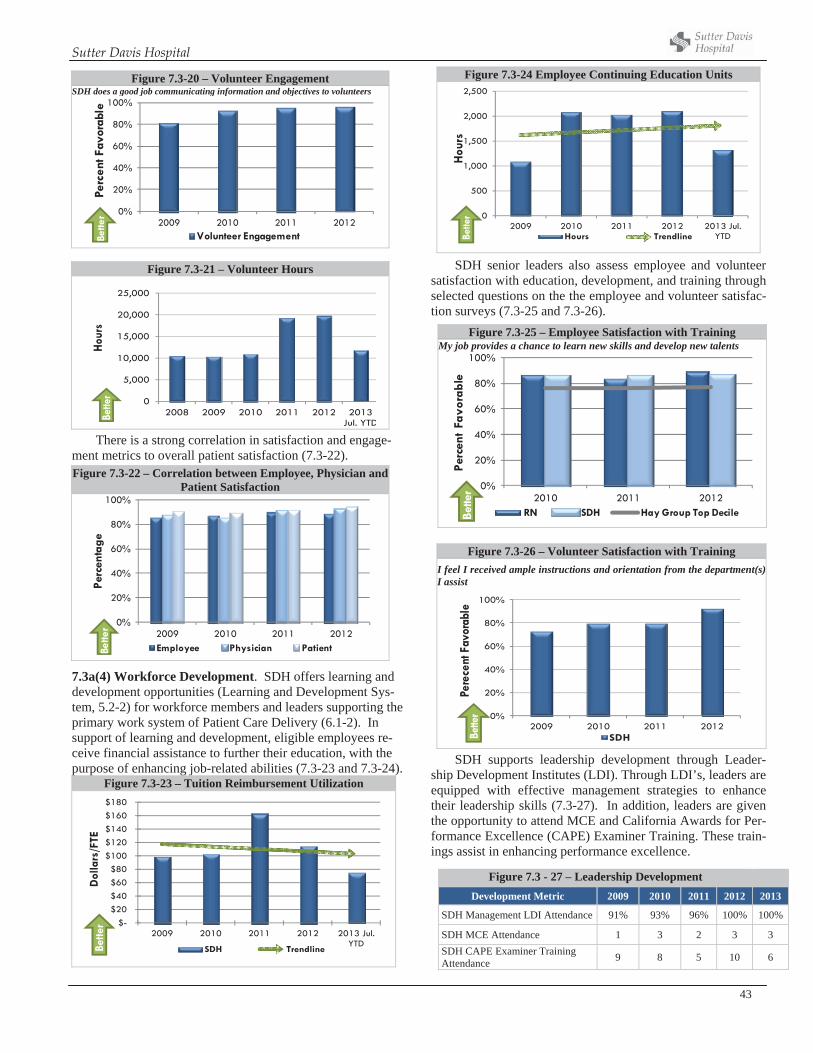
Sutter Davis Hospital
43
Figure 7.3-21 – Volunteer Hours
0
5,000
10,000
15,000
20,000
25,000
2008 2009 2010 2011 2012 2013 Jul. YTD
Hour
sBe
tter
There is a strong correlation in satisfaction and engage-ment metrics to overall patient satisfaction (7.3-22). Figure 7.3-22 – Correlation between Employee, Physician and
Patient Satisfaction
0%
20%
40%
60%
80%
100%
2009 2010 2011 2012
Perc
enta
ge
Employee Physician PatientBette
r
7.3a(4) Workforce Development. SDH offers learning and development opportunities (Learning and Development Sys-tem, 5.2-2) for workforce members and leaders supporting the primary work system of Patient Care Delivery (6.1-2). In support of learning and development, eligible employees re-ceive financial assistance to further their education, with the purpose of enhancing job-related abilities (7.3-23 and 7.3-24).
Figure 7.3-23 – Tuition Reimbursement Utilization
$-$20 $40 $60 $80
$100 $120 $140 $160 $180
2009 2010 2011 2012 2013 Jul. YTD
Dol
lars
/FTE
SDH TrendlineBette
r
Figure 7.3-24 Employee Continuing Education Units
0
500
1,000
1,500
2,000
2,500
2009 2010 2011 2012 2013 Jul. YTD
Hou
rs
Hours TrendlineBette
r
SDH senior leaders also assess employee and volunteer satisfaction with education, development, and training through selected questions on the the employee and volunteer satisfac-tion surveys (7.3-25 and 7.3-26).
Figure 7.3-26 – Volunteer Satisfaction with Training I feel I received ample instructions and orientation from the department(s) I assist
0%
20%
40%
60%
80%
100%
2009 2010 2011 2012
Pere
cent
Fav
orab
le
SDHBette
r
SDH supports leadership development through Leader-ship Development Institutes (LDI). Through LDI’s, leaders are equipped with effective management strategies to enhance their leadership skills (7.3-27). In addition, leaders are given the opportunity to attend MCE and California Awards for Per-formance Excellence (CAPE) Examiner Training. These train-ings assist in enhancing performance excellence.
Figure 7.3-20 – Volunteer Engagement SDH does a good job communicating information and objectives to volunteers
0%
20%
40%
60%
80%
100%
2009 2010 2011 2012
Perc
ent F
avor
able
Volunteer Engagement Bette
r
Figure 7.3-25 – Employee Satisfaction with Training My job provides a chance to learn new skills and develop new talents
0%
20%
40%
60%
80%
100%
2010 2011 2012
Perc
ent
Favo
rabl
e
RN SDH Hay Group Top DecileBette
r
Figure 7.3 - 27 – Leadership Development Development Metric 2009 2010 2011 2012 2013
SDH Management LDI Attendance 91% 93% 96% 100% 100%
SDH MCE Attendance 1 3 2 3 3 SDH CAPE Examiner Training Attendance 9 8 5 10 6
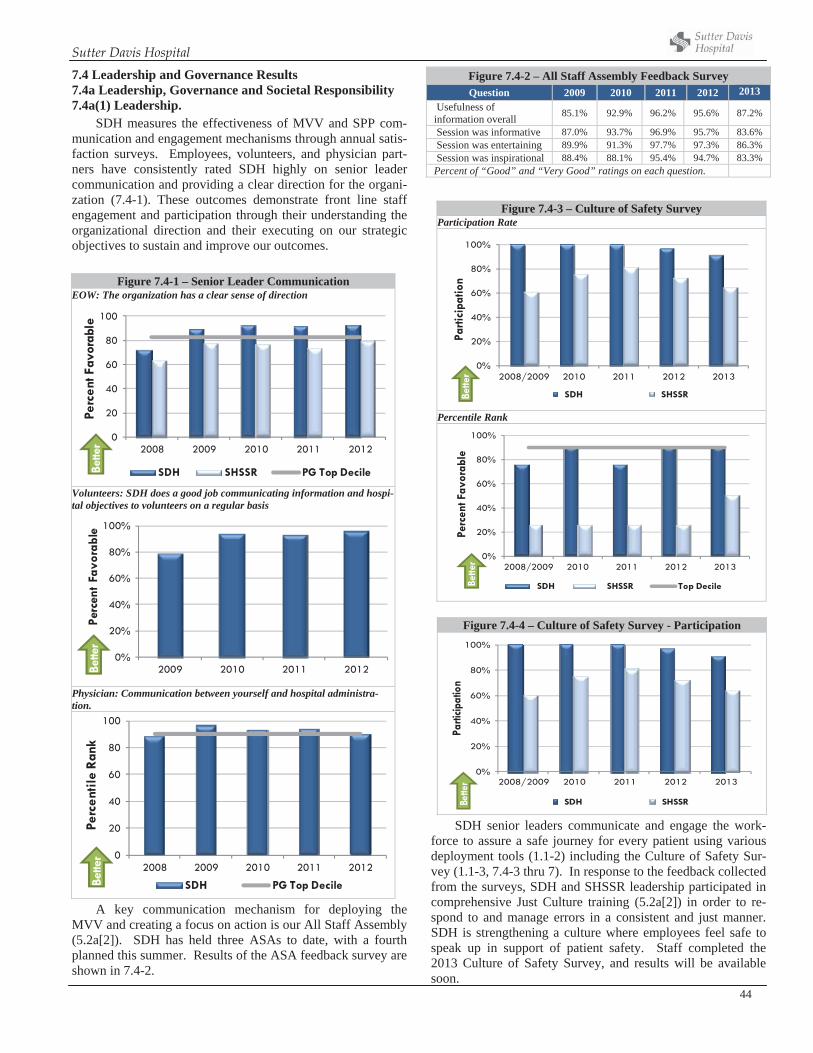
Sutter Davis Hospital
44
7.4 Leadership and Governance Results 7.4a Leadership, Governance and Societal Responsibility 7.4a(1) Leadership.
SDH measures the effectiveness of MVV and SPP com-munication and engagement mechanisms through annual satis-faction surveys. Employees, volunteers, and physician part-ners have consistently rated SDH highly on senior leader communication and providing a clear direction for the organi-zation (7.4-1). These outcomes demonstrate front line staff engagement and participation through their understanding the organizational direction and their executing on our strategic objectives to sustain and improve our outcomes.
Figure 7.4-1 – Senior Leader Communication EOW: The organization has a clear sense of direction
0
20
40
60
80
100
2008 2009 2010 2011 2012
Perc
ent F
avor
able
SDH SHSSR PG Top DecileBette
r
Volunteers: SDH does a good job communicating information and hospi-tal objectives to volunteers on a regular basis
0%
20%
40%
60%
80%
100%
2009 2010 2011 2012
Perc
ent
Favo
rabl
eBe
tter
Physician: Communication between yourself and hospital administra-tion.
0
20
40
60
80
100
2008 2009 2010 2011 2012
Perc
entil
e Ra
nk
SDH PG Top DecileBette
r
A key communication mechanism for deploying the MVV and creating a focus on action is our All Staff Assembly (5.2a[2]). SDH has held three ASAs to date, with a fourth planned this summer. Results of the ASA feedback survey are shown in 7.4-2.
Figure 7.4-2 – All Staff Assembly Feedback Survey Question 2009 2010 2011 2012 2013
Usefulness of information overall 85.1% 92.9% 96.2% 95.6% 87.2%
Session was informative 87.0% 93.7% 96.9% 95.7% 83.6% Session was entertaining 89.9% 91.3% 97.7% 97.3% 86.3% Session was inspirational 88.4% 88.1% 95.4% 94.7% 83.3% Percent of “Good” and “Very Good” ratings on each question.
Figure 7.4-3 – Culture of Safety Survey Participation Rate
0%
20%
40%
60%
80%
100%
2008/2009 2010 2011 2012 2013
Parti
cipa
tion
SDH SHSSRBette
r
Percentile Rank
0%
20%
40%
60%
80%
100%
2008/2009 2010 2011 2012 2013
Perc
ent F
avor
able
SDH SHSSR Top DecileBette
r
SDH senior leaders communicate and engage the work-force to assure a safe journey for every patient using various deployment tools (1.1-2) including the Culture of Safety Sur-vey (1.1-3, 7.4-3 thru 7). In response to the feedback collected from the surveys, SDH and SHSSR leadership participated in comprehensive Just Culture training (5.2a[2]) in order to re-spond to and manage errors in a consistent and just manner. SDH is strengthening a culture where employees feel safe to speak up in support of patient safety. Staff completed the 2013 Culture of Safety Survey, and results will be available soon.
Figure 7.4-4 – Culture of Safety Survey - Participation
0%
20%
40%
60%
80%
100%
2008/2009 2010 2011 2012 2013
Parti
cipat
ion
SDH SHSSRBette
r
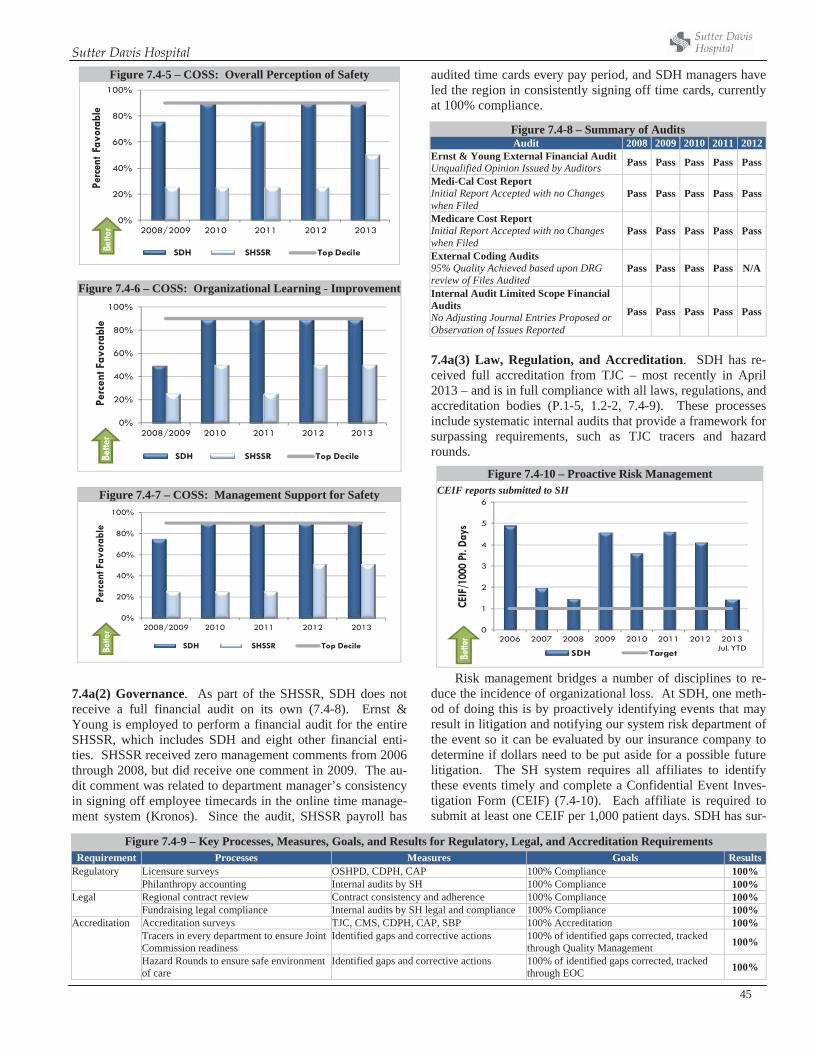
Sutter Davis Hospital
45
Figure 7.4-5 – COSS: Overall Perception of Safety
0%
20%
40%
60%
80%
100%
2008/2009 2010 2011 2012 2013
Perc
ent F
avor
able
SDH SHSSR Top DecileBette
r
Figure 7.4-6 – COSS: Organizational Learning - Improvement
0%
20%
40%
60%
80%
100%
2008/2009 2010 2011 2012 2013
Perc
ent F
avor
able
SDH SHSSR Top DecileBette
r
7.4a(2) Governance. As part of the SHSSR, SDH does not receive a full financial audit on its own (7.4-8). Ernst & Young is employed to perform a financial audit for the entire SHSSR, which includes SDH and eight other financial enti-ties. SHSSR received zero management comments from 2006 through 2008, but did receive one comment in 2009. The au-dit comment was related to department manager’s consistency in signing off employee timecards in the online time manage-ment system (Kronos). Since the audit, SHSSR payroll has
audited time cards every pay period, and SDH managers have led the region in consistently signing off time cards, currently at 100% compliance.
7.4a(3) Law, Regulation, and Accreditation. SDH has re-ceived full accreditation from TJC – most recently in April 2013 – and is in full compliance with all laws, regulations, and accreditation bodies (P.1-5, 1.2-2, 7.4-9). These processes include systematic internal audits that provide a framework for surpassing requirements, such as TJC tracers and hazard rounds.
Risk management bridges a number of disciplines to re-duce the incidence of organizational loss. At SDH, one meth-od of doing this is by proactively identifying events that may result in litigation and notifying our system risk department of the event so it can be evaluated by our insurance company to determine if dollars need to be put aside for a possible future litigation. The SH system requires all affiliates to identify these events timely and complete a Confidential Event Inves-tigation Form (CEIF) (7.4-10). Each affiliate is required to submit at least one CEIF per 1,000 patient days. SDH has sur-
Figure 7.4-7 – COSS: Management Support for Safety
0%
20%
40%
60%
80%
100%
2008/2009 2010 2011 2012 2013
Perc
ent F
avor
able
SDH SHSSR Top DecileBette
r
Figure 7.4-9 – Key Processes, Measures, Goals, and Results for Regulatory, Legal, and Accreditation Requirements Requirement Processes Measures Goals Results
Regulatory Licensure surveys OSHPD, CDPH, CAP 100% Compliance 100% Philanthropy accounting Internal audits by SH 100% Compliance 100% Legal Regional contract review Contract consistency and adherence 100% Compliance 100% Fundraising legal compliance Internal audits by SH legal and compliance 100% Compliance 100% Accreditation Accreditation surveys TJC, CMS, CDPH, CAP, SBP 100% Accreditation 100% Tracers in every department to ensure Joint
Commission readiness Identified gaps and corrective actions 100% of identified gaps corrected, tracked
through Quality Management 100%
Hazard Rounds to ensure safe environment of care
Identified gaps and corrective actions 100% of identified gaps corrected, tracked through EOC 100%
Figure 7.4-8 – Summary of Audits Audit 2008 2009 2010 2011 2012
Ernst & Young External Financial Audit Unqualified Opinion Issued by Auditors Pass Pass Pass Pass Pass
Medi-Cal Cost Report Initial Report Accepted with no Changes when Filed
Pass Pass Pass Pass Pass
Medicare Cost Report Initial Report Accepted with no Changes when Filed
Pass Pass Pass Pass Pass
External Coding Audits 95% Quality Achieved based upon DRG review of Files Audited
Pass Pass Pass Pass N/A
Internal Audit Limited Scope Financial Audits No Adjusting Journal Entries Proposed or Observation of Issues Reported
Pass Pass Pass Pass Pass
Figure 7.4-10 – Proactive Risk ManagementCEIF reports submitted to SH
0
1
2
3
4
5
6
2006 2007 2008 2009 2010 2011 2012 2013 Jul. YTD
CEIF
/100
0 Pt
. Day
s
SDH TargetBette
r
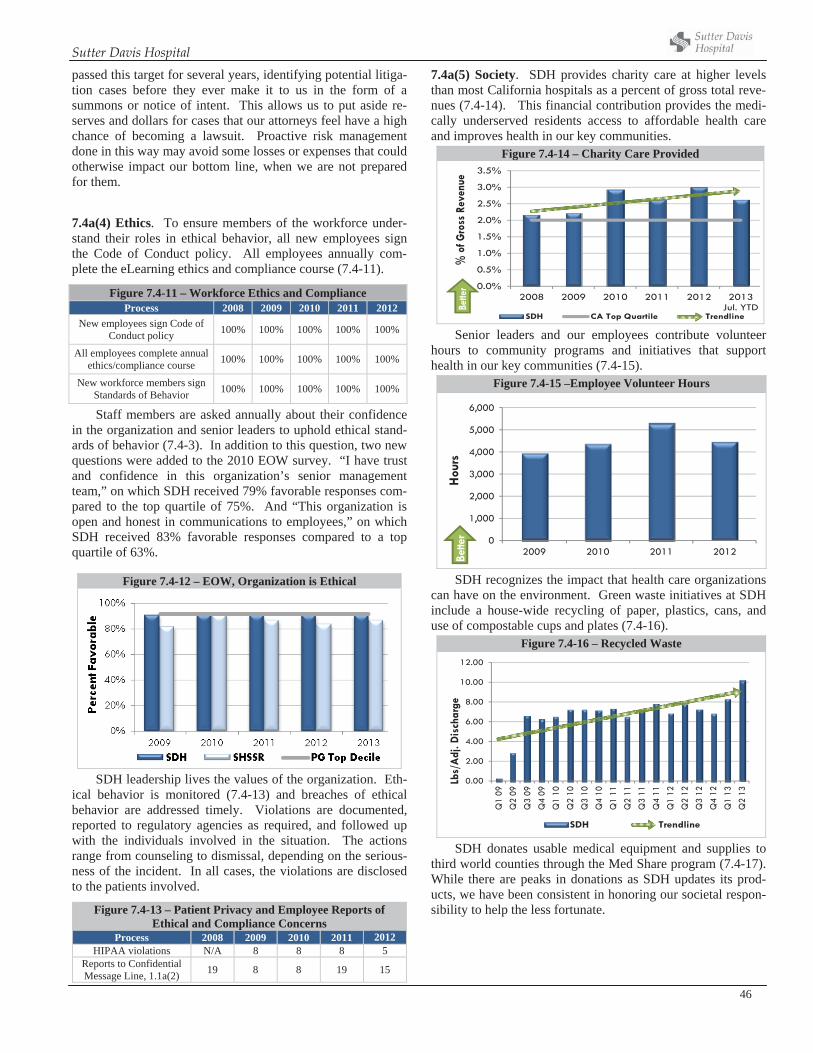
Sutter Davis Hospital
46
passed this target for several years, identifying potential litiga-tion cases before they ever make it to us in the form of a summons or notice of intent. This allows us to put aside re-serves and dollars for cases that our attorneys feel have a high chance of becoming a lawsuit. Proactive risk management done in this way may avoid some losses or expenses that could otherwise impact our bottom line, when we are not prepared for them.
7.4a(4) Ethics. To ensure members of the workforce under-stand their roles in ethical behavior, all new employees sign the Code of Conduct policy. All employees annually com-plete the eLearning ethics and compliance course (7.4-11).
Staff members are asked annually about their confidence in the organization and senior leaders to uphold ethical stand-ards of behavior (7.4-3). In addition to this question, two new questions were added to the 2010 EOW survey. “I have trust and confidence in this organization’s senior management team,” on which SDH received 79% favorable responses com-pared to the top quartile of 75%. And “This organization is open and honest in communications to employees,” on which SDH received 83% favorable responses compared to a top quartile of 63%.
SDH leadership lives the values of the organization. Eth-ical behavior is monitored (7.4-13) and breaches of ethical behavior are addressed timely. Violations are documented, reported to regulatory agencies as required, and followed up with the individuals involved in the situation. The actions range from counseling to dismissal, depending on the serious-ness of the incident. In all cases, the violations are disclosed to the patients involved.
7.4a(5) Society. SDH provides charity care at higher levels than most California hospitals as a percent of gross total reve-nues (7.4-14). This financial contribution provides the medi-cally underserved residents access to affordable health care and improves health in our key communities.
Figure 7.4-14 – Charity Care Provided
0.0%
0.5%
1.0%
1.5%
2.0%
2.5%
3.0%
3.5%
2008 2009 2010 2011 2012 2013 Jul. YTD
% o
f Gro
ss R
even
ue
SDH CA Top Quartile Trendline
Bette
r
Senior leaders and our employees contribute volunteer hours to community programs and initiatives that support health in our key communities (7.4-15).
Figure 7.4-15 –Employee Volunteer Hours
0
1,000
2,000
3,000
4,000
5,000
6,000
2009 2010 2011 2012
Hou
rsBe
tter
SDH recognizes the impact that health care organizations can have on the environment. Green waste initiatives at SDH include a house-wide recycling of paper, plastics, cans, and use of compostable cups and plates (7.4-16).
Figure 7.4-16 – Recycled Waste
0.00
2.00
4.00
6.00
8.00
10.00
12.00
Q1
09Q
2 09
Q3
09Q
4 09
Q1
10Q
2 10
Q3
10Q
4 10
Q1
11Q
2 11
Q3
11Q
4 11
Q1
12Q
2 12
Q3
12Q
4 12
Q1
13Q
2 13
Lbs/
Adj
. Dis
char
ge
SDH Trendline
SDH donates usable medical equipment and supplies to third world counties through the Med Share program (7.4-17). While there are peaks in donations as SDH updates its prod-ucts, we have been consistent in honoring our societal respon-sibility to help the less fortunate.
Figure 7.4-11 – Workforce Ethics and Compliance Process 2008 2009 2010 2011 2012
New employees sign Code of Conduct policy 100% 100% 100% 100% 100%
All employees complete annual ethics/compliance course 100% 100% 100% 100% 100%
New workforce members sign Standards of Behavior 100% 100% 100% 100% 100%
Figure 7.4-12 – EOW, Organization is Ethical
Figure 7.4-13 – Patient Privacy and Employee Reports of Ethical and Compliance Concerns
Process 2008 2009 2010 2011 2012 HIPAA violations N/A 8 8 8 5
Reports to Confidential Message Line, 1.1a(2) 19 8 8 19 15
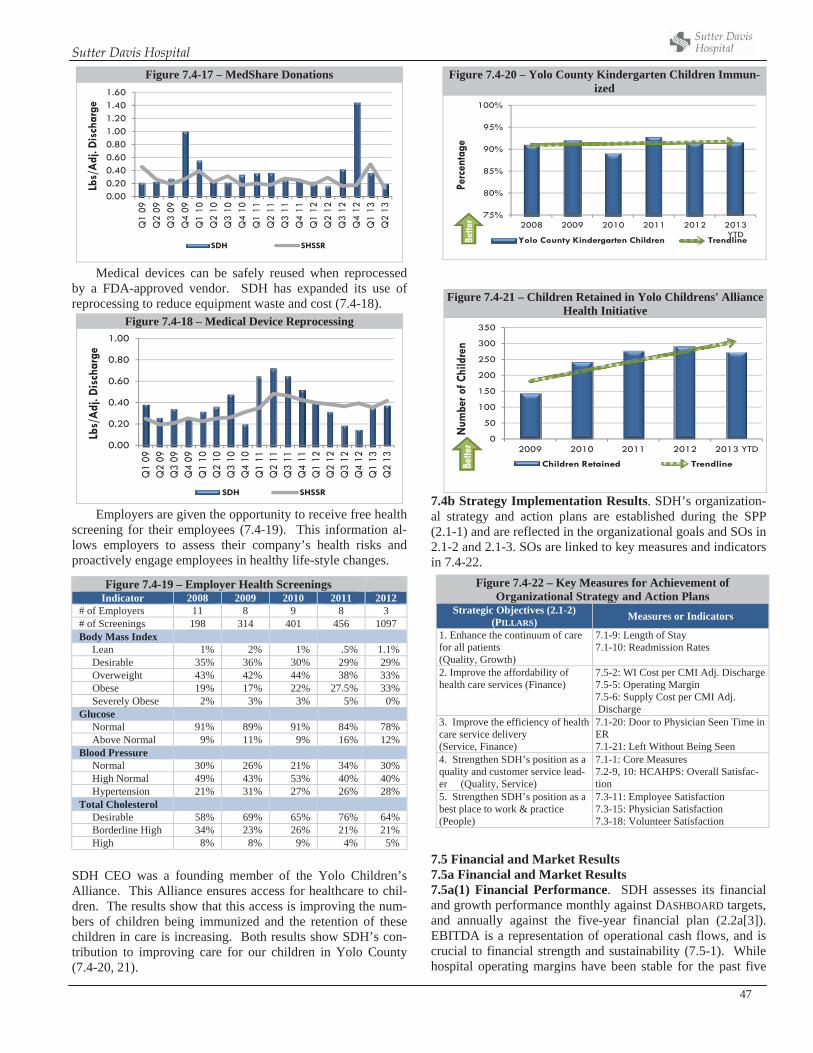
Sutter Davis Hospital
47
Figure 7.4-17 – MedShare Donations
0.000.200.400.600.801.001.201.401.60
Q1
09Q
2 09
Q3
09Q
4 09
Q1
10Q
2 10
Q3
10Q
4 10
Q1
11Q
2 11
Q3
11Q
4 11
Q1
12Q
2 12
Q3
12Q
4 12
Q1
13Q
2 13
Lbs/
Adj
. Dis
char
ge
SDH SHSSR
Medical devices can be safely reused when reprocessed by a FDA-approved vendor. SDH has expanded its use of reprocessing to reduce equipment waste and cost (7.4-18).
Figure 7.4-18 – Medical Device Reprocessing
0.00
0.20
0.40
0.60
0.80
1.00
Q1
09Q
2 09
Q3
09Q
4 09
Q1
10Q
2 10
Q3
10Q
4 10
Q1
11Q
2 11
Q3
11Q
4 11
Q1
12Q
2 12
Q3
12Q
4 12
Q1
13Q
2 13
Lbs/
Adj
. Dis
char
ge
SDH SHSSR
Employers are given the opportunity to receive free health screening for their employees (7.4-19). This information al-lows employers to assess their company’s health risks and proactively engage employees in healthy life-style changes.
SDH CEO was a founding member of the Yolo Children’s Alliance. This Alliance ensures access for healthcare to chil-dren. The results show that this access is improving the num-bers of children being immunized and the retention of these children in care is increasing. Both results show SDH’s con-tribution to improving care for our children in Yolo County (7.4-20, 21).
Figure 7.4-20 – Yolo County Kindergarten Children Immun-ized
75%
80%
85%
90%
95%
100%
2008 2009 2010 2011 2012 2013 YTD
Perc
enta
ge
Yolo County Kindergarten Children TrendlineBette
r
7.4b Strategy Implementation Results. SDH’s organization-al strategy and action plans are established during the SPP (2.1-1) and are reflected in the organizational goals and SOs in 2.1-2 and 2.1-3. SOs are linked to key measures and indicators in 7.4-22.
Figure 7.4-22 – Key Measures for Achievement of Organizational Strategy and Action Plans
Strategic Objectives (2.1-2) (PILLARS) Measures or Indicators
1. Enhance the continuum of care for all patients (Quality, Growth)
7.1-9: Length of Stay 7.1-10: Readmission Rates
2. Improve the affordability of health care services (Finance)
7.5-2: WI Cost per CMI Adj. Discharge7.5-5: Operating Margin 7.5-6: Supply Cost per CMI Adj. Discharge
3. Improve the efficiency of health care service delivery (Service, Finance)
7.1-20: Door to Physician Seen Time in ER7.1-21: Left Without Being Seen
4. Strengthen SDH’s position as a quality and customer service lead-er (Quality, Service)
7.1-1: Core Measures 7.2-9, 10: HCAHPS: Overall Satisfac-tion
5. Strengthen SDH’s position as a best place to work & practice (People)
7.3-11: Employee Satisfaction 7.3-15: Physician Satisfaction 7.3-18: Volunteer Satisfaction
7.5 Financial and Market Results 7.5a Financial and Market Results 7.5a(1) Financial Performance. SDH assesses its financial and growth performance monthly against DASHBOARD targets, and annually against the five-year financial plan (2.2a[3]). EBITDA is a representation of operational cash flows, and is crucial to financial strength and sustainability (7.5-1). While hospital operating margins have been stable for the past five
Figure 7.4-21 – Children Retained in Yolo Childrens' Alliance Health Initiative
0
50
100
150
200
250
300
350
2009 2010 2011 2012 2013 YTDN
umbe
r of C
hild
ren
Children Retained TrendlineBette
r
Figure 7.4-19 – Employer Health Screenings Indicator 2008 2009 2010 2011 2012
# of Employers 11 8 9 8 3 # of Screenings 198 314 401 456 1097 Body Mass Index Lean 1% 2% 1% .5% 1.1% Desirable 35% 36% 30% 29% 29% Overweight 43% 42% 44% 38% 33% Obese 19% 17% 22% 27.5% 33% Severely Obese 2% 3% 3% 5% 0% Glucose Normal 91% 89% 91% 84% 78% Above Normal 9% 11% 9% 16% 12% Blood Pressure Normal 30% 26% 21% 34% 30% High Normal 49% 43% 53% 40% 40% Hypertension 21% 31% 27% 26% 28% Total Cholesterol Desirable 58% 69% 65% 76% 64% Borderline High 34% 23% 26% 21% 21% High 8% 8% 9% 4% 5%
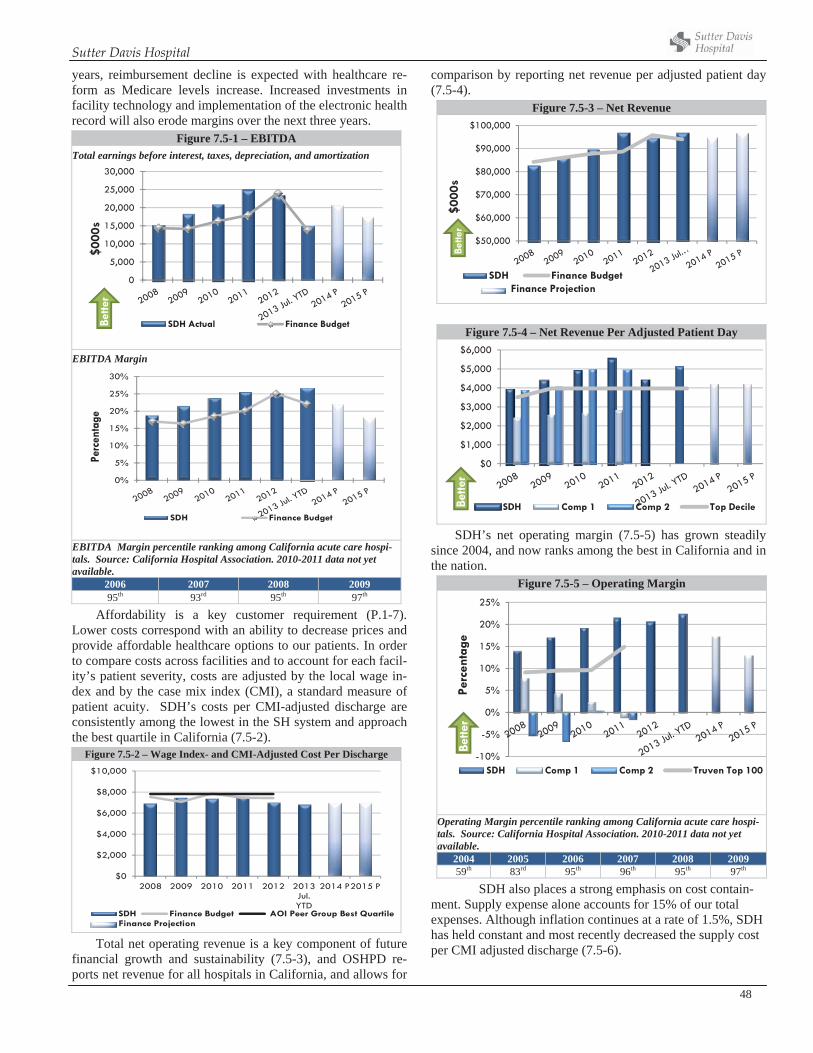
Sutter Davis Hospital
48
years, reimbursement decline is expected with healthcare re-form as Medicare levels increase. Increased investments in facility technology and implementation of the electronic health record will also erode margins over the next three years.
Figure 7.5-1 – EBITDA Total earnings before interest, taxes, depreciation, and amortization
0
5,000
10,000
15,000
20,000
25,000
30,000
$000
s
SDH Actual Finance BudgetBette
r
EBITDA Margin
0%
5%
10%
15%
20%
25%
30%
Perc
enta
ge
SDH Finance Budget
EBITDA Margin percentile ranking among California acute care hospi-tals. Source: California Hospital Association. 2010-2011 data not yet available.
2006 2007 2008 2009 95th 93rd 95th 97th
Affordability is a key customer requirement (P.1-7). Lower costs correspond with an ability to decrease prices and provide affordable healthcare options to our patients. In order to compare costs across facilities and to account for each facil-ity’s patient severity, costs are adjusted by the local wage in-dex and by the case mix index (CMI), a standard measure of patient acuity. SDH’s costs per CMI-adjusted discharge are consistently among the lowest in the SH system and approach the best quartile in California (7.5-2).
Figure 7.5-2 – Wage Index- and CMI-Adjusted Cost Per Discharge
$0
$2,000
$4,000
$6,000
$8,000
$10,000
2008 2009 2010 2011 2012 2013 Jul. YTD
2014 P2015 P
SDH Finance Budget AOI Peer Group Best QuartileFinance Projection
Total net operating revenue is a key component of future financial growth and sustainability (7.5-3), and OSHPD re-ports net revenue for all hospitals in California, and allows for
comparison by reporting net revenue per adjusted patient day (7.5-4).
Figure 7.5-3 – Net Revenue
$50,000
$60,000
$70,000
$80,000
$90,000
$100,000
$000
s
SDH Finance Budget
Bette
r
Finance Projection
Figure 7.5-4 – Net Revenue Per Adjusted Patient Day
$0
$1,000
$2,000
$3,000
$4,000
$5,000
$6,000
SDH Comp 1 Comp 2 Top DecileBette
r
SDH’s net operating margin (7.5-5) has grown steadily since 2004, and now ranks among the best in California and in the nation.
Figure 7.5-5 – Operating Margin
-10%
-5%
0%
5%
10%
15%
20%
25%
Perc
enta
ge
SDH Comp 1 Comp 2 Truven Top 100
Bette
r
Operating Margin percentile ranking among California acute care hospi-tals. Source: California Hospital Association. 2010-2011 data not yet available.
2004 2005 2006 2007 2008 2009 59th 83rd 95th 96th 95th 97th
SDH also places a strong emphasis on cost contain-ment. Supply expense alone accounts for 15% of our total expenses. Although inflation continues at a rate of 1.5%, SDH has held constant and most recently decreased the supply cost per CMI adjusted discharge (7.5-6).
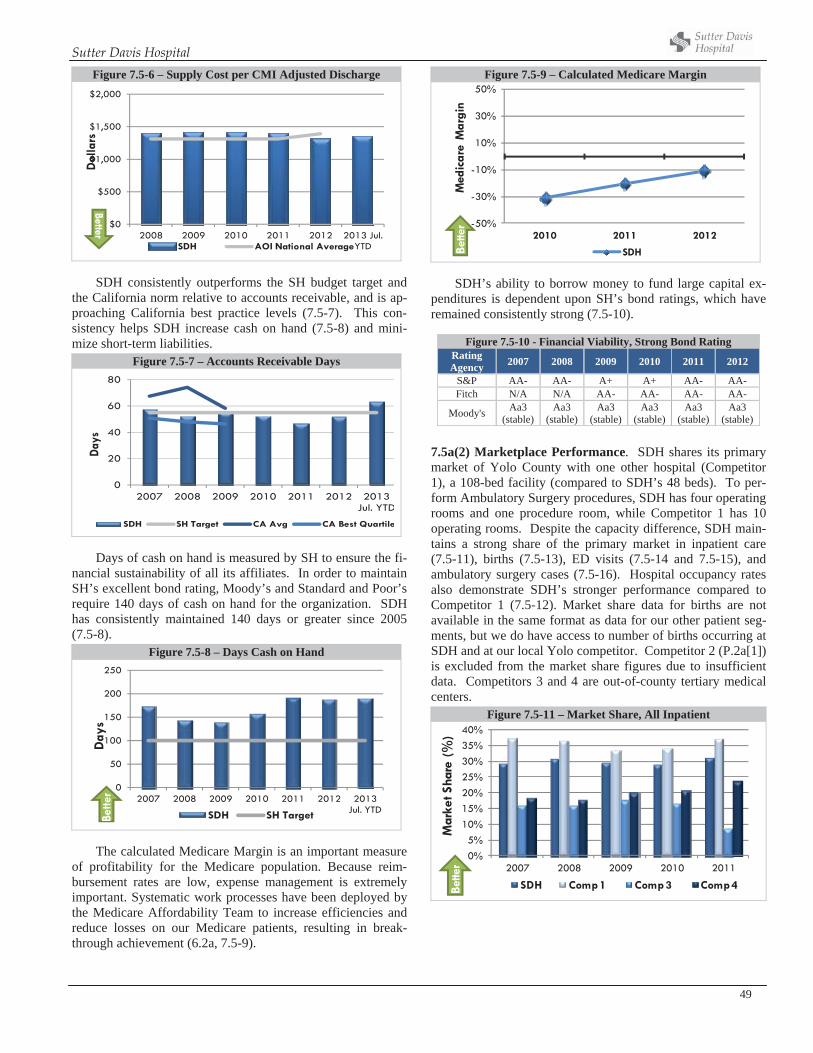
Sutter Davis Hospital
49
Figure 7.5-6 – Supply Cost per CMI Adjusted Discharge
$0
$500
$1,000
$1,500
$2,000
2008 2009 2010 2011 2012 2013 Jul. YTD
Dol
lars
SDH AOI National Average
Better
SDH consistently outperforms the SH budget target and the California norm relative to accounts receivable, and is ap-proaching California best practice levels (7.5-7). This con-sistency helps SDH increase cash on hand (7.5-8) and mini-mize short-term liabilities.
Figure 7.5-7 – Accounts Receivable Days
0
20
40
60
80
2007 2008 2009 2010 2011 2012 2013 Jul. YTD
Days
SDH SH Target CA Avg CA Best Quartile
Days of cash on hand is measured by SH to ensure the fi-nancial sustainability of all its affiliates. In order to maintain SH’s excellent bond rating, Moody’s and Standard and Poor’s require 140 days of cash on hand for the organization. SDH has consistently maintained 140 days or greater since 2005 (7.5-8).
Figure 7.5-8 – Days Cash on Hand
0
50
100
150
200
250
2007 2008 2009 2010 2011 2012 2013 Jul. YTD
Day
s
SDH SH TargetBette
r
The calculated Medicare Margin is an important measure of profitability for the Medicare population. Because reim-bursement rates are low, expense management is extremely important. Systematic work processes have been deployed by the Medicare Affordability Team to increase efficiencies and reduce losses on our Medicare patients, resulting in break-through achievement (6.2a, 7.5-9).
Figure 7.5-9 – Calculated Medicare Margin
-50%
-30%
-10%
10%
30%
50%
2010 2011 2012
Med
icar
e M
argi
n
SDHBette
r
SDH’s ability to borrow money to fund large capital ex-penditures is dependent upon SH’s bond ratings, which have remained consistently strong (7.5-10).
Figure 7.5-10 - Financial Viability, Strong Bond Rating RatingAgency 2007 2008 2009 2010 2011 2012
S&P AA- AA- A+ A+ AA- AA- Fitch N/A N/A AA- AA- AA- AA-
Moody's Aa3(stable)
Aa3(stable)
Aa3(stable)
Aa3(stable)
Aa3(stable)
Aa3(stable)
7.5a(2) Marketplace Performance. SDH shares its primary market of Yolo County with one other hospital (Competitor 1), a 108-bed facility (compared to SDH’s 48 beds). To per-form Ambulatory Surgery procedures, SDH has four operating rooms and one procedure room, while Competitor 1 has 10 operating rooms. Despite the capacity difference, SDH main-tains a strong share of the primary market in inpatient care (7.5-11), births (7.5-13), ED visits (7.5-14 and 7.5-15), and ambulatory surgery cases (7.5-16). Hospital occupancy rates also demonstrate SDH’s stronger performance compared to Competitor 1 (7.5-12). Market share data for births are not available in the same format as data for our other patient seg-ments, but we do have access to number of births occurring at SDH and at our local Yolo competitor. Competitor 2 (P.2a[1]) is excluded from the market share figures due to insufficient data. Competitors 3 and 4 are out-of-county tertiary medical centers.
Figure 7.5-11 – Market Share, All Inpatient
0%5%
10%15%20%25%30%35%40%
2007 2008 2009 2010 2011
Mar
ket S
hare
(%)
SDH Comp 1 Comp 3 Comp 4Bette
r
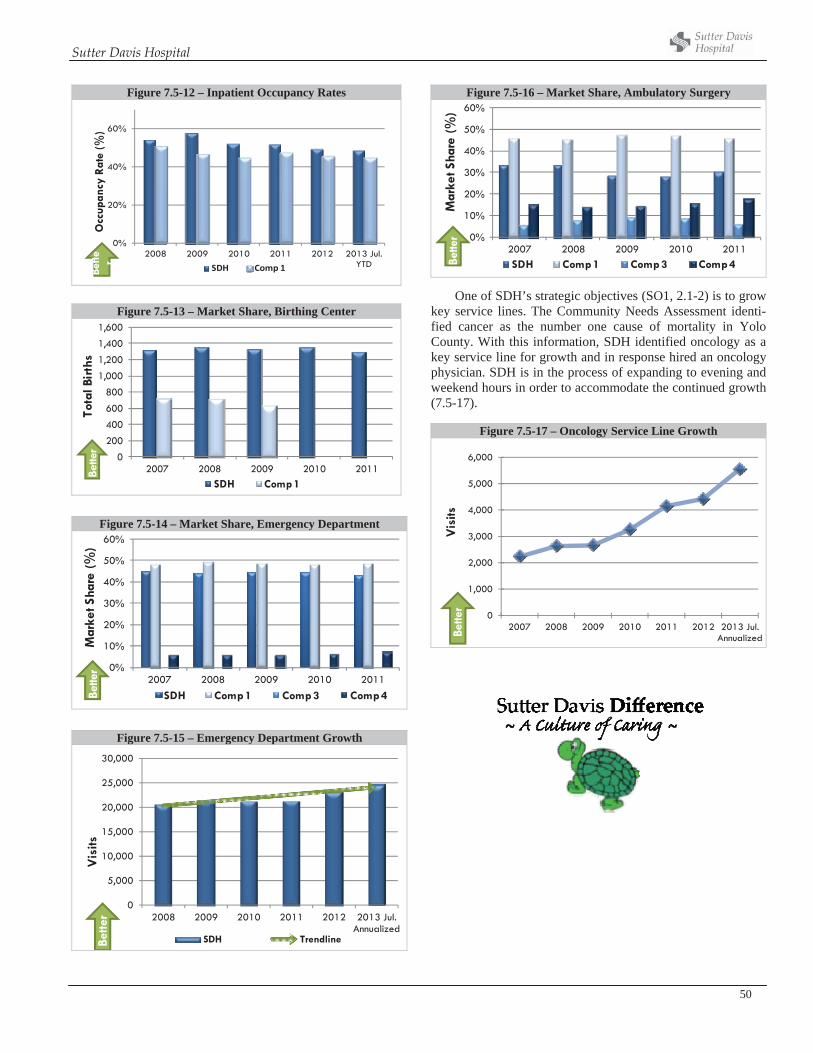
Sutter Davis Hospital
50
Figure 7.5-12 – Inpatient Occupancy Rates
0%
20%
40%
60%
2008 2009 2010 2011 2012 2013 Jul. YTD
Occ
upan
cy R
ate
(%)
SDH Comp 1Bette r
Figure 7.5-13 – Market Share, Birthing Center
0
200
400
600
800
1,000
1,200
1,400
1,600
2007 2008 2009 2010 2011
Tota
l Bir
ths
SDH Comp 1
Bette
r
Figure 7.5-14 – Market Share, Emergency Department
0%
10%
20%
30%
40%
50%
60%
2007 2008 2009 2010 2011
Mar
ket S
hare
(%)
SDH Comp 1 Comp 3 Comp 4Bette
r
Figure 7.5-15 – Emergency Department Growth
0
5,000
10,000
15,000
20,000
25,000
30,000
2008 2009 2010 2011 2012 2013 Jul. Annualized
Vis
its
SDH TrendlineBette
rFigure 7.5-16 – Market Share, Ambulatory Surgery
0%
10%
20%
30%
40%
50%
60%
2007 2008 2009 2010 2011
Mar
ket S
hare
(%)
SDH Comp 1 Comp 3 Comp 4Bette
r
One of SDH’s strategic objectives (SO1, 2.1-2) is to grow key service lines. The Community Needs Assessment identi-fied cancer as the number one cause of mortality in Yolo County. With this information, SDH identified oncology as a key service line for growth and in response hired an oncology physician. SDH is in the process of expanding to evening and weekend hours in order to accommodate the continued growth (7.5-17).
Figure 7.5-17 – Oncology Service Line Growth
0
1,000
2,000
3,000
4,000
5,000
6,000
2007 2008 2009 2010 2011 2012 2013 Jul. Annualized
Vis
itsBe
tter