Embed Size (px)
Citation preview
Faculty of Natural Resources and Agricultural Sciences Department of Food Science
Swedish native mountain cattle and their milk proteins – Conventional compared to pasture operated farming for indoor and
outdoor period
Fjällkor och deras mjölkproteiner – Konventionell drift jämfört med fäboddrift för inne- och uteperiod
Claesson Camilla
Independent Project in Food Science• Bachelor Project • 15 hec • Ground G2EPublication / Swedish University of Agricultural Sciences, Department of Food Science, no 451 Uppsala, 2016
Swedish native mountain cattle and their milk proteins – Conventional compared to pasture operated farming for indoor and outdoor period
Fjällkor och deras mjölkproteiner
– Konventionell drift jämfört med fäboddrift för inne- och uteperiod
Claesson Camilla
Supervisor: Johansson Monika, Department of Food Science, SLU
Examiner: Dimberg Lena, Department of Food Science, SLU
Credits: 15 hec Level: Ground G2E Course title: Independent Project in Food Science – Bachelor Project Course code: EX0669 Programme/education: Agricultural Programme - Food Science
Place of publication: Uppsala Year of publication: 2016 Title of series: Publication / Swedish University of Agricultural Sciences, Department of Food Science Serie no: 451 Online publication: http://stud.epsilon.slu.se
Keywords: WHEY, CASEIN, BOVINE, CAPILLARY ELECTROPHORESIS, COW
Sveriges lantbruksuniversitet Swedish University of Agricultural Sciences
Faculty of Natural Resources and Agricultural Sciences Department of Food Science
Abstract Swedish native mountain cattle are a small breed from northern part of Sweden. They have existed as a breed since before the 1900-century. 1896 it was decided that one feature should be selected: hornless and white with black or brown fea-tures. The breed represents 0.3 % of dairy cows in Sweden and they are threatened by extinction. They have a small milk yield compared to other modern cows, but their milk proteins are of big interest.
The purpose of this bachelor study was to analyze the milk proteins from Swe-dish mountain cattle with emphases on outdoor and indoor period from samples from two different farms. The pasture operated farm had 6 cows and the conven-tional farm had 11 cows participating in the study.
The method was based on capillary electrophoresis (CE) and a percentage of dif-ferent proteins in the milk samples was given.
The pasture operated farmed cow’s milk had a 1.65-1.99 % unit higher total whey protein content. For total whey protein the difference between indoor and outdoor period was very similar for both farms cow’s milk. The conventional farmed cow’s milk decreased 3.39 % units from outdoor to indoor period for total casein proteins compared to pasture operated farmed cow’s milk with 0.30 % units. Pasture operated farmed cows milk had a 0.23-0.51 % units higher β-CN B and 5.54-10 % units higher β-CN A2, but 3.68-4.41 % units lower β-CN A1 than con-ventional farmed cows milk. The β-CN B was decreasing 0.16-0.44 % units and β-CN A2 is decreasing 0.87-3.59 % units and β-CN A1 was increasing 0.23-0.96 % units when indoor period was compared to outdoor period. Pasture operated farmed cow’s milk had 1 % units higher β-CN B than conventional farmed cow’s milk and 2 % unit higher percentage than the control milk.
These differences could have many reasons. It does not seem likely that the dif-ferences were due to their feed intake. The cow’s milk protein profile has a natural variation during the lactation months. The farms could have different genetic possi-bilities, since they could come from different blood lines.
Keywords: WHEY, CASEIN, BOVINE, CAPILLARY ELECTROPHORESIS, COW
Sammanfattning Fjällkon är en liten ras från norra Sverige som har funnits som ras sedan 1800-talet. 1896 beslutades att fjällkon skulle ha ett utseende: ”den vita kostymen”. Det inne-bar att de skulle vara kulliga och vita med svarta eller bruna tecken. Rasen repre-senterar 0.3% av mjölkkorna i Sverige och är utrotningshotad. De mjölkar ganska lite i jämförelse med andra raser, men deras mjölkproteiner är av stort intresse.
Syftet med arbetet var att analysera mjölkproteinerna från fjällkor med focus på inne och ute period från samlade mjölkprover från två gårdar. Fäboddrift gården hade 6 kor och den konventionella gården hade 11 kor med i studien.
Metoden som användes är baserad på kapillär elektrofores (CE) och ett procenttal av olika proteiner gavs från mjölk provet.
Fäboddrift gårdens kors mjölk hade 1,65–1,99 % enheter högre total vassle pro-tein. For total vassle protein var skillnaden mellan inne och uteperiod väldigt lik för båda gårdar. Den konventionella gårdens komjölk sjönk med 3,39 % enheter från ute period till inne period för totalt kasein och fäboddrift gårdens komjölk med bara 0,30 % enheter. För β-kasein B hade fäboddrift gårdens komjölk högre värden med 0,23-0,51 % enheter och för β-kasein A2 högre med 5,54–10 % enheter än konvent-ionella gårdens komjölk. Konventionella gårdens komjölk hade 3,68–4,41 % enhet-er högre β-kasein A1 än fäboddrift gårdens komjölk. β-kasein B minskade med 0,16-0,44 % enheter, β-kasein A2 minskade med 0,87-3,59 % enheter och β-kasein A1 ökade med 0,23-0,96 % enheter från ute period till inne period. Fäboddrift hade 1 % enhet högre β-kasein B än konventionella gårdens komjölk som i sin tur har 1 % enhet högre än kontrollen.
Skillnaderna som sågs mellan gårdarna kan ha olika anledningar. Det är inte tro-ligt att skillnaderna berodde på olika foderintag. Kornas protein profil varierar na-turligt med laktations månader. Gårdarna kan ha olika genetiska förutsättningar, då korna kan härstamma från olika avels linjer.
Nyckelord: VASSLE, KASEIN, KOR, KAPILLÄR ELEKTROFORES
Table of contents
List of Tables 5
List of Figures 6
Abbreviations 7
1 Introduction 8 1.1 Background 8
2 Pastures, milk components and purpose 10 2.1 Pasture operated farming 10 2.2 Conventional farming 10 2.3 Grazing periods 10 2.4 Milk proteins 11
2.4.1 Whey fraction 11 2.4.2 Casein fraction 11 2.4.2.1 β-CN 12
2.5 Purpose of this study 12 2.6 Purpose of results 13
2.6.1 Future work 13
3 Materials and Methods 14 3.1 Animals and milk sampling 14 3.2 Sample preparation 15 3.3 Capillary electrophoresis 15 3.4 Milk composition data 15 3.5 Genotyping 15 3.6 Statistics 16
4 Results 17 4.1 Milk composition data 17 4.2 Genotype data 18 4.3 Protein profile data 19
4.3.1 Whey protein 19 4.3.2 Casein protein 20
4.3.2.1 β-CN 21
5 Discussion 25 5.1 Milk composition data 25 5.2 Genotype data 25 5.3 Protein analysis 26
6 Conclusion 27
7 Acknowledgements 28
References 29
Appendix 1 31
Appendix 2 32
Appendix 3 33
List of Tables
Table 1. Allele frequencies for β-CN 12
Table 2. Conventional farming for indoor and outdoor period 17 Table 3. Pasture operated farming for indoor and outdoor period 17
Table 4. Conventional farming and pasture operated farming with mean for 4 months including both indoor and outdoor period 18
Table 5. Cow genotype and protein analysis of β-Caseins A1 and A2 of pasture operated 18
Table 6. Cow genotype and protein analysis of β-Caseins A1 and A2 of conventional farm 19
Table I. Statistics of cattle breeds in Sweden 31
Table II. Regulations for grazing periods 31 Table III. Month of calving for cows and lactation month for collected samples from
both farms. 31
Table IV. Sample buffer 32
Table V. Run buffer 32
5
List of Figures
Figure 1. Total whey protein for different periods 20
Figure 2. Total casein protein for different periods 21
Figure 3. Beta-caseins for outdoor period 22
Figure 4. Beta-caseins for indoor period 23
Figure 5. Total beta-caseins 24 Figure I. Total whey protein for four months 33
Figure II. Total casein protein for four months 34
6
Abbreviations SRB SLB SKB SJB CE CN SSC αS-CN β-CN α-LA β-LG PRF WWF
Swedish red and white cattle Swedish lowland cattle Swedish hornless cattle Swedish jersey cattle Capillary electrophoresis Casein Somatic cells (cells/ml) αS-Casein β-Casein α-Lactalbumin β-Lactoglobulin “Projekt rädda fjällkon” World wildlife fund
7
1 Introduction
1.1 Background Milk is produced by female mammals in the mammary glands to feed their off-spring’s (Christian 2014). The physical and chemical composition of milk varies depending on species, age, breed, activity level, stage of lactation, intervals be-tween milking and usage of medicine (Christian 2014). Milk is a solution of water, fat, proteins, lactose, vitamins and minerals (Christian 2014; Coultate 2009).
In Sweden, the dairy cow population is dominated by Swedish red cattle (SRB) and Swedish lowland cattle (SLB) (Cattle statistics 2016). Swedish mountain cat-tle are a bread that belongs to Swedish hornless cattle (SKB) group together with red hornless cattle. Swedish mountain cattle are smaller, approximately 400 kg, compared to the more common breeds with 500-650 kg for SRB and SLB (Alskog et al. 1995). SKB represent only 0.3 % of the total number of dairy cows in Swe-den. SKB has a milk yield of 5500 kg, with 4.45 % fat and 3.56 % protein. They have a protein and fat content similar to SRB, but with approximately half the milk yield. Swedish jersey cattle (SJB) have a higher fat, protein and milk yield than SKB. SLB has the highest milk yield, but lowest fat and protein content (Table I, see appendix 1; Cattle statistics 2016).
Swedish mountain cattle have existed as a breed since before nineteenth-century. Some had horns and some were hornless (Nilsson 2006). They used to have a big variation of color: black, brown, red, white-yellow, grey, multi-colored, dappled and spots that flout together on the side of the cow. In 1896 it was decided that hornless and white with features of black or brown should be the characteris-tics of this cow breed (Alskog et al. 1995; Nilsson 2006; Hallander 1989). Unfor-tunately, the selection of white cattle resulted in gonad hyperplasia, which is un-derdevelopment of female or male genitals. The source for the problem was a re-cessive gene. The gene was strongly related to the lack of color on the cattle, espe-cially if the ears were white or predominant white (Nilsson 2006; Hallander 1989).
8
The breed was in 1993 threated by both extinction and inbreeding, because of the small number of cattle, especially purebred. World wildlife fund (WWF) starts project rescue Swedish mountain cattle (PRF) to try to save the breed. It was esti-mated that 300-500 cattle existed, but most were very close related. The Swedish Board of Agriculture (SJV) took over PRF and the association Svensk fjällrasavel was started by the farmers and have made it possible to preserve important lines of sperm from Nordavel (previously named NTC) to be used in breeding (Nilsson 2006). They are preserved in Nordens ark, together with other Swedish native animals. Swedish mountain cattle are not suited for the modern dairy systems in the way that the dairy companies pay by milk yield, not quality (Nilsson 2006). They are very important to preserve as a breed, but also to preserve them as a functioning dairy cow. The modern breeds have lower protein, compare to Swe-dish mountain cattle, since the yield has been increasing. It is possible that Swe-dish native mountain cattle may be a good resource in the future (Nilsson 2006; Ortman 2015). The Swedish mountain cow’s milk seems to be preferable when making cheese (Nilsson 2006).
9
2 Pastures, milk components and purpose
2.1 Pasture operated farming Pasture operated farming is an old form of farming. The cows are released in the morning to find food and would come home by themselves in the evening to get milked. They find food themselves in the outdoor period and eat hay in the indoor period.
2.2 Conventional farming Conventional farming is the most common way of farming, following all the Swe-dish regulations. The cattle can be tied up in base or loose housing barn with milk-ing pit or robot milking system. But when it comes to feed, the choice is up to the farmer and can therefore differ between farms. But common is to feed with grass, silage and feed concentrate in outdoor period and silage and feed concentrate in indoor period.
2.3 Grazing periods In Sweden the animals have to be pastured and the law regulate the amount of days (Table II, see appendix 1). In northern part of Sweden animals must be greas-ing 60 days in pasture season (1 April-31 October). Of those 60 days, 30 must be within the period 1 May- 15 September. For middle Sweden, the cattle need to be outside for 90 days in pasture season, and 60 of them has to be within the period 1 May- 15 September. For the southern part of Sweden, the cows have to be outside 120 days in pasture season, whilst 60 days of them must be within the period 1 May- 15 September (Jordbruksverket).
10
2.4 Milk proteins
The cow milk´s protein fraction is approximately 3-4 % (Christian et al. 2014). This fraction consists of 80 % caseins and 20 % whey proteins. The casein pro-teins involve αS-casein (αS-CN), β-casein (β-CN), κ-casein (κ-CN). The most important whey proteins are α-lactalbumin (α-LA), β-lactoglobulin (β-LG), and immunoglobulins (Christian et al. 2014; Coultate 2009). There is a number of different versions of each protein, because of a small difference in amino acid sequence. Because of that it is possible to identify a breed of cow from a sample of its milk by comparing the protein variants proportions. (Coultate 2009).
2.4.1 Whey fraction Whey proteins are α-lactalbumin, β-lactoglobulin, serum albumin and immuno-globulins. α-Lactalbumin is a co-enzyme in the synthesis of lactose. β-Lactoglobulins exist in milk as a dimer, since it is insoluble in water and therefore bind another α-lactalbumin. In low pH it can form an octamer. But the hydropho-bic bonds break when heated (Walstra et al. 1999). Whey proteins are heat sensi-tive and denaturate at 60 oC. They are also important for fermented products, be-cause during heating they form complex with casein and contribute to the wanted viscosity in yogurt and sour milk (Reivell et al. 2014).
2.4.2 Casein fraction The caseins biological role is to transfer Ca2+ from mother to offspring (Reivell et al. 2014). Caseins are important for the dairy industry. The casein micelle is built up by αS-CN and β-CN. The κ-CN is present on the surface of the micelle and stabilize it (Christian et al. 2014).
γ-CN is a degradation product of β-CN. αS-CN consists of αS1-CN and αS2-CN. They are both phosphoproteins, but αS2-CN has sulfide bonds. αS-CN and β-CN are phosphoproteins with phosphate groups esterified with serine, which reacts with Ca2+ions. κ-CN is a glycoprotein and protects the Ca2+ to not leak out. But κ-CN is an easy target for the rennet enzyme chymosin, and cause κ-CN to lose its protective property and the other caseins lose their Ca2+ and form a cheese curd (Walstra et al. 1999; Reivell et al. 2014)
CN are heat resistant and can tolerated 140 oC for 4 seconds. When fermented products are made, a starter culture is added which lower the pH, causing the CN-micelles negative charge to neutralize and they cannot repel other CN-micelles anymore. The CN-micelle lose its Ca2+ and the CN become a coagel and works as
11
a protein network that build the structure of yogurt and sour milk (Reivell et al. 2014).
2.4.2.1 β-CN Cheese making is an old way of preserving and concentrating the milk (Reivell et al. 2014). The protruding hairs of β-CN plays an important role for the colloidal stabilization of flocculation at lower temperature in cheese making (Walstra et al. 1999).
Swedish mountain cattle have according to farmers, a milk composition very suitable for cheese production, because only half the milk yield needs to be used to produce the same amount of cheese (Östensson 2013). Because of the combination of protein and fat, Swedish mountain cattle generally have a higher fat content than modern cow breeds (Table I, see appendix 1) they also have a higher percent-age of CN B then more modern breeds (Table 1). Since the SKB cows produce half the milk yield as a SLB or SLB (cattle statistics 2016), they would produce the same amount of cheese. But since the SKB is cattle that can live on lean bait compared to the other two breeds, they would be good complement to the modern breeds. This could also be the future way of farming, when less feed would be needed for the cows (Nilsson 2006).
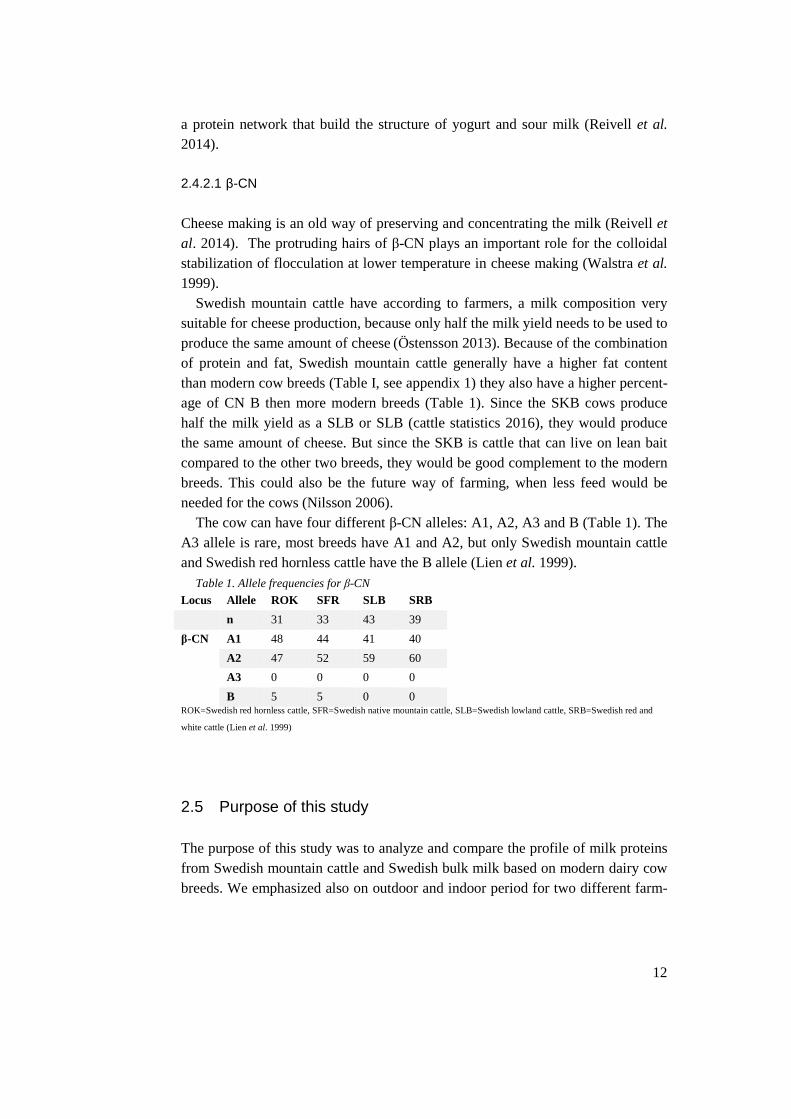
The cow can have four different β-CN alleles: A1, A2, A3 and B (Table 1). The A3 allele is rare, most breeds have A1 and A2, but only Swedish mountain cattle and Swedish red hornless cattle have the B allele (Lien et al. 1999).
Table 1. Allele frequencies for β-CN Locus Allele ROK SFR SLB SRB n 31 33 43 39 β-CN A1 48 44 41 40
A2 47 52 59 60 A3 0 0 0 0 B 5 5 0 0
ROK=Swedish red hornless cattle, SFR=Swedish native mountain cattle, SLB=Swedish lowland cattle, SRB=Swedish red and
white cattle (Lien et al. 1999)
2.5 Purpose of this study The purpose of this study was to analyze and compare the profile of milk proteins from Swedish mountain cattle and Swedish bulk milk based on modern dairy cow breeds. We emphasized also on outdoor and indoor period for two different farm-
12
ing systems in order to find out what impact the seasonal variation and effects of farming has on milk components from Swedish mountain cattle.
2.6 Purpose of results The results will be included in a complex survey, where the quality of milk from Swedish mountain cattle is in focus. The work is performed in collaboration with SLU, Department of Animal Breeding & Genetics and Svensk Fjällrasförening.
2.6.1 Future work Statistics on the data regarding correlation and significance will be performed in the future work.
13
3 Materials and Methods
3.1 Animals and milk sampling Individual milk samples were obtained from two different farms in Sweden. One farm was pasture operated from Sparreholm (middle region of Sweden) and the second one was conventional farm from Boden (northern region of Sweden). The samples were collected during outdoor period (August and September) and indoor period (October and November). Six and eleven Swedish mountain cows were included from the pasture operated and conventional farm, respectively. The milk samples were preserved by bronopol, in order to inhibit the microbial activity. The samples were stored at -20°C prior to analysis. As a control, low pasteurized, not homogenized 4,3% fat bulk milk (Arla) available in the stores was used in addition to the other milk samples. The control milk was defatted and treated in the same way as the milk from Swedish cattle and analyzed for milk protein profile.
The conventional farming cattle in this study was fed regrowth lay in the day and silage with food concentrate in the night for outdoor period. For indoor period the cattle were fed silage and feed concentrate. Feed concentrate was crushed oat grains and rapeseed cake food concentrate.
The pasture operated farming cattle in this study was fed extended bait in Au-gust. Regrowth lay, grass, and birdsfoot trefoil in September. For indoor period (October and November) the cattle was fed hay, grass, birdsfoot trefoil and black medic.
The Swedish mountain cattle in this study for both conventional farming and pasture operated farming used tied up milking. Samples that was used in this study, were collected by farmers from Sparreholm and Boden. The cows calved in different months and was thereby in different lactation month when samples were collected (Table III, see appendix1).
14
3.2 Sample preparation Frozen milk samples were thawed and placed in 45°C water bath for 15 minutes. Each sample was vortexed (Vortex-Genie 2, Scientific industries, inc., U.S.) and water bathed for further 15 minutes at the same temperature. Milk (150µL) was transferred by pipette into an Eppendorf safe lock tubes (Eppendorf, Germany) with 350 µL sample buffer (Table 10, see appendix 2) with ditioretinol (DTT) added and vortexed. The samples were incubated in room temperature for at least 1 hour and centrifuged (Himac CT15RE, Hitachi Koki Co., Ltd.) at 1500 rpm at 4°C for 10 minutes. The cream layers were removed with cotton swabs. The sam-ples were filtered by using a syringe with a 45μm nylon membrane filter and trans-ferred into new Eppendorf tubes. The samples, 30 µL, were transferred by pipette into conic vials (Agilent, Kista Sweden) for protein analysis by the capillary elec-trophoresis (CE) instrument.
3.3 Capillary electrophoresis Protein separation was performed with a 7100 capillary electrophoresis (CE) sys-tem (Agilent Technologies Co. America) as described by Johansson et al. (2013). Separations were performed using unfused silica standard capillary, with 50μm inner diameter, and 0.4 m active length (Chrom Tech, Märsta, Sweden). Run buff-er (Table 11, see appendix 2) was used. The calculation of relative concentrations of the individual proteins was based on the peak area and expressed as a percent-age of the total areas recorded for all peaks in the electropherogram. Chemstation software version A 10.02 was used.
3.4 Milk composition data Data over the milk components from individual cows during the four months were obtained from Växa Sverige. Milk components included in the investigation were: urea, total fat (%), total protein (%) and somatic cells (SCC) (cells/ml).
3.5 Genotyping Genotyping of individual cows with emphases on β-CN was done at Department of Animal Breeding and Genetics laboratory at SLU. These results can then be
15
compared with the results of β-CN A1 and A2 presence given from the protein profile.
3.6 Statistics Statistics of the data has not been performed and values described as higher or lower when compared in result and discussion, has not been examined to be signif-icant.
16
4 Results
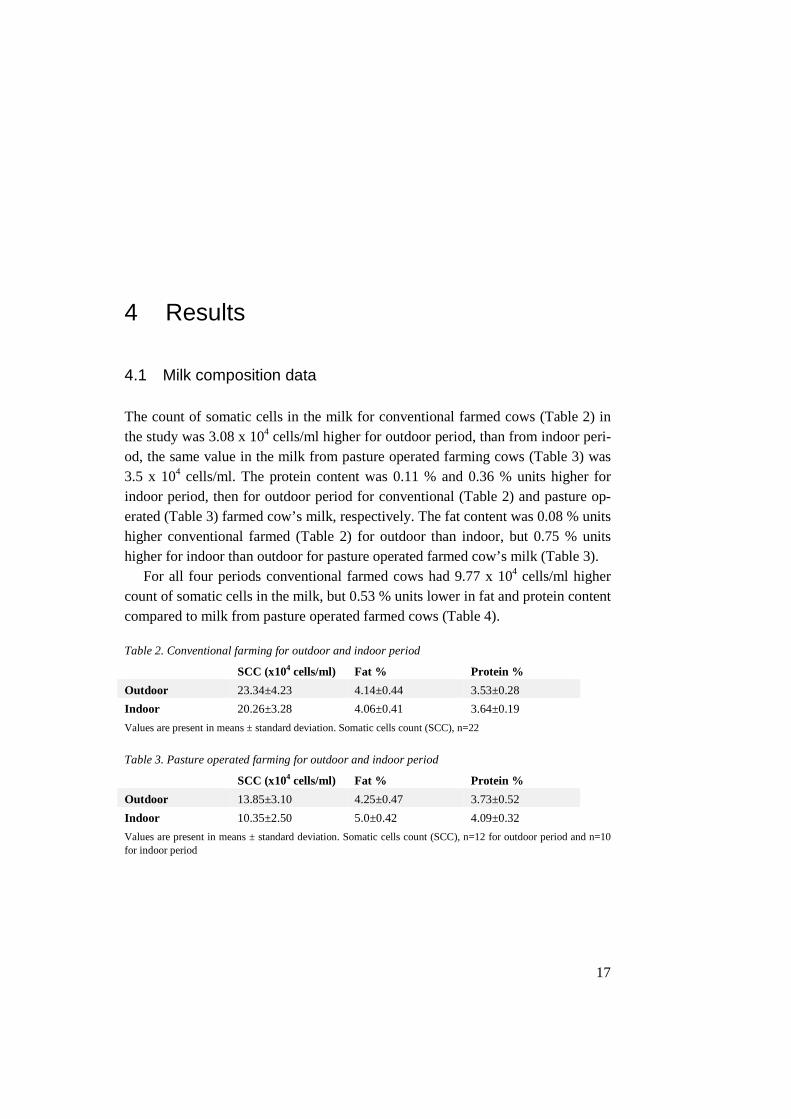
4.1 Milk composition data The count of somatic cells in the milk for conventional farmed cows (Table 2) in the study was 3.08 x 10⁴ cells/ml higher for outdoor period, than from indoor peri-od, the same value in the milk from pasture operated farming cows (Table 3) was 3.5 x 10⁴ cells/ml. The protein content was 0.11 % and 0.36 % units higher for indoor period, then for outdoor period for conventional (Table 2) and pasture op-erated (Table 3) farmed cow’s milk, respectively. The fat content was 0.08 % units higher conventional farmed (Table 2) for outdoor than indoor, but 0.75 % units higher for indoor than outdoor for pasture operated farmed cow’s milk (Table 3).
For all four periods conventional farmed cows had 9.77 x 10⁴ cells/ml higher count of somatic cells in the milk, but 0.53 % units lower in fat and protein content compared to milk from pasture operated farmed cows (Table 4).
Table 2. Conventional farming for outdoor and indoor period
SCC (x104 cells/ml) Fat % Protein % Outdoor 23.34±4.23 4.14±0.44 3.53±0.28 Indoor 20.26±3.28 4.06±0.41 3.64±0.19 Values are present in means ± standard deviation. Somatic cells count (SCC), n=22
Table 3. Pasture operated farming for outdoor and indoor period
SCC (x104 cells/ml) Fat % Protein % Outdoor 13.85±3.10 4.25±0.47 3.73±0.52 Indoor 10.35±2.50 5.0±0.42 4.09±0.32 Values are present in means ± standard deviation. Somatic cells count (SCC), n=12 for outdoor period and n=10 for indoor period
17
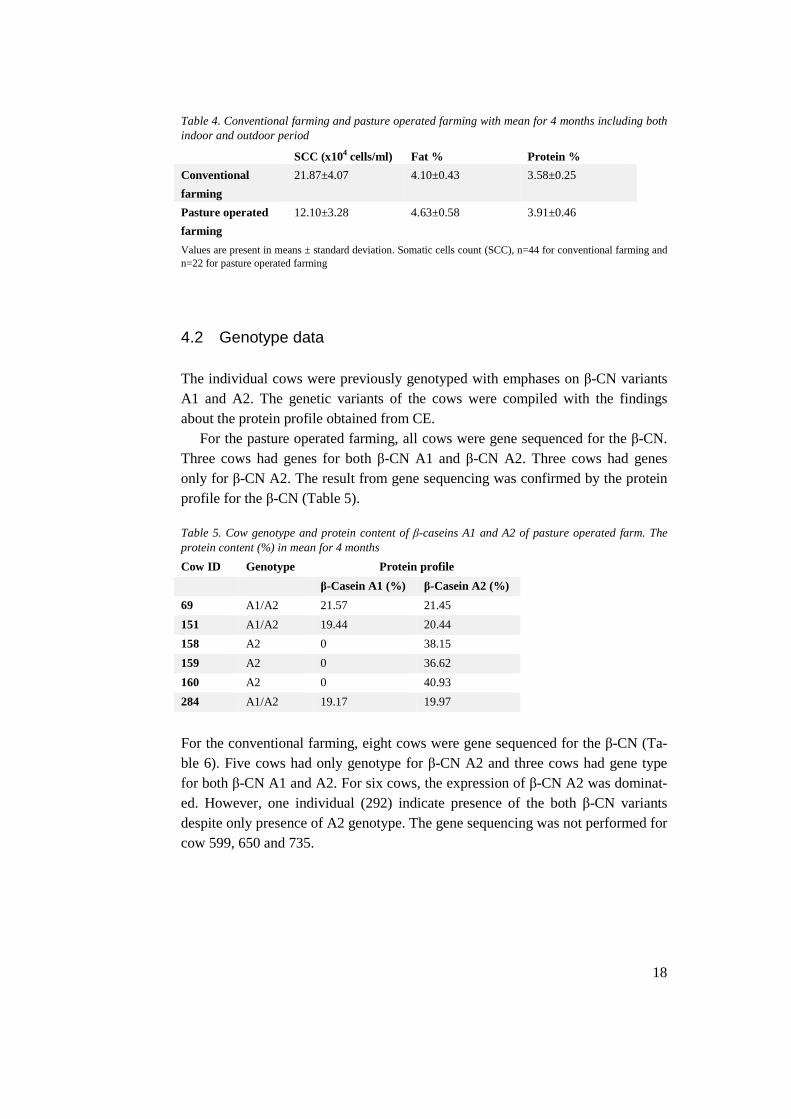
Table 4. Conventional farming and pasture operated farming with mean for 4 months including both indoor and outdoor period
SCC (x104 cells/ml) Fat % Protein % Conventional farming
21.87±4.07 4.10±0.43 3.58±0.25
Pasture operated farming
12.10±3.28 4.63±0.58 3.91±0.46
Values are present in means ± standard deviation. Somatic cells count (SCC), n=44 for conventional farming and n=22 for pasture operated farming
4.2 Genotype data The individual cows were previously genotyped with emphases on β-CN variants A1 and A2. The genetic variants of the cows were compiled with the findings about the protein profile obtained from CE.
For the pasture operated farming, all cows were gene sequenced for the β-CN. Three cows had genes for both β-CN A1 and β-CN A2. Three cows had genes only for β-CN A2. The result from gene sequencing was confirmed by the protein profile for the β-CN (Table 5).
Table 5. Cow genotype and protein content of β-caseins A1 and A2 of pasture operated farm. The protein content (%) in mean for 4 months Cow ID Genotype Protein profile β-Casein A1 (%) β-Casein A2 (%) 69 A1/A2 21.57 21.45 151 A1/A2 19.44 20.44 158 A2 0 38.15 159 A2 0 36.62 160 A2 0 40.93 284 A1/A2 19.17 19.97
For the conventional farming, eight cows were gene sequenced for the β-CN (Ta-ble 6). Five cows had only genotype for β-CN A2 and three cows had gene type for both β-CN A1 and A2. For six cows, the expression of β-CN A2 was dominat-ed. However, one individual (292) indicate presence of the both β-CN variants despite only presence of A2 genotype. The gene sequencing was not performed for cow 599, 650 and 735.
18
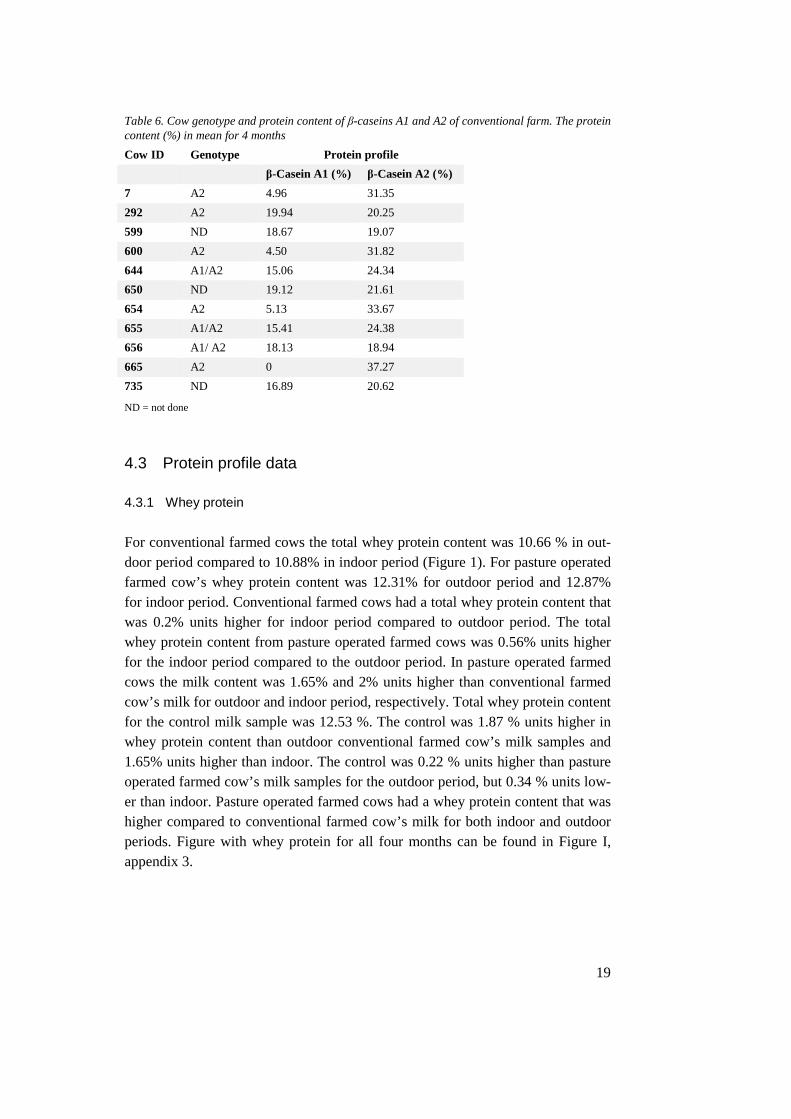
Table 6. Cow genotype and protein content of β-caseins A1 and A2 of conventional farm. The protein content (%) in mean for 4 months Cow ID Genotype Protein profile β-Casein A1 (%) β-Casein A2 (%) 7 A2 4.96 31.35 292 A2 19.94 20.25 599 ND 18.67 19.07 600 A2 4.50 31.82 644 A1/A2 15.06 24.34 650 ND 19.12 21.61 654 A2 5.13 33.67 655 A1/A2 15.41 24.38 656 A1/ A2 18.13 18.94 665 A2 0 37.27 735 ND 16.89 20.62
ND = not done
4.3 Protein profile data
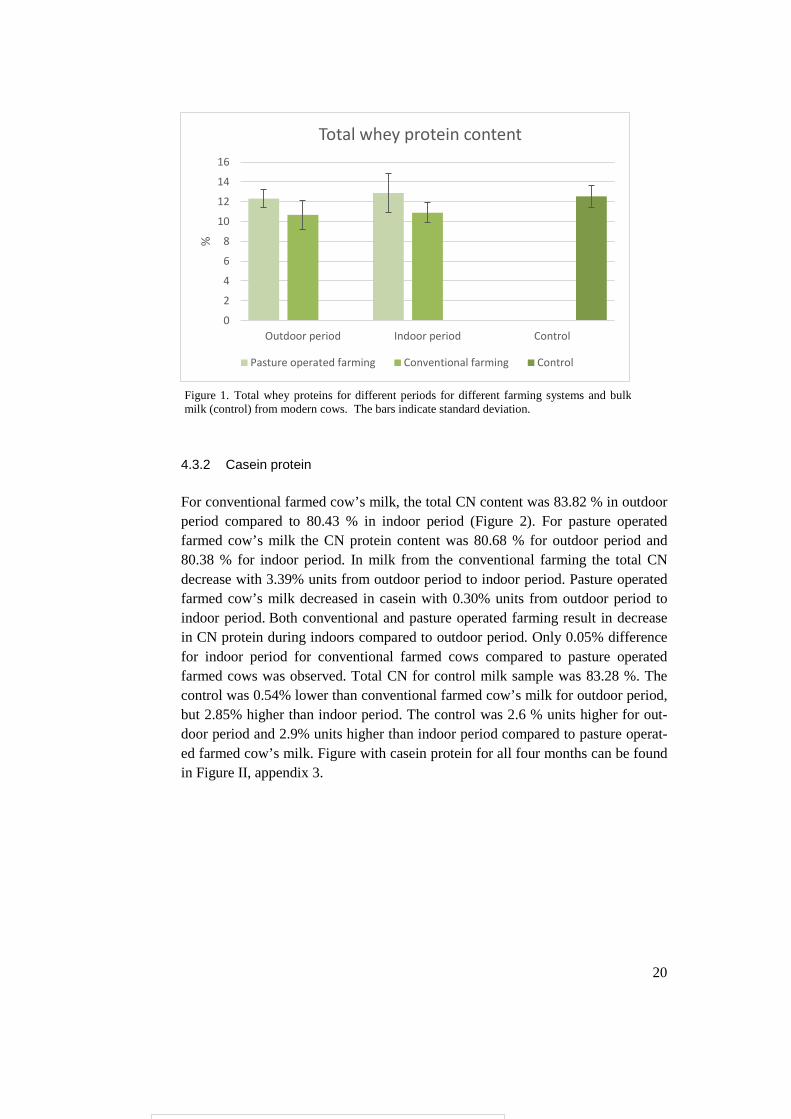
4.3.1 Whey protein For conventional farmed cows the total whey protein content was 10.66 % in out-door period compared to 10.88% in indoor period (Figure 1). For pasture operated farmed cow’s whey protein content was 12.31% for outdoor period and 12.87% for indoor period. Conventional farmed cows had a total whey protein content that was 0.2% units higher for indoor period compared to outdoor period. The total whey protein content from pasture operated farmed cows was 0.56% units higher for the indoor period compared to the outdoor period. In pasture operated farmed cows the milk content was 1.65% and 2% units higher than conventional farmed cow’s milk for outdoor and indoor period, respectively. Total whey protein content for the control milk sample was 12.53 %. The control was 1.87 % units higher in whey protein content than outdoor conventional farmed cow’s milk samples and 1.65% units higher than indoor. The control was 0.22 % units higher than pasture operated farmed cow’s milk samples for the outdoor period, but 0.34 % units low-er than indoor. Pasture operated farmed cows had a whey protein content that was higher compared to conventional farmed cow’s milk for both indoor and outdoor periods. Figure with whey protein for all four months can be found in Figure I, appendix 3.
19
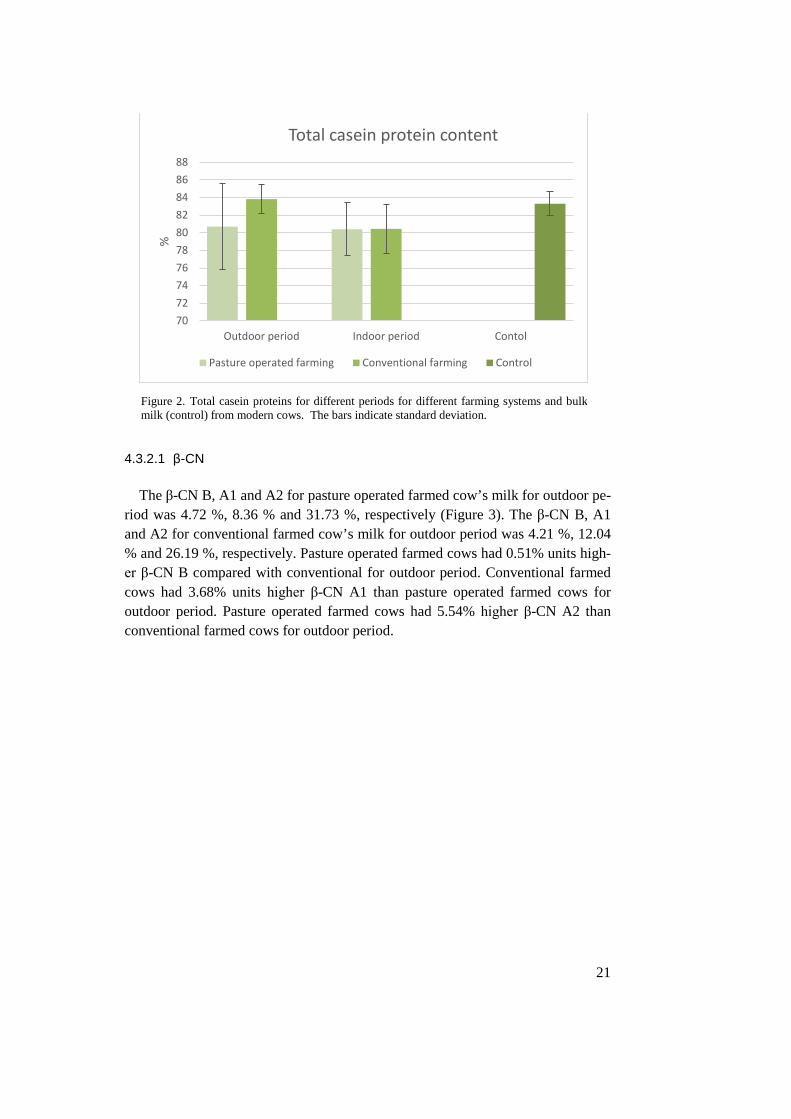
4.3.2 Casein protein For conventional farmed cow’s milk, the total CN content was 83.82 % in outdoor period compared to 80.43 % in indoor period (Figure 2). For pasture operated farmed cow’s milk the CN protein content was 80.68 % for outdoor period and 80.38 % for indoor period. In milk from the conventional farming the total CN decrease with 3.39% units from outdoor period to indoor period. Pasture operated farmed cow’s milk decreased in casein with 0.30% units from outdoor period to indoor period. Both conventional and pasture operated farming result in decrease in CN protein during indoors compared to outdoor period. Only 0.05% difference for indoor period for conventional farmed cows compared to pasture operated farmed cows was observed. Total CN for control milk sample was 83.28 %. The control was 0.54% lower than conventional farmed cow’s milk for outdoor period, but 2.85% higher than indoor period. The control was 2.6 % units higher for out-door period and 2.9% units higher than indoor period compared to pasture operat-ed farmed cow’s milk. Figure with casein protein for all four months can be found in Figure II, appendix 3.
Figure 1. Total whey proteins for different periods for different farming systems and bulk milk (control) from modern cows. The bars indicate standard deviation.
0
2
4
6
8
10
12
14
16
Outdoor period Indoor period Control
%
Total whey protein content
Pasture operated farming Conventional farming Control
20
4.3.2.1 β-CN The β-CN B, A1 and A2 for pasture operated farmed cow’s milk for outdoor pe-
riod was 4.72 %, 8.36 % and 31.73 %, respectively (Figure 3). The β-CN B, A1 and A2 for conventional farmed cow’s milk for outdoor period was 4.21 %, 12.04 % and 26.19 %, respectively. Pasture operated farmed cows had 0.51% units high-er β-CN B compared with conventional for outdoor period. Conventional farmed cows had 3.68% units higher β-CN A1 than pasture operated farmed cows for outdoor period. Pasture operated farmed cows had 5.54% higher β-CN A2 than conventional farmed cows for outdoor period.
70727476788082848688
Outdoor period Indoor period Contol
%
Total casein protein content
Pasture operated farming Conventional farming Control
Figure 2. Total casein proteins for different periods for different farming systems and bulk milk (control) from modern cows. The bars indicate standard deviation.
21
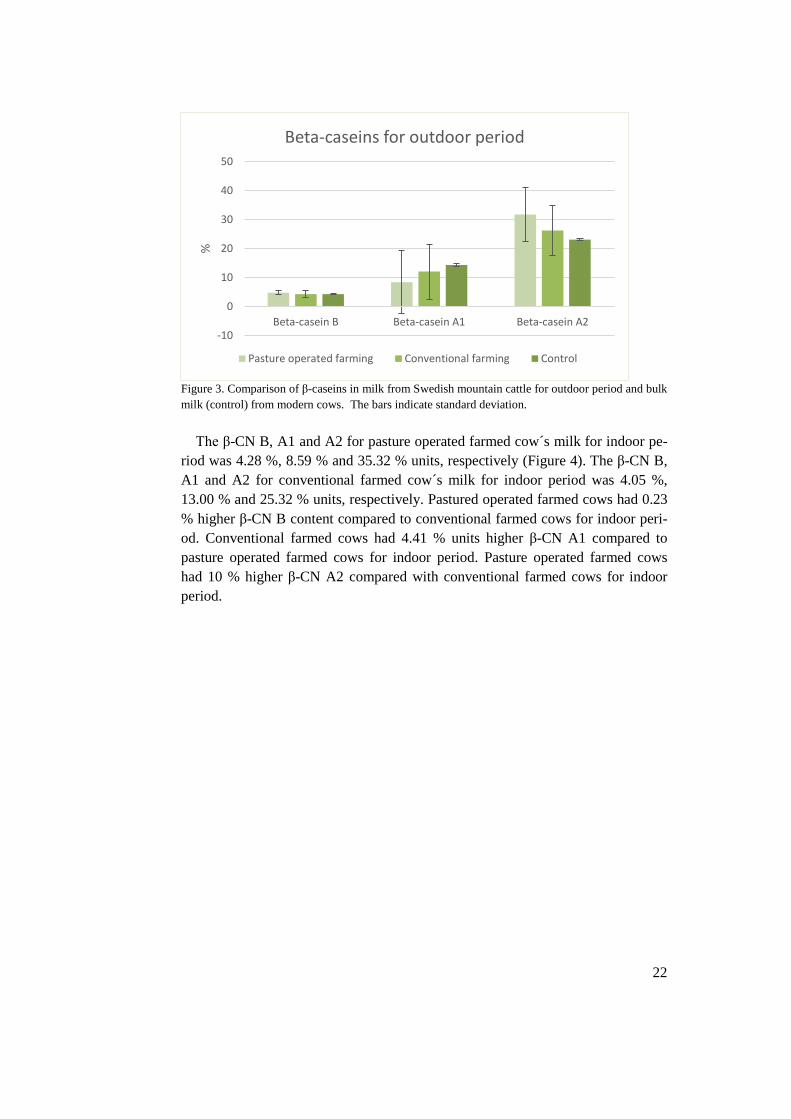
Figure 3. Comparison of β-caseins in milk from Swedish mountain cattle for outdoor period and bulk milk (control) from modern cows. The bars indicate standard deviation.
The β-CN B, A1 and A2 for pasture operated farmed cow´s milk for indoor pe-riod was 4.28 %, 8.59 % and 35.32 % units, respectively (Figure 4). The β-CN B, A1 and A2 for conventional farmed cow´s milk for indoor period was 4.05 %, 13.00 % and 25.32 % units, respectively. Pastured operated farmed cows had 0.23 % higher β-CN B content compared to conventional farmed cows for indoor peri-od. Conventional farmed cows had 4.41 % units higher β-CN A1 compared to pasture operated farmed cows for indoor period. Pasture operated farmed cows had 10 % higher β-CN A2 compared with conventional farmed cows for indoor period.
-10
0
10
20
30
40
50
Beta-casein B Beta-casein A1 Beta-casein A2
%
Beta-caseins for outdoor period
Pasture operated farming Conventional farming Control
22
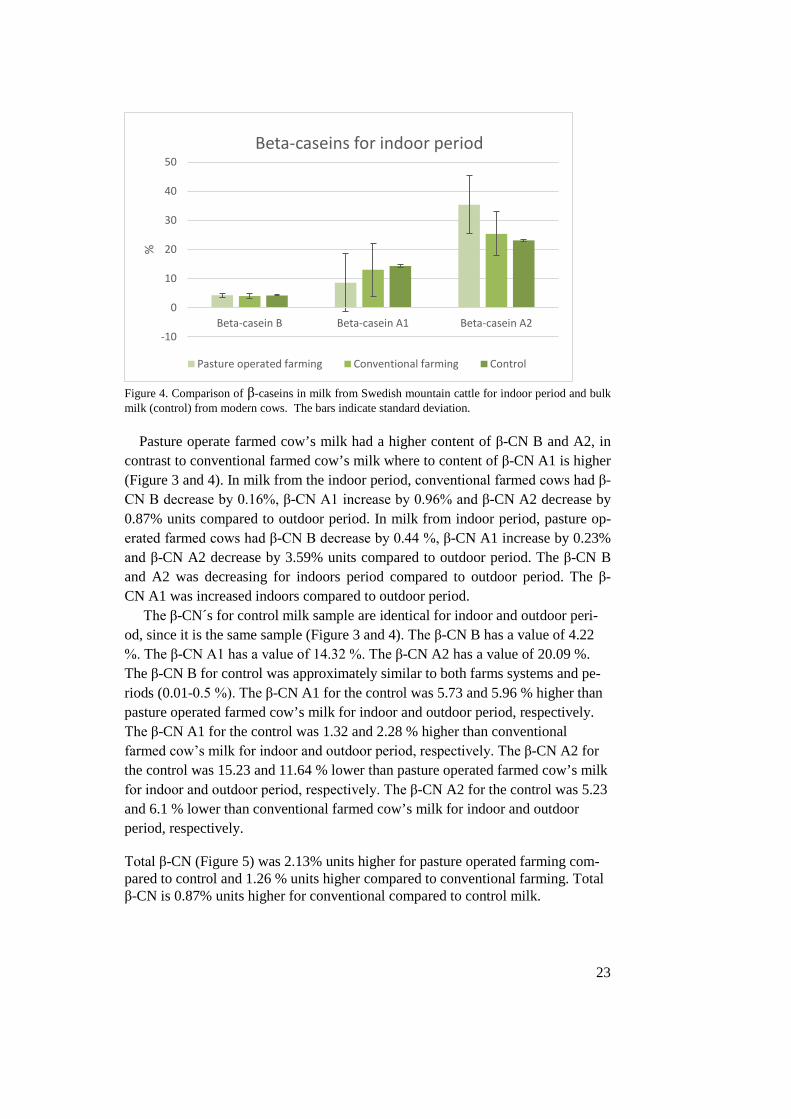
Figure 4. Comparison of β-caseins in milk from Swedish mountain cattle for indoor period and bulk milk (control) from modern cows. The bars indicate standard deviation.
Pasture operate farmed cow’s milk had a higher content of β-CN B and A2, in contrast to conventional farmed cow’s milk where to content of β-CN A1 is higher (Figure 3 and 4). In milk from the indoor period, conventional farmed cows had β-CN B decrease by 0.16%, β-CN A1 increase by 0.96% and β-CN A2 decrease by 0.87% units compared to outdoor period. In milk from indoor period, pasture op-erated farmed cows had β-CN B decrease by 0.44 %, β-CN A1 increase by 0.23% and β-CN A2 decrease by 3.59% units compared to outdoor period. The β-CN B and A2 was decreasing for indoors period compared to outdoor period. The β-CN A1 was increased indoors compared to outdoor period.
The β-CN´s for control milk sample are identical for indoor and outdoor peri-od, since it is the same sample (Figure 3 and 4). The β-CN B has a value of 4.22 %. The β-CN A1 has a value of 14.32 %. The β-CN A2 has a value of 20.09 %. The β-CN B for control was approximately similar to both farms systems and pe-riods (0.01-0.5 %). The β-CN A1 for the control was 5.73 and 5.96 % higher than pasture operated farmed cow’s milk for indoor and outdoor period, respectively. The β-CN A1 for the control was 1.32 and 2.28 % higher than conventional farmed cow’s milk for indoor and outdoor period, respectively. The β-CN A2 for the control was 15.23 and 11.64 % lower than pasture operated farmed cow’s milk for indoor and outdoor period, respectively. The β-CN A2 for the control was 5.23 and 6.1 % lower than conventional farmed cow’s milk for indoor and outdoor period, respectively.
Total β-CN (Figure 5) was 2.13% units higher for pasture operated farming com-pared to control and 1.26 % units higher compared to conventional farming. Total β-CN is 0.87% units higher for conventional compared to control milk.
-10
0
10
20
30
40
50
Beta-casein B Beta-casein A1 Beta-casein A2
%
Beta-caseins for indoor period
Pasture operated farming Conventional farming Control
23
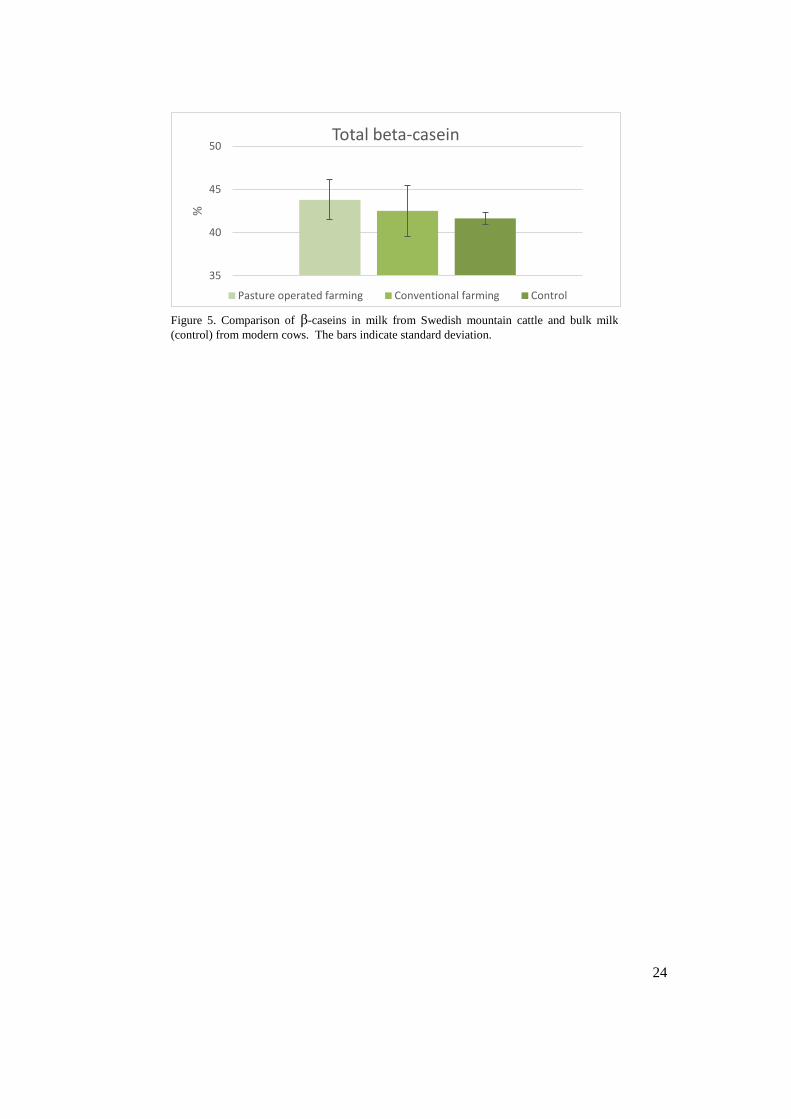
Figure 5. Comparison of β-caseins in milk from Swedish mountain cattle and bulk milk (control) from modern cows. The bars indicate standard deviation.
35
40
45
50
%
Total beta-casein
Pasture operated farming Conventional farming Control
24
5 Discussion This was an investigation of milk proteins from Swedish mountain cattle. The number of individuals in the study was 4-6 cows for pasture farming and 11 cows for conventional farming. Despite the low number of animals, this survey can give an indication of the parameters analyzed. For better significance however, bigger number of cows would be needed.
5.1 Milk composition data The milk composition for SKB from cattle statistics was 4.45 % fat and 3.56 % protein (Table II, see appendix 1). The milk composition for the Swedish moun-tain cows in this study was 4.10 % total fat and 3.58 % total protein for conven-tional farming and 4.63 % total fat and 3.91 % total protein for pasture operated farming (Table 4). This is in agreement of the average levels of total- protein and fat shown by statistics of cattle breeds in Sweden (Table I, see appendix 1). The conventional cattle have double as high number of somatic cells in the milk than the pasture operated (Table 4). This could be due to differences in the farm man-agement, where the conventional farm includes more individual’s lead to a higher infection pressure.
5.2 Genotype data The results from genotype analysis for pasture-operated farming were confirmed by protein profile analysis (Table 5). In two cases from the conventional farming, low expression of β-CN A1 was observed despite the A2 genotype. The levels of β-CN A2 were however 75% higher in this individuals. In one case the genotype did not coincide with the expressed proteins (Table 6). Possible explanation is that
25
the samples were mixed up during handling. New milk samples for the protein analyses would be needed in order to clarify this issue.
5.3 Protein analysis The pasture operated farming gave higher in total whey protein content for both indoor and outdoor period (Figure 1). The conventional farming decreased 3.39 % in CN and pasture operated farming decrease 0.30% from outdoor to indoor period (Figure 2). The conventional farmed cow’s milk had 3.14% higher CN for outdoor period and only 0.05% higher for indoor period than pasture operated farmed cows. Pasture operated farmed cows had a higher β-CN B and A2, but lower β-CN A1 than conventional farmed cows. β-CN B and A2 decreased, but β-CN A1 in-creased for indoor period compared to outdoor period.
The differences between the periods can be explained by the stage of lactation (Table III, appendix 1). It has been shown previously that there is a variation in protein levels during lactation stage (Walstra 1999). The indoor period is connect-ed to late lactation for pasture operated farm cows and for half of the conventional farms cows. For half of conventional farm cows, the indoor period is middle lacta-tion. However, it is not known how the lactation period affects the milk composi-tion in Swedish mountain cattle. However, these differences in protein profile in the milk between pasture operated farmed and conventional farmed cows seems unlikely to be caused by different feed intake, since different feed content has been shown to have no effect on protein profile according to the report from Johansson et al. (2013). One reason for the differences in protein levels could be that these two farms have genetic differences within their breed. It is known that there are a few different blood lines according to Nilsson (2006). Up to day however, the protein profile of the different lines has not been investigated and therefore the knowledge is poor. Interestingly, the Swedish mountain cattle showed to have higher amount of the total β-CN compare to the control milk (Table 5). Compared to the control (Table 3 and 4) Swedish mountain cattle had approximately the same amount of β-CN B, a higher amount of β-CN A2 and lower amount of β-CN A1 than the control bulk milk. For total whey protein, pasture operated farmed cows and control bulk milk sample showed no difference, but had approximately 15 % higher whey protein content than conventional farmed cows (Figure 1). The control milk was bulk milk available in the Swedish stores. As the amount of Swedish mountain cattle represent only 0.3 %, one can assume that the bulk milk represents the modern breeds.
26
6 Conclusion
This study investigated the milk protein profile in Swedish mountain cattle from two different farms for both outdoor and indoor periods. The pasture operated farmed cow’s milk had a higher total whey protein content than conventional farming cow’s milk. For total whey protein the difference between indoor and outdoor was very low for both farms. The conventional farmed cow’s milk indi-cated a decrease from outdoor to indoor period for total caseins compared to pas-ture operated farmed cows. Milk from the pasture operated farm had a higher β-CN B and A2, but lower β-CN A1 than milk from conventional farming. The β-CN B and A2 decreased and β-CN A1 increased during the indoor period com-pared to outdoor period. Milk from pasture operated farm had higher β-CN B lev-els than milk from conventional farming. Despite the management of the farms, milk from Swedish native mountain cattle contains higher levels of total β-CN, lower of β-CN A1 and higher β-CN A2 compared to modern breeds (control).
27
7 Acknowledgements
I would like to thank the farmers Anna Jansdotter from Sparreholm and Robert Nilsson from Boden that participated with milk samples and information about what their cows were fed and info from the Växa Sverige milk analysis for the cows.
I would like to thank Kristina Belfrage from Svensk fjällrasavel for writing an application to be able to finance this project.
I would also like to thank for the data from gen-sequencing of these cows from Tomas Bergström.
I would also like to thank Jonas Ohlsson for preparing samples for august. I would like to thank Monika Johansson for being my mentor in this study.
28
References Alskog, A. & Berg, M. (1995). Majros: om svenska kor i våra hjärtan. Stockholm: LTs förlag. pp.
53-62 Cattle statistics (2016), source: Växa Sverige.
Availible: http://vxa.se/Global/Dokument/Dokument/%C3%96vrigt/Husdjursstatistik2016.pdf [2016-05-08]
Christian, E. & Vaclavik, V. (2014). Essentials of Food Science, 4. ed. New York: Springer science.
pp. 201-229. Coultate, T.P. (2009). Food: The Chemistry of its Components, 5. ed. Cambridge: Royal Society of
Chemistry. pp. 176-177. Hallander, H. (1989). Svenska lantraser-deras betydelse förr och nu. Dejavu. pp. 186-240. Johansson, M., Placha, O., Pickova, J., Andrén, A., Zamaratskaia, G., Spörndly, E. & Åkerstedt, M.
(2013). Impact of crude protein content in silage and concentrate on protein and fatty acid pro-files in bovine milk. Czech Journal Animal Science. vol. 58 (7): pp. 304–312
Johansson, M., Åkerstedt, M., Li, S., Zamaratskaia, G. & Lundh, Å. (2013). Casein breakdown in
bovine milk by a field strain of Staphylococcus aureus. Journal of Food Protection. vol. 76 pp. 1638-1642
Jordbruksverket (2016-05-09), Betesgång och utevistelse.
ble: http://www.jordbruksverket.se/amnesomraden/djur/olikaslagsdjur/notkreatur/betesgangochutevistelse/djurformjolkproduktion.4.17f5bc3614d8ea10709196ae.html [2016-05-15]
Lien, S., Kantanen, J., Olsaker, I., Holm, L-E., Eythorsdottir, E., Sandberg, K., Dalsgard, B. &
Adalsteinsson, S. (1999). Comparison of milk protein allele frequencies in Nordic cattle breeds. Animal Genetics. vol. 30 pp. 85-91
Nilsson, R. (2006). Fjällkon- historik, avel och framtid. Luleå: GTC print AB. pp. 5-26, 83-102, 181-
195.
29
Nordens ark, Fjällko. Available: http://nordensark.se/vara-djur/lantraser/ [2016-05-15] Ortman, T. (2015). När man talar om korna… - Diskursiva positioneringar av svenska lantraskor för
produktion och bevarande. Sveriges lantbruksuniversitet. Instutitionen för stad och land/ Lands-bygdsutveckling-agronomprogrammet (fördjupningsarbete 2015)
Reivell, G-B. & Marklinder, I. (2014) Mjölk och mjölkprodukter I: Nylander A, Jonsson L, Marklin-
der I, Nydahl M. (2014). Livsmedelsvetenskap, 2 ed. Lund: Studentlitteratur AB. pp. 278-284 Walstra, P., Geurts, T. J., Noomen, A., Jellema, A. & van Boekel, M. A. J. S. (1999). Dairy technol-
ogy: principles of milk properties and processes. New Tork: Marcel Dekker Inc. pp.3-26, 71-91, 107-147, 541-638
Östensson, H. (2013). Små kor med högvärdigt protein. Svea jord och skog. vol. 3, p. 32.
30
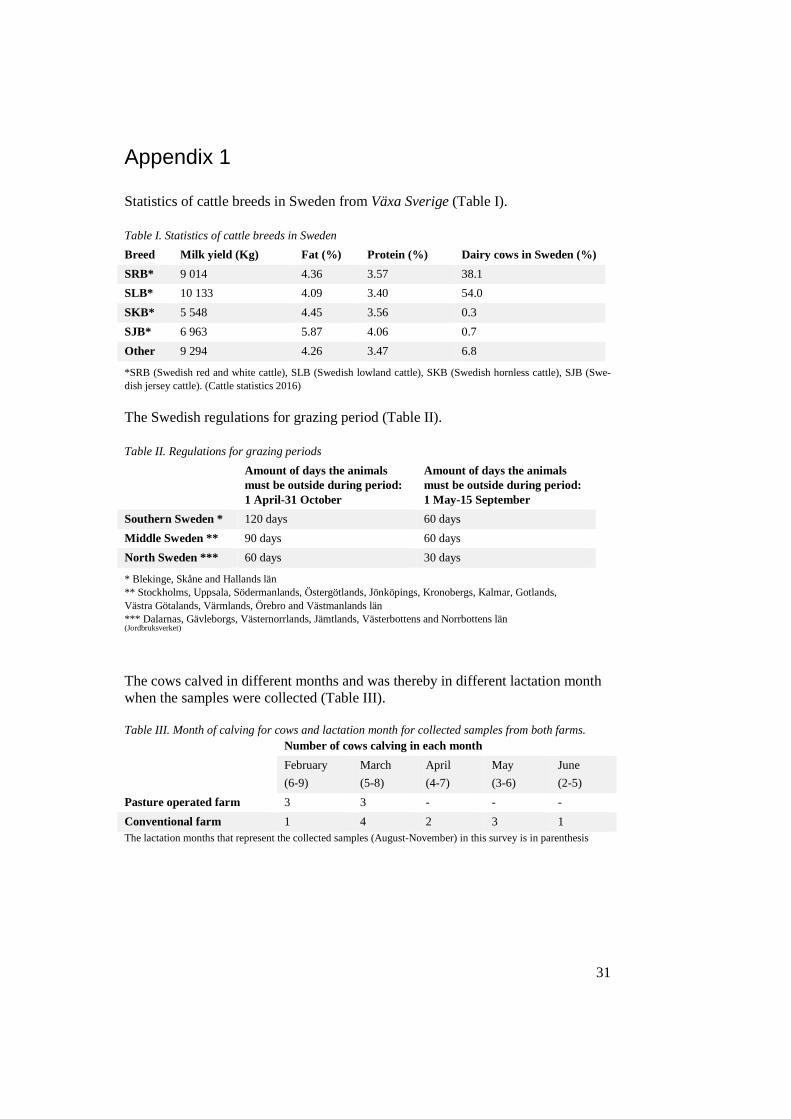
Appendix 1 Statistics of cattle breeds in Sweden from Växa Sverige (Table I).
Table I. Statistics of cattle breeds in Sweden Breed Milk yield (Kg) Fat (%) Protein (%) Dairy cows in Sweden (%) SRB* 9 014 4.36 3.57 38.1 SLB* 10 133 4.09 3.40 54.0 SKB* 5 548 4.45 3.56 0.3 SJB* 6 963 5.87 4.06 0.7 Other 9 294 4.26 3.47 6.8
*SRB (Swedish red and white cattle), SLB (Swedish lowland cattle), SKB (Swedish hornless cattle), SJB (Swe-dish jersey cattle). (Cattle statistics 2016) The Swedish regulations for grazing period (Table II).
Table II. Regulations for grazing periods Amount of days the animals
must be outside during period: 1 April-31 October
Amount of days the animals must be outside during period: 1 May-15 September
Southern Sweden * 120 days 60 days Middle Sweden ** 90 days 60 days North Sweden *** 60 days 30 days
* Blekinge, Skåne and Hallands län ** Stockholms, Uppsala, Södermanlands, Östergötlands, Jönköpings, Kronobergs, Kalmar, Gotlands, Västra Götalands, Värmlands, Örebro and Västmanlands län *** Dalarnas, Gävleborgs, Västernorrlands, Jämtlands, Västerbottens and Norrbottens län (Jordbruksverket)
The cows calved in different months and was thereby in different lactation month when the samples were collected (Table III). Table III. Month of calving for cows and lactation month for collected samples from both farms. Number of cows calving in each month
February (6-9)
March (5-8)
April (4-7)
May (3-6)
June (2-5)
Pasture operated farm 3 3 - - - Conventional farm 1 4 2 3 1 The lactation months that represent the collected samples (August-November) in this survey is in parenthesis
31
Appendix 2
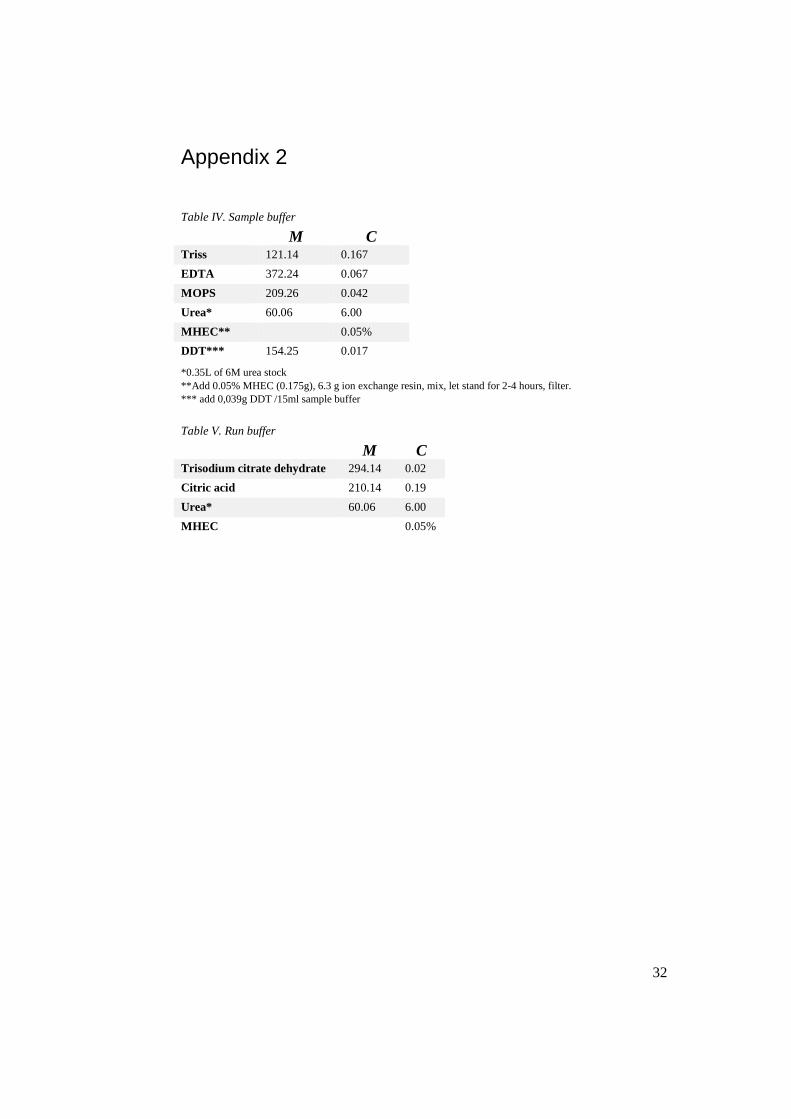
Table IV. Sample buffer
M C Triss 121.14 0.167 EDTA 372.24 0.067 MOPS 209.26 0.042 Urea* 60.06 6.00 MHEC** 0.05% DDT*** 154.25 0.017
*0.35L of 6M urea stock **Add 0.05% MHEC (0.175g), 6.3 g ion exchange resin, mix, let stand for 2-4 hours, filter. *** add 0,039g DDT /15ml sample buffer
Table V. Run buffer
M C Trisodium citrate dehydrate 294.14 0.02 Citric acid 210.14 0.19 Urea* 60.06 6.00 MHEC 0.05%
32
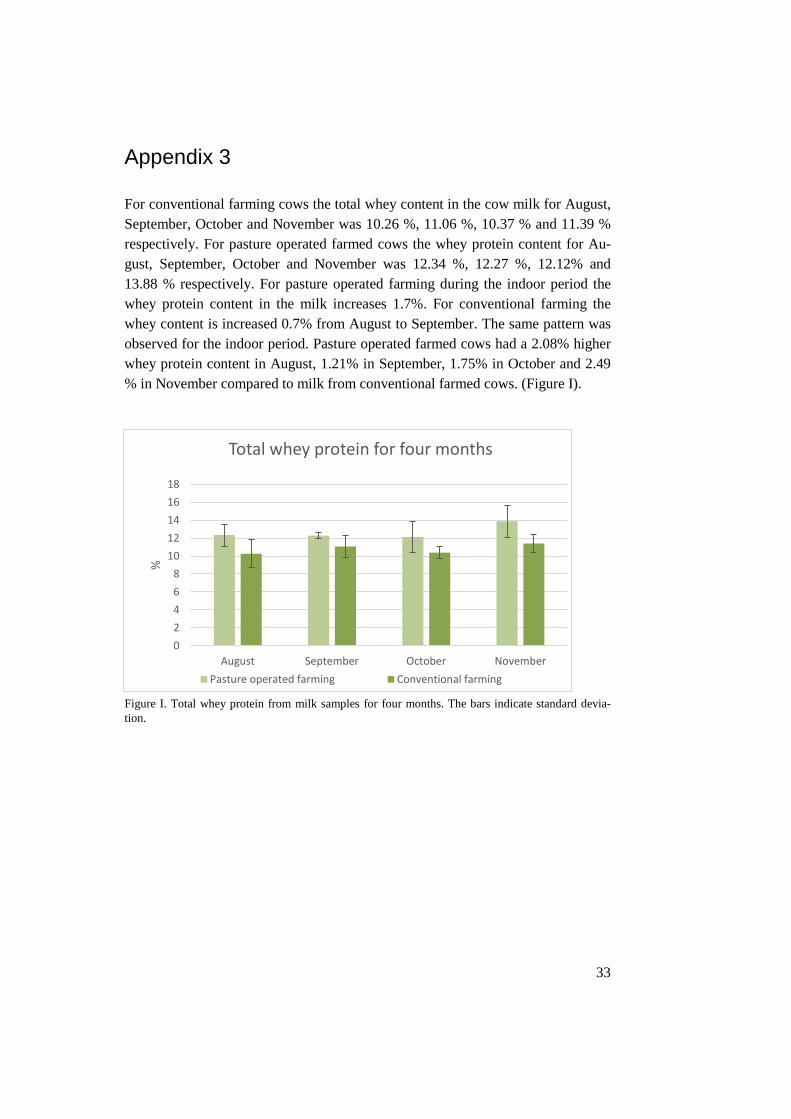
Appendix 3 For conventional farming cows the total whey content in the cow milk for August, September, October and November was 10.26 %, 11.06 %, 10.37 % and 11.39 % respectively. For pasture operated farmed cows the whey protein content for Au-gust, September, October and November was 12.34 %, 12.27 %, 12.12% and 13.88 % respectively. For pasture operated farming during the indoor period the whey protein content in the milk increases 1.7%. For conventional farming the whey content is increased 0.7% from August to September. The same pattern was observed for the indoor period. Pasture operated farmed cows had a 2.08% higher whey protein content in August, 1.21% in September, 1.75% in October and 2.49 % in November compared to milk from conventional farmed cows. (Figure I).
Figure I. Total whey protein from milk samples for four months. The bars indicate standard devia-tion.
02468
1012141618
August September October November
%
Total whey protein for four months
Pasture operated farming Conventional farming
33
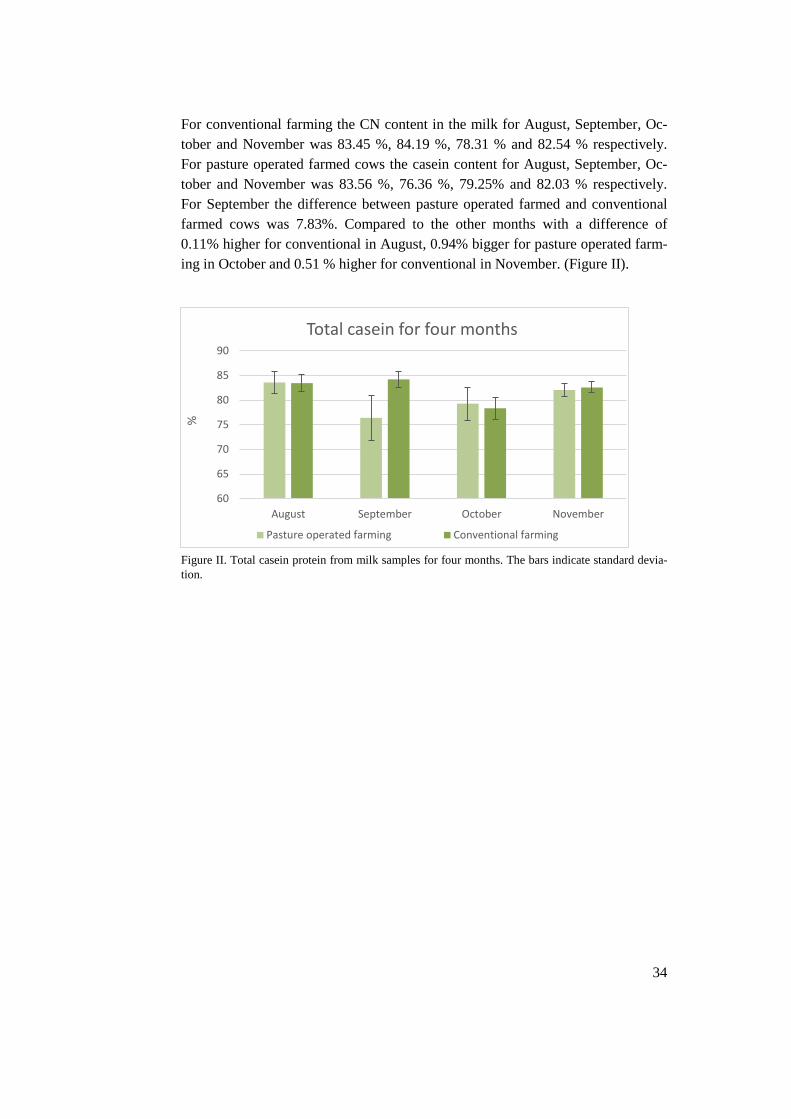
For conventional farming the CN content in the milk for August, September, Oc-tober and November was 83.45 %, 84.19 %, 78.31 % and 82.54 % respectively. For pasture operated farmed cows the casein content for August, September, Oc-tober and November was 83.56 %, 76.36 %, 79.25% and 82.03 % respectively. For September the difference between pasture operated farmed and conventional farmed cows was 7.83%. Compared to the other months with a difference of 0.11% higher for conventional in August, 0.94% bigger for pasture operated farm-ing in October and 0.51 % higher for conventional in November. (Figure II).
Figure II. Total casein protein from milk samples for four months. The bars indicate standard devia-tion.
60
65
70
75
80
85
90
August September October November
%
Total casein for four months
Pasture operated farming Conventional farming
34