Embed Size (px)
Citation preview
SWOT measurements for understanding water related disasters
Jun Magome, Kuniyoshi Takeuchi, Kazuhiko Fukami and Pham Thanh Hai
ICHARM International Center for Water Hazard and Risk Management under the auspices of UNESCO hosted by PWRI, Tsukuba
2
Short IntroductionRelated Research to SWOT
- Reservoir Storage Monitoring using Satellite Observations.
1st Dam Database Workshop 3
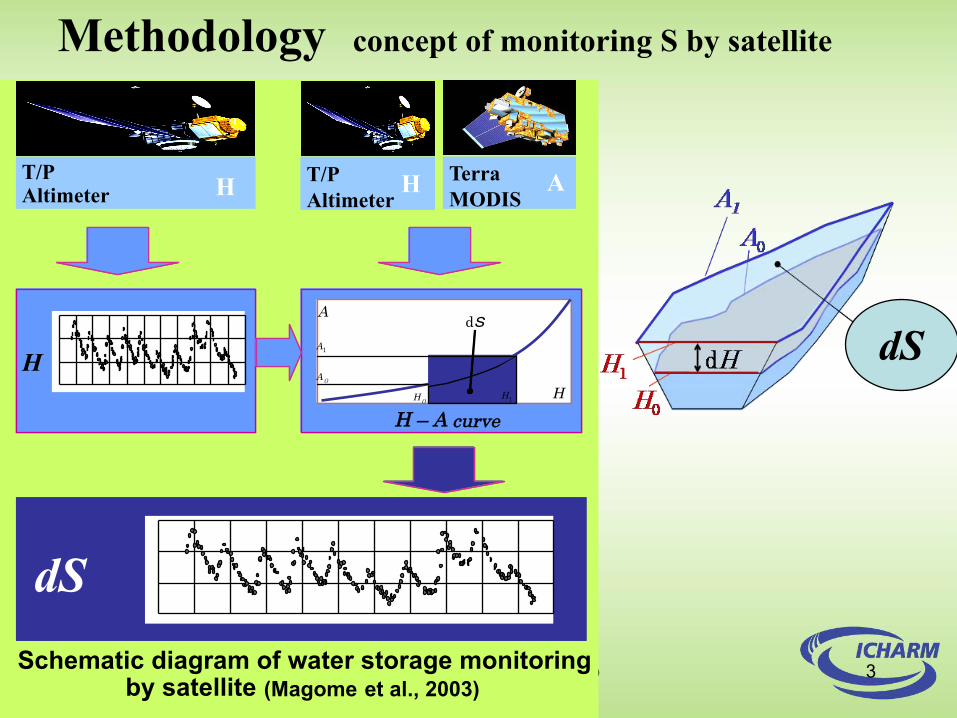
Methodology concept of monitoring S by satellite
dV
T/PAltimeter
TerraMODISH A
A
H0
A0
A1
dV
H – A curveH
H
T/P Altimeter
H
H1
dS
T/PAltimeter
TerraMODISH A
A
H0
A0
A1
dS
H – A curveH
H
T/P Altimeter
H
H1
Schematic diagram of water storage monitoring by satellite (Magome et al., 2003)
dS
1st Dam Database Workshop 4
!(
!(
!(
!(
!(
!(
!(
!(
!(
!(!(
!(!(
!(
!(
!(!( !(
!(
!(
!(
!(
!(
!(
!(
!(
!(
!(
!(
!(
!(
!(
!(
!(
TanaGuri
ChadVolta
Mweru
WoodsHuron
Vanern
Powell
Nasser
Malawi
Khanka
Kariba
Gaoyou
Turkana
Hovsgol
Victoria
Chiquita
Aral SeaWinnebago
Tonle Sap
Tanganyik
SaltonSea
Mangueira
Diefenbak
Cocibolca
Chardarin
Rybinskoye
KiyevskoyeIjsselmeer
Cabora Bassa
Kremenshukoye
Kainji
Zeyskoye
D iefenbak
-1.5
-0.5
0.5
1.5
1992 1993 1994 1995 1996 1997 1998 1999 2000 2001 2002 2003 2004
⊿V(km3)
H uron
-50
-30
-10
10
30
50
1992 1993 1994 1995 1996 1997 1998 1999 2000 2001 2002 2003 2004
⊿V(km3)
C ocibolca
-6-4-12479
1992 1993 1994 1995 1996 1997 1998 1999 2000 2001 2002 2003 2004
⊿V(km3)
G uri
-40
-25
-10
5
20
1992 1993 1994 1995 1996 1997 1998 1999 2000 2001 2002 2003 2004
⊿V(km3)
A sw an
-30
0
30
60
90
1992 1993 1994 1995 1996 1997 1998 1999 2000 2001 2002 2003 2004
⊿V(km3)
Turkana
-10
0
10
20
30
1992 1993 1994 1995 1996 1997 1998 1999 2000 2001 2002 2003 2004
⊿V(km3)
C hardarinskoye
-4
-2
0
2
1992 1993 1994 1995 1996 1997 1998 1999 2000 2001 2002 2003 2004
⊿V(km3)
G aoyou
-0.004
-0.003
-0.002
-0.001
0.000
0.001
1992 1993 1994 1995 1996 1997 1998 1999 2000 2001 2002 2003 2004
⊿V(km3)
Krem enshugskoye
-4
-2
0
2
4
6
1992 1993 1994 1995 1996 1997 1998 1999 2000 2001 2002 2003 2004
⊿V(km3)
V anern
-4
-2
0
2
4
6
1992 1993 1994 1995 1996 1997 1998 1999 2000 2001 2002 2003 2004
⊿V(km3)
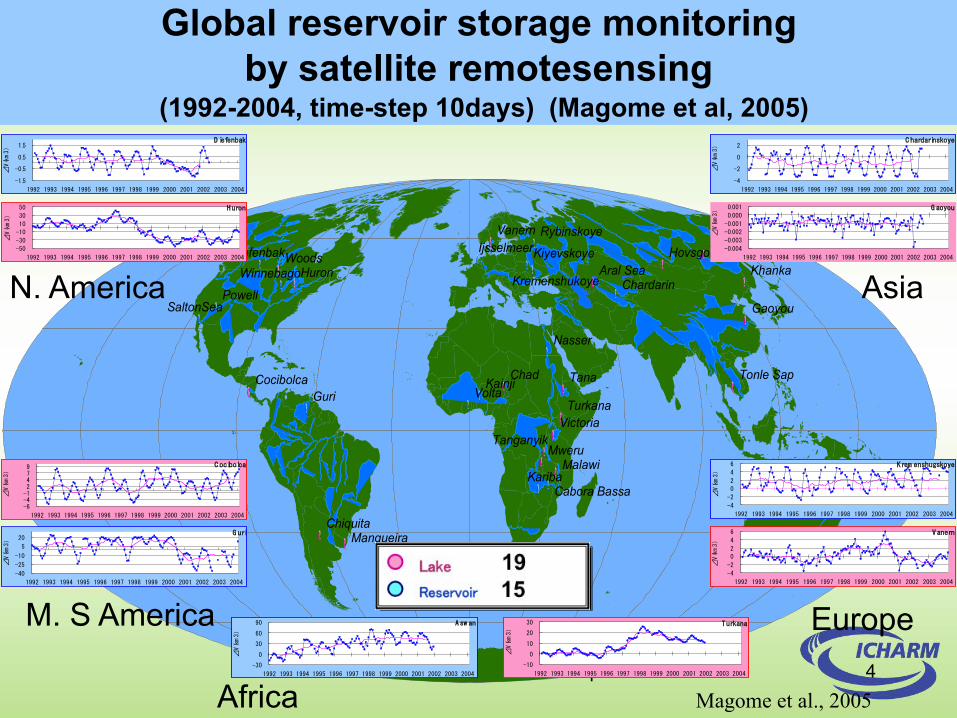
N. America
M. S America
Africa
Europe
Asia
Global reservoir storage monitoring by satellite remotesensing
(1992-2004, time-step 10days) (Magome et al, 2005)
湖沼 19地点ダム貯水池 15地点
Magome et al., 2005
5
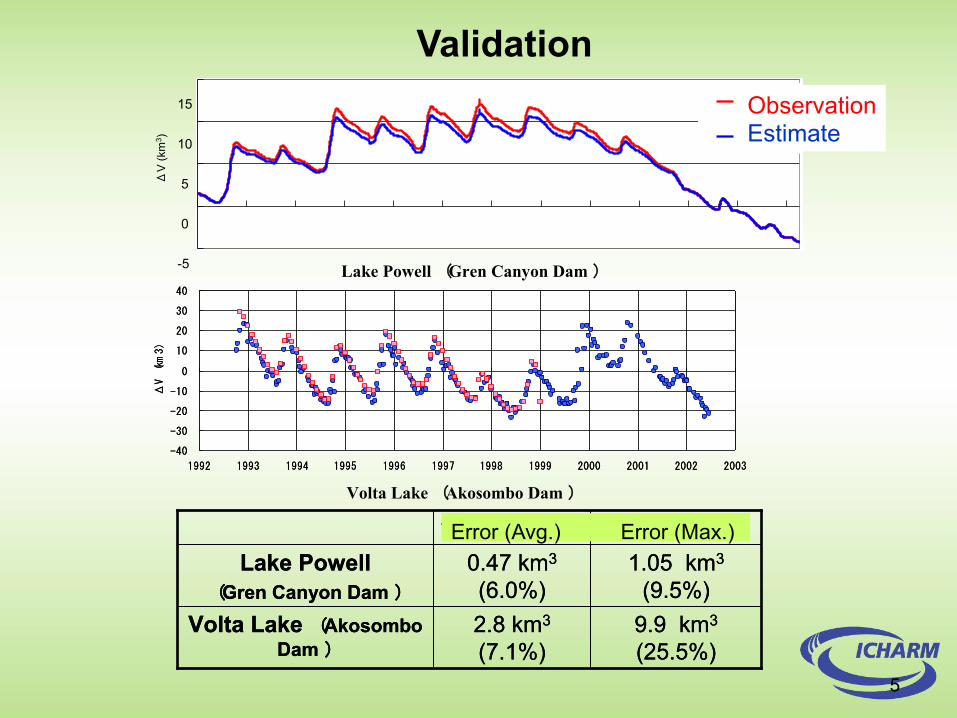
Validation
-5
0
5
10
15
92/10/3
93/10/3
94/10/3
95/10/3
96/10/3
97/10/3
98/10/3
99/10/3
00/10/3
01/10/3
02/10/3
03/10/3
04/10/3
⊿V(km3)
実測値
推定値
Lake Powell (Gren Canyon Dam )
-40
-30
-20
-10
0
10
20
30
40
1992 1993 1994 1995 1996 1997 1998 1999 2000 2001 2002 2003
ΔV (km3)
-40
-30
-20
-10
0
10
20
30
40
1992 1993 1994 1995 1996 1997 1998 1999 2000 2001 2002 2003
ΔV (km3)
15
10
5
0
-5
Volta Lake (Akosombo Dam )
ΔV
(km
3 )
9.9 km3
(25.5%)2.8 km3
(7.1%)Volta Lake (Akosombo
Dam )
1.05 km3
(9.5%)0.47 km3
(6.0%)Lake Powell
(Gren Canyon Dam )
誤差最大値誤差平均
9.9 km3
(25.5%)2.8 km3
(7.1%)Volta Lake (Akosombo
Dam )
1.05 km3
(9.5%)0.47 km3
(6.0%)Lake Powell
(Gren Canyon Dam )
誤差最大値誤差平均Error (Avg.) Error (Max.)
ObservationEstimate

SWOT measurements for understanding water related disasters
Jun Magome, Kuniyoshi Takeuchi, Kazuhiko Fukami and Pham Thanh Hai
ICHARM International Center for Water Hazard and Risk Management under the auspices of UNESCO hosted by PWRI, Tsukuba
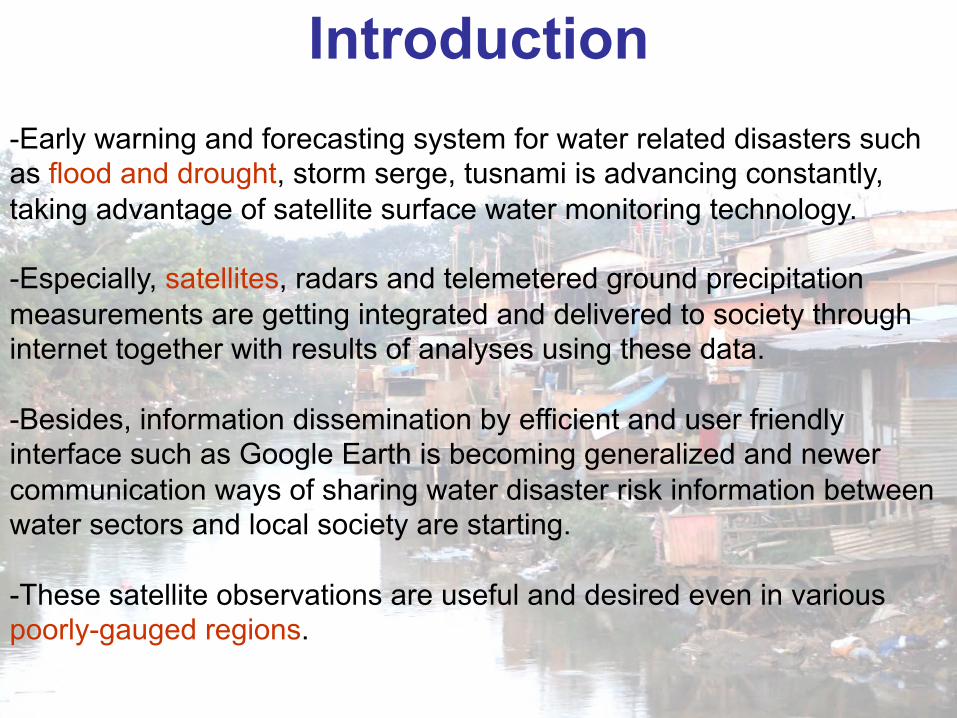
-Early warning and forecasting system for water related disasters such as flood and drought, storm serge, tusnami is advancing constantly, taking advantage of satellite surface water monitoring technology.
-Especially, satellites, radars and telemetered ground precipitation measurements are getting integrated and delivered to society through internet together with results of analyses using these data.
-Besides, information dissemination by efficient and user friendly interface such as Google Earth is becoming generalized and newer communication ways of sharing water disaster risk information between water sectors and local society are starting.
-These satellite observations are useful and desired even in various poorly-gauged regions.
Introduction
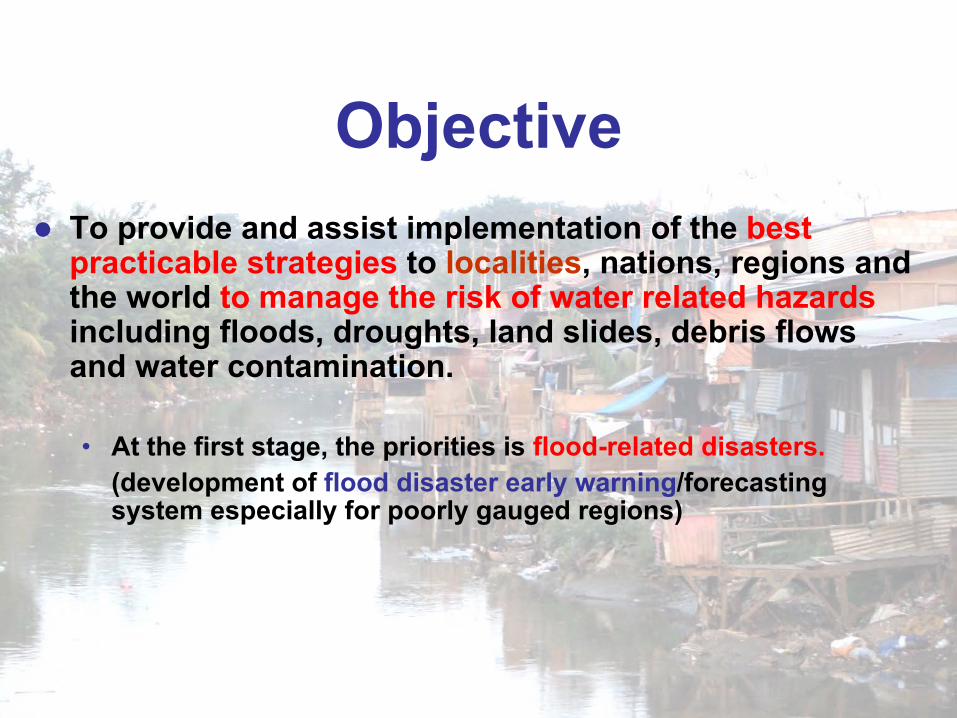
Objectivel To provide and assist implementation of the best
practicable strategies to localities, nations, regions and the world to manage the risk of water related hazards including floods, droughts, land slides, debris flows and water contamination.
• At the first stage, the priorities is flood-related disasters.(development of flood disaster early warning/forecasting system especially for poorly gauged regions)
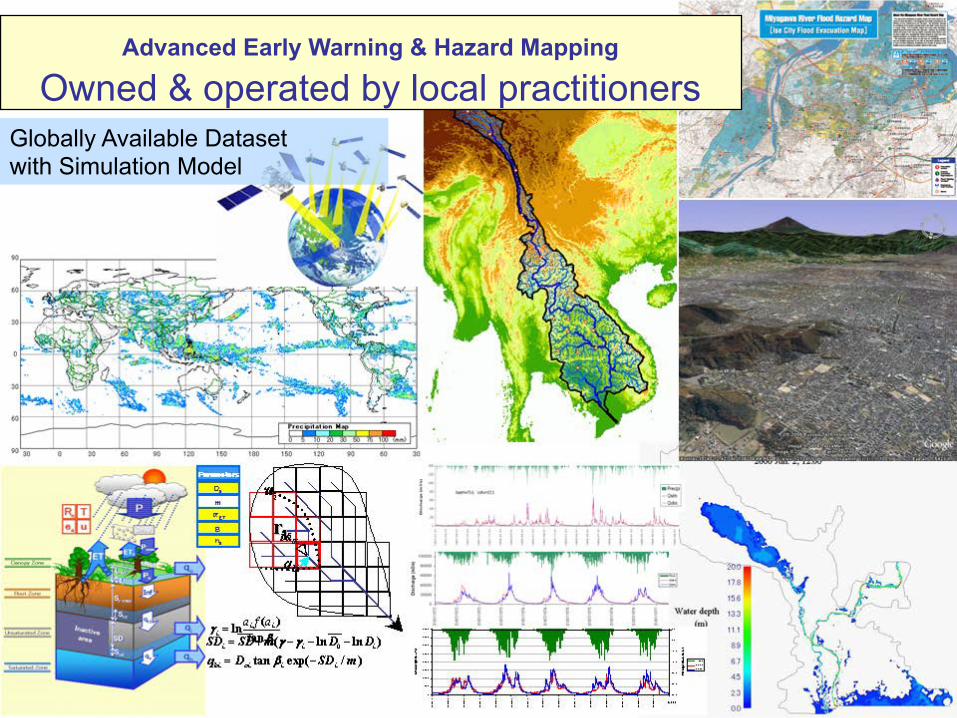
Advanced Early Warning & Hazard Mapping
Owned & operated by local practitionersGlobally Available Datasetwith Simulation Model
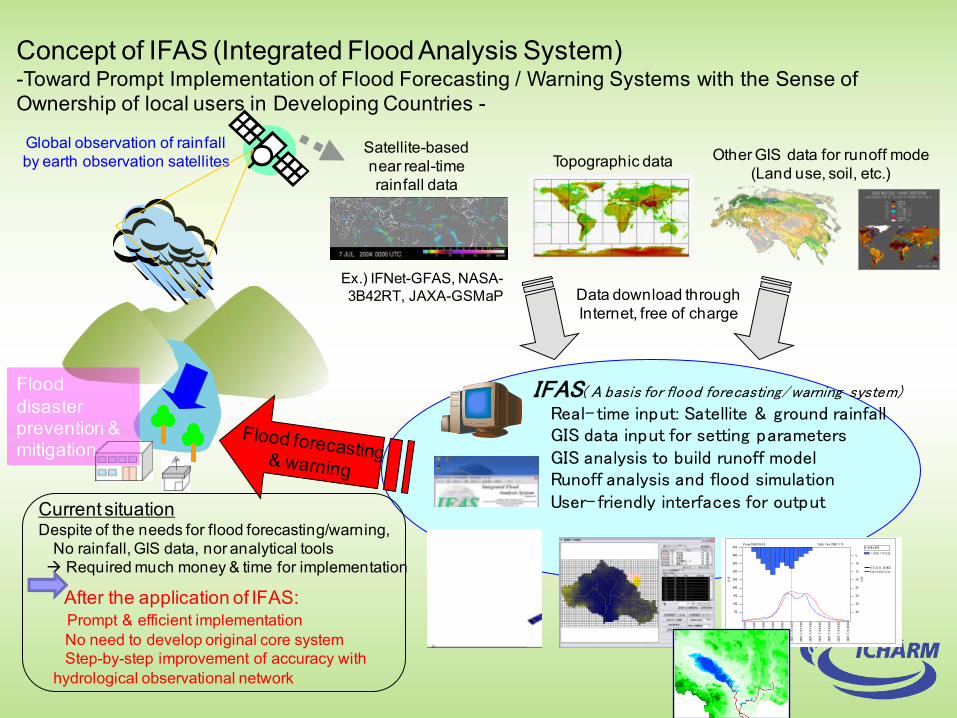
Concept of IFAS (Integrated Flood Analysis System) -Toward Prompt Implementation of Flood Forecasting / Warning Systems with the Sense of Ownership of local users in Developing Countries -
Global observation of rainfallby earth observation satellites Other GIS data for runoff mode
(Land use, soil, etc.)
IFAS( A basis for flood forecasting/warning system)
Real- time input: Satellite & ground rainfallGIS data input for setting parametersGIS analysis to build runoff modelRunoff analysis and flood simulationUser- friendly interfaces for output
5
10
15
20
25
30
35
40
2007/7/9 0:00
2007/7/9 2:00
2007/7/9 4:00
2007/7/9 6:00
2007/7/9 8:00
2007/7/9 10:00
2007/7/9 12:00
2007/7/9 14:00
2007/7/9 16:00
2007/7/9 18:00
2007/7/9 19:00
2007/7/9 20:00
450
400
350
300
雨量
50
流量 250
200
150
100
Project:ABC D EFG D ate Tim e:2007/7/9G rid No:482
上流域平均雨量
河道流量 (G 482)
○○実績河道流
Data download throughInternet, free of charge
Flood disaster prevention & mitigation
Topographic dataSatellite-based near real-time rainfall data
Current situationDespite of the needs for flood forecasting/warning,
No rainfall, GIS data, nor analytical toolsà Required much money & time for implementation
After the application of IFAS:Prompt & efficient implementationNo need to develop original core systemStep-by-step improvement of accuracy with
hydrological observational network
Ex.) IFNet-GFAS, NASA-3B42RT, JAXA-GSMaP
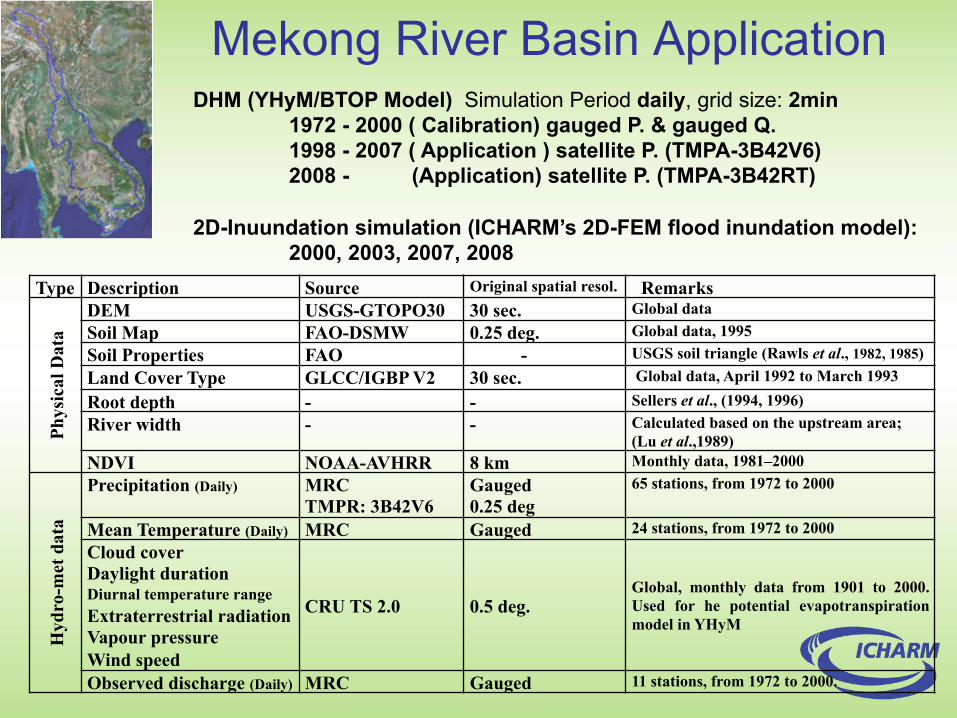
Mekong River Basin ApplicationDHM (YHyM/BTOP Model) Simulation Period daily, grid size: 2min
1972 - 2000 ( Calibration) gauged P. & gauged Q.1998 - 2007 ( Application ) satellite P. (TMPA-3B42V6)2008 - (Application) satellite P. (TMPA-3B42RT)
2D-Inuundation simulation (ICHARM’s 2D-FEM flood inundation model): 2000, 2003, 2007, 2008
Type Description Source Original spatial resol. Remarks
Phys
ical
Dat
a
DEM USGS-GTOPO30 30 sec. Global dataSoil Map FAO-DSMW 0.25 deg. Global data, 1995Soil Properties FAO - USGS soil triangle (Rawls et al., 1982, 1985)Land Cover Type GLCC/IGBP V2 30 sec. Global data, April 1992 to March 1993
Root depth - - Sellers et al., (1994, 1996)River width - - Calculated based on the upstream area;
(Lu et al.,1989)NDVI NOAA-AVHRR 8 km Monthly data, 1981–2000
Hyd
ro-m
et d
ata
Precipitation (Daily) MRCTMPR: 3B42V6
Gauged0.25 deg
65 stations, from 1972 to 2000
Mean Temperature (Daily) MRC Gauged 24 stations, from 1972 to 2000Cloud coverDaylight durationDiurnal temperature rangeExtraterrestrial radiationVapour pressureWind speed
CRU TS 2.0 0.5 deg.Global, monthly data from 1901 to 2000.Used for he potential evapotranspirationmodel in YHyM
Observed discharge (Daily) MRC Gauged 11 stations, from 1972 to 2000.
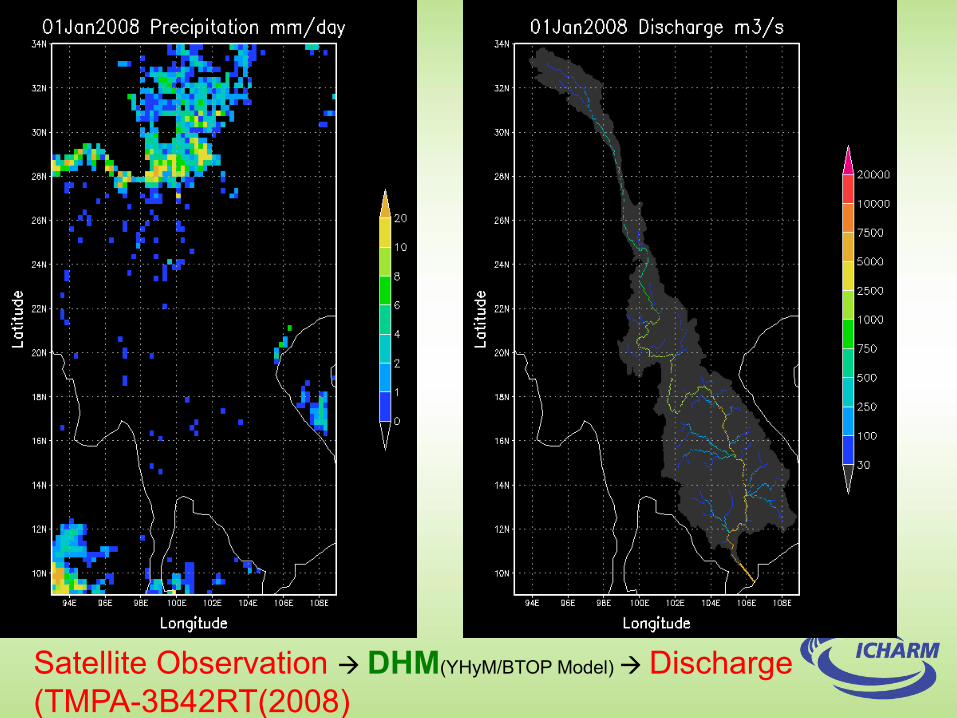
Satellite Observation à DHM(YHyM/BTOP Model) à Discharge(TMPA-3B42RT(2008)
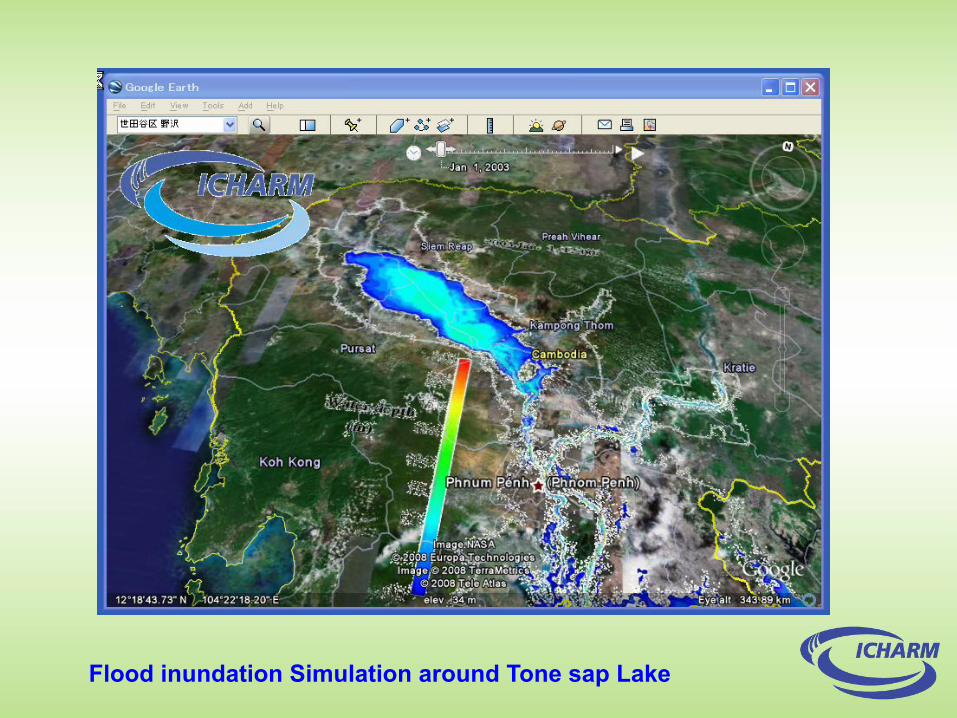
Flood inundation Simulation around Tone sap Lake
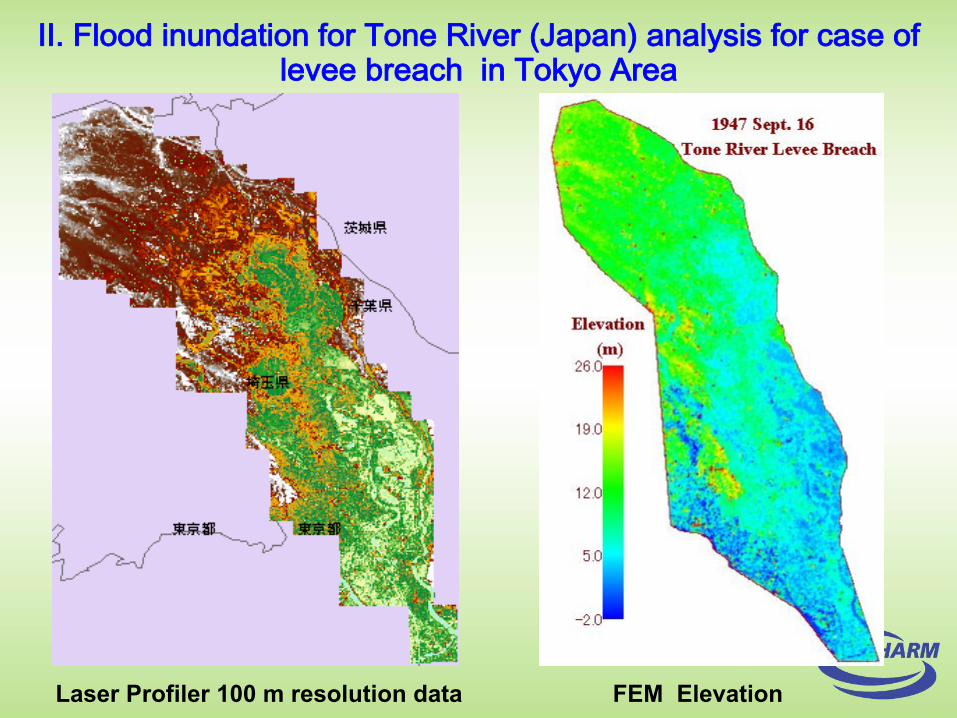
II. Flood inundation for Tone River (Japan) analysis for case of levee breach in Tokyo Area
Laser Profiler 100 m resolution data FEM Elevation
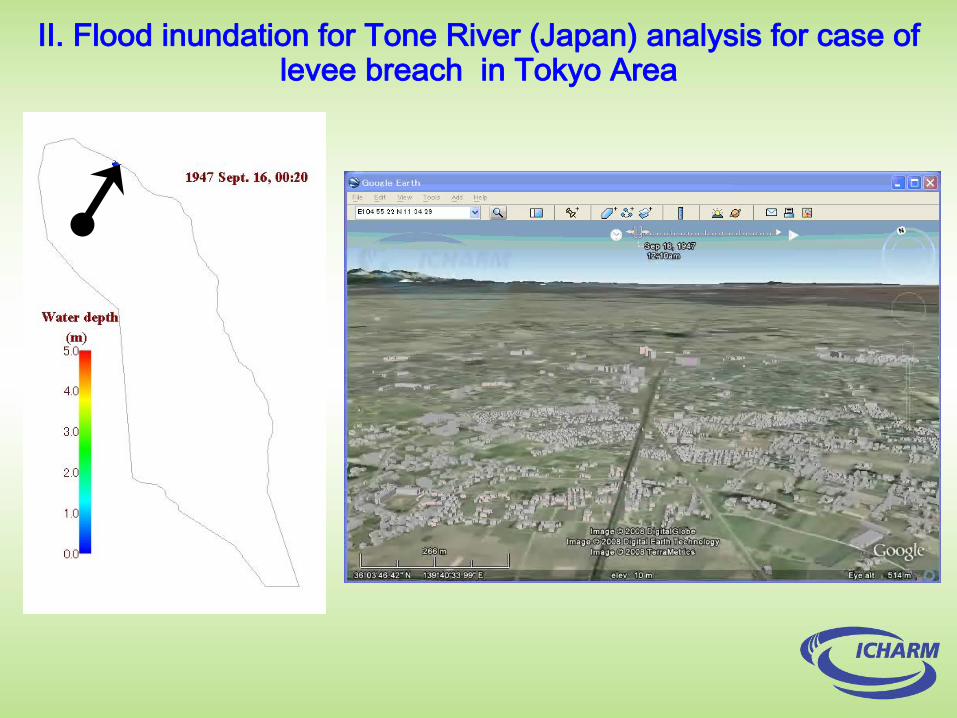
II. Flood inundation for Tone River (Japan) analysis for case of levee breach in Tokyo Area

• to implement effective water related disaster management (for flood, drought (incl. cyclone) , storm serge, tusnami and so on) by local water sectors, measurements of water surface elevation and water storage change or discharge in higher temporal resolution and spatial resolution by SWOT are very useful especially data poor and large international river basins (e.g. Mekong River Basin, Euphrates river)
- It will be very helpful for water related disaster management to detect and monitor the inundated area and depth directory for flood disasters without influence of clouds with more reliable.
- For early warning and forecasting system, accurate elevations as well as hydrological information by SWOT make DHMs and flood inundation models more effectively for flood disaster management sectors.
SWOT for water related disaster
- SWOT output will be utilize as high resolution verification datasets, more realistic hydrological input data, initial condition data and boundary condition.- In addition, new physical way of parameter determination of these models will be also desired.

Thank you very much

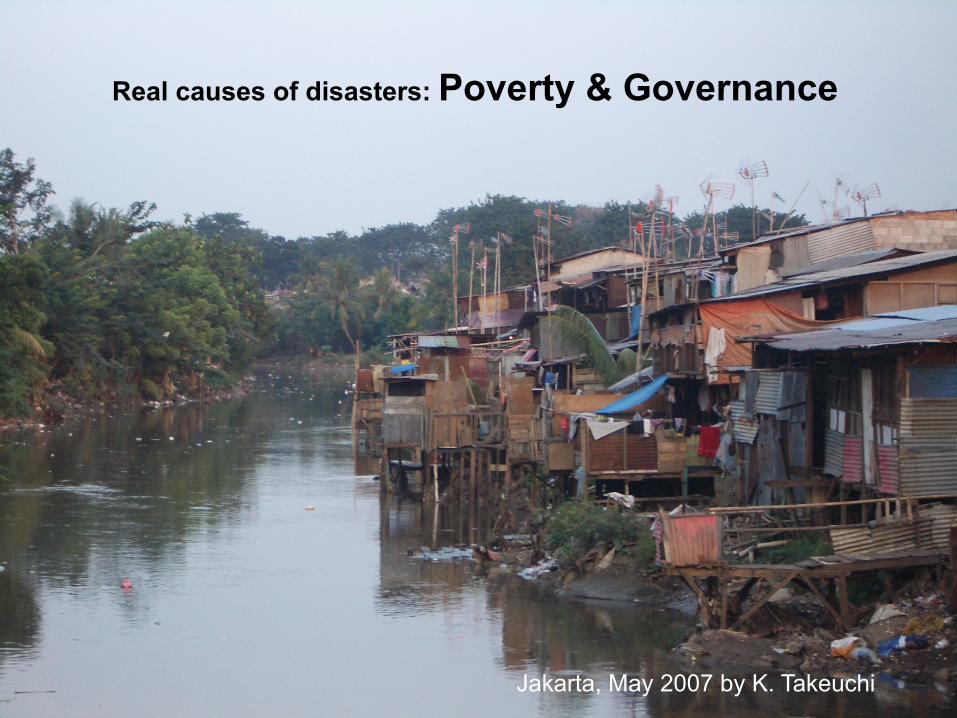
Jakarta, May 2007 by K. Takeuchi
Real causes of disasters: Poverty & Governance
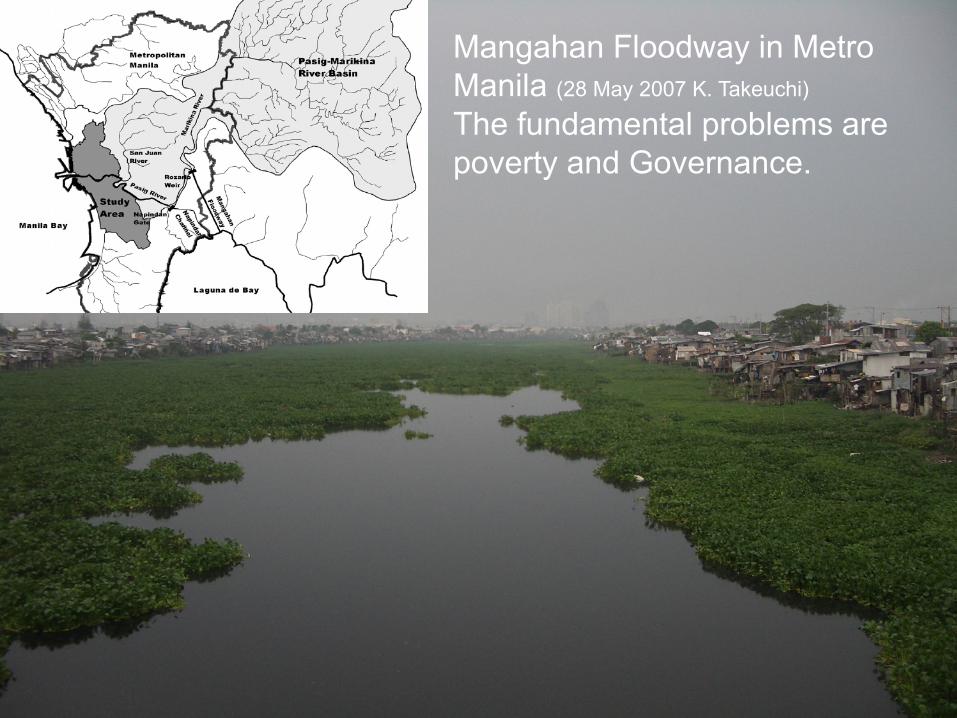
Mangahan Floodway in Metro Manila (28 May 2007 K. Takeuchi)
The fundamental problems are poverty and Governance.