Embed Size (px)
Citation preview
Symmetries. Even and odd functions
Humans like to admire symmetry and are attracted to it.
1-E1 Precalculus
1-E2 Precalculus
What should we know
● Definitions of
− a function,
− a relation,
− a function domain.
● Vertical line test.
1-E3 Precalculus
What shall we study
● Three types of curve symmetry:
− symmetry with respect to the y-axis,
− symmetry with respect to the x-axis,
− symmetry with respect to the coordinate origin.
● which of the symmetry applies to functions and which to relations,
● how the symmetry with respect to the y-axis and to the coordinate origin is reflected in the function equation,
● algebraical and graphical proof of the axis or origin symmetry,
● symmetry rules for some functions: polynomials, rational, trigonometric and composed functions,
1-E4 Precalculus
● to present a function as a sum of even and odd functions.
Symmetry of a graph: Exercise 1
1-A
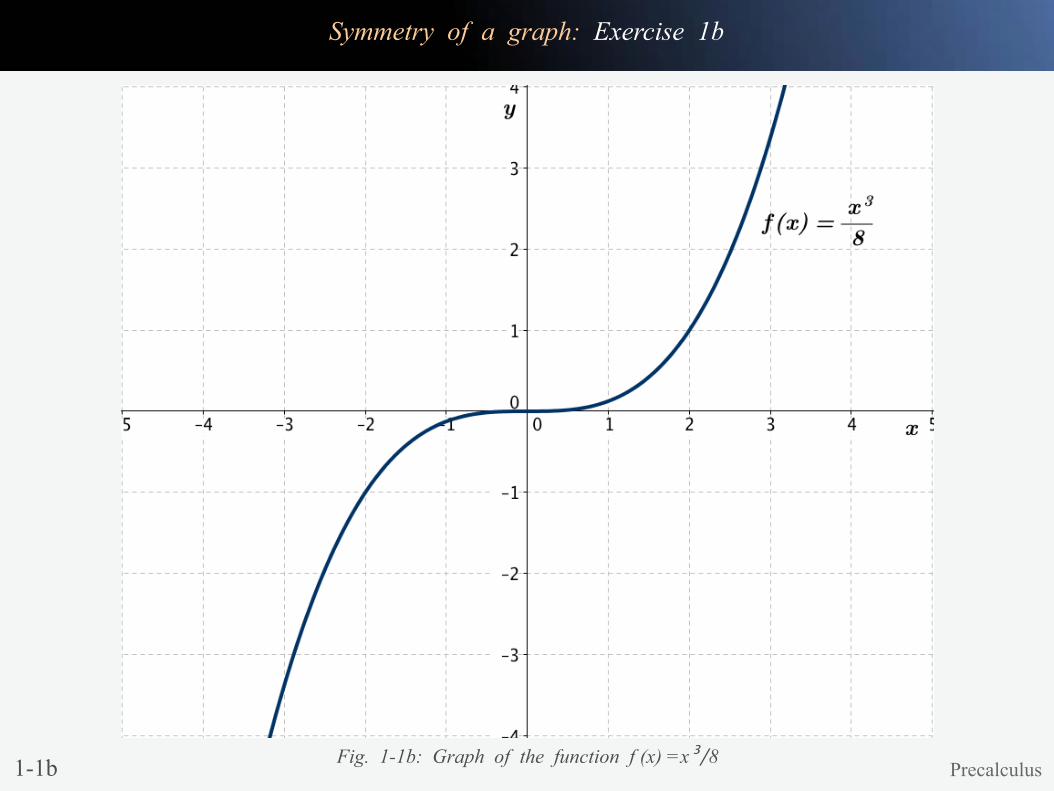
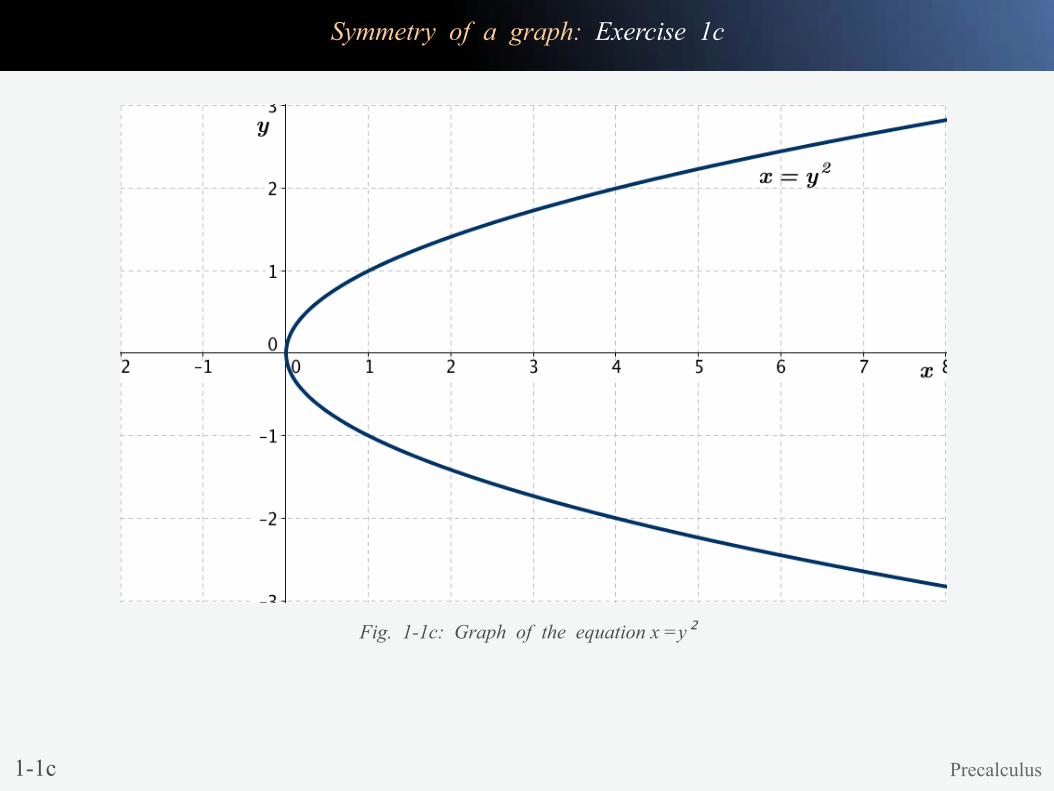
In Figure 1-1 three graphs, which correspond to the followingequations
a ) y = x 2 , b ) y = x 3
8, c ) x = y 2
are given. Determine whether each graph is symmetric or not anddescribe the type of symmetry.
Exercise 1:
Precalculus
Symmetry of a graph: Exercise 1a
1-1a Precalculus
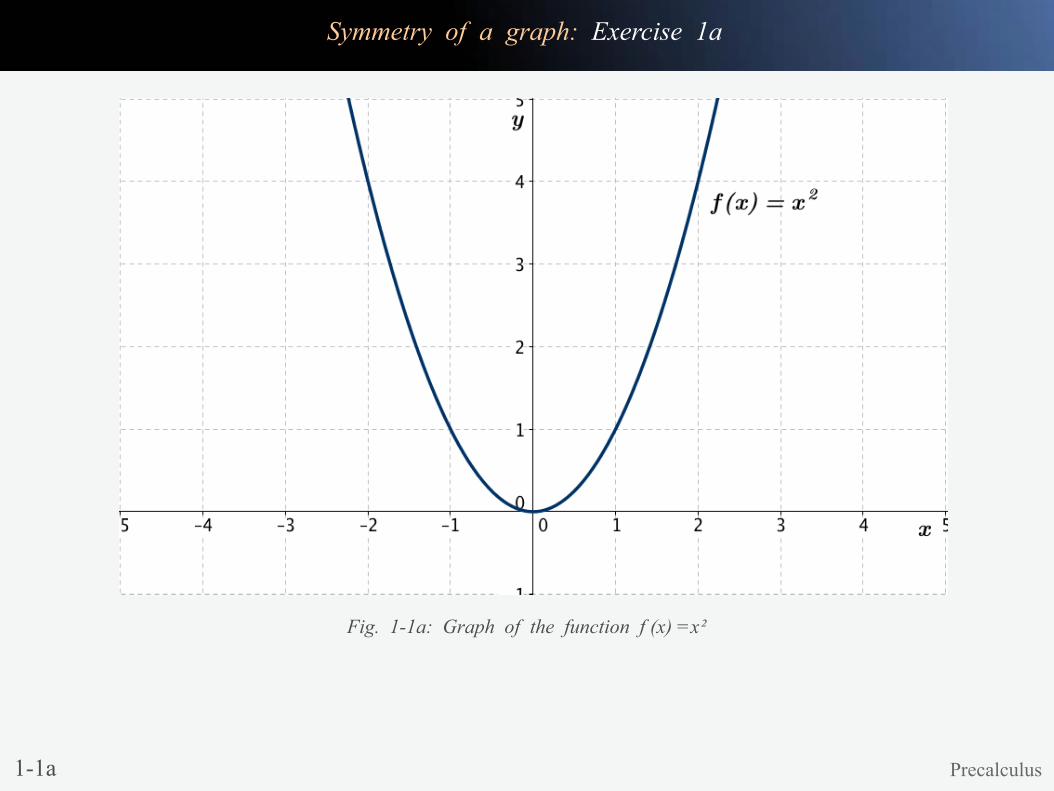
Fig. 1-1a: Graph of the function f (x) =x²
Symmetry of a graph: Exercise 1b
1-1b PrecalculusFig. 1-1b: Graph of the function f (x) =x³/8
Symmetry of a graph: Exercise 1c
1-1c Precalculus
Fig. 1-1c: Graph of the equation x =y²
Symmetry of a graph: Solution 1a
1-2a Precalculus
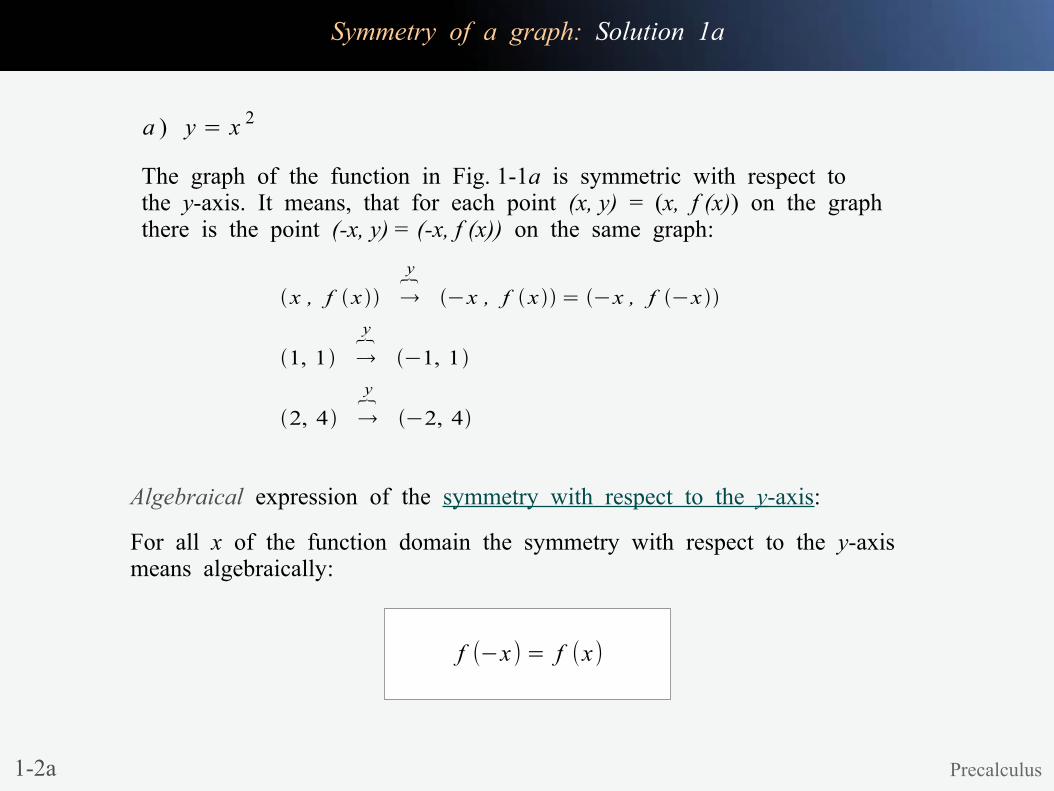
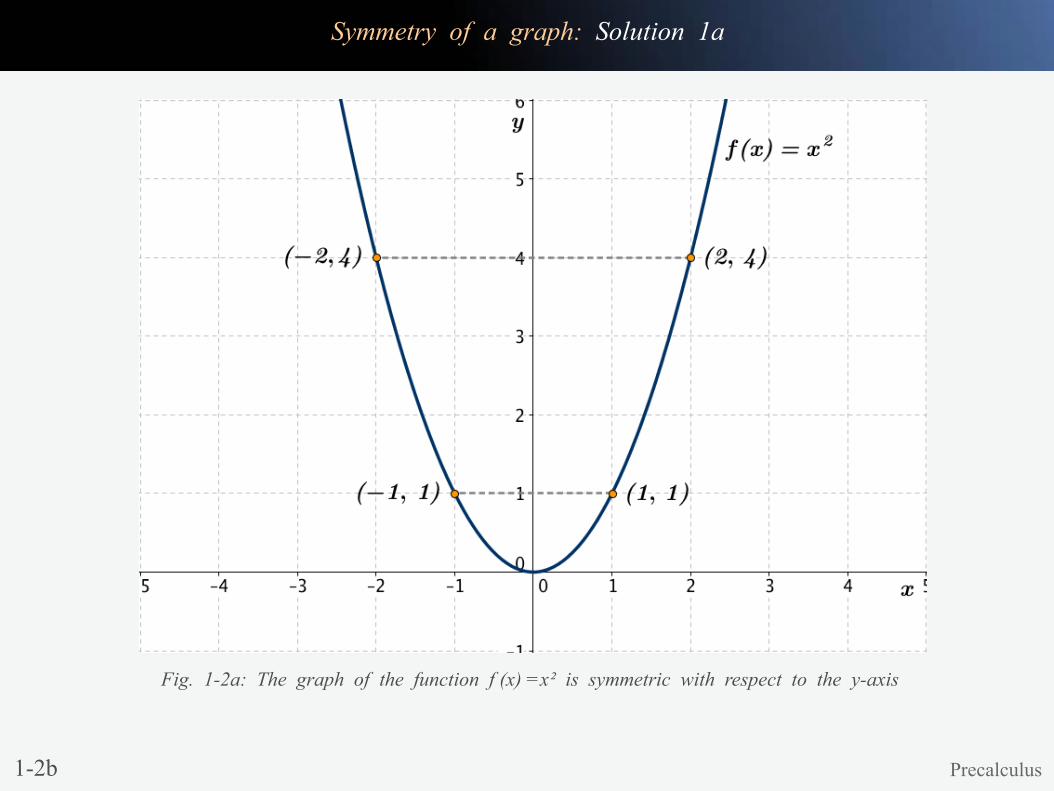
The graph of the function in Fig. 1-1a is symmetric with respect tothe y-axis. It means, that for each point (x, y) = (x, f (x)) on the graphthere is the point (-x, y) = (-x, f (x)) on the same graph:
a ) y = x 2
Algebraical expression of the symmetry with respect to the y-axis:
For all x of the function domain the symmetry with respect to the y-axismeans algebraically:
f (−x ) = f (x)
x , f x y
−x , f x = −x , f −x
1, 1 y
−1, 1
2, 4 y
−2, 4
1-2b Precalculus
Fig. 1-2a: The graph of the function f (x) =x² is symmetric with respect to the y-axis
Symmetry of a graph: Solution 1a
1-3a Precalculus
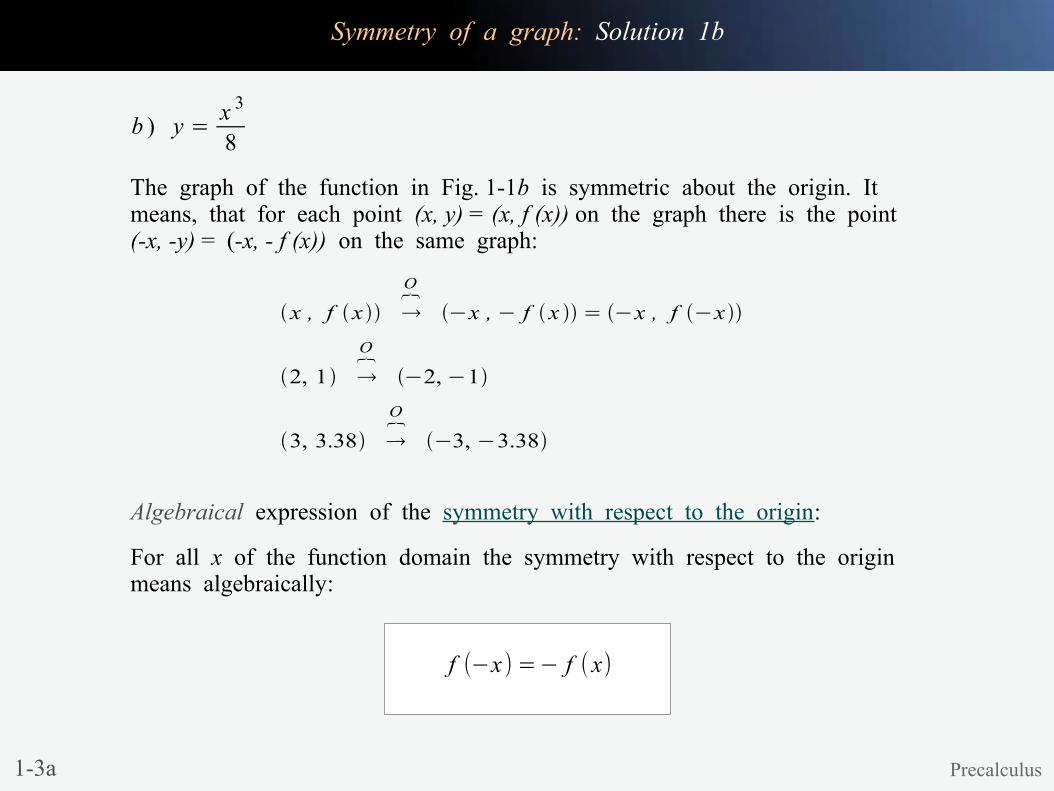
b ) y = x 3
8
The graph of the function in Fig. 1-1b is symmetric about the origin. Itmeans, that for each point (x, y) = (x, f (x)) on the graph there is the point(-x, -y) = (-x, - f (x)) on the same graph:
x , f x O
−x , − f x = −x , f −x
2, 1 O
−2, −1
3, 3.38 O
−3, −3.38
Algebraical expression of the symmetry with respect to the origin:
For all x of the function domain the symmetry with respect to the originmeans algebraically:
f (−x ) =− f (x)
Symmetry of a graph: Solution 1b

1-3b PrecalculusFig. 1-2b: The graph of the function f (x) =x³/8 is symmetric with respect to the point O (0, 0)
Symmetry of a graph: Solution 1b
1-4a
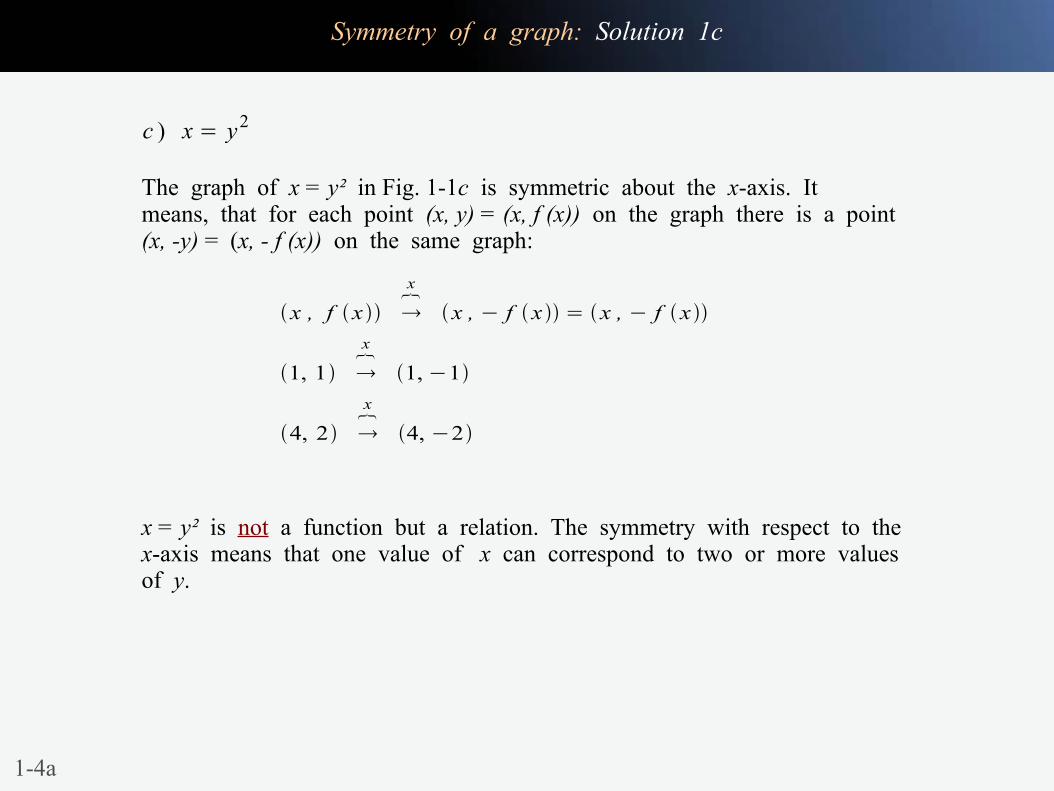
c ) x = y2
The graph of x = y² in Fig. 1-1c is symmetric about the x-axis. Itmeans, that for each point (x, y) = (x, f (x)) on the graph there is a point(x, -y) = (x, - f (x)) on the same graph:
x , f x x
x , − f x = x , − f x
1, 1 x
1, −1
4, 2 x
4, −2
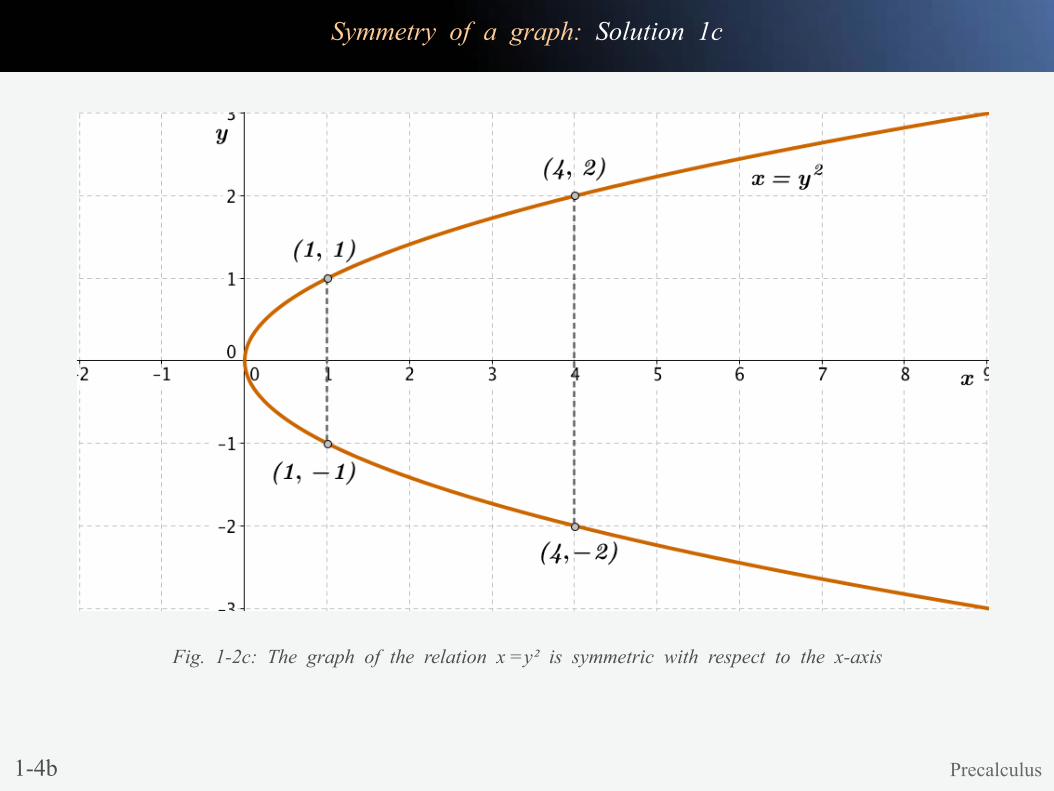
x = y² is not a function but a relation. The symmetry with respect to thex-axis means that one value of x can correspond to two or more valuesof y.
Symmetry of a graph: Solution 1c
1-4b
Fig. 1-2c: The graph of the relation x =y² is symmetric with respect to the x-axis
Precalculus
Symmetry of a graph: Solution 1c
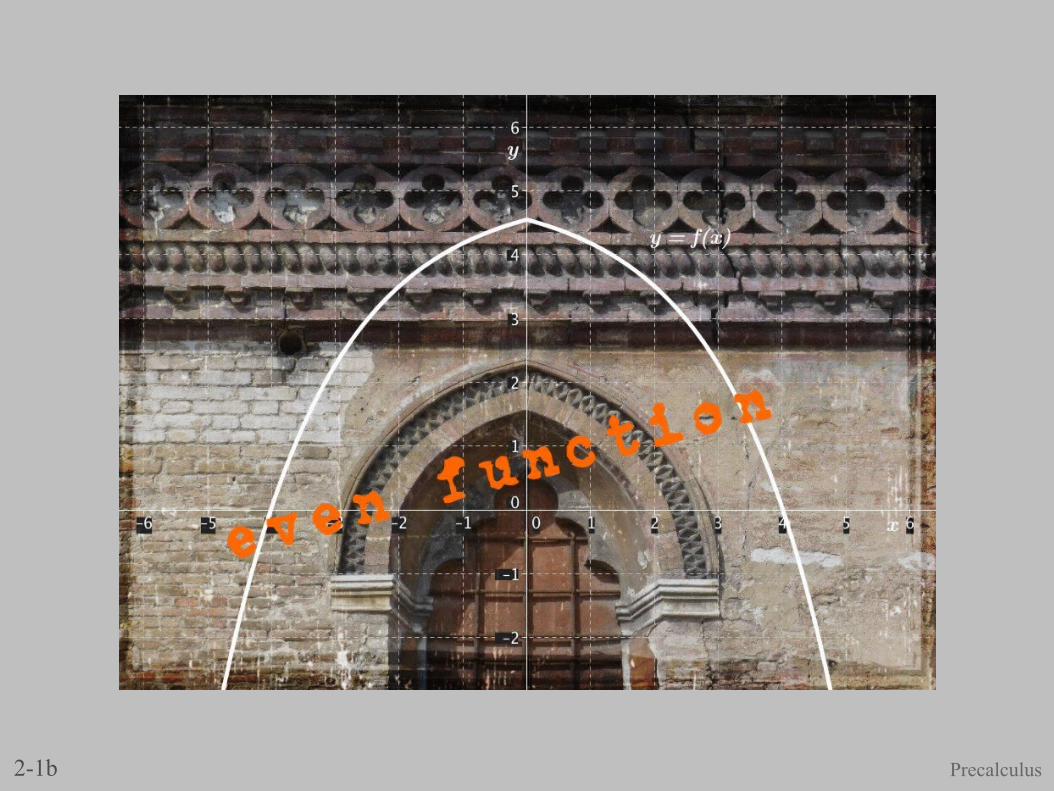
Even function
2-1a Precalculus
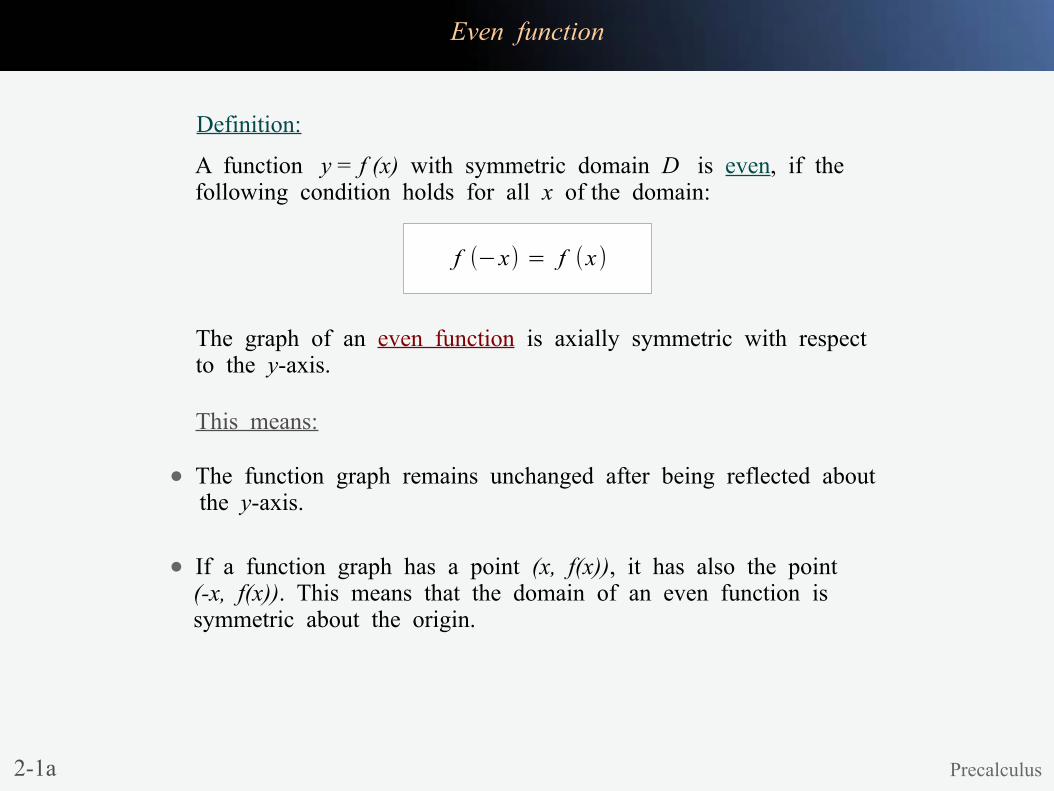
The graph of an even function is axially symmetric with respectto the y-axis.
● The function graph remains unchanged after being reflected about the y-axis.
This means:
● If a function graph has a point (x, f(x)), it has also the point (-x, f(x)). This means that the domain of an even function is symmetric about the origin.
A function y = f (x) with symmetric domain D is even, if thefollowing condition holds for all x of the domain:
f (−x) = f (x)
Definition:
2-1b Precalculus

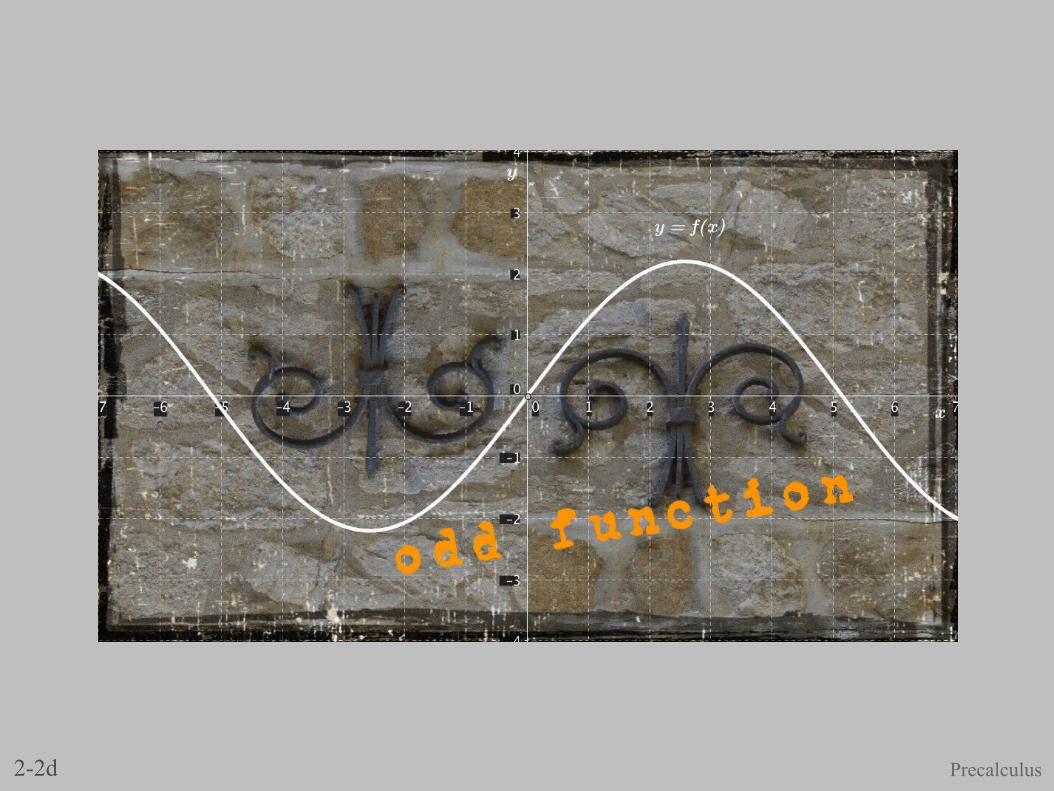
Odd function
2-21 Precalculus
The graph of an odd function is symmetric with respect to theorigin. The symmetry with respect to the origin is a rotationalsymmetry.
● The graph remains unchanged after 180 degree rotation about the origin. If one rotates a right hand side of a curve by 180˚ about the origin, then one gets the left side of the curve.
This means that:
● if a function graph has a point (x, f(x)), it has also the point (-x, -f(x)). This means that the domain of an odd function is symmetric about the origin.
A function y = f (x) with symmetric domain D is odd, if thefollowing condition holds for all x of the domain:
Definition:
f (−x) = − f (x)
Odd function
2-2c Precalculus
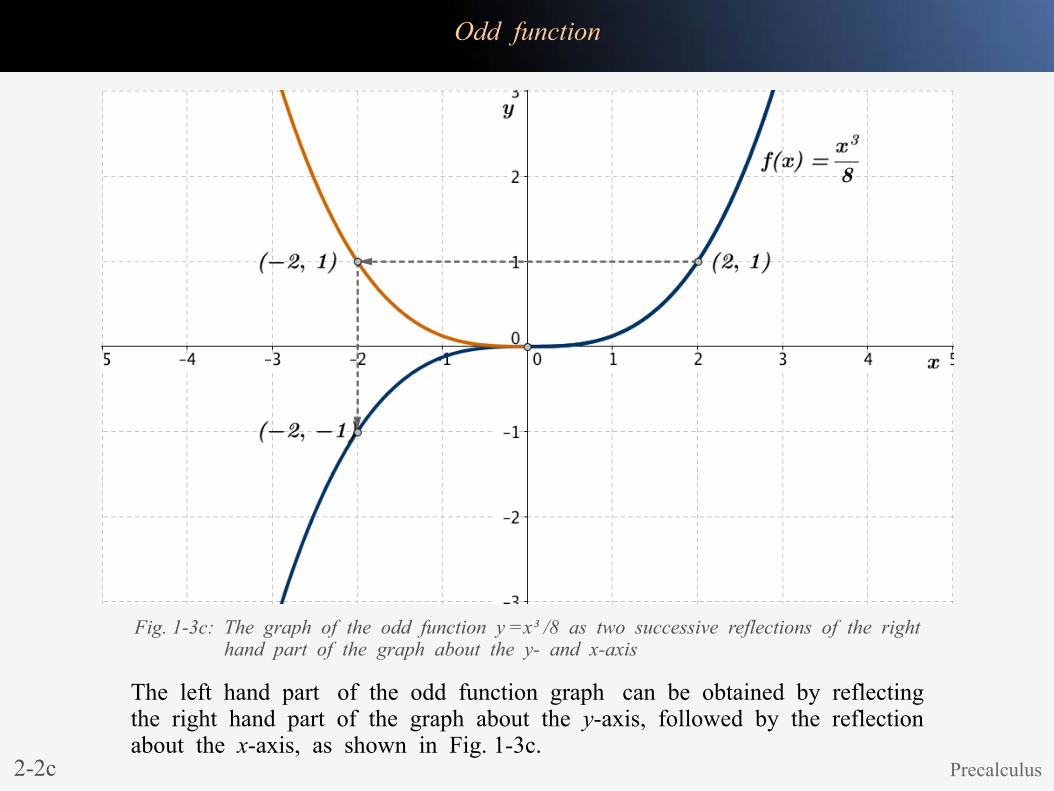
The left hand part of the odd function graph can be obtained by reflectingthe right hand part of the graph about the y-axis, followed by the reflectionabout the x-axis, as shown in Fig. 1-3c.
Fig. 1-3c: The graph of the odd function y =x³ /8 as two successive reflections of the right hand part of the graph about the y- and x-axis
2-2d Precalculus
2-2e Precalculus
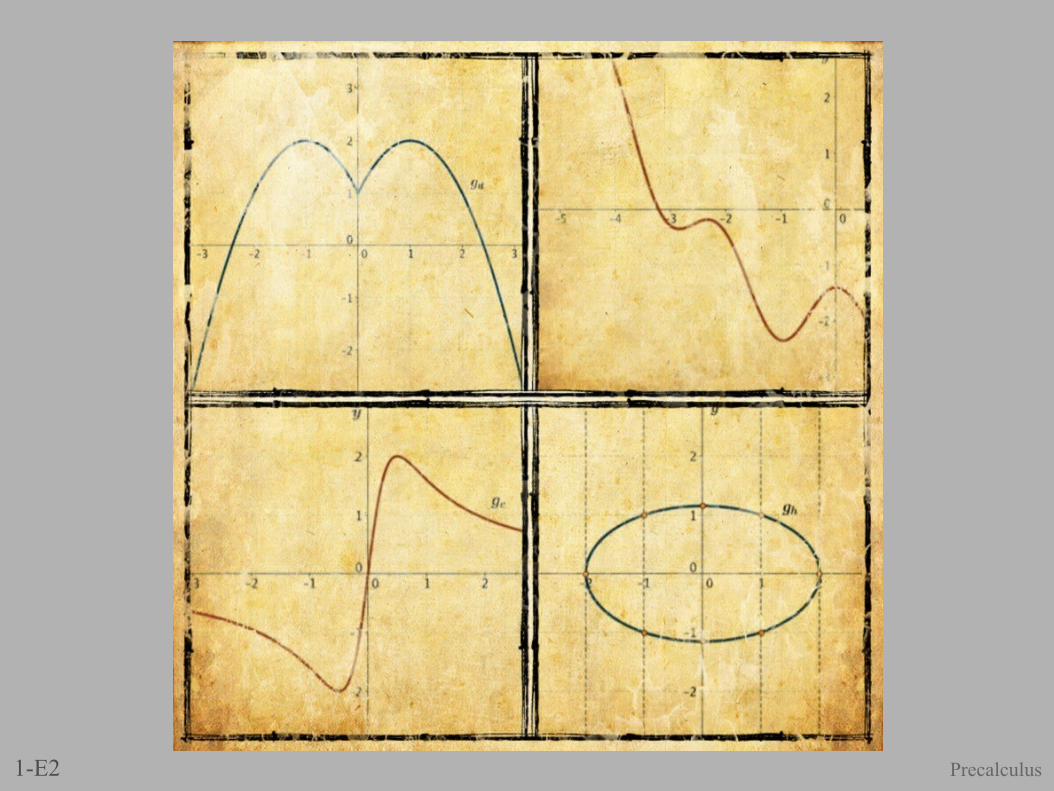
Symmetry of a graph: Exercise 2
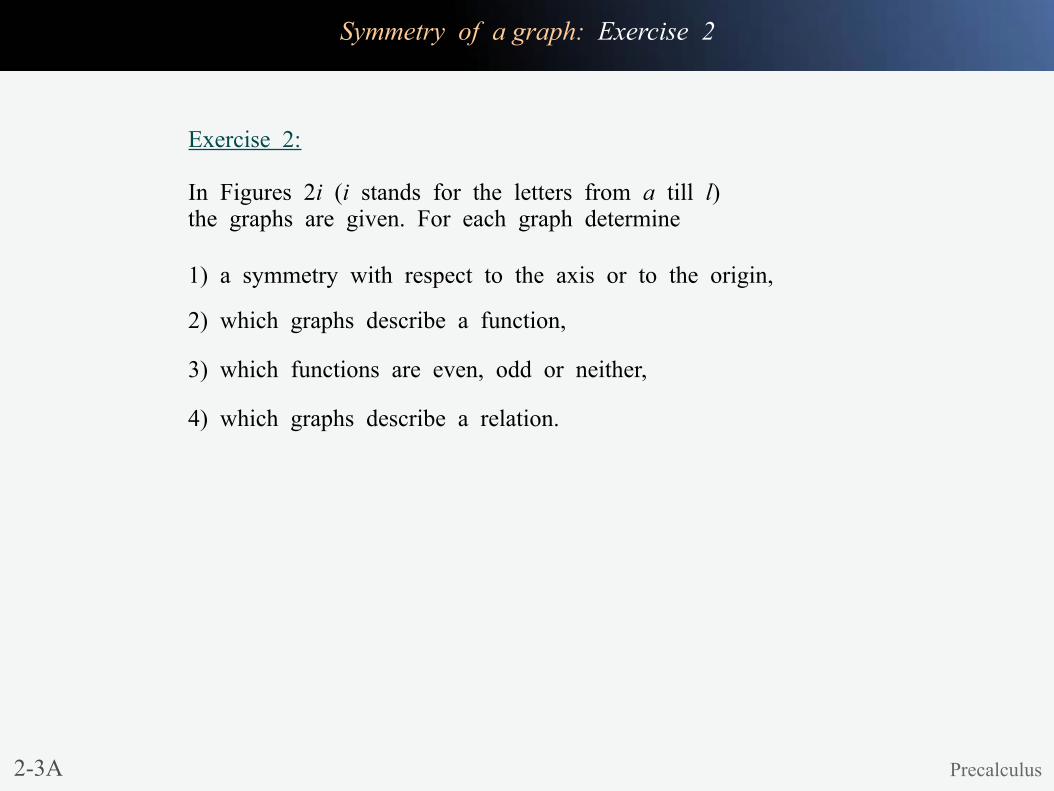
In Figures 2i (i stands for the letters from a till l)the graphs are given. For each graph determine
Exercise 2:
2-3A Precalculus
1) a symmetry with respect to the axis or to the origin,
2) which graphs describe a function,
3) which functions are even, odd or neither,
4) which graphs describe a relation.
2-3a Precalculus
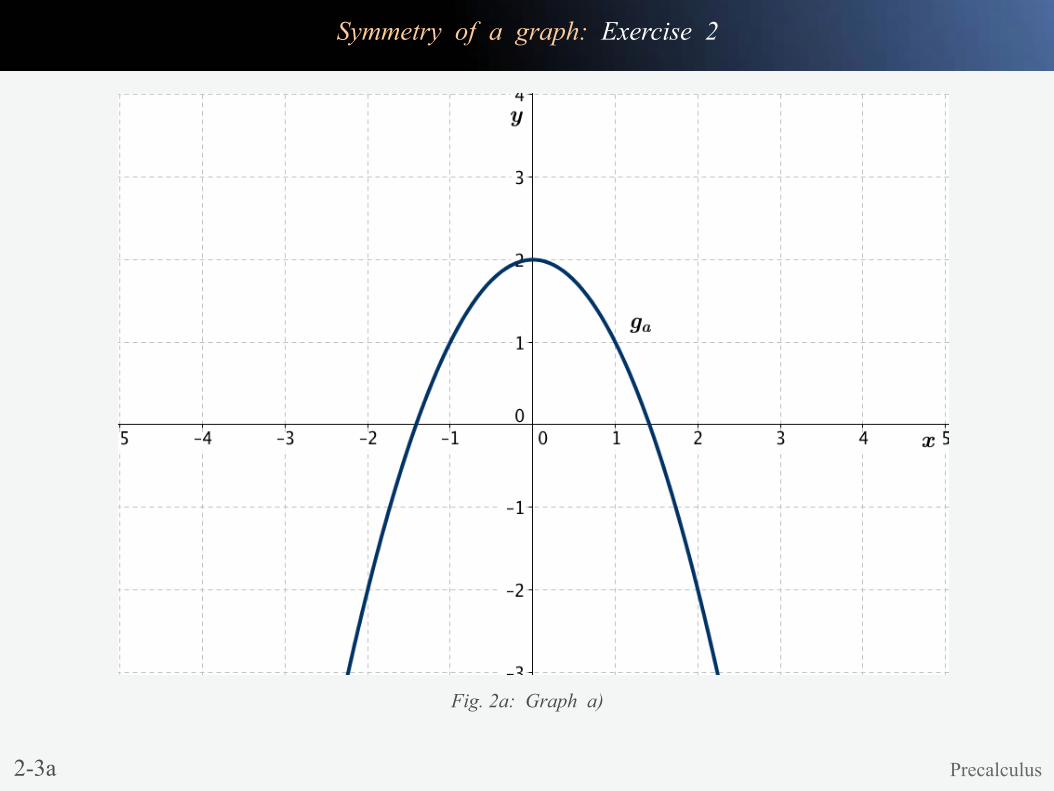
Fig. 2a: Graph a)
Symmetry of a graph: Exercise 2
2-3b Precalculus
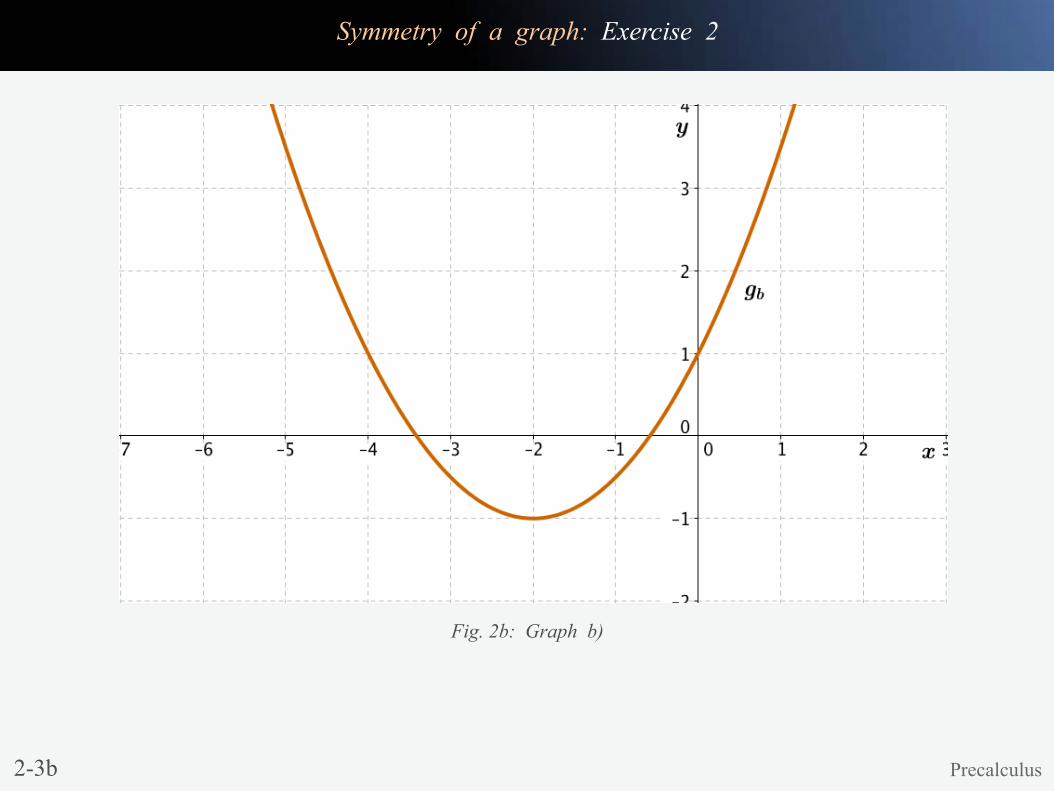
Fig. 2b: Graph b)
Symmetry of a graph: Exercise 2
2-3c Precalculus
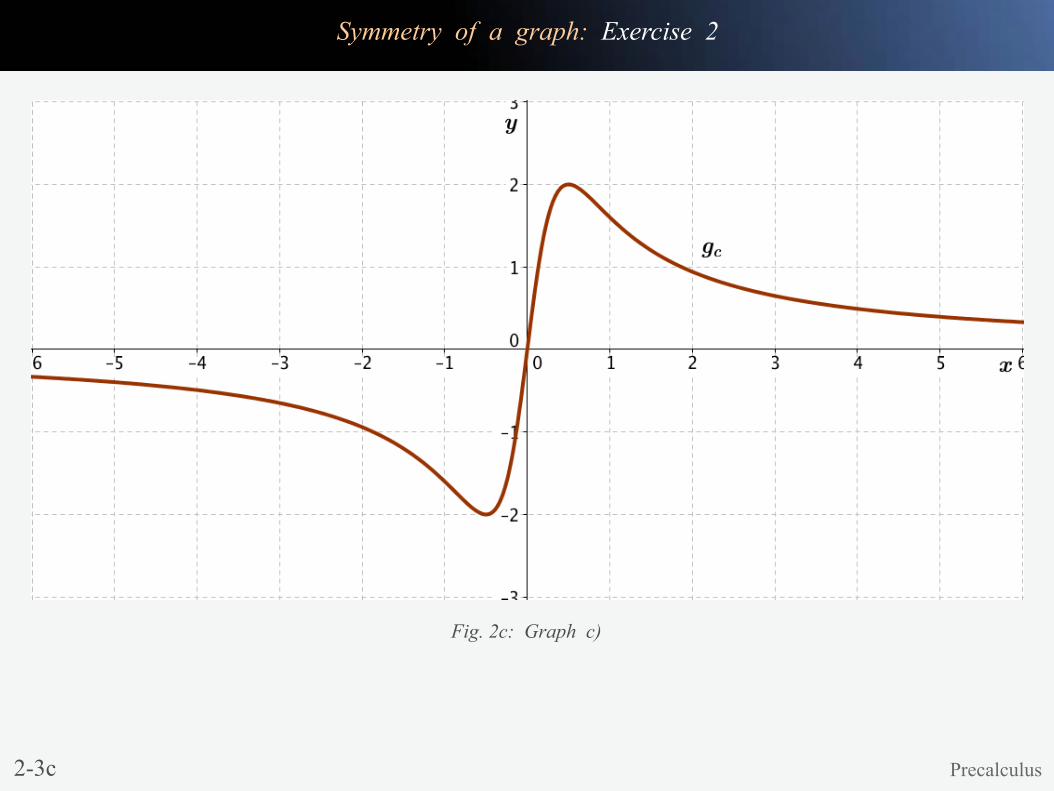
Fig. 2c: Graph c)
Symmetry of a graph: Exercise 2
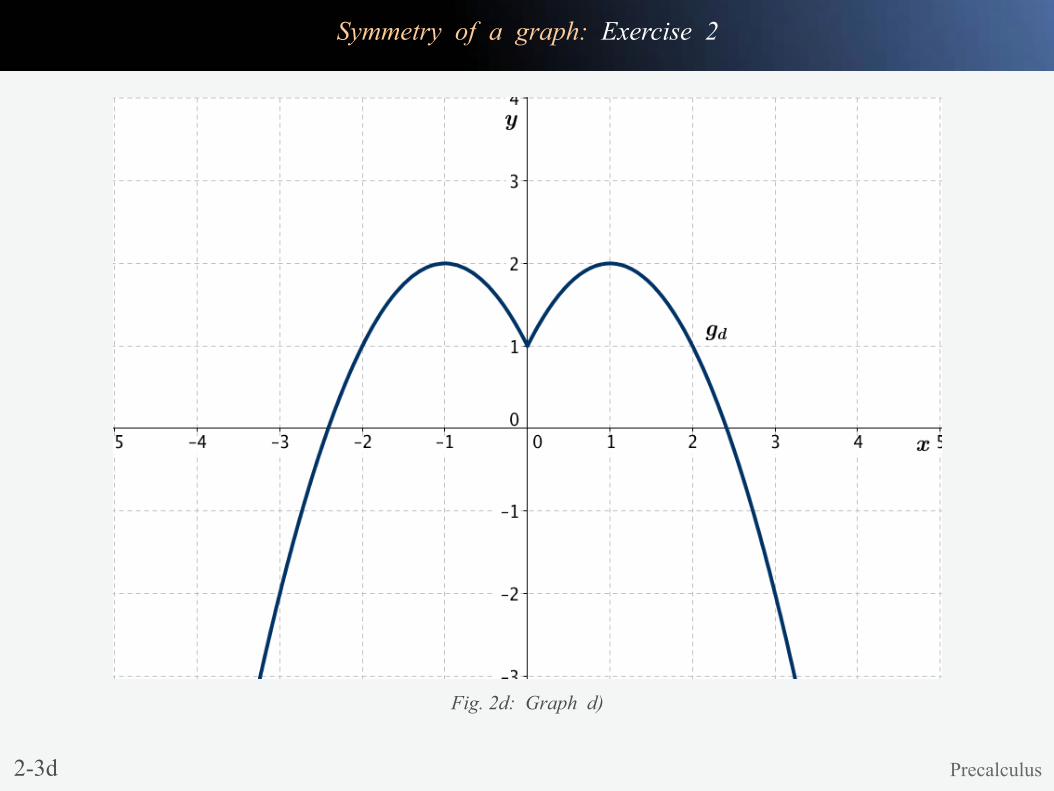
2-3d Precalculus
Fig. 2d: Graph d)
Symmetry of a graph: Exercise 2
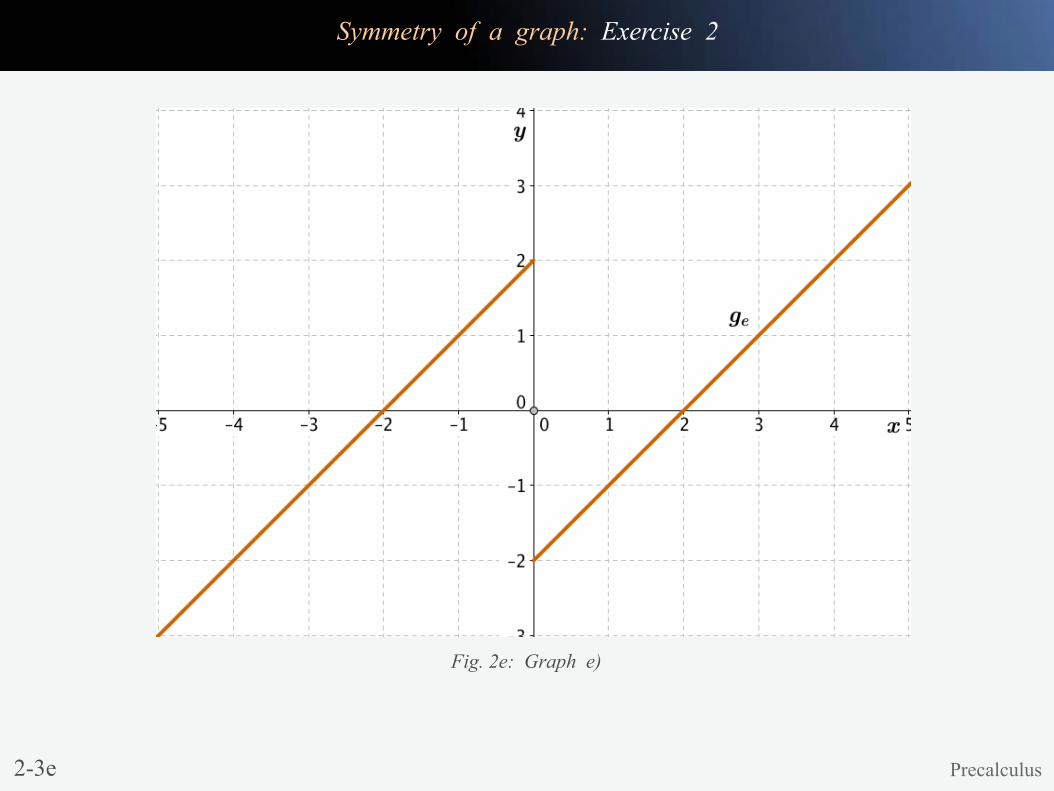
2-3e Precalculus
Fig. 2e: Graph e)
Symmetry of a graph: Exercise 2
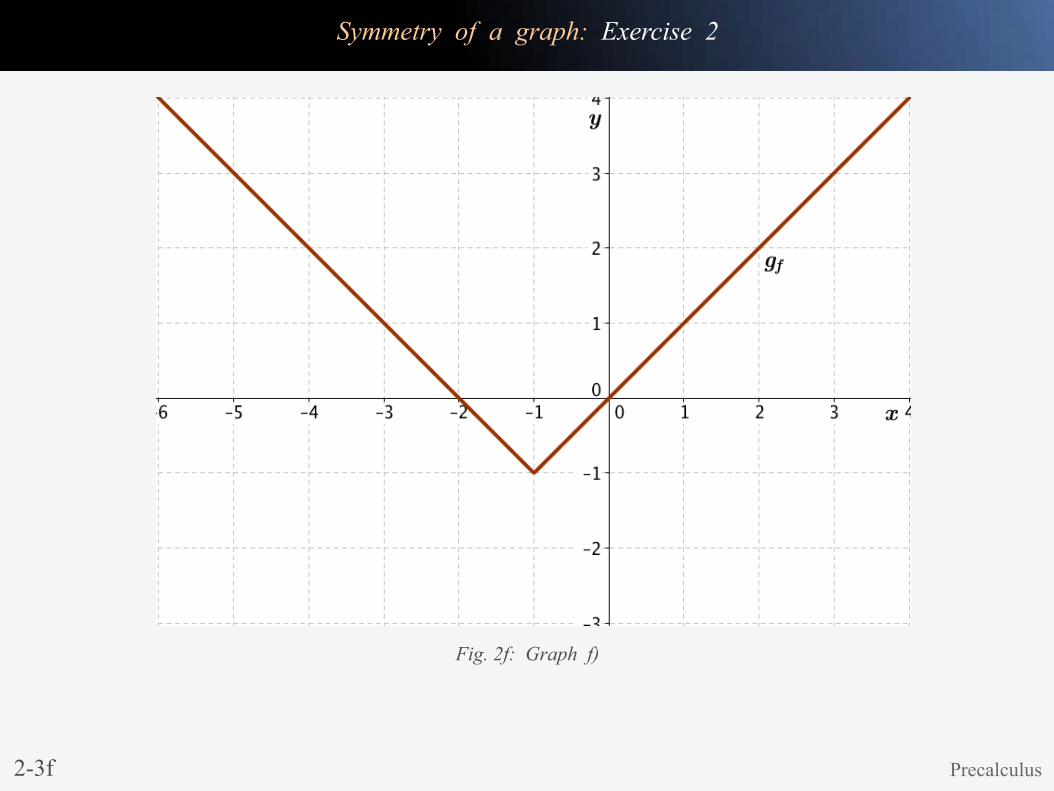
2-3f Precalculus
Fig. 2f: Graph f)
Symmetry of a graph: Exercise 2
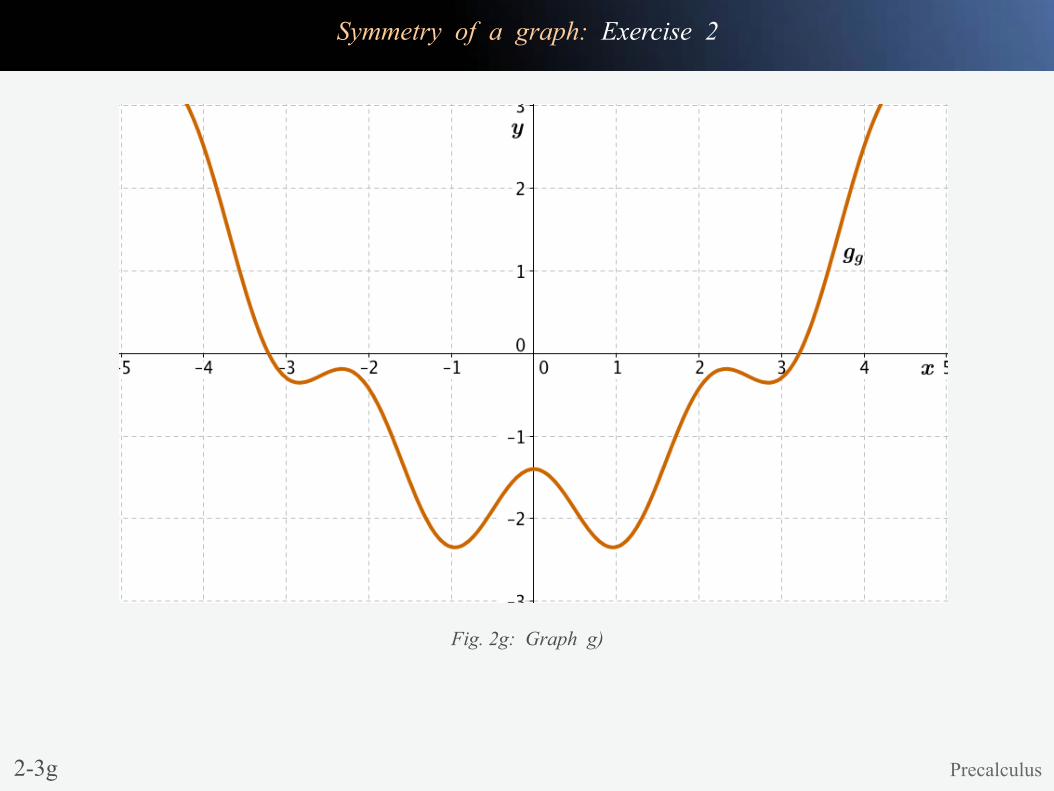
2-3g Precalculus
Fig. 2g: Graph g)
Symmetry of a graph: Exercise 2
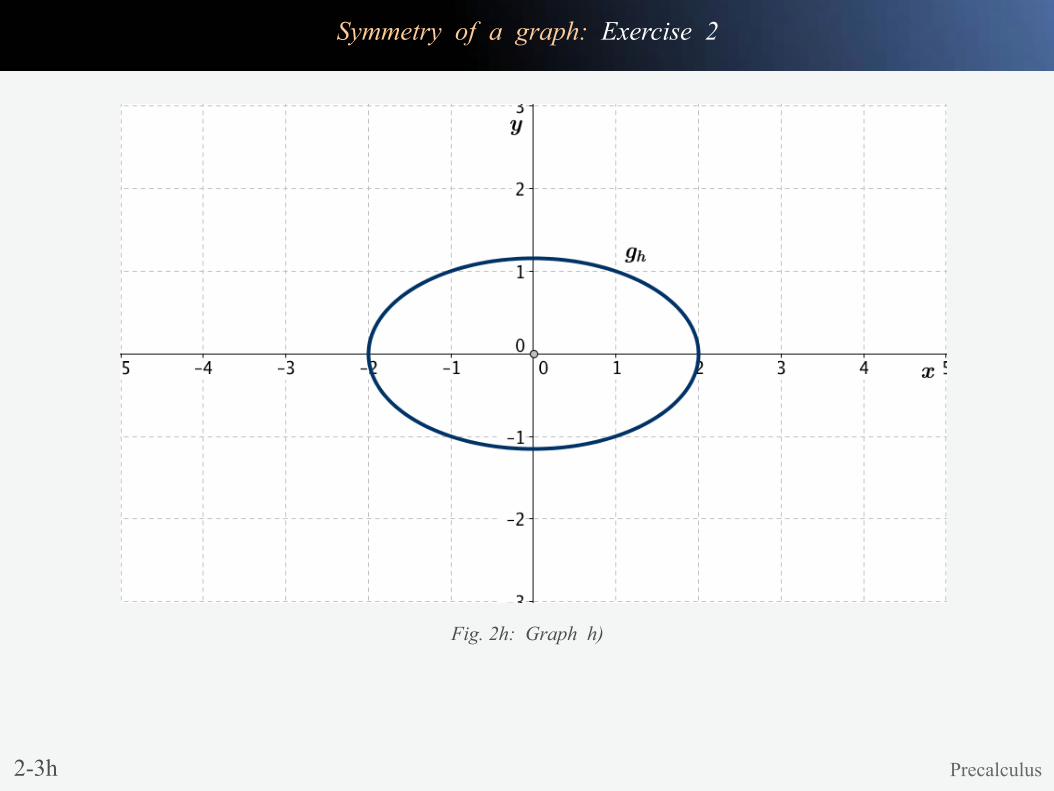
2-3h Precalculus
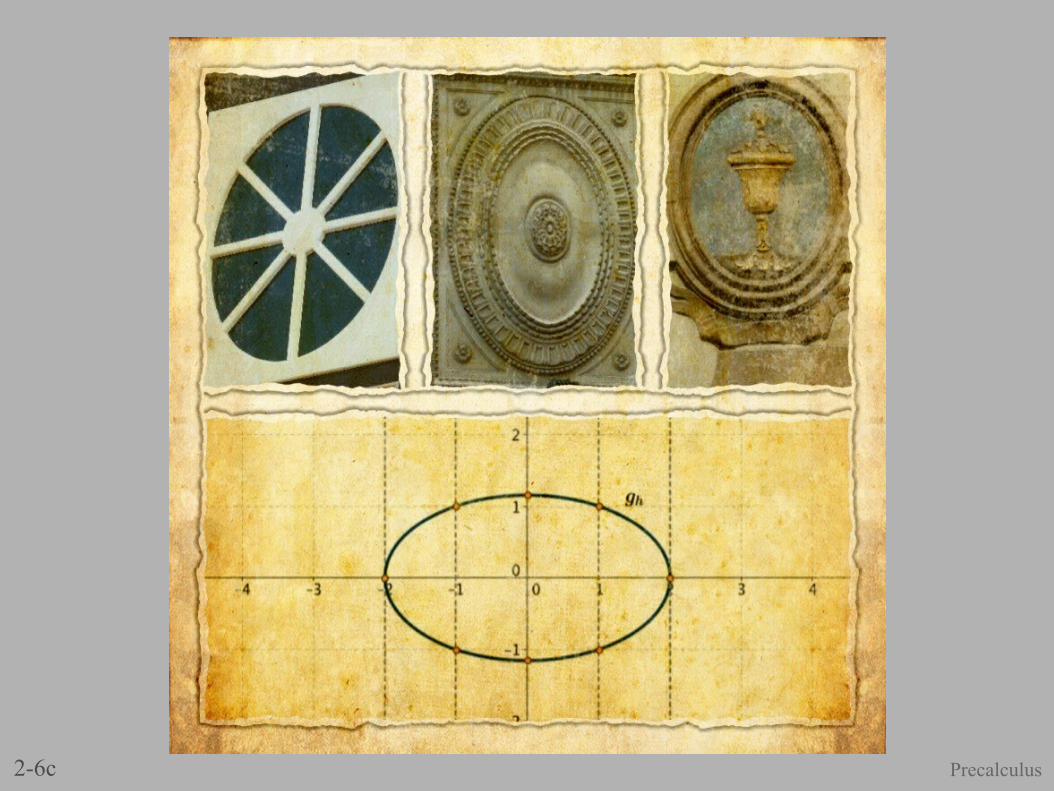
Fig. 2h: Graph h)
Symmetry of a graph: Exercise 2
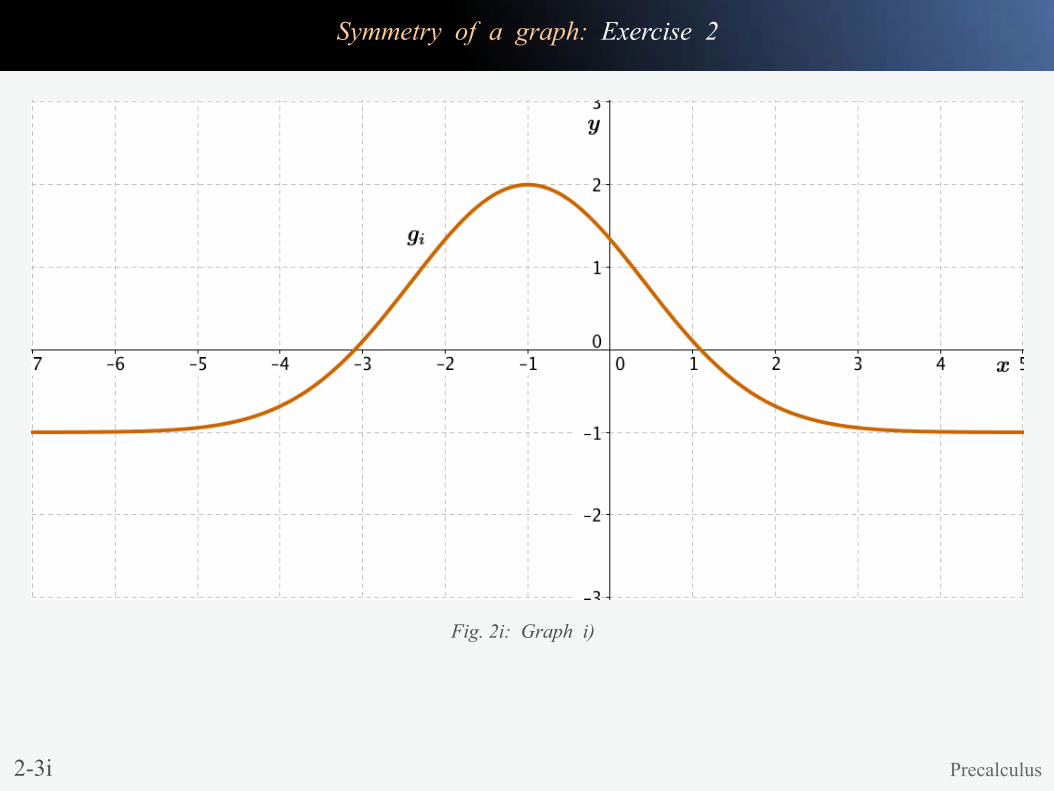
2-3i Precalculus
Fig. 2i: Graph i)
Symmetry of a graph: Exercise 2
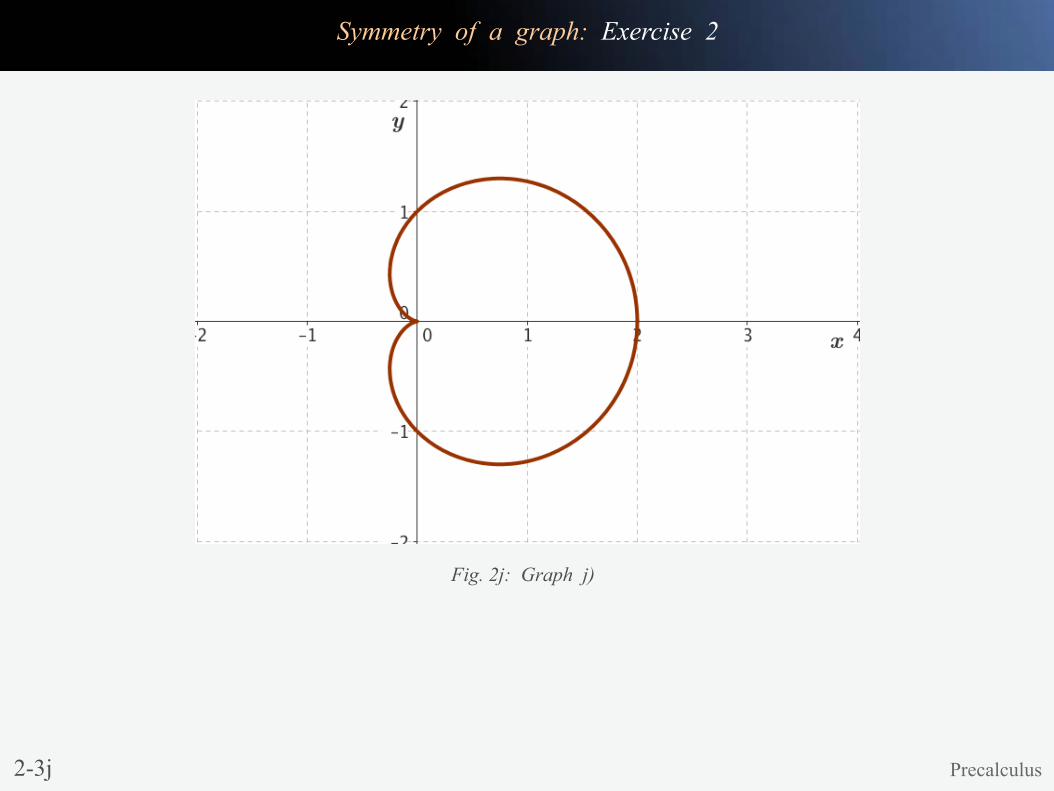
2-3j Precalculus
Fig. 2j: Graph j)
Symmetry of a graph: Exercise 2
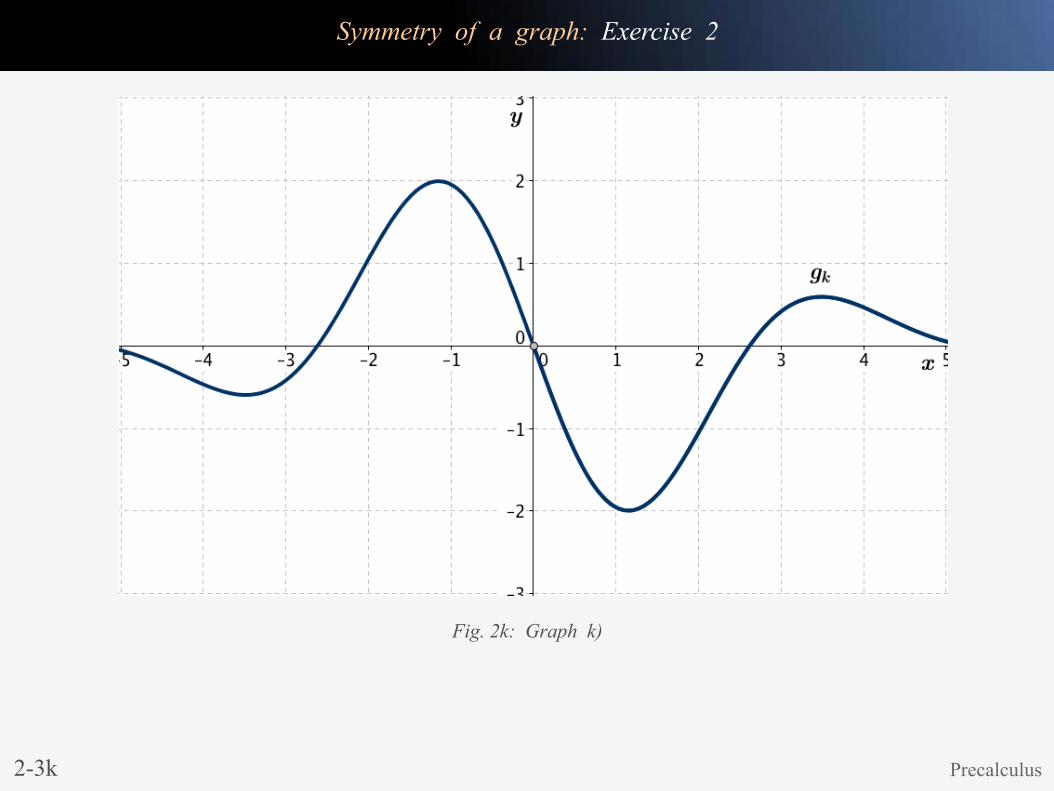
2-3k Precalculus
Fig. 2k: Graph k)
Symmetry of a graph: Exercise 2
Symmetry of a graph: Exercise 2
2-3l Precalculus
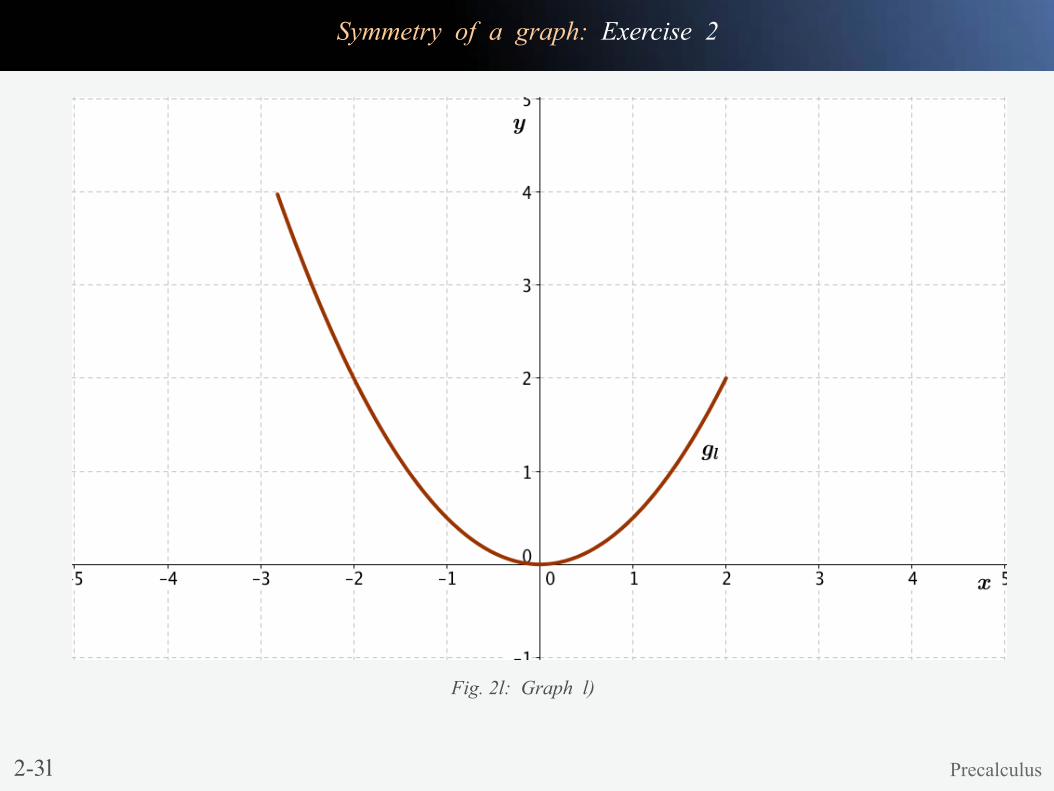
Fig. 2l: Graph l)
Symmetry of a graph: Solution 2
2-4a Precalculus
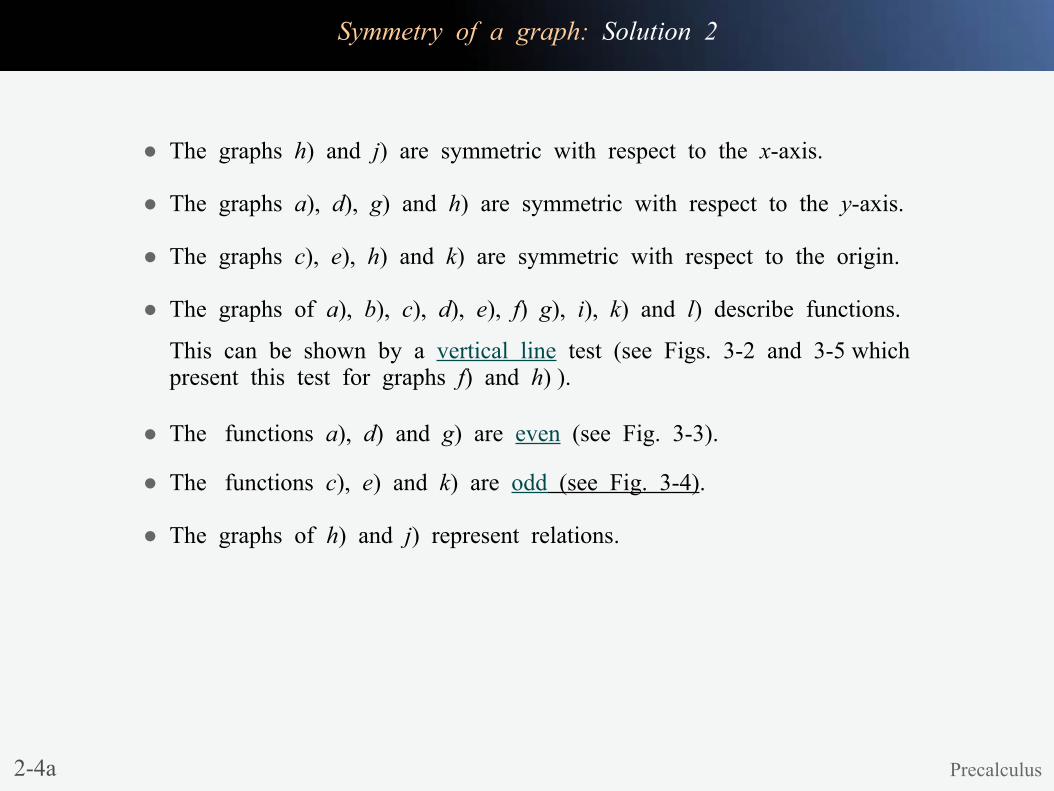
● The graphs h) and j) are symmetric with respect to the x-axis.
● The graphs a), d), g) and h) are symmetric with respect to the y-axis.
● The graphs c), e), h) and k) are symmetric with respect to the origin.
● The graphs of a), b), c), d), e), f) g), i), k) and l) describe functions.
● The graphs of h) and j) represent relations.
● The functions a), d) and g) are even (see Fig. 3-3).
● The functions c), e) and k) are odd (see Fig. 3-4).
This can be shown by a vertical line test (see Figs. 3-2 and 3-5 whichpresent this test for graphs f) and h) ).
Symmetry of a graph: Solution 2
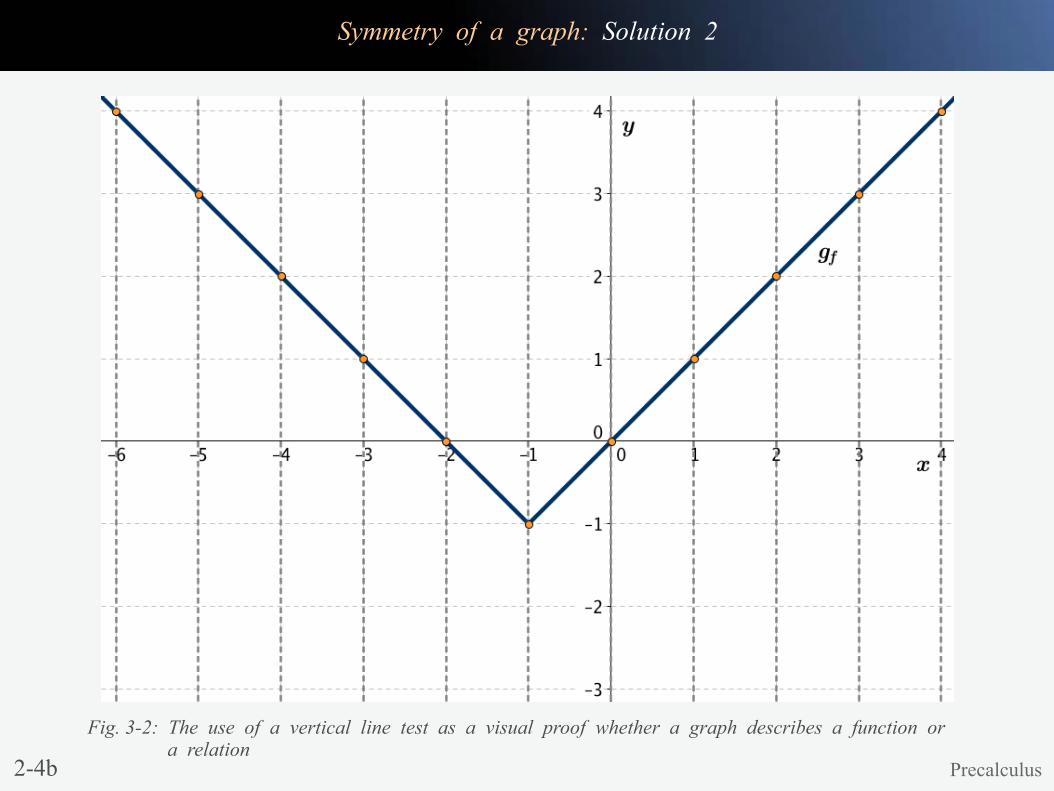
Fig. 3-2: The use of a vertical line test as a visual proof whether a graph describes a function or a relation
Precalculus2-4b
A symmetry of a graph: Solution 2
2-4c Precalculus
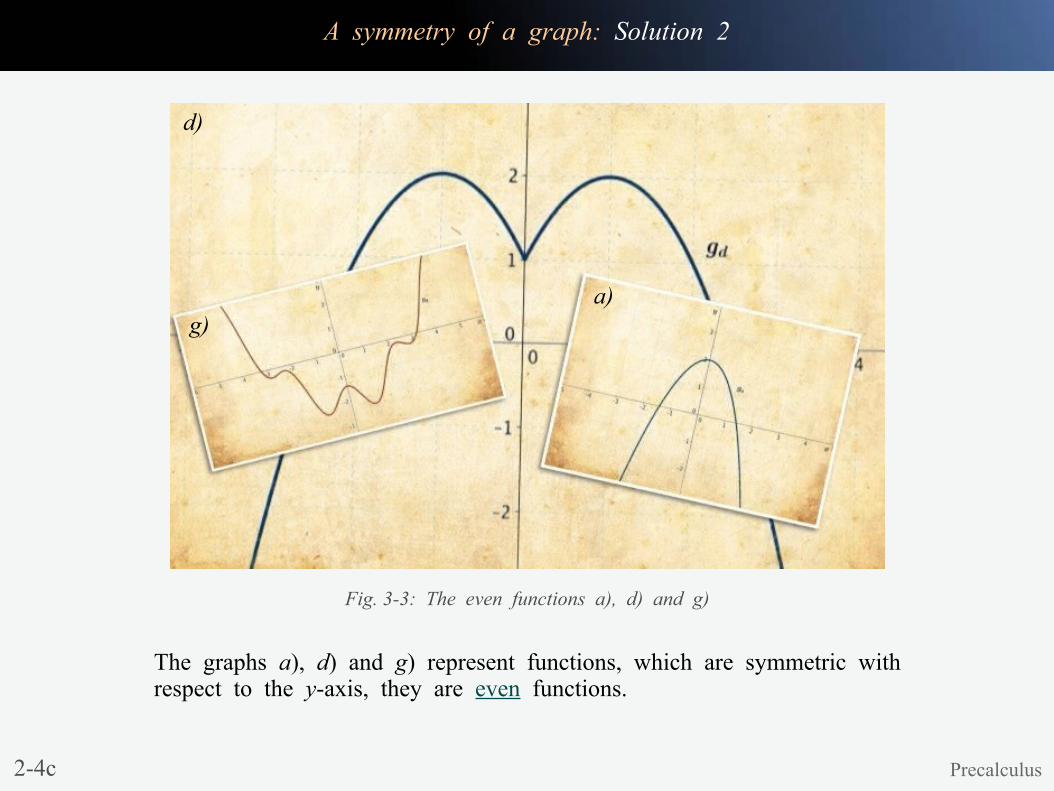
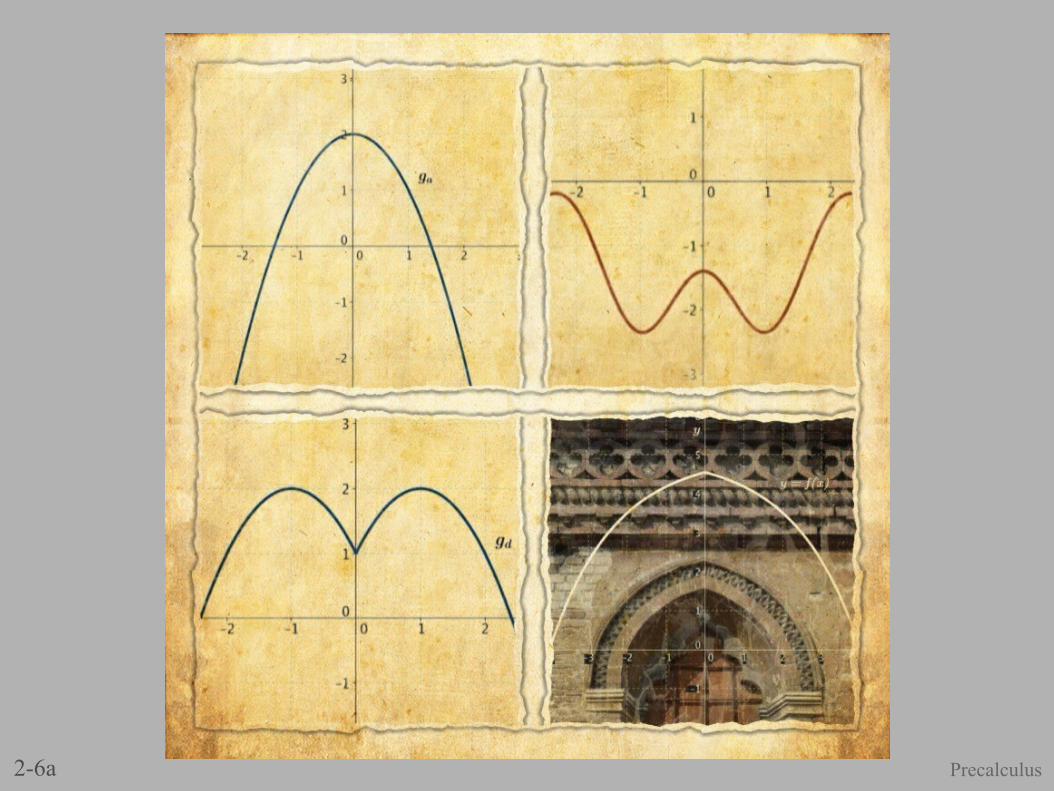
Fig. 3-3: The even functions a), d) and g)
The graphs a), d) and g) represent functions, which are symmetric withrespect to the y-axis, they are even functions.
d)
g)a)
A symmetry of a graph: Solution 2
2-4d Precalculus
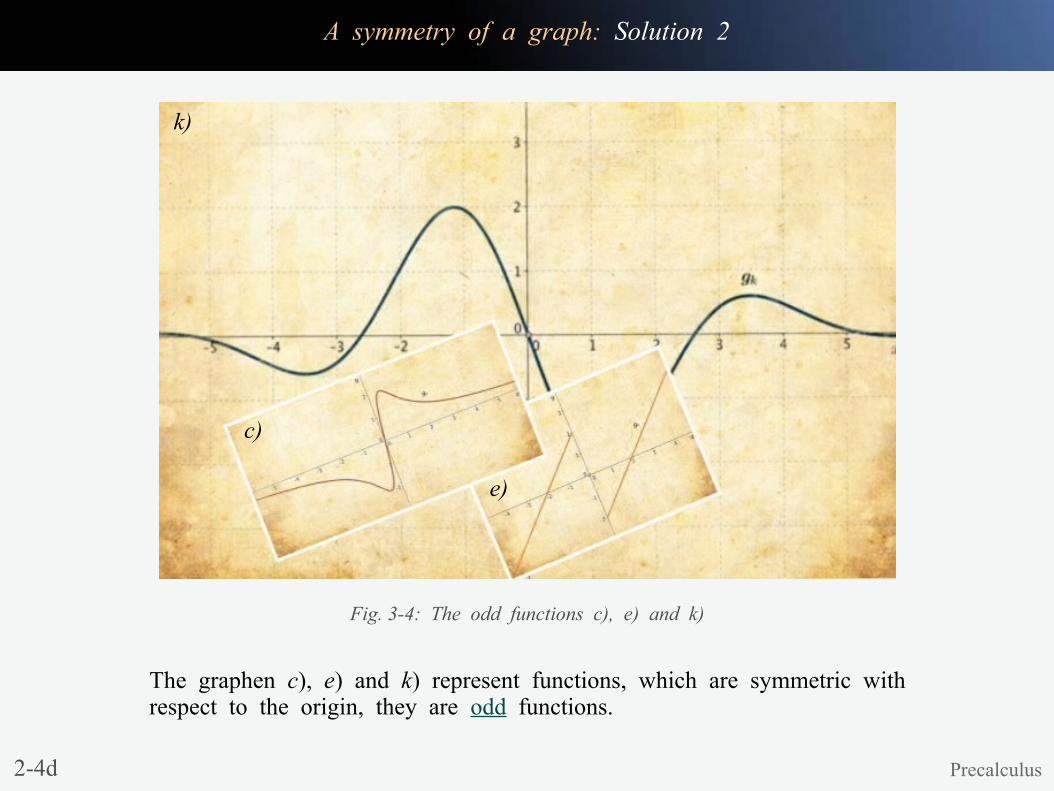
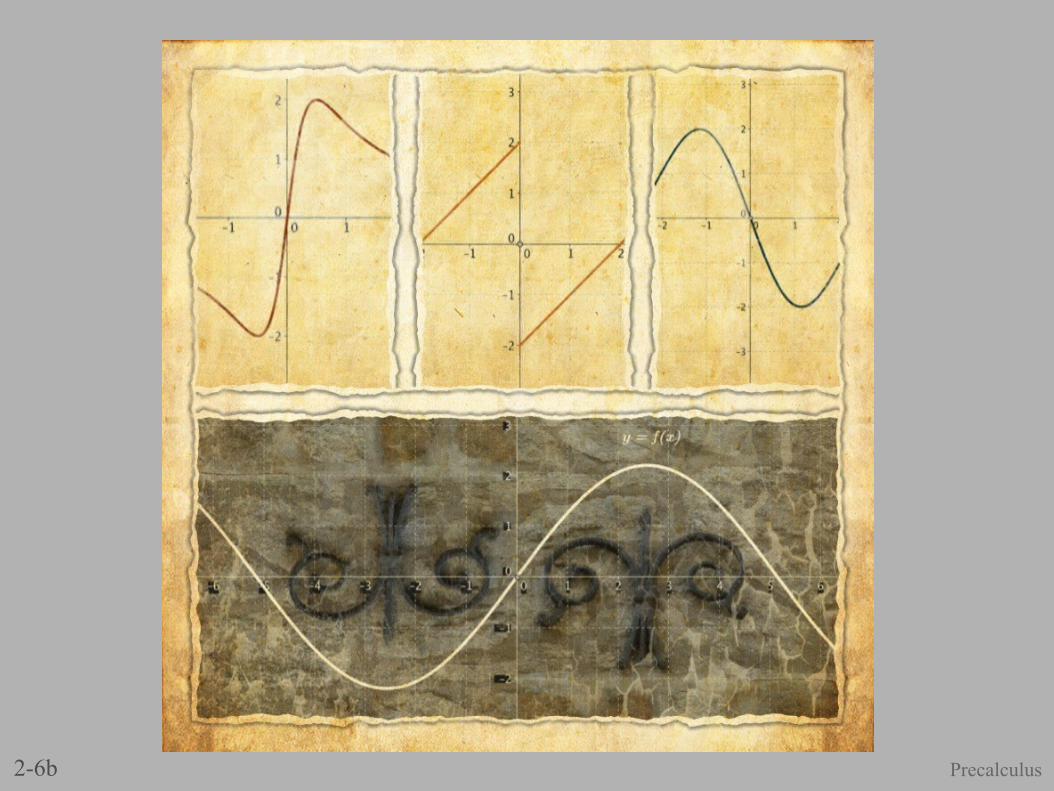
Fig. 3-4: The odd functions c), e) and k)
The graphen c), e) and k) represent functions, which are symmetric withrespect to the origin, they are odd functions.
e)
k)
c)
Symmetry of a graph: Solution 2
2-5 Precalculus
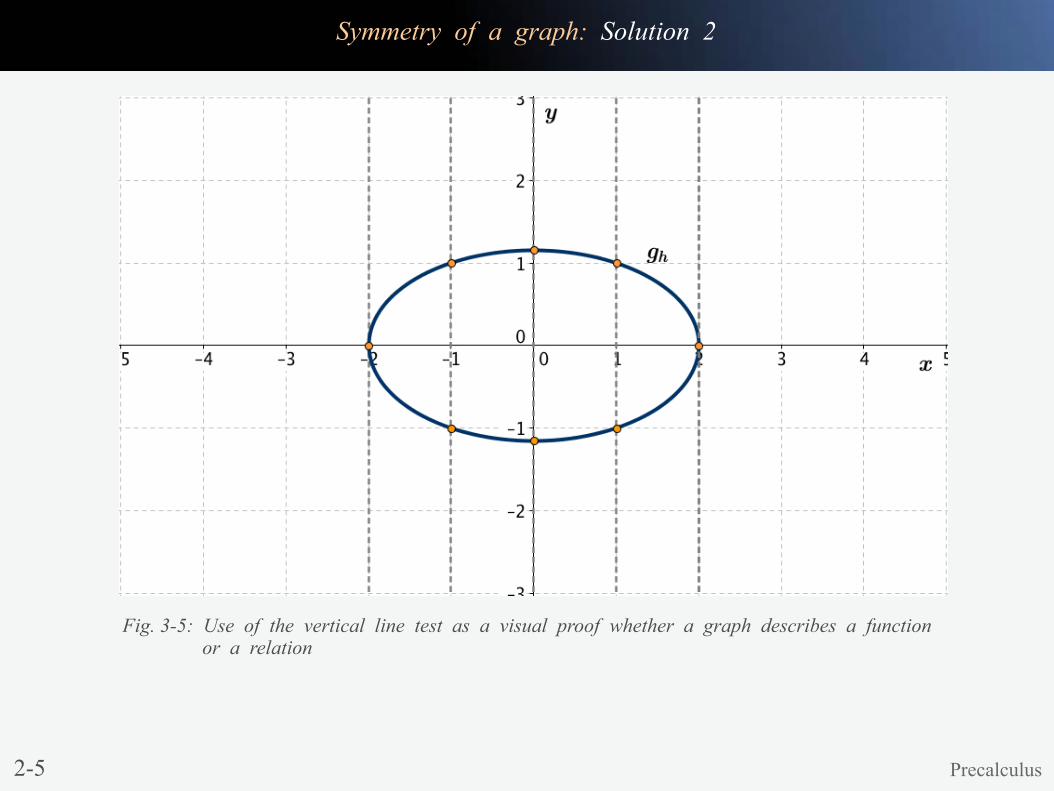
Fig. 3-5: Use of the vertical line test as a visual proof whether a graph describes a function or a relation
2-6a Precalculus
2-6b Precalculus
2-6c Precalculus