Embed Size (px)
Citation preview
INTERNATIONAL JOURNAL OF CLIMATOLOGY
Int. J. Climatol. 20: 131–149 (2000)
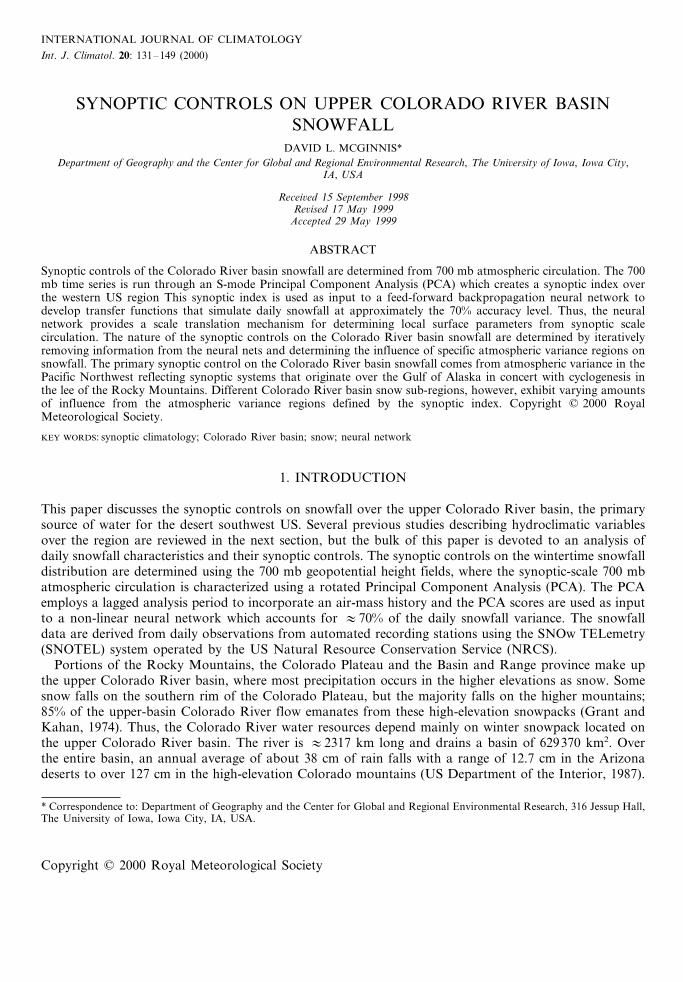
SYNOPTIC CONTROLS ON UPPER COLORADO RIVER BASINSNOWFALL
DAVID L. MCGINNIS*Department of Geography and the Center for Global and Regional En6ironmental Research, The Uni6ersity of Iowa, Iowa City,
IA, USA
Recei6ed 15 September 1998Re6ised 17 May 1999
Accepted 29 May 1999
ABSTRACT
Synoptic controls of the Colorado River basin snowfall are determined from 700 mb atmospheric circulation. The 700mb time series is run through an S-mode Principal Component Analysis (PCA) which creates a synoptic index overthe western US region This synoptic index is used as input to a feed-forward backpropagation neural network todevelop transfer functions that simulate daily snowfall at approximately the 70% accuracy level. Thus, the neuralnetwork provides a scale translation mechanism for determining local surface parameters from synoptic scalecirculation. The nature of the synoptic controls on the Colorado River basin snowfall are determined by iterativelyremoving information from the neural nets and determining the influence of specific atmospheric variance regions onsnowfall. The primary synoptic control on the Colorado River basin snowfall comes from atmospheric variance in thePacific Northwest reflecting synoptic systems that originate over the Gulf of Alaska in concert with cyclogenesis inthe lee of the Rocky Mountains. Different Colorado River basin snow sub-regions, however, exhibit varying amountsof influence from the atmospheric variance regions defined by the synoptic index. Copyright © 2000 RoyalMeteorological Society.
KEY WORDS: synoptic climatology; Colorado River basin; snow; neural network
1. INTRODUCTION
This paper discusses the synoptic controls on snowfall over the upper Colorado River basin, the primarysource of water for the desert southwest US. Several previous studies describing hydroclimatic variablesover the region are reviewed in the next section, but the bulk of this paper is devoted to an analysis ofdaily snowfall characteristics and their synoptic controls. The synoptic controls on the wintertime snowfalldistribution are determined using the 700 mb geopotential height fields, where the synoptic-scale 700 mbatmospheric circulation is characterized using a rotated Principal Component Analysis (PCA). The PCAemploys a lagged analysis period to incorporate an air-mass history and the PCA scores are used as inputto a non-linear neural network which accounts for :70% of the daily snowfall variance. The snowfalldata are derived from daily observations from automated recording stations using the SNOw TELemetry(SNOTEL) system operated by the US Natural Resource Conservation Service (NRCS).
Portions of the Rocky Mountains, the Colorado Plateau and the Basin and Range province make upthe upper Colorado River basin, where most precipitation occurs in the higher elevations as snow. Somesnow falls on the southern rim of the Colorado Plateau, but the majority falls on the higher mountains;85% of the upper-basin Colorado River flow emanates from these high-elevation snowpacks (Grant andKahan, 1974). Thus, the Colorado River water resources depend mainly on winter snowpack located onthe upper Colorado River basin. The river is :2317 km long and drains a basin of 629370 km2. Overthe entire basin, an annual average of about 38 cm of rain falls with a range of 12.7 cm in the Arizonadeserts to over 127 cm in the high-elevation Colorado mountains (US Department of the Interior, 1987).
* Correspondence to: Department of Geography and the Center for Global and Regional Environmental Research, 316 Jessup Hall,The University of Iowa, Iowa City, IA, USA.
Copyright © 2000 Royal Meteorological Society
D.L. MCGINNIS132
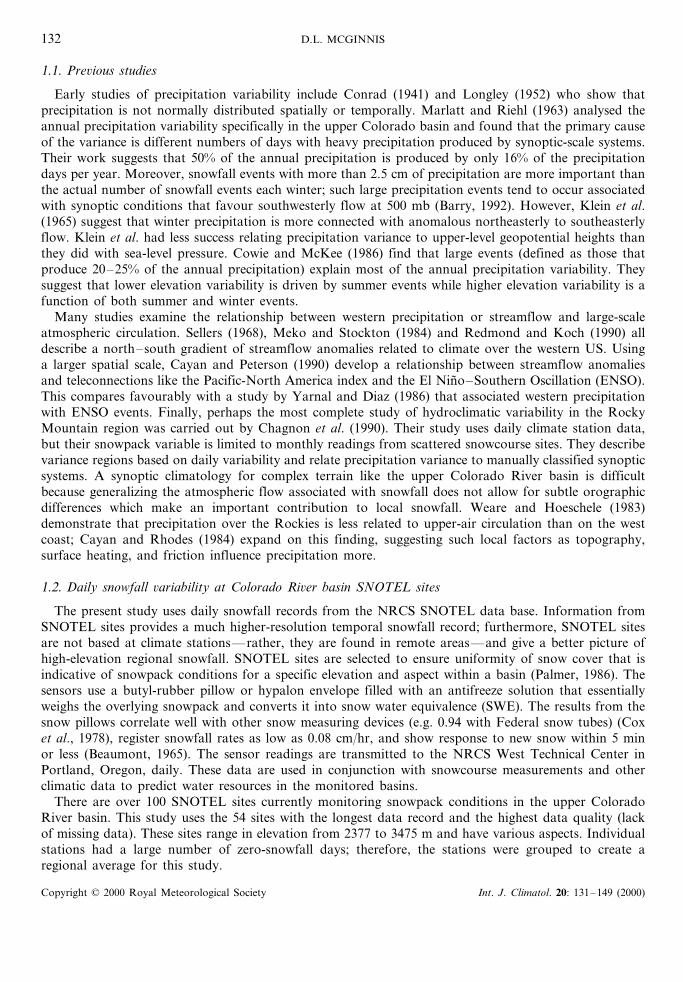
1.1. Pre6ious studies
Early studies of precipitation variability include Conrad (1941) and Longley (1952) who show thatprecipitation is not normally distributed spatially or temporally. Marlatt and Riehl (1963) analysed theannual precipitation variability specifically in the upper Colorado basin and found that the primary causeof the variance is different numbers of days with heavy precipitation produced by synoptic-scale systems.Their work suggests that 50% of the annual precipitation is produced by only 16% of the precipitationdays per year. Moreover, snowfall events with more than 2.5 cm of precipitation are more important thanthe actual number of snowfall events each winter; such large precipitation events tend to occur associatedwith synoptic conditions that favour southwesterly flow at 500 mb (Barry, 1992). However, Klein et al.(1965) suggest that winter precipitation is more connected with anomalous northeasterly to southeasterlyflow. Klein et al. had less success relating precipitation variance to upper-level geopotential heights thanthey did with sea-level pressure. Cowie and McKee (1986) find that large events (defined as those thatproduce 20–25% of the annual precipitation) explain most of the annual precipitation variability. Theysuggest that lower elevation variability is driven by summer events while higher elevation variability is afunction of both summer and winter events.
Many studies examine the relationship between western precipitation or streamflow and large-scaleatmospheric circulation. Sellers (1968), Meko and Stockton (1984) and Redmond and Koch (1990) alldescribe a north–south gradient of streamflow anomalies related to climate over the western US. Usinga larger spatial scale, Cayan and Peterson (1990) develop a relationship between streamflow anomaliesand teleconnections like the Pacific-North America index and the El Nino–Southern Oscillation (ENSO).This compares favourably with a study by Yarnal and Diaz (1986) that associated western precipitationwith ENSO events. Finally, perhaps the most complete study of hydroclimatic variability in the RockyMountain region was carried out by Chagnon et al. (1990). Their study uses daily climate station data,but their snowpack variable is limited to monthly readings from scattered snowcourse sites. They describevariance regions based on daily variability and relate precipitation variance to manually classified synopticsystems. A synoptic climatology for complex terrain like the upper Colorado River basin is difficultbecause generalizing the atmospheric flow associated with snowfall does not allow for subtle orographicdifferences which make an important contribution to local snowfall. Weare and Hoeschele (1983)demonstrate that precipitation over the Rockies is less related to upper-air circulation than on the westcoast; Cayan and Rhodes (1984) expand on this finding, suggesting such local factors as topography,surface heating, and friction influence precipitation more.
1.2. Daily snowfall 6ariability at Colorado Ri6er basin SNOTEL sites
The present study uses daily snowfall records from the NRCS SNOTEL data base. Information fromSNOTEL sites provides a much higher-resolution temporal snowfall record; furthermore, SNOTEL sitesare not based at climate stations—rather, they are found in remote areas—and give a better picture ofhigh-elevation regional snowfall. SNOTEL sites are selected to ensure uniformity of snow cover that isindicative of snowpack conditions for a specific elevation and aspect within a basin (Palmer, 1986). Thesensors use a butyl-rubber pillow or hypalon envelope filled with an antifreeze solution that essentiallyweighs the overlying snowpack and converts it into snow water equivalence (SWE). The results from thesnow pillows correlate well with other snow measuring devices (e.g. 0.94 with Federal snow tubes) (Coxet al., 1978), register snowfall rates as low as 0.08 cm/hr, and show response to new snow within 5 minor less (Beaumont, 1965). The sensor readings are transmitted to the NRCS West Technical Center inPortland, Oregon, daily. These data are used in conjunction with snowcourse measurements and otherclimatic data to predict water resources in the monitored basins.
There are over 100 SNOTEL sites currently monitoring snowpack conditions in the upper ColoradoRiver basin. This study uses the 54 sites with the longest data record and the highest data quality (lackof missing data). These sites range in elevation from 2377 to 3475 m and have various aspects. Individualstations had a large number of zero-snowfall days; therefore, the stations were grouped to create aregional average for this study.
Copyright © 2000 Royal Meteorological Society Int. J. Climatol. 20: 131–149 (2000)
SYNOPTIC CONTROLS ON SNOWFALL 133
To determine how the stations’ time series compare, a rotated PCA is performed on the SNOTELstation time series from 1981 to 1989. The snow year is defined as 1 October–31 May, following NRCSprecedent. Each of the 54 SNOTEL sites were individually analysed and any single-day snowfall eventgreater than five standard deviations (S.D.s) from the site mean were deleted from the time series. Forexample, one station reported a one-day event of 65.5 cm SWE. Such a single-day event is hardly likelyand is considered here to be a data error and is removed from the data set.
The S-mode PCA is performed such that the stations form the columns and their time series (daily datafrom 8 snow years) form the rows (cases). The correlation between stations forms a matrix from whichfive eigenvectors are extracted. When rotated, the stations that load most highly on a given eigenvectorrepresent a group with synchronous variance. The five eigenvectors describe 68% of the total variance andare used to define SNOTEL site groups with similar temporal variance. Within each group, the meanloading of each site on the eigenvector is between 0.61 and 0.68 (see Table I).
For the most part, the stations combine by simple regional geography, with the different mountainranges and their general aspects forming the basis for each group (see Figure 5.7 in McGinnis, 1994). Theexception occurs in the sites draining the Upper Green river where two sites in the Uinta Mountainscorrelate with sites further north in Wyoming. Each region is discussed in further detail below by focusingon the individual station that loads most highly on the group eigenvector, and is most representative ofthe group behaviour. The groups of general interest are those that drain into the Upper Colorado,Yampa-White, Gunnison, Dolores, and San Juan Rivers. These sites receive the greatest snow amounts,thus they contribute most to the flow of the Colorado River.
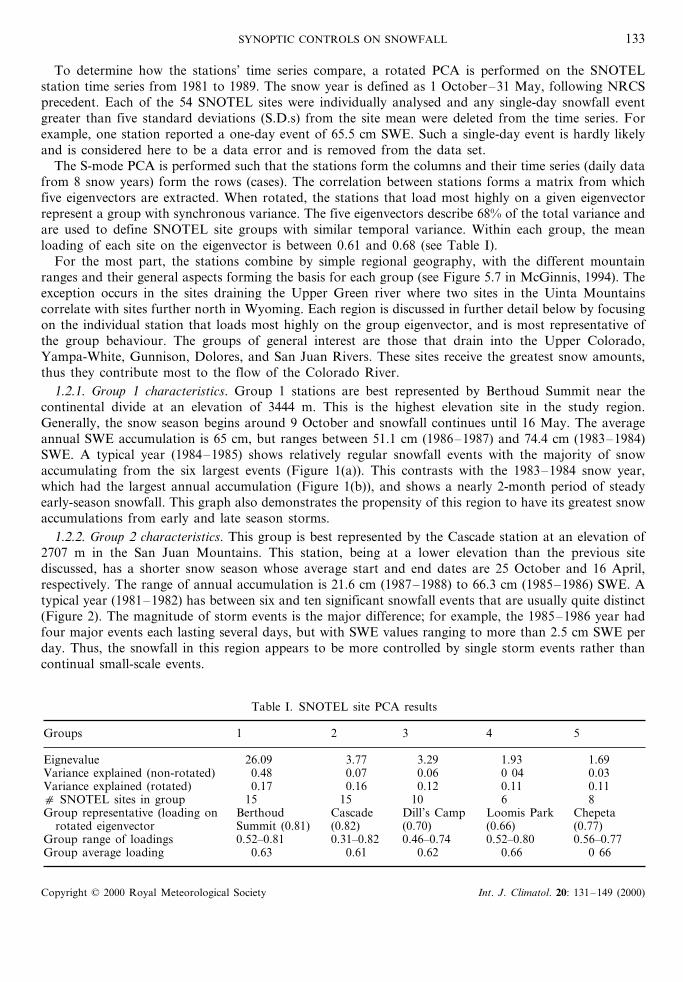
1.2.1. Group 1 characteristics. Group 1 stations are best represented by Berthoud Summit near thecontinental divide at an elevation of 3444 m. This is the highest elevation site in the study region.Generally, the snow season begins around 9 October and snowfall continues until 16 May. The averageannual SWE accumulation is 65 cm, but ranges between 51.1 cm (1986–1987) and 74.4 cm (1983–1984)SWE. A typical year (1984–1985) shows relatively regular snowfall events with the majority of snowaccumulating from the six largest events (Figure 1(a)). This contrasts with the 1983–1984 snow year,which had the largest annual accumulation (Figure 1(b)), and shows a nearly 2-month period of steadyearly-season snowfall. This graph also demonstrates the propensity of this region to have its greatest snowaccumulations from early and late season storms.
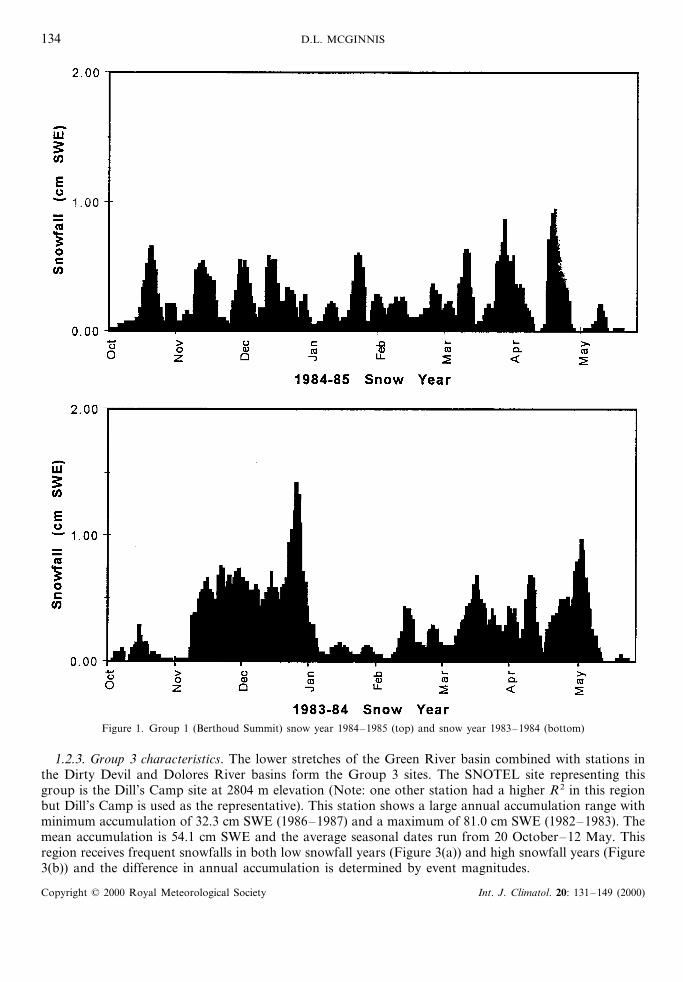
1.2.2. Group 2 characteristics. This group is best represented by the Cascade station at an elevation of2707 m in the San Juan Mountains. This station, being at a lower elevation than the previous sitediscussed, has a shorter snow season whose average start and end dates are 25 October and 16 April,respectively. The range of annual accumulation is 21.6 cm (1987–1988) to 66.3 cm (1985–1986) SWE. Atypical year (1981–1982) has between six and ten significant snowfall events that are usually quite distinct(Figure 2). The magnitude of storm events is the major difference; for example, the 1985–1986 year hadfour major events each lasting several days, but with SWE values ranging to more than 2.5 cm SWE perday. Thus, the snowfall in this region appears to be more controlled by single storm events rather thancontinual small-scale events.
Table I. SNOTEL site PCA results
Groups 41 2 3 5
26.09 1.69Eignevalue 1.933.293.77Variance explained (non-rotated) 0.48 0.07 0.06 0 04 0.03
0.110.17 0.16 0.12Variance explained (rotated) 0.11815 15 10c SNOTEL sites in group 6
ChepetaCascade Dill’s CampBerthoud Loomis ParkGroup representative (loading on(0.82) (0.70) (0.77)Summit (0.81)rotated eigenvector (0.66)
0.56–0.77Group range of loadings 0.52–0.800.46–0.740.31–0.820.52–0.810 660.660.620.610.63Group average loading
Copyright © 2000 Royal Meteorological Society Int. J. Climatol. 20: 131–149 (2000)
D.L. MCGINNIS134
Figure 1. Group 1 (Berthoud Summit) snow year 1984–1985 (top) and snow year 1983–1984 (bottom)
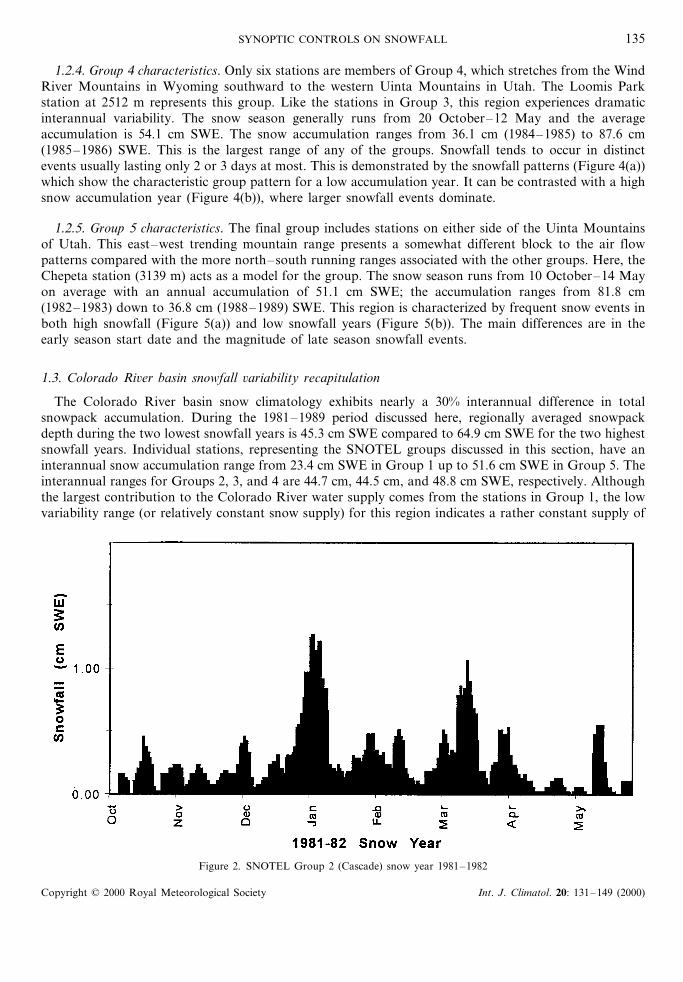
1.2.3. Group 3 characteristics. The lower stretches of the Green River basin combined with stations inthe Dirty Devil and Dolores River basins form the Group 3 sites. The SNOTEL site representing thisgroup is the Dill’s Camp site at 2804 m elevation (Note: one other station had a higher R2 in this regionbut Dill’s Camp is used as the representative). This station shows a large annual accumulation range withminimum accumulation of 32.3 cm SWE (1986–1987) and a maximum of 81.0 cm SWE (1982–1983). Themean accumulation is 54.1 cm SWE and the average seasonal dates run from 20 October–12 May. Thisregion receives frequent snowfalls in both low snowfall years (Figure 3(a)) and high snowfall years (Figure3(b)) and the difference in annual accumulation is determined by event magnitudes.
Copyright © 2000 Royal Meteorological Society Int. J. Climatol. 20: 131–149 (2000)
SYNOPTIC CONTROLS ON SNOWFALL 135
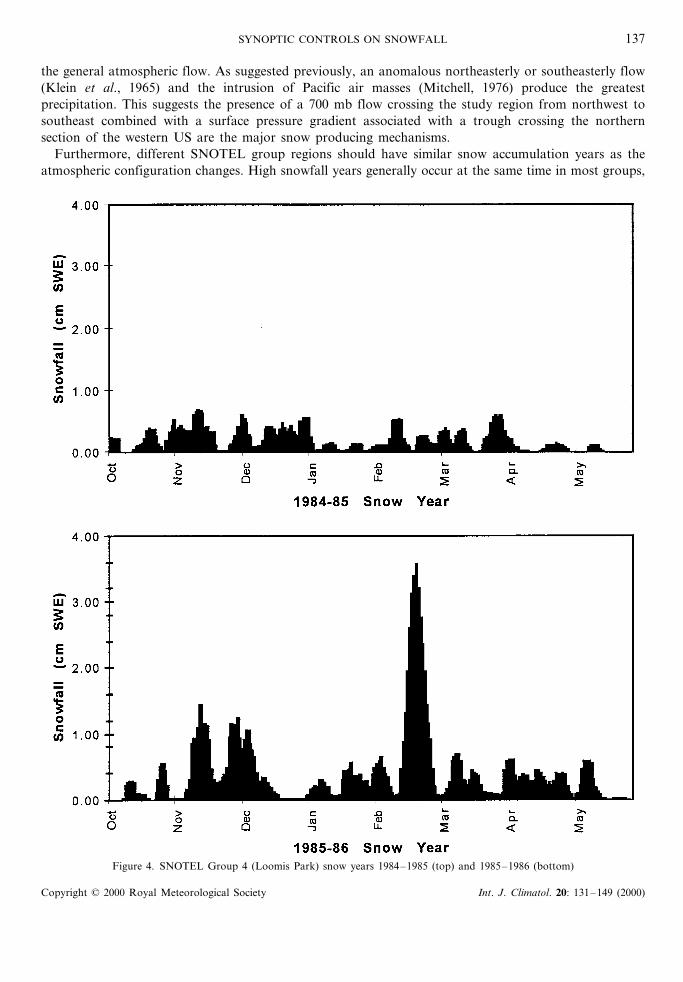
1.2.4. Group 4 characteristics. Only six stations are members of Group 4, which stretches from the WindRiver Mountains in Wyoming southward to the western Uinta Mountains in Utah. The Loomis Parkstation at 2512 m represents this group. Like the stations in Group 3, this region experiences dramaticinterannual variability. The snow season generally runs from 20 October–12 May and the averageaccumulation is 54.1 cm SWE. The snow accumulation ranges from 36.1 cm (1984–1985) to 87.6 cm(1985–1986) SWE. This is the largest range of any of the groups. Snowfall tends to occur in distinctevents usually lasting only 2 or 3 days at most. This is demonstrated by the snowfall patterns (Figure 4(a))which show the characteristic group pattern for a low accumulation year. It can be contrasted with a highsnow accumulation year (Figure 4(b)), where larger snowfall events dominate.
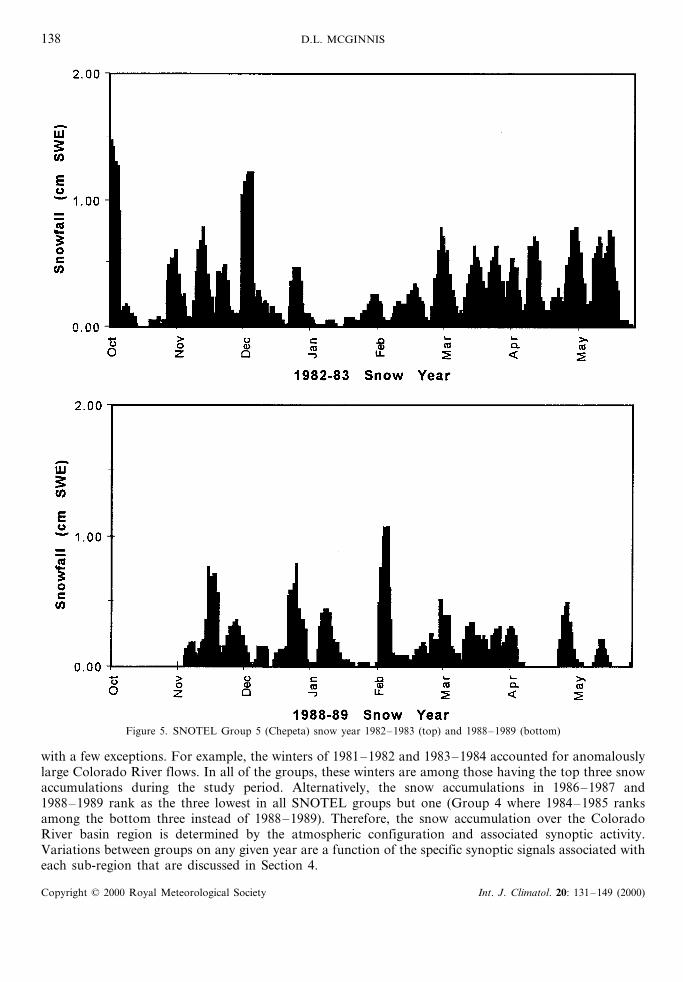
1.2.5. Group 5 characteristics. The final group includes stations on either side of the Uinta Mountainsof Utah. This east–west trending mountain range presents a somewhat different block to the air flowpatterns compared with the more north–south running ranges associated with the other groups. Here, theChepeta station (3139 m) acts as a model for the group. The snow season runs from 10 October–14 Mayon average with an annual accumulation of 51.1 cm SWE; the accumulation ranges from 81.8 cm(1982–1983) down to 36.8 cm (1988–1989) SWE. This region is characterized by frequent snow events inboth high snowfall (Figure 5(a)) and low snowfall years (Figure 5(b)). The main differences are in theearly season start date and the magnitude of late season snowfall events.
1.3. Colorado Ri6er basin snowfall 6ariability recapitulation
The Colorado River basin snow climatology exhibits nearly a 30% interannual difference in totalsnowpack accumulation. During the 1981–1989 period discussed here, regionally averaged snowpackdepth during the two lowest snowfall years is 45.3 cm SWE compared to 64.9 cm SWE for the two highestsnowfall years. Individual stations, representing the SNOTEL groups discussed in this section, have aninterannual snow accumulation range from 23.4 cm SWE in Group 1 up to 51.6 cm SWE in Group 5. Theinterannual ranges for Groups 2, 3, and 4 are 44.7 cm, 44.5 cm, and 48.8 cm SWE, respectively. Althoughthe largest contribution to the Colorado River water supply comes from the stations in Group 1, the lowvariability range (or relatively constant snow supply) for this region indicates a rather constant supply of
Figure 2. SNOTEL Group 2 (Cascade) snow year 1981–1982
Copyright © 2000 Royal Meteorological Society Int. J. Climatol. 20: 131–149 (2000)
D.L. MCGINNIS136
Figure 3. SNOTEL Group 3 (Dill’s Camp) snow years 1986–1987 (top) and 1982–1983 (bottom)
Colorado River water. This suggests, therefore, that the interannual variations in total water supply mustbe primarily a function of the variance in the other regions.
Based on the figures shown earlier, the frequency of snowfall events in these regions appears to remainrelatively constant from year to year; however, the size and duration of the storm events tend to differ.Therefore, interannual snow accumulation variance is related more to event characteristics than eventfrequency. This agrees with Marlatt and Riehl (1963) and Cowie and McKee (1986) suggesting that eventmagnitude and precipitation variance are most likely associated with air mass characteristics. Further-more, air mass characteristics normally will affect the entire Colorado River basin region depending on
Copyright © 2000 Royal Meteorological Society Int. J. Climatol. 20: 131–149 (2000)
SYNOPTIC CONTROLS ON SNOWFALL 137
the general atmospheric flow. As suggested previously, an anomalous northeasterly or southeasterly flow(Klein et al., 1965) and the intrusion of Pacific air masses (Mitchell, 1976) produce the greatestprecipitation. This suggests the presence of a 700 mb flow crossing the study region from northwest tosoutheast combined with a surface pressure gradient associated with a trough crossing the northernsection of the western US are the major snow producing mechanisms.
Furthermore, different SNOTEL group regions should have similar snow accumulation years as theatmospheric configuration changes. High snowfall years generally occur at the same time in most groups,
Figure 4. SNOTEL Group 4 (Loomis Park) snow years 1984–1985 (top) and 1985–1986 (bottom)
Copyright © 2000 Royal Meteorological Society Int. J. Climatol. 20: 131–149 (2000)
D.L. MCGINNIS138
Figure 5. SNOTEL Group 5 (Chepeta) snow year 1982–1983 (top) and 1988–1989 (bottom)
with a few exceptions. For example, the winters of 1981–1982 and 1983–1984 accounted for anomalouslylarge Colorado River flows. In all of the groups, these winters are among those having the top three snowaccumulations during the study period. Alternatively, the snow accumulations in 1986–1987 and1988–1989 rank as the three lowest in all SNOTEL groups but one (Group 4 where 1984–1985 ranksamong the bottom three instead of 1988–1989). Therefore, the snow accumulation over the ColoradoRiver basin region is determined by the atmospheric configuration and associated synoptic activity.Variations between groups on any given year are a function of the specific synoptic signals associated witheach sub-region that are discussed in Section 4.
Copyright © 2000 Royal Meteorological Society Int. J. Climatol. 20: 131–149 (2000)
SYNOPTIC CONTROLS ON SNOWFALL 139
2. SYNOPTIC INDEX FOR 700 mb CIRCULATION
Important developments for the analysis of regional climate include statistical downscaling methodologiesthat translate between the large-scale atmospheric circulation and local events. Traditionally, suchmethodologies have used linear relationships; however, neural networks provide a new way to accomplishthe same goal, with the added benefit of addressing the non-linear relationships that are characteristic ofsome climatic fields.
Hewitson and Crane (1992, 1993) provide examples of both approaches: predicting temperaturedistributions from atmospheric circulation using stepwise linear regression and using neural nets todemonstrate relationships between atmospheric circulation and regional precipitation These two studieswere carried out for very different climate regimes. The 1992 paper examined linear relationships betweenthe atmospheric circulation and the temperature distribution over the US, while the 1993 paper usedneural nets to examine relationships between circulation and rainfall in tropical Mexico—a locationwhere precipitation is discontinuous in time and is dominated by convective processes. Neural netsperformed well under these conditions, but there was no direct comparison of neural nets with moretraditional linear procedures. McGinnis (1994) compares stepwise multiple regressions and neuralnetworks for simulating daily snowfall from atmospheric circulation and finds that neural networksexplain twice the variance of the regression methodologies. Therefore, neural nets are used here todescribe the relationship between atmospheric circulation and local/regional daily snowfall.
2.1. Data preparation and methodology
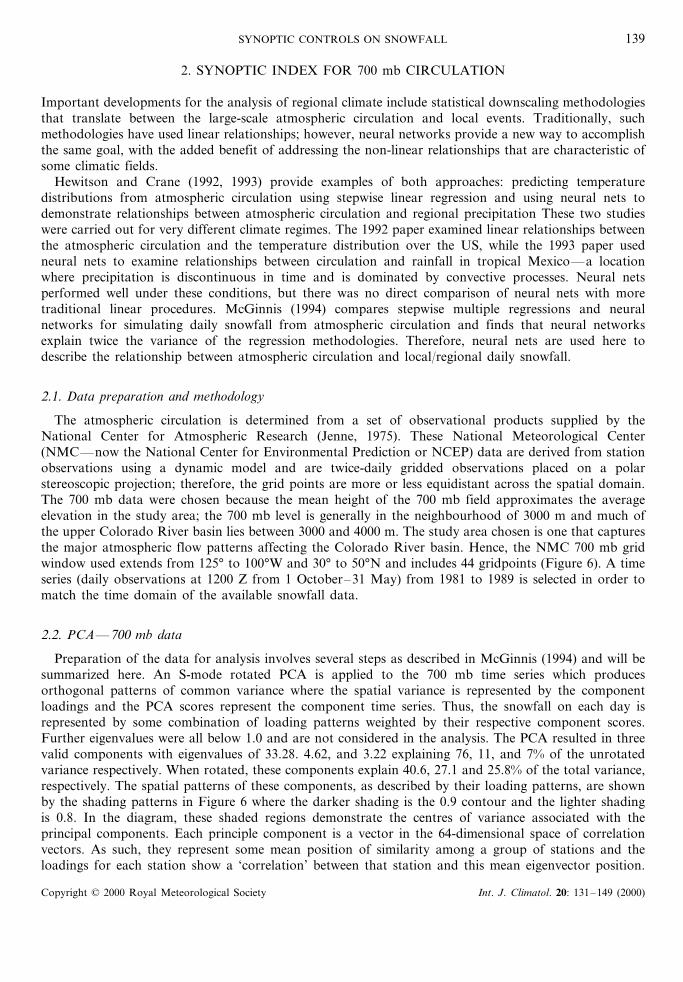
The atmospheric circulation is determined from a set of observational products supplied by theNational Center for Atmospheric Research (Jenne, 1975). These National Meteorological Center(NMC—now the National Center for Environmental Prediction or NCEP) data are derived from stationobservations using a dynamic model and are twice-daily gridded observations placed on a polarstereoscopic projection; therefore, the grid points are more or less equidistant across the spatial domain.The 700 mb data were chosen because the mean height of the 700 mb field approximates the averageelevation in the study area; the 700 mb level is generally in the neighbourhood of 3000 m and much ofthe upper Colorado River basin lies between 3000 and 4000 m. The study area chosen is one that capturesthe major atmospheric flow patterns affecting the Colorado River basin. Hence, the NMC 700 mb gridwindow used extends from 125° to 100°W and 30° to 50°N and includes 44 gridpoints (Figure 6). A timeseries (daily observations at 1200 Z from 1 October–31 May) from 1981 to 1989 is selected in order tomatch the time domain of the available snowfall data.
2.2. PCA—700 mb data
Preparation of the data for analysis involves several steps as described in McGinnis (1994) and will besummarized here. An S-mode rotated PCA is applied to the 700 mb time series which producesorthogonal patterns of common variance where the spatial variance is represented by the componentloadings and the PCA scores represent the component time series. Thus, the snowfall on each day isrepresented by some combination of loading patterns weighted by their respective component scores.Further eigenvalues were all below 1.0 and are not considered in the analysis. The PCA resulted in threevalid components with eigenvalues of 33.28. 4.62, and 3.22 explaining 76, 11, and 7% of the unrotatedvariance respectively. When rotated, these components explain 40.6, 27.1 and 25.8% of the total variance,respectively. The spatial patterns of these components, as described by their loading patterns, are shownby the shading patterns in Figure 6 where the darker shading is the 0.9 contour and the lighter shadingis 0.8. In the diagram, these shaded regions demonstrate the centres of variance associated with theprincipal components. Each principle component is a vector in the 64-dimensional space of correlationvectors. As such, they represent some mean position of similarity among a group of stations and theloadings for each station show a ‘correlation’ between that station and this mean eigenvector position.
Copyright © 2000 Royal Meteorological Society Int. J. Climatol. 20: 131–149 (2000)
D.L. MCGINNIS140
Figure 6. NMC gridpoints in the synoptic study and 700 mb PCA loading patterns (the 0.9 and the 0.8 contours are the darker andlighter shadings, respectively)
While the actual spatial patterns associated with the PCA components have no ‘real’ meaning, we canassociate their variance patterns with climate phenomena that relate to the same spatial domain. Forexample, in component 1 the variance pattern covers the southeast portion of the study region—mostlikely related to synoptic systems resulting from Rocky Mountain lee cyclogenesis. The second pattern isin the same region as North Pacific and Gulf of Alaska synoptic systems and the third pattern occurswhere the effects of the sub-tropical Pacific and the southern branch of the jet stream dominate. Despitethe fact that the individual component loading patterns cannot be directly related to specific climatefeatures, these spatial regions make climatological sense and provide a ‘simplified’ index of the 700 mbcirculation over the region. Any given day can be represented as a combination of these three variancepatterns and the component score values calculated by combining the original data time series with ascore coefficient matrix determined by the PCA procedure. The score values become the input data to theneural net algorithms used to predict snowfall.
3. NEURAL NETWORK ANALYSIS
Complex behaviour in the atmosphere does not lend itself to linear-analytical techniques and neuralnetworks provide new approaches to problem solving that use non-linear mathematics and are applicableto a wide variety of problems.
Neural networks are analogous to linear regression in concept where a set of independent variables isused to predict a dependent variable. Non-linear regression parameters may be specified, but neuralnetworks can accommodate non-linearities that are arbitrary in nature. Neural nets have the ability togeneralize relationships from a small subset of data and to handle noisy inputs or missing inputparameters (Hewitson and Crane, 1994). The mathematical structure of various neural net forms aredetailed in Clothiaux and Bachmann (1994) but a simplified discussion of neural net structures should
Copyright © 2000 Royal Meteorological Society Int. J. Climatol. 20: 131–149 (2000)
SYNOPTIC CONTROLS ON SNOWFALL 141
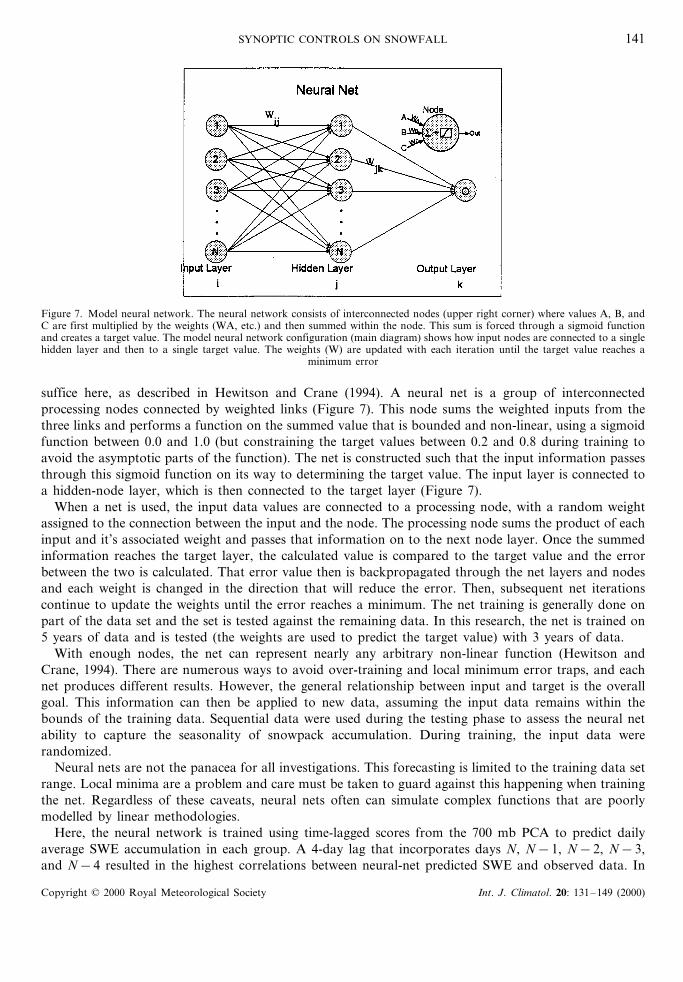
Figure 7. Model neural network. The neural network consists of interconnected nodes (upper right corner) where values A, B, andC are first multiplied by the weights (WA, etc.) and then summed within the node. This sum is forced through a sigmoid functionand creates a target value. The model neural network configuration (main diagram) shows how input nodes are connected to a singlehidden layer and then to a single target value. The weights (W) are updated with each iteration until the target value reaches a
minimum error
suffice here, as described in Hewitson and Crane (1994). A neural net is a group of interconnectedprocessing nodes connected by weighted links (Figure 7). This node sums the weighted inputs from thethree links and performs a function on the summed value that is bounded and non-linear, using a sigmoidfunction between 0.0 and 1.0 (but constraining the target values between 0.2 and 0.8 during training toavoid the asymptotic parts of the function). The net is constructed such that the input information passesthrough this sigmoid function on its way to determining the target value. The input layer is connected toa hidden-node layer, which is then connected to the target layer (Figure 7).
When a net is used, the input data values are connected to a processing node, with a random weightassigned to the connection between the input and the node. The processing node sums the product of eachinput and it’s associated weight and passes that information on to the next node layer. Once the summedinformation reaches the target layer, the calculated value is compared to the target value and the errorbetween the two is calculated. That error value then is backpropagated through the net layers and nodesand each weight is changed in the direction that will reduce the error. Then, subsequent net iterationscontinue to update the weights until the error reaches a minimum. The net training is generally done onpart of the data set and the set is tested against the remaining data. In this research, the net is trained on5 years of data and is tested (the weights are used to predict the target value) with 3 years of data.
With enough nodes, the net can represent nearly any arbitrary non-linear function (Hewitson andCrane, 1994). There are numerous ways to avoid over-training and local minimum error traps, and eachnet produces different results. However, the general relationship between input and target is the overallgoal. This information can then be applied to new data, assuming the input data remains within thebounds of the training data. Sequential data were used during the testing phase to assess the neural netability to capture the seasonality of snowpack accumulation. During training, the input data wererandomized.
Neural nets are not the panacea for all investigations. This forecasting is limited to the training data setrange. Local minima are a problem and care must be taken to guard against this happening when trainingthe net. Regardless of these caveats, neural nets often can simulate complex functions that are poorlymodelled by linear methodologies.
Here, the neural network is trained using time-lagged scores from the 700 mb PCA to predict dailyaverage SWE accumulation in each group. A 4-day lag that incorporates days N, N−1, N−2, N−3,and N−4 resulted in the highest correlations between neural-net predicted SWE and observed data. In
Copyright © 2000 Royal Meteorological Society Int. J. Climatol. 20: 131–149 (2000)
D.L. MCGINNIS142
Table II. Correlations and RMSE between observed daily SWE for the period 1986–1989 (the neural net testing period)
Group 1 Group 2 Group 3 Group 4 Group 5
1986–1989 R2 0.64 0.77 0.77 0.68 0.62RMSE (cm) 0.17 0.14 0.11 0.09 0.10
general, the neural net captures the phase of snowfall events well and most daily events less than 1.0 cmare well modelled. However, large magnitude events are sometimes underpredicted (see Figures 5.9 and5.11–5.14 in McGinnis, 1994). Over a given snow year, SWE increases as a result of a relatively smallnumber of days with significant snowfall totals. The majority of days have little or no snowfall. Theneural net is trained to best simulate all days, not just the major-event snowfalls. As a result, the largerevents are likely to be under-predicted as the net attempts to model the lower daily values. If the net weretrained on precipitation-days only, the results would most likely be significant over-prediction of annualSWE. Therefore, the neural networks used here present a compromise and focus on the entire data seriesinstead of the precipitation events only. The result is an under-estimation of high-precipitation events.
Table II summarizes the correlation between daily SWE and net-predicted values along with the rootmean-squared error (RMSE) between these values. The ability of the net to match the interannualvariation and to closely model annual snowfall accumulation magnitudes gives confidence in the synopticcontrols on snowfall and the ability of the neural net methodology to simulate this relationship. Snowfallon the Colorado River basin is influenced by a variety of meteorological parameters such as humidity andtemperature that determine the atmospheric state at any given time. While these are all, to some degree,a function of the large-scale circulation, none of this information is input directly into the net.Considering that the input data merely show the 5-day history of variance in synoptic-scale 700 mbcirculation, the power of the neural networks to predict daily snowfall from atmospheric circulation isexceptional. The net predicts a regional value for a climate variable (group average snowfall) from alarge-scale parameter (atmospheric circulation) with high degree of accuracy.
4. SYNOPTIC CONTROLS
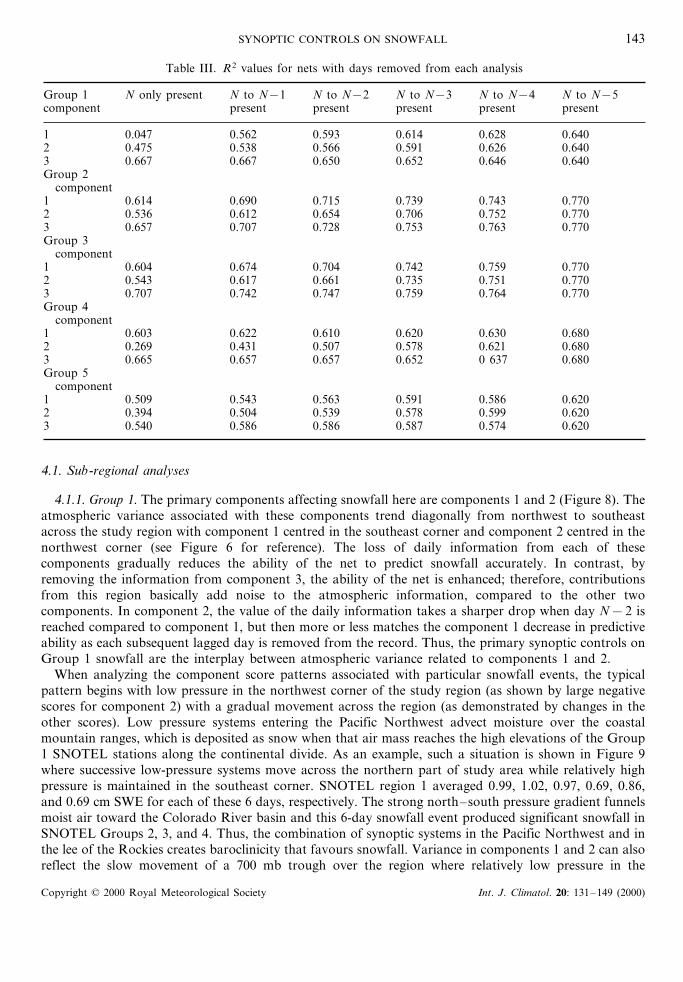
In order to determine the most important variance pattern responsible for snowfall in a given SNOTELgroup, a data-removal method is used where successive days of information are iteratively removed fromthe data set. The net (with a new configuration) is then run with the reduced data set to determine whatchange occurs when fewer lagged days are included from each component. In this technique, the laggedinformation from a given component is removed starting with day N−4 and each subsequent day isdeleted (constructing a new neural net each time) until no information from that component is present inthe net. The resulting R2 values for the net predictions (comparing the 3-year test set net-predictedsnowfall to observed snowfall) provide the evidence for that synoptic index region’s daily importance tothe ability of the net to determine snowfall. Each time a day of information is removed, the netconfiguration must be modified; however, the basic structure of the net remains constant with X inputsconnected to 1.5X hidden-layer nodes resulting in a single target value. Maintaining a constant ratiobetween input and hidden-layer nodes is an arbitrary and pragmatic method to avoid testing endlesspermutations searching for the absolute best network configuration. By keeping the configuration thesame, only one variable (the number of input nodes) is allowed to change, resulting in R2 values thatdemonstrate the importance of each lagged component’s information in predicting snowfall (Table III).
These results show how each group reacts to different components and differing numbers of laggeddays being removed. While each group has its own characteristics, the analysis reveals several commonfeatures that reflect a large regional response to atmospheric variability.
Copyright © 2000 Royal Meteorological Society Int. J. Climatol. 20: 131–149 (2000)
SYNOPTIC CONTROLS ON SNOWFALL 143
Table III. R2 values for nets with days removed from each analysis
Group 1 N to N−5N only present N to N−1 N to N−4N to N−2 N to N−3present presentpresentpresentcomponent present
1 0.047 0.562 0.593 0.614 0.628 0.6402 0.475 0.538 0.566 0.591 0.626 0.6403 0.667 0.667 0.650 0.652 0.646 0.640Group 2
component1 0.614 0.690 0.715 0.739 0.743 0.7702 0.536 0.612 0.654 0.706 0.752 0.7703 0.657 0.707 0.728 0.753 0.763 0.770Group 3
component1 0.604 0.674 0.704 0.742 0.759 0.7702 0.543 0.617 0.661 0.735 0.751 0.7703 0.707 0.742 0.747 0.759 0.764 0.770Group 4
component1 0.603 0.622 0.610 0.620 0.630 0.6802 0.269 0.431 0.507 0.578 0.621 0.6803 0.665 0.657 0.657 0.652 0 637 0.680Group 5
component1 0.509 0.543 0.563 0.591 0.586 0.6202 0.394 0.504 0.539 0.578 0.599 0.6203 0.540 0.586 0.586 0.587 0.574 0.620
4.1. Sub-regional analyses
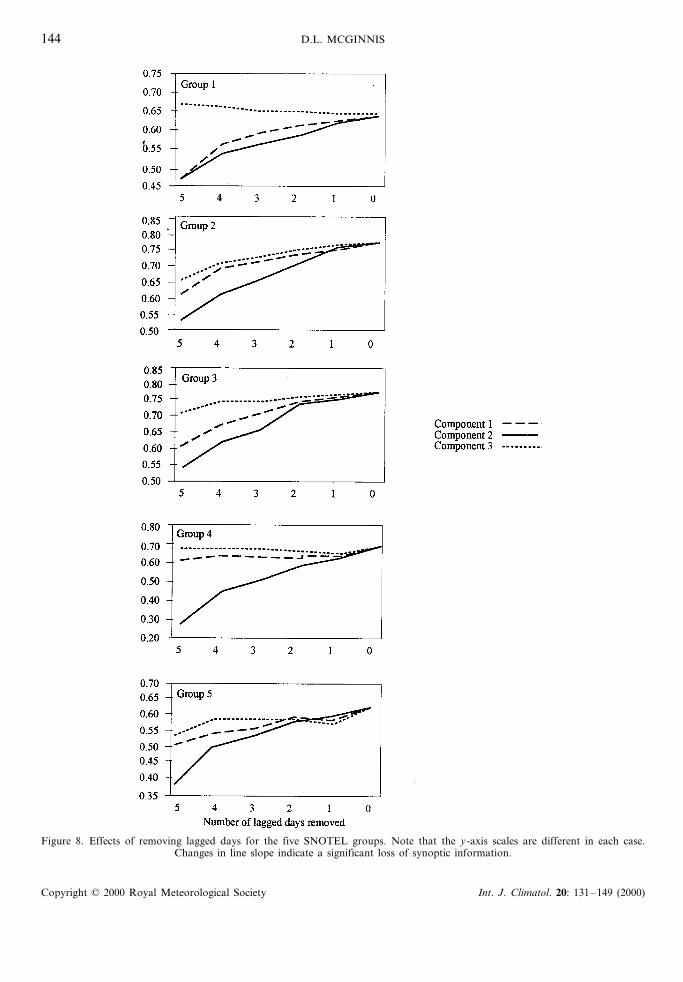
4.1.1. Group 1. The primary components affecting snowfall here are components 1 and 2 (Figure 8). Theatmospheric variance associated with these components trend diagonally from northwest to southeastacross the study region with component 1 centred in the southeast corner and component 2 centred in thenorthwest corner (see Figure 6 for reference). The loss of daily information from each of thesecomponents gradually reduces the ability of the net to predict snowfall accurately. In contrast, byremoving the information from component 3, the ability of the net is enhanced; therefore, contributionsfrom this region basically add noise to the atmospheric information, compared to the other twocomponents. In component 2, the value of the daily information takes a sharper drop when day N−2 isreached compared to component 1, but then more or less matches the component 1 decrease in predictiveability as each subsequent lagged day is removed from the record. Thus, the primary synoptic controls onGroup 1 snowfall are the interplay between atmospheric variance related to components 1 and 2.
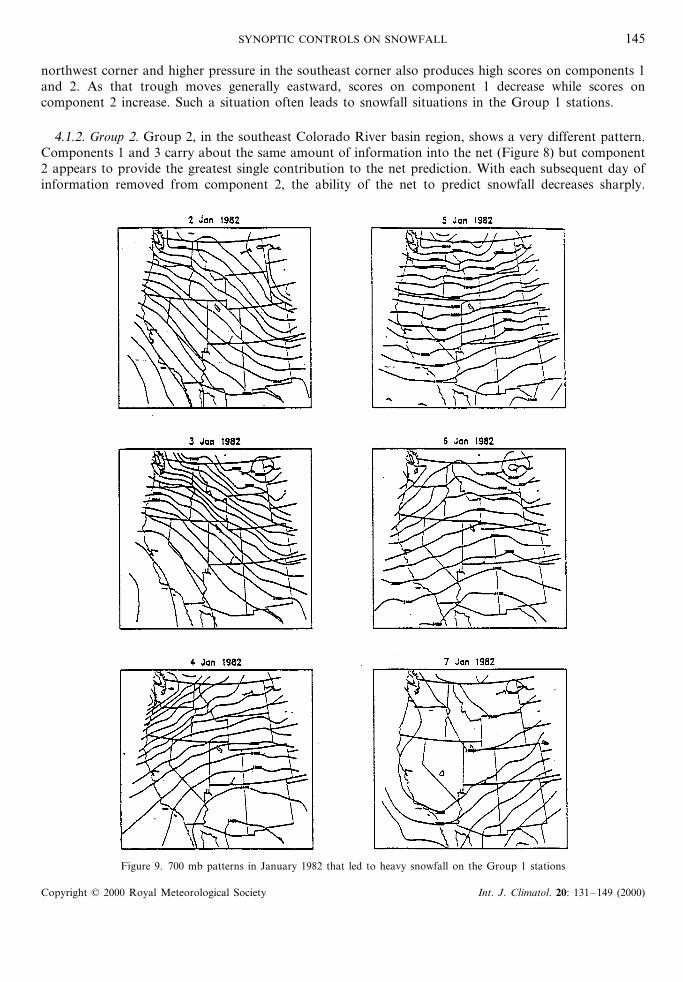
When analyzing the component score patterns associated with particular snowfall events, the typicalpattern begins with low pressure in the northwest corner of the study region (as shown by large negativescores for component 2) with a gradual movement across the region (as demonstrated by changes in theother scores). Low pressure systems entering the Pacific Northwest advect moisture over the coastalmountain ranges, which is deposited as snow when that air mass reaches the high elevations of the Group1 SNOTEL stations along the continental divide. As an example, such a situation is shown in Figure 9where successive low-pressure systems move across the northern part of study area while relatively highpressure is maintained in the southeast corner. SNOTEL region 1 averaged 0.99, 1.02, 0.97, 0.69, 0.86,and 0.69 cm SWE for each of these 6 days, respectively. The strong north–south pressure gradient funnelsmoist air toward the Colorado River basin and this 6-day snowfall event produced significant snowfall inSNOTEL Groups 2, 3, and 4. Thus, the combination of synoptic systems in the Pacific Northwest and inthe lee of the Rockies creates baroclinicity that favours snowfall. Variance in components 1 and 2 can alsoreflect the slow movement of a 700 mb trough over the region where relatively low pressure in the
Copyright © 2000 Royal Meteorological Society Int. J. Climatol. 20: 131–149 (2000)
D.L. MCGINNIS144
Figure 8. Effects of removing lagged days for the five SNOTEL groups. Note that the y-axis scales are different in each case.Changes in line slope indicate a significant loss of synoptic information.
Copyright © 2000 Royal Meteorological Society Int. J. Climatol. 20: 131–149 (2000)
SYNOPTIC CONTROLS ON SNOWFALL 145
northwest corner and higher pressure in the southeast corner also produces high scores on components 1and 2. As that trough moves generally eastward, scores on component 1 decrease while scores oncomponent 2 increase. Such a situation often leads to snowfall situations in the Group 1 stations.
4.1.2. Group 2. Group 2, in the southeast Colorado River basin region, shows a very different pattern.Components 1 and 3 carry about the same amount of information into the net (Figure 8) but component2 appears to provide the greatest single contribution to the net prediction. With each subsequent day ofinformation removed from component 2, the ability of the net to predict snowfall decreases sharply.
Figure 9. 700 mb patterns in January 1982 that led to heavy snowfall on the Group 1 stations
Copyright © 2000 Royal Meteorological Society Int. J. Climatol. 20: 131–149 (2000)
D.L. MCGINNIS146
Again, many of these stations lie along the continental divide and/or have a northwest aspect and stormsassociated with the Pacific Northwest provide the greatest snowfall for this group. Why is the varianceassociated with component 1 less important here than in the Group 1 stations described above? Theanswer most likely lies in the path of air mass movement. In Group 1, the atmospheric flow became mostimportant as moisture was advected from the northwest and the barrier of the continental divide providedan uplift mechanism that promoted snowfall. In the Group 2 area, however, the advection has to traversea greater distance of mountain structures and much of the moisture is extracted further to the northwest.Therefore, the depth of low pressure associated with component 2 and the ability of that system to carrymoisture further into the mountains becomes important. Furthermore, the greater the pressure gradientis between the southeast and the northwest corners the more likely there will be southeasterly flow fromthe Gulf of Mexico that will be uplifted along the continental divide in this region causing snowfall.
Cyclones generated in the lee of the Rockies which would be reflected in the component 1 varianceregion, often travel quickly northeastward and becomes less influential for the southeastern ColoradoRiver basin. Additionally, the stations of Group 2 are the southernmost stations on the Colorado Riverbasin and are more influenced by the high pressures associated with the desert regions of New Mexico andArizona. It is important to note that this sub-region, along with Group 3, performed the best in the netpredictions.
4.1.3. Group 3. The Group 3 net results matched the high performance found in Group 2. The snowfallis strongly affected by synoptic controls; the SNOTEL stations in Group 3, however, are low in numberand small in comparative importance to Colorado River flow. This is a relatively dry region and in mostyears, this group shows the least average snow accumulation. The most important atmospheric varianceregion here is component 2 followed by component 1. Surprisingly, component 3 adds little if anyinformation important to snowfall to this southwestern-most group (Figure 8). These stations tend to beat much lower elevation than other stations and receive less snow related to general advective upliftingover the mountain barriers.
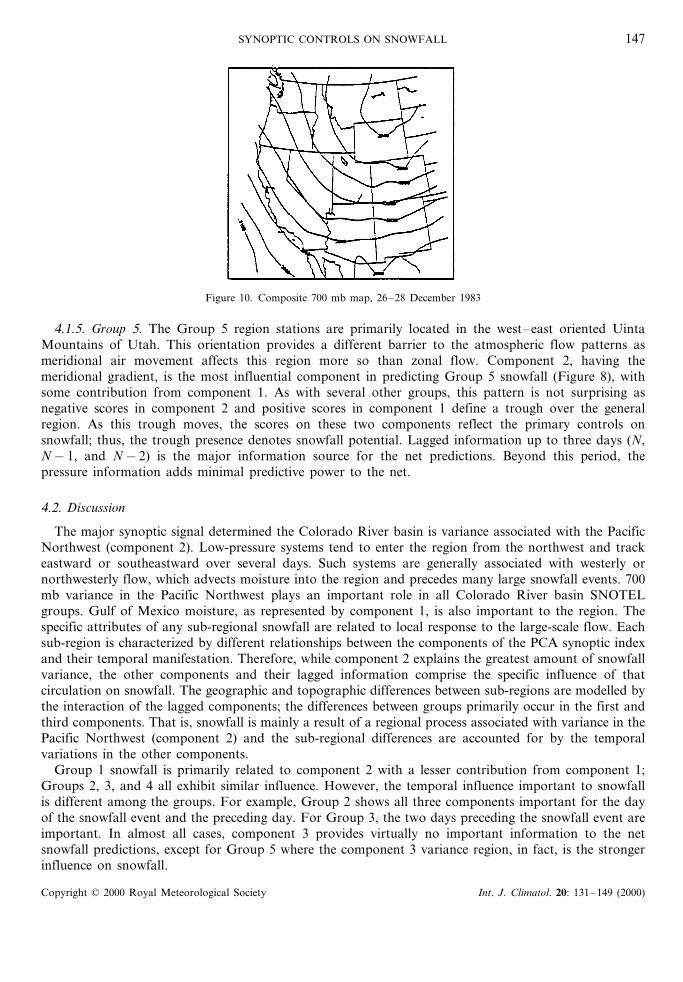
For this group, the most important information days for snowfall prediction are days N, N−1, andN−2. The maximum R2 values are reached at day N−2, and further lagged data appear unimportant.This set of three days provides the greatest information, especially in components 1 and 2. As in Group1, the primary driving force behind the regional snowfall variance is storm systems beginning in thePacific Northwest and moving across the region Group 3 is affected by this transition less than thestations in Group 1 because any trough associated with such a storm system moves away from the Group3 sub-region sooner than happens in Group 1. Furthermore, the area to the west of Group 3 is a drydesert-like area with little moisture to add to the atmosphere. Also, less moisture from the Gulf of Mexicocan reach the area. The combination of these factors creates a reduced moisture source. The result is lessavailable moisture than there is for the other regions. High snowfall in the Group 3 region is oftenassociated with lows that move slowly across the Colorado River basin, e.g. Figure 10. One notableoccurrence was the El Nino winter of 1982–1983 when the SNOTEL stations in Group 3 received thegreatest snowfall in the Colorado River basin. During this winter, a nearly stationary wave developed inthe jet stream with a trough off the southern California coast and a ridge stretching north of the GreatLakes. This pattern advected more moisture than normal to the Group 3 region. Even in this situation,however, the variance patterns associated with components 1 and 2 were most important showing arelatively stationary high and low, respectively.
4.1.4. Group 4. Group 4, to no surprise, has only one component of importance—component 2. Thisnorthwestern-most section of the Colorado River basin receives the first influences of variance associatedwith component 2. Two days of lagged information are important in component 2 (Figure 8) whereascomponents 1 and 3 contain virtually no information important to the net predictions. This regionexperiences some of the greatest snowfall amounts anywhere in the basin with 1985–1986 having a totalof 99.21 cm SWE. Such accumulations are primarily a result of cyclonic systems emanating from thenorthern Pacific/Gulf of Alaska region.
Copyright © 2000 Royal Meteorological Society Int. J. Climatol. 20: 131–149 (2000)
SYNOPTIC CONTROLS ON SNOWFALL 147
Figure 10. Composite 700 mb map, 26–28 December 1983
4.1.5. Group 5. The Group 5 region stations are primarily located in the west–east oriented UintaMountains of Utah. This orientation provides a different barrier to the atmospheric flow patterns asmeridional air movement affects this region more so than zonal flow. Component 2, having themeridional gradient, is the most influential component in predicting Group 5 snowfall (Figure 8), withsome contribution from component 1. As with several other groups, this pattern is not surprising asnegative scores in component 2 and positive scores in component 1 define a trough over the generalregion. As this trough moves, the scores on these two components reflect the primary controls onsnowfall; thus, the trough presence denotes snowfall potential. Lagged information up to three days (N,N−1, and N−2) is the major information source for the net predictions. Beyond this period, thepressure information adds minimal predictive power to the net.
4.2. Discussion
The major synoptic signal determined the Colorado River basin is variance associated with the PacificNorthwest (component 2). Low-pressure systems tend to enter the region from the northwest and trackeastward or southeastward over several days. Such systems are generally associated with westerly ornorthwesterly flow, which advects moisture into the region and precedes many large snowfall events. 700mb variance in the Pacific Northwest plays an important role in all Colorado River basin SNOTELgroups. Gulf of Mexico moisture, as represented by component 1, is also important to the region. Thespecific attributes of any sub-regional snowfall are related to local response to the large-scale flow. Eachsub-region is characterized by different relationships between the components of the PCA synoptic indexand their temporal manifestation. Therefore, while component 2 explains the greatest amount of snowfallvariance, the other components and their lagged information comprise the specific influence of thatcirculation on snowfall. The geographic and topographic differences between sub-regions are modelled bythe interaction of the lagged components; the differences between groups primarily occur in the first andthird components. That is, snowfall is mainly a result of a regional process associated with variance in thePacific Northwest (component 2) and the sub-regional differences are accounted for by the temporalvariations in the other components.
Group 1 snowfall is primarily related to component 2 with a lesser contribution from component 1;Groups 2, 3, and 4 all exhibit similar influence. However, the temporal influence important to snowfallis different among the groups. For example, Group 2 shows all three components important for the dayof the snowfall event and the preceding day. For Group 3, the two days preceding the snowfall event areimportant. In almost all cases, component 3 provides virtually no important information to the netsnowfall predictions, except for Group 5 where the component 3 variance region, in fact, is the strongerinfluence on snowfall.
Copyright © 2000 Royal Meteorological Society Int. J. Climatol. 20: 131–149 (2000)
D.L. MCGINNIS148
Despite the fact that many storm systems are multi-day events and the analysis discussed here suggestsa synoptic time frame of 5 days, the most important net prediction period days are N, N−1, N−2 andN−3. For the most part, all groups require three days of lagged information in the net. Groups 2, 4, and5 all show components 1 and 3 to be much less influential than component 2, as removing these laggedcomponents from the net has little influence on the neural net ability to predict daily snowfall.
A common scenario for large snowfall events includes a trough of low pressure advecting moist air intothe region from off the southern California coast followed by a low pressure system coming from thenorthern Pacific/Gulf of Alaska that carries with it mechanisms for vertical motion and lower tempera-tures. When this system reaches the Colorado River basin, the relatively moist air mass (combined withadditional moisture advected from the Gulf of Mexico) is lifted and snowfall occurs. Then, thelow-pressure system moves out onto the plains. Initially, this system is indicated by a set of low scores oncomponent 2 and high scores on component 1 suggesting the presence of a trough dipping through theregion This is often followed by the opposite situation where a ridge is established over the mountains anda trough enters the US mid-section.
Snowfall on the Colorado River basin is strongly related to large-scale atmospheric circulation. It ispossible to characterize the atmospheric variance and create a synoptic circulation index that can then beused to simulate daily snowfall using neural networks. The synoptic controls on snowfall shown in thisresearch demonstrate the influence of both the large-scale atmospheric configuration and other localfactors such as orography. This study confirms earlier studies (e.g. Marlatt and Riehl, 1963; Mitchell,1976; Cowie and McKee, 1986) that suggest Colorado River basin snowpack is more dependent onstorm-event magnitude than storm frequency and that the primary source region for Colorado Riverbasin storm events is the Pacific Northwest and Gulf of Alaska.
ACKNOWLEDGEMENTS
The work performed in this paper was completed under NSF Grant cEAR-963429 to M. Serreze,University of Colorado and D.L. McGinnis, University of Iowa and NASA GrantcNAG-5-7543 to A.Frei, University of Colorado and D.L. McGinnis, University of Iowa. Dr B.C. Hewitson, University ofCape Town, South Africa has helped this project in many ways. The NevProp neural network softwarewas supplied by Dr P. Goodman, University of Nevada, Reno, USA.
REFERENCES
Barry, R.G. 1992. Mountain Weather and Climate, 2nd edn., Routledge, New York, 402 pp.Beaumont, R.T. 1965. ‘Mt. Hood pressure pillow gage’, Proceedings of the 45th Western Snow Conference, Colorado Springs, CO,
pp. 29–35Cayan, D.R. and Peterson, D.H. 1990. The Influence of North Pacific Atmospheric Circulation on Streamflow in the West,
Geophysical Monograph 55, American Geophysical Union, pp. 375–397.Cayan, D.R. and Rhodes, J.O. 1984. ‘Local relationships between United States west coast precipitation and monthly mean
circulation parameters’, Mon. Weather Re6., 112, 1276–1282.Chagnon, D., McKee, T.B. and Doesken, N.J. 1990. Hydroclimatic Variability in the Rocky Mountain Region, Climatology Report
No. 90-3, Atmospheric Science Paper No. 475, Department of Atmospheric Sciences, Colorado State University, Fort Collins,CO, 225 pp.
Clothiaux, E.E. and Bachmann, C.M. 1994. ‘Neural networks and their applications’, in Hewitson, B.C. and Crane, R.G. (eds),Neural Nets: Applications in Geography, Kluwer, Boston, pp. 11–52.
Conrad, V. 1941. ‘The variability of precipitation’, Mon. Weather Re6., 69, 5–11.Cowie, J.R. and McKee, T.B. 1986. Colorado Precipitation E6ent and Variability Analyses, Climatology Report No. 86-3,
Department of Atmospheric Sciences, Colorado State University, 102 pp.Cox, L.M., Bartee, L.D., Crook, A.G., Farnes, P.E. and Smith, J.L. 1978. ‘The care and feeding of snow pillows’, Proceedings of
the 46th Western Snow Conference, Otter Crest, OR, pp. 40–47.Grant, L.O. and Kahan, A.M. 1974. ‘Weather modification for augmenting orographic precipitation’, in Hess, W.N. (ed.), Weather
and Climate Modification, Wiley, New York, pp. 282–317.Hewitson, B.H. and Crane, R.G. 1992. ‘Regional-scale prediction from the GISS GCM’, Paleogeogr., Paleoclimatol., Paleoecol.
(Global Planet. Chang. Sect.), 97, 249–267.Hewitson, B.H. and Crane, R.G. 1993. ‘Large-scale controls on local precipitation in tropical Mexico’, Geophys. Res. Let., 19(18),
1835–1838.Hewitson, B.H. and Crane, R.G. (eds) 1994. Neural Nets: Applications in Geography, Kluwer, Boston, 194 pp.
Copyright © 2000 Royal Meteorological Society Int. J. Climatol. 20: 131–149 (2000)
SYNOPTIC CONTROLS ON SNOWFALL 149
Jenne, R.L. 1975. Data Sets for Meteorological Research, NCAR-TN/1A–111, National Center for Atmospheric Research, Boulder,CO, 194 pp.
Klein, W.H., Crockett, C.W. and Andrews, J.F. 1965. ‘Objective predictions of daily precipitation and cloudiness’, J. Geophys. Res.,70, 801–813.
Longley, R.W. 1952. ‘Measures of the variability of precipitation’, Mon. Weather Re6., 80, 111–117.Marlatt, W. and Riehl, H. 1963. ‘Precipitation regimes over the upper Colorado River’, J. Geophys. Res., 68, 6447–6458.McGinnis, D.L. 1994. ‘Predicting snowfall from synoptic circulation: a comparison of linear regression and neural network
methodologies’, in Hewitson, B.C. and Crane, R.G. (eds), Neural Nets: Applications in Geography, Kluwer, Boston, pp. 79–99.Meko, D.M. and Stockton, C.W. 1984. ‘Secular variations in streamflow in the western United States’, J. Clim. Appl. Meteor., 23,
889–897.Mitchell, V.L. 1976. ‘The regionalization of climate in the western Unites States’, J. Appl. Met., 15, 920–927.Palmer, P.L. 1986. ‘Estimating snow course water equivalent from SNOTEL pillow telemetry: an analysis of accuracy’, Proceedings
of the Western Snow Conference, Phoenix, AZ, pp. 81–86.Redmond, K.T. and Koch, R.W. 1990. ‘Western surface climate and streamflow and the El Nino/Southern Oscillation’, International
Symposium on the Hydraulics Hydrology of Arid Lands, American Society of Civil Engineers, San Diego, 567–572 pp.Sellers, W.D. 1968. ‘Climatology of monthly precipitation patterns in the western United States, 1931–1966’, Mon. Weather Re6.,
96, 585–595.US Department of the Interior, 1987. Ri6er Basins of the United States: The Colorado, US Department of the Interior/Geological
Survey, 1987-190-755.Weare, B.C. and Hoeschele, M.A. 1983. ‘Specification on monthly precipitation in the western United States from monthly mean
circulation’, J. Clim. App. Meteor., 22, 1000–1007.Yarnal, B. and Diaz, H.F. 1986. ‘Relationship between extremes of the Southern Oscillation and winter climate of the
Anglo-American Pacific Coast’, J. Climatol., 6, 197–219.
Copyright © 2000 Royal Meteorological Society Int. J. Climatol. 20: 131–149 (2000)
.