Embed Size (px)
DESCRIPTION
Synoptic situations associated to floods in the river mouths. Purposes: Classify synoptic situations associated to various types of floods Assess the changes of synoptical conditions favorable for inundations in a changing climate. Areas: Baltic sea Black sea Azov sea Caspian sea - PowerPoint PPT Presentation
Citation preview

Synoptic situations associated to floods in the river mouths
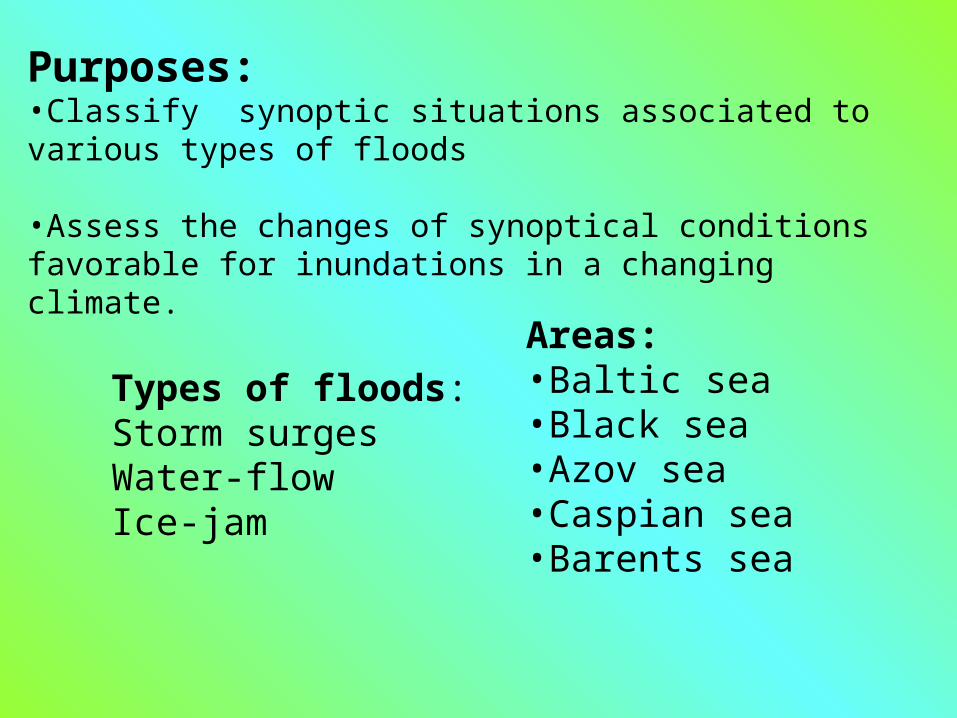
Purposes:•Classify synoptic situations associated to various types of floods
•Assess the changes of synoptical conditions favorable for inundations in a changing climate.
Types of floods:Storm surgesWater-flowIce-jam
Areas:•Baltic sea•Black sea•Azov sea•Caspian sea•Barents sea
Method:Synoptic frontal analysis is applied
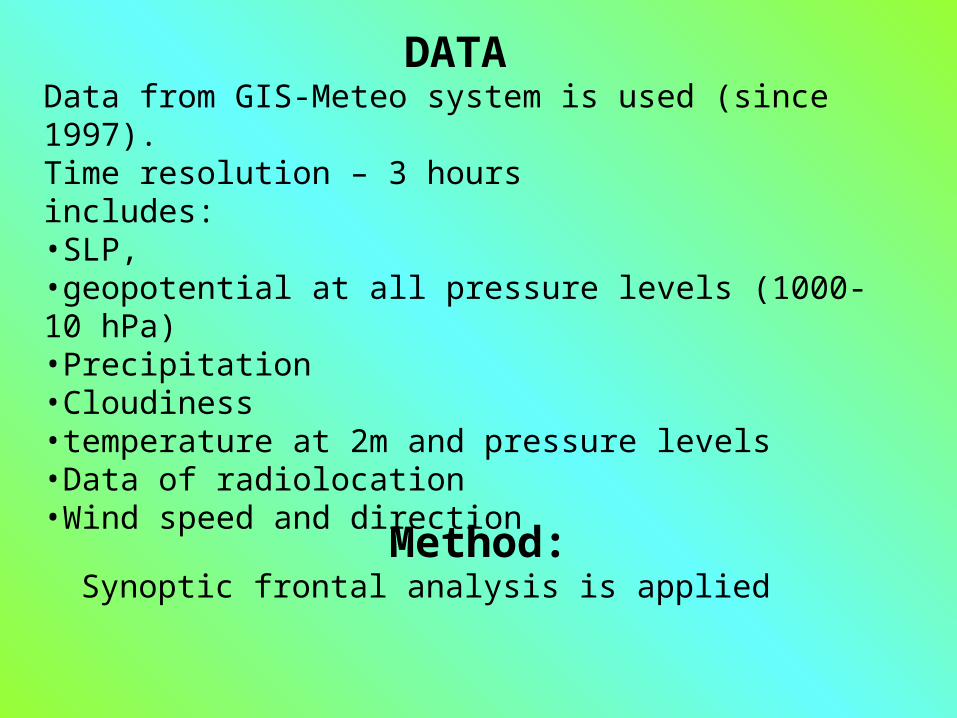
DATAData from GIS-Meteo system is used (since 1997). Time resolution – 3 hoursincludes:•SLP, •geopotential at all pressure levels (1000-10 hPa)•Precipitation•Cloudiness•temperature at 2m and pressure levels•Data of radiolocation•Wind speed and direction
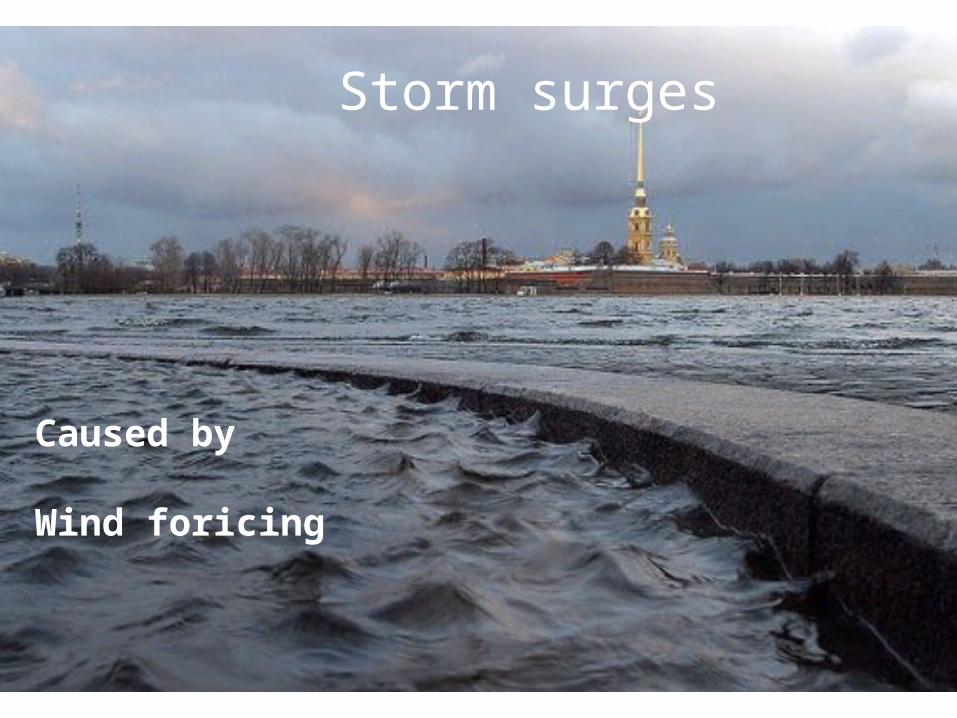
Нагонные наводненияStorm surges
Caused by
Wind foricing
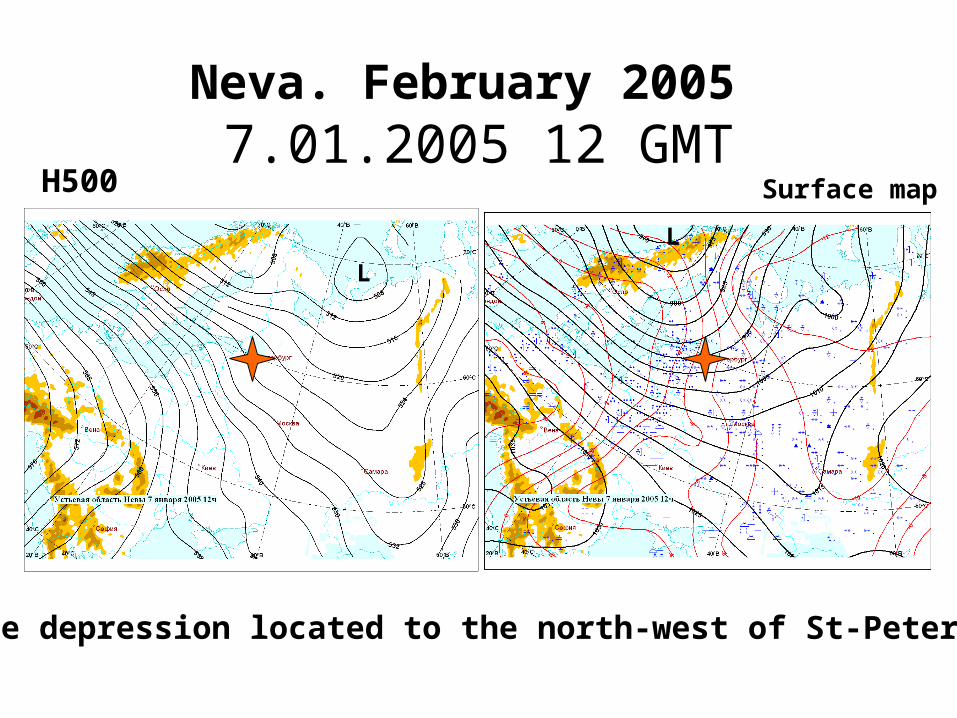
Neva. February 2005 7.01.2005 12 GMT
H500 Surface map
L
L
Large depression located to the north-west of St-Petersburg
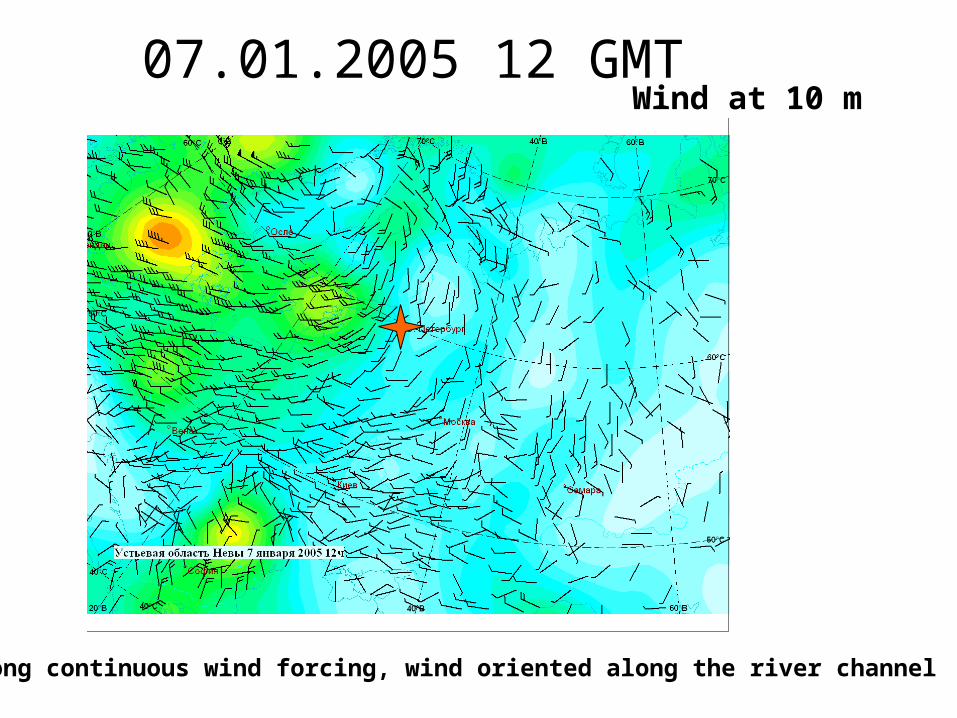
Wind at 10 m07.01.2005 12 GMT
Strong continuous wind forcing, wind oriented along the river channel
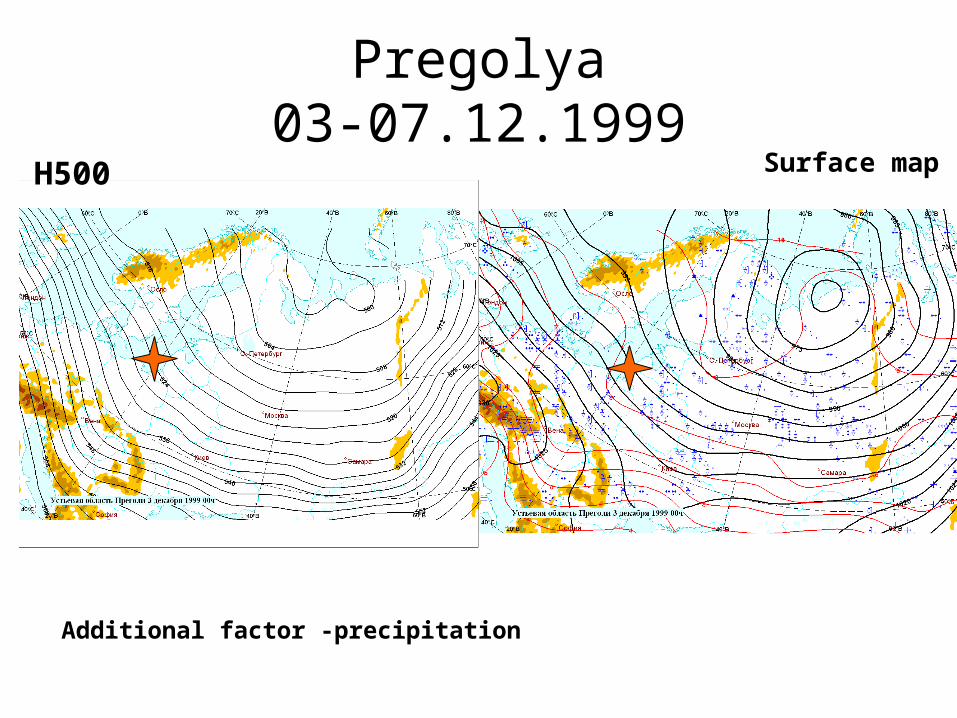
Pregolya03-07.12.1999
Surface mapH500
Additional factor -precipitation
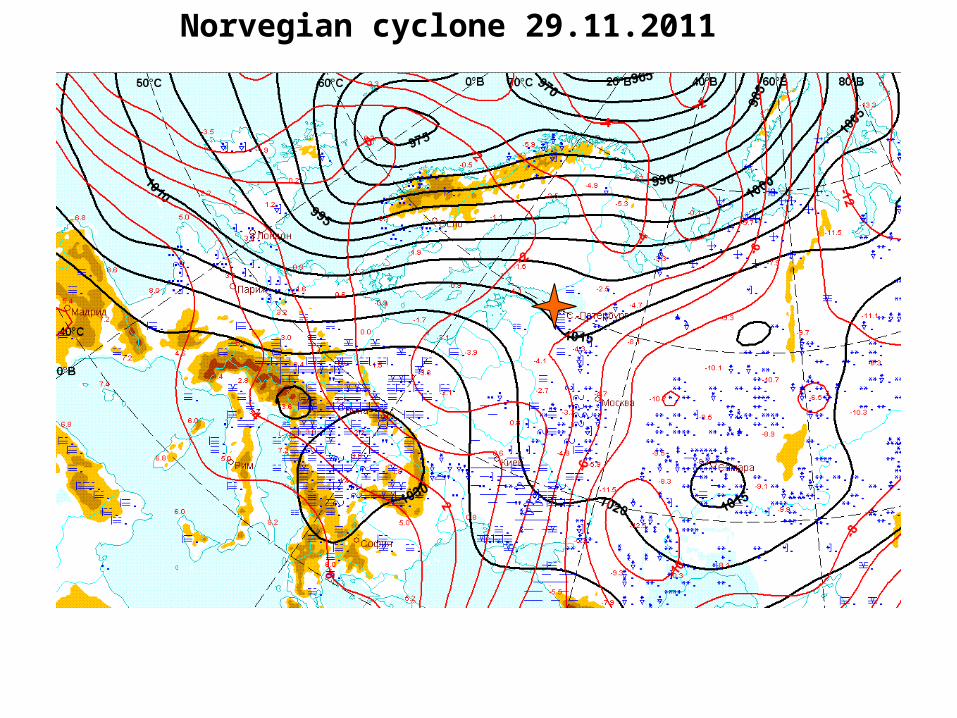
Norvegian cyclone 29.11.2011
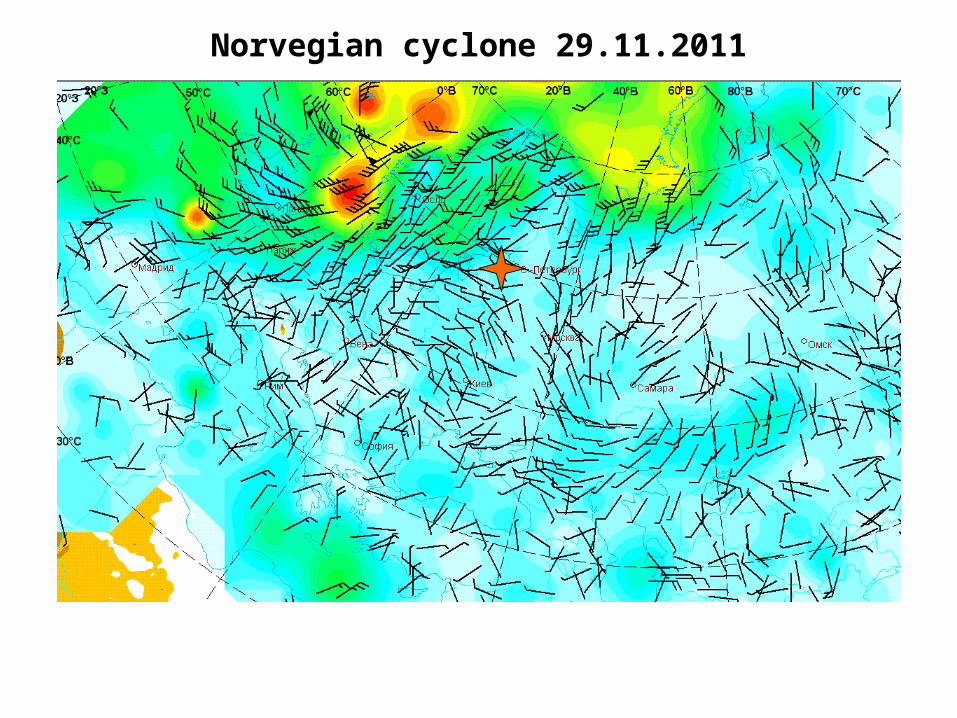
Norvegian cyclone 29.11.2011
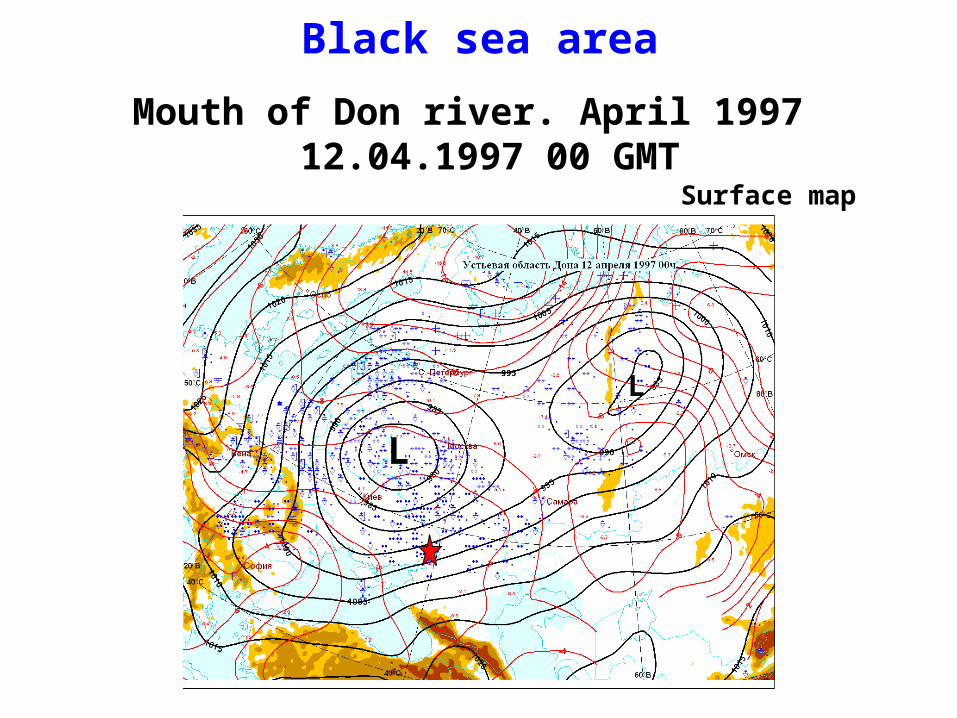
Mouth of Don river. April 1997 12.04.1997 00 GMT
L
L
Surface map
Black sea area
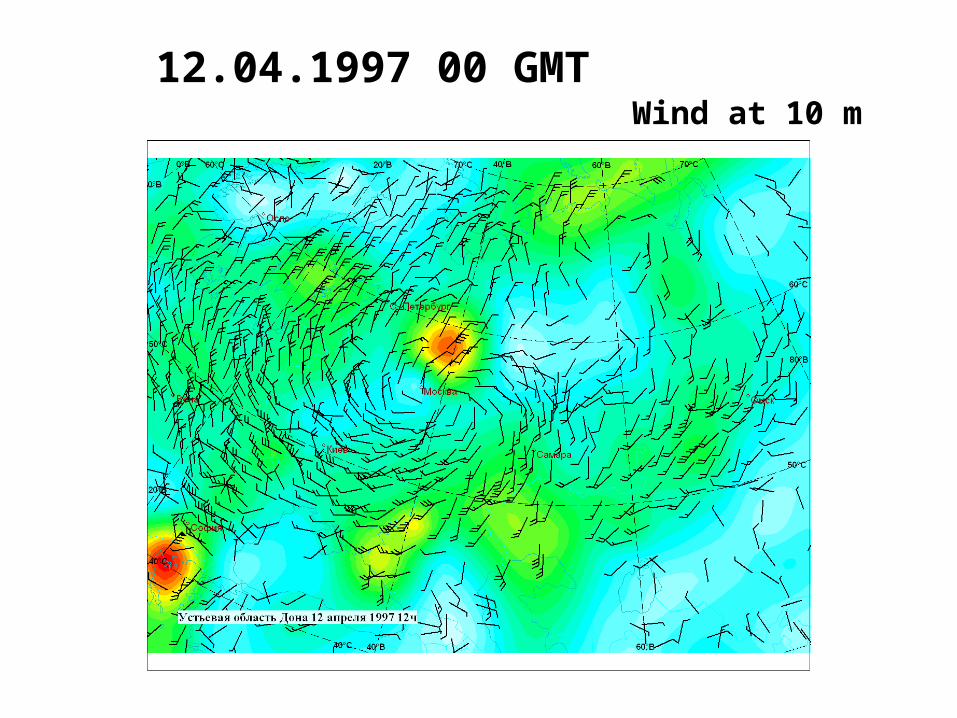
12.04.1997 00 GMTWind at 10 m
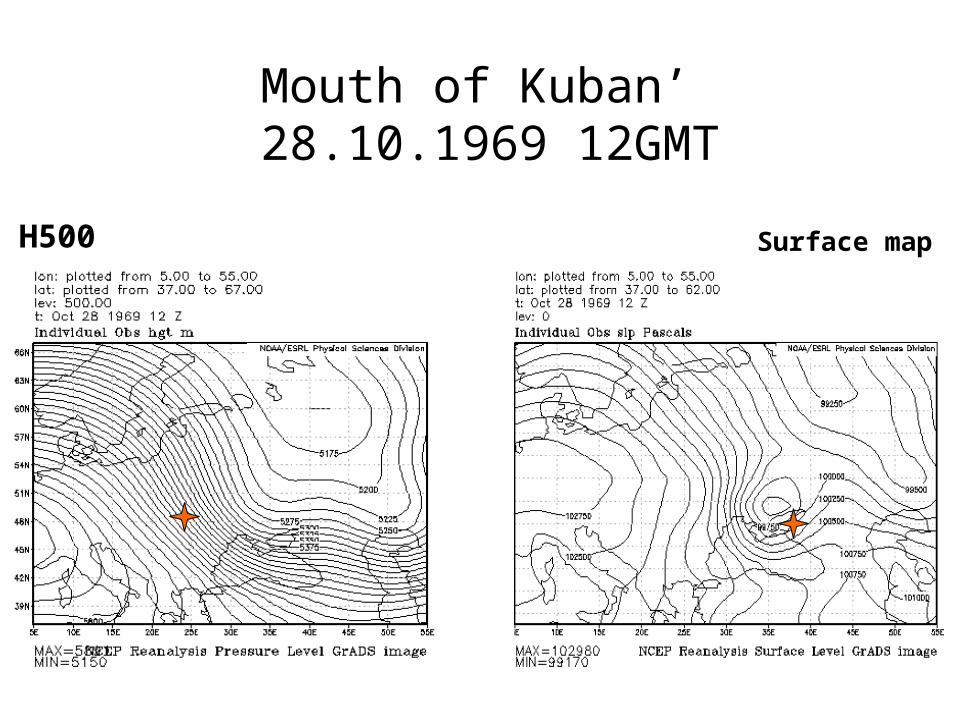
Mouth of Kuban’ 28.10.1969 12GMT
Surface mapH500
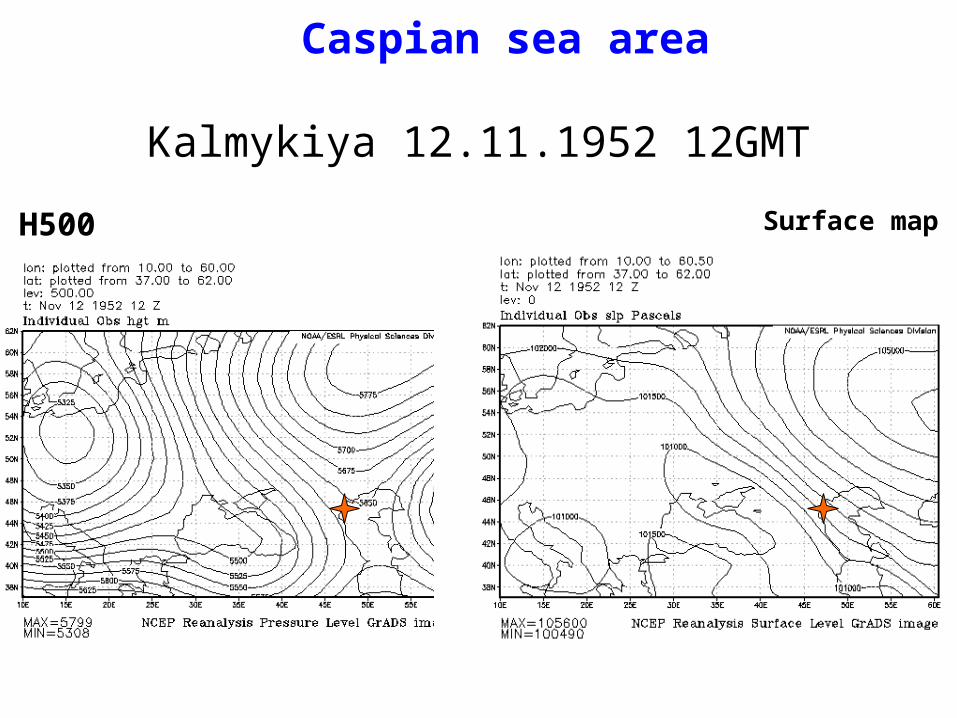
Kalmykiya 12.11.1952 12GMT
H500 Surface map
Caspian sea area
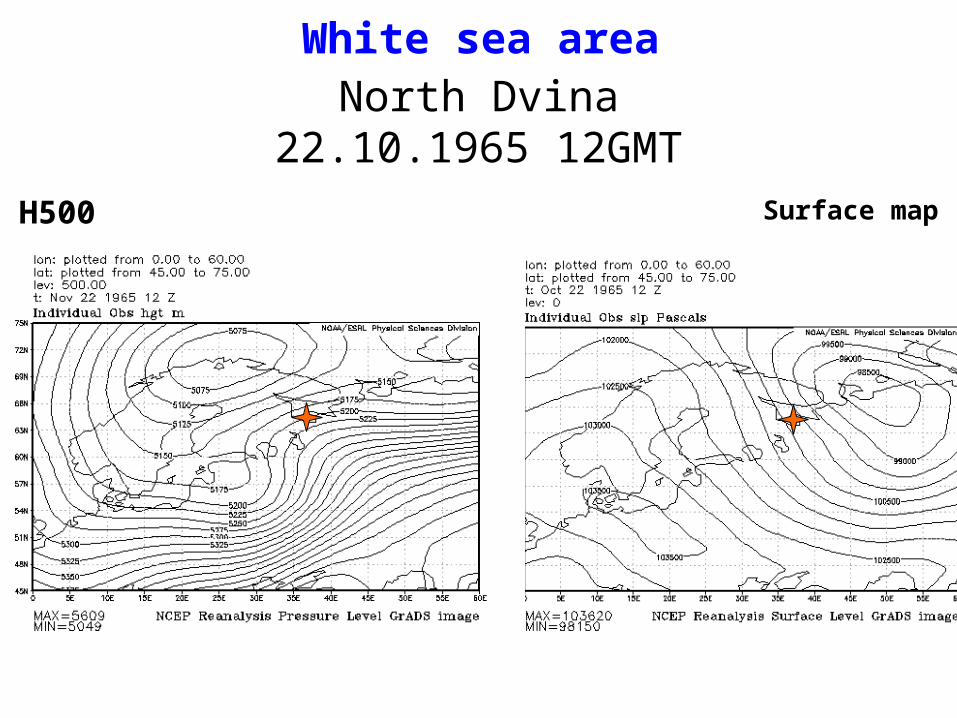
North Dvina22.10.1965 12GMT
H500 Surface map
White sea area
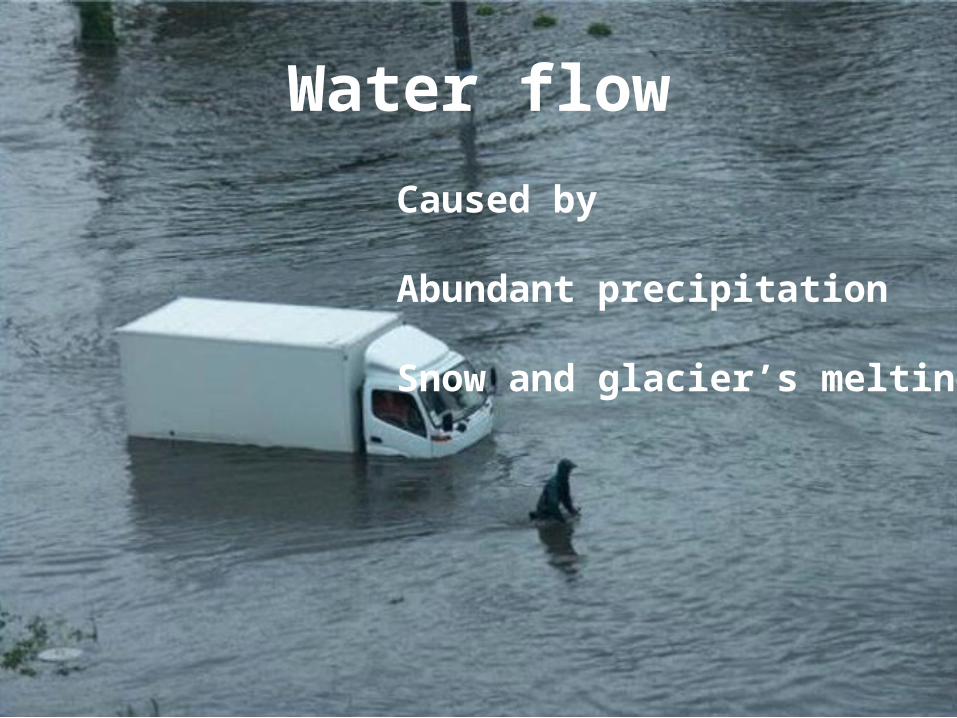
Water flow
Caused by
Abundant precipitation
Snow and glacier’s melting
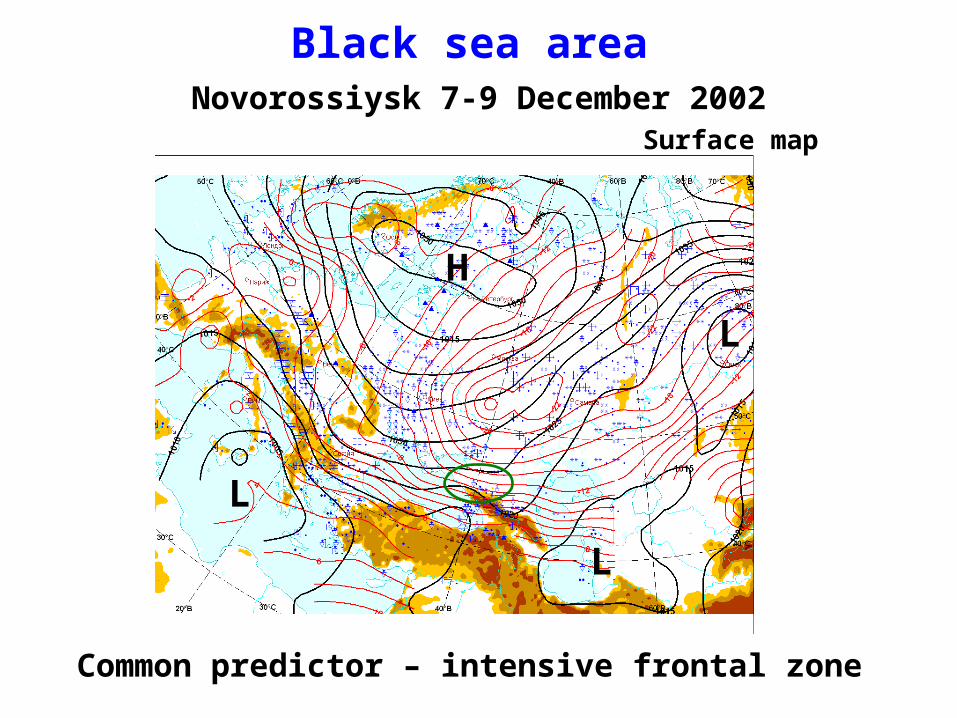
Novorossiysk 7-9 December 2002Surface map
L
L
H
L
Black sea area
Common predictor – intensive frontal zone
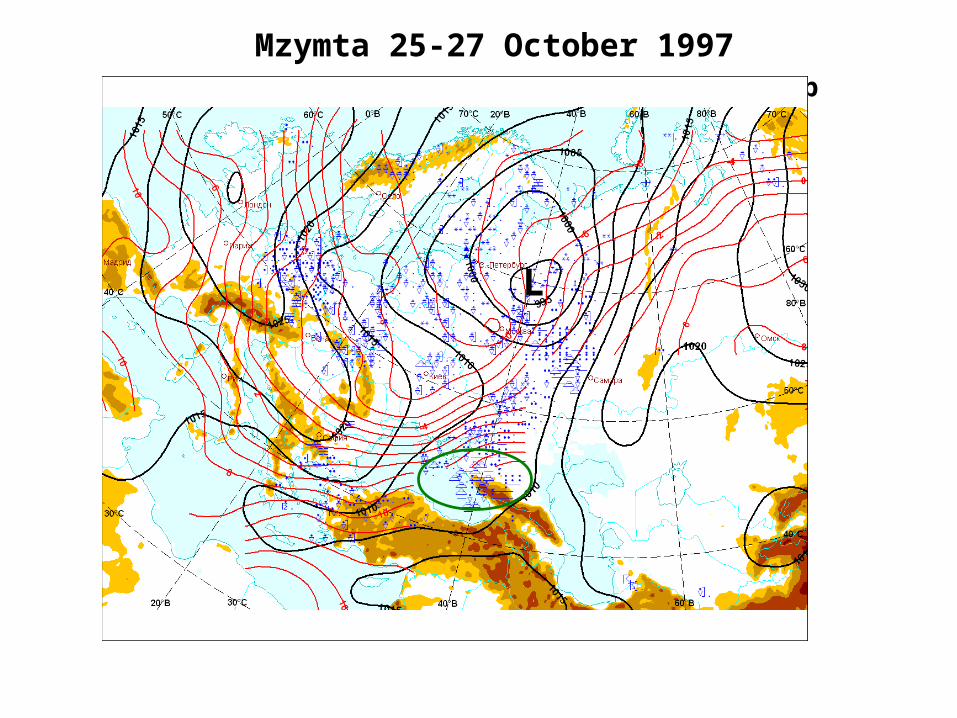
Mzymta 25-27 October 1997Surface map
L
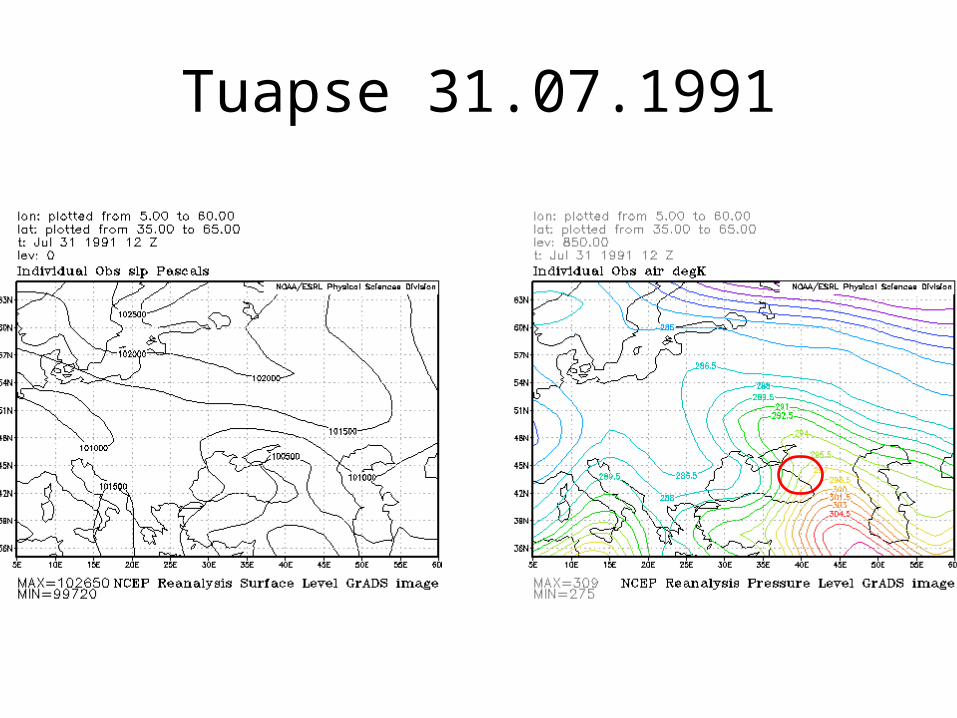
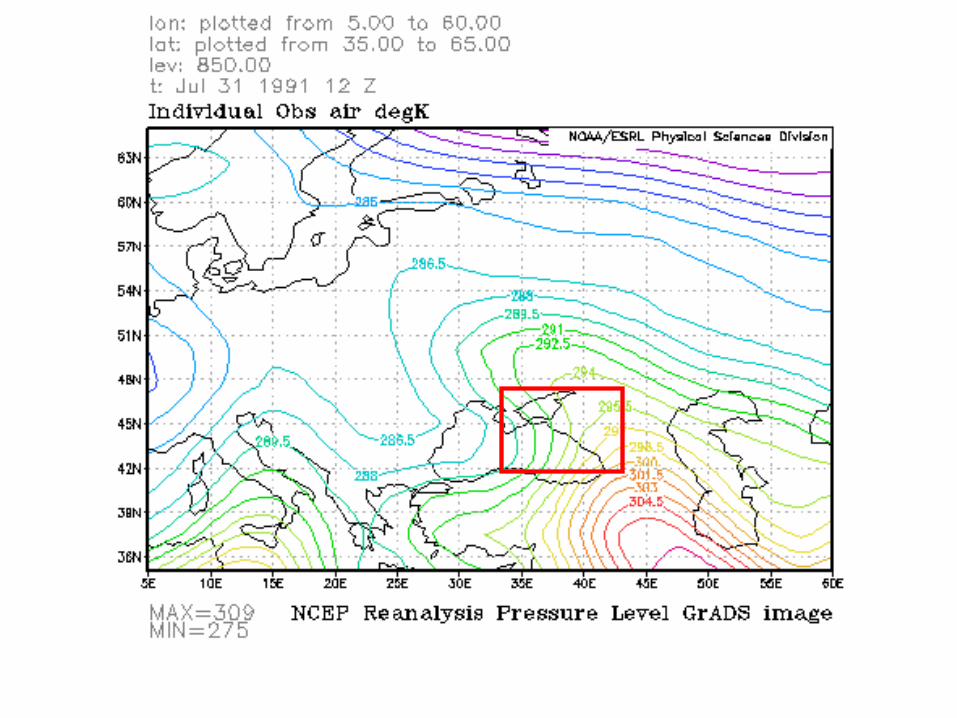
Tuapse 31.07.1991
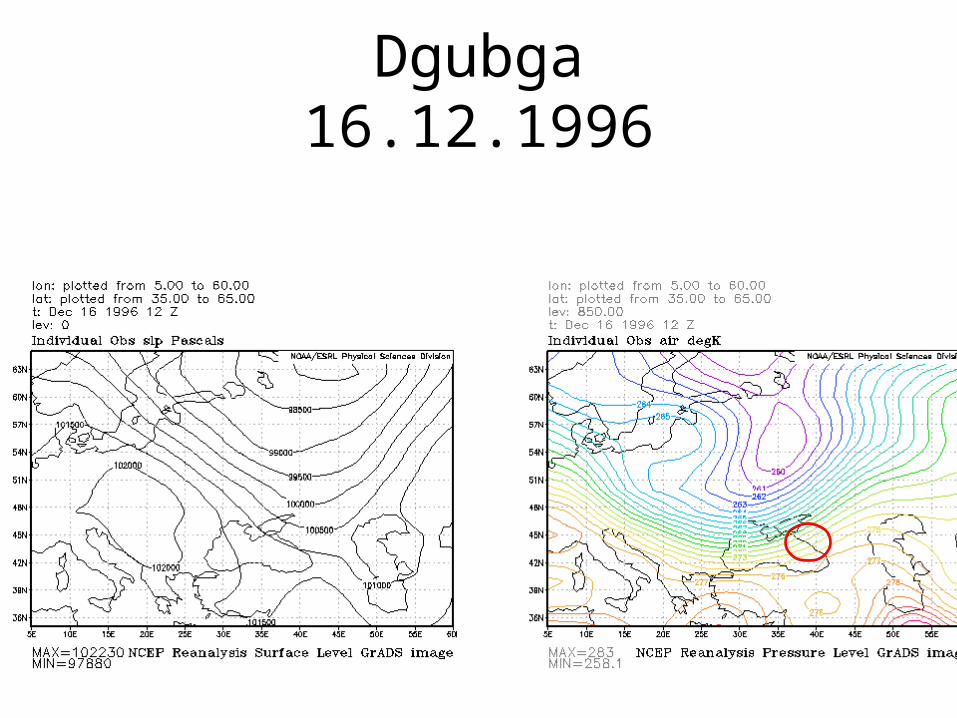
Dgubga16.12.1996
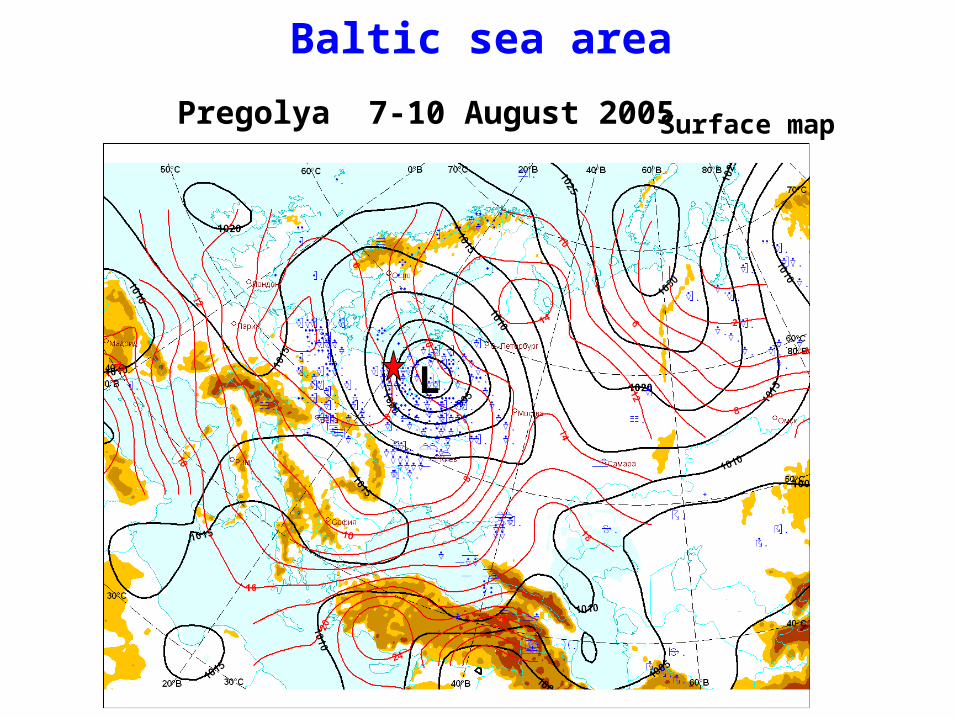
Pregolya 7-10 August 2005 Surface map
L
Baltic sea area
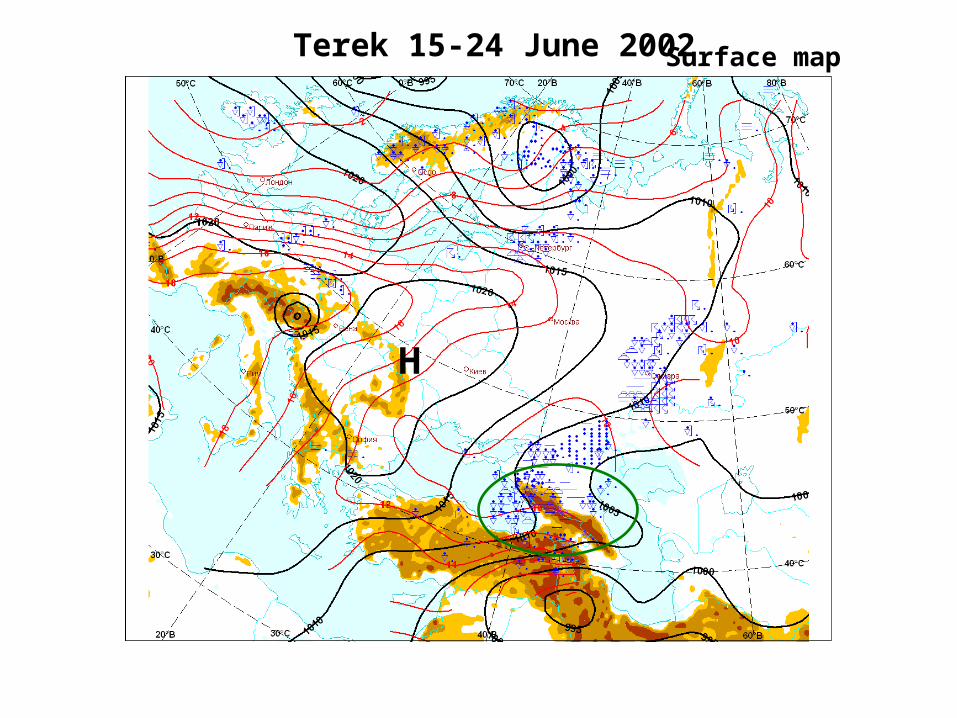
Terek 15-24 June 2002 Surface map
H
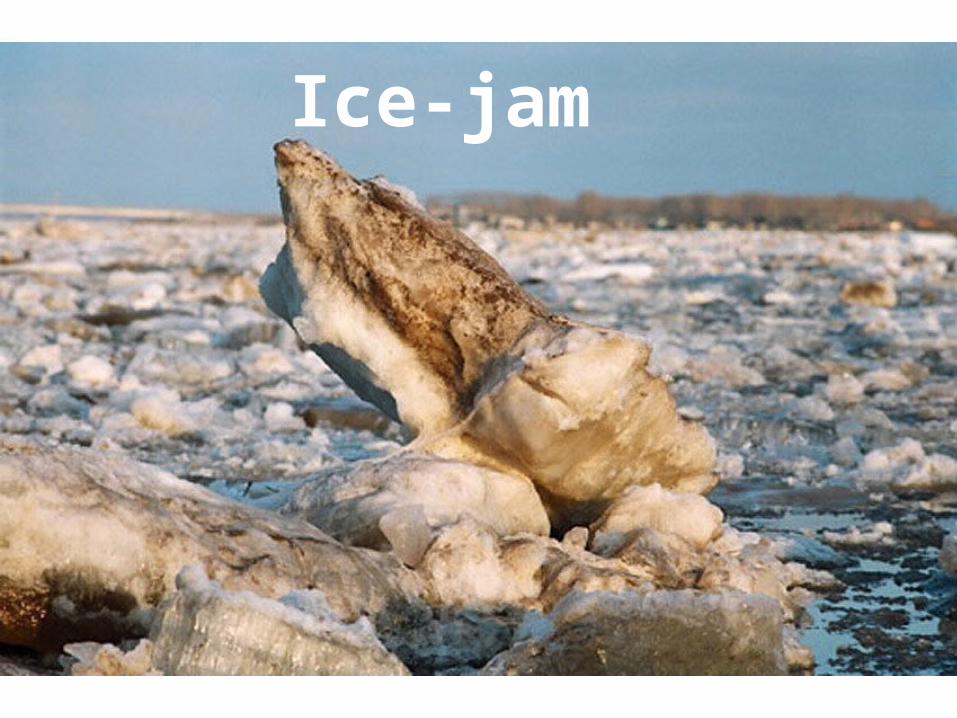
Ice-jam
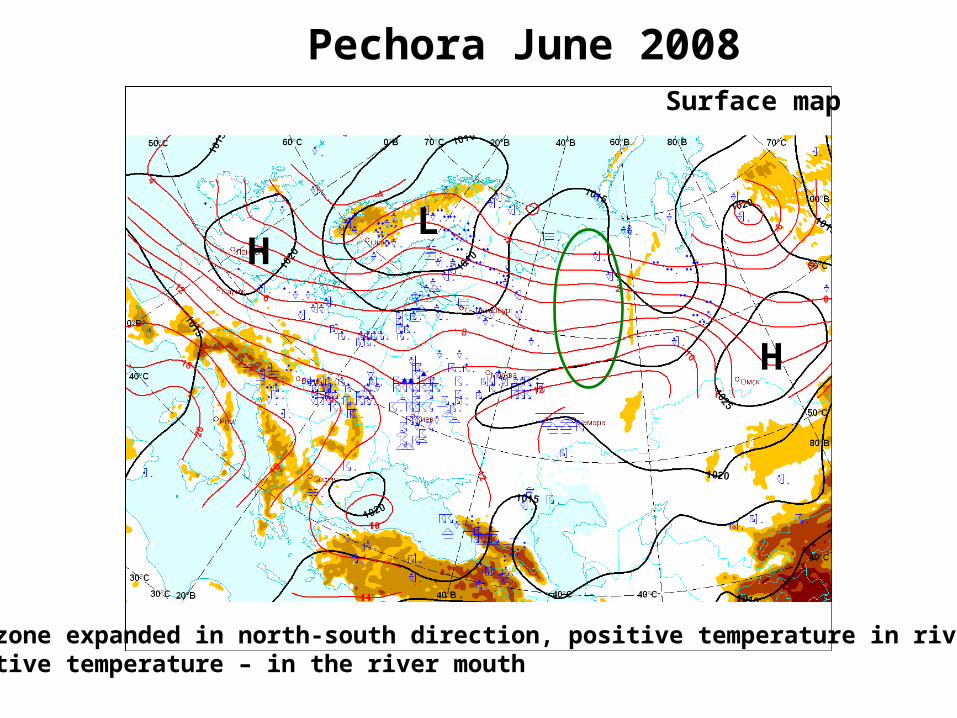
Pechora June 2008Surface map
LН
Н
Frontal zone expanded in north-south direction, positive temperature in river source and negative temperature – in the river mouth
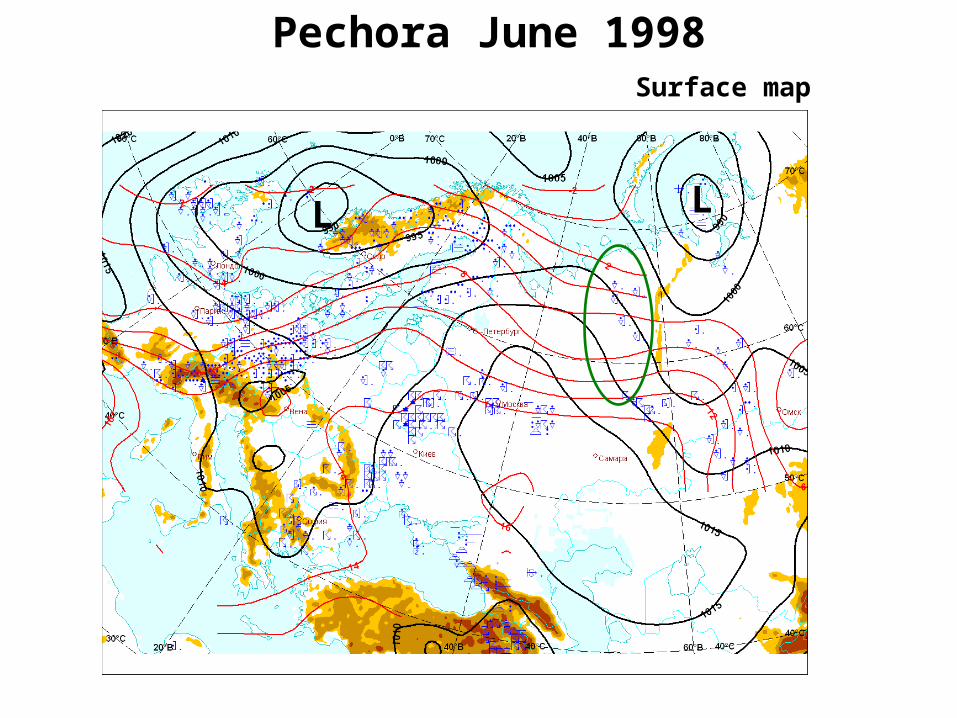
Pechora June 1998Surface map
L L
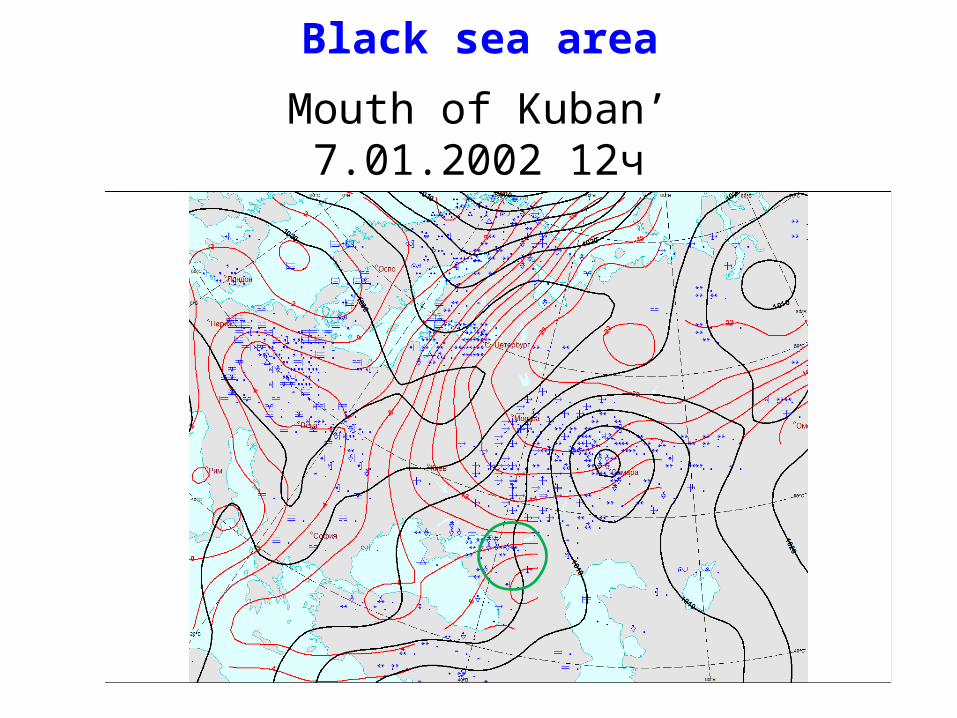
Mouth of Kuban’7.01.2002 12ч
Black sea area
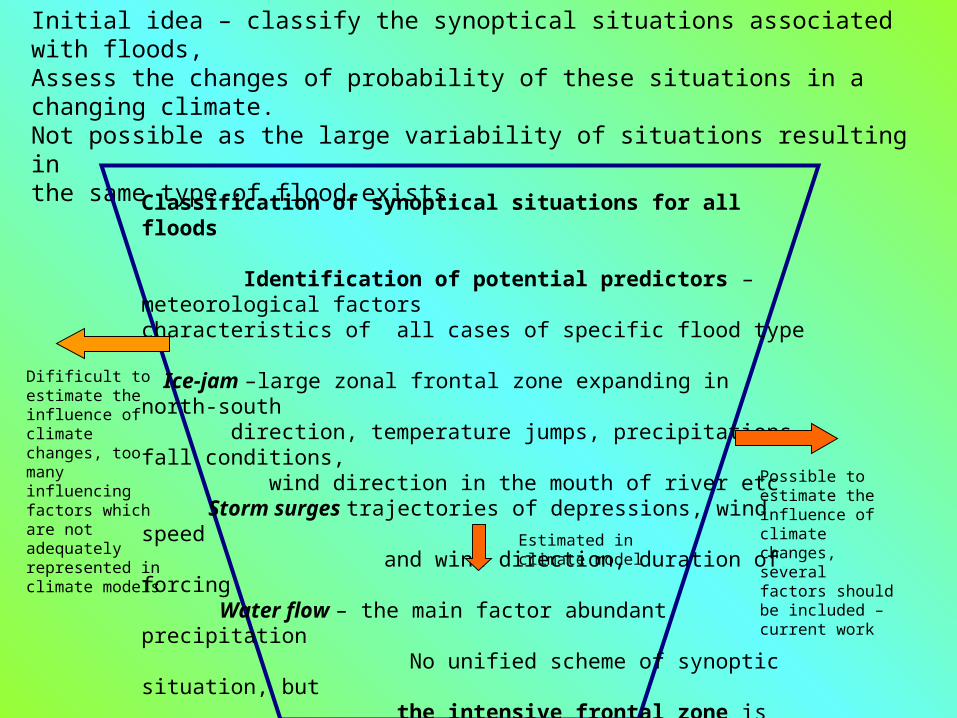
Initial idea – classify the synoptical situations associated with floods, Assess the changes of probability of these situations in a changing climate. Not possible as the large variability of situations resulting in the same type of flood exists.
Classification of synoptical situations for all floods
Identification of potential predictors – meteorological factors characteristics of all cases of specific flood type
Ice-jam –large zonal frontal zone expanding in north-south direction, temperature jumps, precipitations fall conditions, wind direction in the mouth of river etc Storm surges trajectories of depressions, wind speed and wind direction, duration of forcing Water flow – the main factor abundant precipitation No unified scheme of synoptic situation, but the intensive frontal zone is always presented
Temperature gradient – approximation of frontal
zone probability of gradient exceeding some
threshold for modern and future climate
Difificult to estimate the influence of climate changes, too many influencing factors which are not adequately represented in climate models
Possible to estimate the influence of climate changes, several factors should be included – current work
Estimated in climate model
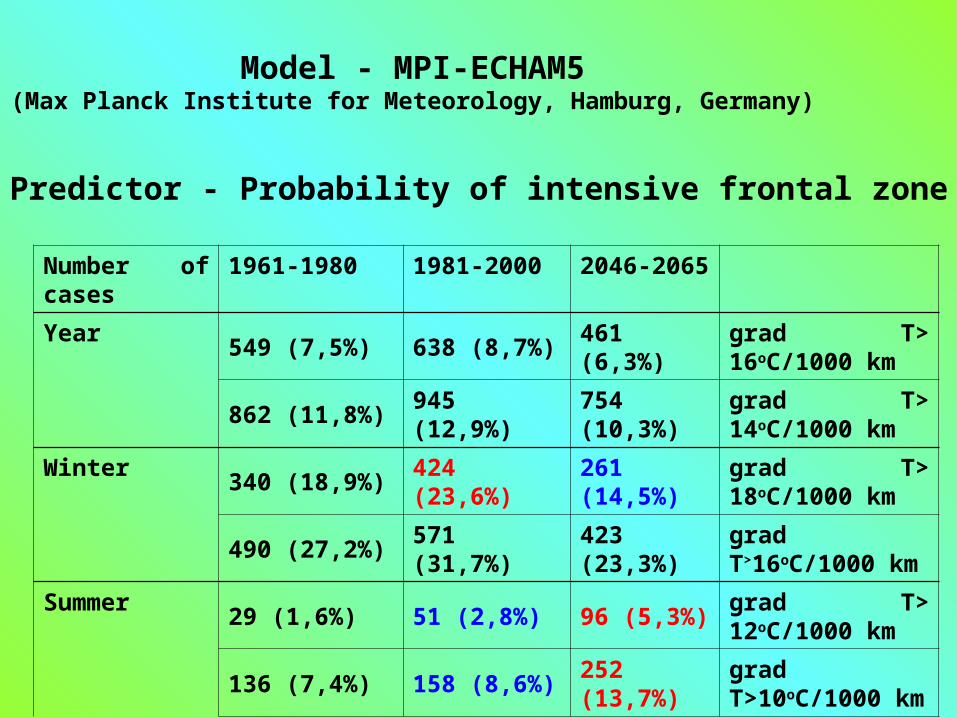
Model - MPI-ECHAM5 (Max Planck Institute for Meteorology, Hamburg, Germany)
Predictor - Probability of intensive frontal zone
Number of cases
1961-1980 1981-2000 2046-2065
Year549 (7,5%) 638 (8,7%) 461 (6,3%)
grad T> 16oC/1000 km
862 (11,8%) 945 (12,9%) 754 (10,3%)grad T> 14oC/1000 km
Winter340 (18,9%) 424 (23,6%) 261 (14,5%)
grad T> 18oC/1000 km
490 (27,2%) 571 (31,7%) 423 (23,3%)grad T>16oC/1000 km
Summer29 (1,6%) 51 (2,8%) 96 (5,3%)
grad T> 12oC/1000 km
136 (7,4%) 158 (8,6%) 252 (13,7%)grad T>10oC/1000 km
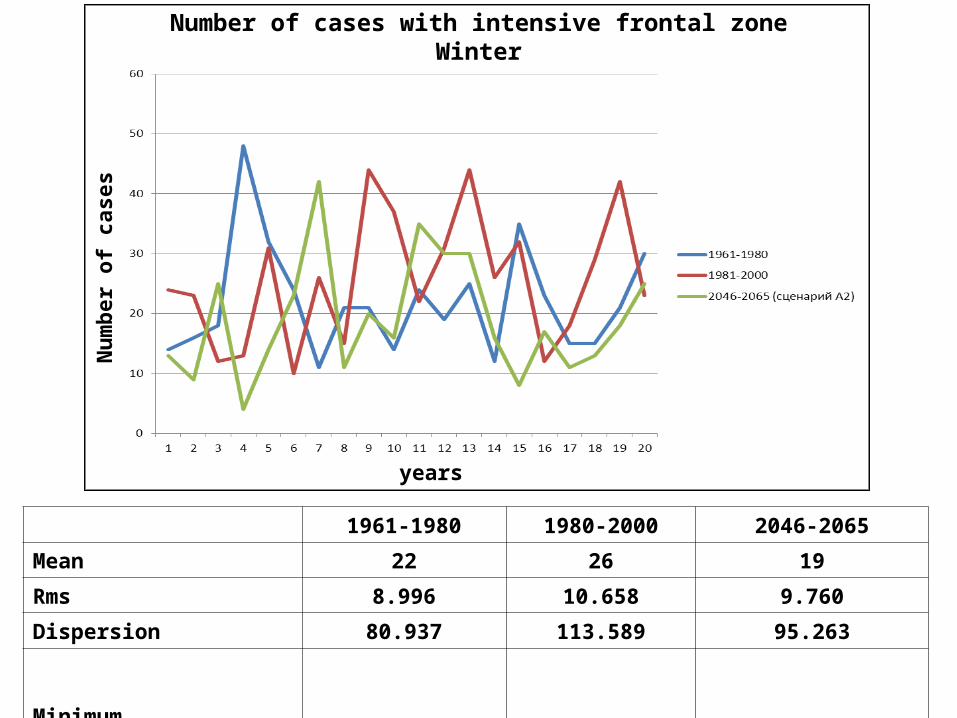
1961-1980 1980-2000 2046-2065
Mean 22 26 19
Rms 8.996 10.658 9.760
Dispersion 80.937 113.589 95.263
Minimum
11 10 4
Maximum 48 44 42
Number of cases with intensive frontal zoneWinter
Nu
mb
er o
f ca
ses
years
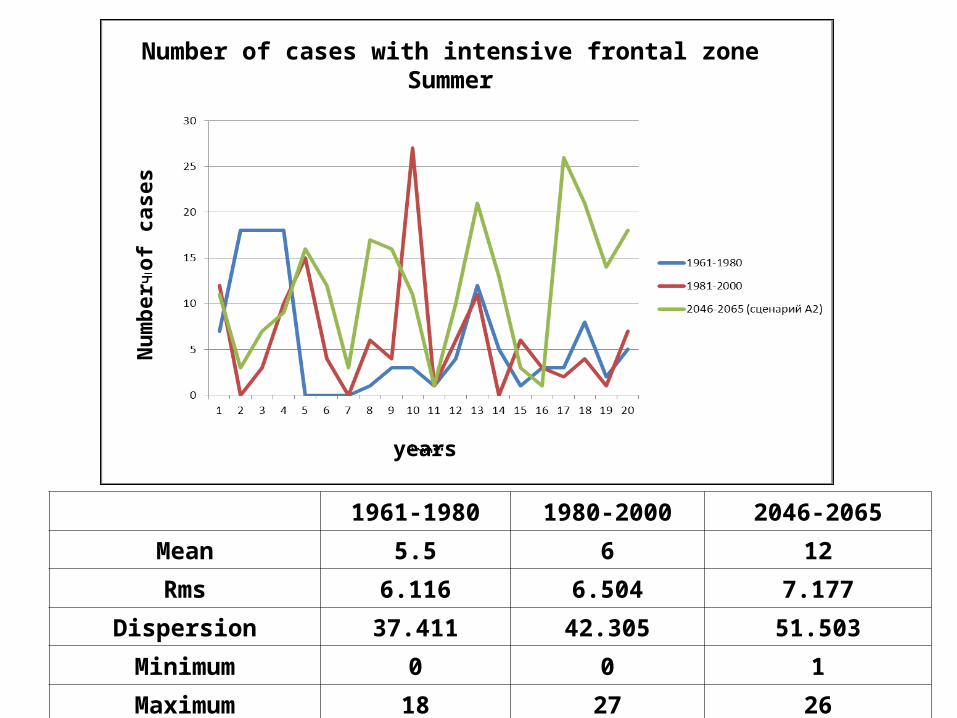
1961-1980 1980-2000 2046-2065
Mean 5.5 6 12
Rms 6.116 6.504 7.177
Dispersion 37.411 42.305 51.503
Minimum 0 0 1
Maximum 18 27 26
Number of cases with intensive frontal zoneSummer
Nu
mb
er o
f ca
ses
years