Embed Size (px)
Citation preview
SYNTHESIS OF NEW FERROCENYL SUBSTITUTED QUINOXALINE
DERIVATIVE MONOMERS, THEIR POLYMERIZATION AND
ELECTROCHEMICAL BEHAVIORS
A THESIS SUBMITTED TO
THE GRADUATE SCHOOL OF NATURAL AND APPLIED SCIENCES
OF
MIDDLE EAST TECHNICAL UNIVERSITY
BY
ŞERİFE ÖZDEMİR
IN PARTIAL FULFILLMENT OF THE REQUIREMENTS
FOR
THE DEGREE OF MASTER OF SCIENCE
IN
CHEMISTRY
SEPTEMBER 2010
ii
Approval of the thesis:
SYNTHESIS OF NEW FERROCENYL SUBSTITUTED QUINOXALINE
DERIVATIVE MONOMERS, THEIR POLYMERIZATION AND
ELECTROCHEMICAL BEHAVIORS
submitted by ŞERİFE ÖZDEMİR in partial fulfillment of the requirements for the
degree of Master of Science in Chemistry Department, Middle East Technical
University by,
Prof. Dr. Canan Özgen
Dean, Graduate School of Natural and Applied Sciences
Prof. Dr. İlker Özkan
Head of Department, Chemistry
Prof. Dr. Özdemir Doğan
Supervisor, Chemistry Dept., METU
Prof. Dr. Levent Toppare
Co-Supervisor, Chemistry Dept., METU
Examining Committee Members:
Prof. Dr. Duygu Kısakürek
Chemistry Dept., METU
Prof. Dr. Özdemir Doğan
Chemistry Dept., METU
Prof. Dr. Levent Toppare
Chemistry Dept., METU
Assoc. Prof. Dr. Adnan Bulut
Chemistry Dept., Kırıkkale University
Assist. Prof. Dr. Ali Çırpan
Chemistry Dept., METU
Date: 17.09.2010

iii
I hereby declare that all information in this document has been obtained and
presented in accordance with academic rules and ethical conduct. I also declare
that, as required by these rules and conduct, I have fully cited and referenced
all material and results that are not original to this work.
Name, Last name : ŞERİFE ÖZDEMİR
Signature
iv
ABSTRACT
SYNTHESIS OF NEW FERROCENYL SUBSTITUTED QUINOXALINE
DERIVATIVE MONOMERS, THEIR POLYMERIZATION AND
ELECTROCHEMICAL BEHAVIORS
Özdemir, Şerife
M. S., Department of Chemistry
Supervisor: Prof. Dr. Özdemir Doğan
Co-Supervisor: Prof. Dr. Levent Toppare
September 2010, 71 pages
5,8-Bis(2,3-dihydrothieno[3,4b][1,4]dioxin-5-yl)-2-(naphthalen-2-yl)-3-ferrocenyl-
4a,8a-dihydroquinoxaline (DEFNQ), 5,8-bis(2,3-dihydrothieno[3,4-b][1,4]dioxin-5-
yl)-2-(phenyl)-3 ferrocenylquinoxaline (DEFPQ) and 5,8-bis(2,3-dihydrothieno[3,4-
b][1,4]dioxin-5-yl)-2,3-di(naphthalen-2-yl)quinoxaline (DEDNQ) were synthesized,
electrochemically polymerized and electrochromic properties of resultant polymers
were investigated. For the characterization of the monomers Nuclear Magnetic
Resonance (1H-NMR,
13C-NMR) were used. Cyclic Voltammetry (CV) and
Ultraviolet–Visible Spectroscopy were used to investigate electrochemical behavior of
the monomers and redox reactions of conducting polymers. After electrochemical
polymerizations, the electrochromic properties of the conducting polymers were
investigated via spectroelectrochemistry, kinetic and colorimetry studies to explore the
one of most important property of conducting polymers, the ability to switch reversibly
between the two states of different optical properties, „electrochromism‟. Cyclic
Voltammetry and Spectroelectrochemistry studies for PDEFNQ, PDEFPQ and

v
PDEDNQ showed that ferrocenyl (Fc) group containing derivatives are multichromic
green to transmissive polymer with high tendency to be both p and n doped.
PDEDNQ which was not functionalized with ferrocenyl group does not show
multichromism. According to the electrochemical and spectroscopic results each
polymer is a potential candidate for optoelectronic applications.
Keywords: Ferrocene, Multichromism, Donor-Acceptor-Donor, Green Polymers,
Subsitution Effect.
vi
ÖZ
FEROSENİL SÜBSTİTÜE KİNOKZALİN TÜREVİ MONOMERLERİN
SENTEZİ, POLİMERİZASYONU VE ELEKTROKİMYASAL ÖZELLİKLERİNİN
İNCELENMESİ
Özdemir, Şerife
Yüksek Lisans, Kimya Bölümü
Tez Yöneticisi: Prof. Dr. Özdemir Doğan
Ortak Tez Yöneticisi : Prof. Dr. Levent Toppare
Eylül 2010, 71 sayfa
5,8-Bis(2,3-dihydrothieno[3,4b][1,4]dioxin-5-yl)-2-(naphthalen-2-yl)-3-ferrocenyl-
4a,8a-dihydroquinoxaline (DEFNQ), 5,8-bis(2,3-dihydrothieno[3,4-b][1,4]dioxin-5-
yl)-2-(phenyl)-3 ferrocenylquinoxaline (DEFPQ) ve 5,8-bis(2,3-dihydrothieno[3,4-
b][1,4]dioxin-5-yl)-2,3-di(naphthalen-2-yl)quinoxaline (DEDNQ) monomerleri
sentezlenmiş, elektrokimyasal olarak polimerleştirilmiş ve elde edilen polimerlerin
elektrokimyasal özellikleri incelenmiştir. Sentezlenen monomerlerin karakterizasyonu
için 1H,
13C Nükleer Manyetik Rezonans Spektroskopisi (NMR) kullanılmıştır.
Dönüşümlü Voltammetre (CV) ve UV-Vis Spektrofotometresi kullanılarak
monomerlerin elektrokimyasal davranışı ve iletken polimerlerin redox tepkimeleri
tespit edilmiştir. Elektrokimyasal polimerizasyon sonucunda elde edilen iletken
polimerlerin elektrokromik özellikleri spektroelektrokimya, kinetik ve kolorimetri
çalışmaları sonucunda incelenmiş ve bu kısımda iletken polimerlerin en ilginç
özelliklerinden biri olan „electrokromizm‟ araştırılmıştır. Dönüşümlü Voltametre ve
vii
Spektroelektrokimya çalışmaları sonucunda Ferrosenil (Fc) grup içeren türevlerin
(PDEFNQ, PDEFPQ) indirgenmiş halde yeşil yükseltgenince yüksek geçirgenliğe
sahip olduğu ve aynı zamanda multikromik özellik gösterdiği gözlenmiştir. Ferrosenil
grubu içermeyen türevin (PDEDNQ) ise multikromik özellik göztermediği
gözlenmiştir. Tüm polimerler hem p-tipi hem n-tipi katkılanabilmektedir.
Elektrokimysal ve spektroskopik sonuçlar her bir polimerin optoelektronik
uygulamalar için iyi birer aday olduğunu göztermektedir.
Anahtar kelimeler: Ferrosen, Multikromizm, Donör-Akseptör-Donör, Yeşil
Polimerler, Substitüsyon Etkisi.

viii
To My Family
ix
ACKNOWLEDGEMENTS
I would like to express my sincere thanks to my supervisor Prof. Dr. Özdemir Doğan
and my co-supervisor Prof. Dr. Levent Toppare for their guidance, support,
encouragement, patience, advice, criticism and for listening and helping me in many
ways.
I would like to thank to Abidin Balan and Derya Baran for their endless helps besides
their kind friendships.
I would like to thank to Assoc. Prof. Dr. Adnan Bulut for his valuable discussions
and friendship.
I would like thank to Hakan Babiz, Akın İnce, Gül Şenyurt, Muhammet İşçi and all
Toppare Research Group members for their cooperation and their kind friendships.
Many thanks to Yadigar, Hacer, Dilek, Naime for always being there for me, for
their true friendship.
Words fail to express my eternal gratitude to my family for believing in me and
giving me endless support.
I would like to express my special thanks to Fırat Hacıoğlu. I always know that he is
with me and he never leaves me alone.
x
TABLE OF CONTENTS
TABLE OF CONTENTS
ABSTRACT ................................................................................................................ iv
ÖZ ............................................................................................................................... vi
ACKNOWLEDGEMENTS ........................................................................................ ix
TABLE OF CONTENTS ............................................................................................. x
LIST OF TABLES .................................................................................................... xiii
LIST OF FIGURES .................................................................................................. xiv
ABBREVATIONS .................................................................................................... xix
CHAPTERS
1.INTRODUCTION .................................................................................................... 1
1.1 Conducting Polymers ......................................................................................... 1
1.2 Band Theory ....................................................................................................... 2
1.3 Doping Types in Conducting Polymers ............................................................. 6
1.4 Polymerization methods ..................................................................................... 8
1.5 Applications of Conducting Polymers ............................................................. 10
1.6 Electrochromism .............................................................................................. 11
1.6.1 Types of Electrochromic Materials ........................................................... 12
1.6.2 Multicolor Electrochromic Polymers: Color Control ............................... 14
1.7 Low Band Gap Systems ................................................................................... 15
1.8 Color of Conducting Polymers and Impotance of Green Polymeric Materials 17
1.9 Ferrocene Polymers .......................................................................................... 19
2.EXPERIMENTAL .............................................................................................. 24
2.1 Materials and Methods ..................................................................................... 24
2.2 Equipment ........................................................................................................ 24
2.3 Procedure, Synthesis ........................................................................................ 25
xi
2.3.1 Synthesis of 2-Hydroxy-2-(naphthalen-2-yl)-1-ferrocenylethanone ........ 25
2.3.2 Synthesis of 1-ferrocenyl-2-naphthylethanedione .................................... 26
2.3.3 Synthesis of 1-ferrocenyl-2-phenylethanedione ....................................... 26
2.3.4 Synthesis of 1,2-di(naphthalen-2-yl)ethane-1,2-dione .............................. 27
2.3.5 Synthesis of 4,7-Dibromo-2.1.3-benzothiadiazole.................................... 28
2.3.6 Synthesis of 3,6-dibromo-1,2-phenylenediamine ..................................... 28
2.3.7 Synthesis of tributl(2,3-dihydrothieno[3,4-b][1,4]dioxin-5-yl)stannane .. 29
2.3.8 Synthesis of 5,8-dibromo-2-(naphthalen-2-yl)-3-ferrocenyl-4a,8a-
dihydroquinoxaline ............................................................................................ 30
2.3.9 Synthesis of 5,8-bis(2,3-dihydrothieno[3,4-b][1,4]dioxin-5-yl)-2-
(naphthalen-2-yl)-3-ferrocenyl-4a,8a-dihydroquinoxaline (M1) ....................... 31
2.3.10 Synthesis of 5,8-dibromo-2-phenyl-3-ferrocenylquinoxaline ................. 32
2.3.11 Synthesis of 5,8-bis(2,3-dihydrothieno[3,4-b][1,4]dioxin-5-yl)-2-
(phenyll)-3-ferrocenylquinoxaline (M2) ............................................................ 32
2.3.12 Synthesis of 5,8-dibromo-2,3-di(naphthalen-2-yl)quinoxaline............... 34
2.3.13 Synthesis of 5,8-bis(2,3-dihydrothieno[3,4-b][1,4]dioxin-5-yl)-2,3-
di(naphthalen-2-yl)quinoxaline (M3)................................................................. 35
3.RESULTS AND DISCUSSION ............................................................................. 36
3.1 Electrochemical and Electrochromic Properties of Quinoxaline Derivative ... 36
Polymers ................................................................................................................. 36
3.1.1 Electrochemical and Electrochromic Properties of PDEFNQ (P1) .......... 36
3.1.1.1 Electrochemistry of DEFNQ (M1)..................................................... 36
3.1.1.2 Spectroelectrochemistry of P1 ........................................................... 40
3.1.1.3 Kinetic Studies of P1 .......................................................................... 42
3.1.2 Electrochemical and Electrochromic Properties of PDEFPQ (P2) ........... 43
3.1.2.1 Electrochemistry of DEFPQ (M2) ..................................................... 43
3.1.2.2 Spectroelectrochemistry of P2 ........................................................... 45
3.1.2.3 Kinetic Studies of P2 .......................................................................... 47
3.1.3 Electrochemical and Electrochromic Properties of PDEDNQ (P3) .......... 48
3.1.3.1 Electrochemistry of DEDNQ (M3) .................................................... 48
3.1.3.2 Spectroelectrochemistry of P3 ........................................................... 50

xii
3.1.3.3 Kinetic Studies of P3 .......................................................................... 51
3.2 Comparison of PDEFNQ (P1), PDEFPQ (P2), PDEDNQ (P3) and PDPEQ .. 53
4.CONCLUSION ....................................................................................................... 55
REFERENCES ........................................................................................................... 56
APPENDIX A - NMR DATA ................................................................................... 61
xiii
LIST OF TABLES
TABLES
Table 1 Electrochemical and Optical Results for P1, P2, P3 and PDPEQ . a Data was
Taken from Ref 69. b Fc/Fc
+ Oxidation Potential was Observed in The First Cycle
During CV. ................................................................................................................. 54
xiv
LIST OF FIGURES
FIGURES
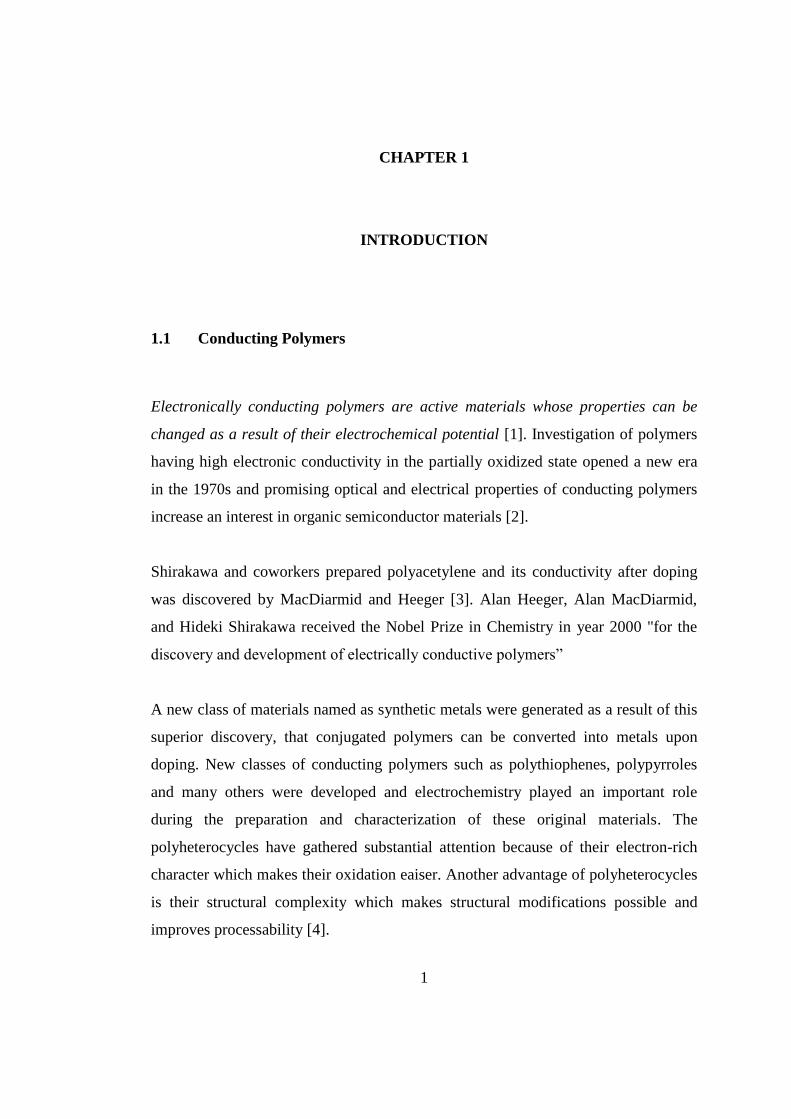
Figure 1. 1 Common Conjugated Polymers ................................................................ 2
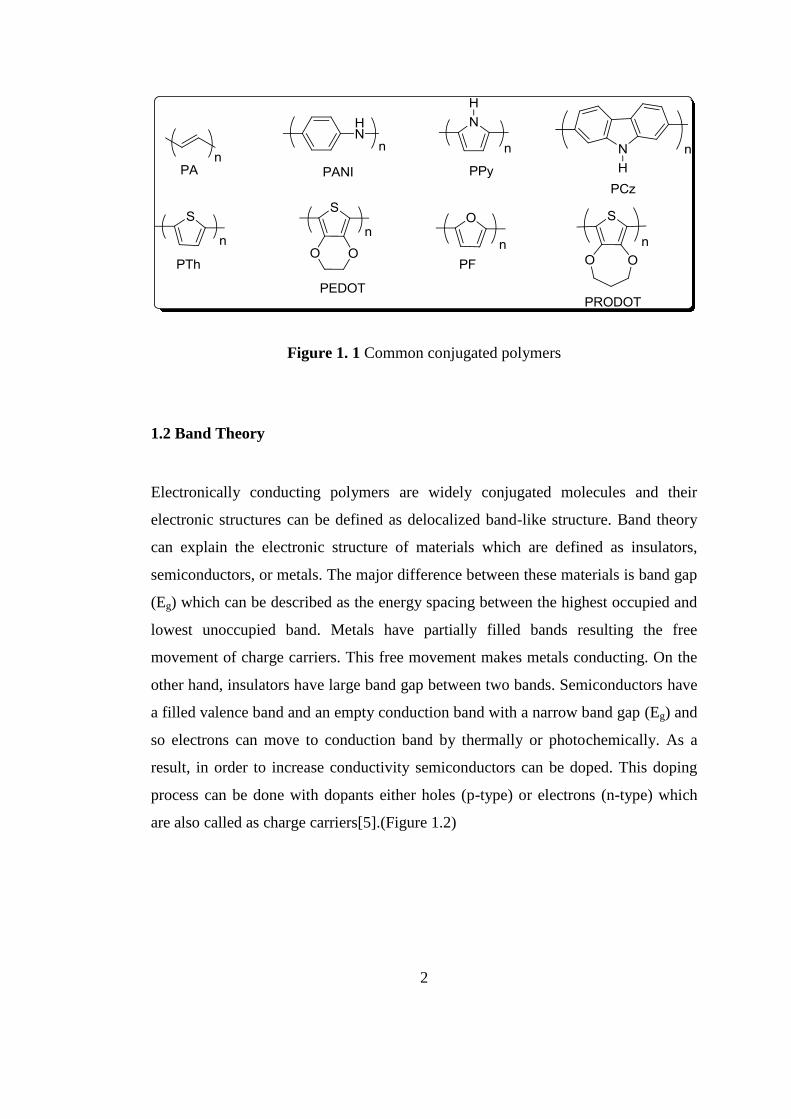
Figure 1. 2 The Band Structure of an Insulator, a Semiconductor and a Conductor .. 3
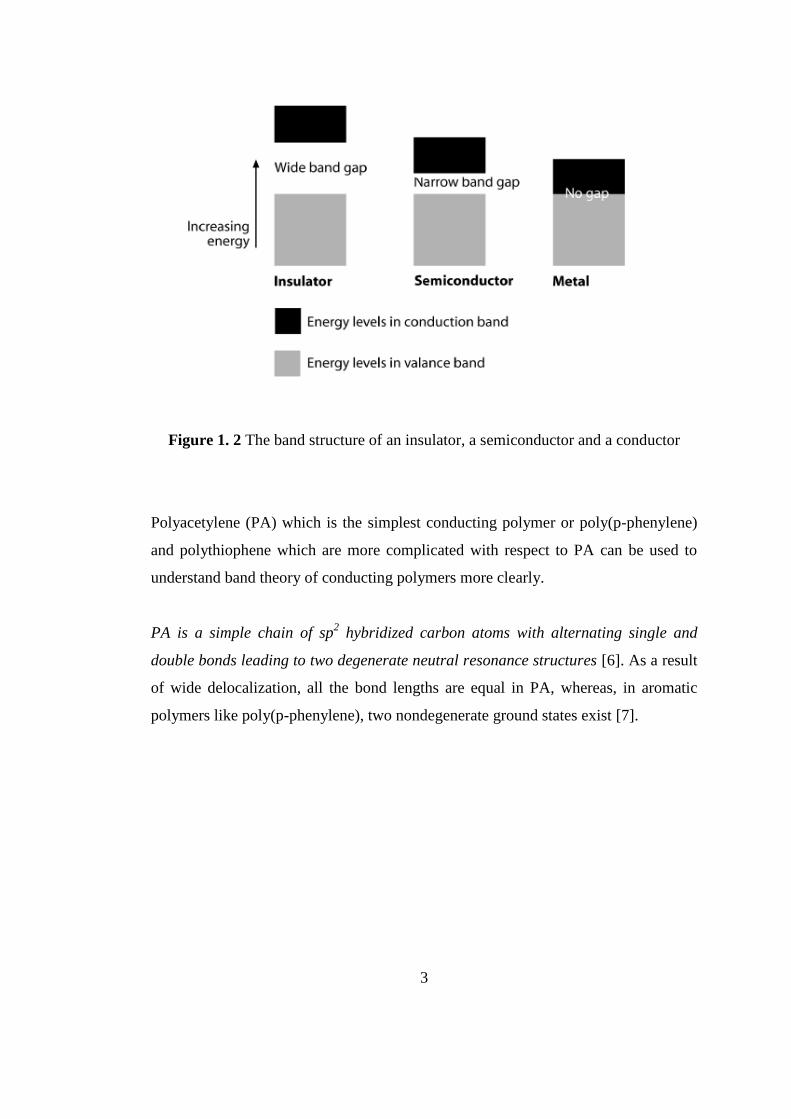
Figure 1. 3 The Degenerate Ground States of Pa (a) and the Nondegenerate Ground
States of The Fully Aromatic Polymer, Poly(P-Phenylene) (b). .................................. 4
Figure 1. 4 The Charged States, Charge Carries and Energy Bands for Pa [8]. ......... 5
Figure 1. 5 The Charged States, Charge Carries and Energy Bands for
Poly(Thiophene) [8]. .................................................................................................... 6
Figure 1. 6 Band Model of (A) Non-Doped, (B) Slightly Doped, and (C) Heavily
Doped Conducting Polymers. ...................................................................................... 7
Figure 1. 7 a) p-Doping and b) n-Doping of Conducting Polymer ............................. 8
Figure 1. 8 Radical-Cation/Monomer and Radical-Cation/Radical Cation Coupling 9
Figure 1. 9 Electrochemical Polymerization Mechanism for a Five Membered
Heterocyclic Compound, Where X = N-H, S, O ....................................................... 10
Figure 1. 10 The Three Common Viologen Redox States, Dication, Radical Cation,
Neutral Species........................................................................................................... 12
Figure 1. 11 The Doped and Undoped Form of Polypyrrole. ................................... 13
Figure 1. 12 Examples of Multicolor Ec Polymers Synthesized by Structural
Modification. 0 = Neutral; I= Intermediate; + =Oxidized; - and-- = Reduced .......... 15
Figure 1. 13 Illustration of methods for the alteration of band gap ..........................16
Figure 1. 14 VB and CB Levels for Cyanovinylene Subsituted with Different Donor
Groups. ....................................................................................................................... 17
Figure 1. 15 Structure of The First Neutral State Green Polymer............................. 18
Figure 1. 16 Examples of Gren Polymeric Materials With Transmissive Oxidized
State. ........................................................................................................................... 19
xv
Figure 1. 17 Structure of Ferrocene. ......................................................................... 19
Figure 1. 18 Schematic Representation of Three Types of Metal Containing
Conducting Polymers. ................................................................................................ 21
Figure 1. 19 Synthetic Route to Ferrocene Clicked Poly(3,4-
Ethylenedioxythiophene). .......................................................................................... 22
Figure 1. 20 Structures of a) 1,1-Bis(5-(2,2-Bithienyl))Ferrocene and b) 1,1-Bis(5-
(2,2:5,2-Terthienyl)) Ferrocene. ................................................................................. 22
Figure 2. 1 Synthetic Route for 2-Hydroxy-2-(Naphthalen-2-yl)-1-
Ferrocenylethanone .................................................................................................... 25
Figure 2. 2 Synthetic Route for 1-Ferrocenyl-2-Naphthylethanedione..................... 26
Figure 2. 3 Synthetic Route for 1-Ferrocenyl-2-Phenylethanedione ........................ 26
Figure 2. 4 Synthetic Route for 1,2-Di(Naphthalen-2-yl)Ethane-1,2-Dione ............ 27
Figure 2. 5 Synthetic Route for 4,7-Dibromo-2.1.3-Benzothiadiazole ..................... 28
Figure 2. 6 Synthetic Route for 3,6-Dibromo-1,2-Phenylenediamine ...................... 28
Figure 2. 7 Synthetic Route for Tributyl(2,3-Dihydrothieno[3,4-b][1,4]Dioxin-5-
yl)Stannane ................................................................................................................. 29
Figure 2. 8 Synthetic Route for 5,8-Dibromo-2-(Naphthalen-2-yl)-3-Ferrocenyl-
4a,8a-Dihydroquinoxaline:......................................................................................... 30
Figure 2. 9 Synthetic Route for 5,8-Bis(2,3-Dihydrothieno[3,4-B][1,4]Dioxin-5-yl)-
2-(Naphthalen-2-yl)-3-Ferrocenyl-4a,8a-Dihydroquinoxaline .................................. 31
Figure 2. 10 Synthetic Route for 5,8-Dibromo-2-Phenyl-3-Ferrocenylquinoxaline 32
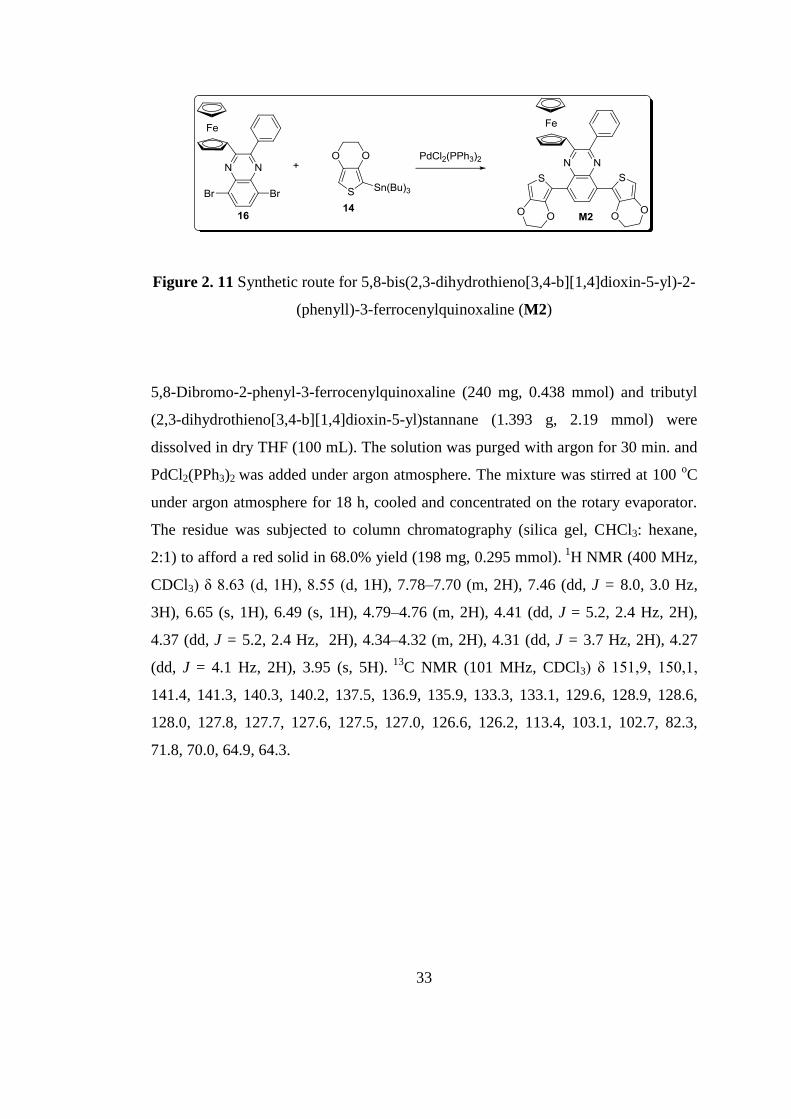
Figure 2. 11 Synthetic Route for 5,8-Bis(2,3-Dihydrothieno[3,4-B][1,4]Dioxin-5-
yl)-2-(Phenyll)-3-Ferrocenylquinoxaline ................................................................... 33
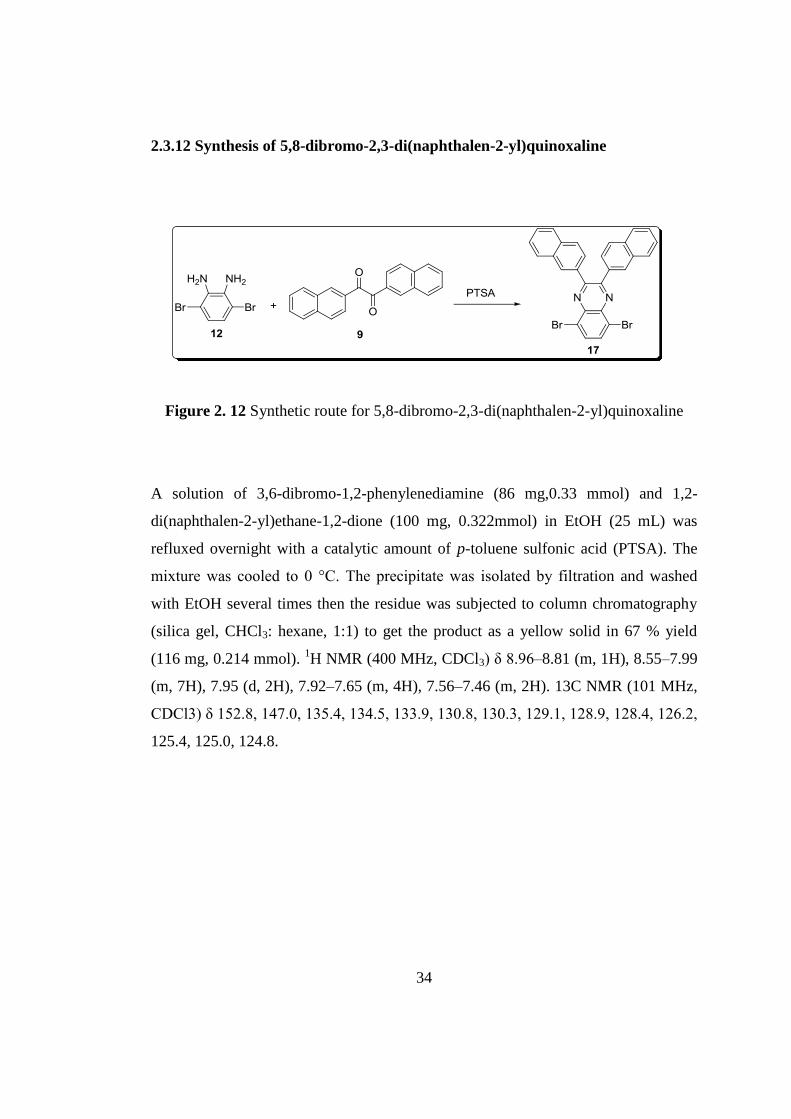
Figure 2. 12 Synthetic Route for 5,8-Dibromo-2,3-Di(Naphthalen-2-yl)Quinoxaline
.................................................................................................................................... 34
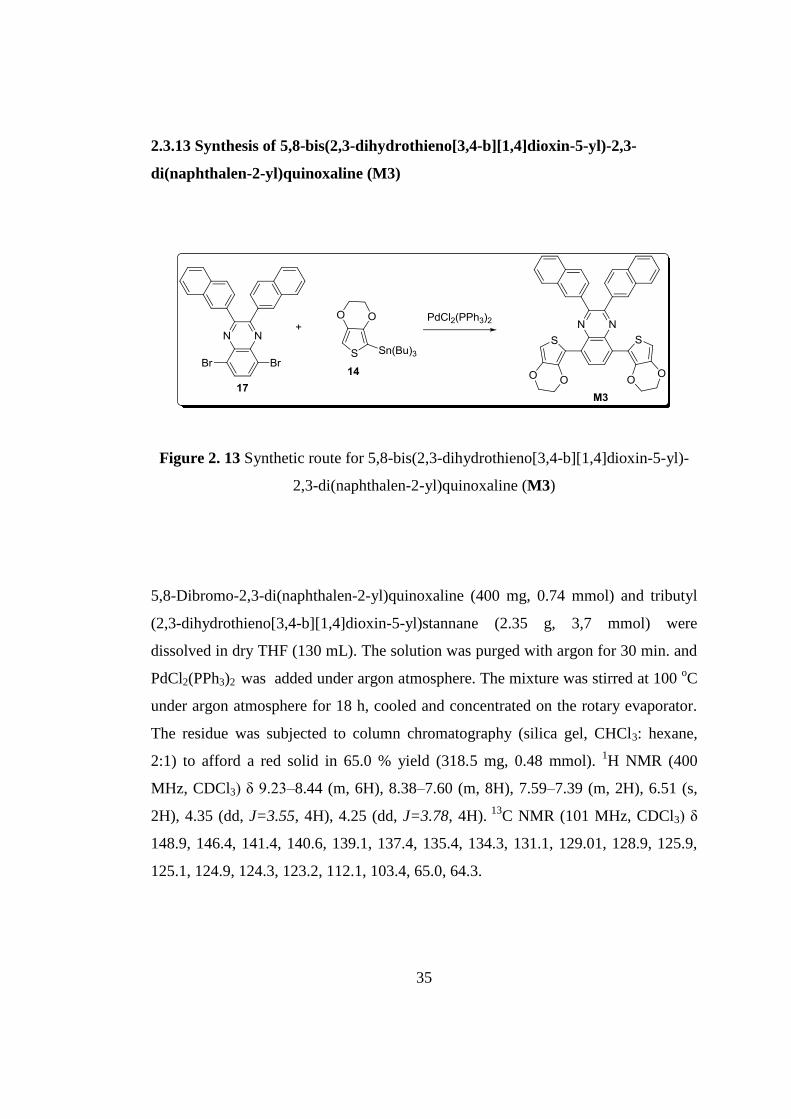
Figure 2. 13 Synthetic Route for 5,8-Bis(2,3-Dihydrothieno[3,4-B][1,4]Dioxin-5-
yl)-2,3-Di(Naphthalen-2-yl)Quinoxaline ................................................................... 35
Figure 3. 1 Single Scan Voltammograms of A) Fc ― , Acceptor Unit ― In Acn
and B) The First Run Of Electropolymerization of M1 in a Dcm/Acn (5:95,V:V)/
TBAPF6 Solvent-Electrolyte Couple. ........................................................................ 37
xvi
Figure 3. 2 Multiple Scan Voltammogram for Polymerization of M1 in Dcm/Acn/
TBAPF6 Solution. ...................................................................................................... 38
Figure 3. 3 Single Scan Voltammogram of P1 Upon Both p and n-Type Doping.... 39
Figure 3. 4 Scan Rate Dependence of P1 Films At 100, 150, 200, 250, and 300
mV/s. .......................................................................................................................... 39
Figure 3. 5 Electronic Absorption Spectra for PDEFNQ Upon p Doping Between -
0.3 V and 1.2 V with 0.1 V Potential Intervals in a Monomer Free Solution. ........... 41
Figure 3. 6 Colors of P1 at its Neutral (0.0 V) and Different Oxidized States. ........ 41
Figure 3. 7 Percent Transmittance Changes as a Function of Time At 730 nm and
1750 nm for P1. .......................................................................................................... 42
Figure 3. 8 Repeated Potential Scan Electropolymerization of M2 in 0.1 M
TBAPF6/ACN/DCM on ITO Electrode. ................................................................... 43
Figure 3. 9 Single Scan Voltammogram of P2 Upon Both p and n-Type Doping.... 44
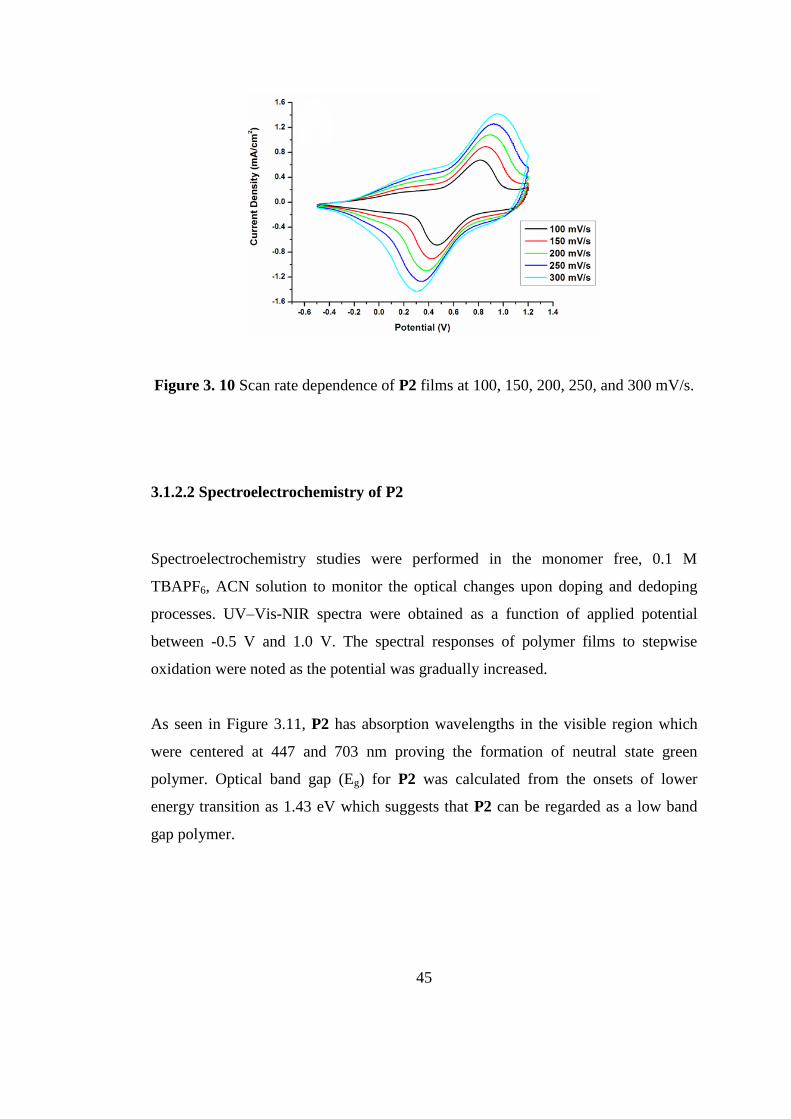
Figure 3. 10 Scan Rate Dependence of P2 Films at 100, 150, 200, 250, and 300
mV/s. .......................................................................................................................... 45
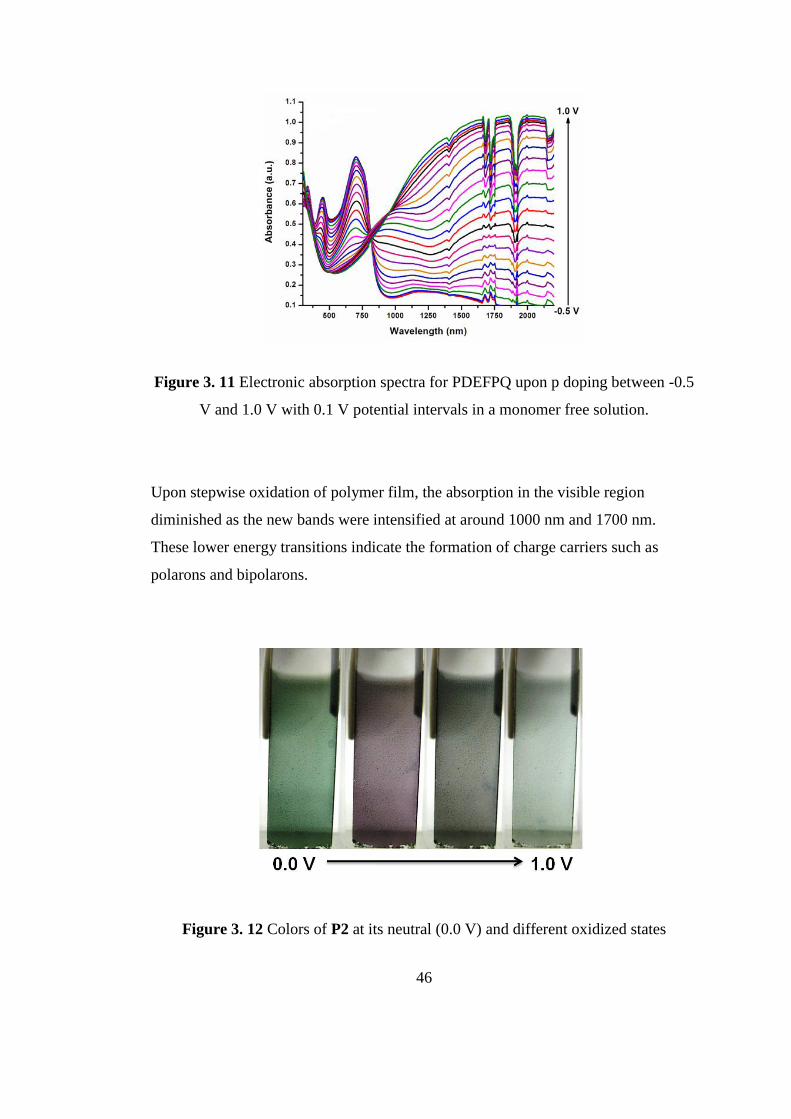
Figure 3. 11 Electronic Absorption Spectra for PDEFPQ upon p Doping Between -
0.5 V and 1.0 V with 0.1 V Potential Intervals in a Monomer Free Solution. ........... 46
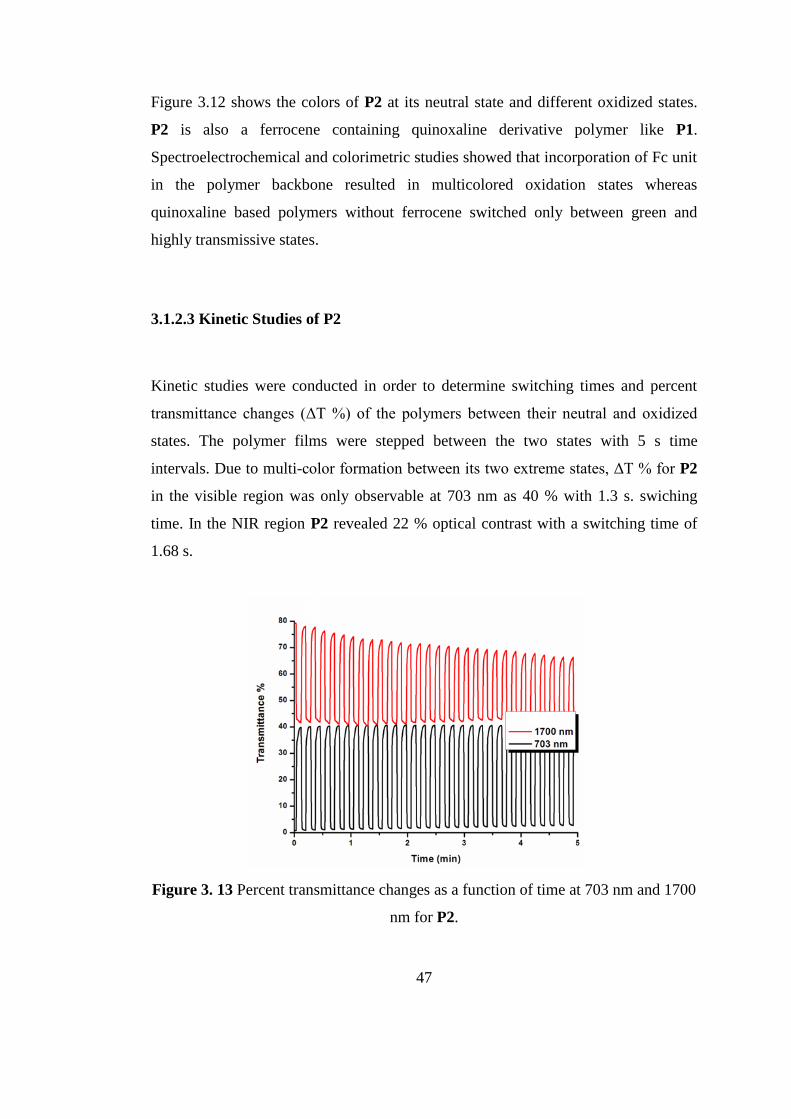
Figure 3. 12 Colors of P2 At Its Neutral (0.0 V) and Different Oxidized States ...... 46
Figure 3. 13 Percent Transmittance Changes as a Function Of Time At 703 nm and
1700 nm for P2. .......................................................................................................... 47
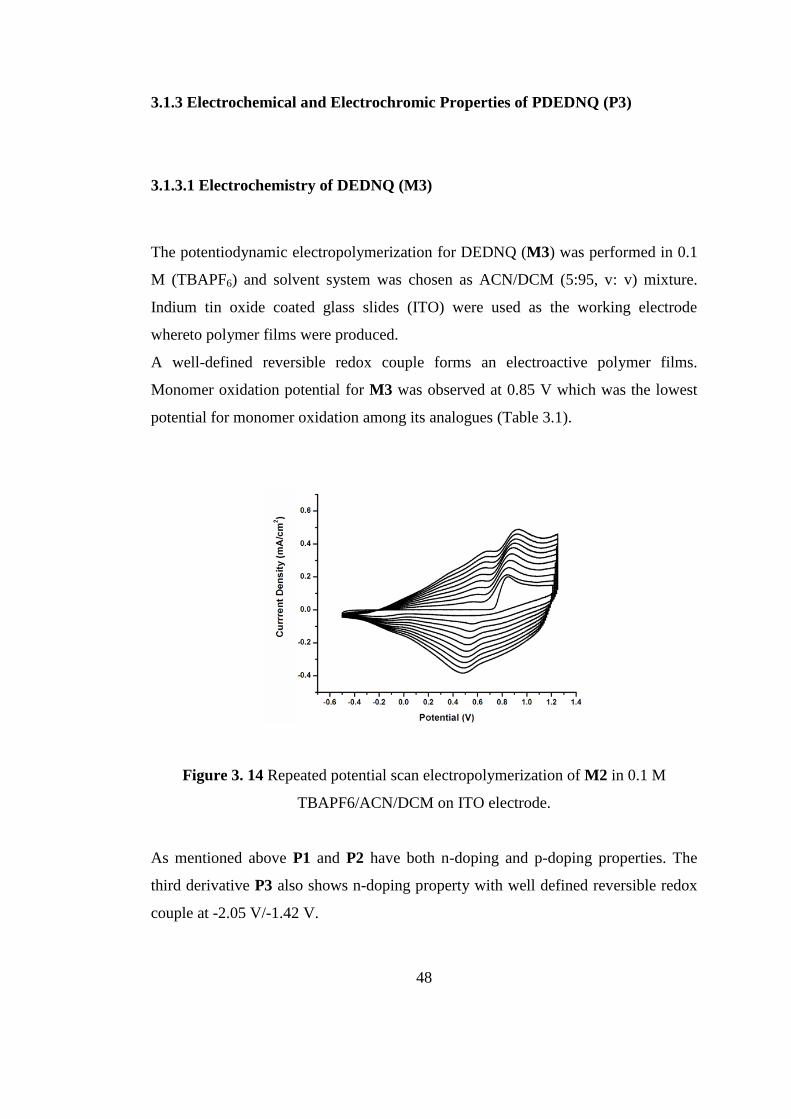
Figure 3. 14 Repeated Potential Scan Electropolymerization of M2 in 0.1 M
TBAPF6/ACN/DCM on ITO Electrode. ................................................................... 48
Figure 3. 15 Single Scan Voltammogram of P3 Upon Both p and n-Type Doping.. 49
Figure 3. 16 Scan Rate Dependence of P3 Films At 100, 150, 200, 250, and 300
mV/s. .......................................................................................................................... 49
Figure 3. 17 Electronic Absorption Spectra for PDEDNQ Upon p Doping Between -
0.5 V And 1.0 V With 0.1 V Potential Intervals in a Monomer Free Solution. ......... 50
Figure 3. 18 Colors of P3 at its Neutral (0.0 V) and Oxidized State. ....................... 51
Figure 3. 19 Percent Transmittance Changes as a Function of Time at 450 Nm, 760
nm and 1800 nm for P3. ............................................................................................. 52
Figure 3. 20 Chemical Structures of P1, P2, P3 And PDPEQ .................................. 53
xvii
Figure A. 1 1H-Nmr Spectrum of 2-Hydroxy-2-(Naphthalen-2-yl)-1-
Ferrocenylethanone 3 ................................................................................................. 61
Figure A. 2 13
C-Nmr Spectrum of 2-Hydroxy-2-(Naphthalen-2-yl)-1-
Ferrocenylethanone 3 ................................................................................................. 62
Figure A. 3 1H-Nmr Spectrum of 1-Ferrocenyl-2-Naphthylethanedione 4 .............. 62
Figure A. 4 1H-Nmr Spectrum of 1-Ferrocenyl-2-Phenylethanedione7 ................... 63
Figure A. 5 13
C-Nmr Spectrum of 1-Ferrocenyl-2-Phenylethanedione 7 ................. 63
Figure A. 6 1H-Nmr Spectrum of 1,2-Di(Naphthalen-2-yl)Ethane-1,2-Dione 9 ...... 64
Figure A. 7 1H-Nmr Spectrum of 4, 7-Dibromo-2.1.3-Benzothiadiazole 11 ............ 64
Figure A. 8 13
C-Nmr Spectrum of 4, 7-Dibromo-2.1.3-Benzothiadiazole 11 ........... 65
Figure A. 9 1H-Nmr Spectrum of 3,6-Dibromo-1,2-Phenylenediamine 12 .............. 65
Figure A. 10 13
C-Nmr Spectrum of 3, 6-Dibromo-1, 2-Phenylenediamine 12 ......... 66
Figure A. 11 1H-Nmr Spectrum of 5, 8-Dibromo-2-(Naphthalen-2-yl)-3-Ferrocenyl-
4a, 8a-Dihydroquinoxaline 15 .................................................................................... 66
Figure A. 12 13
C-Nmr Spectrum of 5,8-Dibromo-2-(Naphthalen-2-yl)-3-Ferrocenyl-
4a,8a-Dihydroquinoxaline 15 ..................................................................................... 67
Figure A. 13 1H-Nmr Spectrum of 5,8-Bis(2,3-Dihydrothieno[3,4-B][1,4]Dioxin-5-
yl)-2-(Naphthalen-2-yl)-3-Ferrocenyl-4a,8a-Dihydroquinoxaline M1...................... 67
Figure A. 14 13
C-Nmr Spectrum of 5,8-Bis(2,3-Dihydrothieno[3,4-B][1,4]Dioxin-5-
yl)-2-(Naphthalen-2-yl)-3-Ferrocenyl-4a,8a-Dihydroquinoxaline M1...................... 68
Figure A. 15 1H-Nmr Spectrum of 5,8-Dibromo-2-Phenyl-3-Ferrocenylquinoxaline
16 ................................................................................................................................ 68
Figure A. 16 13
C-Nmr Spectrum of 5,8-Dibromo-2-Phenyl-3-Ferrocenylquinoxaline
16 ................................................................................................................................ 69
Figure A. 17 1H-Nmr Spectrum of 5, 8-Bis (2, 3-Dihydrothieno [3, 4-B][1,4]Dioxin-
5-yl)-2-(Phenyll)-3-Ferrocenylquinoxaline M2 ......................................................... 69
Figure A. 18 13
C-Nmr Spectrum of 5, 8-Bis (2, 3-Dihydrothieno [3, 4-
B][1,4]Dioxin-5-yl)-2-(Phenyll)-3-Ferrocenylquinoxaline M2 ................................. 70
Figure A. 19 1H-Nmr Spectrum of 5,8-Dibromo-2,3-Di(Naphthalen-2-
yl)Quinoxaline 17....................................................................................................... 70
xviii
Figure A. 20 1H-Nmr Spectrum of 5,8-Bis(2,3-Dihydrothieno[3,4-B][1,4]Dioxin-5-
yl)-2,3-Di(Naphthalen-2-yl)Quinoxaline M3 ............................................................ 71
Figure A. 21 13
C-Nmr Spectrum of 5,8-Bis(2,3-Dihydrothieno[3,4-B][1,4]Dioxin-5-
yl)-2,3-Di(Naphthalen-2-yl)Quinoxaline M3 ............................................................ 71
xix
ABBREVATIONS
ACN Acetonitrile
CB Conduction Band
CP Conducting Polymer
CV Cyclic Voltammetry
DCM Dichloromethane
ECD Electrochromic Device
EDOT 3,4-Ethylenedioxythiophene
Eg Band Gap Energy
Fc Ferrocenyl
HOMO Highest Occupied Molecular Orbital
ITO Indium Tin Oxide
LED Light Emitting Diode
LUMO Lowest Unoccupied Molecular Orbital
NMR Nuclear Magnetic Resonance
PDEQ Poly5,8-Bis(2,3-dihydrothieno[3,4-b][1,4]dioxin-5-yl)
PDEFNQ 5,8-bis(2,3-dihydrothieno[3,4-b][1,4]dioxin-5-yl)-2-(naphthalen-2-yl)-
3-ferrocenyl-4a,8a-dihydroquinoxaline
PDEFPQ 5,8-bis(2,3-dihydrothieno[3,4-b][1,4]dioxin-5-yl)-2-(phenyll)-3-
ferrocenylquinoxaline
PDEDNQ 5,8-bis(2,3-dihydrothieno[3,4-b][1,4]dioxin-5-yl)-2,3-di(naphthalen-2-
yl)quinoxaline
PPy Polypyrrole
PTh Polythiophene
PTSA P-toluene sulfonic acid
TBAPF6 Tetrabutylammonium hexafluorophosphate
VB Valence Band
1
CHAPTER 1
INTRODUCTION
1.1 Conducting Polymers
Electronically conducting polymers are active materials whose properties can be
changed as a result of their electrochemical potential [1]. Investigation of polymers
having high electronic conductivity in the partially oxidized state opened a new era
in the 1970s and promising optical and electrical properties of conducting polymers
increase an interest in organic semiconductor materials [2].
Shirakawa and coworkers prepared polyacetylene and its conductivity after doping
was discovered by MacDiarmid and Heeger [3]. Alan Heeger, Alan MacDiarmid,
and Hideki Shirakawa received the Nobel Prize in Chemistry in year 2000 "for the
discovery and development of electrically conductive polymers”
A new class of materials named as synthetic metals were generated as a result of this
superior discovery, that conjugated polymers can be converted into metals upon
doping. New classes of conducting polymers such as polythiophenes, polypyrroles
and many others were developed and electrochemistry played an important role
during the preparation and characterization of these original materials. The
polyheterocycles have gathered substantial attention because of their electron-rich
character which makes their oxidation eaiser. Another advantage of polyheterocycles
is their structural complexity which makes structural modifications possible and
improves processability [4].
2
Figure 1. 1 Common conjugated polymers
1.2 Band Theory
Electronically conducting polymers are widely conjugated molecules and their
electronic structures can be defined as delocalized band-like structure. Band theory
can explain the electronic structure of materials which are defined as insulators,
semiconductors, or metals. The major difference between these materials is band gap
(Eg) which can be described as the energy spacing between the highest occupied and
lowest unoccupied band. Metals have partially filled bands resulting the free
movement of charge carriers. This free movement makes metals conducting. On the
other hand, insulators have large band gap between two bands. Semiconductors have
a filled valence band and an empty conduction band with a narrow band gap (Eg) and
so electrons can move to conduction band by thermally or photochemically. As a
result, in order to increase conductivity semiconductors can be doped. This doping
process can be done with dopants either holes (p-type) or electrons (n-type) which
are also called as charge carriers[5].(Figure 1.2)
3
Figure 1. 2 The band structure of an insulator, a semiconductor and a conductor
Polyacetylene (PA) which is the simplest conducting polymer or poly(p-phenylene)
and polythiophene which are more complicated with respect to PA can be used to
understand band theory of conducting polymers more clearly.
PA is a simple chain of sp2 hybridized carbon atoms with alternating single and
double bonds leading to two degenerate neutral resonance structures [6]. As a result
of wide delocalization, all the bond lengths are equal in PA, whereas, in aromatic
polymers like poly(p-phenylene), two nondegenerate ground states exist [7].
4
Figure 1. 3 The degenerate ground states of PA (a) and the nondegenerate ground
states of the fully aromatic polymer, poly(p-phenylene) (b).
For PA as conjugation increases a band structure formation is observed. The ground
state of polyacetylene is degenerate which produces structural defects in polymer
chains. These defects cause a change in bond alternation. At the defect site, a single
unpaired electron exists and this neutral defect known as a 'soliton'. A minimum
energy configuration can be achieved by combaining a neutral soliton and a charged
one. These two will produce a 'polaron' , which can be defined as a radical cation,
and polaron brings about two states in the band gap, a bonding and an anti-bonding
orbital. At a high doping level, two charged solitons will form as a combination of
polarons. And finally the interaction of charged solitons will form a soliton band
which creates metallic conductivity [5].
5
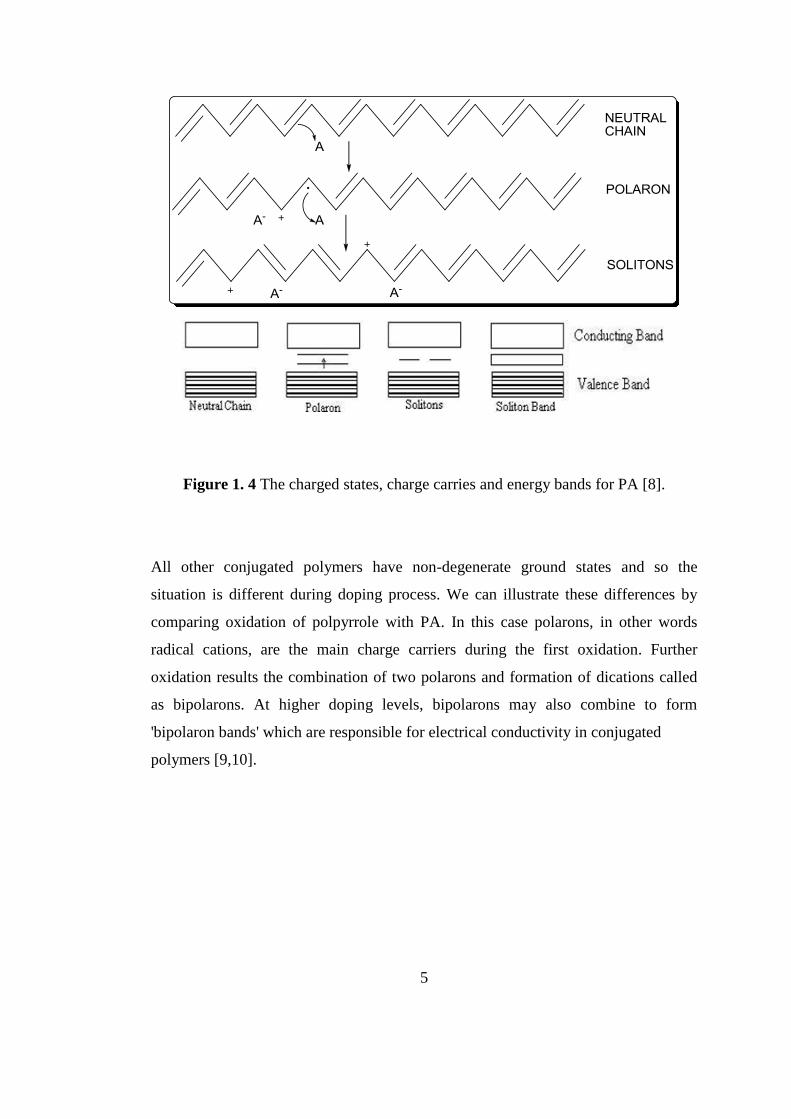
Figure 1. 4 The charged states, charge carries and energy bands for PA [8].
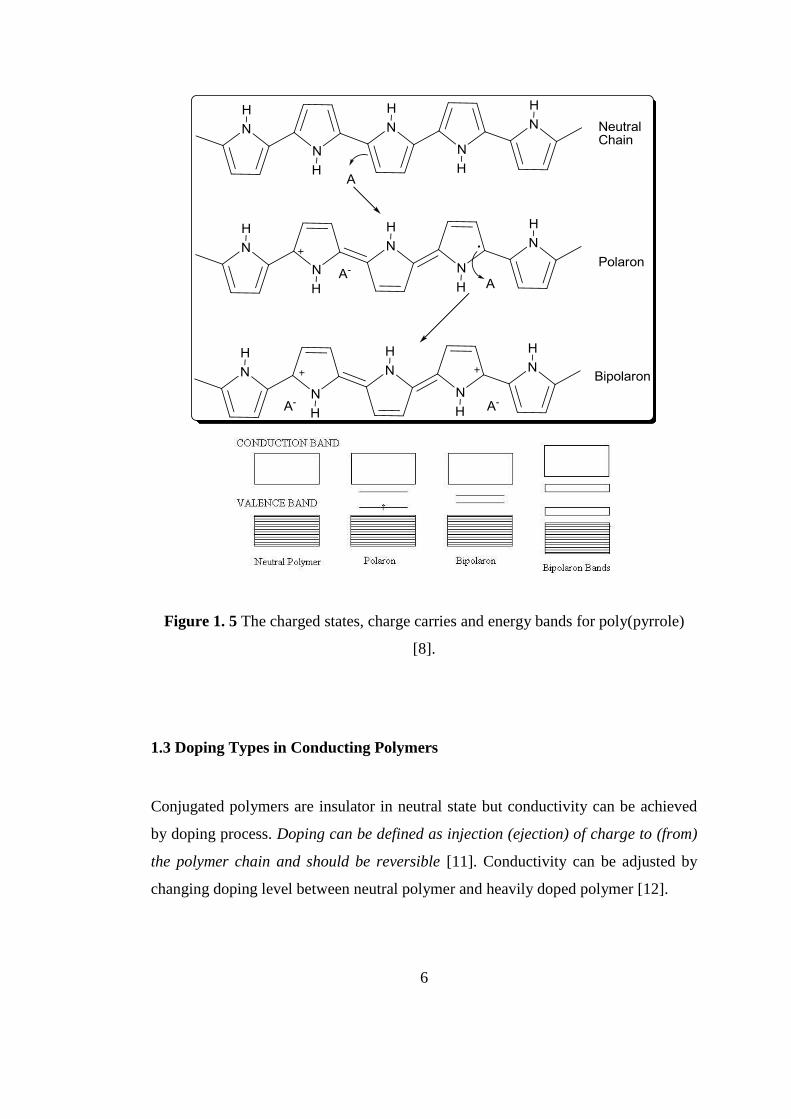
All other conjugated polymers have non-degenerate ground states and so the
situation is different during doping process. We can illustrate these differences by
comparing oxidation of polpyrrole with PA. In this case polarons, in other words
radical cations, are the main charge carriers during the first oxidation. Further
oxidation results the combination of two polarons and formation of dications called
as bipolarons. At higher doping levels, bipolarons may also combine to form
'bipolaron bands' which are responsible for electrical conductivity in conjugated
polymers [9,10].
6
Figure 1. 5 The charged states, charge carries and energy bands for poly(pyrrole)
[8].
1.3 Doping Types in Conducting Polymers
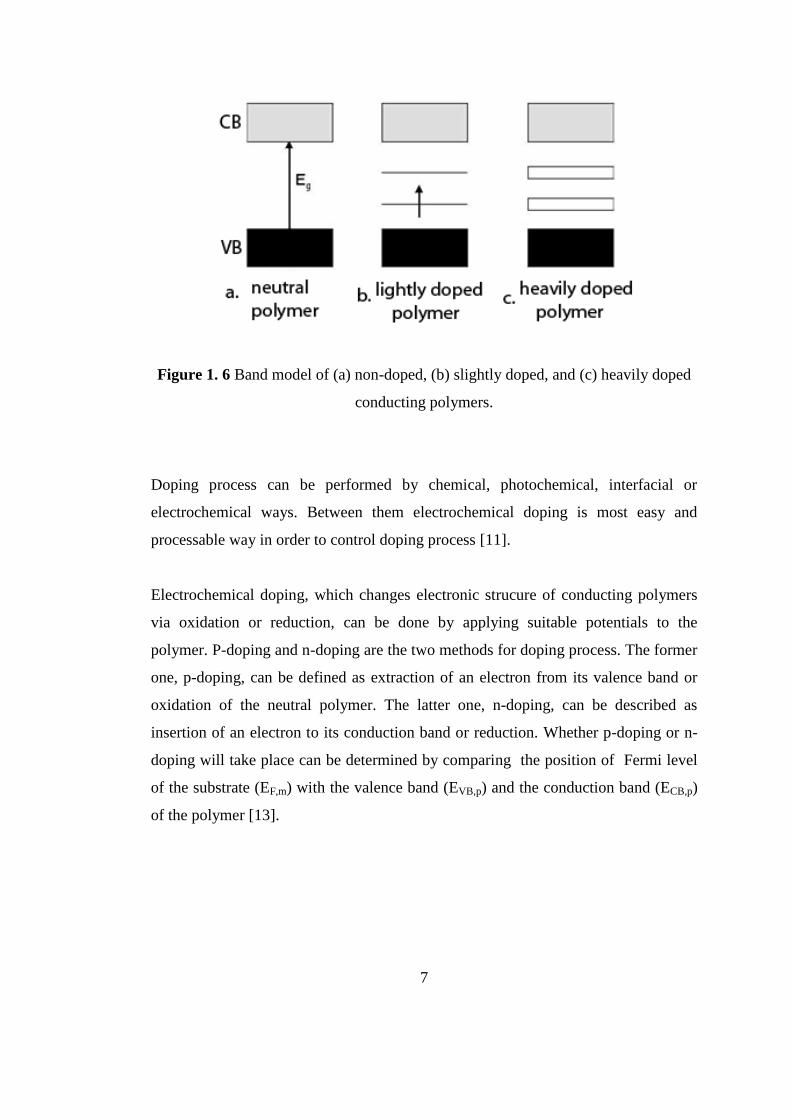
Conjugated polymers are insulator in neutral state but conductivity can be achieved
by doping process. Doping can be defined as injection (ejection) of charge to (from)
the polymer chain and should be reversible [11]. Conductivity can be adjusted by
changing doping level between neutral polymer and heavily doped polymer [12].
7
Figure 1. 6 Band model of (a) non-doped, (b) slightly doped, and (c) heavily doped
conducting polymers.
Doping process can be performed by chemical, photochemical, interfacial or
electrochemical ways. Between them electrochemical doping is most easy and
processable way in order to control doping process [11].
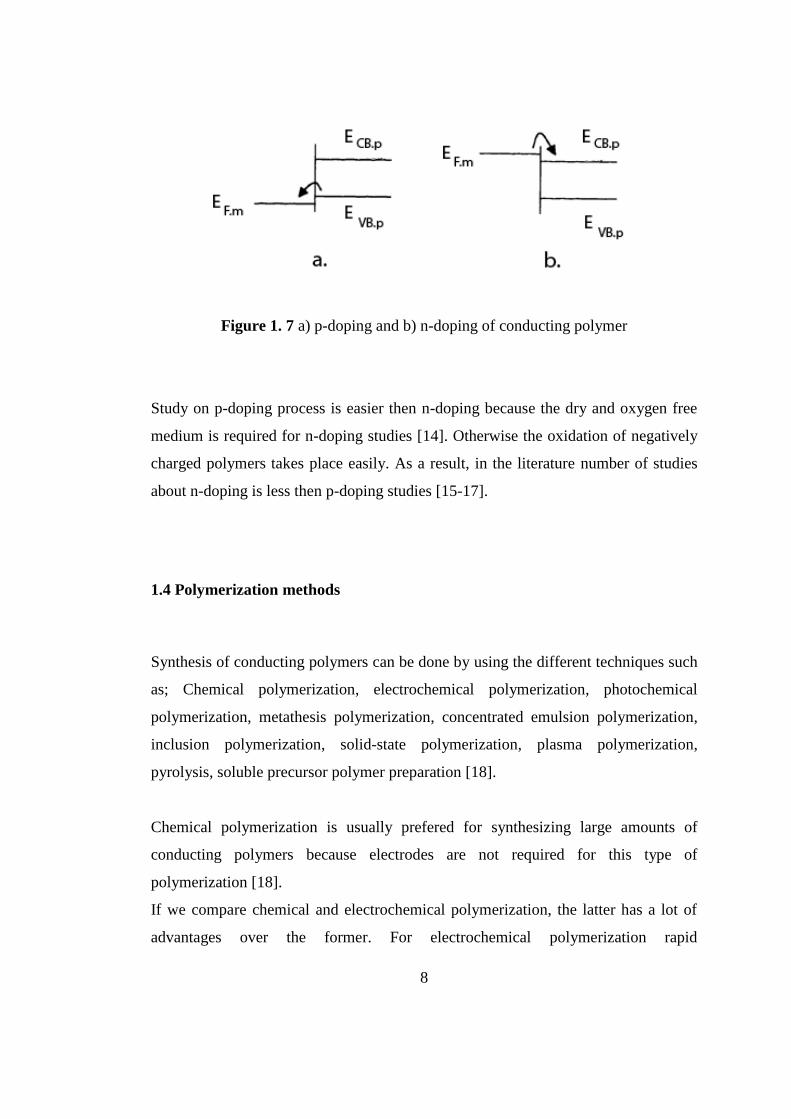
Electrochemical doping, which changes electronic strucure of conducting polymers
via oxidation or reduction, can be done by applying suitable potentials to the
polymer. P-doping and n-doping are the two methods for doping process. The former
one, p-doping, can be defined as extraction of an electron from its valence band or
oxidation of the neutral polymer. The latter one, n-doping, can be described as
insertion of an electron to its conduction band or reduction. Whether p-doping or n-
doping will take place can be determined by comparing the position of Fermi level
of the substrate (EF,m) with the valence band (EVB,p) and the conduction band (ECB,p)
of the polymer [13].
8
Figure 1. 7 a) p-doping and b) n-doping of conducting polymer
Study on p-doping process is easier then n-doping because the dry and oxygen free
medium is required for n-doping studies [14]. Otherwise the oxidation of negatively
charged polymers takes place easily. As a result, in the literature number of studies
about n-doping is less then p-doping studies [15-17].
1.4 Polymerization methods
Synthesis of conducting polymers can be done by using the different techniques such
as; Chemical polymerization, electrochemical polymerization, photochemical
polymerization, metathesis polymerization, concentrated emulsion polymerization,
inclusion polymerization, solid-state polymerization, plasma polymerization,
pyrolysis, soluble precursor polymer preparation [18].
Chemical polymerization is usually prefered for synthesizing large amounts of
conducting polymers because electrodes are not required for this type of
polymerization [18].
If we compare chemical and electrochemical polymerization, the latter has a lot of
advantages over the former. For electrochemical polymerization rapid
9
characterization of conducting polymers are posssible because in this case desired
polymers synthesized on an electrode surface. In addition it is simple, reproducible
and the film thickness can be controlled during electrochemical polymerization [11].
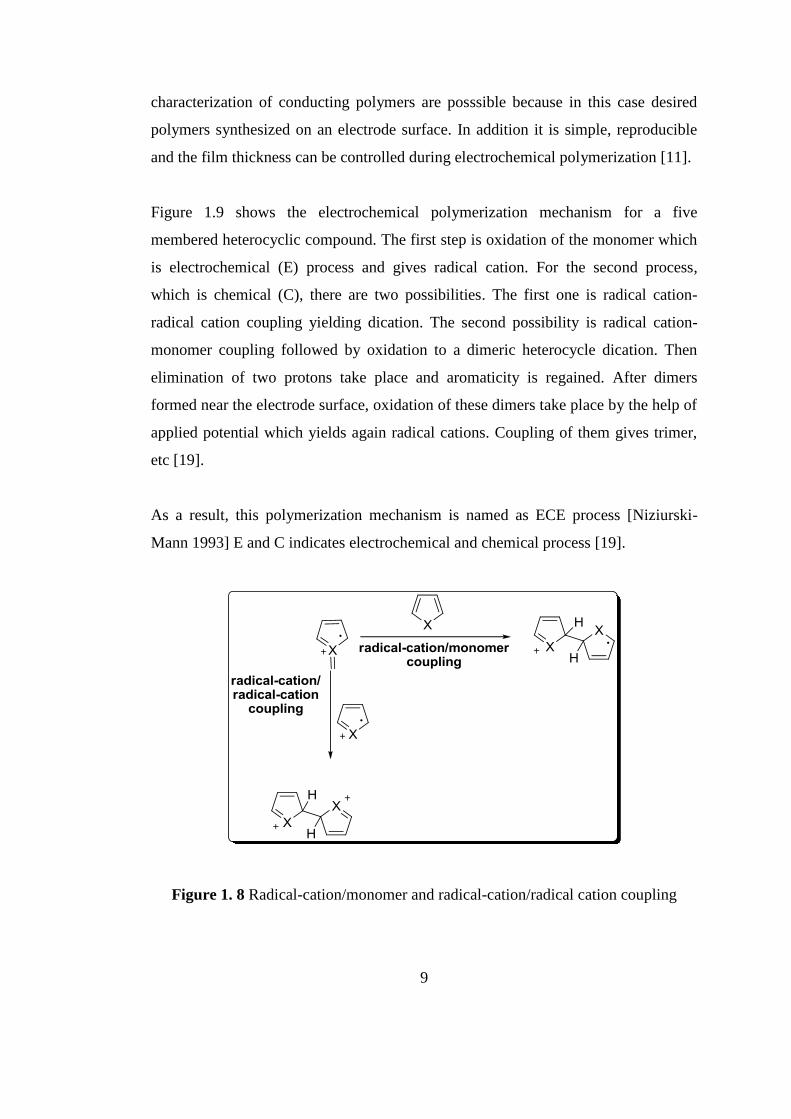
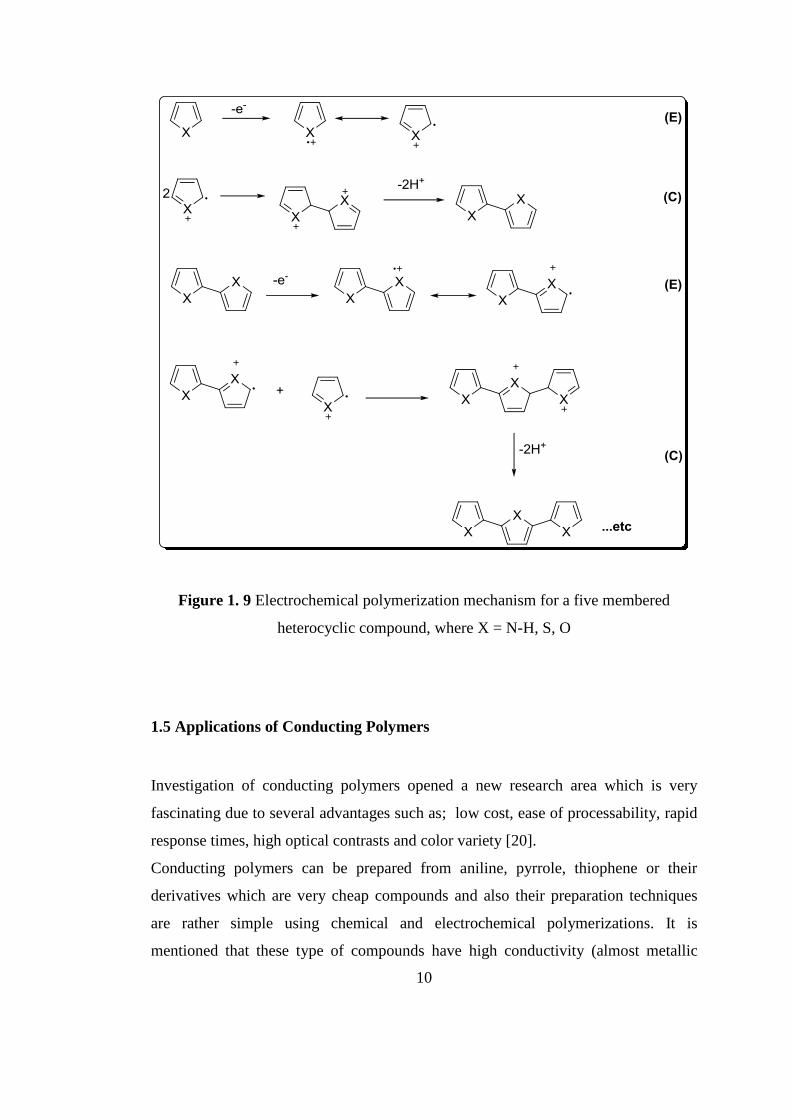
Figure 1.9 shows the electrochemical polymerization mechanism for a five
membered heterocyclic compound. The first step is oxidation of the monomer which
is electrochemical (E) process and gives radical cation. For the second process,
which is chemical (C), there are two possibilities. The first one is radical cation-
radical cation coupling yielding dication. The second possibility is radical cation-
monomer coupling followed by oxidation to a dimeric heterocycle dication. Then
elimination of two protons take place and aromaticity is regained. After dimers
formed near the electrode surface, oxidation of these dimers take place by the help of
applied potential which yields again radical cations. Coupling of them gives trimer,
etc [19].
As a result, this polymerization mechanism is named as ECE process [Niziurski-
Mann 1993] E and C indicates electrochemical and chemical process [19].
Figure 1. 8 Radical-cation/monomer and radical-cation/radical cation coupling
10
Figure 1. 9 Electrochemical polymerization mechanism for a five membered
heterocyclic compound, where X = N-H, S, O
1.5 Applications of Conducting Polymers
Investigation of conducting polymers opened a new research area which is very
fascinating due to several advantages such as; low cost, ease of processability, rapid
response times, high optical contrasts and color variety [20].
Conducting polymers can be prepared from aniline, pyrrole, thiophene or their
derivatives which are very cheap compounds and also their preparation techniques
are rather simple using chemical and electrochemical polymerizations. It is
mentioned that these type of compounds have high conductivity (almost metallic
11
conductivity); in addition, the conductivity can be changed by oxidation or reduction
[2]. These valuable properties increase the popularity of conducting polymers and
make them applicable in a variety of area. Sensors [21], light emitting diodes [22],
solar cells [23], field effect transistors [24], and electrochromic devices [25] are
some of the important industrial applications of conducting polymers.
1.6 Electrochromism
The reversible and visible change in transmittance or reflectance as a result of an
applied voltage is called as electrochromism [26]. The increasing popularity of
electrochromic materials in academia and industry can be explained by their dramatic
spectroelectrochemical properties and their wide field of applications [27].
In order to characterize electrochromic materials different parameters can be used
which are very useful to identify them and specify their usage area. Electrochromic
contrast, coloration efficiency, switching speed, stability and optical memory are
some of these parameters [28].
Electrochromic materials can be divided into three main types according to optical
states. The changes in color between a colored and a transmissive state are the first
case. Metal oxides, viologens, and polymers such as poly(3,4-
ethylenedioxythiophene) (PEDOT) are important examples for this type. This type of
electrochromic materials can be used for smart windows and optical shutters which
are classified as absorption/transmission-type device applications. The second case is
the color changes between the two colored states. Polythiophene which can be used
for display-type applications is a good example of this type. Finally, the third case is
the electrochromic materials having more than two color states which can also called
as multicolored EC polymers. Conjugated polymers are good examples for this class
[28].
12
1.6.1 Types of Electrochromic Materials
There are mainly three types of electrochromic materials; metal oxides, organic small
molecules (viologens) and conducting polymers [29].
Transition-metal oxides with high band-gap such as tungsten oxide, WO3 were
widely studied over the past 30 years and these types of materials are the earliest
electrochromic materials. Electrochromic properties for oxides of V, Mo, Nb, and Ti
(cathodically coloring), and oxides of Ni, Co, and Ir (anodically coloring) were also
studied [29]. Tungsten oxide is a transparent thin film in its neutral state and when it
is electrochemically reduced the color of the thin film turned to blue. The following
equation illustrates the electrochromic process of WO3.
WO3 + xM+ + xe
− → MxWO3
(transparent) (blue)
with M+= H
+, Li
+, Na
+, or K
+ [30].
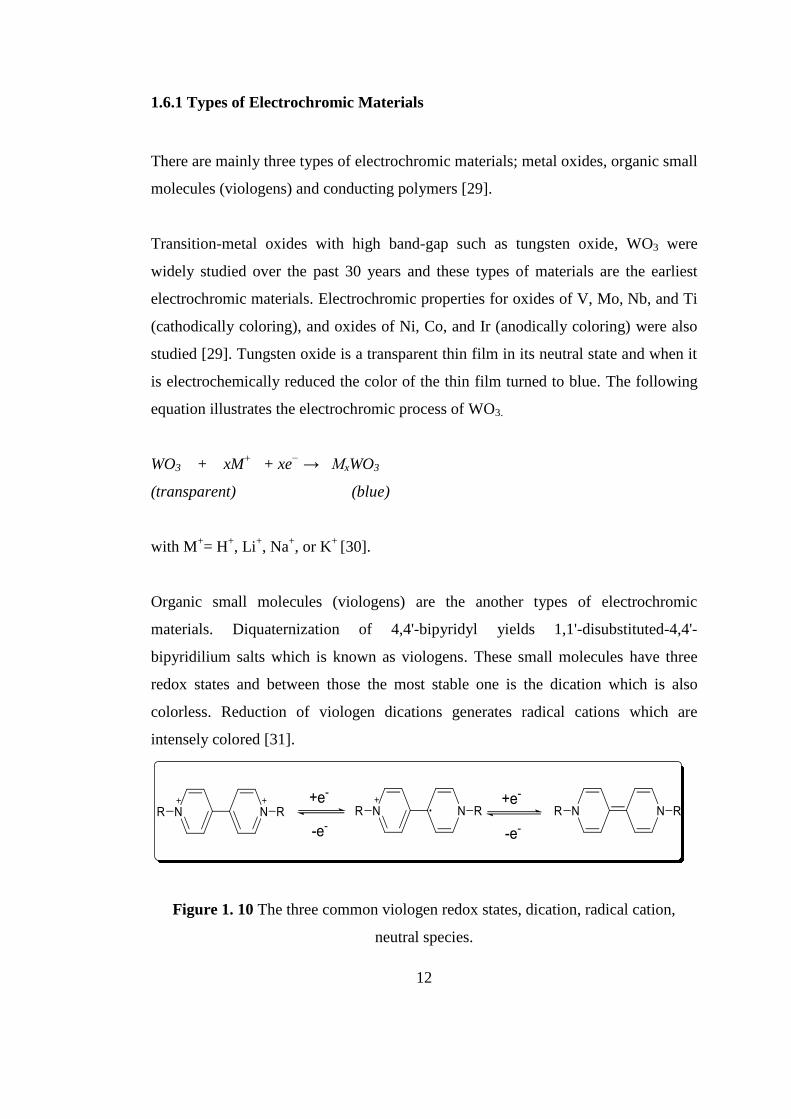
Organic small molecules (viologens) are the another types of electrochromic
materials. Diquaternization of 4,4'-bipyridyl yields 1,1'-disubstituted-4,4'-
bipyridilium salts which is known as viologens. These small molecules have three
redox states and between those the most stable one is the dication which is also
colorless. Reduction of viologen dications generates radical cations which are
intensely colored [31].
Figure 1. 10 The three common viologen redox states, dication, radical cation,
neutral species.
13
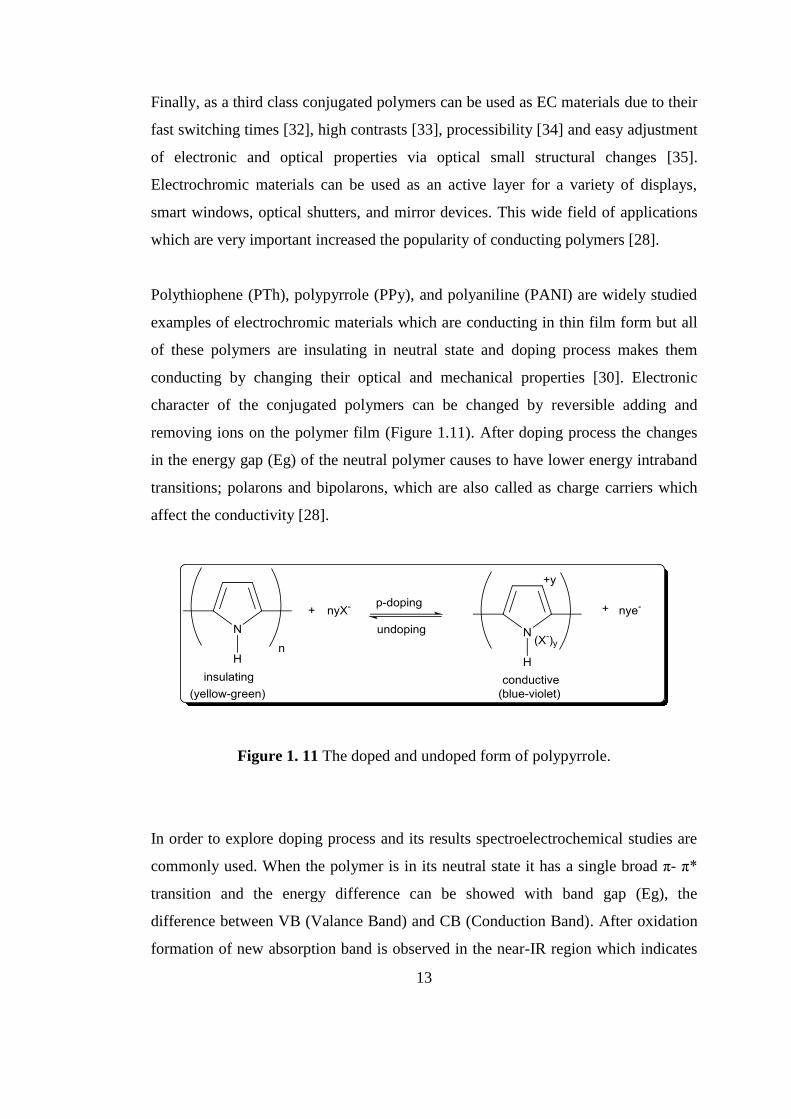
Finally, as a third class conjugated polymers can be used as EC materials due to their
fast switching times [32], high contrasts [33], processibility [34] and easy adjustment
of electronic and optical properties via optical small structural changes [35].
Electrochromic materials can be used as an active layer for a variety of displays,
smart windows, optical shutters, and mirror devices. This wide field of applications
which are very important increased the popularity of conducting polymers [28].
Polythiophene (PTh), polypyrrole (PPy), and polyaniline (PANI) are widely studied
examples of electrochromic materials which are conducting in thin film form but all
of these polymers are insulating in neutral state and doping process makes them
conducting by changing their optical and mechanical properties [30]. Electronic
character of the conjugated polymers can be changed by reversible adding and
removing ions on the polymer film (Figure 1.11). After doping process the changes
in the energy gap (Eg) of the neutral polymer causes to have lower energy intraband
transitions; polarons and bipolarons, which are also called as charge carriers which
affect the conductivity [28].
Figure 1. 11 The doped and undoped form of polypyrrole.
In order to explore doping process and its results spectroelectrochemical studies are
commonly used. When the polymer is in its neutral state it has a single broad π- π*
transition and the energy difference can be showed with band gap (Eg), the
difference between VB (Valance Band) and CB (Conduction Band). After oxidation
formation of new absorption band is observed in the near-IR region which indicates
14
the formation of radical cations (polarons). After further oxidation while the intensity
of polaron bands and π- π* transition decrease, bipolaron bands are formed in the
near-IR region. These changes alter the color of EC polymers [36].
1.6.2 Multicolor Electrochromic Polymers: Color Control
When we compare conjugated polymers as EC materials with others (inorganic
compounds and viologens), the most important advantage is obviously their ease of
structural modification by making small changes in the chemical structure. One can
change the color of EC material in doped and undoped forms and synthesize
multichromic polymers by the controlling band gap [37]. Copolymerization or
homopolymerization can be used for band gap modification. In the literature
modification of main chain and pendant groups are the widely used synthetic ways
for adjusting band gap. EDOT is widely used as the donor group for that purpose.
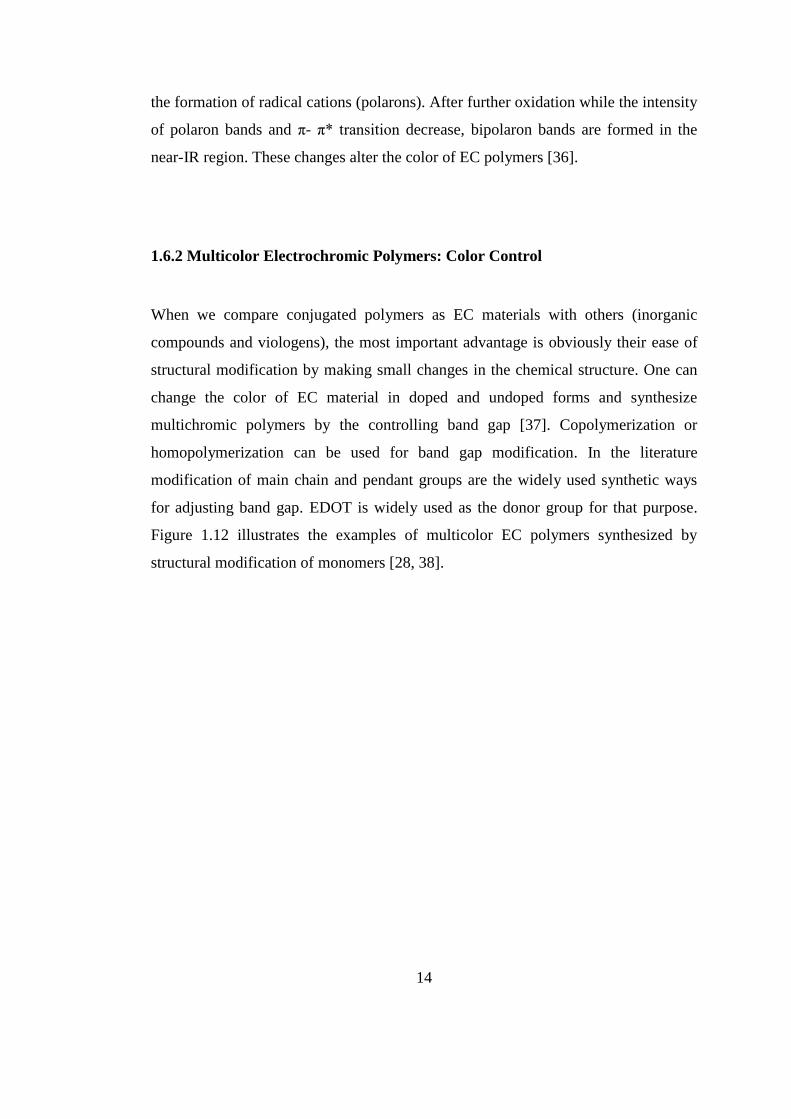
Figure 1.12 illustrates the examples of multicolor EC polymers synthesized by
structural modification of monomers [28, 38].
15
Figure 1. 12 Examples of multicolor EC polymers synthesized by structural
modification. 0 = neutral; I= intermediate; + =oxidized; and-- = reduced
1.7 Low Band Gap Systems
Band gap does not only affect the color but also alter the conductivity of polymers.
Low band gap polymers are an interesting class of materials which attract so many
researchers in recent years due to their wide field of applications. Polymers which
are transparent in doped state are very valuable materials and this rare property can
also be satisfied by modification of band gap. As a result of this modification one can
widen the application area of these polymers such as smart windows or electrodes.
16
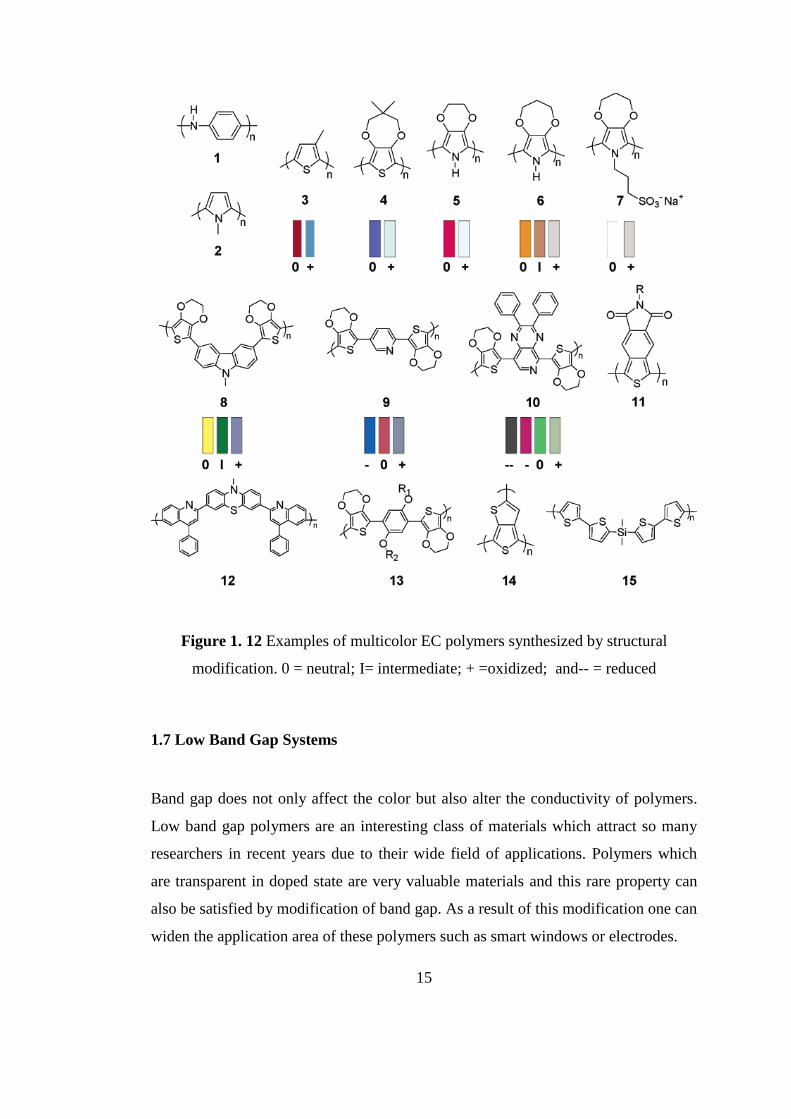
In the literature, five basic methods were used to lower the band gap. Figure 1.13
shows these five methods for the alteration of band gap. Variation of bond length,
increasing planarity of the systems, increasing stability of the polymer by using
resonance, interchain effects and finally synthesizing donor-acceptor-donor type
polymers are the methods for modification of band gap. Between them, the last one
is the most advantageous and preferable one because this method minimize solubility
problems and also provides variety in synthesis [39].
Figure 1. 13 Illustration of methods for the alteration of band gap
17
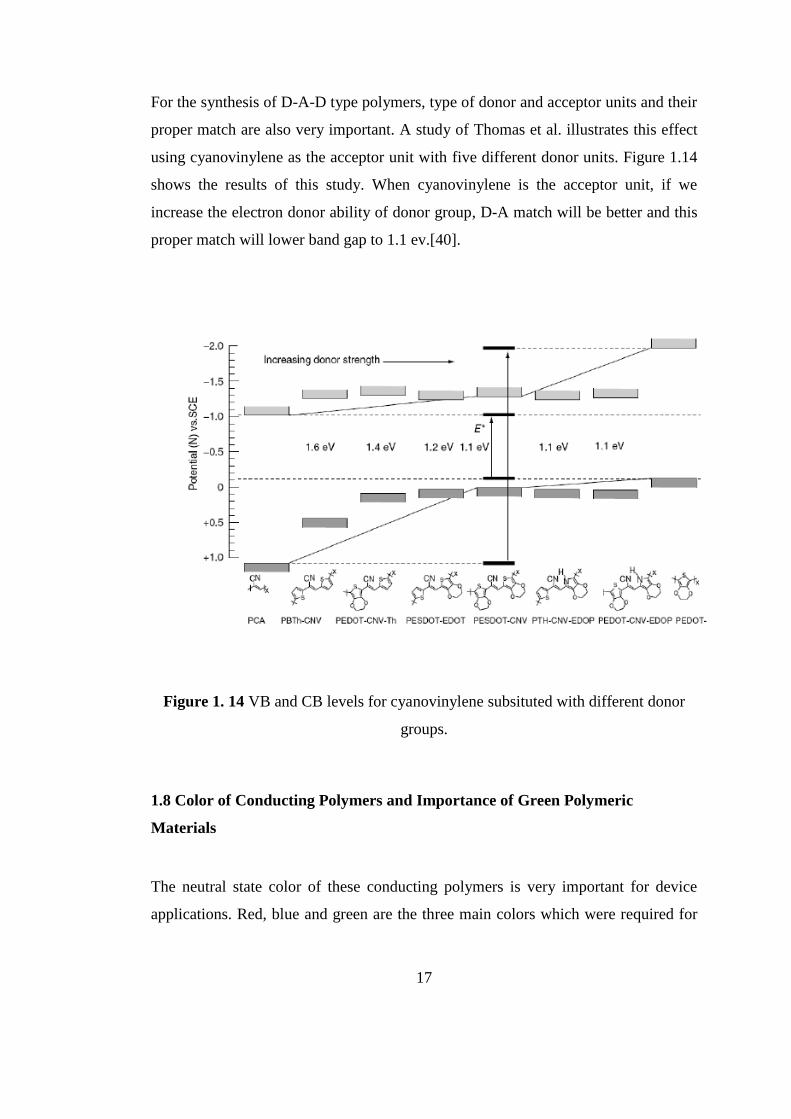
For the synthesis of D-A-D type polymers, type of donor and acceptor units and their
proper match are also very important. A study of Thomas et al. illustrates this effect
using cyanovinylene as the acceptor unit with five different donor units. Figure 1.14
shows the results of this study. When cyanovinylene is the acceptor unit, if we
increase the electron donor ability of donor group, D-A match will be better and this
proper match will lower band gap to 1.1 ev.[40].
Figure 1. 14 VB and CB levels for cyanovinylene subsituted with different donor
groups.
1.8 Color of Conducting Polymers and Importance of Green Polymeric
Materials
The neutral state color of these conducting polymers is very important for device
applications. Red, blue and green are the three main colors which were required for
18
electrochromic devices. After these three were synthesized by mixing each of them
all other colors can be acquired [41,42].
Most of the electrochromic polymers synthesized in the literature are red and blue
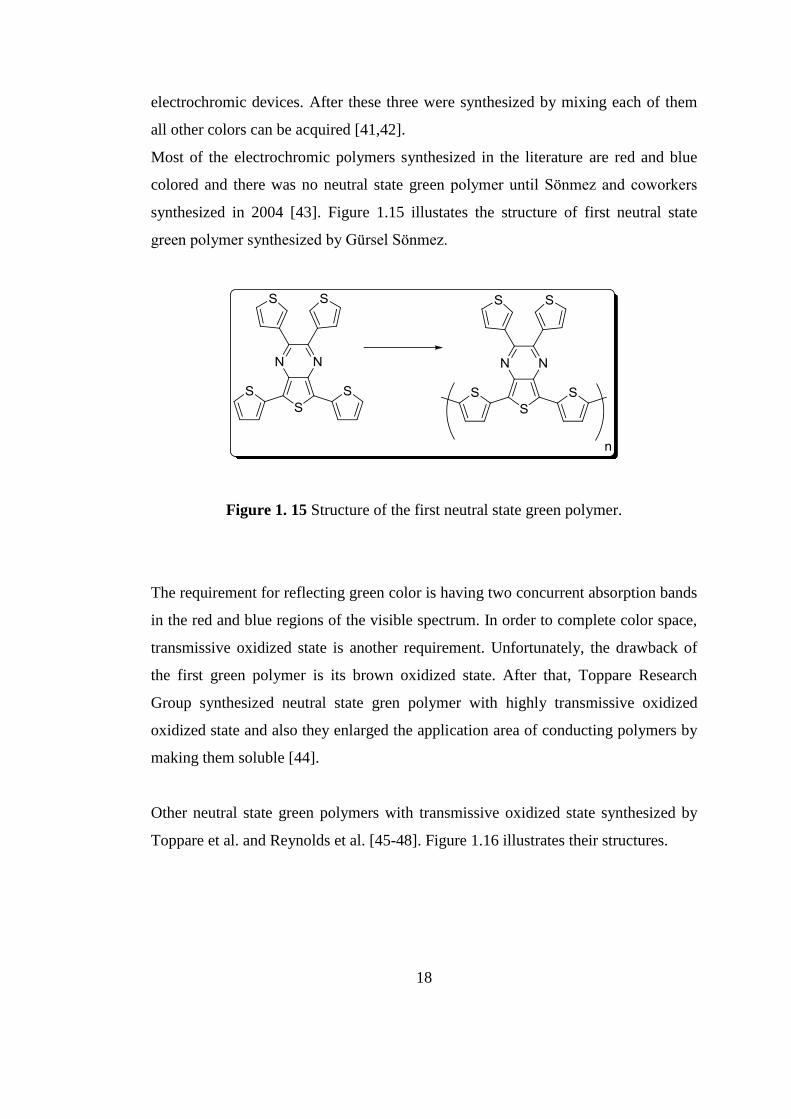
colored and there was no neutral state green polymer until Sönmez and coworkers
synthesized in 2004 [43]. Figure 1.15 illustates the structure of first neutral state
green polymer synthesized by Gürsel Sönmez.
Figure 1. 15 Structure of the first neutral state green polymer.
The requirement for reflecting green color is having two concurrent absorption bands
in the red and blue regions of the visible spectrum. In order to complete color space,
transmissive oxidized state is another requirement. Unfortunately, the drawback of
the first green polymer is its brown oxidized state. After that, Toppare Research
Group synthesized neutral state gren polymer with highly transmissive oxidized
oxidized state and also they enlarged the application area of conducting polymers by
making them soluble [44].
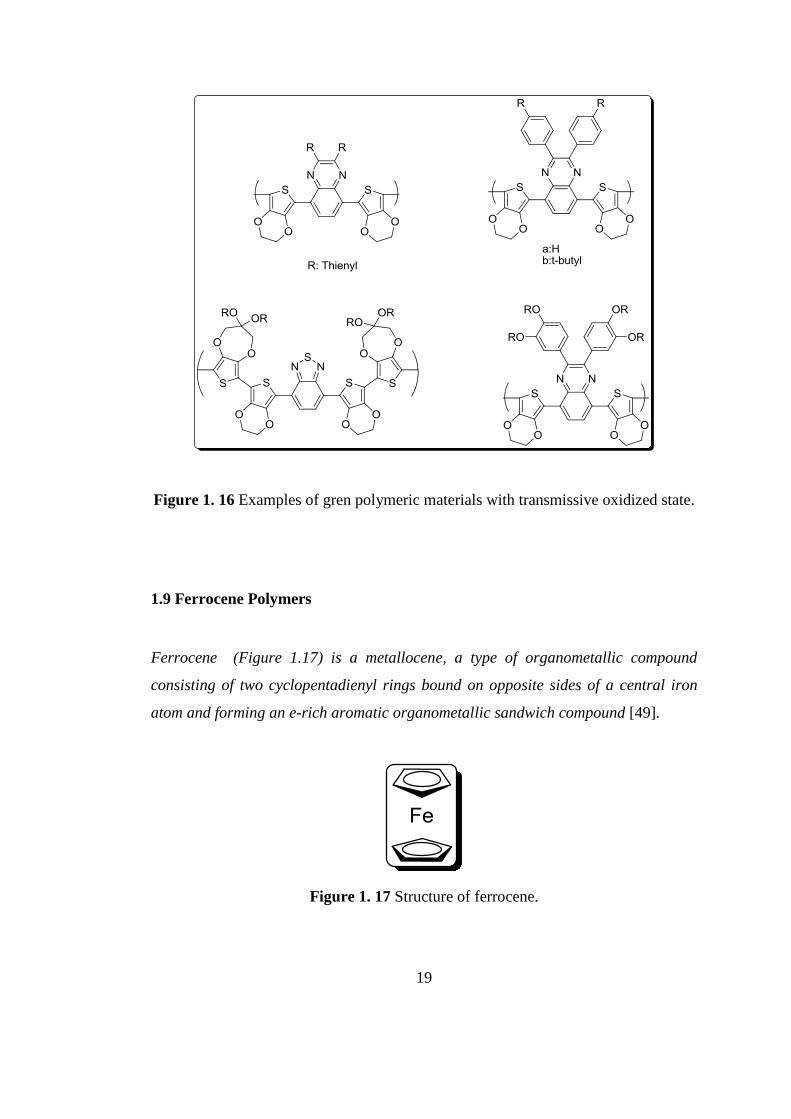
Other neutral state green polymers with transmissive oxidized state synthesized by
Toppare et al. and Reynolds et al. [45-48]. Figure 1.16 illustrates their structures.
19
Figure 1. 16 Examples of gren polymeric materials with transmissive oxidized state.
1.9 Ferrocene Polymers
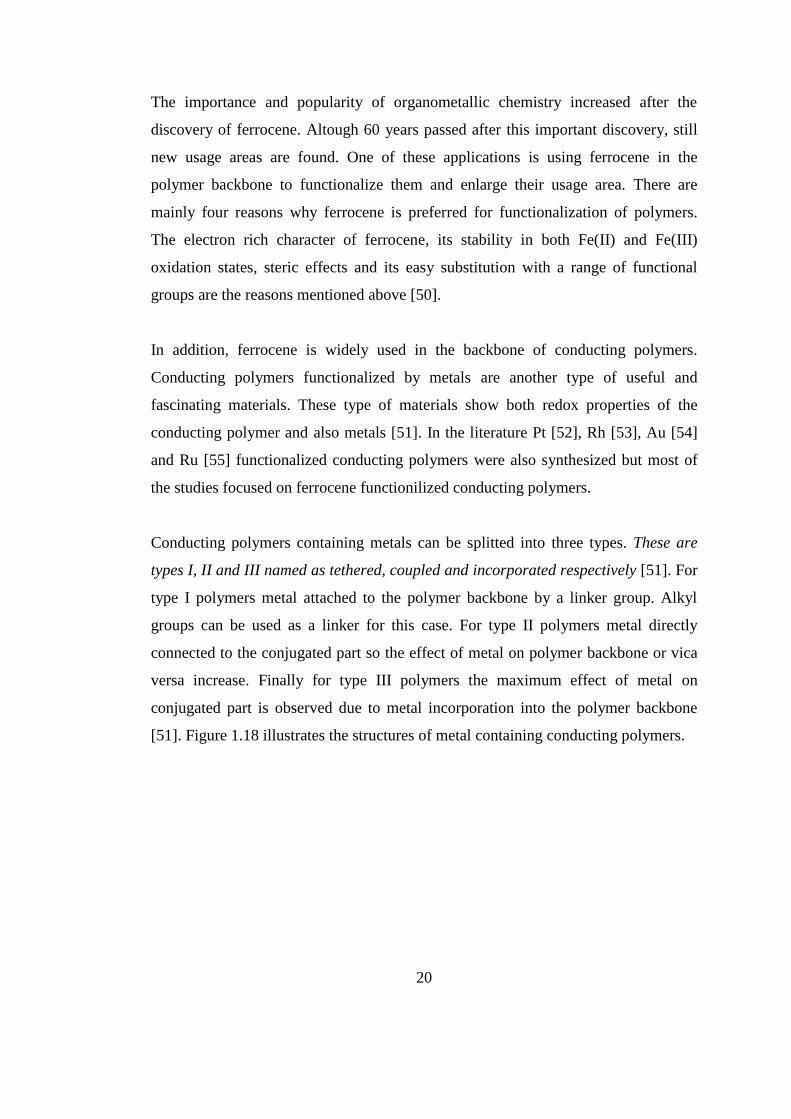
Ferrocene (Figure 1.17) is a metallocene, a type of organometallic compound
consisting of two cyclopentadienyl rings bound on opposite sides of a central iron
atom and forming an e-rich aromatic organometallic sandwich compound [49].
Figure 1. 17 Structure of ferrocene.
20
The importance and popularity of organometallic chemistry increased after the
discovery of ferrocene. Altough 60 years passed after this important discovery, still
new usage areas are found. One of these applications is using ferrocene in the
polymer backbone to functionalize them and enlarge their usage area. There are
mainly four reasons why ferrocene is preferred for functionalization of polymers.
The electron rich character of ferrocene, its stability in both Fe(II) and Fe(III)
oxidation states, steric effects and its easy substitution with a range of functional
groups are the reasons mentioned above [50].
In addition, ferrocene is widely used in the backbone of conducting polymers.
Conducting polymers functionalized by metals are another type of useful and
fascinating materials. These type of materials show both redox properties of the
conducting polymer and also metals [51]. In the literature Pt [52], Rh [53], Au [54]
and Ru [55] functionalized conducting polymers were also synthesized but most of
the studies focused on ferrocene functionilized conducting polymers.
Conducting polymers containing metals can be splitted into three types. These are
types I, II and III named as tethered, coupled and incorporated respectively [51]. For
type I polymers metal attached to the polymer backbone by a linker group. Alkyl
groups can be used as a linker for this case. For type II polymers metal directly
connected to the conjugated part so the effect of metal on polymer backbone or vica
versa increase. Finally for type III polymers the maximum effect of metal on
conjugated part is observed due to metal incorporation into the polymer backbone
[51]. Figure 1.18 illustrates the structures of metal containing conducting polymers.
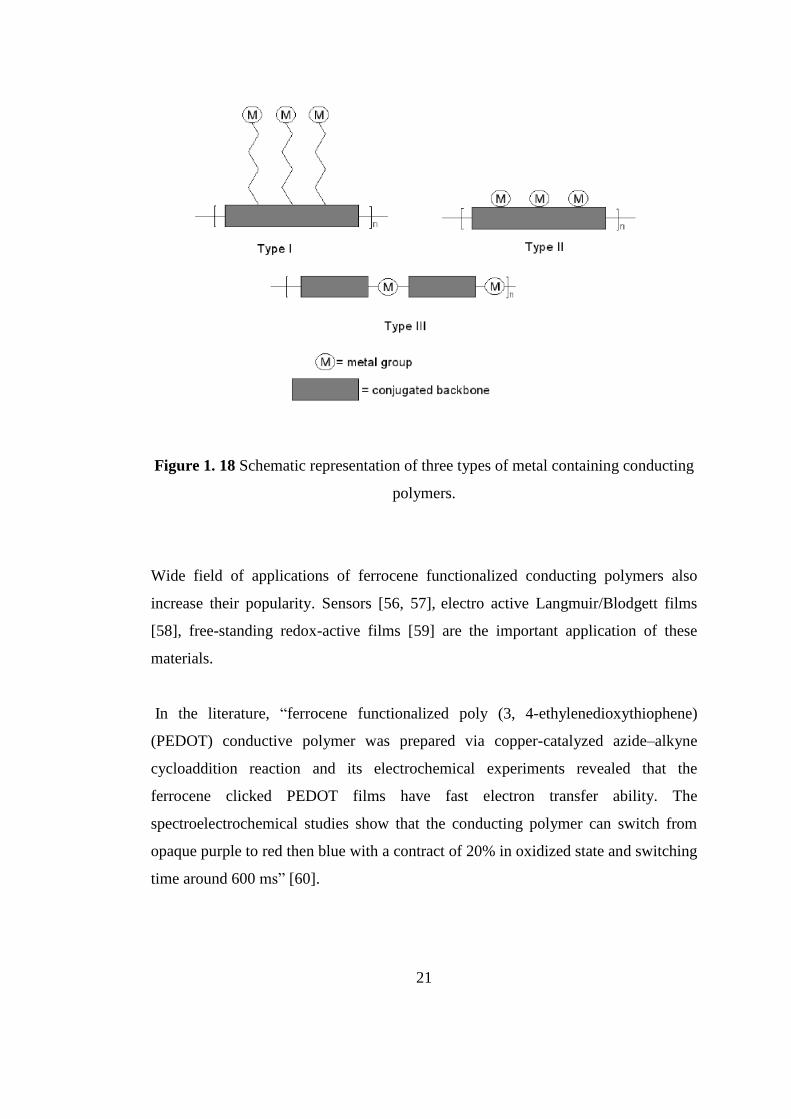
21
Figure 1. 18 Schematic representation of three types of metal containing conducting
polymers.
Wide field of applications of ferrocene functionalized conducting polymers also
increase their popularity. Sensors [56, 57], electro active Langmuir/Blodgett films
[58], free-standing redox-active films [59] are the important application of these
materials.
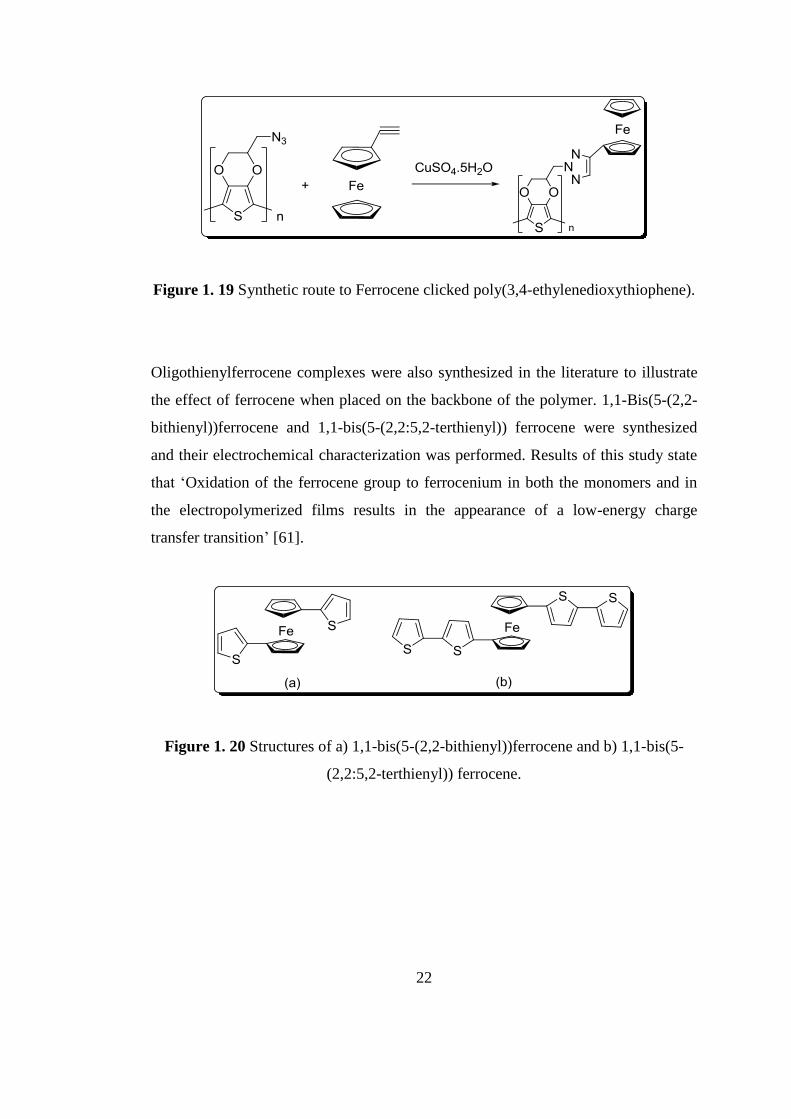
In the literature, “ferrocene functionalized poly (3, 4-ethylenedioxythiophene)
(PEDOT) conductive polymer was prepared via copper-catalyzed azide–alkyne
cycloaddition reaction and its electrochemical experiments revealed that the
ferrocene clicked PEDOT films have fast electron transfer ability. The
spectroelectrochemical studies show that the conducting polymer can switch from
opaque purple to red then blue with a contract of 20% in oxidized state and switching
time around 600 ms” [60].
22
Figure 1. 19 Synthetic route to Ferrocene clicked poly(3,4-ethylenedioxythiophene).
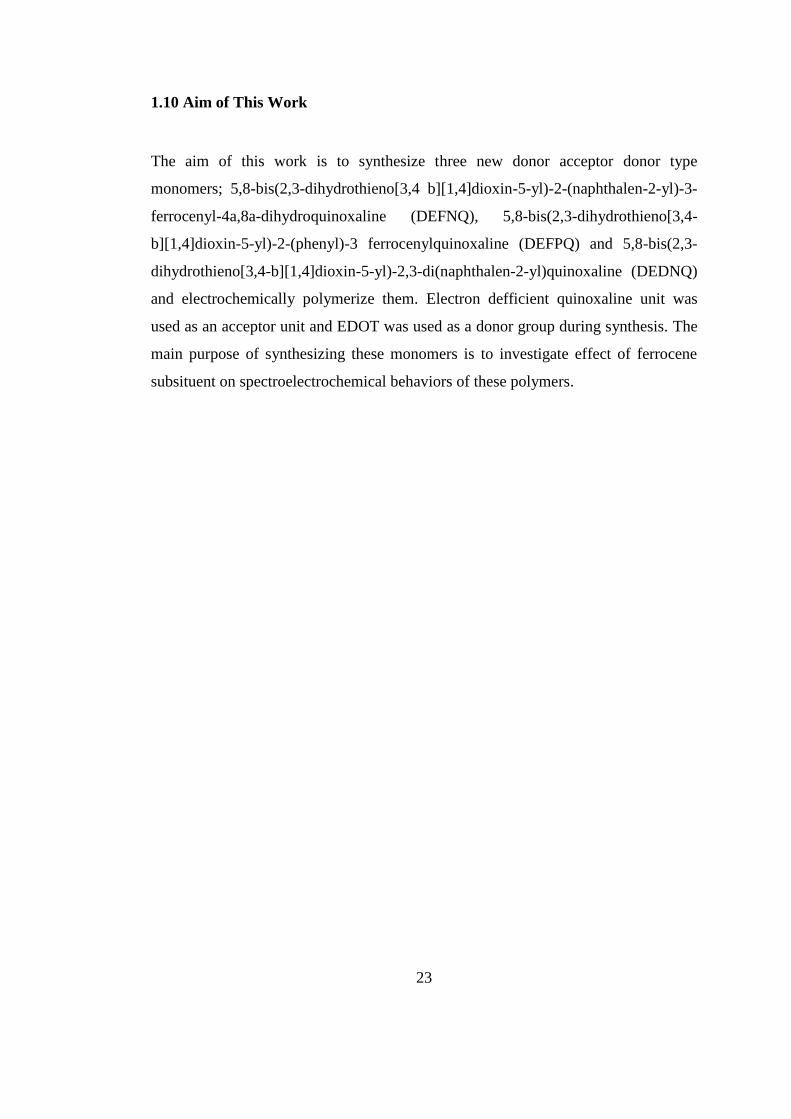
Oligothienylferrocene complexes were also synthesized in the literature to illustrate
the effect of ferrocene when placed on the backbone of the polymer. 1,1-Bis(5-(2,2-
bithienyl))ferrocene and 1,1-bis(5-(2,2:5,2-terthienyl)) ferrocene were synthesized
and their electrochemical characterization was performed. Results of this study state
that „Oxidation of the ferrocene group to ferrocenium in both the monomers and in
the electropolymerized films results in the appearance of a low-energy charge
transfer transition‟ [61].
Figure 1. 20 Structures of a) 1,1-bis(5-(2,2-bithienyl))ferrocene and b) 1,1-bis(5-
(2,2:5,2-terthienyl)) ferrocene.
23
1.10 Aim of This Work
The aim of this work is to synthesize three new donor acceptor donor type
monomers; 5,8-bis(2,3-dihydrothieno[3,4 b][1,4]dioxin-5-yl)-2-(naphthalen-2-yl)-3-
ferrocenyl-4a,8a-dihydroquinoxaline (DEFNQ), 5,8-bis(2,3-dihydrothieno[3,4-
b][1,4]dioxin-5-yl)-2-(phenyl)-3 ferrocenylquinoxaline (DEFPQ) and 5,8-bis(2,3-
dihydrothieno[3,4-b][1,4]dioxin-5-yl)-2,3-di(naphthalen-2-yl)quinoxaline (DEDNQ)
and electrochemically polymerize them. Electron defficient quinoxaline unit was
used as an acceptor unit and EDOT was used as a donor group during synthesis. The
main purpose of synthesizing these monomers is to investigate effect of ferrocene
subsituent on spectroelectrochemical behaviors of these polymers.
24
CHAPTER 2
EXPERIMENTAL
2.1 Materials and Methods
All chemicals and reagents were obtained from commercial sources and used without
further purification. Ferrocene Carboxaldehyde (Aldrich), β-Naphtaldehyde
(Aldrich), manganese dioxide (MnO2), 3,4-ethylenedioxythiophene (EDOT)
(Aldrich), benzothiadiazole (Aldrich), sodium borohydride (NaBH4) (Aldrich),
potassium cyanide (KCN) (Aldrich), bromine (Br2) (Aldrich), dichloromethane
(DCM) (Merck), chloroform (CHCl3) (Merck), p-Toluenesulfonic acid (PTSA)
(Aldrich) were used as received. Benzaldehyde (Aldrich) was distilled before use.
Tetrahydrofuran (THF) (Across) was dried with sodium and benzophenone before
use.
2.2 Equipment
VoltaLab PST050 and Solartron 1285 potentiostats were used for cyclic voltammetry
studies in order to supply a constant potential. One-compartment cell was used for
electrolyses and all of the measurements were performed in an open air medium. The
working electrode was ITO, counter electrode was platinum (Pt) and the reference
electrode was silver (Ag) wire. For the spectroelectrochemistry studies a Varian Cary
5000 UV-Vis spectrophotometer was used. Bruker-Instrument-NMR Spectrometer
(DPX-400) was used to record 1H-NMR and
13C-NMR spectra of the monomers,
25
CDCl3 was chosen as the solvent and chemical shifts (δ) were given in ppm relative
to tetramethylsilane as the internal standard.
2.3 Procedure, Synthesis
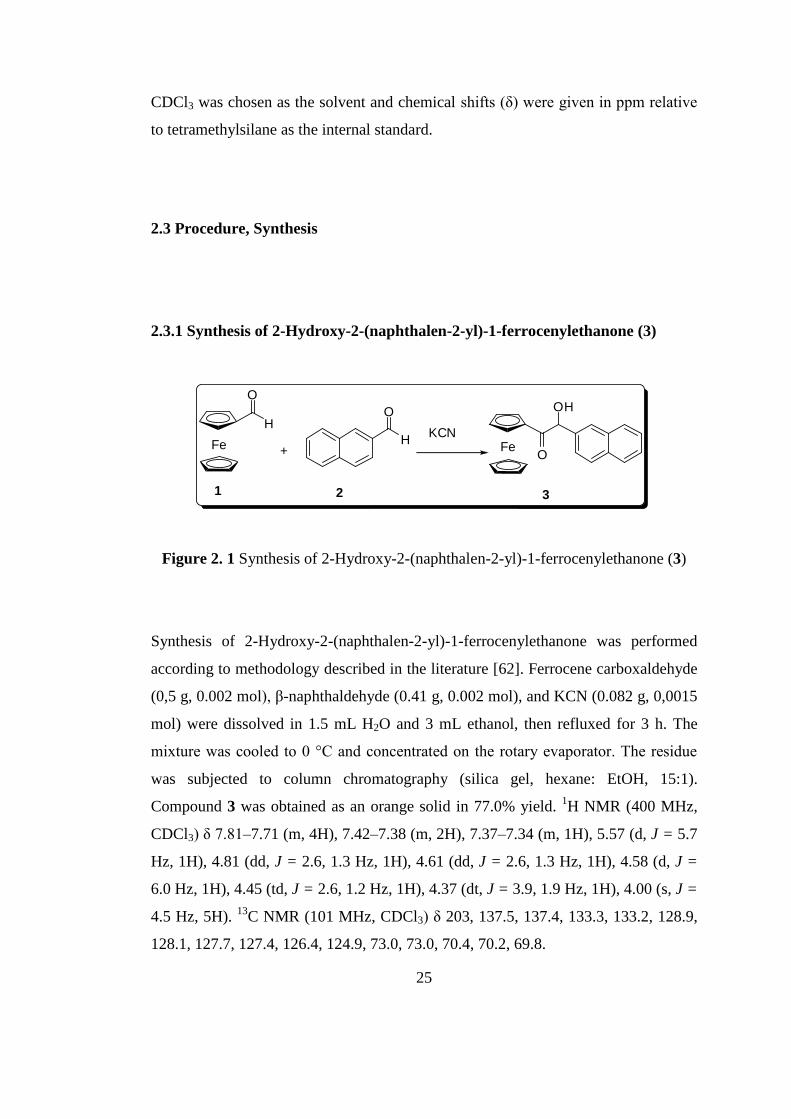
2.3.1 Synthesis of 2-Hydroxy-2-(naphthalen-2-yl)-1-ferrocenylethanone (3)
Fe
H
O
+H
O
KCNFe
O
OH
1 2 3
Figure 2. 1 Synthesis of 2-Hydroxy-2-(naphthalen-2-yl)-1-ferrocenylethanone (3)
Synthesis of 2-Hydroxy-2-(naphthalen-2-yl)-1-ferrocenylethanone was performed
according to methodology described in the literature [62]. Ferrocene carboxaldehyde
(0,5 g, 0.002 mol), β-naphthaldehyde (0.41 g, 0.002 mol), and KCN (0.082 g, 0,0015
mol) were dissolved in 1.5 mL H2O and 3 mL ethanol, then refluxed for 3 h. The
mixture was cooled to 0 °C and concentrated on the rotary evaporator. The residue
was subjected to column chromatography (silica gel, hexane: EtOH, 15:1).
Compound 3 was obtained as an orange solid in 77.0% yield. 1H NMR (400 MHz,
CDCl3) δ 7.81–7.71 (m, 4H), 7.42–7.38 (m, 2H), 7.37–7.34 (m, 1H), 5.57 (d, J = 5.7
Hz, 1H), 4.81 (dd, J = 2.6, 1.3 Hz, 1H), 4.61 (dd, J = 2.6, 1.3 Hz, 1H), 4.58 (d, J =
6.0 Hz, 1H), 4.45 (td, J = 2.6, 1.2 Hz, 1H), 4.37 (dt, J = 3.9, 1.9 Hz, 1H), 4.00 (s, J =
4.5 Hz, 5H). 13
C NMR (101 MHz, CDCl3) δ 203, 137.5, 137.4, 133.3, 133.2, 128.9,
128.1, 127.7, 127.4, 126.4, 124.9, 73.0, 73.0, 70.4, 70.2, 69.8.
26
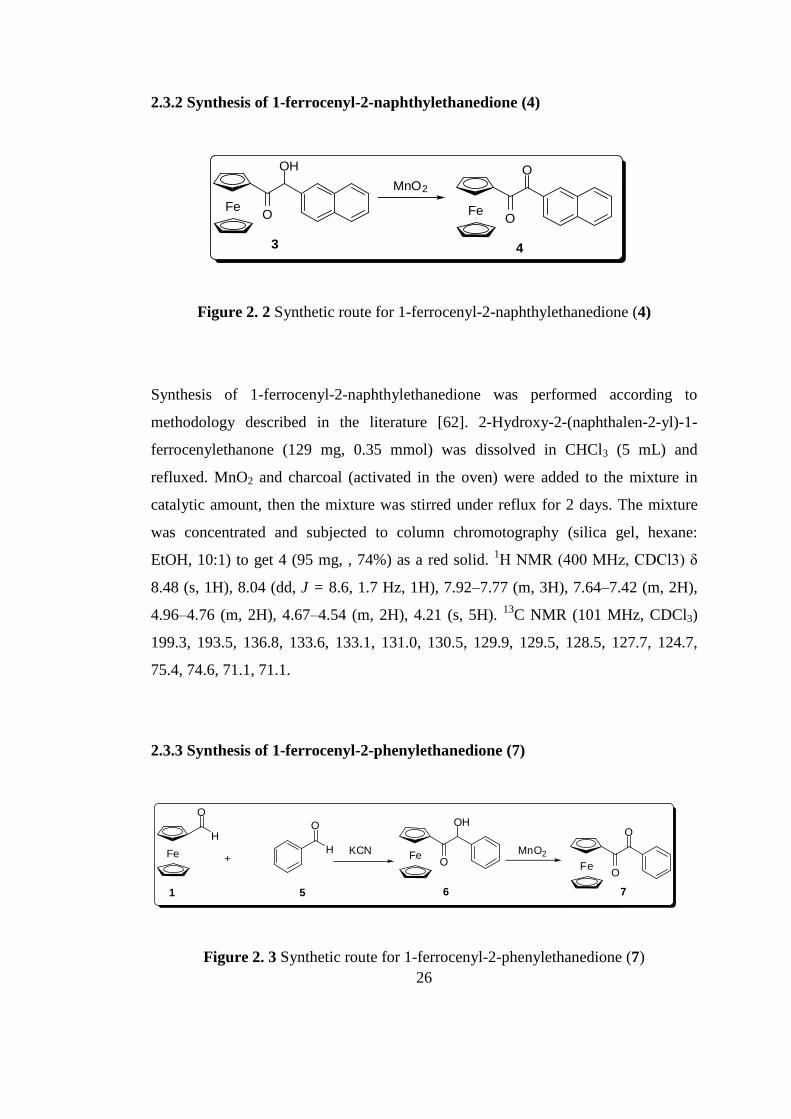
2.3.2 Synthesis of 1-ferrocenyl-2-naphthylethanedione (4)
FeO
OH
MnO2
FeO
O
3 4
Figure 2. 2 Synthetic route for 1-ferrocenyl-2-naphthylethanedione (4)
Synthesis of 1-ferrocenyl-2-naphthylethanedione was performed according to
methodology described in the literature [62]. 2-Hydroxy-2-(naphthalen-2-yl)-1-
ferrocenylethanone (129 mg, 0.35 mmol) was dissolved in CHCl3 (5 mL) and
refluxed. MnO2 and charcoal (activated in the oven) were added to the mixture in
catalytic amount, then the mixture was stirred under reflux for 2 days. The mixture
was concentrated and subjected to column chromotography (silica gel, hexane:
EtOH, 10:1) to get 4 (95 mg, , 74%) as a red solid. 1H NMR (400 MHz, CDCl3) δ
8.48 (s, 1H), 8.04 (dd, J = 8.6, 1.7 Hz, 1H), 7.92–7.77 (m, 3H), 7.64–7.42 (m, 2H),
4.96–4.76 (m, 2H), 4.67–4.54 (m, 2H), 4.21 (s, 5H). 13
C NMR (101 MHz, CDCl3)
199.3, 193.5, 136.8, 133.6, 133.1, 131.0, 130.5, 129.9, 129.5, 128.5, 127.7, 124.7,
75.4, 74.6, 71.1, 71.1.
2.3.3 Synthesis of 1-ferrocenyl-2-phenylethanedione (7)
Fe
H
O
+H
O
KCN FeO
OH
1 5 6
MnO2
FeO
O
7
Figure 2. 3 Synthetic route for 1-ferrocenyl-2-phenylethanedione (7)
27
Synthesis of 1-ferrocenyl-2-phenylethanedione was performed according to
methodology described in the literature [62] and the procedure is given in the
previous part. Compound 6 was synthesized by benzoin condensation with 60%
yield. Oxidation of 6 with MnO2 gave desired compound (1-ferrocenyl-2-
phenylethanedione) as a puple solid with 72% yield. 1H NMR (400 MHz, CDCl3) δ
8.02–7.93 (m, 2H), 7.54 (t, J = 7.4 Hz, 1H), 7.43 (t, J = 7.6 Hz, 2H), 4.82–4.72 (m,
2H), 4.60–4.50 (m, 2H), 4.18 (s, 5H). 13
C NMR (101 MHz, CDCl3) δ 199.2, 191.5,
134.0, 133.5, 129.9, 128.6, 77.1, 76.8, 76.5, 73.4, 70.4.
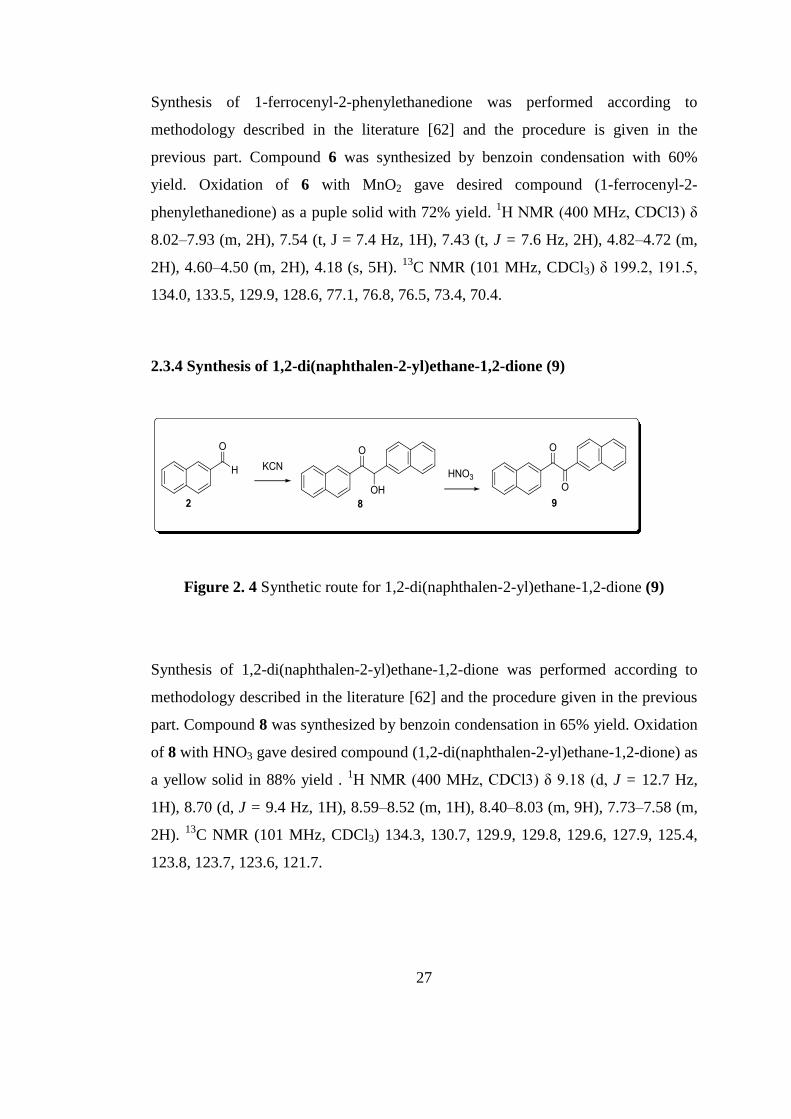
2.3.4 Synthesis of 1,2-di(naphthalen-2-yl)ethane-1,2-dione (9)
Figure 2. 4 Synthetic route for 1,2-di(naphthalen-2-yl)ethane-1,2-dione (9)
Synthesis of 1,2-di(naphthalen-2-yl)ethane-1,2-dione was performed according to
methodology described in the literature [62] and the procedure given in the previous
part. Compound 8 was synthesized by benzoin condensation in 65% yield. Oxidation
of 8 with HNO3 gave desired compound (1,2-di(naphthalen-2-yl)ethane-1,2-dione) as
a yellow solid in 88% yield . 1H NMR (400 MHz, CDCl3) δ 9.18 (d, J = 12.7 Hz,
1H), 8.70 (d, J = 9.4 Hz, 1H), 8.59–8.52 (m, 1H), 8.40–8.03 (m, 9H), 7.73–7.58 (m,
2H). 13
C NMR (101 MHz, CDCl3) 134.3, 130.7, 129.9, 129.8, 129.6, 127.9, 125.4,
123.8, 123.7, 123.6, 121.7.
28
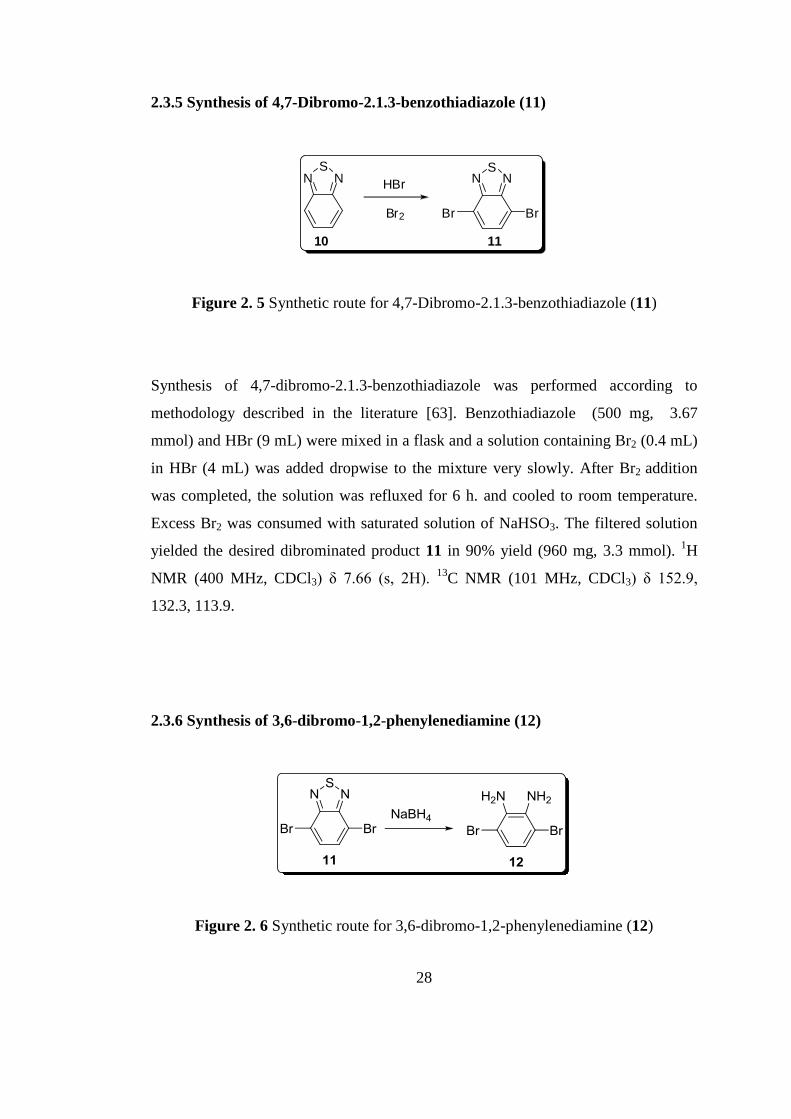
2.3.5 Synthesis of 4,7-Dibromo-2.1.3-benzothiadiazole (11)
NS
N NS
N
BrBr
HBr
Br2
10 11
Figure 2. 5 Synthetic route for 4,7-Dibromo-2.1.3-benzothiadiazole (11)
Synthesis of 4,7-dibromo-2.1.3-benzothiadiazole was performed according to
methodology described in the literature [63]. Benzothiadiazole (500 mg, 3.67
mmol) and HBr (9 mL) were mixed in a flask and a solution containing Br2 (0.4 mL)
in HBr (4 mL) was added dropwise to the mixture very slowly. After Br2 addition
was completed, the solution was refluxed for 6 h. and cooled to room temperature.
Excess Br2 was consumed with saturated solution of NaHSO3. The filtered solution
yielded the desired dibrominated product 11 in 90% yield (960 mg, 3.3 mmol). 1H
NMR (400 MHz, CDCl3) δ 7.66 (s, 2H). 13
C NMR (101 MHz, CDCl3) δ 152.9,
132.3, 113.9.
2.3.6 Synthesis of 3,6-dibromo-1,2-phenylenediamine (12)
Figure 2. 6 Synthetic route for 3,6-dibromo-1,2-phenylenediamine (12)
29
Synthesis of 3,6-dibromo-1,2-phenylenediamine was performed according to
methodology described in the literature [64]. 4, 7-Dibromo-2.1.3-benzothiadiazole
(300 mg, 1.03 mmol) was dissolved in EtOH (25 mL). To this mixture, sodium
borohydride (1.5 g, 0.04 mol) was added in small portions at 0 oC, and the mixture
was stirred for 24 h at room temperature. The solvent was evaporated completely,
and the extraction was performed firstly with ether and water, secondly with ether
and brine. Removing all of the solvent yielded 3,6-dibromo-1,2-phenylenediamine
(12) (234 mg, 0.88 mmol) as a pale yellow solid in 86% yield. 1H NMR (400 MHz,
CDCl3) δ 6.78 (s, 2H), 3.82 (s, 4H). 13
C NMR (101 MHz, CDCl3) δ 133.5, 123.2,
109.5.
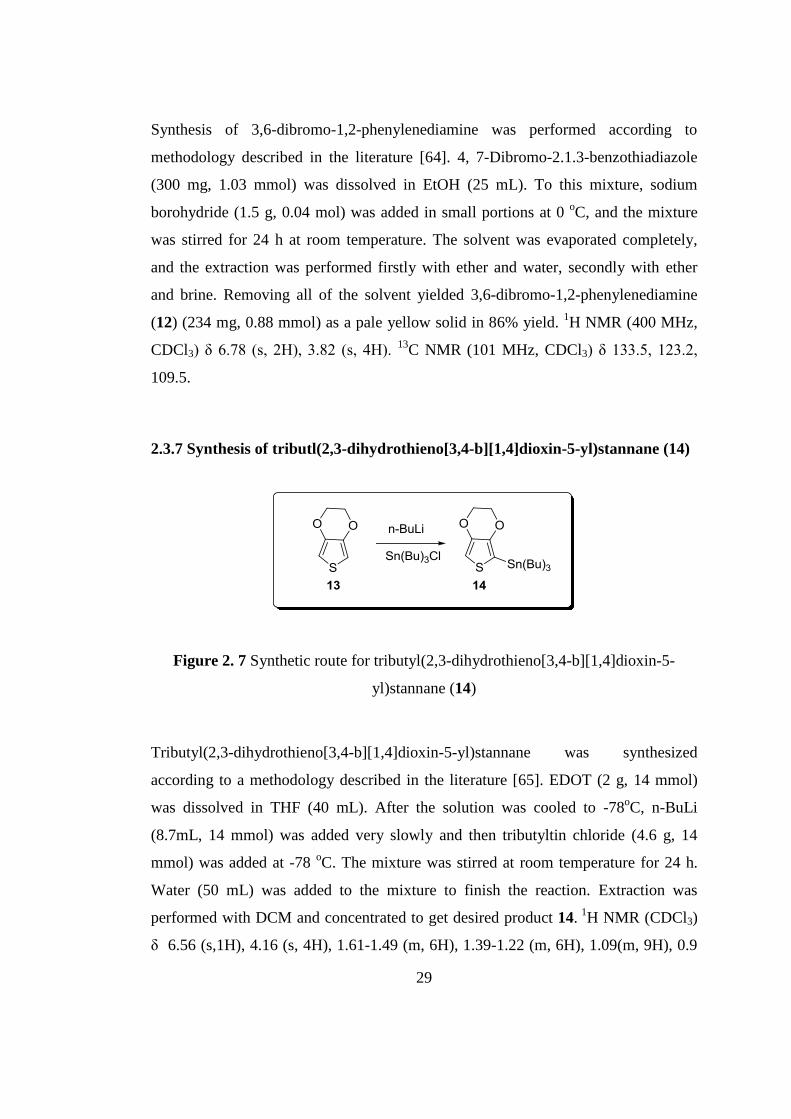
2.3.7 Synthesis of tributl(2,3-dihydrothieno[3,4-b][1,4]dioxin-5-yl)stannane (14)
Figure 2. 7 Synthetic route for tributyl(2,3-dihydrothieno[3,4-b][1,4]dioxin-5-
yl)stannane (14)
Tributyl(2,3-dihydrothieno[3,4-b][1,4]dioxin-5-yl)stannane was synthesized
according to a methodology described in the literature [65]. EDOT (2 g, 14 mmol)
was dissolved in THF (40 mL). After the solution was cooled to -78oC, n-BuLi
(8.7mL, 14 mmol) was added very slowly and then tributyltin chloride (4.6 g, 14
mmol) was added at -78 oC. The mixture was stirred at room temperature for 24 h.
Water (50 mL) was added to the mixture to finish the reaction. Extraction was
performed with DCM and concentrated to get desired product 14. 1
H NMR (CDCl3)
δ 6.56 (s,1H), 4.16 (s, 4H), 1.61-1.49 (m, 6H), 1.39-1.22 (m, 6H), 1.09(m, 9H), 0.9
30
(m, 6H). 13
C NMR (CDCl3) δ 147.88, 142.65, 109.8, 105.99, 64.86, 64.80, 29.08,
27.40, 13.76, 10.72.
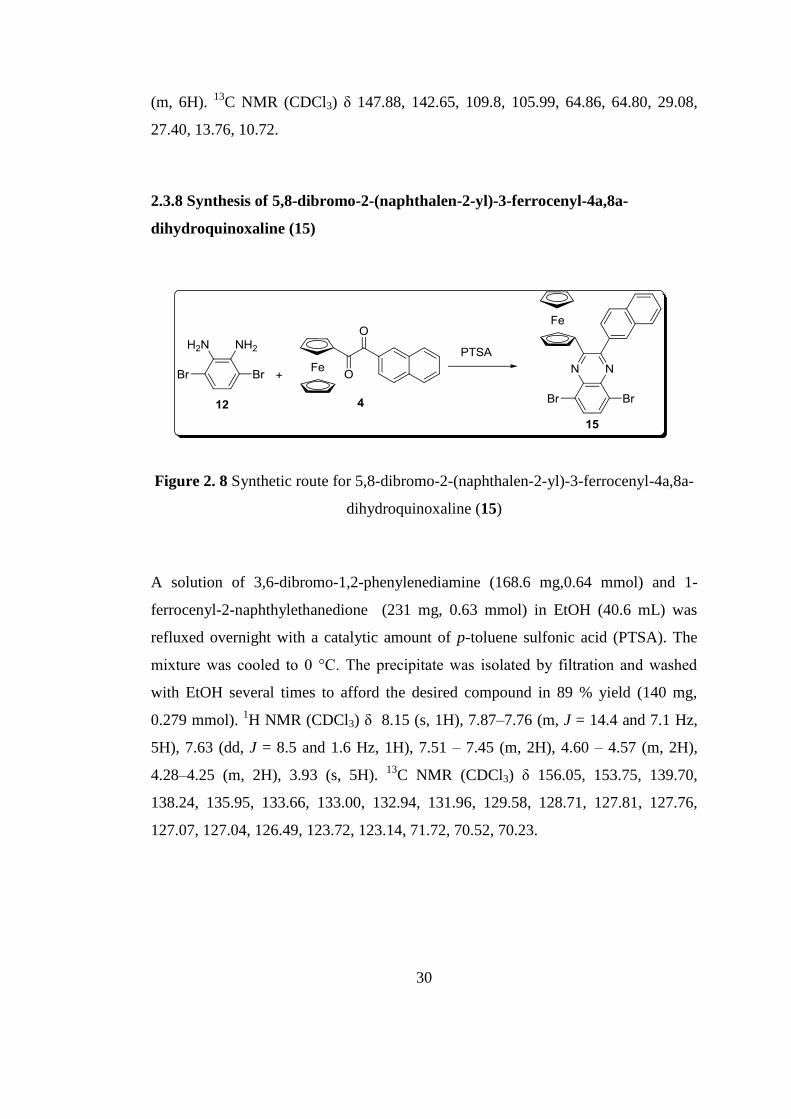
2.3.8 Synthesis of 5,8-dibromo-2-(naphthalen-2-yl)-3-ferrocenyl-4a,8a-
dihydroquinoxaline (15)
Figure 2. 8 Synthetic route for 5,8-dibromo-2-(naphthalen-2-yl)-3-ferrocenyl-4a,8a-
dihydroquinoxaline (15)
A solution of 3,6-dibromo-1,2-phenylenediamine (168.6 mg,0.64 mmol) and 1-
ferrocenyl-2-naphthylethanedione (231 mg, 0.63 mmol) in EtOH (40.6 mL) was
refluxed overnight with a catalytic amount of p-toluene sulfonic acid (PTSA). The
mixture was cooled to 0 °C. The precipitate was isolated by filtration and washed
with EtOH several times to afford the desired compound in 89 % yield (140 mg,
0.279 mmol). 1H NMR (CDCl3) δ 8.15 (s, 1H), 7.87–7.76 (m, J = 14.4 and 7.1 Hz,
5H), 7.63 (dd, J = 8.5 and 1.6 Hz, 1H), 7.51 – 7.45 (m, 2H), 4.60 – 4.57 (m, 2H),
4.28–4.25 (m, 2H), 3.93 (s, 5H). 13
C NMR (CDCl3) δ 156.05, 153.75, 139.70,
138.24, 135.95, 133.66, 133.00, 132.94, 131.96, 129.58, 128.71, 127.81, 127.76,
127.07, 127.04, 126.49, 123.72, 123.14, 71.72, 70.52, 70.23.
31
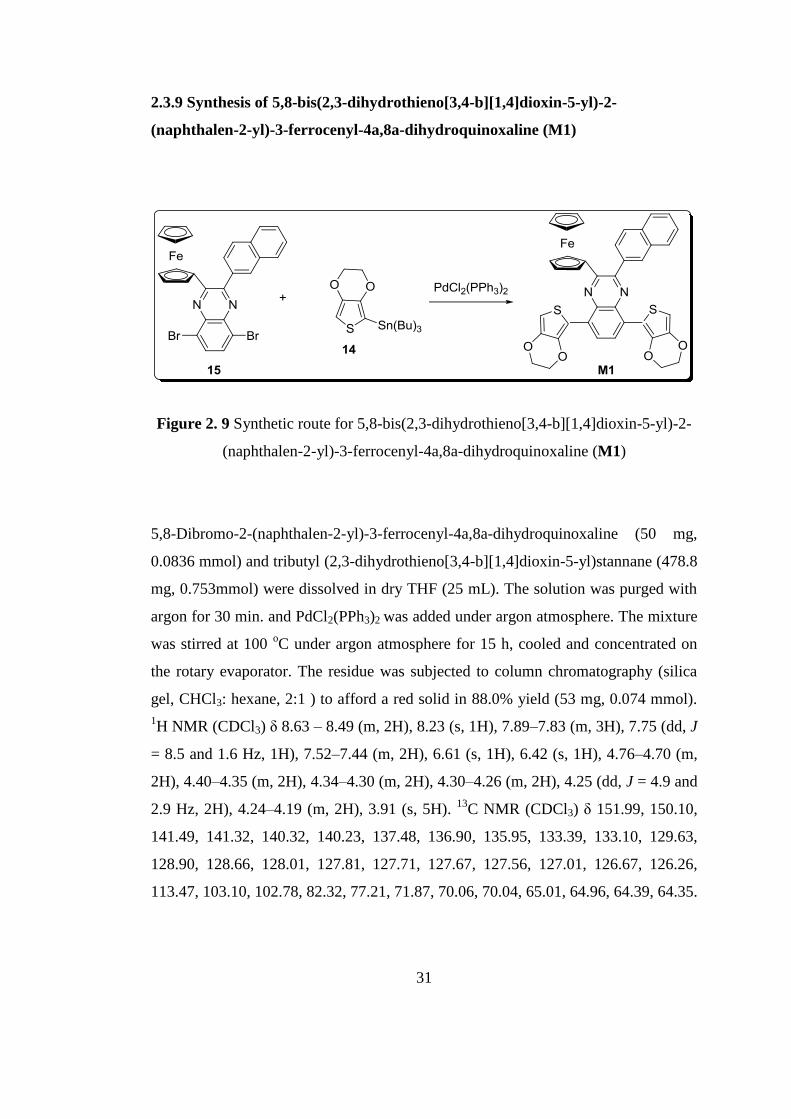
2.3.9 Synthesis of 5,8-bis(2,3-dihydrothieno[3,4-b][1,4]dioxin-5-yl)-2-
(naphthalen-2-yl)-3-ferrocenyl-4a,8a-dihydroquinoxaline (M1)
Figure 2. 9 Synthetic route for 5,8-bis(2,3-dihydrothieno[3,4-b][1,4]dioxin-5-yl)-2-
(naphthalen-2-yl)-3-ferrocenyl-4a,8a-dihydroquinoxaline (M1)
5,8-Dibromo-2-(naphthalen-2-yl)-3-ferrocenyl-4a,8a-dihydroquinoxaline (50 mg,
0.0836 mmol) and tributyl (2,3-dihydrothieno[3,4-b][1,4]dioxin-5-yl)stannane (478.8
mg, 0.753mmol) were dissolved in dry THF (25 mL). The solution was purged with
argon for 30 min. and PdCl2(PPh3)2 was added under argon atmosphere. The mixture
was stirred at 100 oC under argon atmosphere for 15 h, cooled and concentrated on
the rotary evaporator. The residue was subjected to column chromatography (silica
gel, CHCl3: hexane, 2:1 ) to afford a red solid in 88.0% yield (53 mg, 0.074 mmol).
1H NMR (CDCl3) δ 8.63 – 8.49 (m, 2H), 8.23 (s, 1H), 7.89–7.83 (m, 3H), 7.75 (dd, J
= 8.5 and 1.6 Hz, 1H), 7.52–7.44 (m, 2H), 6.61 (s, 1H), 6.42 (s, 1H), 4.76–4.70 (m,
2H), 4.40–4.35 (m, 2H), 4.34–4.30 (m, 2H), 4.30–4.26 (m, 2H), 4.25 (dd, J = 4.9 and
2.9 Hz, 2H), 4.24–4.19 (m, 2H), 3.91 (s, 5H). 13
C NMR (CDCl3) δ 151.99, 150.10,
141.49, 141.32, 140.32, 140.23, 137.48, 136.90, 135.95, 133.39, 133.10, 129.63,
128.90, 128.66, 128.01, 127.81, 127.71, 127.67, 127.56, 127.01, 126.67, 126.26,
113.47, 103.10, 102.78, 82.32, 77.21, 71.87, 70.06, 70.04, 65.01, 64.96, 64.39, 64.35.
32
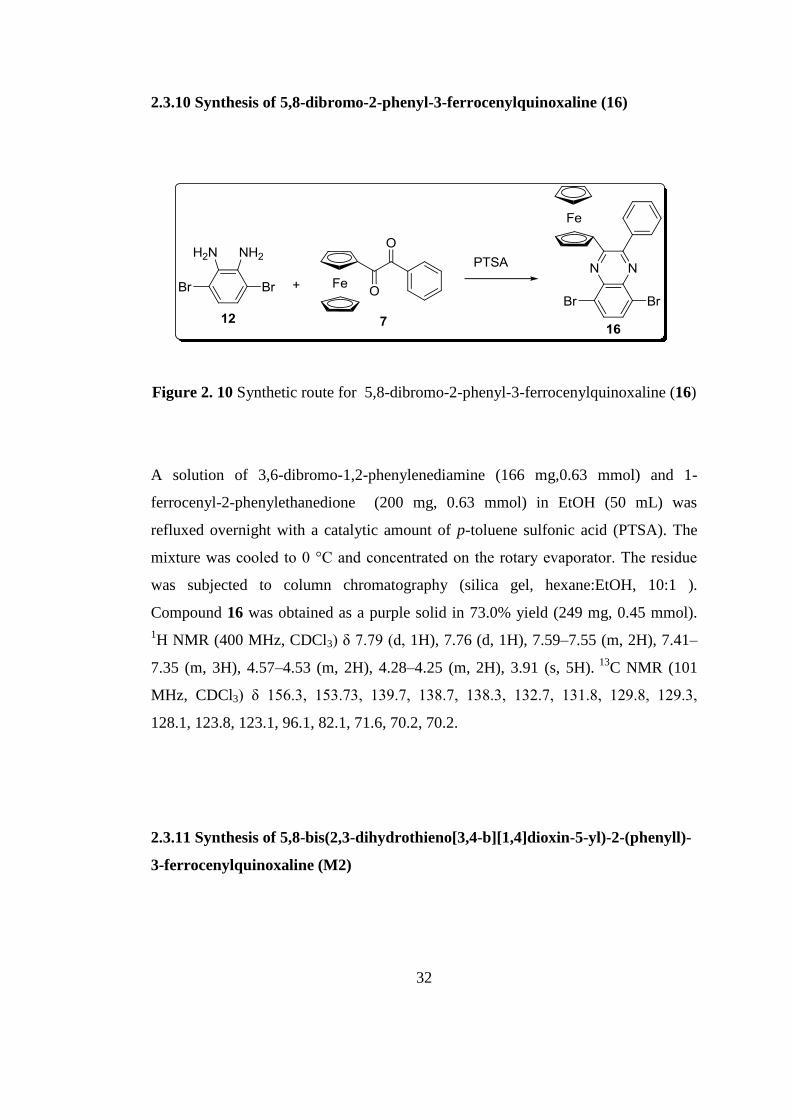
2.3.10 Synthesis of 5,8-dibromo-2-phenyl-3-ferrocenylquinoxaline (16)
Figure 2. 10 Synthetic route for 5,8-dibromo-2-phenyl-3-ferrocenylquinoxaline (16)
A solution of 3,6-dibromo-1,2-phenylenediamine (166 mg,0.63 mmol) and 1-
ferrocenyl-2-phenylethanedione (200 mg, 0.63 mmol) in EtOH (50 mL) was
refluxed overnight with a catalytic amount of p-toluene sulfonic acid (PTSA). The
mixture was cooled to 0 °C and concentrated on the rotary evaporator. The residue
was subjected to column chromatography (silica gel, hexane:EtOH, 10:1 ).
Compound 16 was obtained as a purple solid in 73.0% yield (249 mg, 0.45 mmol).
1H NMR (400 MHz, CDCl3) δ 7.79 (d, 1H), 7.76 (d, 1H), 7.59–7.55 (m, 2H), 7.41–
7.35 (m, 3H), 4.57–4.53 (m, 2H), 4.28–4.25 (m, 2H), 3.91 (s, 5H). 13
C NMR (101
MHz, CDCl3) δ 156.3, 153.73, 139.7, 138.7, 138.3, 132.7, 131.8, 129.8, 129.3,
128.1, 123.8, 123.1, 96.1, 82.1, 71.6, 70.2, 70.2.
2.3.11 Synthesis of 5,8-bis(2,3-dihydrothieno[3,4-b][1,4]dioxin-5-yl)-2-(phenyll)-
3-ferrocenylquinoxaline (M2)
33
Figure 2. 11 Synthetic route for 5,8-bis(2,3-dihydrothieno[3,4-b][1,4]dioxin-5-yl)-2-
(phenyll)-3-ferrocenylquinoxaline (M2)
5,8-Dibromo-2-phenyl-3-ferrocenylquinoxaline (240 mg, 0.438 mmol) and tributyl
(2,3-dihydrothieno[3,4-b][1,4]dioxin-5-yl)stannane (1.393 g, 2.19 mmol) were
dissolved in dry THF (100 mL). The solution was purged with argon for 30 min. and
PdCl2(PPh3)2 was added under argon atmosphere. The mixture was stirred at 100 oC
under argon atmosphere for 18 h, cooled and concentrated on the rotary evaporator.
The residue was subjected to column chromatography (silica gel, CHCl3: hexane,
2:1) to afford a red solid in 68.0% yield (198 mg, 0.295 mmol). 1
H NMR (400 MHz,
CDCl3) δ 8.63 (d, 1H), 8.55 (d, 1H), 7.78–7.70 (m, 2H), 7.46 (dd, J = 8.0, 3.0 Hz,
3H), 6.65 (s, 1H), 6.49 (s, 1H), 4.79–4.76 (m, 2H), 4.41 (dd, J = 5.2, 2.4 Hz, 2H),
4.37 (dd, J = 5.2, 2.4 Hz, 2H), 4.34–4.32 (m, 2H), 4.31 (dd, J = 3.7 Hz, 2H), 4.27
(dd, J = 4.1 Hz, 2H), 3.95 (s, 5H). 13
C NMR (101 MHz, CDCl3) δ 151,9, 150,1,
141.4, 141.3, 140.3, 140.2, 137.5, 136.9, 135.9, 133.3, 133.1, 129.6, 128.9, 128.6,
128.0, 127.8, 127.7, 127.6, 127.5, 127.0, 126.6, 126.2, 113.4, 103.1, 102.7, 82.3,
71.8, 70.0, 64.9, 64.3.
34
2.3.12 Synthesis of 5,8-dibromo-2,3-di(naphthalen-2-yl)quinoxaline
Figure 2. 12 Synthetic route for 5,8-dibromo-2,3-di(naphthalen-2-yl)quinoxaline
A solution of 3,6-dibromo-1,2-phenylenediamine (86 mg,0.33 mmol) and 1,2-
di(naphthalen-2-yl)ethane-1,2-dione (100 mg, 0.322mmol) in EtOH (25 mL) was
refluxed overnight with a catalytic amount of p-toluene sulfonic acid (PTSA). The
mixture was cooled to 0 °C. The precipitate was isolated by filtration and washed
with EtOH several times then the residue was subjected to column chromatography
(silica gel, CHCl3: hexane, 1:1) to get the product as a yellow solid in 67 % yield
(116 mg, 0.214 mmol). 1H NMR (400 MHz, CDCl3) δ 8.96–8.81 (m, 1H), 8.55–7.99
(m, 7H), 7.95 (d, 2H), 7.92–7.65 (m, 4H), 7.56–7.46 (m, 2H). 13C NMR (101 MHz,
CDCl3) δ 152.8, 147.0, 135.4, 134.5, 133.9, 130.8, 130.3, 129.1, 128.9, 128.4, 126.2,
125.4, 125.0, 124.8.
35
2.3.13 Synthesis of 5,8-bis(2,3-dihydrothieno[3,4-b][1,4]dioxin-5-yl)-2,3-
di(naphthalen-2-yl)quinoxaline (M3)
Figure 2. 13 Synthetic route for 5,8-bis(2,3-dihydrothieno[3,4-b][1,4]dioxin-5-yl)-
2,3-di(naphthalen-2-yl)quinoxaline (M3)
5,8-Dibromo-2,3-di(naphthalen-2-yl)quinoxaline (400 mg, 0.74 mmol) and tributyl
(2,3-dihydrothieno[3,4-b][1,4]dioxin-5-yl)stannane (2.35 g, 3,7 mmol) were
dissolved in dry THF (130 mL). The solution was purged with argon for 30 min. and
PdCl2(PPh3)2 was added under argon atmosphere. The mixture was stirred at 100 oC
under argon atmosphere for 18 h, cooled and concentrated on the rotary evaporator.
The residue was subjected to column chromatography (silica gel, CHCl3: hexane,
2:1) to afford a red solid in 65.0 % yield (318.5 mg, 0.48 mmol). 1H NMR (400
MHz, CDCl3) δ 9.23–8.44 (m, 6H), 8.38–7.60 (m, 8H), 7.59–7.39 (m, 2H), 6.51 (s,
2H), 4.35 (dd, J=3.55, 4H), 4.25 (dd, J=3.78, 4H). 13
C NMR (101 MHz, CDCl3) δ
148.9, 146.4, 141.4, 140.6, 139.1, 137.4, 135.4, 134.3, 131.1, 129.01, 128.9, 125.9,
125.1, 124.9, 124.3, 123.2, 112.1, 103.4, 65.0, 64.3.
36
CHAPTER 3
RESULTS AND DISCUSSION
3.1 Electrochemical and Electrochromic Properties of Quinoxaline Derivative
Polymers
3.1.1 Electrochemical and Electrochromic Properties of PDEFNQ (P1)
3.1.1.1 Electrochemistry of DEFNQ (M1)
The potentiodynamic electropolymerization for M1 was performed in 0.1 M
tetrabutylammonium hexafluorophosphate (TBAPF6) and solvent system was chosen
as acetonitrile (ACN)/ dichloromethane (DCM) (5:95, v:v) mixture. Indium tin oxide
coated glass slides (ITO) were used as the working electrode whereto polymer films
are produced.
Figure 3.1a illustates single scan voltammograms of Fc, and electron defficient
acceptor unit of the monomer. Figure 3.1b represents the first run of
electropolymerization of DEFNQ (M1). The reversible oxidation/reduction peaks of
Fc (ferrocene) were recorded at 0.78 V and 0.17 V respectively, versus Ag wire
pseudo reference electrode. When Fc attached to the quinoxaline unit, the oxidation
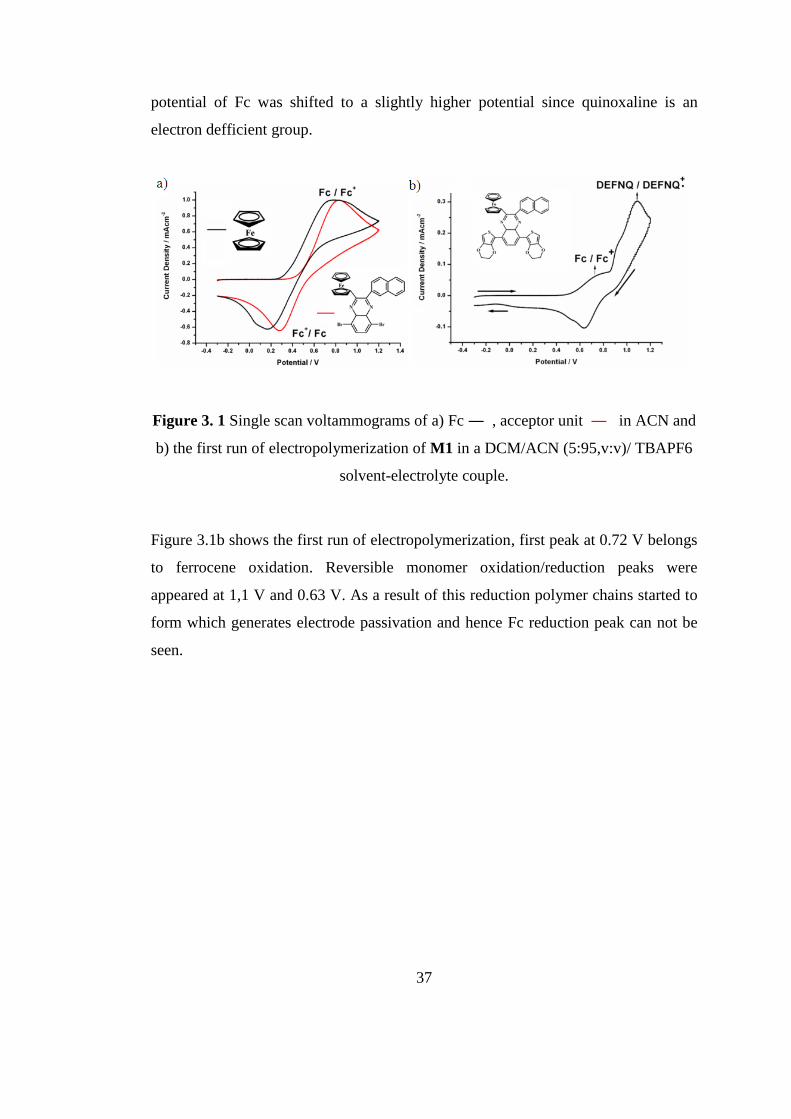
37
potential of Fc was shifted to a slightly higher potential since quinoxaline is an
electron defficient group.
Figure 3. 1 Single scan voltammograms of a) Fc ― , acceptor unit ― in ACN and
b) the first run of electropolymerization of M1 in a DCM/ACN (5:95,v:v)/ TBAPF6
solvent-electrolyte couple.
Figure 3.1b shows the first run of electropolymerization, first peak at 0.72 V belongs
to ferrocene oxidation. Reversible monomer oxidation/reduction peaks were
appeared at 1,1 V and 0.63 V. As a result of this reduction polymer chains started to
form which generates electrode passivation and hence Fc reduction peak can not be
seen.
38
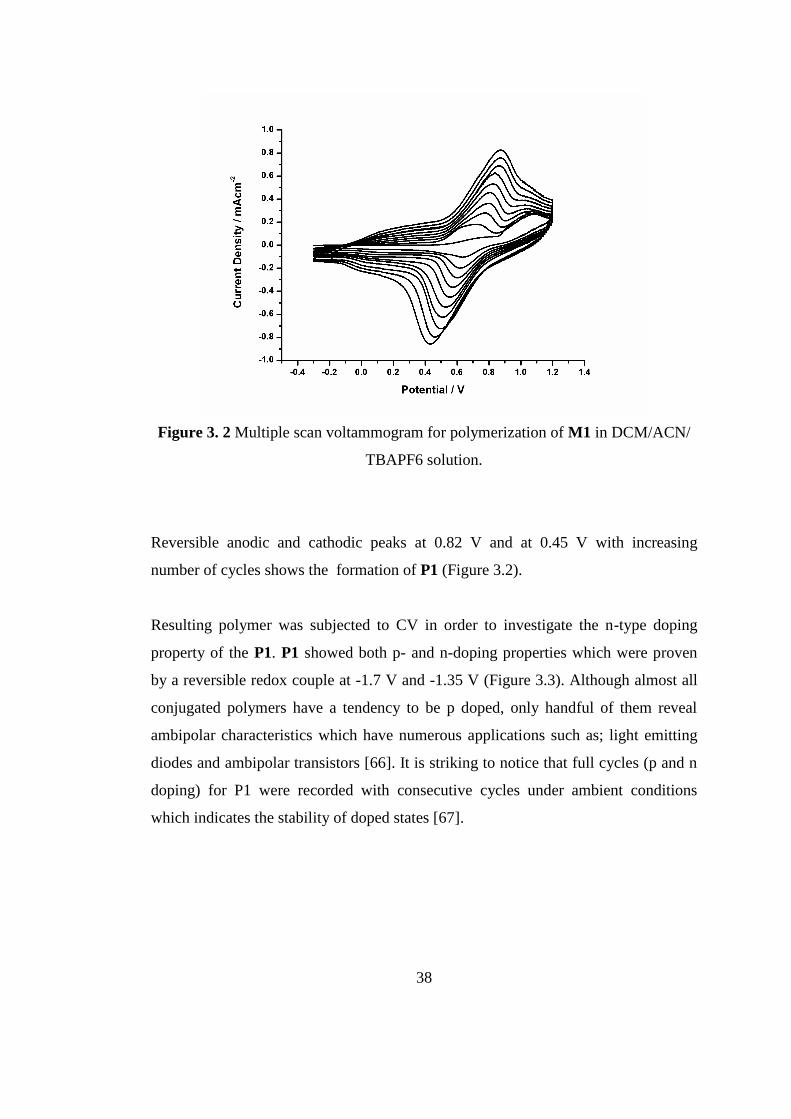
Figure 3. 2 Multiple scan voltammogram for polymerization of M1 in DCM/ACN/
TBAPF6 solution.
Reversible anodic and cathodic peaks at 0.82 V and at 0.45 V with increasing
number of cycles shows the formation of P1 (Figure 3.2).
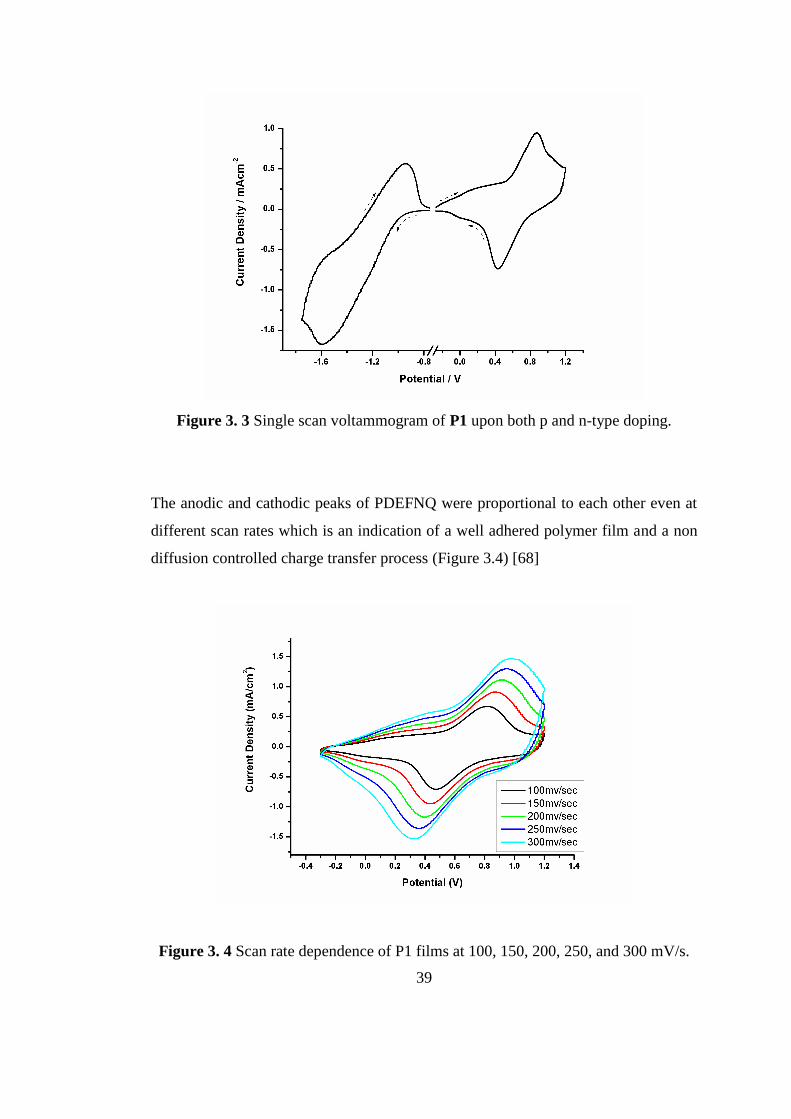
Resulting polymer was subjected to CV in order to investigate the n-type doping
property of the P1. P1 showed both p- and n-doping properties which were proven
by a reversible redox couple at -1.7 V and -1.35 V (Figure 3.3). Although almost all
conjugated polymers have a tendency to be p doped, only handful of them reveal
ambipolar characteristics which have numerous applications such as; light emitting
diodes and ambipolar transistors [66]. It is striking to notice that full cycles (p and n
doping) for P1 were recorded with consecutive cycles under ambient conditions
which indicates the stability of doped states [67].
39
Figure 3. 3 Single scan voltammogram of P1 upon both p and n-type doping.
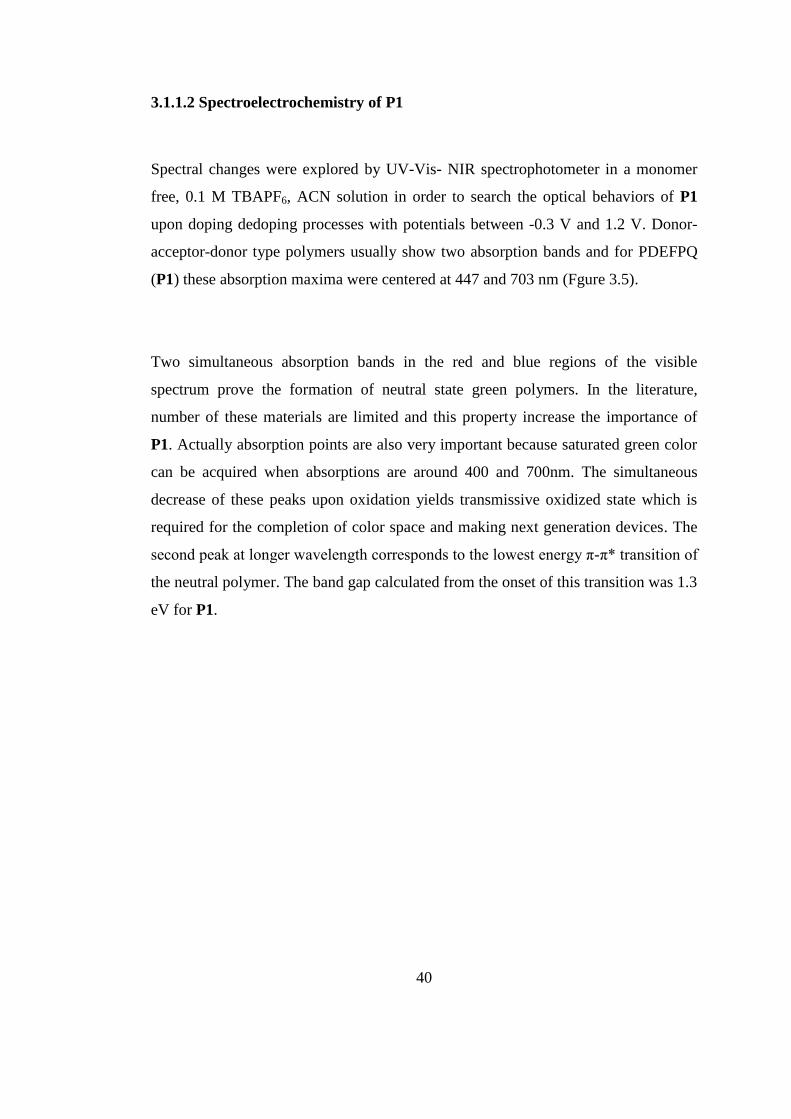
The anodic and cathodic peaks of PDEFNQ were proportional to each other even at
different scan rates which is an indication of a well adhered polymer film and a non
diffusion controlled charge transfer process (Figure 3.4) [68]
Figure 3. 4 Scan rate dependence of P1 films at 100, 150, 200, 250, and 300 mV/s.
40
3.1.1.2 Spectroelectrochemistry of P1
Spectral changes were explored by UV-Vis- NIR spectrophotometer in a monomer
free, 0.1 M TBAPF6, ACN solution in order to search the optical behaviors of P1
upon doping dedoping processes with potentials between -0.3 V and 1.2 V. Donor-
acceptor-donor type polymers usually show two absorption bands and for PDEFPQ
(P1) these absorption maxima were centered at 447 and 703 nm (Fgure 3.5).
Two simultaneous absorption bands in the red and blue regions of the visible
spectrum prove the formation of neutral state green polymers. In the literature,
number of these materials are limited and this property increase the importance of
P1. Actually absorption points are also very important because saturated green color
can be acquired when absorptions are around 400 and 700nm. The simultaneous
decrease of these peaks upon oxidation yields transmissive oxidized state which is
required for the completion of color space and making next generation devices. The
second peak at longer wavelength corresponds to the lowest energy π-π* transition of
the neutral polymer. The band gap calculated from the onset of this transition was 1.3
eV for P1.
41
Figure 3. 5 Electronic absorption spectra for PDEFNQ upon p doping between -0.3
V and 1.2 V with 0.1 V potential intervals in a monomer free solution.
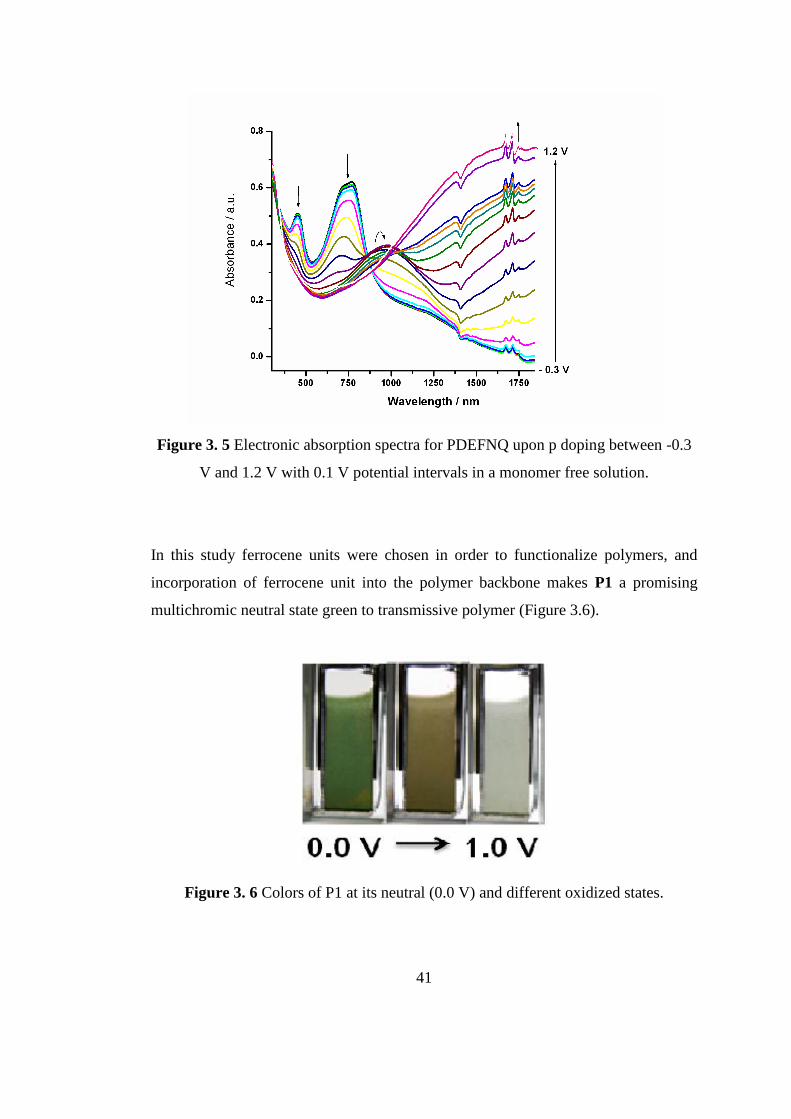
In this study ferrocene units were chosen in order to functionalize polymers, and
incorporation of ferrocene unit into the polymer backbone makes P1 a promising
multichromic neutral state green to transmissive polymer (Figure 3.6).
Figure 3. 6 Colors of P1 at its neutral (0.0 V) and different oxidized states.
42
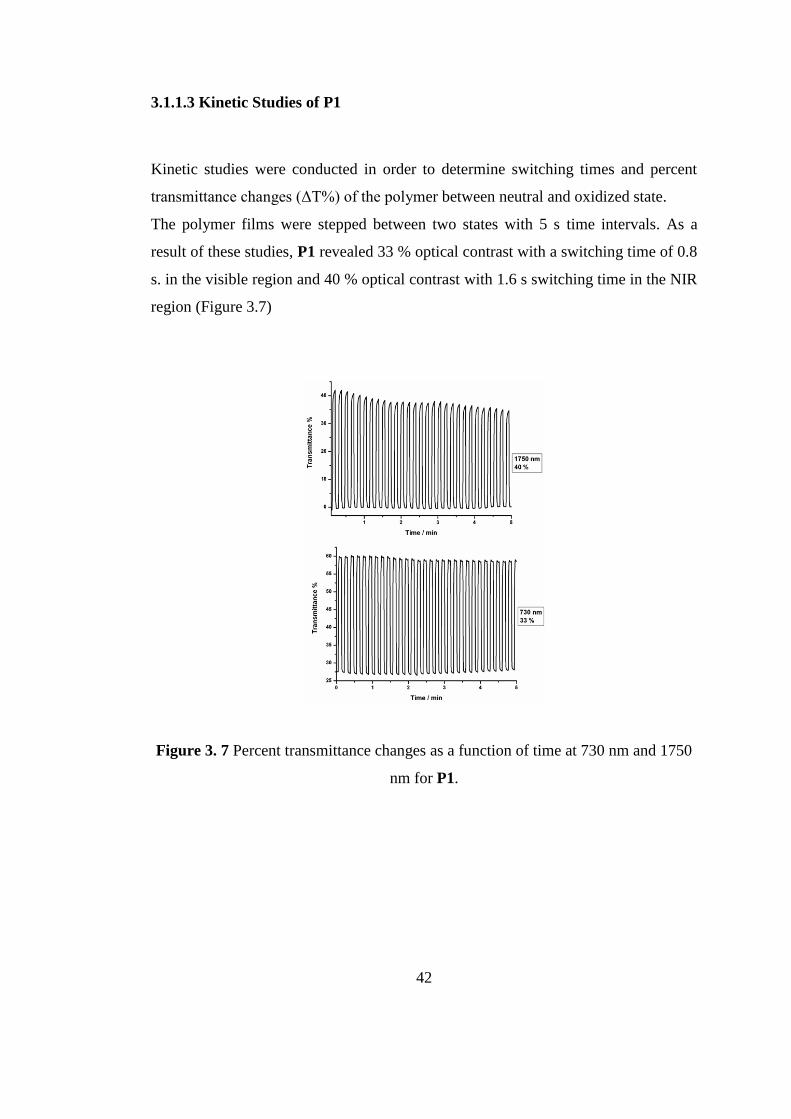
3.1.1.3 Kinetic Studies of P1
Kinetic studies were conducted in order to determine switching times and percent
transmittance changes (ΔT%) of the polymer between neutral and oxidized state.
The polymer films were stepped between two states with 5 s time intervals. As a
result of these studies, P1 revealed 33 % optical contrast with a switching time of 0.8
s. in the visible region and 40 % optical contrast with 1.6 s switching time in the NIR
region (Figure 3.7)
Figure 3. 7 Percent transmittance changes as a function of time at 730 nm and 1750
nm for P1.
43
3.1.2 Electrochemical and Electrochromic Properties of PDEFPQ (P2)
3.1.2.1 Electrochemistry of DEFPQ (M2)
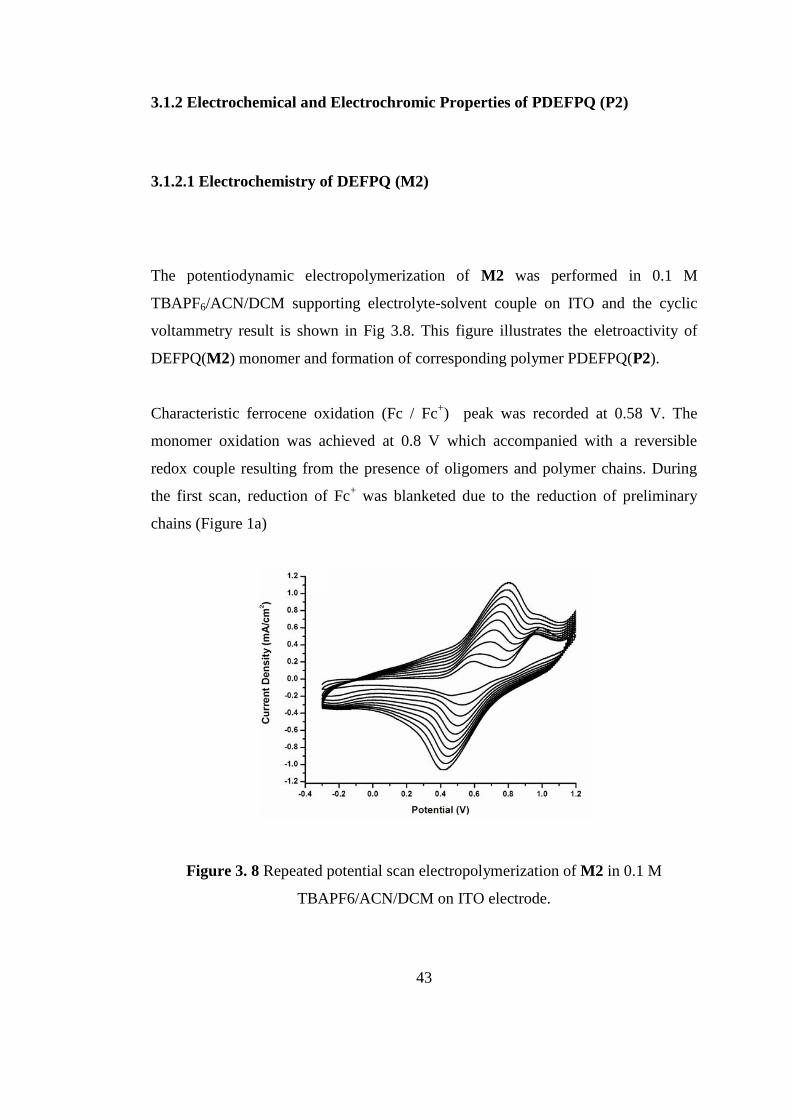
The potentiodynamic electropolymerization of M2 was performed in 0.1 M
TBAPF6/ACN/DCM supporting electrolyte-solvent couple on ITO and the cyclic
voltammetry result is shown in Fig 3.8. This figure illustrates the eletroactivity of
DEFPQ(M2) monomer and formation of corresponding polymer PDEFPQ(P2).
Characteristic ferrocene oxidation (Fc / Fc+) peak was recorded at 0.58 V. The
monomer oxidation was achieved at 0.8 V which accompanied with a reversible
redox couple resulting from the presence of oligomers and polymer chains. During
the first scan, reduction of Fc+ was blanketed due to the reduction of preliminary
chains (Figure 1a)
Figure 3. 8 Repeated potential scan electropolymerization of M2 in 0.1 M
TBAPF6/ACN/DCM on ITO electrode.
44
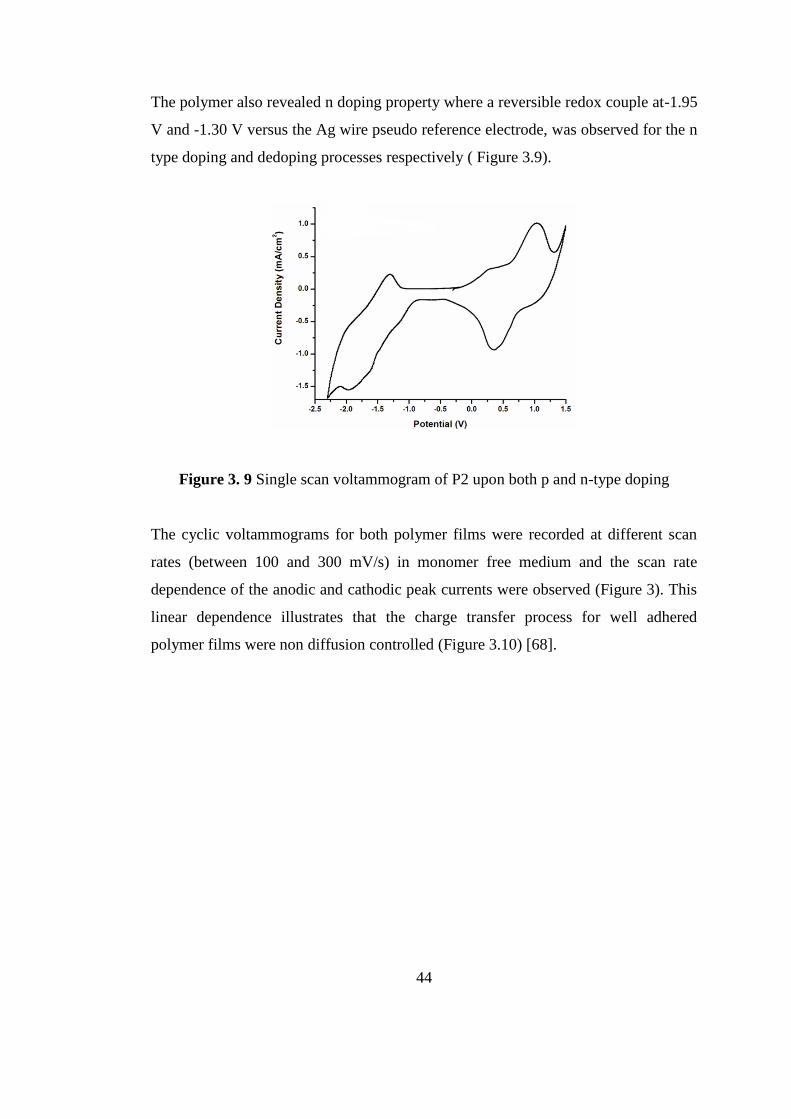
The polymer also revealed n doping property where a reversible redox couple at-1.95
V and -1.30 V versus the Ag wire pseudo reference electrode, was observed for the n
type doping and dedoping processes respectively ( Figure 3.9).
Figure 3. 9 Single scan voltammogram of P2 upon both p and n-type doping
The cyclic voltammograms for both polymer films were recorded at different scan
rates (between 100 and 300 mV/s) in monomer free medium and the scan rate
dependence of the anodic and cathodic peak currents were observed (Figure 3). This
linear dependence illustrates that the charge transfer process for well adhered
polymer films were non diffusion controlled (Figure 3.10) [68].
45
Figure 3. 10 Scan rate dependence of P2 films at 100, 150, 200, 250, and 300 mV/s.
3.1.2.2 Spectroelectrochemistry of P2
Spectroelectrochemistry studies were performed in the monomer free, 0.1 M
TBAPF6, ACN solution to monitor the optical changes upon doping and dedoping
processes. UV–Vis-NIR spectra were obtained as a function of applied potential
between -0.5 V and 1.0 V. The spectral responses of polymer films to stepwise
oxidation were noted as the potential was gradually increased.
As seen in Figure 3.11, P2 has absorption wavelengths in the visible region which
were centered at 447 and 703 nm proving the formation of neutral state green
polymer. Optical band gap (Eg) for P2 was calculated from the onsets of lower
energy transition as 1.43 eV which suggests that P2 can be regarded as a low band
gap polymer.
46
Figure 3. 11 Electronic absorption spectra for PDEFPQ upon p doping between -0.5
V and 1.0 V with 0.1 V potential intervals in a monomer free solution.
Upon stepwise oxidation of polymer film, the absorption in the visible region
diminished as the new bands were intensified at around 1000 nm and 1700 nm.
These lower energy transitions indicate the formation of charge carriers such as
polarons and bipolarons.
Figure 3. 12 Colors of P2 at its neutral (0.0 V) and different oxidized states
47
Figure 3.12 shows the colors of P2 at its neutral state and different oxidized states.
P2 is also a ferrocene containing quinoxaline derivative polymer like P1.
Spectroelectrochemical and colorimetric studies showed that incorporation of Fc unit
in the polymer backbone resulted in multicolored oxidation states whereas
quinoxaline based polymers without ferrocene switched only between green and
highly transmissive states.
3.1.2.3 Kinetic Studies of P2
Kinetic studies were conducted in order to determine switching times and percent
transmittance changes (ΔT %) of the polymers between their neutral and oxidized
states. The polymer films were stepped between the two states with 5 s time
intervals. Due to multi-color formation between its two extreme states, ΔT % for P2
in the visible region was only observable at 703 nm as 40 % with 1.3 s. swiching
time. In the NIR region P2 revealed 22 % optical contrast with a switching time of
1.68 s.
Figure 3. 13 Percent transmittance changes as a function of time at 703 nm and 1700
nm for P2.
48
3.1.3 Electrochemical and Electrochromic Properties of PDEDNQ (P3)
3.1.3.1 Electrochemistry of DEDNQ (M3)
The potentiodynamic electropolymerization for DEDNQ (M3) was performed in 0.1
M (TBAPF6) and solvent system was chosen as ACN/DCM (5:95, v: v) mixture.
Indium tin oxide coated glass slides (ITO) were used as the working electrode
whereto polymer films were produced.
A well-defined reversible redox couple forms an electroactive polymer films.
Monomer oxidation potential for M3 was observed at 0.85 V which was the lowest
potential for monomer oxidation among its analogues (Table 3.1).
Figure 3. 14 Repeated potential scan electropolymerization of M2 in 0.1 M
TBAPF6/ACN/DCM on ITO electrode.
As mentioned above P1 and P2 have both n-doping and p-doping properties. The
third derivative P3 also shows n-doping property with well defined reversible redox
couple at -2.05 V/-1.42 V.
49
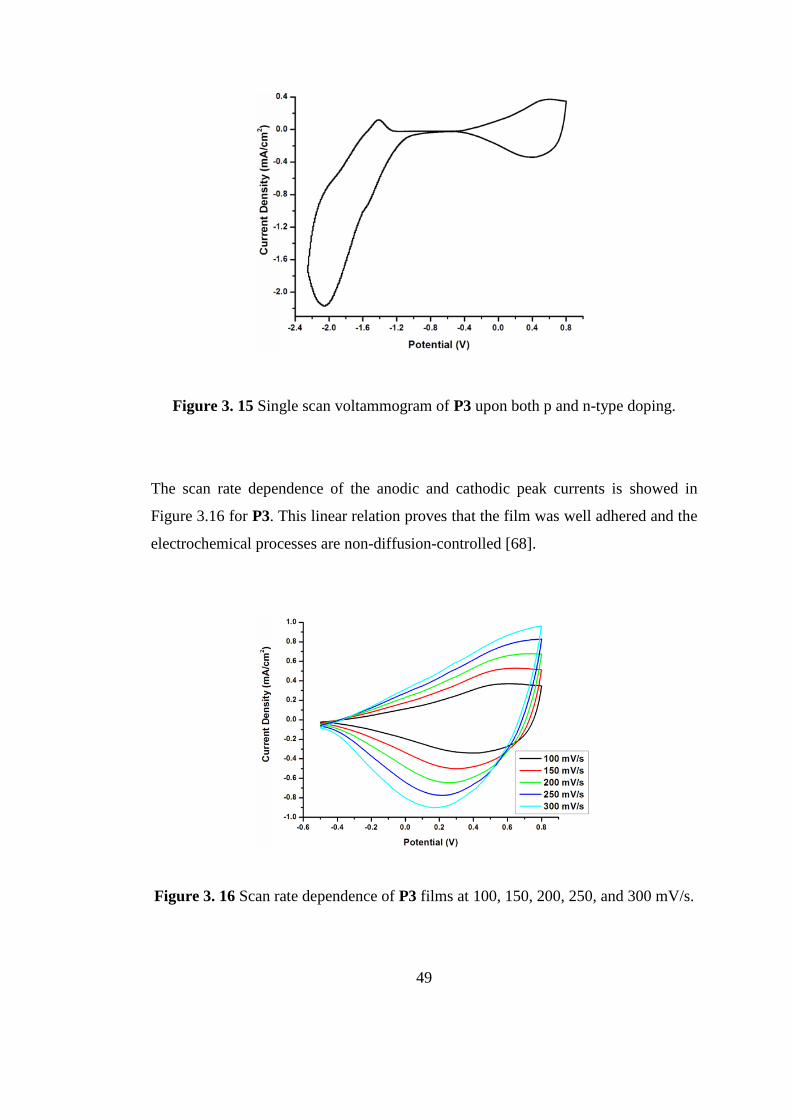
Figure 3. 15 Single scan voltammogram of P3 upon both p and n-type doping.
The scan rate dependence of the anodic and cathodic peak currents is showed in
Figure 3.16 for P3. This linear relation proves that the film was well adhered and the
electrochemical processes are non-diffusion-controlled [68].
Figure 3. 16 Scan rate dependence of P3 films at 100, 150, 200, 250, and 300 mV/s.
50
3.1.3.2 Spectroelectrochemistry of P3
Spectroelectrochemical properties of the polymers were investigated between -0.5
and 1.0 V in 0.1 M TBAPF6/ACN electrolyte-solvent couple and UV-vis-NIR
spectra were recorded upon external bias. Figure 3.17 illustrates
spectroelectrochemistry of electrochemically prepared P3 at the reduced state and
upon doping.
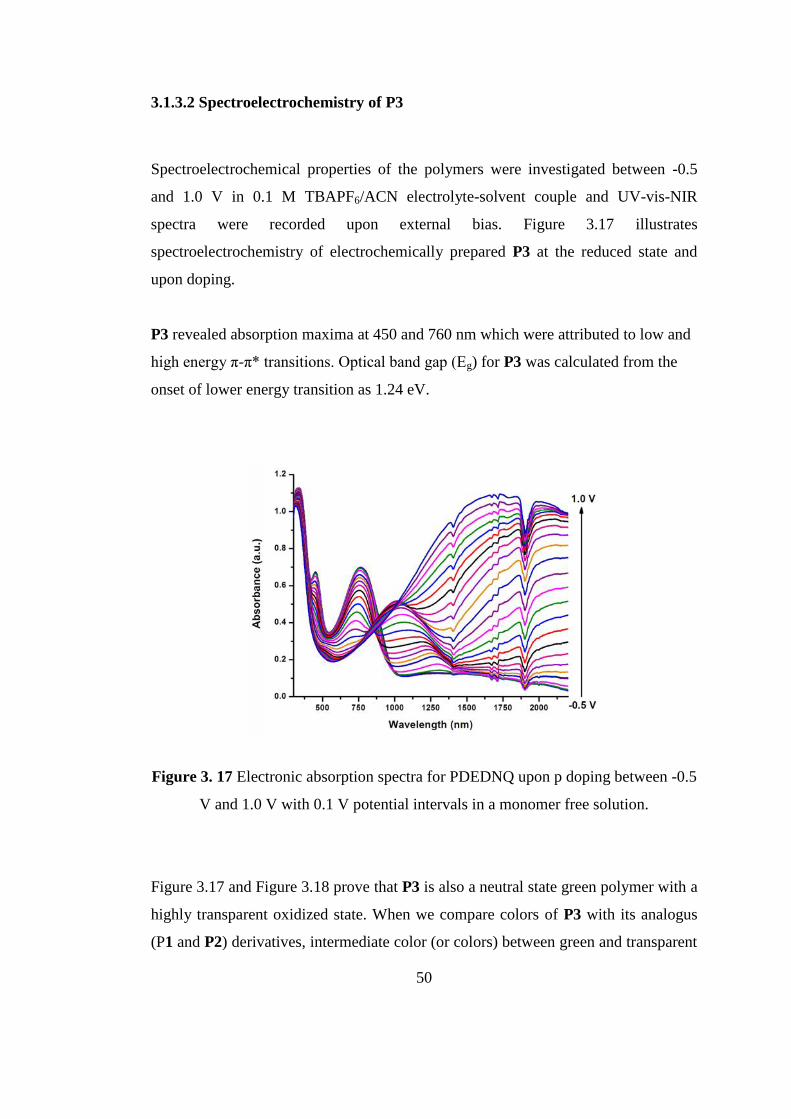
P3 revealed absorption maxima at 450 and 760 nm which were attributed to low and
high energy π-π* transitions. Optical band gap (Eg) for P3 was calculated from the
onset of lower energy transition as 1.24 eV.
Figure 3. 17 Electronic absorption spectra for PDEDNQ upon p doping between -0.5
V and 1.0 V with 0.1 V potential intervals in a monomer free solution.
Figure 3.17 and Figure 3.18 prove that P3 is also a neutral state green polymer with a
highly transparent oxidized state. When we compare colors of P3 with its analogus
(P1 and P2) derivatives, intermediate color (or colors) between green and transparent
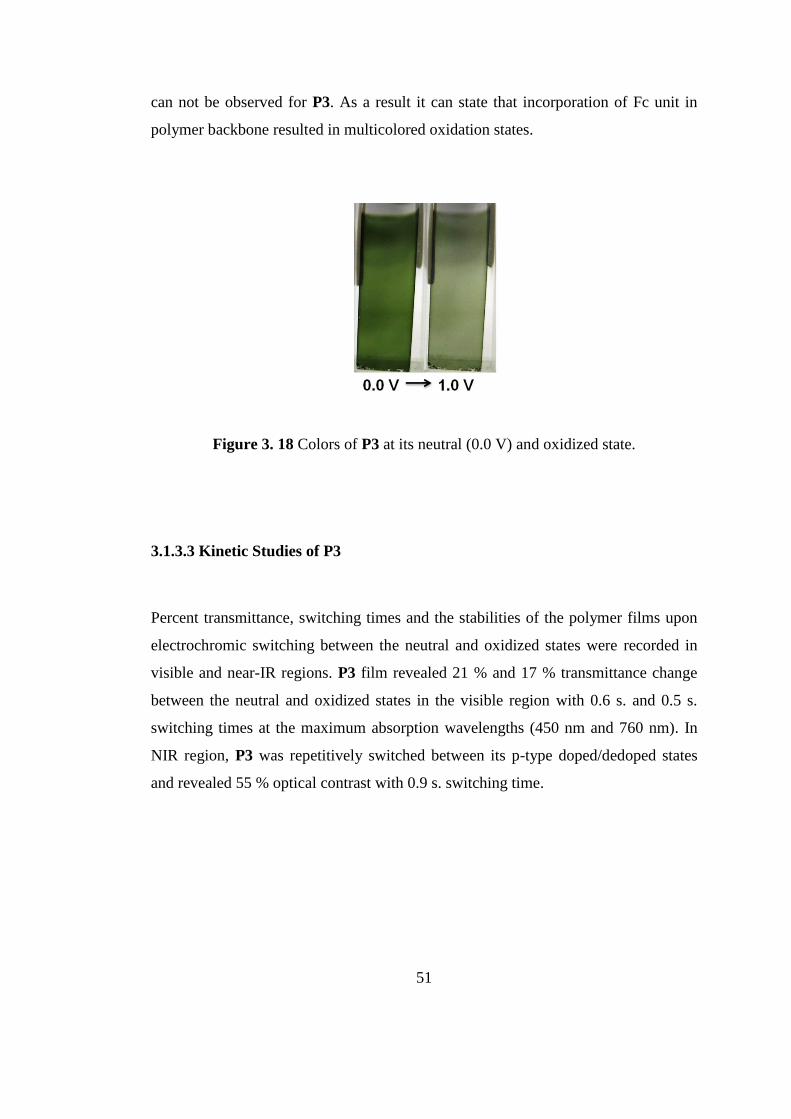
51
can not be observed for P3. As a result it can state that incorporation of Fc unit in
polymer backbone resulted in multicolored oxidation states.
Figure 3. 18 Colors of P3 at its neutral (0.0 V) and oxidized state.
3.1.3.3 Kinetic Studies of P3
Percent transmittance, switching times and the stabilities of the polymer films upon
electrochromic switching between the neutral and oxidized states were recorded in
visible and near-IR regions. P3 film revealed 21 % and 17 % transmittance change
between the neutral and oxidized states in the visible region with 0.6 s. and 0.5 s.
switching times at the maximum absorption wavelengths (450 nm and 760 nm). In
NIR region, P3 was repetitively switched between its p-type doped/dedoped states
and revealed 55 % optical contrast with 0.9 s. switching time.
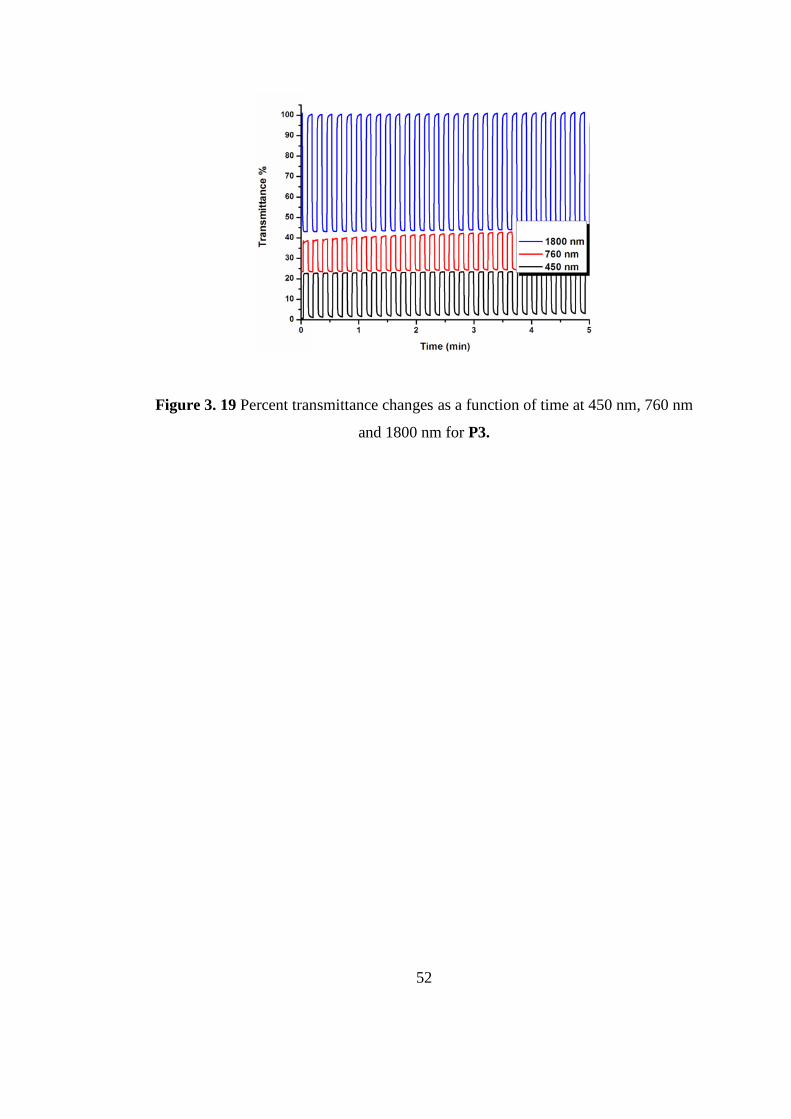
52
Figure 3. 19 Percent transmittance changes as a function of time at 450 nm, 760 nm
and 1800 nm for P3.
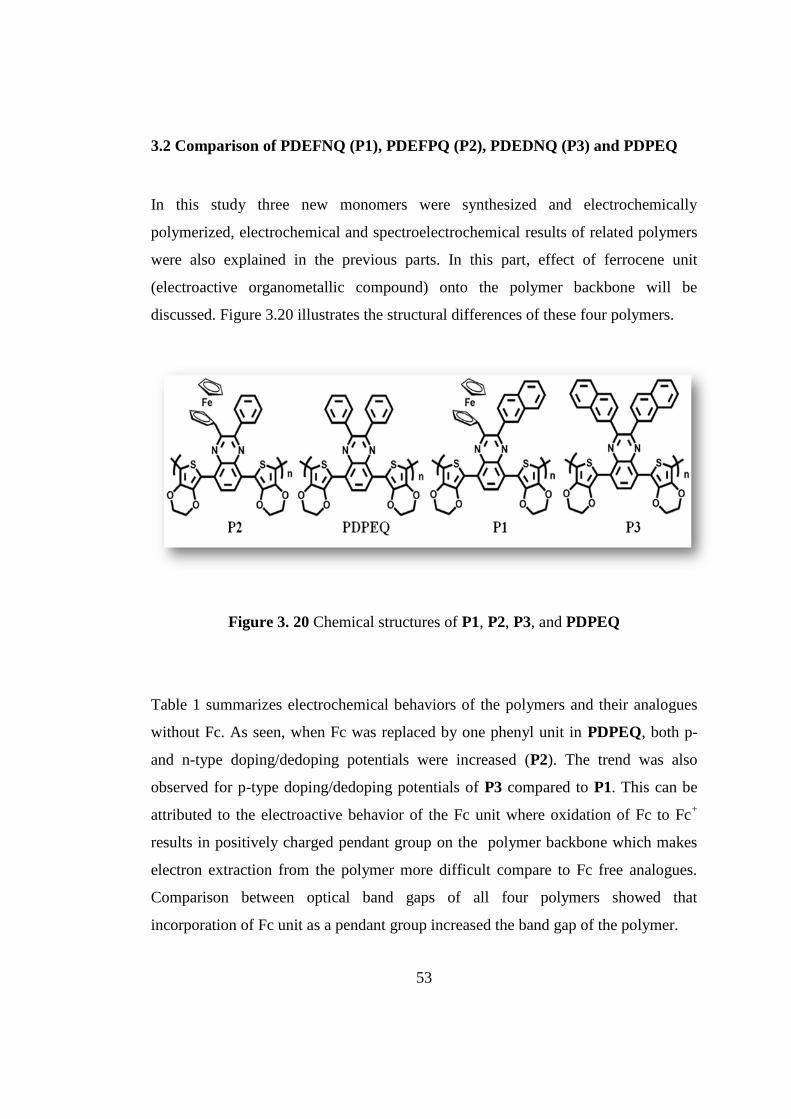
53
3.2 Comparison of PDEFNQ (P1), PDEFPQ (P2), PDEDNQ (P3) and PDPEQ
In this study three new monomers were synthesized and electrochemically
polymerized, electrochemical and spectroelectrochemical results of related polymers
were also explained in the previous parts. In this part, effect of ferrocene unit
(electroactive organometallic compound) onto the polymer backbone will be
discussed. Figure 3.20 illustrates the structural differences of these four polymers.
Figure 3. 20 Chemical structures of P1, P2, P3, and PDPEQ
Table 1 summarizes electrochemical behaviors of the polymers and their analogues
without Fc. As seen, when Fc was replaced by one phenyl unit in PDPEQ, both p-
and n-type doping/dedoping potentials were increased (P2). The trend was also
observed for p-type doping/dedoping potentials of P3 compared to P1. This can be
attributed to the electroactive behavior of the Fc unit where oxidation of Fc to Fc+
results in positively charged pendant group on the polymer backbone which makes
electron extraction from the polymer more difficult compare to Fc free analogues.
Comparison between optical band gaps of all four polymers showed that
incorporation of Fc unit as a pendant group increased the band gap of the polymer.
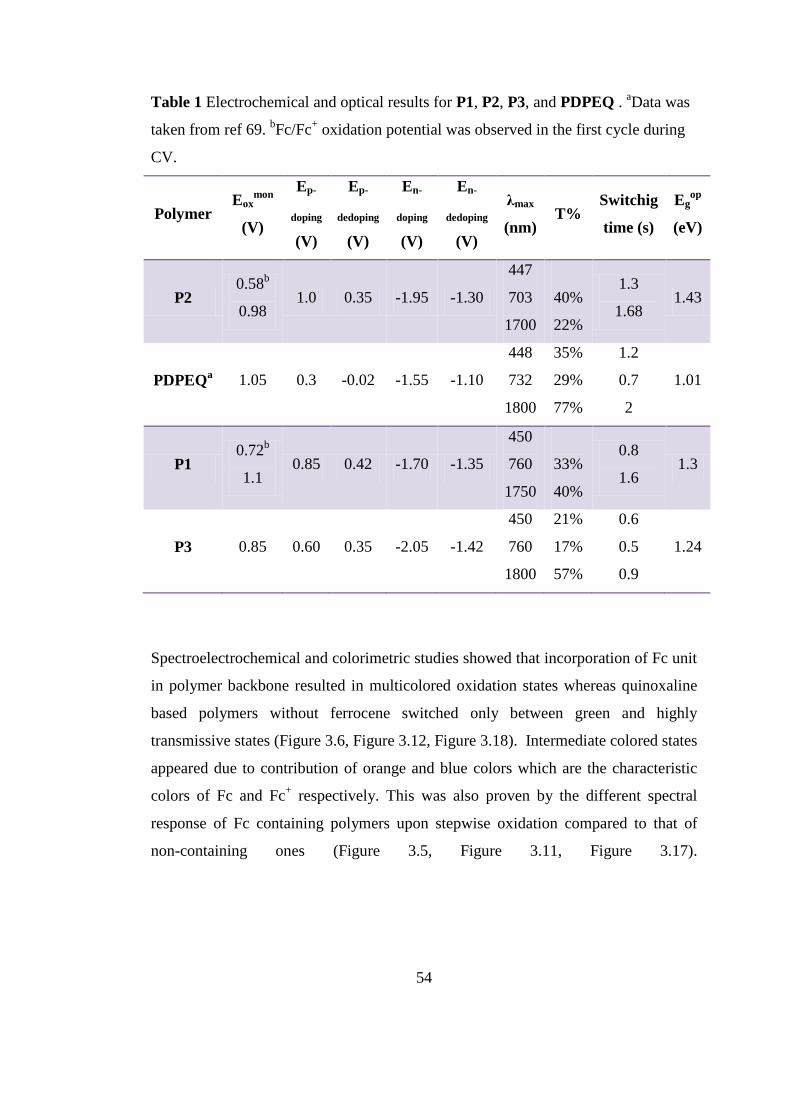
54
Table 1 Electrochemical and optical results for P1, P2, P3, and PDPEQ . aData was
taken from ref 69. bFc/Fc
+ oxidation potential was observed in the first cycle during
CV.
Polymer Eox
mon
(V)
Ep-
doping
(V)
Ep-
dedoping
(V)
En-
doping
(V)
En-
dedoping
(V)
λmax
(nm) T%
Switchig
time (s)
Egop
(eV)
P2 0.58
b
0.98 1.0 0.35 -1.95 -1.30
447
703
1700
40%
22%
1.3
1.68 1.43
PDPEQa 1.05 0.3 -0.02 -1.55 -1.10
448
732
1800
35%
29%
77%
1.2
0.7
2
1.01
P1 0.72
b
1.1 0.85 0.42 -1.70 -1.35
450
760
1750
33%
40%
0.8
1.6 1.3
P3 0.85 0.60 0.35 -2.05 -1.42
450
760
1800
21%
17%
57%
0.6
0.5
0.9
1.24
Spectroelectrochemical and colorimetric studies showed that incorporation of Fc unit
in polymer backbone resulted in multicolored oxidation states whereas quinoxaline
based polymers without ferrocene switched only between green and highly
transmissive states (Figure 3.6, Figure 3.12, Figure 3.18). Intermediate colored states
appeared due to contribution of orange and blue colors which are the characteristic
colors of Fc and Fc+ respectively. This was also proven by the different spectral
response of Fc containing polymers upon stepwise oxidation compared to that of
non-containing ones (Figure 3.5, Figure 3.11, Figure 3.17).
55
CHAPTER 4
CONCLUSION
The donor-accetor-donor type three new monomers were synthesized by Stille
coupling reactions and NMR was used for the characterization of these materials.
Electrochemical polymerization method was used for polymerization of
corresponding monomers. As a result of cyclic voltammetry,
spectroelectrochemistry, kinetic studies and switching experiments electrochemical
properties these conducting polymers were investigated.
All the three materials are quinoxaline and EDOT based conducting polymers.
PDEFNQ (P1) is a ferrocene functionalized, both p and n dopable donor-acceptor-
donor type conjugated polymer. P1 is a neutrally green polymer but it has
multicolored states with a transmissive oxidized state.
Structural design for PDEFPQ (P2) and PDEDNQ (P3) were accomplished in order
to have a better comparison and understanding on the pendant group effect on
electrochromic properties of these green to transmissive conjugated polymers.
Summary of results showed that incorporation of Fc substituent enhanced the optical
contrast in the visible region which in turn resulted in better transparency for the
oxidized state (comparison is made between P2 and PDPEQ or between P1 and P3).
Only phenyl pendant group as in PDPEQ resulted in higher optical contrast with a
longer switching time than that of naphtyl substituted P3. However, Fc pendant
group bearing polymers (P1 and P2) revealed multicolored electrochromism which is
an effect of independent electrochromic switching of Fc. Thus, multicolored states
with green to transmissive switching polymers could be achieved by Fc substitution.
56
REFERENCES
[1] M.S. Freund, B. Deore, Self-Doped Conducting Polymers, 2007, England, p1.
[2] G. Inzelt, Conducting Polymers (A New Era in Electrochemistry), 2008, Berlin
Heidelberg, p1.
[3] C. K. Chiang, Y. W. Park, A. J. Heeger, H. Shirakawa, E. J. Louis, A. G.
MacDiarmid, Phys. Rev. Lett., 1977, 39, 1098.
[4] a) A. F. Diaz, Chem. Scr., 1981, 17,142. b)G. Tourillon, F. J. Garnier, J.
Electroanal. Chem., 1982, 135,173. c) A. F. Diaz, K. K. Kanazawa, G. P. Gardini, J.
Chem. Soc., Chem. Commun., 1979, 635. d) G. Grem, G. Leditzky, B. Ullrich, G.
Leising, Adv. Mater., 1992, 4, 36. e) J. H. Burroughes, D. D. C. Bradley, A. R.
Brown, R. N. Marks, K. MacKay, R. H. Friend, P. L. Burn, A. B. Holmes, Nature,
1990, 347, 539. f) J. Rault-Berthelot, J. Simonet, J. Electrochem. Soc., 1985, 182,
187. g) A. G. MacDiarmid, A. J. Epstein, Faraday Discuss. Chem. Soc., 1989, 88,
317.
[5] M. E. G. Lyons, Electroactive Polymer Electrochemistry, 1994, New York, p48.
[6] K. Shimamura, F. E. Karasz, J. A. Hirsch, J. C. Chien, Makromol. Chem. Rapid
Commun., 1981, 2, 443.
[7] J. L. Bredas, G. B. Street, Acc. Chem. Res., 1985, 18, 309.
[8] C. Pratt, Conducting Polymers.
[9] K. Fesser, A. R. Bishop, D. K. Campbell, Phys. Rev. B, 1983, 27, 4804.
[10] D. L. Wise, G. E. Wnek, D. J. Trantolo, T. M. Cooper, J. D. Gressser, Electrical
And Optical Polymer Systems, 1998, New York, pp 49-52.
[11] A. J. Heeger, J. Phys. Chem. B, 2001, 105, 8475.
[12] A. D. Child, J. R. Reynolds, J. Chem. Soc., Chem. Commun, 1991, 1779.
[13] S. Alkan, L. Toppare, Y. Hepuszer, Y. Yağcı, J. Polym. Sci. Part A: Polym.
Chem., 1999, 37, 4218.
[14] D. M. de Leeuw, M. M. J. Simenon, A. R. Brown, R. E. F. Einerhand, Synth.
Met., 1997, 87, 53.
57
[15] C. J. DuBois, F. Larmat, D. J. Irvin, J. R. Reynolds, Synth. Met., 2001, 119, 321.
[16] C. J. DuBois, K. A. Abboud, J. R. Reynolds, J. Phys. Chem. B, 2004, 108, 8550.
[17] C. J. DuBois, J. R. Reynolds, Adv. Mater., 2002, 14, 1844.
[18] D. Kumar, R. C. Sharma, Eur. Polym. J., 1998, 34, 1053.
[19] G. A. Sotzig, PhD Thesis, University of Florida, (1997).
[20] P.M. Beaujuge, S. Ellinger, J.R. Reynolds, Adv. Mater., 2008, 20, 2772.
[21] a) S. Ryu, I. Yoo, S. Song, B. Yoon, J. M. Kim, J. Am. Chem. Soc., 2009, 131,
3800.
b) Y. Long, H Chen, Y. Yang, H. Wang, Y. Yang, N. Li, K. Li, J. Pei, F. Liu,
Macromolecules, 2009, 42, 6501.
c) R. C. Smith, A. G. Tennyson, M. H. Lim, S. J. Lippard, Org. Lett., 2005, 7, 3573.
d) D. T. McQuade, A. E. Pullen, T. M. Swager, Chem. Rev., 2000, 100, 2537.
[22] a) N. R. Evans, L. S. Devi, C. S. K. Mak, S. E. Watkins, S. I. Pascu, A. Kohler,
R. H. Friend, C. K. Williams, A. B. Holmes., J. Am. Chem Soc., 2006, 128, 6647. b)
Q. Huang, G. A. Evmenenko, P. Dutta, P. Lee, N. R. Armstrong, T. J. Marks, J. Am.
Chem. Soc., 2005, 127, 10227. c) M. H. Song, D. Kabra, B. Wenger, R. H. Friend, H.
J. Snaith., Adv. Funct. Mater., 2009, 19, 2130. d) P. Zacharias, M. C. Gather, A.
Köhnen, N. Rehmann, K. Meerholz, Angew. Chem. Int. Ed., 2009, 48, 4038.
[23] a) Y. He, G. Zhao, J. Min, M. Zhang, Y. Li, Polymer, 2009, 50, 5055. b) J. C.
Bijleveld, A. P. Zoombelt, S. G. J. Mathijssen, M. M. Wienk, M. Turbiez, D. M.
Leeuw, R. A. J. Janssen, J. Am. Chem. Soc., 2009, 13, 16616. c) C. J. Brabec, N. S.
Sariciftci, J. C. Hummelen., Adv. Funct. Mater., 2001, 11, 15. d) N. S. Sariciftci, D.
Braun, C. Zhang, V. Srdanov, A. J. Heeger, F. Stucky, F. Wudl, App. Phys. Lett.,
1993, 62, 585. e) M. Horie, I. W. Shen, S. M. Tuladhar, H. Leventis, S. A. Haque, J.
Nelson, B. R. Saunders, M. L. Turner, Polymer, 2010, 51, 1541.
[24] a) D. S. H. Charrier, T. Vries, S. G. J. Mathijssen, E. J. Geluk, E. C. P. Smits,
M. Kemerink, R. A. J. Janssen, Org. Electron., 2009, 10, 994. b) H. H. Fong, V. A.
Pozdin, A. Amassian, G. G. Malliaras, D. M. Smilgies, M. He, S. Gasper, F. Zhang,
M. Sorensen, J. Am. Chem. Soc., 2008, 130, 13202. c) P. M. Beaujuge, W. Pisula, H.
N. Tsao, S. Ellinger, K. Mullen, J. R. Reynolds., J. Am. Chem. Soc., 2009, 131, 7514.
d) I. McCulloch, M. Heeney, C. Bailey, K. Genevicius, I. MacDonald, M. Shkunov,
D. Sparrowe, S. Tierney, R. Wagner, W. Zhang, M. L. Chabinyc, R. J. Kline, M. D.
58
McGehee, M. F. Toney., Nat. Mater., 2006, 5, 328. e) L. L. Chua, J. Zaumseil, J. F.
Chang, E. C. W. Ou, P. K. H. Ho, H. Sirringhaus, R. H. Friend, Nature, 2005, 434,
194. f) N. Stutzmann, R. H. Friend, H. Sirringhaus, Science, 2003, 299, 1881.
[25] a) S. Celebi, D. Baran, A. Balan, L. Toppare, Electrochimi. Acta, 2010, 55,
2373. b) G. Sonmez, H. B. Sonmez, C. K. F. Shen, R. W. Jost, Y. Rubin, F. Wudl,
Macromolecules, 2005, 38, 669. c) I Schwendeman, R Hickman, G Sonmez, P
Schottland, K Zong, DM Welsh, JR. Reynolds, Chem. Mater, 2002, 14, 3118. d) A.
Balan, G. Gunbas, A. Durmus, L. Toppare, Chem. Mater., 2008, 20, 7510. e) A.
Kumar, S. Jang, J. Padilla, T. F. Otero, G. A. Sotzing, Polymer, 2008, 49, 3686.
[26] R. J. Mortimer, Chem. Soc. Rev., 1997, 26, 147.
[27] D. R. Rosseinsky, R. J. Mortimer, Adv. Mater., 2001, 13, 783.
[28] A. A. Argun, P. H. Aubert, B. C. Thompson, I. Schwendeman, C. L. Gaupp, J.
Hwang, N. J. Pinto, D. B. Tanner, A. G. MacDiarmid, J. R. Reynolds, Chem. Mater.,
2004, 16, 4401.
[29] M. A. Habib, Electrochem. Transition, 1992, 51.
[30] R. J. Mortimer, Electrochim. Acta, 1999, 44, 2971.
[31] P. R. Somani, S. Radhakrishnan, Mater. Chem. Phys., 2003, 77, 117.
[32] A. Kumar, D. M. Welsh, M. C. Morvant, F. Piroux, K. A. Abboud, J. R.
Reynolds, Chem. Mater., 1998, 10, 896.
[33] S. A. Sapp, G. A. Sotzing, J. R. Reynolds, Chem. Mater., 1998, 10, 2101.
[34] G. Sonmez, H. B. Sonmez, C. K. F. Shen, R. W. Jost, Y. Rubin, F. Wudl,
Macromolecules, 2005, 38, 669.
[35] I. Schwendeman, R. Hickman, G. Sonmez, P. Schottland, K. Zong, D. Welsh, J.
R. Reynolds, Chem. Mater., 2002, 14, 3118.
[36] K. Fesser, A. R. Bishop, D. K. Campbell, Phys. Rev. B, 1983, 27, 4804.
[37] J. Roncali, Chem. Rev., 1997, 97, 173.
[38] D. M. Welsh, A. Kumar, E. W. Meijer, J. R. Reynolds, Adv. Mater., 1999, 11,
1379.
[39] A. Balan, Ms Thesis, Middle East Technical University, (2009)
[40] C. A. Thomas, K. Zong, K. A. Abboud, P. J. Steel, J. R. Reynolds, J. Am. Chem.
Soc., 2004, 126, 16440.
[41] G. Gunbas, Ms Thesis, Middle East Technical University, (2007)
59
[42] G. Sonmez, Chem. Commun., 2005, 5251.
[43] G. Sonmez, C. K. F. Shen, Y. Rubin, F. Wudl, Angew. Chem. Int. Ed., 2004, 43,
1498.
[44] A. Durmus, G. E. Gunbas, P. Camurlu, L. Toppare, Chem Commun., 2007,
3246.
[45] A. Durmus, G. E. Gunbas, L. Toppare, Chem. Mater., 2007, 19, 6247.
[46] G. E. Gunbas, A. Durmus, L. Toppare, Adv. Mater, 2008, 20, 691.
[47] G. E. Gunbas, A. Durmus, L. Toppare, Adv. Funct. Mater., 2008, 18, 2026.
[48] P. M. Beaujuge, S. Ellinger J. R. Reynolds, Adv. Mater., 2008, 20, 2772.
[49] a) A. Togni, T. Hayashi , Ferrocene-Homogeneous Catalysis, Organic Synthesis
and Material Science, 1995, VCH, New York. b) G. Wilkinson, J. Organomet.
Chem., 1975, 100, 273.
[50] R. D. A. Hudson, Journal of Organometallic Chemistry, 2001, 47, 637.
[51] M. O. Wolf, Adv. Mater., 2001, 13, 545.
[52] S. Takahashi, M. Kariya, T. Yatake, K. Sonogashira, N. Hagihara,
Macromolecules, 1978, 11, 1063.
[53] H. B. Fyfe, M. Miekuz, D. Zargarian, N. J. Taylor, T. B. Marder, J. Chem. Soc.,
Chem. Commun., 1991, 188.
[54] M. J. Irwin, J. J. Vittal, R. J. Puddephatt, Organometallics, 1997, 16, 3541.
[55] S. J. Davies, B. F. G. Johnson, J. Lewis, P. R. Raithby, J. Organomet. Chem.,
1991, 414, C51.
[56] A. Ion, I. Ion, A. Popescu, M. Ungureanu, J. C. Moutet, E. Saint-Aman, Adv.
Mater., 1997, 9, 711.
[57] J. Chen, C. O. Too, G. G. Wallace, G. F. Swiegers, B.W. Skelton, A. H. White,
Electrochim. Acta, 2002, 47, 4227.
[58] S. Ifuku, Y. Tsujii, H. Kamitakahara, T. Takano, F. Nakatsubo, J. Polym. Sci.,
Part A: Polym. Chem., 2005, 43, 5023.
[59] M. E. Plonska, A. Bettencourt-Dias, A. L. Balch, K. Winkler, Chem. Mater.,
2003, 15, 4122.
[60] J. Xu, Y. Tian, R. Peng, Y. Xian, Q. Ran, L. Jin, Electrochem. Commun., 2009,
11, 1972.
[61] Y. Zhu, M. O. Wolf, Chem. Mater., 1999, 11, 2995.
60
[62] L. E. Harrington, J. F. Britten, M. J. McGlinchey, Can. J. Chem., 2003, 81,
1180.
[63] B. A. Da Silveria Neto, A. L. Sant′Ana, G. Ebeling, S. R. Goncalves, E. V. U.
Costa, H. F. Quina, J. Dupont, Tetrahedron, 2005, 61, 10975.
[64] Y. Tsubata, T. Suzuki, T. Miyashi, Y. Yamashita, J. Org. Chem., 1992, 57,
6749.
[65] S. S. Zhu, T. M. Swager, J. Am. Chem. Soc., 1997, 119, 12568.
[66] a) M. A. Khan,W. Xu, K. Haq, Y. Bai, F.Wei, X. Y. Jiang, Z. L. Zhang, W. Q.
Zhu, J. Phys. D: Appl. Phys., 2007, 40, 6535. b) E. J. Meijer, D. M. de Leeuw, S.
Setayesh, E. van Veenendaal, B. H. Huisman, P. W. M. Blom, J. C. Hummelen, U.
Scherf , T. M. Klapwijk, Nature Materials, 2003, 2, 678.
[67] C. J. DuBois, J. R. Reynolds, Adv. Mater., 2002, 14, 1844.
[68] G. Sonmez, I. Schwendeman, P. Schottland, K. Zong, J. R. Reynolds,
Macromolecules, 2003, 36, 639.
[69] G. Gunbas, A. Durmus, L. Toppare, Adv. Mater., 2008, 20, 691.
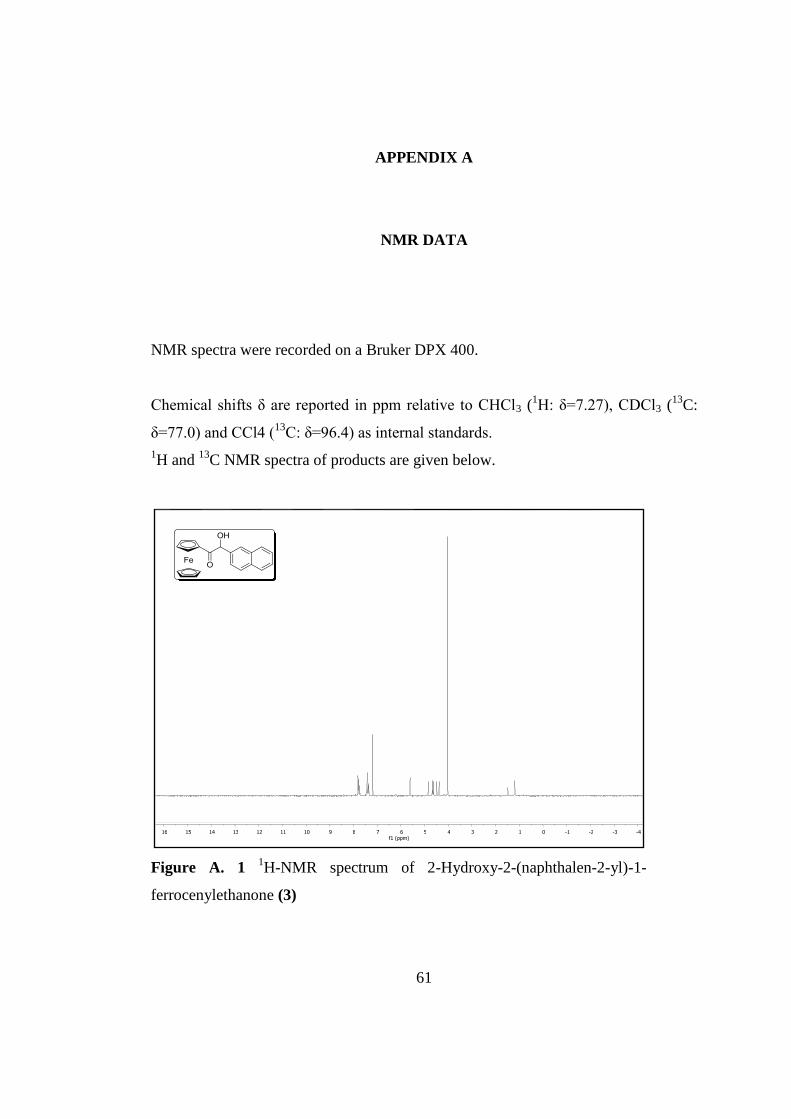
61
APPENDIX A
NMR DATA
NMR spectra were recorded on a Bruker DPX 400.
Chemical shifts δ are reported in ppm relative to CHCl3 (1H: δ=7.27), CDCl3 (
13C:
δ=77.0) and CCl4 (13
C: δ=96.4) as internal standards.
1H and
13C NMR spectra of products are given below.
-4 -3 -2 -1 0 1 2 3 4 5 6 7 8 9 10 11 12 13 14 15 16 f1 (ppm)
Figure A. 1 1H-NMR spectrum of 2-Hydroxy-2-(naphthalen-2-yl)-1-
ferrocenylethanone (3)
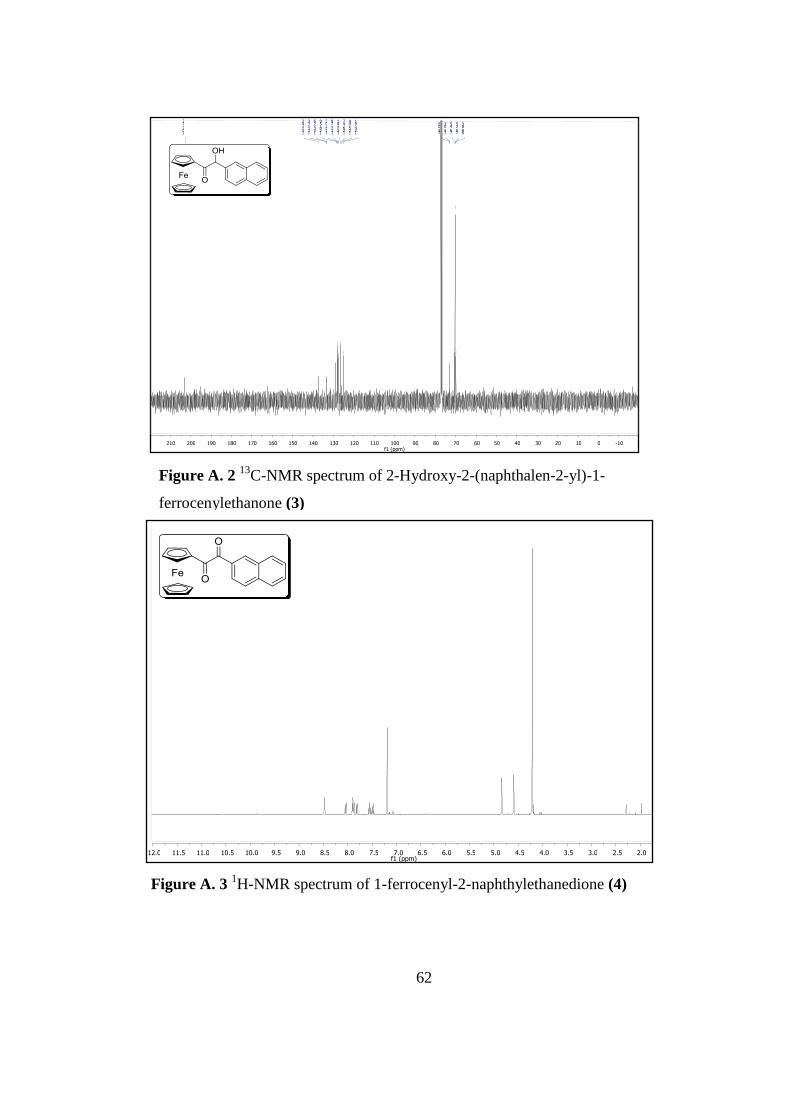
62
2.0 2.5 3.0 3.5 4.0 4.5 5.0 5.5 6.0 6.5 7.0 7.5 8.0 8.5 9.0 9.5 10.0 10.5 11.0 11.5 12.0 f1 (ppm)
-10 0 10 20 30 40 50 60 70 80 90 100 110 120 130 140 150 160 170 180 190 200 210 f1 (ppm)
6 9 . 8 3
7 0 . 2 5
7 0 . 4 5
7 3 . 0 3
7 3 . 0 5
1 2 4 . 9 1
1 2 5 . 9 4
1 2 6 . 4 7
1 2 7 . 4 1
1 2 7 . 7 8
1 2 8 . 0 3
1 2 8 . 5 9
1 3 3 . 2 6
1 3 3 . 3 3
1 3 7 . 4 2
2 0 2 . 7 2
Figure A. 2 13
C-NMR spectrum of 2-Hydroxy-2-(naphthalen-2-yl)-1-
ferrocenylethanone (3)
Figure A. 3 1H-NMR spectrum of 1-ferrocenyl-2-naphthylethanedione (4)
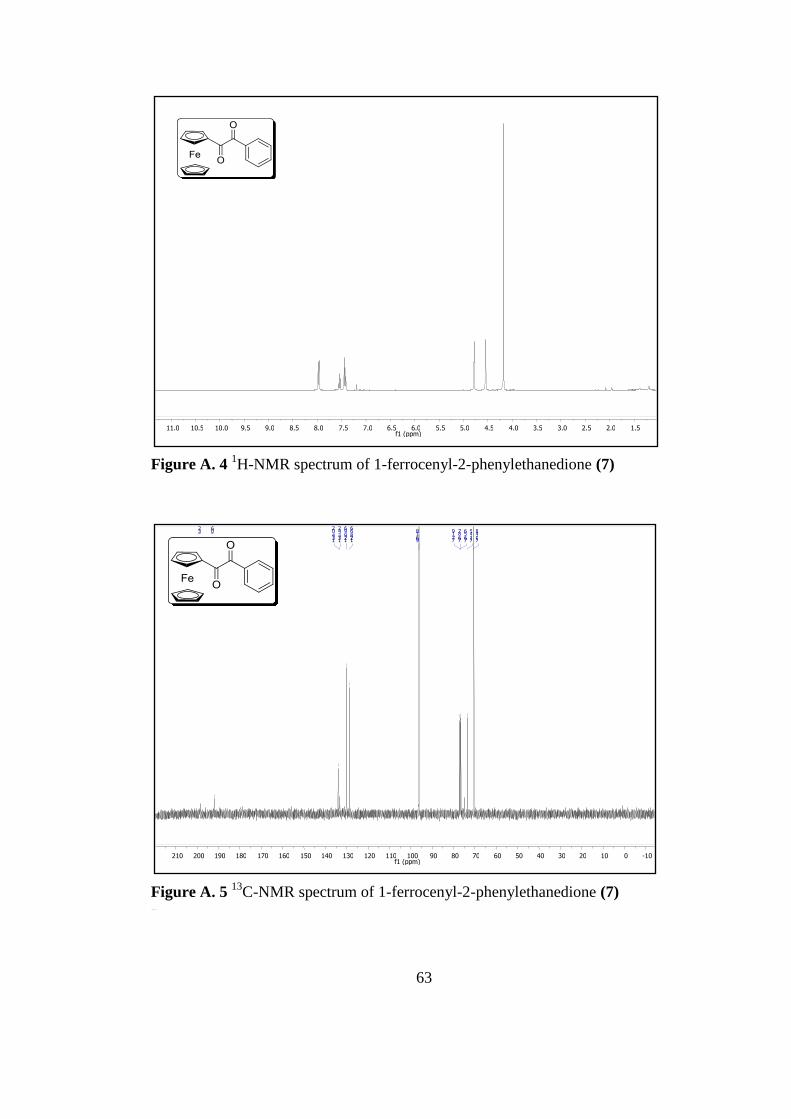
63
F
-10 0 10 20 30 40 50 60 70 80 90 100 110 120 130 140 150 160 170 180 190 200 210 f1 (ppm)
7 0 . 4 8
7 3 . 4 5
7 6 . 5 6
7 6 . 8 7
7 7 . 1 9
9 6 . 1 8
1 2 8 . 6 6
1 2 9 . 9 6
1 3 3 . 4 2
1 3 4 . 0 2
1 9 2 . 0 6
1 9 8 . 3 2
1.5 2.0 2.5 3.0 3.5 4.0 4.5 5.0 5.5 6.0 6.5 7.0 7.5 8.0 8.5 9.0 9.5 10.0 10.5 11.0 f1 (ppm)
Figure A. 4 1H-NMR spectrum of 1-ferrocenyl-2-phenylethanedione (7)
Figure A. 5 13
C-NMR spectrum of 1-ferrocenyl-2-phenylethanedione (7)
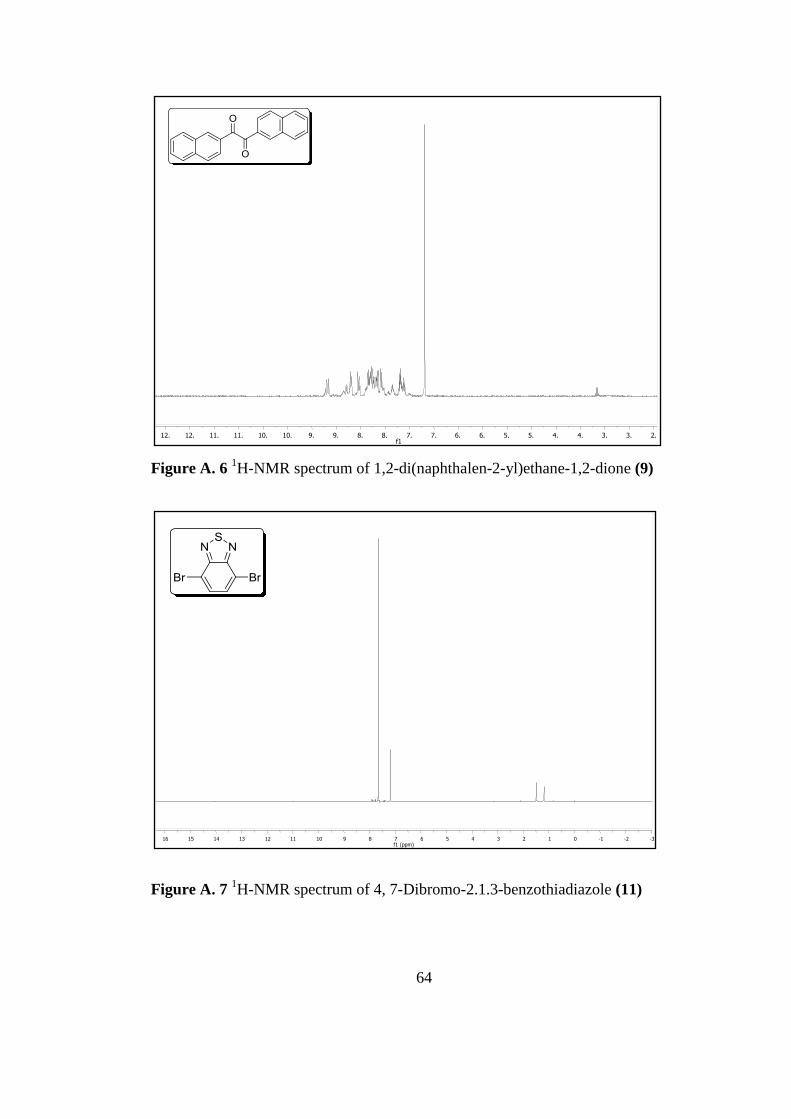
64
-3 -2 -1 0 1 2 3 4 5 6 7 8 9 10 11 12 13 14 15 16 f1 (ppm)
2.5
3.0
3.5
4.0
4.5
5.0
5.5
6.0
6.5
7.0
7.5
8.0
8.5
9.0
9.5
10.0
10.5
11.0
11.5
12.0
12.5 f1
(ppm)
Figure A. 6 1H-NMR spectrum of 1,2-di(naphthalen-2-yl)ethane-1,2-dione (9)
Figure A. 7 1H-NMR spectrum of 4, 7-Dibromo-2.1.3-benzothiadiazole (11)
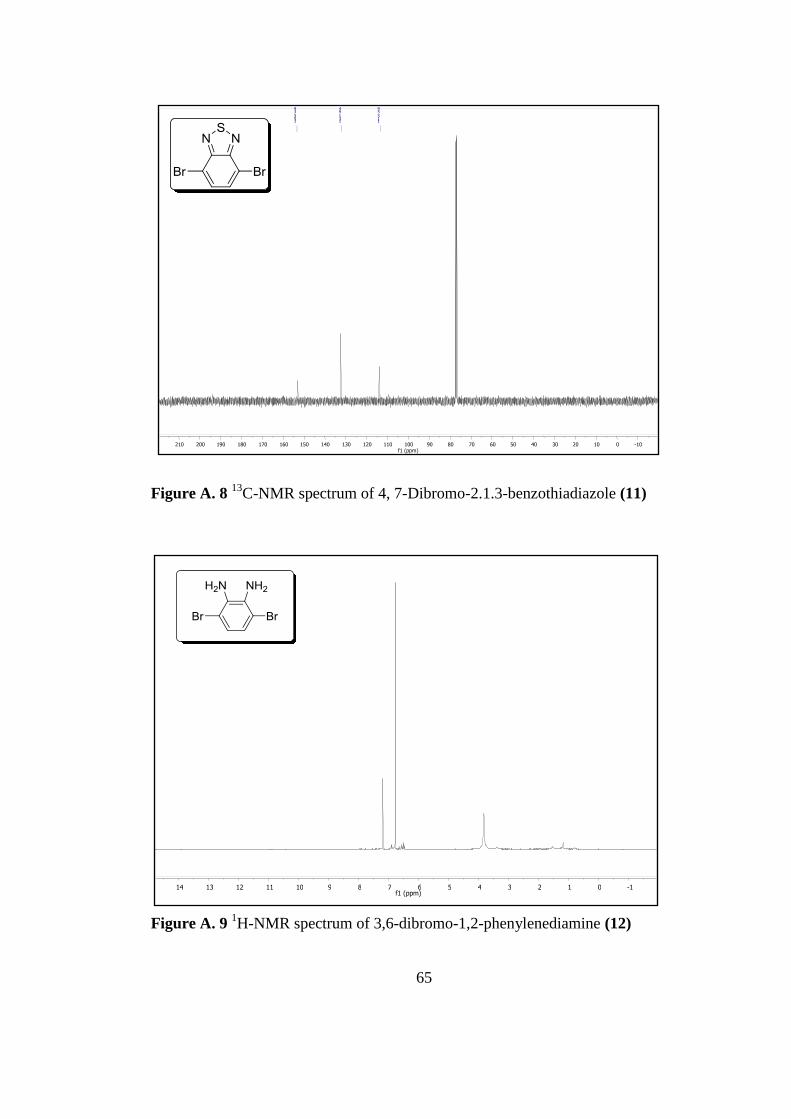
65
-1 0 1 2 3 4 5 6 7 8 9 10 11 12 13 14 f1 (ppm)
-10 0 10 20 30 40 50 60 70 80 90 100 110 120 130 140 150 160 170 180 190 200 210 f1 (ppm)
1 1 3 . 5 9
1 3 1 . 9 4
1 5 3 . 3 9
Figure A. 8 13
C-NMR spectrum of 4, 7-Dibromo-2.1.3-benzothiadiazole (11)
Figure A. 9 1H-NMR spectrum of 3,6-dibromo-1,2-phenylenediamine (12)
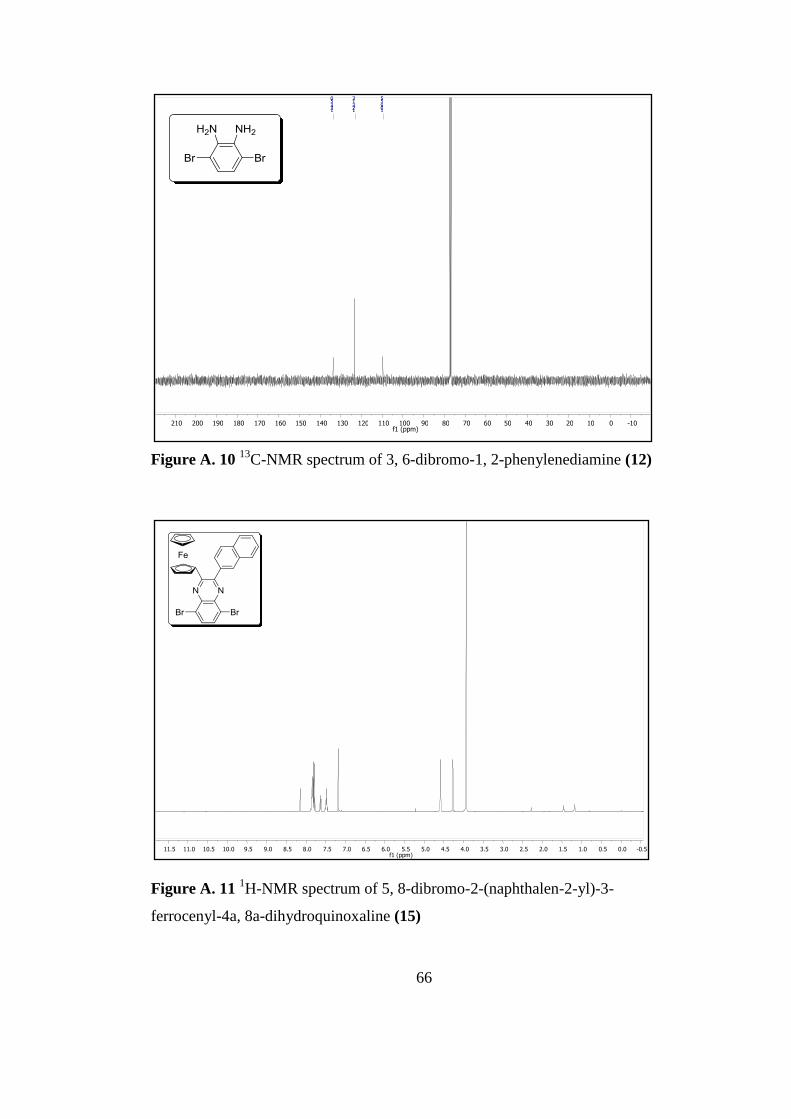
66
-0.5 0.0 0.5 1.0 1.5 2.0 2.5 3.0 3.5 4.0 4.5 5.0 5.5 6.0 6.5 7.0 7.5 8.0 8.5 9.0 9.5 10.0 10.5 11.0 11.5 f1 (ppm)
-10 0 10 20 30 40 50 60 70 80 90 100 110 120 130 140 150 160 170 180 190 200 210 f1 (ppm)
1 0 9 . 5 5
1 2 3 . 1 3
1 3 3 . 5 0
Figure A. 10 13
C-NMR spectrum of 3, 6-dibromo-1, 2-phenylenediamine (12)
Figure A. 11 1H-NMR spectrum of 5, 8-dibromo-2-(naphthalen-2-yl)-3-
ferrocenyl-4a, 8a-dihydroquinoxaline (15)
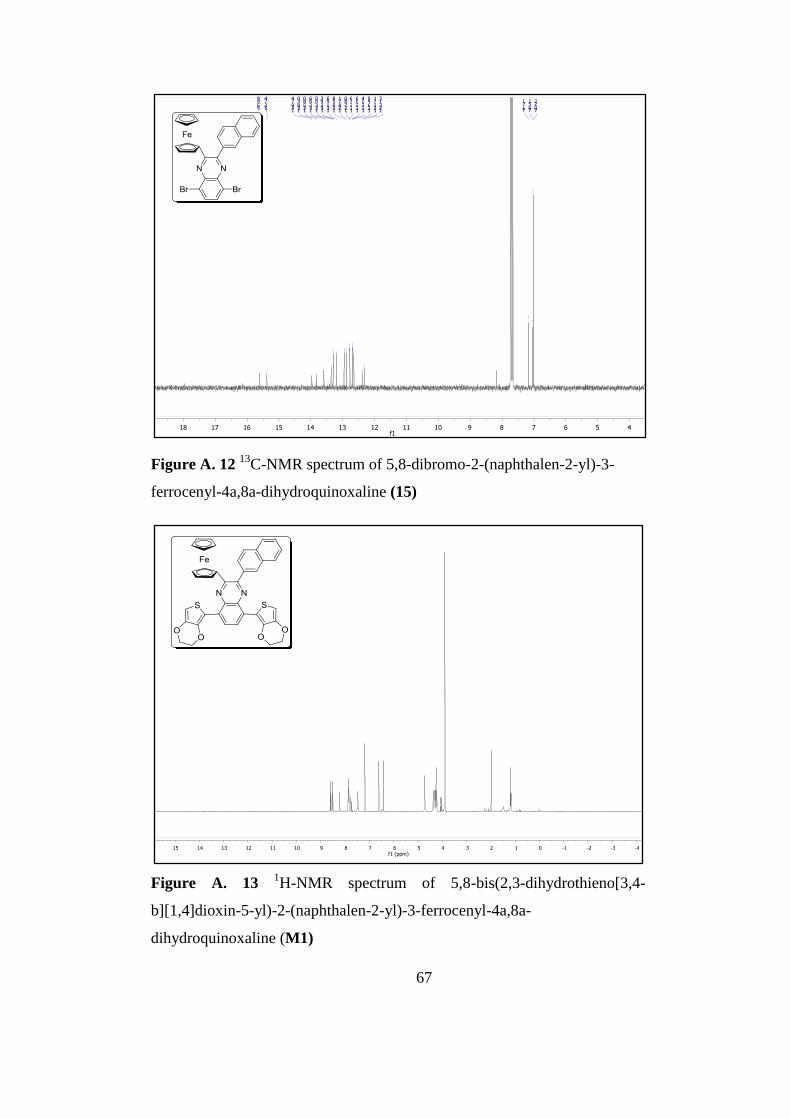
67
-4 -3 -2 -1 0 1 2 3 4 5 6 7 8 9 10 11 12 13 14 15 f1 (ppm)
40
50
60
70
80
90
100
110
120
130
140
150
160
170
180 f1
(ppm)
7 0 . 2 2
7 0 . 5 1
7 1 . 7 1
1 2 3 . 1 3
1 2 3 . 7 1
1 2 6 . 4 8
1 2 7 . 0 4
1 2 7 . 0 6
1 2 7 . 7 6
1 2 7 . 8 0
1 2 8 . 7 1
1 2 9 . 5 8
1 3 1 . 9 6
1 3 2 . 9 3
1 3 3 . 0 0
1 3 3 . 6 6
1 3 5 . 8 0
1 3 8 . 3 0
1 3 9 . 7 4
1 5 3 . 7 4
1 5 5 . 9 9
Figure A. 12 13
C-NMR spectrum of 5,8-dibromo-2-(naphthalen-2-yl)-3-
ferrocenyl-4a,8a-dihydroquinoxaline (15)
Figure A. 13 1H-NMR spectrum of 5,8-bis(2,3-dihydrothieno[3,4-
b][1,4]dioxin-5-yl)-2-(naphthalen-2-yl)-3-ferrocenyl-4a,8a-
dihydroquinoxaline (M1)
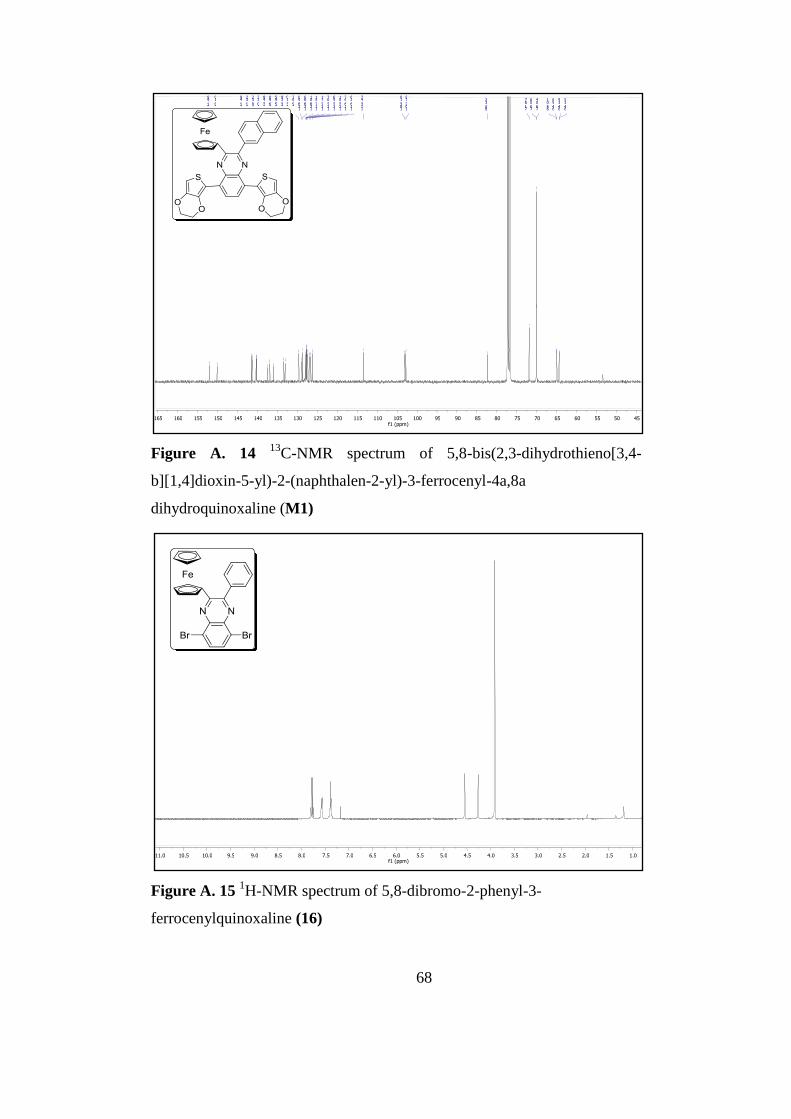
68
1.0 1.5 2.0 2.5 3.0 3.5 4.0 4.5 5.0 5.5 6.0 6.5 7.0 7.5 8.0 8.5 9.0 9.5 10.0 10.5 11.0 f1 (ppm)
45 50 55 60 65 70 75 80 85 90 95 100 105 110 115 120 125 130 135 140 145 150 155 160 165 f1 (ppm)
6 4 . 3 5
6 4 . 3 9
6 4 . 9 6
6 5 . 0 1
7 0 . 0 4
7 0 . 0 6
7 1 . 8 7
8 2 . 3 2
1 0 2 . 7 8
1 0 3 . 1 0
1 1 3 . 4 7
1 2 6 . 2 6
1 2 6 . 6 7
1 2 7 . 0 1
1 2 7 . 5 6
1 2 7 . 6 7
1 2 7 . 7 1
1 2 7 . 8 1
1 2 8 . 0 1
1 2 8 . 6 6
1 2 8 . 9 0
1 2 9 . 6 3
1 3 3 . 1 0
1 3 3 . 3 9
1 3 5 . 9 5
1 3 6 . 9 0
1 3 7 . 4 8
1 4 0 . 2 3
1 4 0 . 3 2
1 4 1 . 3 2
1 4 1 . 4 9
1 5 0 . 1 0
1 5 1 . 9 9
Figure A. 14 13
C-NMR spectrum of 5,8-bis(2,3-dihydrothieno[3,4-
b][1,4]dioxin-5-yl)-2-(naphthalen-2-yl)-3-ferrocenyl-4a,8a
dihydroquinoxaline (M1)
Figure A. 15 1H-NMR spectrum of 5,8-dibromo-2-phenyl-3-
ferrocenylquinoxaline (16)
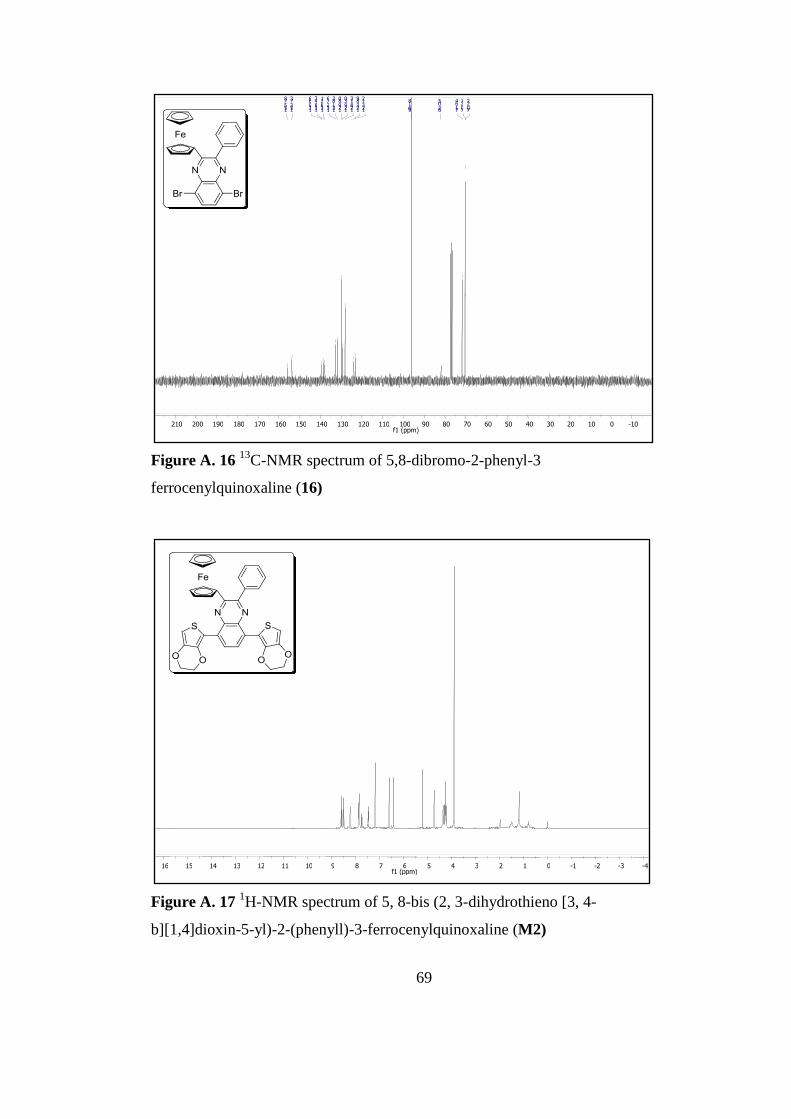
69
-4 -3 -2 -1 0 1 2 3 4 5 6 7 8 9 10 11 12 13 14 15 16 f1 (ppm)
-10 0 10 20 30 40 50 60 70 80 90 100 110 120 130 140 150 160 170 180 190 200 210 f1 (ppm)
7 0 . 2 2
7 0 . 2 7
7 1 . 6 4
8 2 . 0 5
9 6 . 1 8
1 2 3 . 1 2
1 2 3 . 8 9
1 2 8 . 1 3
1 2 9 . 3 0
1 2 9 . 8 0
1 3 1 . 8 2
1 3 2 . 7 6
1 3 8 . 2 1
1 3 8 . 4 7
1 3 9 . 6 6
1 5 3 . 7 3
1 5 5 . 7 8
Figure A. 16 13
C-NMR spectrum of 5,8-dibromo-2-phenyl-3
ferrocenylquinoxaline (16)
Figure A. 17 1H-NMR spectrum of 5, 8-bis (2, 3-dihydrothieno [3, 4-
b][1,4]dioxin-5-yl)-2-(phenyll)-3-ferrocenylquinoxaline (M2)
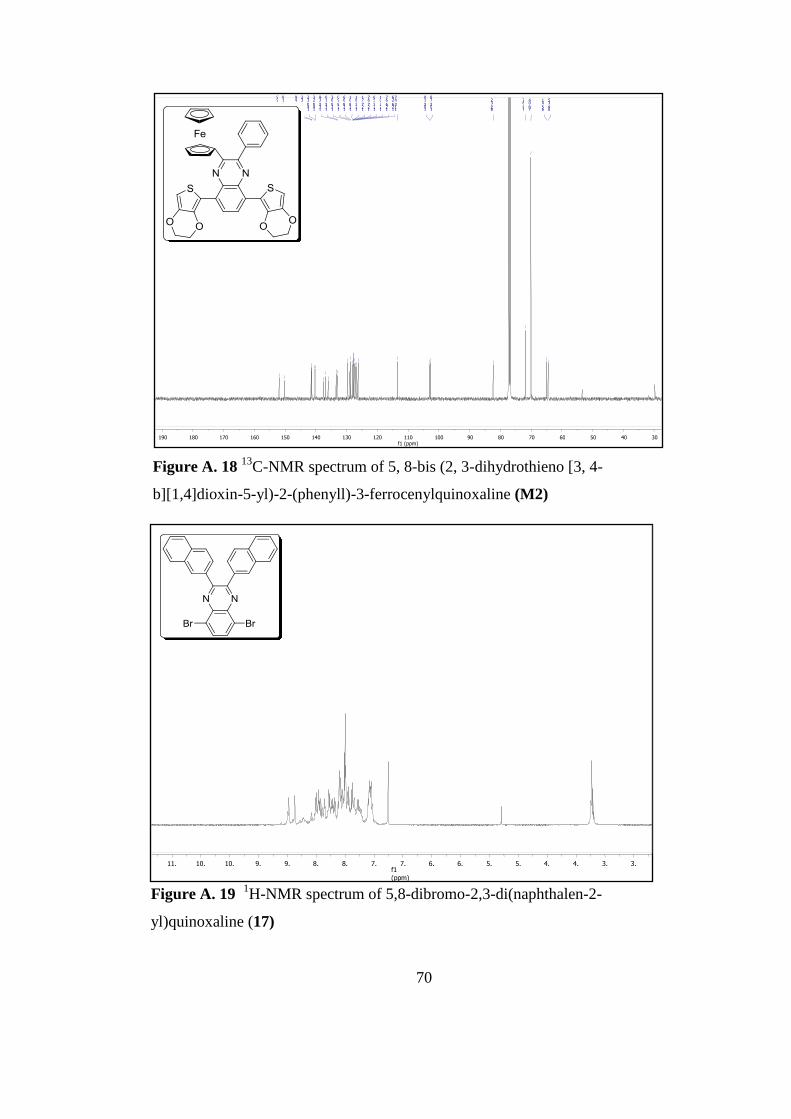
70
3.0
3.5
4.0
4.5
5.0
5.5
6.0
6.5
7.0
7.5
8.0
8.5
9.0
9.5
10.0
10.5
11.0 f1
(ppm)
30 40 50 60 70 80 90 100 110 120 130 140 150 160 170 180 190 f1 (ppm)
6 4 . 3 5
6 5 . 0 1
7 0 . 0 4
7 1 . 8 7
8 2 . 3 2
1 0 2 . 7 8
1 0 3 . 1 0
1 1 3 . 4 7
1 2 6 . 2 6
1 2 6 . 6 7
1 2 7 . 0 1
1 2 7 . 5 6
1 2 7 . 6 7
1 2 7 . 7 1
1 2 7 . 8 1
1 2 8 . 0 1
1 2 8 . 6 6
1 2 8 . 9 0
1 2 9 . 6 3
1 3 3 . 1 0
1 3 3 . 3 9
1 4 0 . 2 3
1 4 0 . 3 2
1 4 1 . 3 2
1 4 1 . 4 9
1 5 0 . 1 0
1 5 1 . 9 9
Figure A. 18 13
C-NMR spectrum of 5, 8-bis (2, 3-dihydrothieno [3, 4-
b][1,4]dioxin-5-yl)-2-(phenyll)-3-ferrocenylquinoxaline (M2)
Figure A. 19 1H-NMR spectrum of 5,8-dibromo-2,3-di(naphthalen-2-
yl)quinoxaline (17)
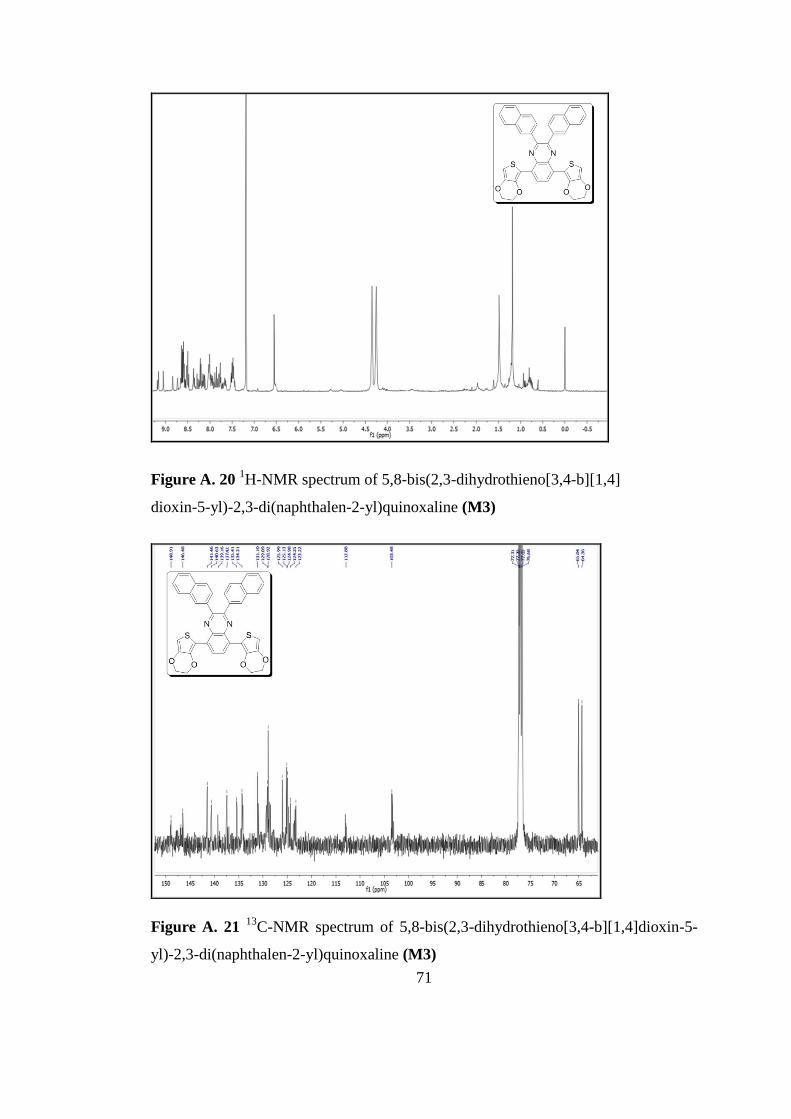
71
Figure A. 20 1H-NMR spectrum of 5,8-bis(2,3-dihydrothieno[3,4-b][1,4]
dioxin-5-yl)-2,3-di(naphthalen-2-yl)quinoxaline (M3)
Figure A. 21 13
C-NMR spectrum of 5,8-bis(2,3-dihydrothieno[3,4-b][1,4]dioxin-5-
yl)-2,3-di(naphthalen-2-yl)quinoxaline (M3)