Embed Size (px)
Citation preview
ANL/LWRS-15/01
System-Level Heat Transfer Analysis, Thermal-
Mechanical Cyclic Stress Analysis, and
Environmental Fatigue Modeling of a Two-Loop
Pressurized Water Reactor: A Preliminary Study
Nuclear Engineering Division
About Argonne National Laboratory
Argonne is a U.S. Department of Energy laboratory managed by UChicago Argonne, LLC
under contract DE-AC02-06CH11357. The Laboratory’s main facility is outside Chicago,
at 9700 South Cass Avenue, Argonne, Illinois 60439. For information about Argonne
and its pioneering science and technology programs, see www.anl.gov.
DOCUMENT AVAILABILITY
Online Access: U.S. Department of Energy (DOE) reports produced after 1991 and a
growing number of pre-1991 documents are available free via DOE’s SciTech Connect
(http://www.osti.gov/scitech/)
Reports not in digital format may be purchased by the public from the
National Technical Information Service (NTIS):
U.S. Department of Commerce
National Technical Information Service
5301 Shawnee Rd
Alexandria, VA 22312
www.ntis.gov
Phone: (800) 553-NTIS (6847) or (703) 605-6000
Fax: (703) 605-6900
Email: [email protected]
Reports not in digital format are available to DOE and DOE contractors from the
Office of Scientific and Technical Information (OSTI):
U.S. Department of Energy
Office of Scientific and Technical Information
P.O. Box 62
Oak Ridge, TN 37831-0062
www.osti.gov
Phone: (865) 576-8401
Fax: (865) 576-5728
Email: [email protected]
Disclaimer
This report was prepared as an account of work sponsored by an agency of the United States Government. Neither the United States
Government nor any agency thereof, nor UChicago Argonne, LLC, nor any of their employees or officers, makes any warranty, express
or implied, or assumes any legal liability or responsibility for the accuracy, completeness, or usefulness of any information, apparatus,
product, or process disclosed, or represents that its use would not infringe privately owned rights. Reference herein to any specific
commercial product, process, or service by trade name, trademark, manufacturer, or otherwise, does not necessarily constitute or imply
its endorsement, recommendation, or favoring by the United States Government or any agency thereof. The views and opinions of
document authors expressed herein do not necessarily state or reflect those of the United States Government or any agency thereof,
Argonne National Laboratory, or UChicago Argonne, LLC.
ANL/LWRS-15/01
System-Level Heat Transfer Analysis, Thermal-Mechanical Cyclic Stress Analysis, and Environmental Fatigue Modeling of a Two-Loop Pressurized Water Reactor: A Preliminary Study
Subhasish Mohanty, William Soppet, Saurin Majumdar, and Ken Natesan
Nuclear Engineering Division, Argonne National Laboratory
April 2015

This page intentionally left blank
System-Level Heat Transfer Analysis, Thermal-Mechanical Cyclic Stress Analysis, and Environmental Fatigue Modeling of a Two-Loop Pressurized Water Reactor: A Preliminary Study April 2015
ANL/LWRS-15/01
i
ABSTRACT
This report provides an update on an assessment of environmentally assisted fatigue for light
water reactor components under extended service conditions. This report is a deliverable in
April 2015 under the work package for environmentally assisted fatigue under DOE’s Light
Water Reactor Sustainability program. In this report, updates are discussed related to a system-
level preliminary finite element model of a two-loop pressurized water reactor (PWR). Based on
this model, system-level heat transfer analysis and subsequent thermal-mechanical stress analysis
were performed for typical design-basis thermal-mechanical fatigue cycles. The in-air fatigue
lives of components, such as the hot and cold legs, were estimated on the basis of stress analysis
results, ASME in-air fatigue life estimation criteria, and fatigue design curves. Furthermore,
environmental correction factors and associated PWR environment fatigue lives for the hot and
cold legs were estimated by using estimated stress and strain histories and the approach
described in NUREG-6909. The discussed models and results are very preliminary. Further
advancement of the discussed model is required for more accurate life prediction of reactor
components. This report only presents the work related to finite element modelling activities.
However, in between multiple tensile and fatigue tests were conducted. The related experimental
results will be presented in the year-end report.

System-Level Heat Transfer Analysis, Thermal-Mechanical Cyclic Stress Analysis, and Environmental Fatigue Modeling of a Two-
Loop Pressurized Water Reactor: A Preliminary Study
April 2015
ANL/LWRS-15/01 ii
This page intentionally left blank
System-Level Heat Transfer Analysis, Thermal-Mechanical Cyclic Stress Analysis, and Environmental Fatigue Modeling of a Two-Loop Pressurized Water Reactor: A Preliminary Study April 2015
ANL/LWRS-15/01
iii
TABLE OF CONTENTS
System-Level Heat Transfer Analysis, Thermal-Mechanical Cyclic Stress Analysis, and Environmental Fatigue Modeling of a Two-Loop Pressurized Water Reactor: A Preliminary Study i
Abstract i
Table of Contents iii
List of Figures iv
List of Tables vii
Abbreviations viii
Acknowledgments ix
1 Introduction 1
2 Finite Element Modeling 3
2.1 System level 3-D solid model ......................................................................................... 3
2.2 Finite element mesh ........................................................................................................ 5
2.3 Heat transfer model ......................................................................................................... 7
2.4 Structural analysis cases ............................................................................................... 10
2.5 Material properties for heat transfer and structural analysis model .............................. 10
3 Results of Heat Transfer Analysis 14
3.1 Selection of artificial convective heat transfer coefficient ........................................... 14
3.2 Linear versus quadratic heat transfer elements ............................................................. 15
3.3 Representative heat transfer analysis results ................................................................. 16
4 Results of Thermal-Mechanical Stress Analysis 24
5 Environmental Fatigue Life Estimation for Example Components 31
6 Summary and Future Study 34
System-Level Heat Transfer Analysis, Thermal-Mechanical Cyclic Stress Analysis, and Environmental Fatigue Modeling of a Two-
Loop Pressurized Water Reactor: A Preliminary Study
April 2015
ANL/LWRS-15/01 iv
LIST OF FIGURES
Figure 2.1 Assembly-level 3-D solid model of a two-loop PWR ............................................... 3
Figure 2.2 Quarter assembly showing ID surface of different components ............................... 4
Figure 2.3 Full system-level FE mesh of two-loop PWR ........................................................... 6
Figure 2.4 Quarter section FE mesh of two-loop PWR showing ID surface .............................. 6
Figure 2.5 Temperature and pressure boundary conditions applied to the ID surfaces of
RPV and hot leg ........................................................................................................... 8
Figure 2.6 Temperature and pressure boundary conditions applied to the ID surfaces of cold
leg ................................................................................................................................. 8
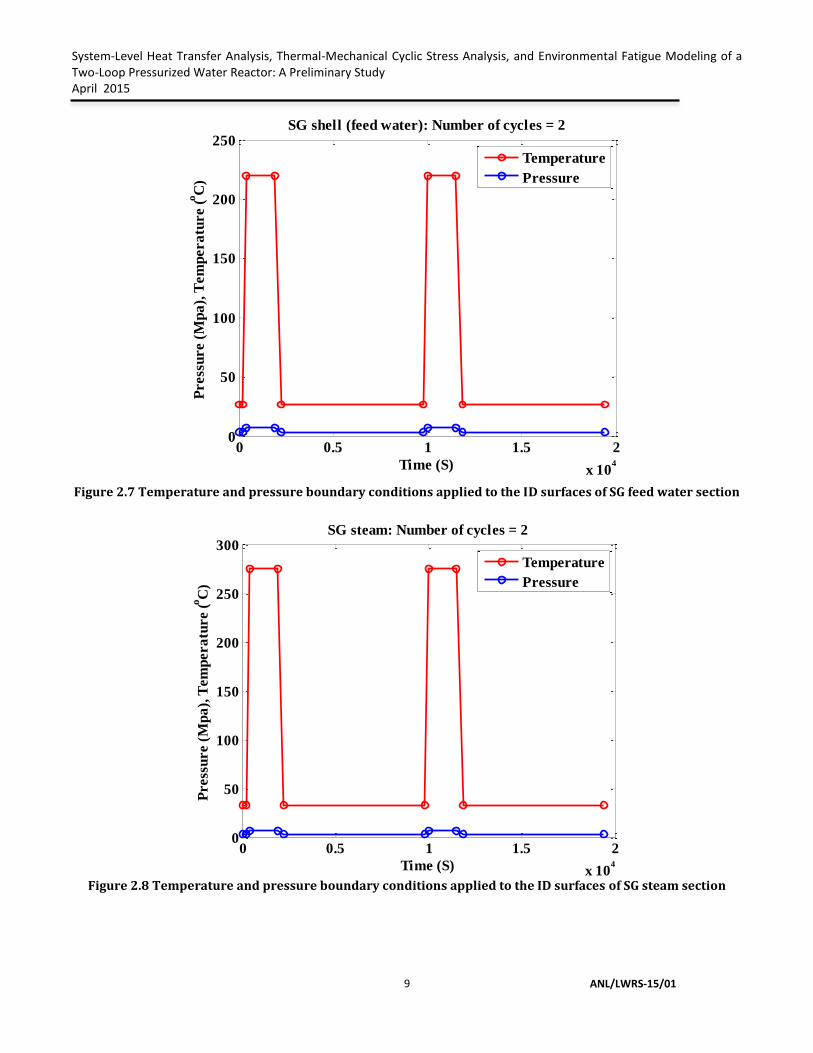
Figure 2.7 Temperature and pressure boundary conditions applied to the ID surfaces of SG
feed water section ........................................................................................................ 9
Figure 2.8 Temperature and pressure boundary conditions applied to the ID surfaces of SG
steam section ................................................................................................................ 9
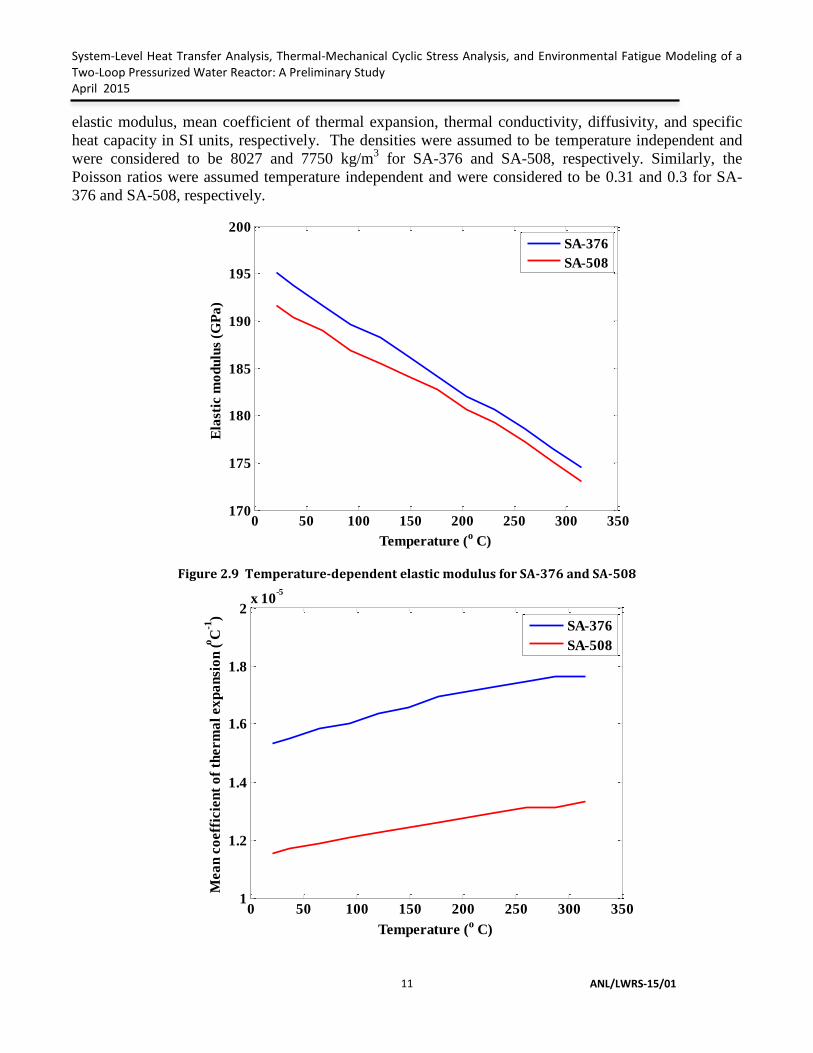
Figure 2.9 Temperature-dependent elastic modulus for SA-376 and SA-508 ......................... 11
Figure 2.10 Temperature-dependent mean coefficient of thermal expansion for SA-376 and
SA-508 ....................................................................................................................... 12
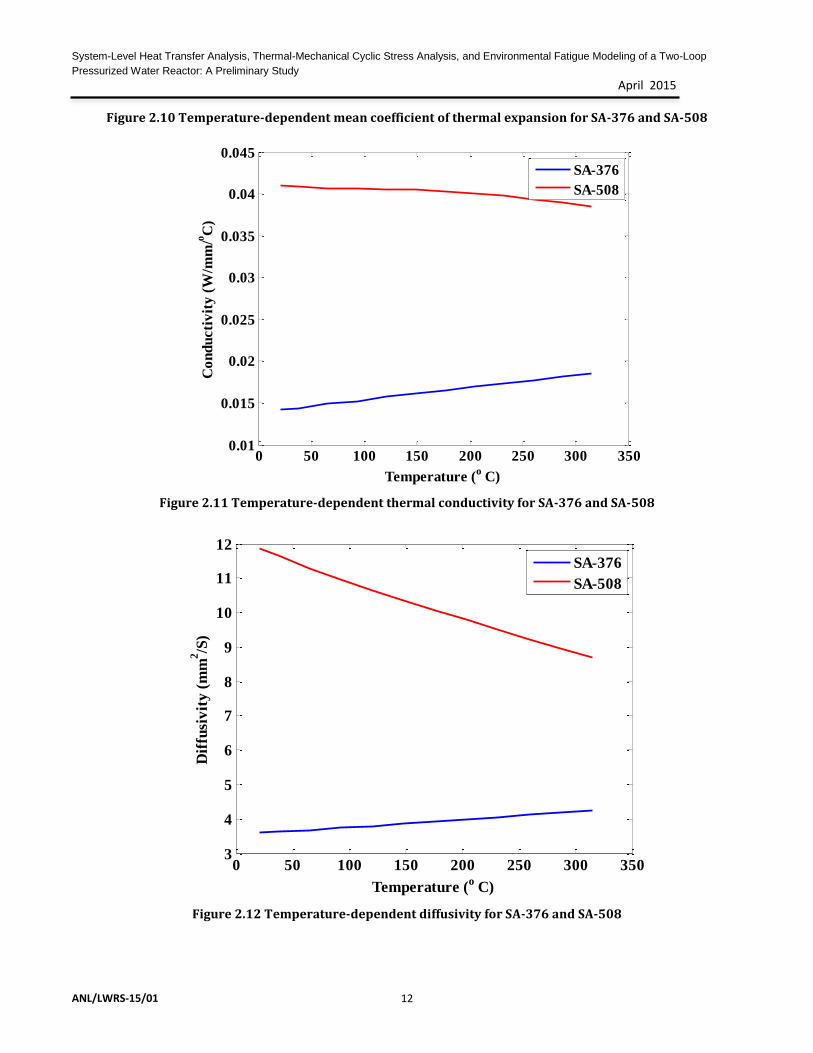
Figure 2.11 Temperature-dependent thermal conductivity for SA-376 and SA-508 ............... 12
Figure 2.12 Temperature-dependent diffusivity for SA-376 and SA-508 ................................ 12
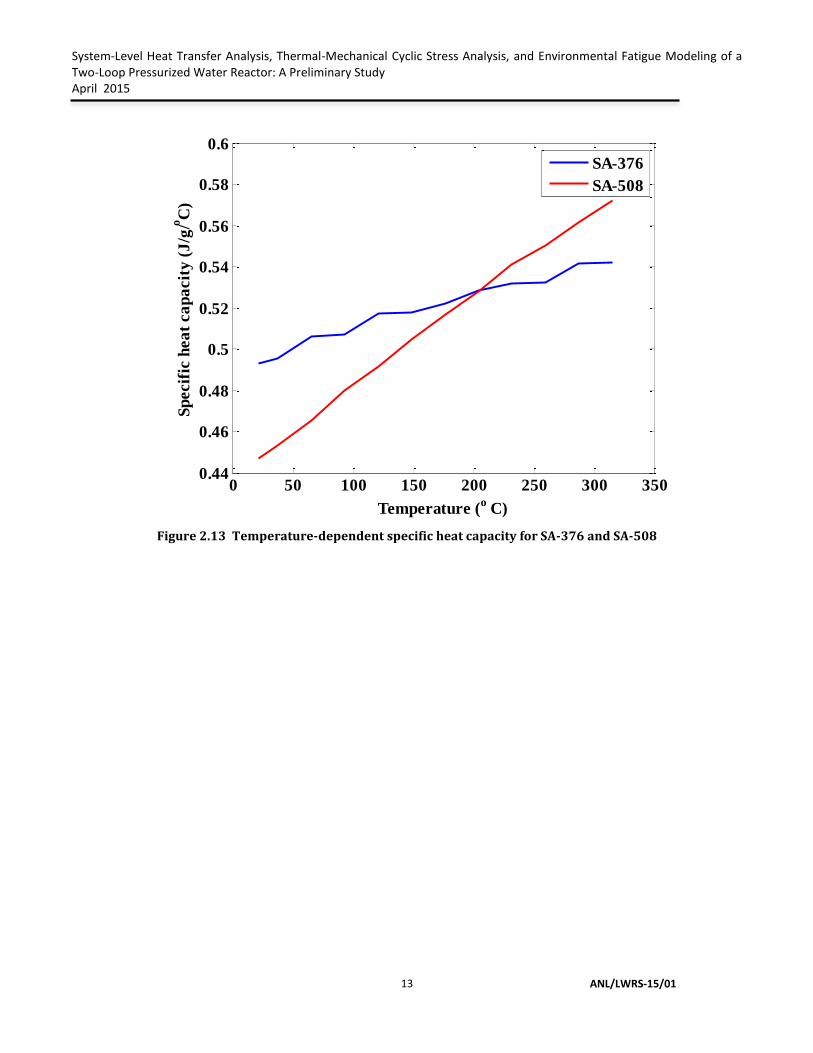
Figure 2.13 Temperature-dependent specific heat capacity for SA-376 and SA-508 ............. 13
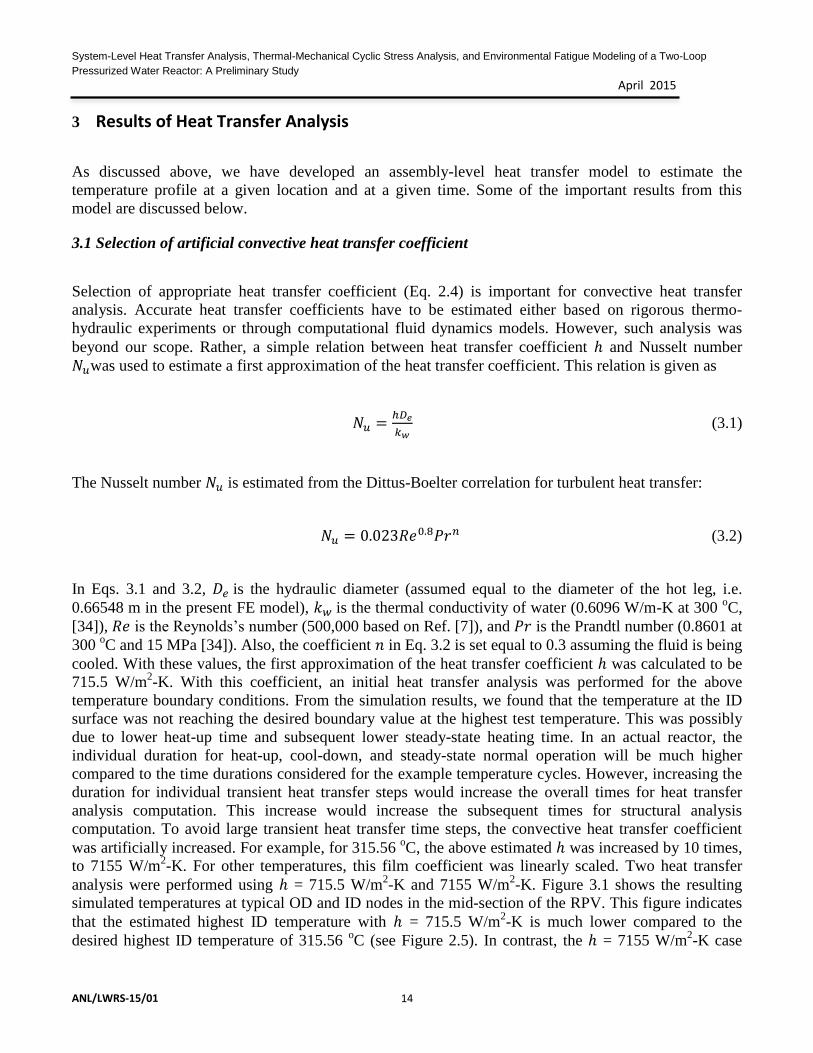
Figure 3.1 Simulated temperature at RPV mid-section OD and ID for different heat transfer
coefficients ................................................................................................................. 15
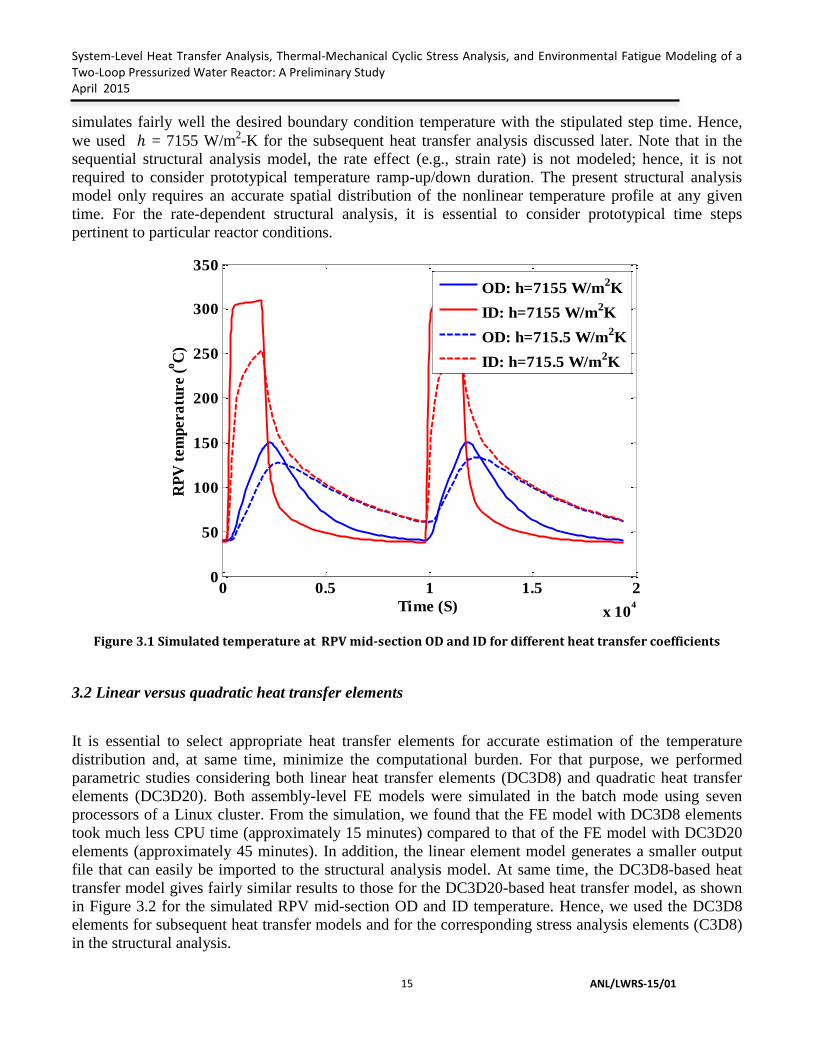
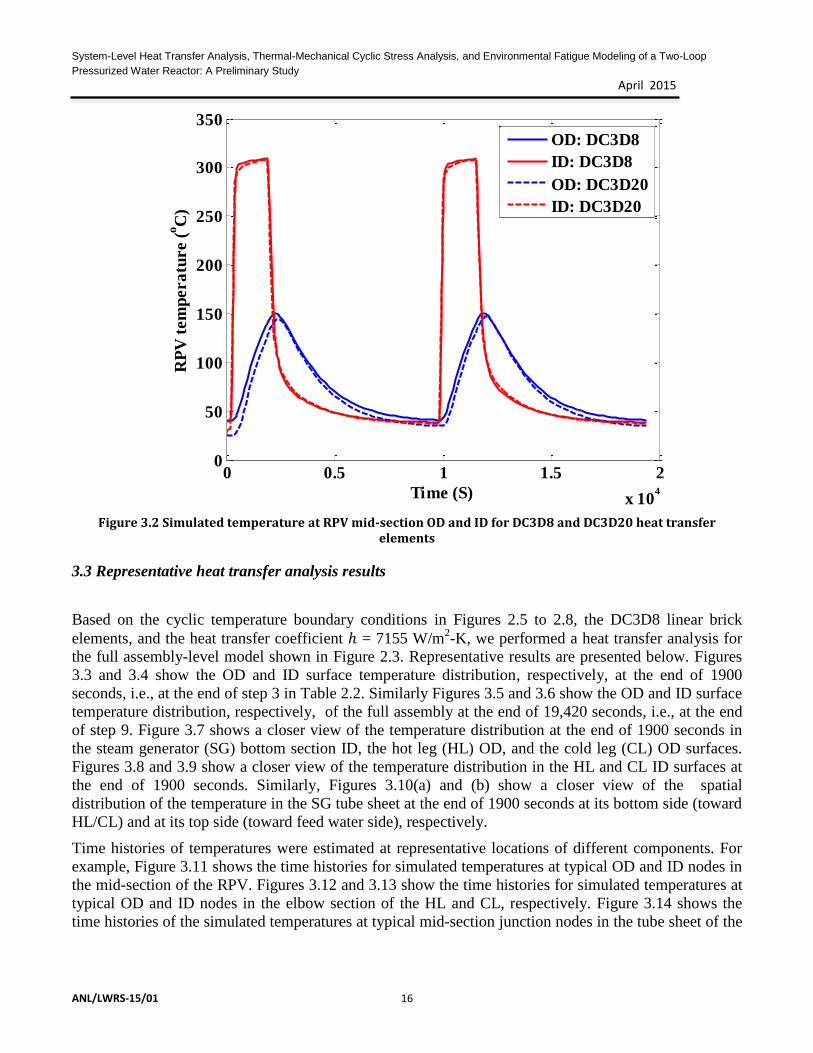
Figure 3.2 Simulated temperature at RPV mid-section OD and ID for DC3D8 and DC3D20
heat transfer elements ................................................................................................ 16
Figure 3.3 Distribution of OD surface temperature of full assembly at the end of 1900 sec ... 17
Figure 3.4 Distribution of ID surface temperature of full assembly at the end of 1900 sec ..... 17
Figure 3.5 Distribution of OD surface temperature of full assembly at the end of 19,420 sec 18
Figure 3.6 Distribution of ID surface temperature of full assembly at the end of 19,420 sec . 18
Figure 3.7 Closer view of spatial distribution of temperature in SG bottom section ID, HL
OD, and CL OD surfaces at the end of 1900 sec ....................................................... 19
Figure 3.8 Closer view of spatial distribution of temperature in ID surface of HL at the end
of 1900 sec ................................................................................................................. 19
Figure 3.9 Closer view of spatial distribution of temperature in ID surface of CL at the end
of 1900 sec ................................................................................................................. 20
Figure 3.10 Closer view of spatial distribution of temperature in SG tube sheet at the end of
1900 sec at (a) bottom side (toward HL/CL) and (b) top side (toward feed water
side) ............................................................................................................................ 20
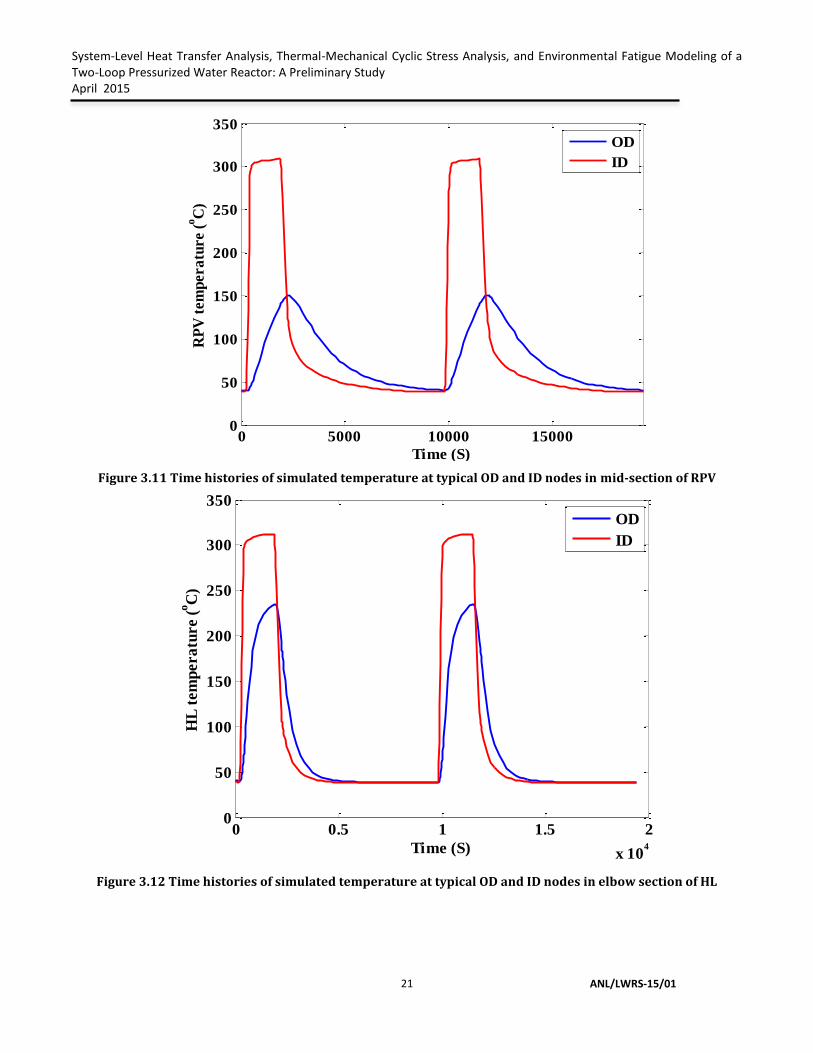
Figure 3.11 Time histories of simulated temperature at typical OD and ID nodes in mid-
section of RPV ........................................................................................................... 21
System-Level Heat Transfer Analysis, Thermal-Mechanical Cyclic Stress Analysis, and Environmental Fatigue Modeling of a Two-Loop Pressurized Water Reactor: A Preliminary Study April 2015
ANL/LWRS-15/01
v
Figure 3.12 Time histories of simulated temperature at typical OD and ID nodes in elbow
section of HL.............................................................................................................. 21
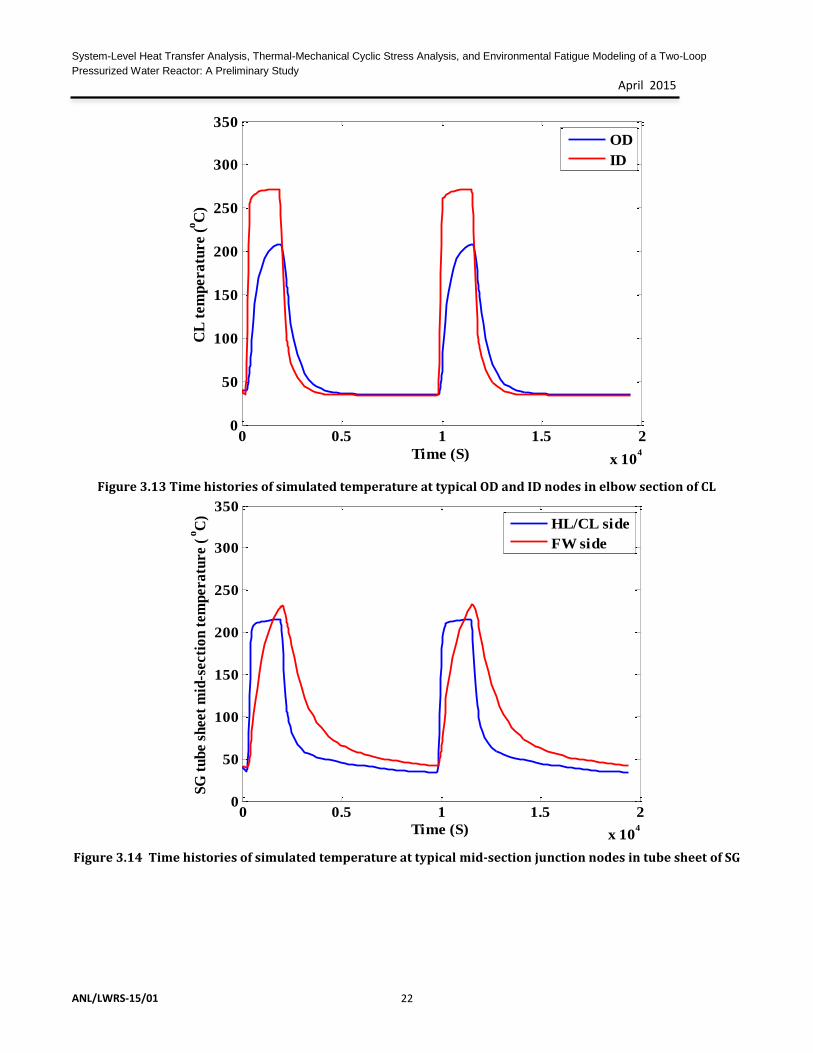
Figure 3.13 Time histories of simulated temperature at typical OD and ID nodes in elbow
section of CL .............................................................................................................. 22
Figure 3.14 Time histories of simulated temperature at typical mid-section junction nodes in
tube sheet of SG ......................................................................................................... 22
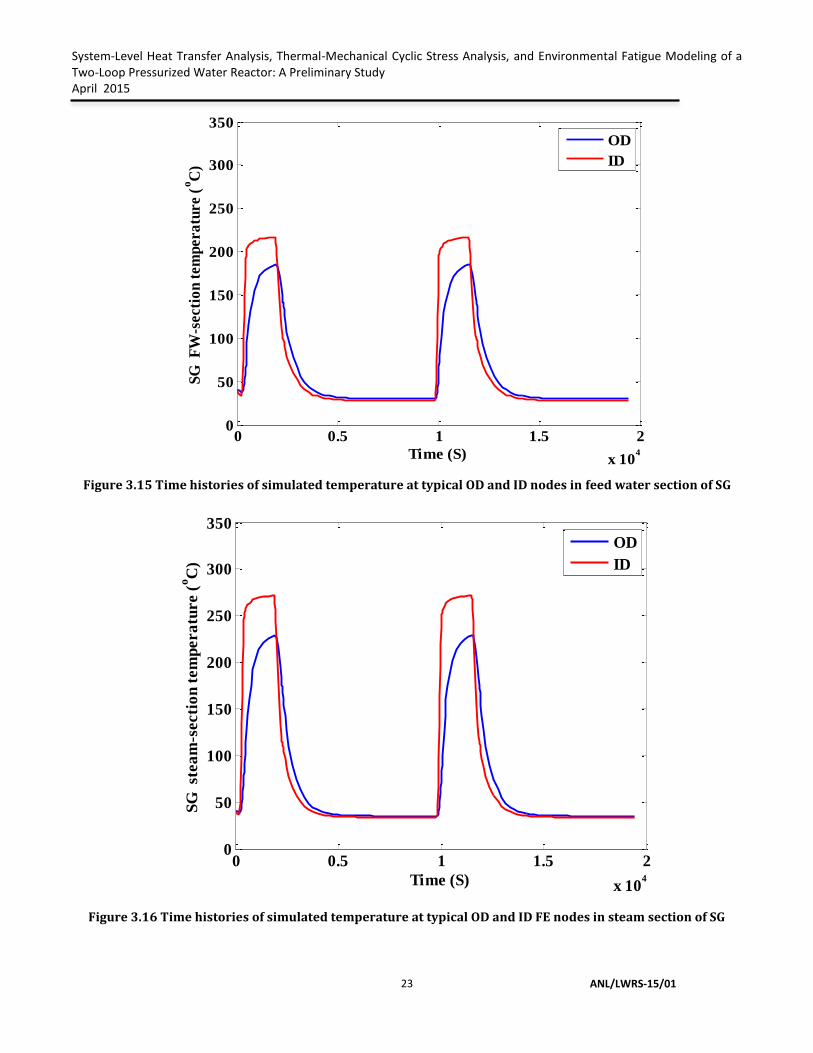
Figure 3.15 Time histories of simulated temperature at typical OD and ID nodes in feed
water section of SG .................................................................................................... 23
Figure 3.16 Time histories of simulated temperature at typical OD and ID FE nodes in steam
section of SG .............................................................................................................. 23
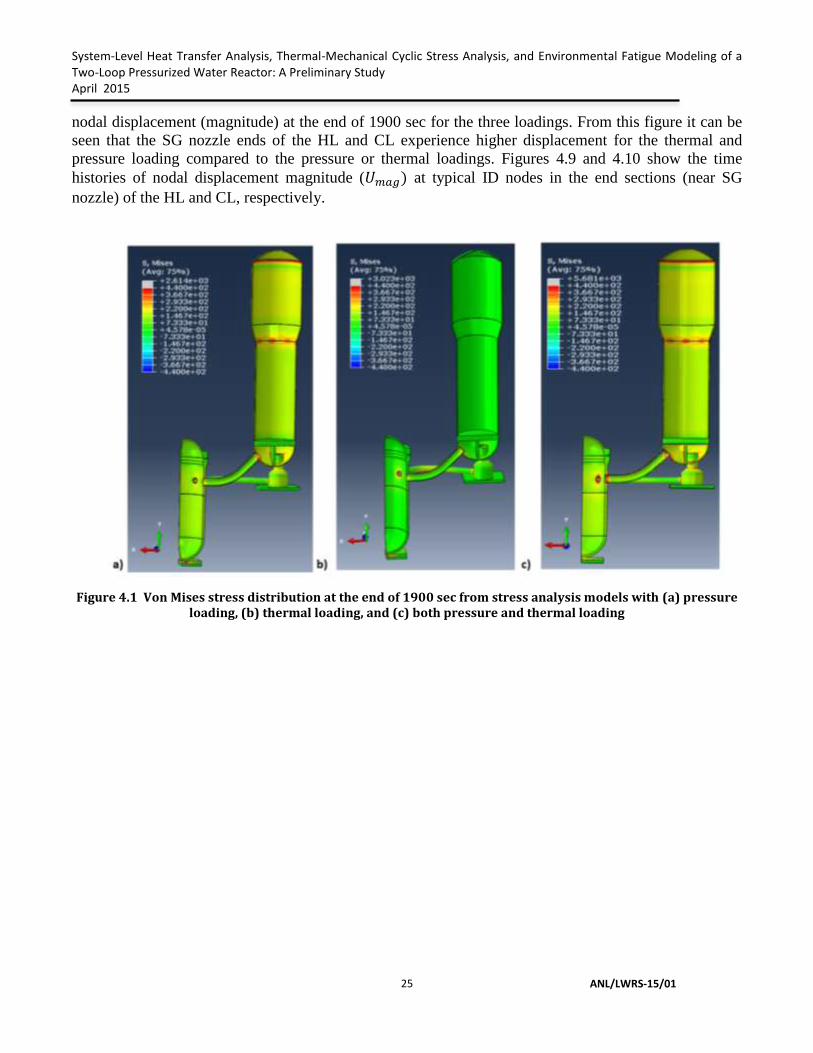
Figure 4.1 Von Mises stress distribution at the end of 1900 sec from stress analysis models
with (a) pressure loading, (b) thermal loading, and (c) both pressure and thermal
loading........................................................................................................................ 25
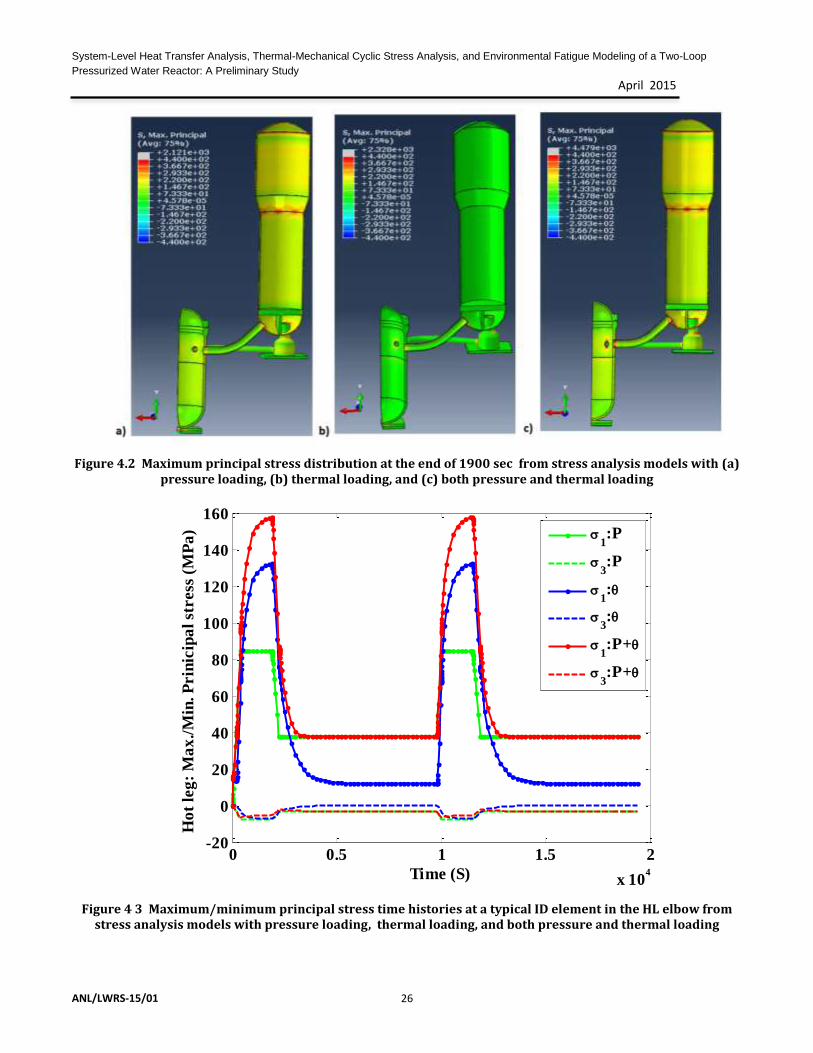
Figure 4.2 Maximum principal stress distribution at the end of 1900 sec from stress
analysis models with (a) pressure loading, (b) thermal loading, and (c) both
pressure and thermal loading ..................................................................................... 26
Figure 4 3 Maximum/minimum principal stress time histories at a typical ID element in the
HL elbow from stress analysis models with pressure loading, thermal loading, and
both pressure and thermal loading ............................................................................. 26
Figure 4.4 Maximum/minimum principal stress time histories at a typical ID element in CL
elbow from stress analysis models with pressure loading, thermal loading, and both
pressure and thermal loading ..................................................................................... 27
Figure 4.5 Maximum principal strain distribution at the end of 1900 sec from stress analysis
models with (a) pressure loading, (b) thermal loading, and (c) both pressure and
thermal loading .......................................................................................................... 27
Figure 4.6 Maximum/minimum principal strain time histories at a typical ID element in HL
elbow from stress analysis models with pressure loading, thermal loading, and both
pressure and thermal loading ..................................................................................... 28
Figure 4.7 Maximum/minimum principal strain time histories at a typical ID element in CL
elbow from stress analysis models with pressure loading, thermal loading, and both
pressure and thermal loading ..................................................................................... 28
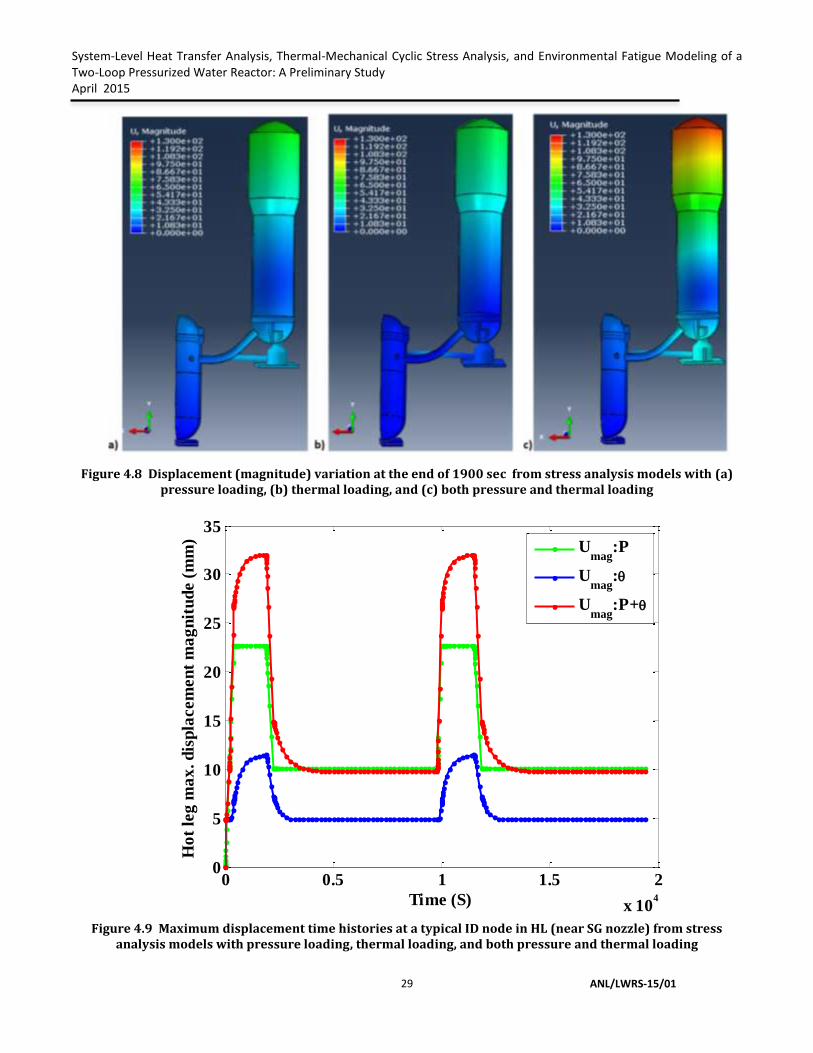
Figure 4.8 Displacement (magnitude) variation at the end of 1900 sec from stress analysis
models with (a) pressure loading, (b) thermal loading, and (c) both pressure and
thermal loading .......................................................................................................... 29
Figure 4.9 Maximum displacement time histories at a typical ID node in HL (near SG
nozzle) from stress analysis models with pressure loading, thermal loading, and
both pressure and thermal loading ............................................................................. 29
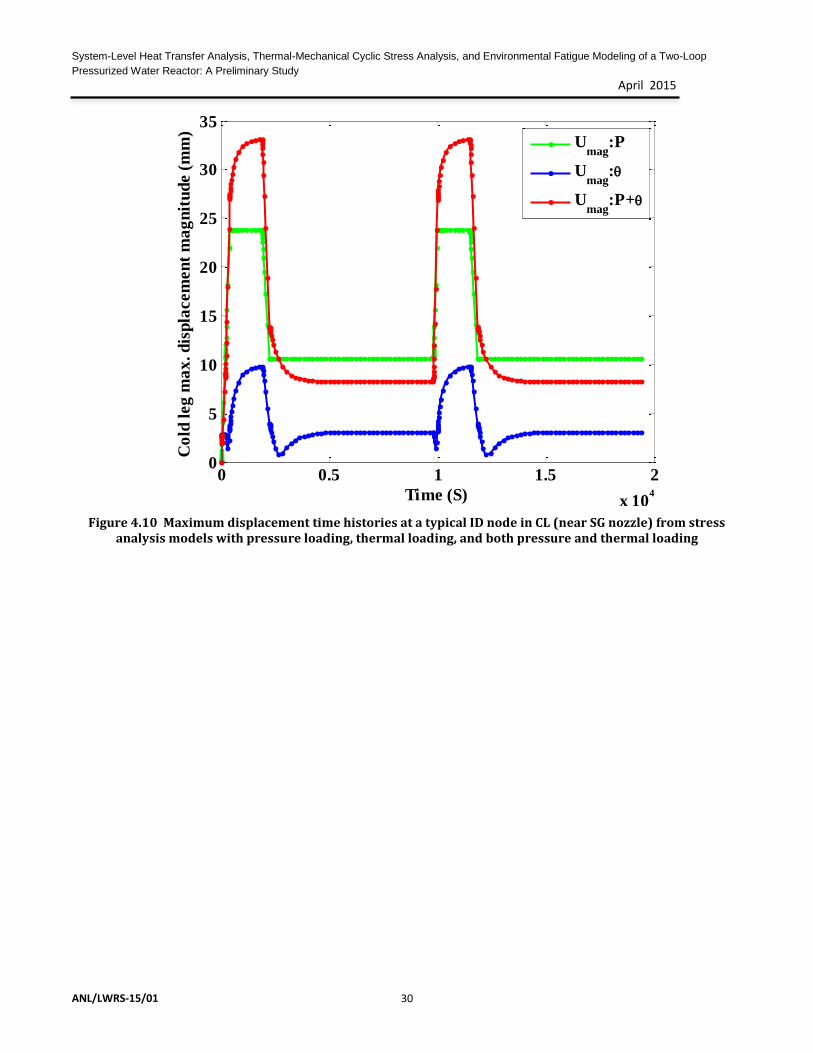
Figure 4.10 Maximum displacement time histories at a typical ID node in CL (near SG
nozzle) from stress analysis models with pressure loading, thermal loading, and
both pressure and thermal loading ............................................................................. 30

System-Level Heat Transfer Analysis, Thermal-Mechanical Cyclic Stress Analysis, and Environmental Fatigue Modeling of a Two-
Loop Pressurized Water Reactor: A Preliminary Study
April 2015
ANL/LWRS-15/01 vi
Figure 5.1 In-air fatigue design curve for austenitic stainless steel (ASME code [35]) ........... 31
System-Level Heat Transfer Analysis, Thermal-Mechanical Cyclic Stress Analysis, and Environmental Fatigue Modeling of a Two-Loop Pressurized Water Reactor: A Preliminary Study April 2015
ANL/LWRS-15/01
vii
LIST OF TABLES
Table 2.1 Number of heat transfer or structural analysis finite elements in PWR assembly
models .......................................................................................................................... 5
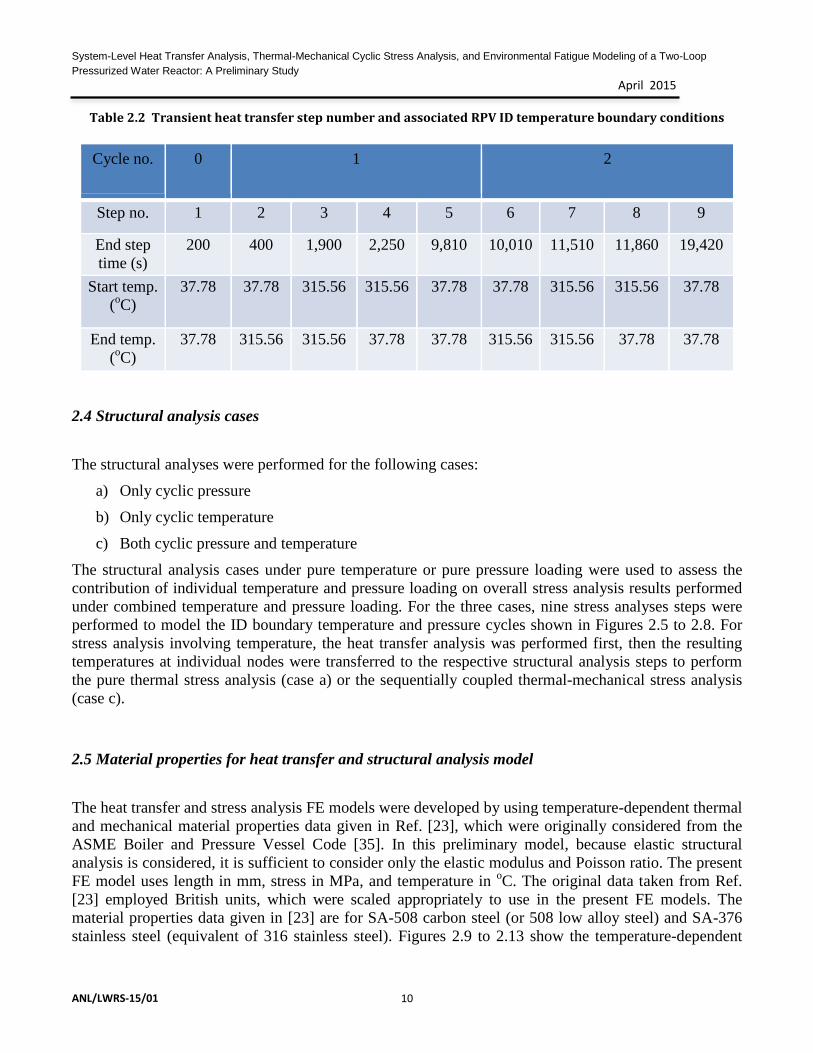
Table 2.2 Transient heat transfer step number and associated RPV ID temperature boundary
conditions ................................................................................................................... 10
Table 5.1 In-air and environmental fatigue lives estimated under different loading conditions
for hot leg ................................................................................................................... 33
Table 5.2 In-air and environmental fatigue lives estimated under different loading conditions
for cold leg ................................................................................................................. 33
System-Level Heat Transfer Analysis, Thermal-Mechanical Cyclic Stress Analysis, and Environmental Fatigue Modeling of a Two-
Loop Pressurized Water Reactor: A Preliminary Study
April 2015
ANL/LWRS-15/01 viii
ABBREVIATIONS
ANL Argonne National Laboratory
CL Cold Leg
DOE Department of Energy
FE Finite Element
FEA Finite Element Analysis
HL Hot Leg
ID Inside Diameter
LOCA Loss of Coolant Accident
LWR Light Water Reactor
LWRS Light Water Reactor Sustainability
OD Outside Diameter
PTS Pressurized Thermal Shock
PWR Pressurized Water Reactor
SCC Stress Corrosion Cracking
SG Steam Generator
SS Stainless Steel
TMF Thermal Mechanical Fatigue

System-Level Heat Transfer Analysis, Thermal-Mechanical Cyclic Stress Analysis, and Environmental Fatigue Modeling of a Two-Loop Pressurized Water Reactor: A Preliminary Study April 2015
ANL/LWRS-15/01
ix
ACKNOWLEDGMENTS
This research was supported through the U.S. Department of Energy’s Light Water Reactor
Sustainability program under the work package of environmental fatigue study, program
manager Dr Jeremy Busby.

System-Level Heat Transfer Analysis, Thermal-Mechanical Cyclic Stress Analysis, and Environmental Fatigue Modeling of a Two-
Loop Pressurized Water Reactor: A Preliminary Study
April 2015
ANL/LWRS-15/01 x
This page intentionally left blank
System-Level Heat Transfer Analysis, Thermal-Mechanical Cyclic Stress Analysis, and Environmental Fatigue Modeling of a Two-Loop Pressurized Water Reactor: A Preliminary Study April 2015
ANL/LWRS-15/01
1
1 Introduction
System-level computer modeling of complex nuclear systems is increasingly becoming a trend due to
the availability of advanced multi-physics computer programs and the increasing use of multiprocessor-
based parallel computing hardware and software. Recently, many works have been published on
thermal-hydraulics simulations of fluid flow and heat transfer in a single reactor component or in a
complex large-scale assembly [1-7]. This type of system-level thermal-hydraulics model helps to better
understand and to accurately predict the fluid flow and heat transfer not only in individual components
but also the overall system and the interaction with each other. Along a similar line, computational
structural mechanics analysis is increasingly being used to perform stress and fracture mechanics
analysis under complex component/assembly-level multi-axial stress states. For example, recent
advances in 3-D finite element analyses (FEA) code and associated improvements in multi-physics
modeling capability (e.g., thermal-mechanical stress analysis) and fracture mechanics simulation
capability allow more accurate 3-D stress and structural integrity analysis of reactor components not
only under combined thermal-mechanical loading but also under multi-axial component/assembly-level
stress states [8-10]. In addition to the above-mentioned multi-physics thermal-mechanical stress
analysis, the present-generation FEA code also allows determination of the effect of other field
variables, such as the effect of neutron dose on the 3D stress state of reactor structural components
[11,12]. Furthermore, advances in FEA tools for 3-D fracture mechanics and crack propagation allow
accurate prediction of the structural integrity of reactor components under severe accident conditions,
such as loss-of-coolant accidents (LOCAs). For example, propagation of preexisting stress corrosion
cracking (SCC) in steam generator tubes and the associated rupture pressure can be predicted accurately
under LOCA [13]. Similarly, in reactor pressure vessels and other primary pressure boundary
components, the effect of pressurized thermal shock (PTS) under severe accident conditions can be
predicted by using 3-D FEA tools [14-19]. Both LOCA and PTS conditions are key elements in the
integrity evaluation of nuclear reactor components and require a multidisciplinary effort to link the
thermal-hydraulic analysis results to structural and fracture mechanics models. In addition to the multi-
physics capability, the current-generation FEA code also allows one to model complex time-dependent
material effects. For example, time-dependent creep damage of the reactor pressure vessel under severe
accident conditions, such as a LOCA, can be more accurately predicted by using component-scale, 3-D
FEA models [20].
The above-mentioned structural analysis examples based on FEA are mostly restricted to a single
component under static or quasi-static transient loading. However, a few studies have been done
involving thermal-mechanical fatigue modeling using system-level 3-D models. Also, at present, most
of the work related to fatigue evaluation in reactor environments is based on stress analysis at the
individual component level combined with estimation of the associated fatigue life using stress/strain
life curves [21-24]. However, as part of the Light Water Reactor Sustainability (LWRS) program
sponsored by the Department of Energy (DOE), Argonne National Laboratory (ANL) is trying to
develop a more mechanistic-based fatigue evaluation approach [25,26] under realistic multi-physics and
multi-axial stress states. Under this program ANL is trying to develop a multi-component finite element
(FE) model for multi-physics and system-level stress analysis and associated fatigue life evaluation
under thermal-mechanical cyclic loading. For the purpose, in the present work, we developed
preliminary FE models for a Westinghouse-type two-loop pressurized water reactor (PWR). Based on

System-Level Heat Transfer Analysis, Thermal-Mechanical Cyclic Stress Analysis, and Environmental Fatigue Modeling of a Two-Loop
Pressurized Water Reactor: A Preliminary Study
April 2015
ANL/LWRS-15/01 2
the FE models, system-level thermal-mechanical fatigue (TMF) analyses were performed. Furthermore,
these TMF results were used for in-air and environmental fatigue life estimation of some key
components such as the reactor cold and hot legs. The related model and calculated results are discussed
below.
System-Level Heat Transfer Analysis, Thermal-Mechanical Cyclic Stress Analysis, and Environmental Fatigue Modeling of a Two-Loop Pressurized Water Reactor: A Preliminary Study April 2015
ANL/LWRS-15/01
3
2 Finite Element Modeling
This section summarizes the 3-D FE models discussed in this report. The FE models were developed
both for heat transfer analysis and for thermal-mechanical cyclic stress analysis.
2.1 System level 3-D solid model
Finite element models were developed for system-level TMF analysis of a Westinghouse-type two-loop
PWR. The models were developed by using commercially available ABAQUS FE software [27]. The
FE models were based on approximate geometry determined from publicly available literatures [28-32].
In the assembly-level model, only major reactor parts such as the pressure vessel, steam generator outer
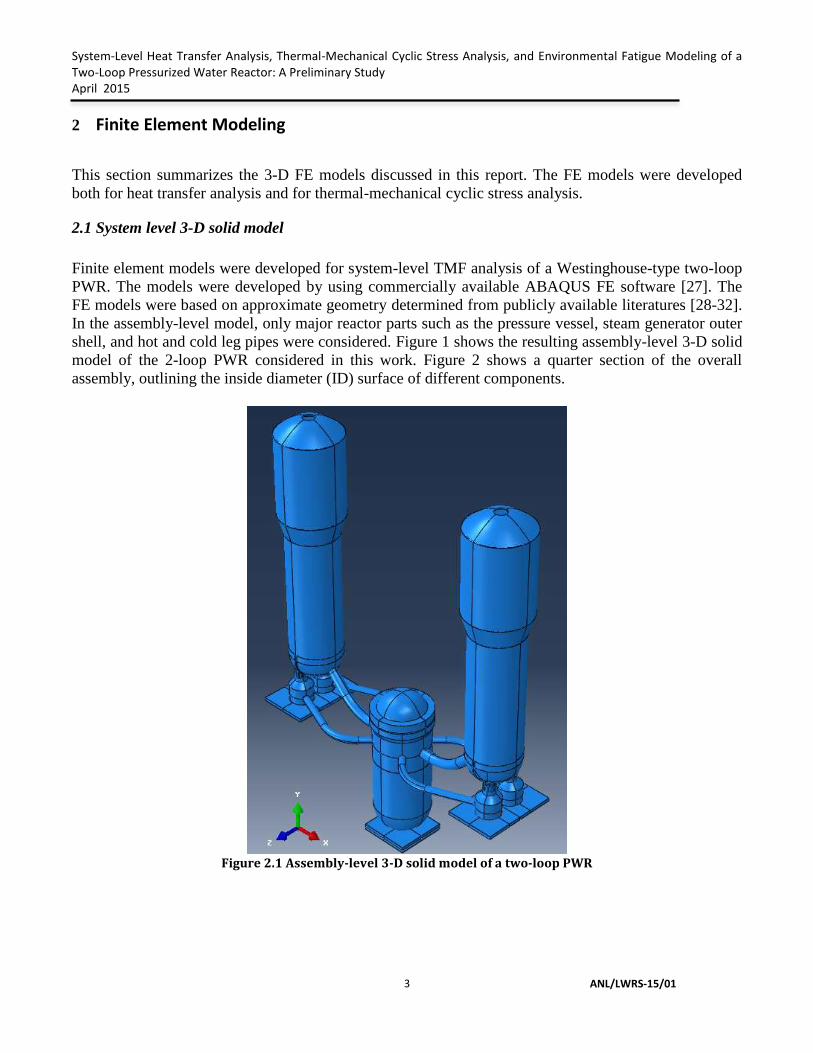
shell, and hot and cold leg pipes were considered. Figure 1 shows the resulting assembly-level 3-D solid
model of the 2-loop PWR considered in this work. Figure 2 shows a quarter section of the overall
assembly, outlining the inside diameter (ID) surface of different components.
Figure 2.1 Assembly-level 3-D solid model of a two-loop PWR
System-Level Heat Transfer Analysis, Thermal-Mechanical Cyclic Stress Analysis, and Environmental Fatigue Modeling of a Two-Loop
Pressurized Water Reactor: A Preliminary Study
April 2015
ANL/LWRS-15/01 4
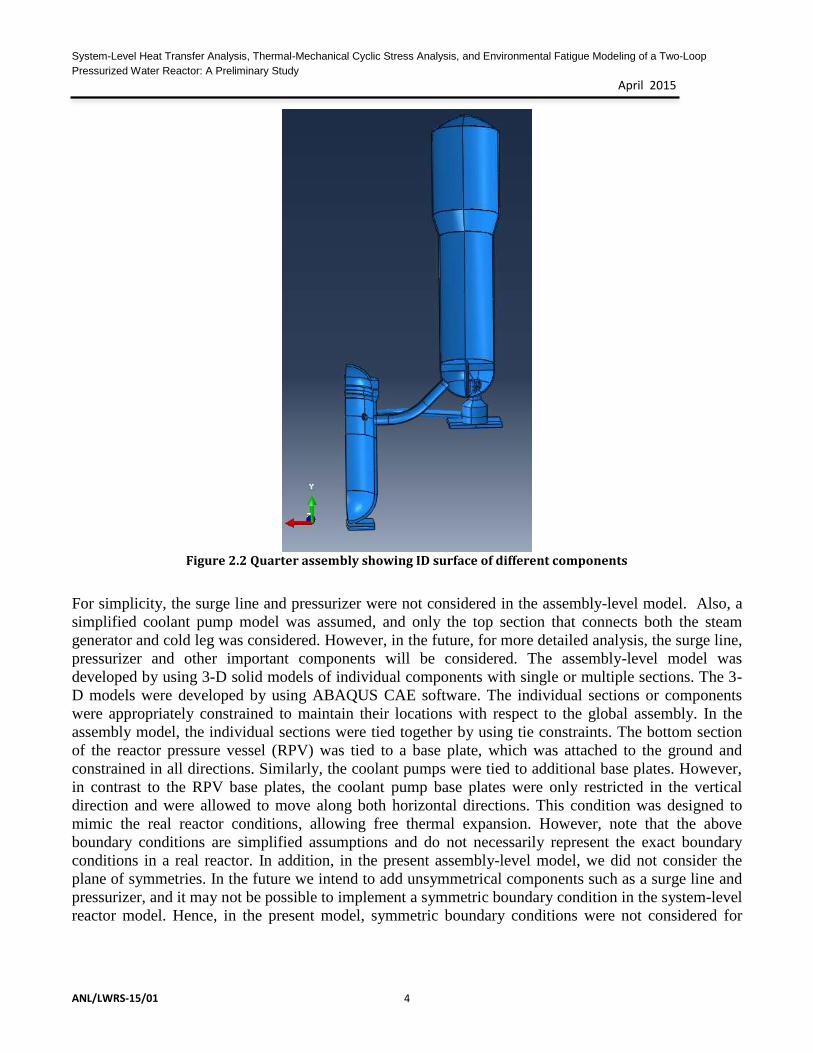
Figure 2.2 Quarter assembly showing ID surface of different components
For simplicity, the surge line and pressurizer were not considered in the assembly-level model. Also, a
simplified coolant pump model was assumed, and only the top section that connects both the steam
generator and cold leg was considered. However, in the future, for more detailed analysis, the surge line,
pressurizer and other important components will be considered. The assembly-level model was
developed by using 3-D solid models of individual components with single or multiple sections. The 3-
D models were developed by using ABAQUS CAE software. The individual sections or components
were appropriately constrained to maintain their locations with respect to the global assembly. In the
assembly model, the individual sections were tied together by using tie constraints. The bottom section
of the reactor pressure vessel (RPV) was tied to a base plate, which was attached to the ground and
constrained in all directions. Similarly, the coolant pumps were tied to additional base plates. However,
in contrast to the RPV base plates, the coolant pump base plates were only restricted in the vertical
direction and were allowed to move along both horizontal directions. This condition was designed to
mimic the real reactor conditions, allowing free thermal expansion. However, note that the above
boundary conditions are simplified assumptions and do not necessarily represent the exact boundary
conditions in a real reactor. In addition, in the present assembly-level model, we did not consider the
plane of symmetries. In the future we intend to add unsymmetrical components such as a surge line and
pressurizer, and it may not be possible to implement a symmetric boundary condition in the system-level
reactor model. Hence, in the present model, symmetric boundary conditions were not considered for

System-Level Heat Transfer Analysis, Thermal-Mechanical Cyclic Stress Analysis, and Environmental Fatigue Modeling of a Two-Loop Pressurized Water Reactor: A Preliminary Study April 2015
ANL/LWRS-15/01
5
possible future amendment. The same assembly-level 3-D model was used for both heat transfer
analysis and subsequent sequential structural analysis.
2.2 Finite element mesh
The individual components in the reactor assembly were FE meshed by using 3-D brick elements. We
chose DC3D8, 8-node linear heat transfer elements to mesh the individual components in the assembly-
level heat transfer models. The corresponding C3D8, 8-node linear elements were used for the stress
analysis models. The assembly has a total of 82762 DC3D8 elements for heat transfer models or C3D8
elements for structural analysis models. Table 2.1 shows the number of elements used for individual
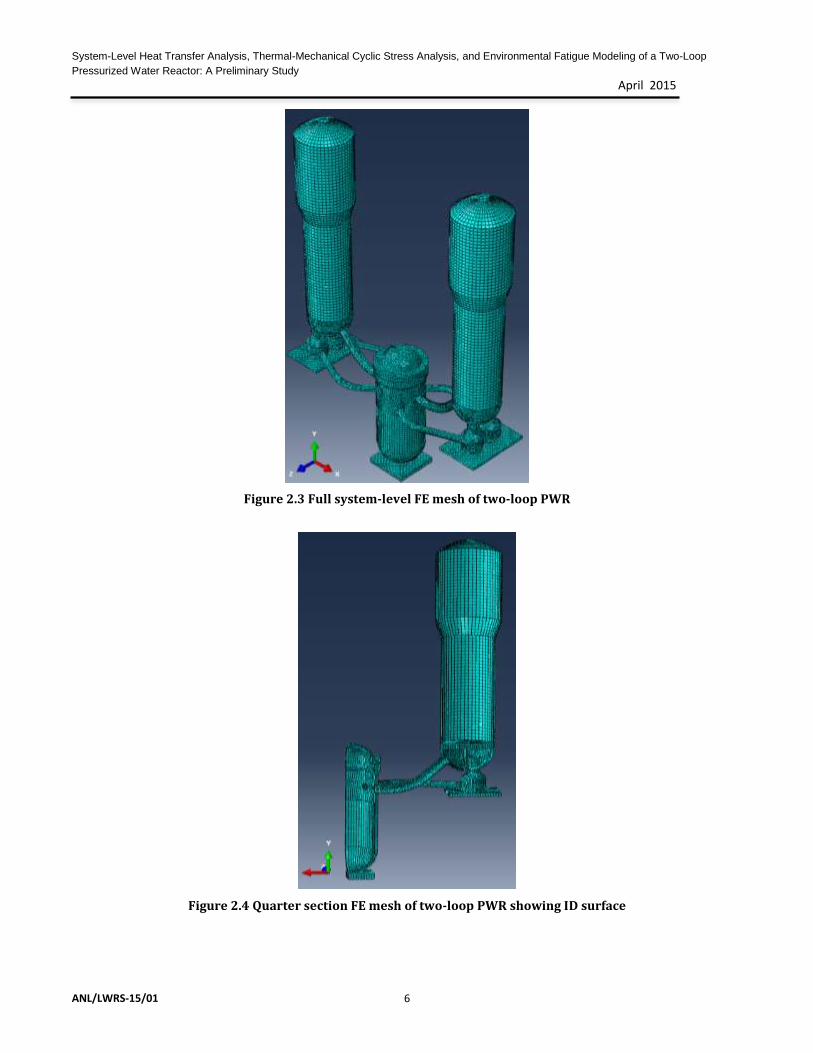
components and the respective material type used in the simulation. Figure 2.3 shows the full assembly-
level FE mesh of the outside diameter (OD) surface, whereas Figure 2.4 shows the quarter section mesh
for the ID surface.
Table 2.1 Number of heat transfer or structural analysis finite elements in PWR assembly models
Component name Total
number of
components
Material type Total number of
DC3D8/C3D8
elements
Pressure vessel 1 SA-508 (LAS) 10806
Steam generator shell 2 SA-508 (LAS) 2x17628 = 35256
Hot leg pipe 2 SA-376 (SS) 2x2014 = 4028
Cold leg pipe 4 SA-376 (SS) 4x3204=12816
Coolant pump 4 SA-376 (SS) 4x4164=16656
RPV base plate 1 Fictitious large stiffness material 800
Coolant pump base plate 4 Fictitious large stiffness material 4x600=2400
Total number of elements in assembly 82762
System-Level Heat Transfer Analysis, Thermal-Mechanical Cyclic Stress Analysis, and Environmental Fatigue Modeling of a Two-Loop
Pressurized Water Reactor: A Preliminary Study
April 2015
ANL/LWRS-15/01 6
Figure 2.3 Full system-level FE mesh of two-loop PWR
Figure 2.4 Quarter section FE mesh of two-loop PWR showing ID surface
System-Level Heat Transfer Analysis, Thermal-Mechanical Cyclic Stress Analysis, and Environmental Fatigue Modeling of a Two-Loop Pressurized Water Reactor: A Preliminary Study April 2015
ANL/LWRS-15/01
7
2.3 Heat transfer model
An uncoupled heat transfer analysis was performed by multiple steps of transient heat transfer analysis.
The heat transfer analysis was performed with ABAQUS software, for which the variational form of the
governing energy balance equation can be given as [27]:
∫ 𝜌�̇�𝑉
𝛿𝜃𝑑𝑉 + ∫𝜕𝛿𝜃
𝜕𝑥𝑉. 𝑘.
𝛿𝜃
𝜕𝑥𝑑𝑉 = ∫ 𝛿𝜃𝑞𝑑𝑆
𝑆 (2.1)
where 𝜌 is density of material, 𝑉 is the volume of solid material with surface area 𝑆, and 𝑞 is the heat
flux per unit area flowing into or out of the body. Also in Eq. 2.1, 𝑈 is the material internal energy,
which can be expressed in terms of the temperature-dependent specific heat 𝑐(𝜃) as:
𝑐(𝜃) =𝑑𝑈
𝑑𝜃 (2.2)
The heat conduction is assumed to be governed by the Fourier law and can be expressed in terms of the
temperature-dependent thermal conductivity (𝜃) :
𝑓 = −𝑘(𝜃)𝜕𝜃
𝜕𝑥 (2.3)
The surface heat flux 𝑞 in Eq. 2.1 can be expressed in terms of the temperature-dependent film
coefficient ℎ(𝜃) as:
𝑞 = ℎ(𝜃)(𝜃 − 𝜃0) (2.4)
In ABAQUS, we defined all the ID surface boundaries with time-dependent temperature sinks and the
convective film condition. Two repetitive cycles were simulated each with four transient heat transfer
steps. At the initial condition, all the material volumes were subjected to a temperature of 37.78 oC.
Before the start of cyclic heat transfer analysis, additional transient heat transfer analysis was performed
to bring up/down the boundary condition temperature to the starting temperature of the first cycles. Nine
heat transfer steps were performed over the entire simulation duration. During the first step, all the OD
surfaces were defined with the ambient temperature boundary condition of 37.78 oC and convective film
condition. The convective film coefficient ℎ for the ambient convective film condition was assumed to
be 100 W/m2-K [33]. The temperature-dependent film coefficient was defined for all other temperature
boundary conditions. The highest temperature considered for the boundary condition was 315.56 oC.
The highest film coefficient corresponding to this temperature was assumed equal to 7155 W/m2-K.
Different ID surfaces were defined with different cyclic temperature boundary conditions. For the
purpose, we used the design-basis temperature and pressure transients given in NUREG/CR-6909 [21].
The transients were used to make two temperature or pressure cycles. In between two
temperature/pressure cycles, sufficient time was maintained to reduce the ID/OD temperature (simulated
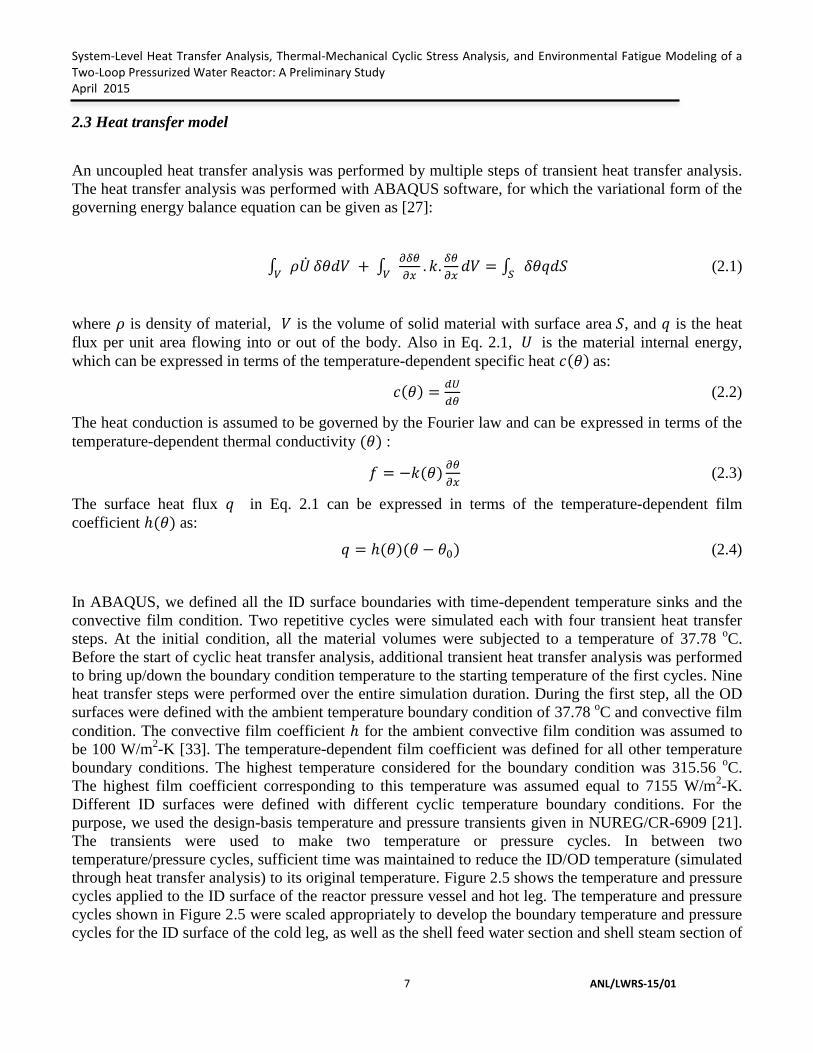
through heat transfer analysis) to its original temperature. Figure 2.5 shows the temperature and pressure
cycles applied to the ID surface of the reactor pressure vessel and hot leg. The temperature and pressure
cycles shown in Figure 2.5 were scaled appropriately to develop the boundary temperature and pressure
cycles for the ID surface of the cold leg, as well as the shell feed water section and shell steam section of
System-Level Heat Transfer Analysis, Thermal-Mechanical Cyclic Stress Analysis, and Environmental Fatigue Modeling of a Two-Loop
Pressurized Water Reactor: A Preliminary Study
April 2015
ANL/LWRS-15/01 8
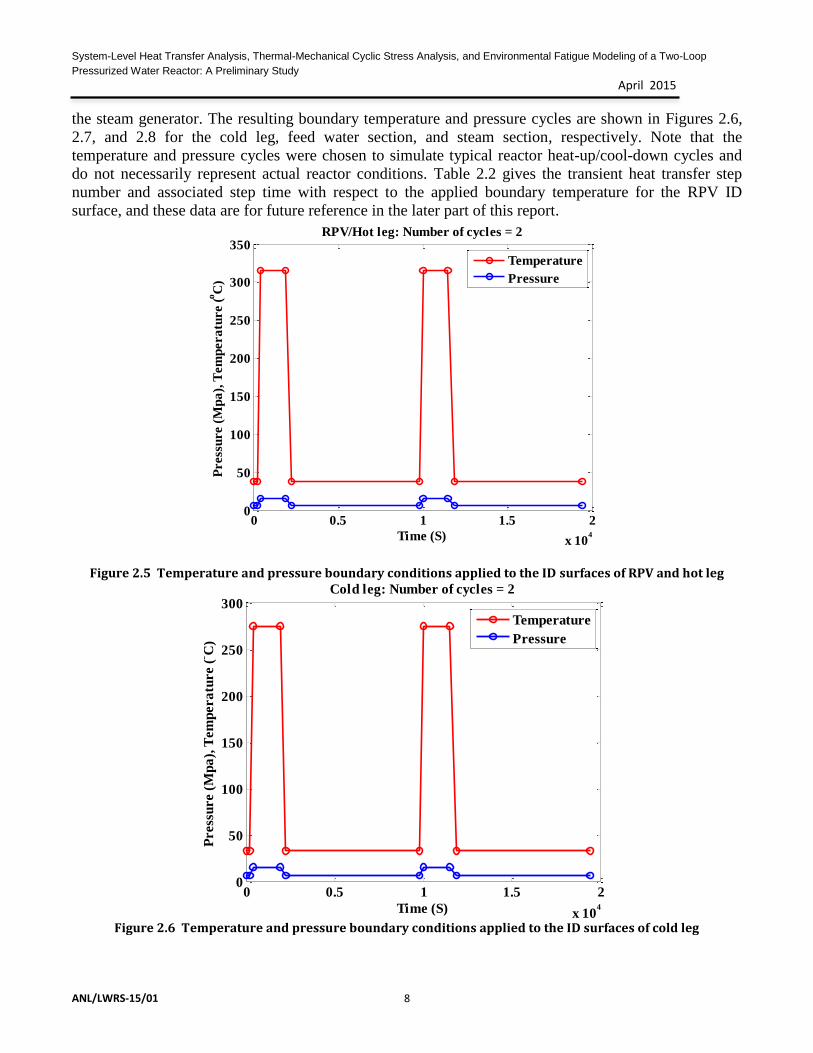
the steam generator. The resulting boundary temperature and pressure cycles are shown in Figures 2.6,
2.7, and 2.8 for the cold leg, feed water section, and steam section, respectively. Note that the
temperature and pressure cycles were chosen to simulate typical reactor heat-up/cool-down cycles and
do not necessarily represent actual reactor conditions. Table 2.2 gives the transient heat transfer step
number and associated step time with respect to the applied boundary temperature for the RPV ID
surface, and these data are for future reference in the later part of this report.
Figure 2.5 Temperature and pressure boundary conditions applied to the ID surfaces of RPV and hot leg
Figure 2.6 Temperature and pressure boundary conditions applied to the ID surfaces of cold leg
0 0.5 1 1.5 2
x 104
0
50
100
150
200
250
300
350
Time (S)
Press
ure (
Mp
a),
Tem
pera
ture (
oC
)RPV/Hot leg: Number of cycles = 2
Temperature
Pressure
0 0.5 1 1.5 2
x 104
0
50
100
150
200
250
300
Time (S)
Press
ure (
Mp
a),
Tem
pera
ture (
oC
)
Cold leg: Number of cycles = 2
Temperature
Pressure
System-Level Heat Transfer Analysis, Thermal-Mechanical Cyclic Stress Analysis, and Environmental Fatigue Modeling of a Two-Loop Pressurized Water Reactor: A Preliminary Study April 2015
ANL/LWRS-15/01
9
Figure 2.7 Temperature and pressure boundary conditions applied to the ID surfaces of SG feed water section
Figure 2.8 Temperature and pressure boundary conditions applied to the ID surfaces of SG steam section
0 0.5 1 1.5 2
x 104
0
50
100
150
200
250
Time (S)
Press
ure (
Mp
a),
Tem
pera
ture (
oC
)
SG shell (feed water): Number of cycles = 2
Temperature
Pressure
0 0.5 1 1.5 2
x 104
0
50
100
150
200
250
300
Time (S)
Press
ure (
Mp
a),
Tem
pera
ture (
oC
)
SG steam: Number of cycles = 2
Temperature
Pressure
System-Level Heat Transfer Analysis, Thermal-Mechanical Cyclic Stress Analysis, and Environmental Fatigue Modeling of a Two-Loop
Pressurized Water Reactor: A Preliminary Study
April 2015
ANL/LWRS-15/01 10
Table 2.2 Transient heat transfer step number and associated RPV ID temperature boundary conditions
Cycle no. 0 1 2
Step no. 1 2 3 4 5 6 7 8 9
End step
time (s)
200 400 1,900 2,250 9,810 10,010 11,510 11,860 19,420
Start temp.
(oC)
37.78 37.78 315.56 315.56 37.78 37.78 315.56 315.56 37.78
End temp.
(oC)
37.78 315.56 315.56 37.78 37.78 315.56 315.56 37.78 37.78
2.4 Structural analysis cases
The structural analyses were performed for the following cases:
a) Only cyclic pressure
b) Only cyclic temperature
c) Both cyclic pressure and temperature
The structural analysis cases under pure temperature or pure pressure loading were used to assess the
contribution of individual temperature and pressure loading on overall stress analysis results performed
under combined temperature and pressure loading. For the three cases, nine stress analyses steps were
performed to model the ID boundary temperature and pressure cycles shown in Figures 2.5 to 2.8. For
stress analysis involving temperature, the heat transfer analysis was performed first, then the resulting
temperatures at individual nodes were transferred to the respective structural analysis steps to perform
the pure thermal stress analysis (case a) or the sequentially coupled thermal-mechanical stress analysis
(case c).
2.5 Material properties for heat transfer and structural analysis model
The heat transfer and stress analysis FE models were developed by using temperature-dependent thermal
and mechanical material properties data given in Ref. [23], which were originally considered from the
ASME Boiler and Pressure Vessel Code [35]. In this preliminary model, because elastic structural
analysis is considered, it is sufficient to consider only the elastic modulus and Poisson ratio. The present
FE model uses length in mm, stress in MPa, and temperature in oC. The original data taken from Ref.
[23] employed British units, which were scaled appropriately to use in the present FE models. The
material properties data given in [23] are for SA-508 carbon steel (or 508 low alloy steel) and SA-376
stainless steel (equivalent of 316 stainless steel). Figures 2.9 to 2.13 show the temperature-dependent
System-Level Heat Transfer Analysis, Thermal-Mechanical Cyclic Stress Analysis, and Environmental Fatigue Modeling of a Two-Loop Pressurized Water Reactor: A Preliminary Study April 2015
ANL/LWRS-15/01
11
elastic modulus, mean coefficient of thermal expansion, thermal conductivity, diffusivity, and specific
heat capacity in SI units, respectively. The densities were assumed to be temperature independent and
were considered to be 8027 and 7750 kg/m3 for SA-376 and SA-508, respectively. Similarly, the
Poisson ratios were assumed temperature independent and were considered to be 0.31 and 0.3 for SA-
376 and SA-508, respectively.
Figure 2.9 Temperature-dependent elastic modulus for SA-376 and SA-508
0 50 100 150 200 250 300 350170
175
180
185
190
195
200
Temperature (o C)
Ela
stic
mo
du
lus
(GP
a)
SA-376
SA-508
0 50 100 150 200 250 300 3501
1.2
1.4
1.6
1.8
2x 10
-5
Temperature (o C)
Mea
n c
oeff
icie
nt
of
therm
al
ex
pa
nsi
on
(oC
-1)
SA-376
SA-508
System-Level Heat Transfer Analysis, Thermal-Mechanical Cyclic Stress Analysis, and Environmental Fatigue Modeling of a Two-Loop
Pressurized Water Reactor: A Preliminary Study
April 2015
ANL/LWRS-15/01 12
Figure 2.10 Temperature-dependent mean coefficient of thermal expansion for SA-376 and SA-508
Figure 2.11 Temperature-dependent thermal conductivity for SA-376 and SA-508
Figure 2.12 Temperature-dependent diffusivity for SA-376 and SA-508
0 50 100 150 200 250 300 3500.01
0.015
0.02
0.025
0.03
0.035
0.04
0.045
Temperature (o C)
Co
nd
ucti
vit
y (
W/m
m/o
C)
SA-376
SA-508
0 50 100 150 200 250 300 3503
4
5
6
7
8
9
10
11
12
Temperature (o C)
Dif
fusi
vit
y (
mm
2/S
)
SA-376
SA-508
System-Level Heat Transfer Analysis, Thermal-Mechanical Cyclic Stress Analysis, and Environmental Fatigue Modeling of a Two-Loop Pressurized Water Reactor: A Preliminary Study April 2015
ANL/LWRS-15/01
13
Figure 2.13 Temperature-dependent specific heat capacity for SA-376 and SA-508
0 50 100 150 200 250 300 3500.44
0.46
0.48
0.5
0.52
0.54
0.56
0.58
0.6
Temperature (o C)
Sp
ecif
ic h
ea
t ca
pa
cit
y (
J/g
/oC
)
SA-376
SA-508
System-Level Heat Transfer Analysis, Thermal-Mechanical Cyclic Stress Analysis, and Environmental Fatigue Modeling of a Two-Loop
Pressurized Water Reactor: A Preliminary Study
April 2015
ANL/LWRS-15/01 14
3 Results of Heat Transfer Analysis
As discussed above, we have developed an assembly-level heat transfer model to estimate the
temperature profile at a given location and at a given time. Some of the important results from this
model are discussed below.
3.1 Selection of artificial convective heat transfer coefficient
Selection of appropriate heat transfer coefficient (Eq. 2.4) is important for convective heat transfer
analysis. Accurate heat transfer coefficients have to be estimated either based on rigorous thermo-
hydraulic experiments or through computational fluid dynamics models. However, such analysis was
beyond our scope. Rather, a simple relation between heat transfer coefficient ℎ and Nusselt number
𝑁𝑢was used to estimate a first approximation of the heat transfer coefficient. This relation is given as
𝑁𝑢 =ℎ𝐷𝑒
𝑘𝑤 (3.1)
The Nusselt number 𝑁𝑢 is estimated from the Dittus-Boelter correlation for turbulent heat transfer:
𝑁𝑢 = 0.023𝑅𝑒0.8𝑃𝑟𝑛 (3.2)
In Eqs. 3.1 and 3.2, 𝐷𝑒 is the hydraulic diameter (assumed equal to the diameter of the hot leg, i.e.
0.66548 m in the present FE model), 𝑘𝑤 is the thermal conductivity of water (0.6096 W/m-K at 300 oC,
[34]), 𝑅𝑒 is the Reynolds’s number (500,000 based on Ref. [7]), and 𝑃𝑟 is the Prandtl number (0.8601 at
300 oC and 15 MPa [34]). Also, the coefficient 𝑛 in Eq. 3.2 is set equal to 0.3 assuming the fluid is being
cooled. With these values, the first approximation of the heat transfer coefficient ℎ was calculated to be
715.5 W/m2-K. With this coefficient, an initial heat transfer analysis was performed for the above
temperature boundary conditions. From the simulation results, we found that the temperature at the ID
surface was not reaching the desired boundary value at the highest test temperature. This was possibly
due to lower heat-up time and subsequent lower steady-state heating time. In an actual reactor, the
individual duration for heat-up, cool-down, and steady-state normal operation will be much higher
compared to the time durations considered for the example temperature cycles. However, increasing the
duration for individual transient heat transfer steps would increase the overall times for heat transfer
analysis computation. This increase would increase the subsequent times for structural analysis
computation. To avoid large transient heat transfer time steps, the convective heat transfer coefficient
was artificially increased. For example, for 315.56 oC, the above estimated ℎ was increased by 10 times,
to 7155 W/m2-K. For other temperatures, this film coefficient was linearly scaled. Two heat transfer
analysis were performed using ℎ = 715.5 W/m2-K and 7155 W/m
2-K. Figure 3.1 shows the resulting
simulated temperatures at typical OD and ID nodes in the mid-section of the RPV. This figure indicates
that the estimated highest ID temperature with ℎ = 715.5 W/m2-K is much lower compared to the
desired highest ID temperature of 315.56 oC (see Figure 2.5). In contrast, the ℎ = 7155 W/m
2-K case
System-Level Heat Transfer Analysis, Thermal-Mechanical Cyclic Stress Analysis, and Environmental Fatigue Modeling of a Two-Loop Pressurized Water Reactor: A Preliminary Study April 2015
ANL/LWRS-15/01
15
simulates fairly well the desired boundary condition temperature with the stipulated step time. Hence,
we used ℎ = 7155 W/m2-K for the subsequent heat transfer analysis discussed later. Note that in the
sequential structural analysis model, the rate effect (e.g., strain rate) is not modeled; hence, it is not
required to consider prototypical temperature ramp-up/down duration. The present structural analysis
model only requires an accurate spatial distribution of the nonlinear temperature profile at any given
time. For the rate-dependent structural analysis, it is essential to consider prototypical time steps
pertinent to particular reactor conditions.
Figure 3.1 Simulated temperature at RPV mid-section OD and ID for different heat transfer coefficients
3.2 Linear versus quadratic heat transfer elements
It is essential to select appropriate heat transfer elements for accurate estimation of the temperature
distribution and, at same time, minimize the computational burden. For that purpose, we performed
parametric studies considering both linear heat transfer elements (DC3D8) and quadratic heat transfer
elements (DC3D20). Both assembly-level FE models were simulated in the batch mode using seven
processors of a Linux cluster. From the simulation, we found that the FE model with DC3D8 elements
took much less CPU time (approximately 15 minutes) compared to that of the FE model with DC3D20
elements (approximately 45 minutes). In addition, the linear element model generates a smaller output
file that can easily be imported to the structural analysis model. At same time, the DC3D8-based heat
transfer model gives fairly similar results to those for the DC3D20-based heat transfer model, as shown
in Figure 3.2 for the simulated RPV mid-section OD and ID temperature. Hence, we used the DC3D8
elements for subsequent heat transfer models and for the corresponding stress analysis elements (C3D8)
in the structural analysis.
0 0.5 1 1.5 2
x 104
0
50
100
150
200
250
300
350
Time (S)
RP
V t
em
pera
ture (
oC
)
OD: h=7155 W/m2K
ID: h=7155 W/m2K
OD: h=715.5 W/m2K
ID: h=715.5 W/m2K
System-Level Heat Transfer Analysis, Thermal-Mechanical Cyclic Stress Analysis, and Environmental Fatigue Modeling of a Two-Loop
Pressurized Water Reactor: A Preliminary Study
April 2015
ANL/LWRS-15/01 16
Figure 3.2 Simulated temperature at RPV mid-section OD and ID for DC3D8 and DC3D20 heat transfer elements
3.3 Representative heat transfer analysis results
Based on the cyclic temperature boundary conditions in Figures 2.5 to 2.8, the DC3D8 linear brick
elements, and the heat transfer coefficient ℎ = 7155 W/m2-K, we performed a heat transfer analysis for
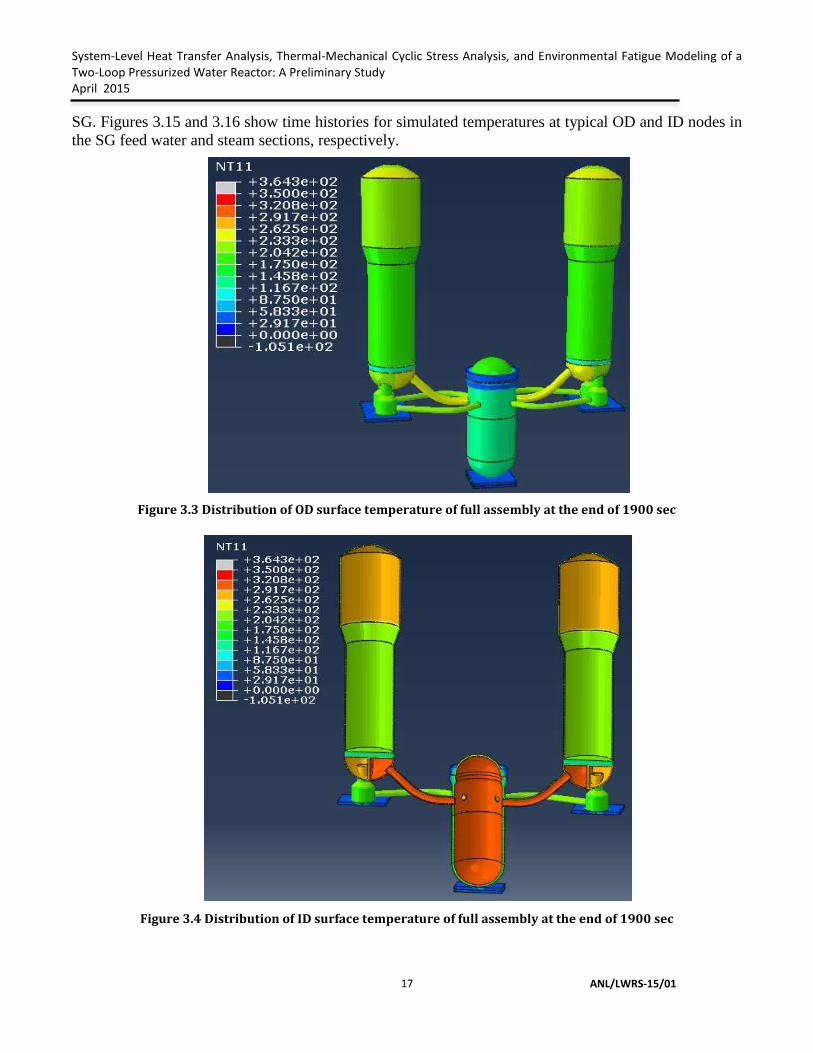
the full assembly-level model shown in Figure 2.3. Representative results are presented below. Figures
3.3 and 3.4 show the OD and ID surface temperature distribution, respectively, at the end of 1900
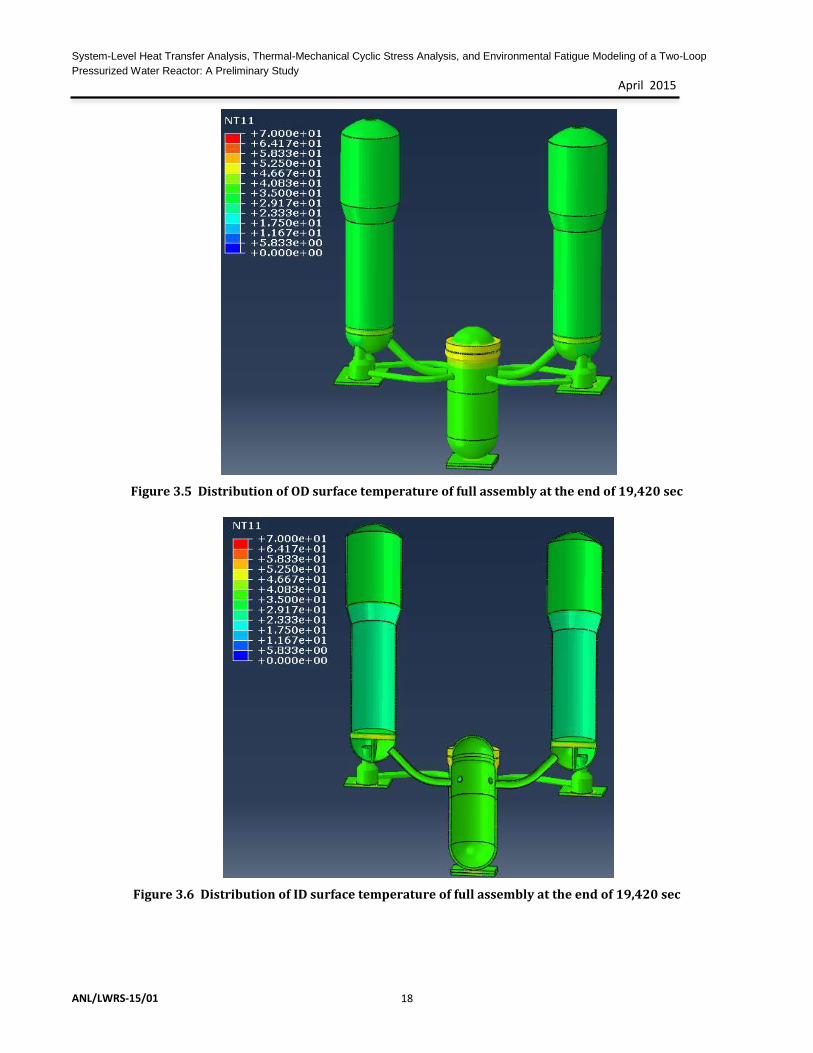
seconds, i.e., at the end of step 3 in Table 2.2. Similarly Figures 3.5 and 3.6 show the OD and ID surface
temperature distribution, respectively, of the full assembly at the end of 19,420 seconds, i.e., at the end
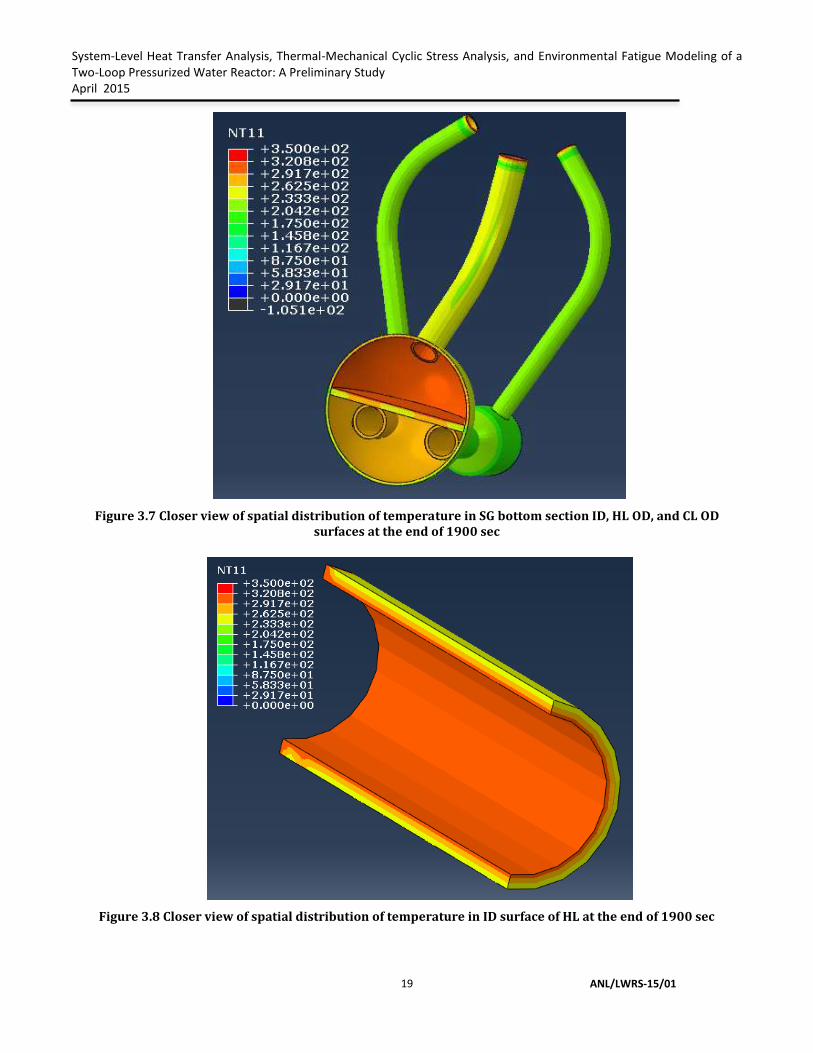
of step 9. Figure 3.7 shows a closer view of the temperature distribution at the end of 1900 seconds in
the steam generator (SG) bottom section ID, the hot leg (HL) OD, and the cold leg (CL) OD surfaces.
Figures 3.8 and 3.9 show a closer view of the temperature distribution in the HL and CL ID surfaces at
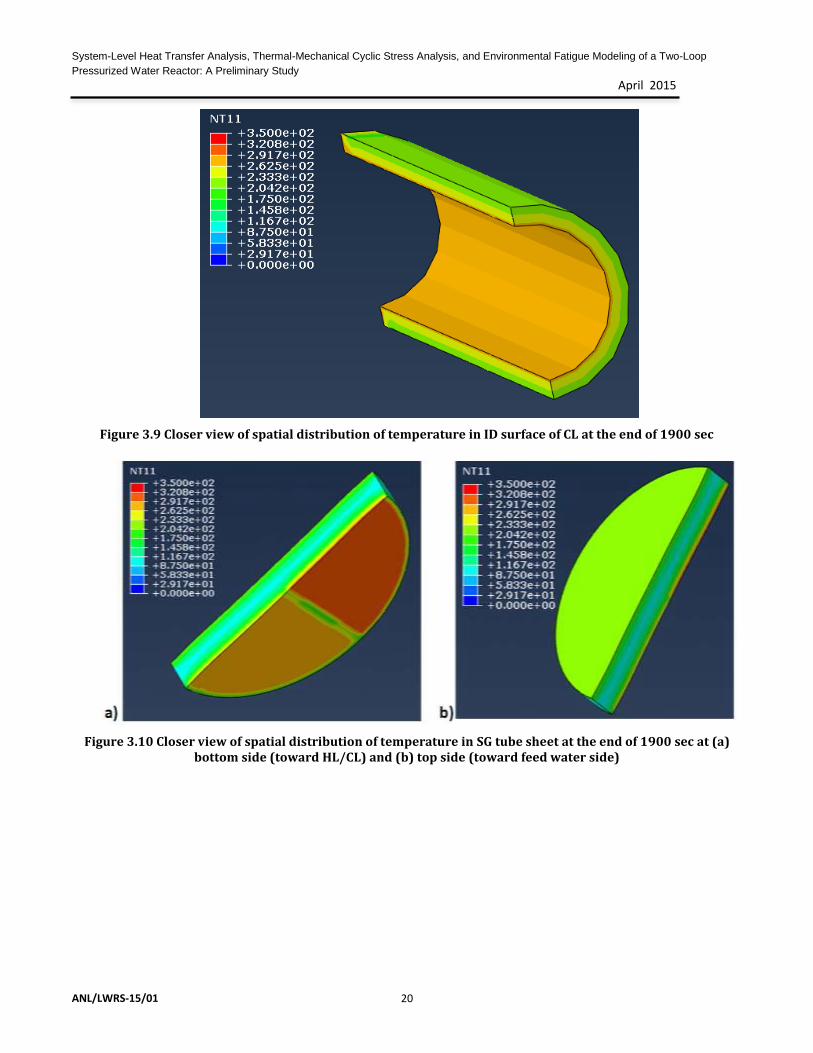
the end of 1900 seconds. Similarly, Figures 3.10(a) and (b) show a closer view of the spatial
distribution of the temperature in the SG tube sheet at the end of 1900 seconds at its bottom side (toward
HL/CL) and at its top side (toward feed water side), respectively.
Time histories of temperatures were estimated at representative locations of different components. For
example, Figure 3.11 shows the time histories for simulated temperatures at typical OD and ID nodes in
the mid-section of the RPV. Figures 3.12 and 3.13 show the time histories for simulated temperatures at
typical OD and ID nodes in the elbow section of the HL and CL, respectively. Figure 3.14 shows the
time histories of the simulated temperatures at typical mid-section junction nodes in the tube sheet of the
0 0.5 1 1.5 2
x 104
0
50
100
150
200
250
300
350
Time (S)
RP
V t
em
pera
ture (
oC
)
OD: DC3D8
ID: DC3D8
OD: DC3D20
ID: DC3D20
System-Level Heat Transfer Analysis, Thermal-Mechanical Cyclic Stress Analysis, and Environmental Fatigue Modeling of a Two-Loop Pressurized Water Reactor: A Preliminary Study April 2015
ANL/LWRS-15/01
17
SG. Figures 3.15 and 3.16 show time histories for simulated temperatures at typical OD and ID nodes in
the SG feed water and steam sections, respectively.
Figure 3.3 Distribution of OD surface temperature of full assembly at the end of 1900 sec
Figure 3.4 Distribution of ID surface temperature of full assembly at the end of 1900 sec
System-Level Heat Transfer Analysis, Thermal-Mechanical Cyclic Stress Analysis, and Environmental Fatigue Modeling of a Two-Loop
Pressurized Water Reactor: A Preliminary Study
April 2015
ANL/LWRS-15/01 18
Figure 3.5 Distribution of OD surface temperature of full assembly at the end of 19,420 sec
Figure 3.6 Distribution of ID surface temperature of full assembly at the end of 19,420 sec
System-Level Heat Transfer Analysis, Thermal-Mechanical Cyclic Stress Analysis, and Environmental Fatigue Modeling of a Two-Loop Pressurized Water Reactor: A Preliminary Study April 2015
ANL/LWRS-15/01
19
Figure 3.7 Closer view of spatial distribution of temperature in SG bottom section ID, HL OD, and CL OD surfaces at the end of 1900 sec
Figure 3.8 Closer view of spatial distribution of temperature in ID surface of HL at the end of 1900 sec
System-Level Heat Transfer Analysis, Thermal-Mechanical Cyclic Stress Analysis, and Environmental Fatigue Modeling of a Two-Loop
Pressurized Water Reactor: A Preliminary Study
April 2015
ANL/LWRS-15/01 20
Figure 3.9 Closer view of spatial distribution of temperature in ID surface of CL at the end of 1900 sec
Figure 3.10 Closer view of spatial distribution of temperature in SG tube sheet at the end of 1900 sec at (a) bottom side (toward HL/CL) and (b) top side (toward feed water side)
System-Level Heat Transfer Analysis, Thermal-Mechanical Cyclic Stress Analysis, and Environmental Fatigue Modeling of a Two-Loop Pressurized Water Reactor: A Preliminary Study April 2015
ANL/LWRS-15/01
21
Figure 3.11 Time histories of simulated temperature at typical OD and ID nodes in mid-section of RPV
Figure 3.12 Time histories of simulated temperature at typical OD and ID nodes in elbow section of HL
0 5000 10000 150000
50
100
150
200
250
300
350
Time (S)
RP
V t
em
pera
ture (
oC
)
OD
ID
0 0.5 1 1.5 2
x 104
0
50
100
150
200
250
300
350
Time (S)
HL
tem
pera
ture (
oC
)
OD
ID
System-Level Heat Transfer Analysis, Thermal-Mechanical Cyclic Stress Analysis, and Environmental Fatigue Modeling of a Two-Loop
Pressurized Water Reactor: A Preliminary Study
April 2015
ANL/LWRS-15/01 22
Figure 3.13 Time histories of simulated temperature at typical OD and ID nodes in elbow section of CL
Figure 3.14 Time histories of simulated temperature at typical mid-section junction nodes in tube sheet of SG
0 0.5 1 1.5 2
x 104
0
50
100
150
200
250
300
350
Time (S)
CL
tem
pera
ture (
oC
)
OD
ID
0 0.5 1 1.5 2
x 104
0
50
100
150
200
250
300
350
Time (S)
SG
tu
be
shee
t m
id-s
ecti
on
tem
per
atu
re (
oC
)
HL/CL side
FW side
System-Level Heat Transfer Analysis, Thermal-Mechanical Cyclic Stress Analysis, and Environmental Fatigue Modeling of a Two-Loop Pressurized Water Reactor: A Preliminary Study April 2015
ANL/LWRS-15/01
23
Figure 3.15 Time histories of simulated temperature at typical OD and ID nodes in feed water section of SG
Figure 3.16 Time histories of simulated temperature at typical OD and ID FE nodes in steam section of SG
0 0.5 1 1.5 2
x 104
0
50
100
150
200
250
300
350
Time (S)
SG
F
W-s
ecti
on
tem
pera
ture (
oC
)
OD
ID
0 0.5 1 1.5 2
x 104
0
50
100
150
200
250
300
350
Time (S)
SG
st
ea
m-s
ecti
on
tem
pera
ture (
oC
)
OD
ID
System-Level Heat Transfer Analysis, Thermal-Mechanical Cyclic Stress Analysis, and Environmental Fatigue Modeling of a Two-Loop
Pressurized Water Reactor: A Preliminary Study
April 2015
ANL/LWRS-15/01 24
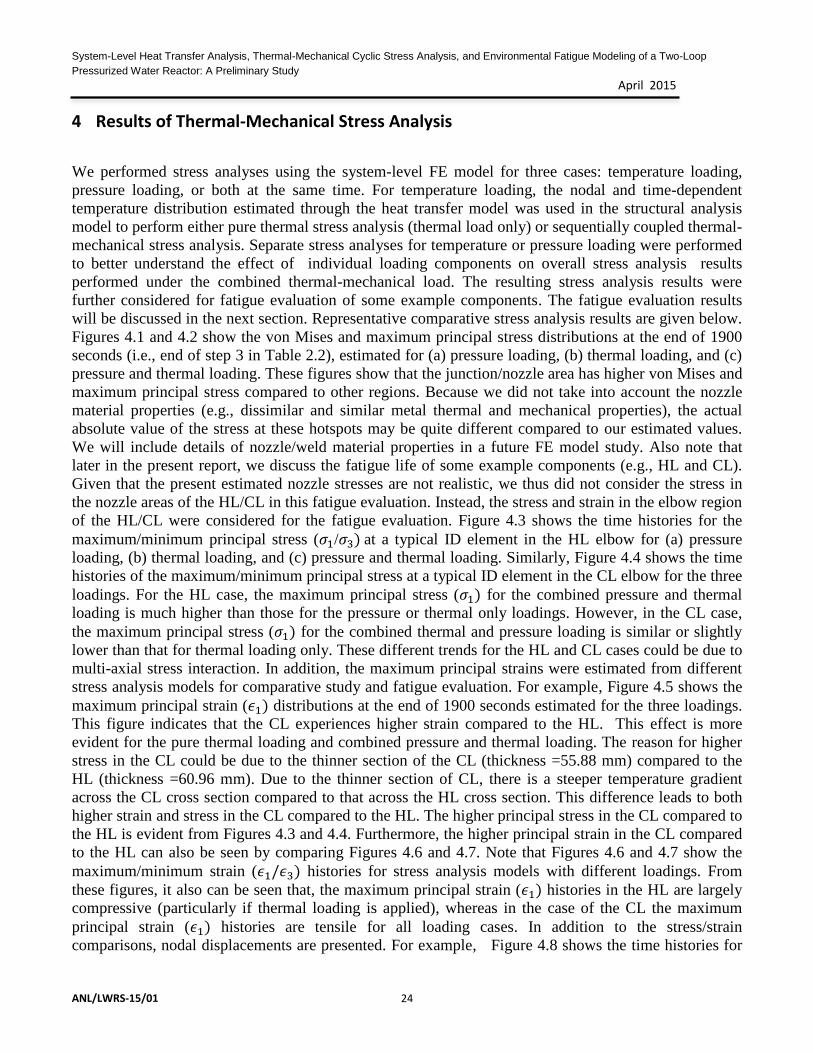
4 Results of Thermal-Mechanical Stress Analysis
We performed stress analyses using the system-level FE model for three cases: temperature loading,
pressure loading, or both at the same time. For temperature loading, the nodal and time-dependent
temperature distribution estimated through the heat transfer model was used in the structural analysis
model to perform either pure thermal stress analysis (thermal load only) or sequentially coupled thermal-
mechanical stress analysis. Separate stress analyses for temperature or pressure loading were performed
to better understand the effect of individual loading components on overall stress analysis results
performed under the combined thermal-mechanical load. The resulting stress analysis results were
further considered for fatigue evaluation of some example components. The fatigue evaluation results
will be discussed in the next section. Representative comparative stress analysis results are given below.
Figures 4.1 and 4.2 show the von Mises and maximum principal stress distributions at the end of 1900
seconds (i.e., end of step 3 in Table 2.2), estimated for (a) pressure loading, (b) thermal loading, and (c)
pressure and thermal loading. These figures show that the junction/nozzle area has higher von Mises and
maximum principal stress compared to other regions. Because we did not take into account the nozzle
material properties (e.g., dissimilar and similar metal thermal and mechanical properties), the actual
absolute value of the stress at these hotspots may be quite different compared to our estimated values.
We will include details of nozzle/weld material properties in a future FE model study. Also note that
later in the present report, we discuss the fatigue life of some example components (e.g., HL and CL).
Given that the present estimated nozzle stresses are not realistic, we thus did not consider the stress in
the nozzle areas of the HL/CL in this fatigue evaluation. Instead, the stress and strain in the elbow region
of the HL/CL were considered for the fatigue evaluation. Figure 4.3 shows the time histories for the
maximum/minimum principal stress (𝜎1/𝜎3) at a typical ID element in the HL elbow for (a) pressure
loading, (b) thermal loading, and (c) pressure and thermal loading. Similarly, Figure 4.4 shows the time
histories of the maximum/minimum principal stress at a typical ID element in the CL elbow for the three
loadings. For the HL case, the maximum principal stress (𝜎1) for the combined pressure and thermal
loading is much higher than those for the pressure or thermal only loadings. However, in the CL case,
the maximum principal stress (𝜎1) for the combined thermal and pressure loading is similar or slightly
lower than that for thermal loading only. These different trends for the HL and CL cases could be due to
multi-axial stress interaction. In addition, the maximum principal strains were estimated from different
stress analysis models for comparative study and fatigue evaluation. For example, Figure 4.5 shows the
maximum principal strain (𝜖1) distributions at the end of 1900 seconds estimated for the three loadings.
This figure indicates that the CL experiences higher strain compared to the HL. This effect is more
evident for the pure thermal loading and combined pressure and thermal loading. The reason for higher
stress in the CL could be due to the thinner section of the CL (thickness =55.88 mm) compared to the
HL (thickness =60.96 mm). Due to the thinner section of CL, there is a steeper temperature gradient
across the CL cross section compared to that across the HL cross section. This difference leads to both
higher strain and stress in the CL compared to the HL. The higher principal stress in the CL compared to
the HL is evident from Figures 4.3 and 4.4. Furthermore, the higher principal strain in the CL compared
to the HL can also be seen by comparing Figures 4.6 and 4.7. Note that Figures 4.6 and 4.7 show the
maximum/minimum strain (𝜖1/𝜖3) histories for stress analysis models with different loadings. From
these figures, it also can be seen that, the maximum principal strain (𝜖1) histories in the HL are largely
compressive (particularly if thermal loading is applied), whereas in the case of the CL the maximum
principal strain (𝜖1) histories are tensile for all loading cases. In addition to the stress/strain
comparisons, nodal displacements are presented. For example, Figure 4.8 shows the time histories for
System-Level Heat Transfer Analysis, Thermal-Mechanical Cyclic Stress Analysis, and Environmental Fatigue Modeling of a Two-Loop Pressurized Water Reactor: A Preliminary Study April 2015
ANL/LWRS-15/01
25
nodal displacement (magnitude) at the end of 1900 sec for the three loadings. From this figure it can be
seen that the SG nozzle ends of the HL and CL experience higher displacement for the thermal and
pressure loading compared to the pressure or thermal loadings. Figures 4.9 and 4.10 show the time
histories of nodal displacement magnitude (𝑈𝑚𝑎𝑔) at typical ID nodes in the end sections (near SG
nozzle) of the HL and CL, respectively.
Figure 4.1 Von Mises stress distribution at the end of 1900 sec from stress analysis models with (a) pressure loading, (b) thermal loading, and (c) both pressure and thermal loading
System-Level Heat Transfer Analysis, Thermal-Mechanical Cyclic Stress Analysis, and Environmental Fatigue Modeling of a Two-Loop
Pressurized Water Reactor: A Preliminary Study
April 2015
ANL/LWRS-15/01 26
Figure 4.2 Maximum principal stress distribution at the end of 1900 sec from stress analysis models with (a) pressure loading, (b) thermal loading, and (c) both pressure and thermal loading
Figure 4 3 Maximum/minimum principal stress time histories at a typical ID element in the HL elbow from stress analysis models with pressure loading, thermal loading, and both pressure and thermal loading
0 0.5 1 1.5 2
x 104
-20
0
20
40
60
80
100
120
140
160
Time (S)
Ho
t le
g:
Ma
x./
Min
. P
rin
icip
al
stress
(M
Pa
)
1:P
3:P
1:
3:
1:P+
3:P+

System-Level Heat Transfer Analysis, Thermal-Mechanical Cyclic Stress Analysis, and Environmental Fatigue Modeling of a Two-Loop Pressurized Water Reactor: A Preliminary Study April 2015
ANL/LWRS-15/01
27
Figure 4.4 Maximum/minimum principal stress time histories at a typical ID element in CL elbow from stress analysis models with pressure loading, thermal loading, and both pressure and thermal loading
Figure 4.5 Maximum principal strain distribution at the end of 1900 sec from stress analysis models with (a) pressure loading, (b) thermal loading, and (c) both pressure and thermal loading
0 0.5 1 1.5 2
x 104
-100
0
100
200
300
400
Time (S)
Co
ld l
eg
: M
ax
./M
in. P
rin
icip
al
stress
(M
Pa
)
1:P
3:P
1:
3:
1:P+
3:P+

System-Level Heat Transfer Analysis, Thermal-Mechanical Cyclic Stress Analysis, and Environmental Fatigue Modeling of a Two-Loop
Pressurized Water Reactor: A Preliminary Study
April 2015
ANL/LWRS-15/01 28
Figure 4.6 Maximum/minimum principal strain time histories at a typical ID element in HL elbow from stress analysis models with pressure loading, thermal loading, and both pressure and thermal loading
Figure 4.7 Maximum/minimum principal strain time histories at a typical ID element in CL elbow from stress analysis models with pressure loading, thermal loading, and both pressure and thermal loading
0 0.5 1 1.5 2
x 104
-0.12
-0.1
-0.08
-0.06
-0.04
-0.02
0
0.02
0.04
0.06
Time (S)
Ho
t le
g:
Ma
x./
Min
. P
rin
icip
al
stra
in (
%)
1:P
3:P
1:
3:
1:P+
3:P+
0 0.5 1 1.5 2
x 104
-0.1
0
0.1
0.2
0.3
0.4
0.5
0.6
Time (S)
Co
ld l
eg
: M
ax
./M
in. P
rin
icip
al
stra
in (
%)
1:P
3:P
1:
3:
1:P+
3:P+
System-Level Heat Transfer Analysis, Thermal-Mechanical Cyclic Stress Analysis, and Environmental Fatigue Modeling of a Two-Loop Pressurized Water Reactor: A Preliminary Study April 2015
ANL/LWRS-15/01
29
Figure 4.8 Displacement (magnitude) variation at the end of 1900 sec from stress analysis models with (a) pressure loading, (b) thermal loading, and (c) both pressure and thermal loading
Figure 4.9 Maximum displacement time histories at a typical ID node in HL (near SG nozzle) from stress analysis models with pressure loading, thermal loading, and both pressure and thermal loading
0 0.5 1 1.5 2
x 104
0
5
10
15
20
25
30
35
Time (S)
Ho
t le
g m
ax
. d
isp
lacem
en
t m
ag
nit
ud
e (
mm
)
Umag
:P
Umag
:
Umag
:P+
System-Level Heat Transfer Analysis, Thermal-Mechanical Cyclic Stress Analysis, and Environmental Fatigue Modeling of a Two-Loop
Pressurized Water Reactor: A Preliminary Study
April 2015
ANL/LWRS-15/01 30
Figure 4.10 Maximum displacement time histories at a typical ID node in CL (near SG nozzle) from stress analysis models with pressure loading, thermal loading, and both pressure and thermal loading
0 0.5 1 1.5 2
x 104
0
5
10
15
20
25
30
35
Time (S)
Co
ld l
eg
ma
x. d
isp
lacem
en
t m
ag
nit
ud
e (
mm
)
Umag
:P
Umag
:
Umag
:P+
System-Level Heat Transfer Analysis, Thermal-Mechanical Cyclic Stress Analysis, and Environmental Fatigue Modeling of a Two-Loop Pressurized Water Reactor: A Preliminary Study April 2015
ANL/LWRS-15/01
31
5 Environmental Fatigue Life Estimation for Example Components
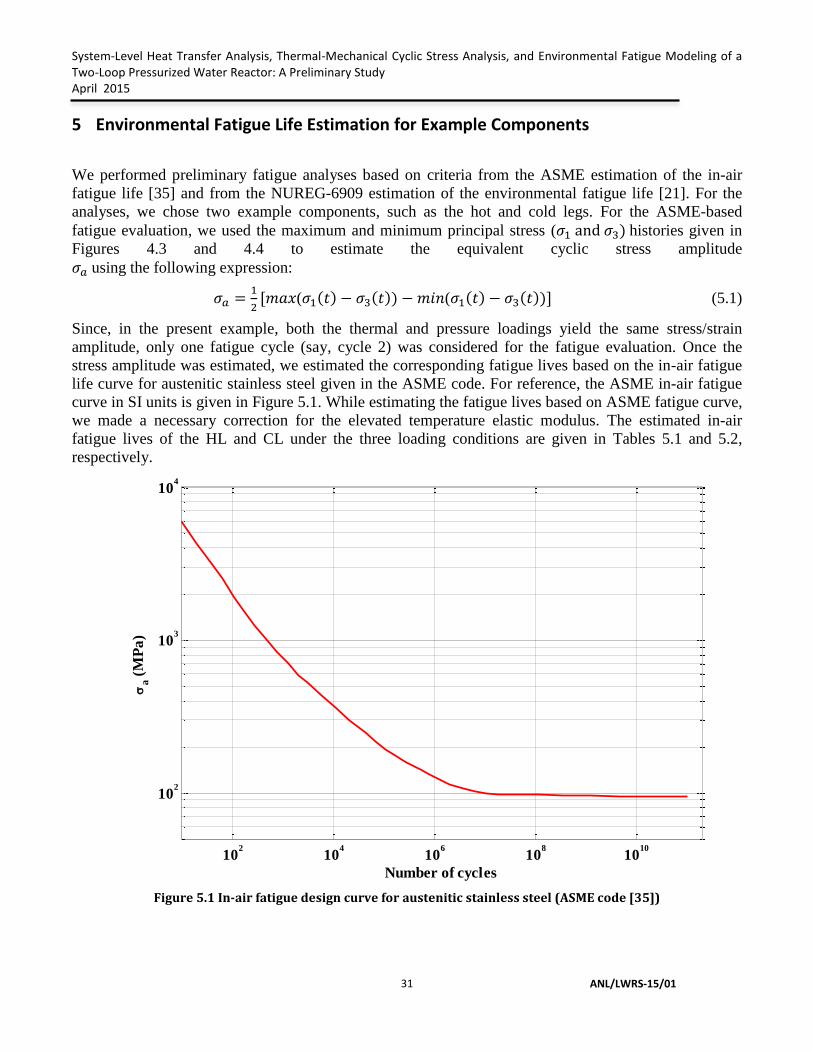
We performed preliminary fatigue analyses based on criteria from the ASME estimation of the in-air
fatigue life [35] and from the NUREG-6909 estimation of the environmental fatigue life [21]. For the
analyses, we chose two example components, such as the hot and cold legs. For the ASME-based
fatigue evaluation, we used the maximum and minimum principal stress (𝜎1 and 𝜎3) histories given in
Figures 4.3 and 4.4 to estimate the equivalent cyclic stress amplitude 𝜎𝑎 using the following expression:
𝜎𝑎 =1
2[𝑚𝑎𝑥(𝜎1(𝑡) − 𝜎3(𝑡)) − 𝑚𝑖𝑛(𝜎1(𝑡) − 𝜎3(𝑡))] (5.1)
Since, in the present example, both the thermal and pressure loadings yield the same stress/strain
amplitude, only one fatigue cycle (say, cycle 2) was considered for the fatigue evaluation. Once the
stress amplitude was estimated, we estimated the corresponding fatigue lives based on the in-air fatigue
life curve for austenitic stainless steel given in the ASME code. For reference, the ASME in-air fatigue
curve in SI units is given in Figure 5.1. While estimating the fatigue lives based on ASME fatigue curve,
we made a necessary correction for the elevated temperature elastic modulus. The estimated in-air
fatigue lives of the HL and CL under the three loading conditions are given in Tables 5.1 and 5.2,
respectively.
Figure 5.1 In-air fatigue design curve for austenitic stainless steel (ASME code [35])
102
104
106
108
1010
102
103
104
Number of cycles
a (
MP
a)
System-Level Heat Transfer Analysis, Thermal-Mechanical Cyclic Stress Analysis, and Environmental Fatigue Modeling of a Two-Loop
Pressurized Water Reactor: A Preliminary Study
April 2015
ANL/LWRS-15/01 32
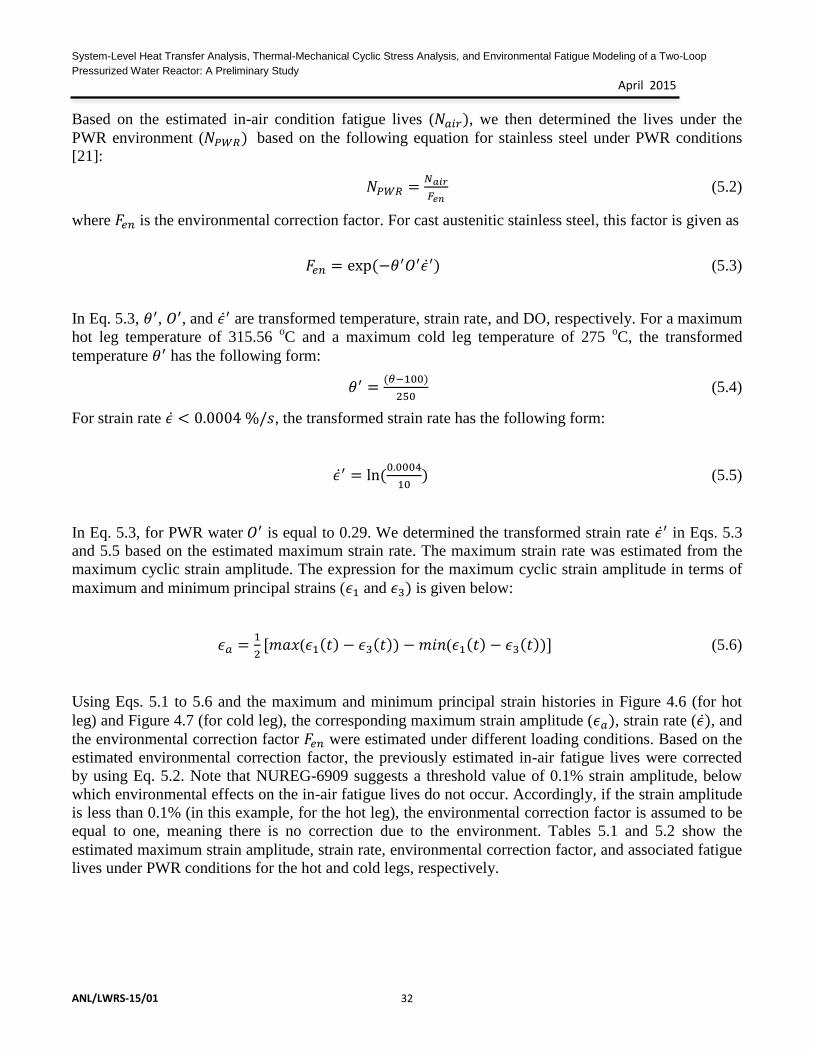
Based on the estimated in-air condition fatigue lives (𝑁𝑎𝑖𝑟), we then determined the lives under the
PWR environment (𝑁𝑃𝑊𝑅) based on the following equation for stainless steel under PWR conditions
[21]:
𝑁𝑃𝑊𝑅 =𝑁𝑎𝑖𝑟
𝐹𝑒𝑛 (5.2)
where 𝐹𝑒𝑛 is the environmental correction factor. For cast austenitic stainless steel, this factor is given as
𝐹𝑒𝑛 = exp (−𝜃′𝑂′𝜖̇′) (5.3)
In Eq. 5.3, 𝜃′, 𝑂′, and 𝜖̇′ are transformed temperature, strain rate, and DO, respectively. For a maximum
hot leg temperature of 315.56 oC and a maximum cold leg temperature of 275
oC, the transformed
temperature 𝜃′ has the following form:
𝜃′ =(𝜃−100)
250 (5.4)
For strain rate 𝜖̇ < 0.0004 %/𝑠, the transformed strain rate has the following form:
𝜖̇′ = ln (0.0004
10) (5.5)
In Eq. 5.3, for PWR water 𝑂′ is equal to 0.29. We determined the transformed strain rate 𝜖̇′ in Eqs. 5.3
and 5.5 based on the estimated maximum strain rate. The maximum strain rate was estimated from the
maximum cyclic strain amplitude. The expression for the maximum cyclic strain amplitude in terms of
maximum and minimum principal strains (𝜖1 and 𝜖3) is given below:
𝜖𝑎 =1
2[𝑚𝑎𝑥(𝜖1(𝑡) − 𝜖3(𝑡)) − 𝑚𝑖𝑛(𝜖1(𝑡) − 𝜖3(𝑡))] (5.6)
Using Eqs. 5.1 to 5.6 and the maximum and minimum principal strain histories in Figure 4.6 (for hot
leg) and Figure 4.7 (for cold leg), the corresponding maximum strain amplitude (𝜖𝑎), strain rate (𝜖̇), and
the environmental correction factor 𝐹𝑒𝑛 were estimated under different loading conditions. Based on the
estimated environmental correction factor, the previously estimated in-air fatigue lives were corrected
by using Eq. 5.2. Note that NUREG-6909 suggests a threshold value of 0.1% strain amplitude, below
which environmental effects on the in-air fatigue lives do not occur. Accordingly, if the strain amplitude
is less than 0.1% (in this example, for the hot leg), the environmental correction factor is assumed to be
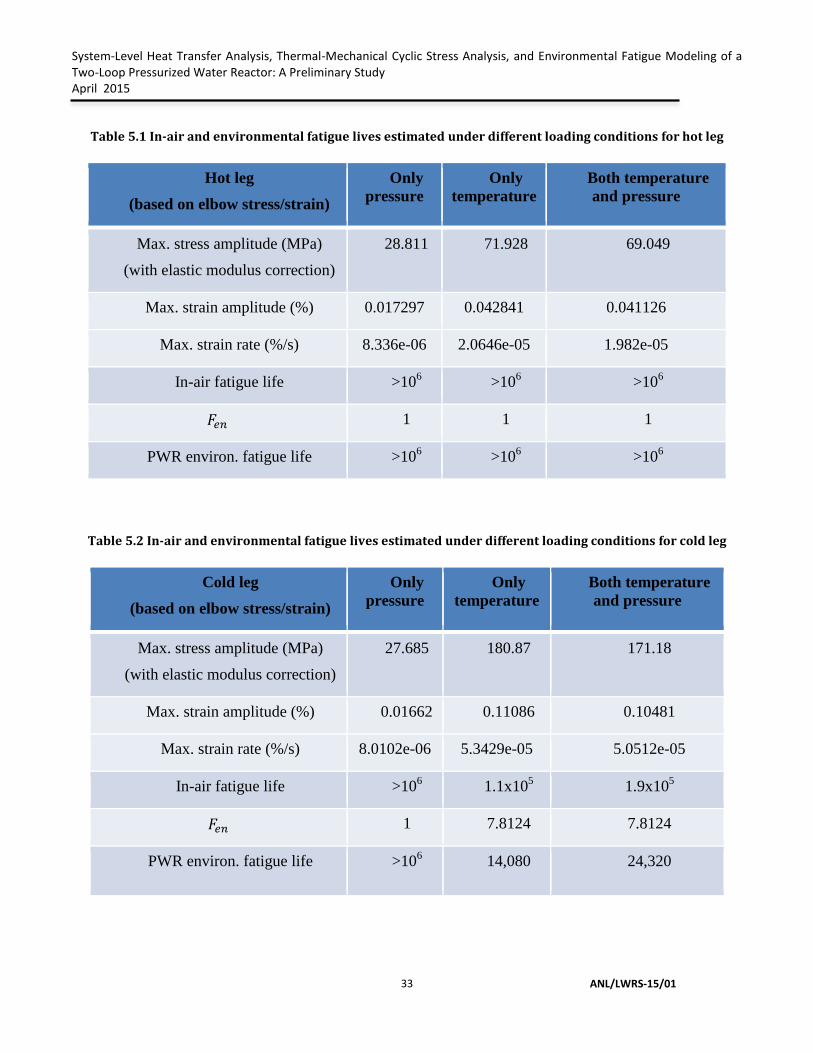
equal to one, meaning there is no correction due to the environment. Tables 5.1 and 5.2 show the
estimated maximum strain amplitude, strain rate, environmental correction factor, and associated fatigue
lives under PWR conditions for the hot and cold legs, respectively.
System-Level Heat Transfer Analysis, Thermal-Mechanical Cyclic Stress Analysis, and Environmental Fatigue Modeling of a Two-Loop Pressurized Water Reactor: A Preliminary Study April 2015
ANL/LWRS-15/01
33
Table 5.1 In-air and environmental fatigue lives estimated under different loading conditions for hot leg
Hot leg
(based on elbow stress/strain)
Only
pressure
Only
temperature
Both temperature
and pressure
Max. stress amplitude (MPa)
(with elastic modulus correction)
28.811 71.928 69.049
Max. strain amplitude (%) 0.017297 0.042841 0.041126
Max. strain rate (%/s) 8.336e-06 2.0646e-05 1.982e-05
In-air fatigue life >106 >10
6 >10
6
𝐹𝑒𝑛 1 1 1
PWR environ. fatigue life >106 >10
6 >10
6
Table 5.2 In-air and environmental fatigue lives estimated under different loading conditions for cold leg
Cold leg
(based on elbow stress/strain)
Only
pressure
Only
temperature
Both temperature
and pressure
Max. stress amplitude (MPa)
(with elastic modulus correction)
27.685 180.87 171.18
Max. strain amplitude (%) 0.01662 0.11086 0.10481
Max. strain rate (%/s) 8.0102e-06 5.3429e-05 5.0512e-05
In-air fatigue life >106 1.1x10
5 1.9x10
5
𝐹𝑒𝑛 1 7.8124 7.8124
PWR environ. fatigue life >106 14,080 24,320

System-Level Heat Transfer Analysis, Thermal-Mechanical Cyclic Stress Analysis, and Environmental Fatigue Modeling of a Two-Loop
Pressurized Water Reactor: A Preliminary Study
April 2015
ANL/LWRS-15/01 34
6 Summary and Future Study
A system-level preliminary FE model was developed for a two-loop PWR reactor. This model was then
used to conduct a system-level heat transfer analysis and subsequent thermal-mechanical stress analysis
for typical design-basis thermal-mechanical cycles. The stress analysis results were then used to estimate
in-air fatigue lives of components, such as the hot and cold legs, based on estimation criteria for the
ASME in-air fatigue life and the fatigue design curve. Furthermore, estimated stress and strain histories
were used to calculate environmental correction factors and associated PWR environment fatigue lives
for the hot and cold legs based on the approach described in NUREG-6909. The discussed models and
results are very preliminary. Further development of the model is required for more accurate life
prediction of reactor components.
Suggested areas for the improvement of the discussed approach/models include the following:
1. Consideration of real plant transients for more realistic time-dependent heat transfer and
structural analysis.
2. Inclusion of other components (surge line, pressurizer, etc.) and incorporation of more realistic
geometric boundary conditions.
3. Detailed thermal-hydraulic simulation of key components for more realistic temperature
boundary conditions (e.g., thermal stratification in surge line pipes during in-surge and out-
surge).
4. Inclusion of elastic-plastic stress analysis for more accurate estimation of stress state beyond the
elastic or yield limit.
5. Inclusion of evolutionary material models for inclusion of cyclic hardening and softening.
6. Use of weld material properties for accurate stress state estimation in the nozzle and other weld
regions.
7. Weld modeling of the nozzle area and other weld regions for accurate inclusion of welding
process-related residual stress.
8. Determination of the effect of preexisting notch/cracks and their propagation due to temperature
and pressure cycling.
9. Consideration of other loading events such as pressurized thermal shock in addition to the heat-
up/cool-down cycles.
10. Inclusion of radiation-induced swelling/shrinkage material models for more accurate stress state
estimation of RPV.
System-Level Heat Transfer Analysis, Thermal-Mechanical Cyclic Stress Analysis, and Environmental Fatigue Modeling of a Two-Loop Pressurized Water Reactor: A Preliminary Study April 2015
ANL/LWRS-15/01
35
References
1. Department of Energy, The Nuclear Energy Advanced Modeling and Simulation (NEAMs) Program
(http://energy.gov/sites/prod/files/2013/07/f2/NEAMS%20Executive%20Program%20Plan.pdf).
2. Palmtag, S., Clarno, K., Davidson, G., Salko, R., Evans, T., Turner, J., & Schmidt, R. (2014).
Coupled neutronics and thermal-hydraulic solution of a full core PWR using VERA-CS.
Proceedings of International Topical Meeting on Advances in Reactor Physics (PHYSOR), Kyoto,
Japan, September 28–October 3, 2014.
3. Kang, D. G., Jhung, M. J., & Chang, S. H. (2011). Fluid–structure interaction analysis for
pressurizer surge line subjected to thermal stratification. Nuclear Engineering and Design, 241(1),
257-269.
4. Conner, M. E., Hassan, Y. A., & Dominguez-Ontiveros, E. E. (2013). Hydraulic benchmark data
for PWR mixing vane grid. Nuclear Engineering and Design, 264, 97-102.
5. Yoon, H. Y., Cho, H. K., Lee, J. R., Park, I. K., & Jeong, J. J. (2012). Multi-scale thermal-hydraulic
analysis of PWRs using the CUPID code. Nuclear Engineering and Technology, (8), 831-846.
6. Murase, M., Minami, N., Nagae, T., & Tomiyama, A. (2010). Countercurrent gas liquid flow in a
PWR hot leg during reflux condensation. Dr. Valentin Uchanin (Ed.), InTech. Available from:
http://www.intechopen.com/books/steam-generator-systems-operational-reliability-and-
efficiency/countercurrent-flow-in-a-pwr-hot-leg-under-reflux-condensation.
7. Shan, J., Zhang, B., Gou, J., & Cao, L. (2014). Subchannel Analysis, CFD Modeling and
Verifications, CHF Experiments and Benchmarking. Science and Technology of Nuclear
Installations, Volume 2014, Hindawi Publishing Corporation.
8. Lin, T., Li, R., Long, H., & Ou, H. (2006). Three-dimensional transient sealing analysis of the
bolted flange connections of reactor pressure vessel. Nuclear Engineering and Design, 236(24),
2599-2607.
9. Yu, S., Liu, J., Zuo, W., & He, S. (2002). Sealing behavior of the HTR-10 pressure vessel flanges.
Nuclear Engineering and Design, 216(1), 247-253.
10. Jia, X., Chen, H., Li, X., Wang, Y., & Wang, L. (2014). A study on the sealing performance of
metallic C-rings in reactor pressure vessel. Nuclear Engineering and Design, 278, 64-70.
11. Mohanty, S., Majumdar, S., & Srinivasan, M. (2013). Constitutive modeling and finite element
procedure development for stress analysis of prismatic high temperature gas cooled reactor graphite
core components. Nuclear Engineering and Design, 260, 145-154.
12. Mohanty, S., Jain, R., Majumdar, S., Tautges, T. J., & Makuteswara, S. Coupled thermal-
irradiation-structural analysis of HGTR fuel brick using ABAQUS. Proceedings of ICAPP ’12,
Chicago, June 24-28, 2012, Paper 12352.
13. Mohanty, S., Majumdar, S., & Natesan, K., Modeling of steam generator tube rupture using
extended finite element method. Structural Mechanics in Reactor Technology (SMiRT)-22
Conference, San Francisco, California, August 18-23, 2013.
14. Chen, M., Lu, F., Wang, R., & Ren, A. (2014). Structural integrity assessment of the reactor
pressure vessel under the pressurized thermal shock loading. Nuclear Engineering and Design, 272,
84-91.
15. Qian, G., & Niffenegger, M. (2013). Procedures, methods and computer codes for the probabilistic
assessment of reactor pressure vessels subjected to pressurized thermal shocks. Nuclear
Engineering and Design, 258, 35-50.
System-Level Heat Transfer Analysis, Thermal-Mechanical Cyclic Stress Analysis, and Environmental Fatigue Modeling of a Two-Loop
Pressurized Water Reactor: A Preliminary Study
April 2015
ANL/LWRS-15/01 36
16. Qian, G., & Niffenegger, M. (2013). Integrity analysis of a reactor pressure vessel subjected to
pressurized thermal shocks by considering constraint effect. Engineering Fracture Mechanics, 112,
14-25.
17. Keim, E., Schmidt, C., Schöpper, A., & Hertlein, R. (2001). Life management of reactor pressure
vessels under pressurized thermal shock loading: Deterministic procedure and application to
Western and Eastern type of reactors. International Journal of Pressure Vessels and Piping, 78(2),
85-98.
18. González-Albuixech, V. F., Qian, G., & Niffenegger, M. (2014). Integrity analysis of reactor
pressure vessels subjected to pressurized thermal shocks by XFEM. Nuclear Engineering and
Design, 275, 336-343.
19. Qian, G., & Niffenegger, M. (2015). Investigation on constraint effect of a reactor pressure vessel
subjected to pressurized thermal shocks. Journal of Pressure Vessel Technology, 137(1), 011204.
20. Villanueva, W., Tran, C. T., & Kudinov, P. (2012). Coupled thermo-mechanical creep analysis for
boiling water reactor pressure vessel lower head. Nuclear Engineering and Design, 249, 146-153.
21. Chopra, O., and Stevens, G. (2014). Effect of LWR Coolant Environments on the Fatigue Life of
Reactor Materials. U.S. Nuclear Regulatory Commission Report No. NUREG/CR-6909, Revision
1.
22. Japan Nuclear Energy Safety Organization (2011). Nuclear Power Generation Facilities
Environmental Fatigue Evaluation Method for Nuclear Power Plants. Nuclear Energy System
Safety Division, Japan Nuclear Energy Safety Organization Report No. JNES-SS-1005.
23. Gray, M. A., & Verlinich, M. M. (2012). Guidelines for Addressing Environmental Effects in
Fatigue Usage Calculations. Electric Power Research Institute Report EPRI--1025823.
24. Chen, B. Y., Huang, C. C., Chou, H. W., Lin, H. C., Liu, R. F., Weng, T. L., & Chang, H. J. (2014).
Reactor pressure vessel integrity assessment by probabilistic fracture mechanics–A plant specific
analysis. International Journal of Pressure Vessels and Piping, 117, 64-69.
25. Mohanty, S., Soppet, W. K., Majumdar, S. and Natesan, K. (2014). Environmental Effect on
Evolutionary Cyclic Plasticity Material Parameters of 316 Stainless Steel: An Experimental &
Material Modeling Approach. Argonne National Laboratory Report ANL/LWRS-14/1
(http://www.osti.gov/scitech/biblio/1168233).
26. Mohanty, S., Soppet, W. K., Majumdar, S.. and Natesan, K. (2013). Report on Assessment of
Environmentally-Assisted Fatigue for LWR Extended Service Conditions. Argonne National
Laboratory Report ANL/LWRS-13/3 (http://www.osti.gov/scitech/biblio/1168222).
27. Dassault Systèmes (2014). ABAQUS Unified FEA: Complete Solutions for Realistic Simulation.
http://www.3ds.com/products-services/simulia/products/abaqus.
28. Shah, V. N., & MacDonald, P. E. (1993). Aging and Life Extension of Major Light Water Reactor
Components. Elsevier Science.
29. Schulz, T. L. (2006). Westinghouse AP1000 advanced passive plant. Nuclear Engineering and
Design, 236(14), 1547-1557.
30. Cummins, W. E., Corletti, M. M., & Schulz, T. L. (2003). Westinghouse AP1000 advanced passive
plant. In Proceedings of ICAPP, Vol. 3, pp. 4-7.
31. Westinghouse Electric (2000). Westinghouse AP600 Design Control Document. US-NRC
Publication, ML003691016 (http://pbadupws.nrc.gov/docs/ML0036/ML003691016.html).
32. Westinghouse Electric (2011). Westinghouse AP1000 Design Control Document. US-NRC
Publication, ML11171A500 (http://pbadupws.nrc.gov/docs/ML1117/ML11171A500.html).
System-Level Heat Transfer Analysis, Thermal-Mechanical Cyclic Stress Analysis, and Environmental Fatigue Modeling of a Two-Loop Pressurized Water Reactor: A Preliminary Study April 2015
ANL/LWRS-15/01
37
33. International Atomic Energy Agency (2005). Natural Circulation in Water Cooled Nuclear Power
Plants Phenomena, Models and Methodology for System Reliability Assessments. International
Atomic Energy Agency Report ISEA-TECHDOC-1474.
34. Sengers, J. V., Watson, J. T. R., Basu, R. S., Kamgar‐Parsi, B., & Hendricks, R. C. (1984).
Representative equations for the thermal conductivity of water substance. Journal of Physical and
Chemical Reference Data, 13(3), 893-933.
35. American Society of Mechanical Engineers (2010). ASME Boiler and Pressure Vessel Code,
section III.

System-Level Heat Transfer Analysis, Thermal-Mechanical Cyclic Stress Analysis, and Environmental Fatigue Modeling of a Two-Loop
Pressurized Water Reactor: A Preliminary Study
April 2015
ANL/LWRS-15/01 38
This page intentionally left blank

Argonne National Laboratory is a U.S. Department of Energy laboratory managed by UChicago Argonne, LLC
Nuclear Engineering Division Argonne National Laboratory
9700 South Cass Avenue, Bldg. 208
Argonne, IL 60439
www.anl.gov