Embed Size (px)
Citation preview
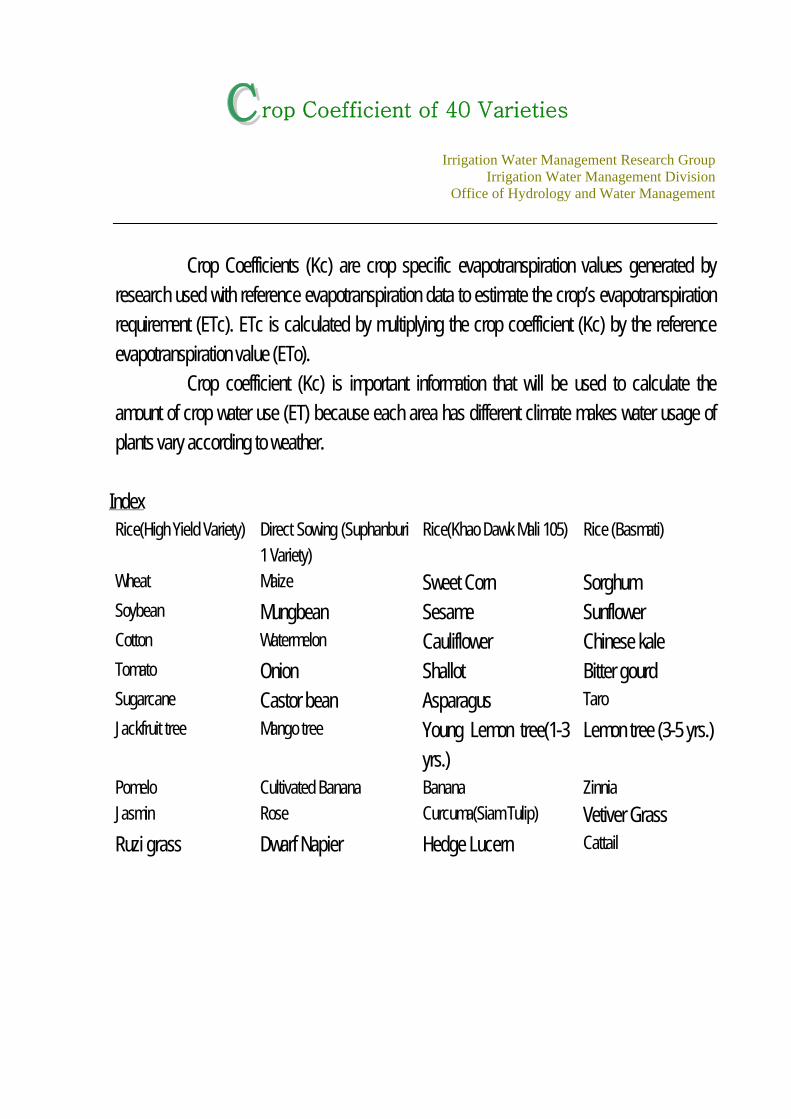
rop Coefficient of 40 Varieties
Irrigation Water Management Research Group
Irrigation Water Management Division Office of Hydrology and Water Management
Crop Coefficients (Kc) are crop specific evapotranspiration values generated by
research used with reference evapotranspiration data to estimate the crop’s evapotranspiration
requirement (ETc). ETc is calculated by multiplying the crop coefficient (Kc) by the reference
evapotranspiration value (ETo).
Crop coefficient (Kc) is important information that will be used to calculate the
amount of crop water use (ET) because each area has different climate makes water usage of
plants vary according to weather.
Index Rice(High Yield Variety) Direct Sowing (Suphanburi
1 Variety)
Rice(Khao Dawk Mali 105) Rice (Basmati)
Wheat Maize Sweet Corn Sorghum
Soybean Mungbean Sesame Sunflower Cotton Watermelon Cauliflower Chinese kale
Tomato Onion Shallot Bitter gourd
Sugarcane Castor bean Asparagus Taro
Jackfruit tree Mango tree Young Lemon tree(1-3
yrs.)
Lemon tree (3-5 yrs.)
Pomelo Cultivated Banana Banana Zinnia
Jasmin Rose Curcuma(Siam Tulip) Vetiver Grass
Ruzi grass Dwarf Napier Hedge Lucern Cattail
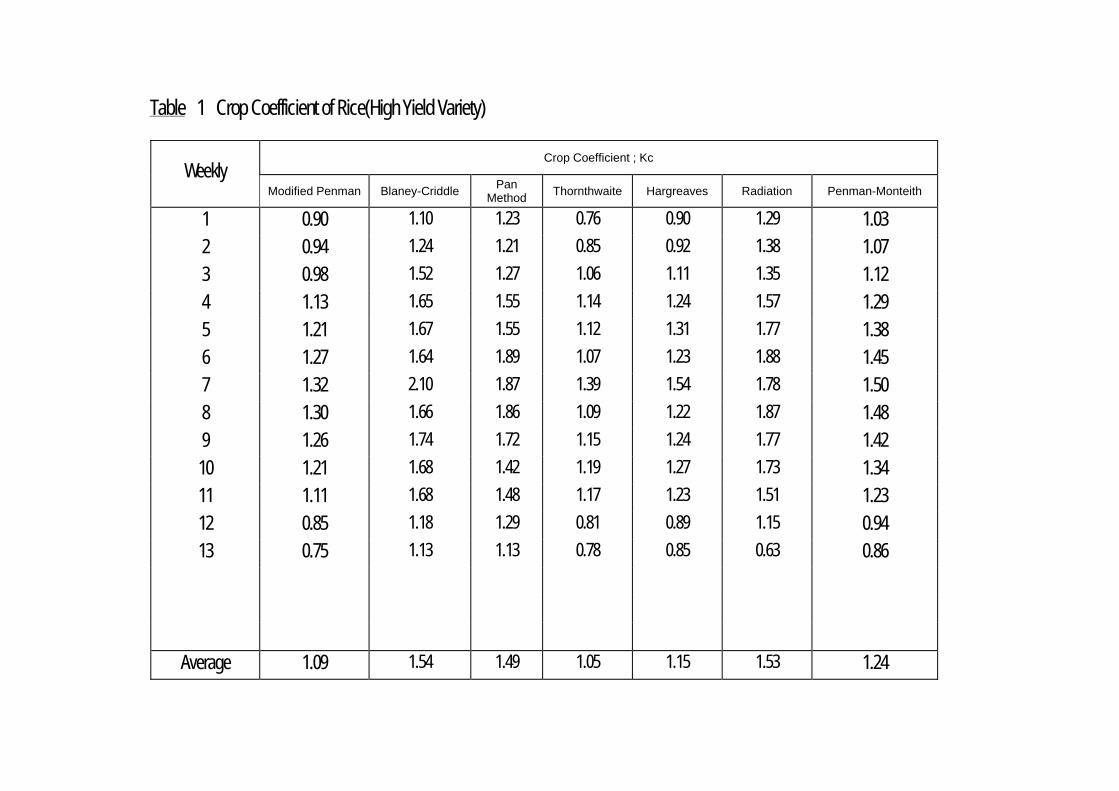
Table 1 Crop Coefficient of Rice(High Yield Variety)
Crop Coefficient ; Kc Weekly
Modified Penman
Blaney-Criddle Pan
Method Thornthwaite Hargreaves Radiation Penman-Monteith
1 0.90 1.10 1.23 0.76 0.90 1.29 1.03
2 0.94 1.24 1.21 0.85 0.92 1.38 1.07
3 0.98 1.52 1.27 1.06 1.11 1.35 1.12
4 1.13 1.65 1.55 1.14 1.24 1.57 1.29
5 1.21 1.67 1.55 1.12 1.31 1.77 1.38
6 1.27 1.64 1.89 1.07 1.23 1.88 1.45
7 1.32 2.10 1.87 1.39 1.54 1.78 1.50
8 1.30 1.66 1.86 1.09 1.22 1.87 1.48
9 1.26 1.74 1.72 1.15 1.24 1.77 1.42
10 1.21 1.68 1.42 1.19 1.27 1.73 1.34
11 1.11 1.68 1.48 1.17 1.23 1.51 1.23
12 0.85 1.18 1.29 0.81 0.89 1.15 0.94
13 0.75 1.13 1.13 0.78 0.85 0.63 0.86
Average 1.09 1.54 1.49 1.05 1.15 1.53 1.24
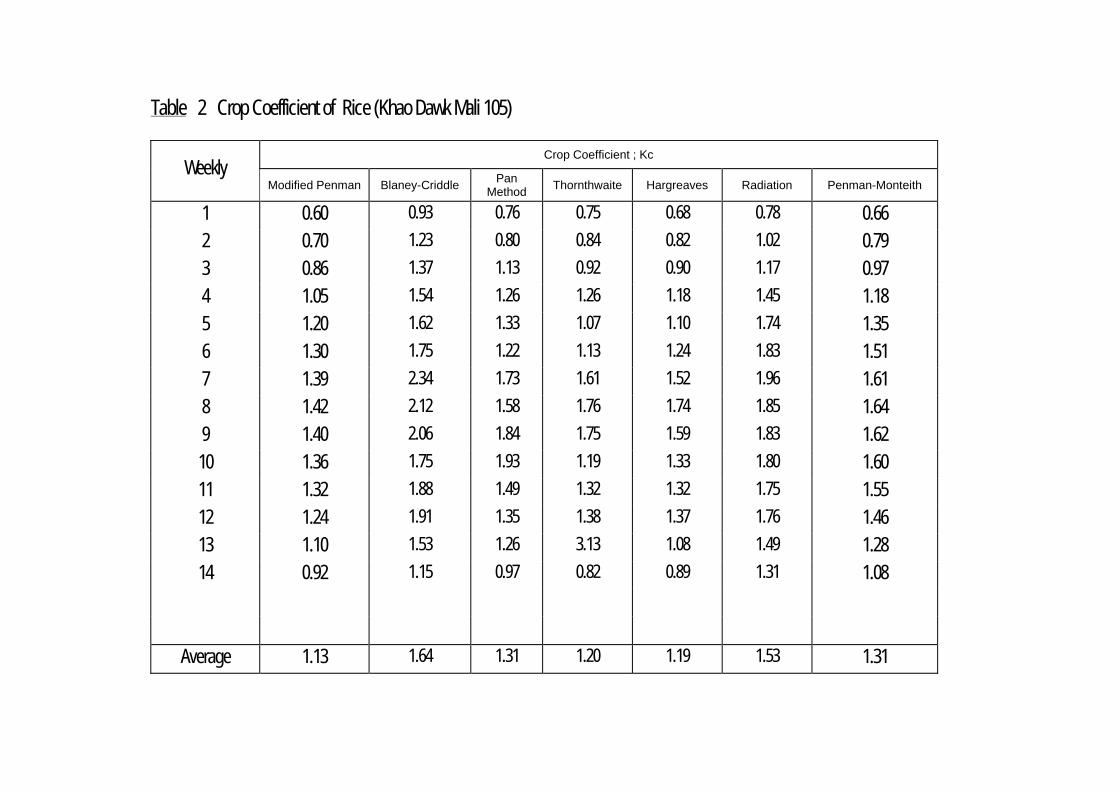
Table 2 Crop Coefficient of Rice (Khao Dawk Mali 105)
Crop Coefficient ; Kc Weekly
Modified Penman
Blaney-Criddle Pan
Method Thornthwaite Hargreaves Radiation Penman-Monteith
1 0.60 0.93 0.76 0.75 0.68 0.78 0.66
2 0.70 1.23 0.80 0.84 0.82 1.02 0.79
3 0.86 1.37 1.13 0.92 0.90 1.17 0.97
4 1.05 1.54 1.26 1.26 1.18 1.45 1.18
5 1.20 1.62 1.33 1.07 1.10 1.74 1.35
6 1.30 1.75 1.22 1.13 1.24 1.83 1.51
7 1.39 2.34 1.73 1.61 1.52 1.96 1.61
8 1.42 2.12 1.58 1.76 1.74 1.85 1.64
9 1.40 2.06 1.84 1.75 1.59 1.83 1.62
10 1.36 1.75 1.93 1.19 1.33 1.80 1.60
11 1.32 1.88 1.49 1.32 1.32 1.75 1.55
12 1.24 1.91 1.35 1.38 1.37 1.76 1.46
13 1.10 1.53 1.26 3.13 1.08 1.49 1.28
14 0.92 1.15 0.97 0.82 0.89 1.31 1.08
Average 1.13 1.64 1.31 1.20 1.19 1.53 1.31
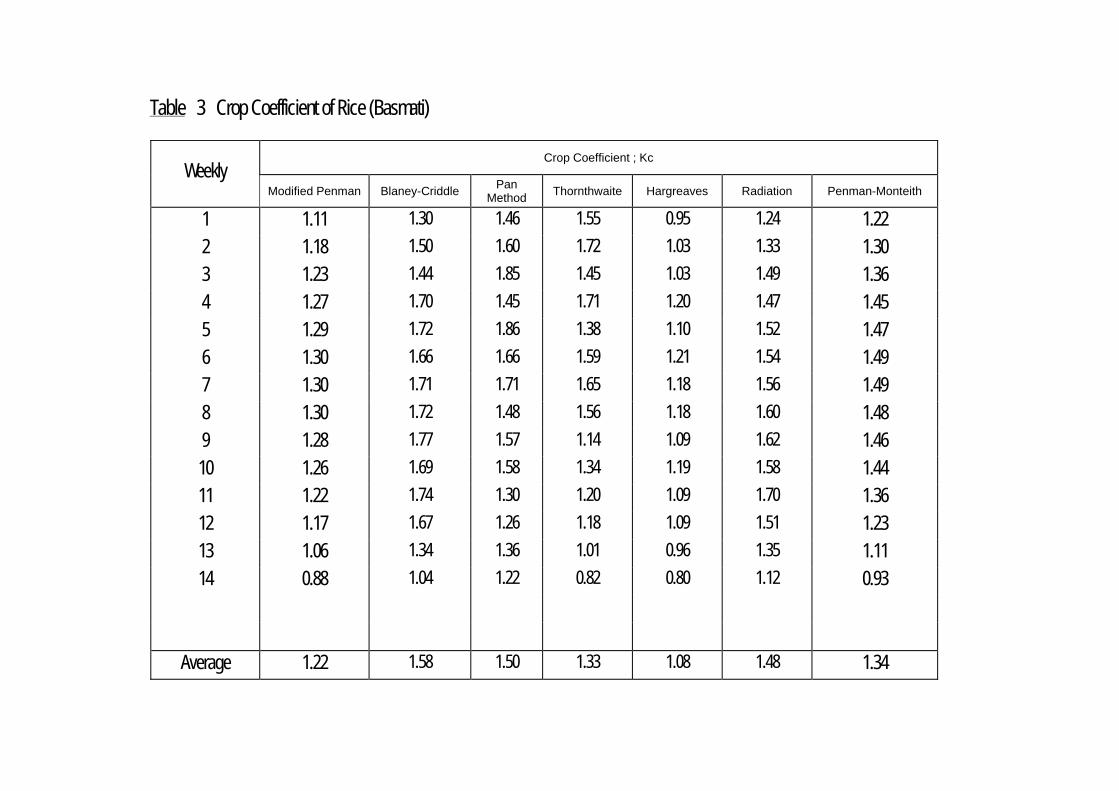
Table 3 Crop Coefficient of Rice (Basmati)
Crop Coefficient ; Kc Weekly
Modified Penman
Blaney-Criddle Pan
Method Thornthwaite Hargreaves Radiation Penman-Monteith
1 1.11 1.30 1.46 1.55 0.95 1.24 1.22
2 1.18 1.50 1.60 1.72 1.03 1.33 1.30
3 1.23 1.44 1.85 1.45 1.03 1.49 1.36
4 1.27 1.70 1.45 1.71 1.20 1.47 1.45
5 1.29 1.72 1.86 1.38 1.10 1.52 1.47
6 1.30 1.66 1.66 1.59 1.21 1.54 1.49
7 1.30 1.71 1.71 1.65 1.18 1.56 1.49
8 1.30 1.72 1.48 1.56 1.18 1.60 1.48
9 1.28 1.77 1.57 1.14 1.09 1.62 1.46
10 1.26 1.69 1.58 1.34 1.19 1.58 1.44
11 1.22 1.74 1.30 1.20 1.09 1.70 1.36
12 1.17 1.67 1.26 1.18 1.09 1.51 1.23
13 1.06 1.34 1.36 1.01 0.96 1.35 1.11
14 0.88 1.04 1.22 0.82 0.80 1.12 0.93
Average 1.22 1.58 1.50 1.33 1.08 1.48 1.34
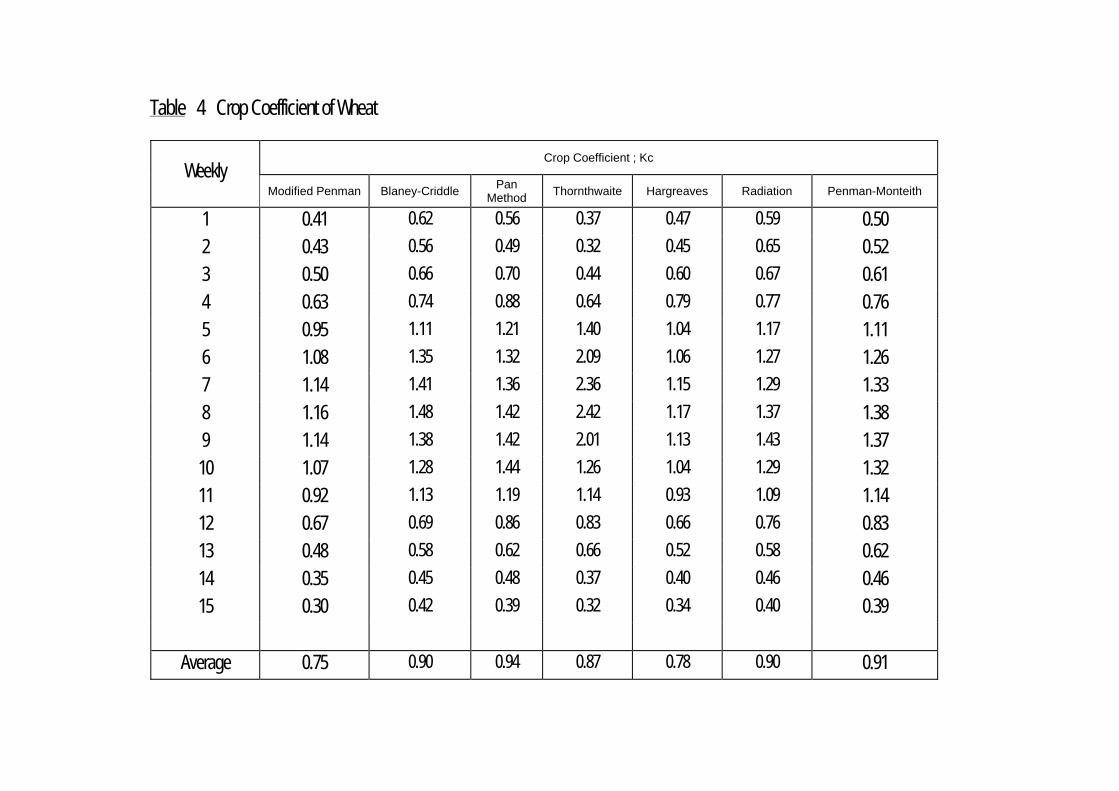
Table 4 Crop Coefficient of Wheat
Crop Coefficient ; Kc Weekly
Modified Penman
Blaney-Criddle Pan
Method Thornthwaite Hargreaves Radiation Penman-Monteith
1 0.41 0.62 0.56 0.37 0.47 0.59 0.50
2 0.43 0.56 0.49 0.32 0.45 0.65 0.52
3 0.50 0.66 0.70 0.44 0.60 0.67 0.61
4 0.63 0.74 0.88 0.64 0.79 0.77 0.76
5 0.95 1.11 1.21 1.40 1.04 1.17 1.11
6 1.08 1.35 1.32 2.09 1.06 1.27 1.26
7 1.14 1.41 1.36 2.36 1.15 1.29 1.33
8 1.16 1.48 1.42 2.42 1.17 1.37 1.38
9 1.14 1.38 1.42 2.01 1.13 1.43 1.37
10 1.07 1.28 1.44 1.26 1.04 1.29 1.32
11 0.92 1.13 1.19 1.14 0.93 1.09 1.14
12 0.67 0.69 0.86 0.83 0.66 0.76 0.83
13 0.48 0.58 0.62 0.66 0.52 0.58 0.62
14 0.35 0.45 0.48 0.37 0.40 0.46 0.46
15 0.30 0.42 0.39 0.32 0.34 0.40 0.39
Average 0.75 0.90 0.94 0.87 0.78 0.90 0.91
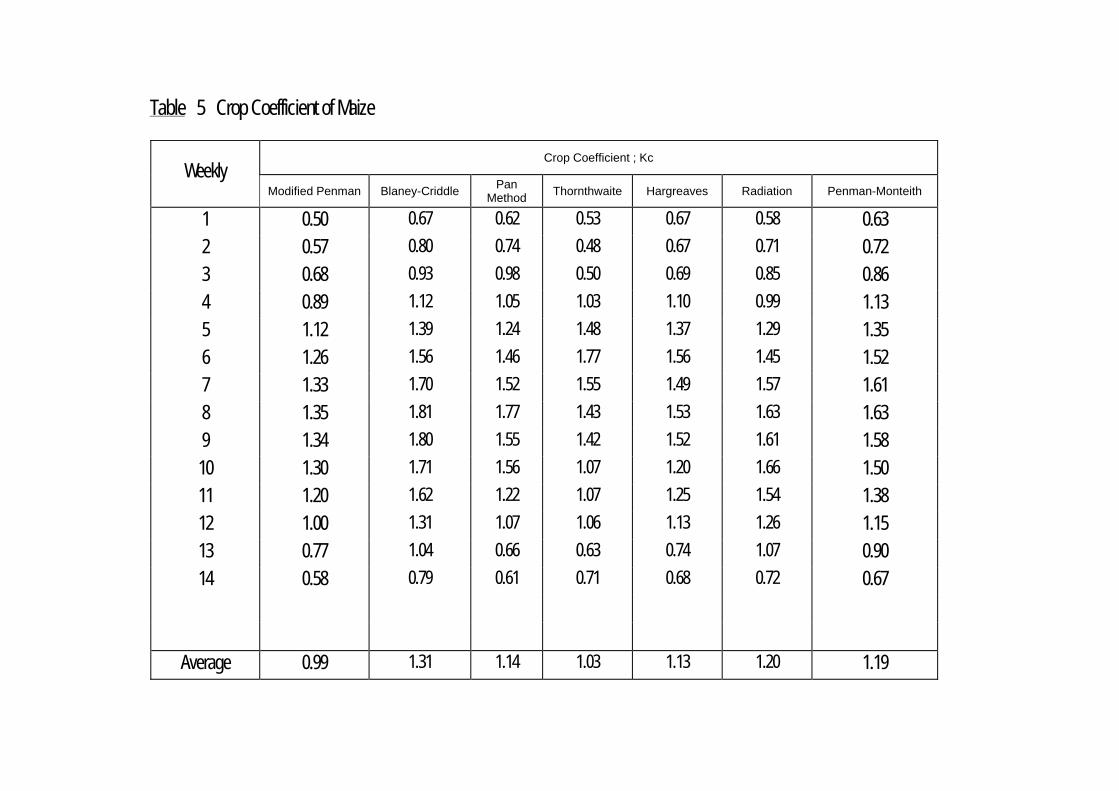
Table 5 Crop Coefficient of Maize
Crop Coefficient ; Kc Weekly
Modified Penman
Blaney-Criddle Pan
Method Thornthwaite Hargreaves Radiation Penman-Monteith
1 0.50 0.67 0.62 0.53 0.67 0.58 0.63
2 0.57 0.80 0.74 0.48 0.67 0.71 0.72
3 0.68 0.93 0.98 0.50 0.69 0.85 0.86
4 0.89 1.12 1.05 1.03 1.10 0.99 1.13
5 1.12 1.39 1.24 1.48 1.37 1.29 1.35
6 1.26 1.56 1.46 1.77 1.56 1.45 1.52
7 1.33 1.70 1.52 1.55 1.49 1.57 1.61
8 1.35 1.81 1.77 1.43 1.53 1.63 1.63
9 1.34 1.80 1.55 1.42 1.52 1.61 1.58
10 1.30 1.71 1.56 1.07 1.20 1.66 1.50
11 1.20 1.62 1.22 1.07 1.25 1.54 1.38
12 1.00 1.31 1.07 1.06 1.13 1.26 1.15
13 0.77 1.04 0.66 0.63 0.74 1.07 0.90
14 0.58 0.79 0.61 0.71 0.68 0.72 0.67
Average 0.99 1.31 1.14 1.03 1.13 1.20 1.19
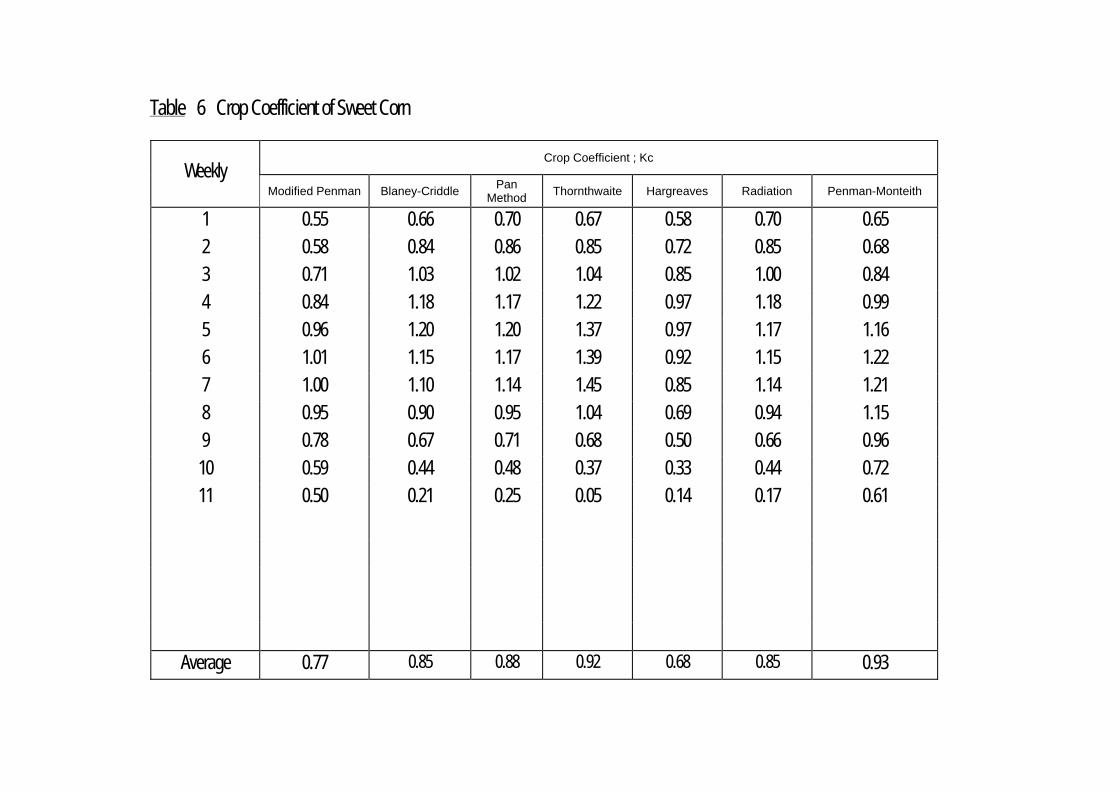
Table 6 Crop Coefficient of Sweet Corn
Crop Coefficient ; Kc Weekly
Modified Penman
Blaney-Criddle Pan
Method Thornthwaite Hargreaves Radiation Penman-Monteith
1 0.55 0.66 0.70 0.67 0.58 0.70 0.65
2 0.58 0.84 0.86 0.85 0.72 0.85 0.68
3 0.71 1.03 1.02 1.04 0.85 1.00 0.84
4 0.84 1.18 1.17 1.22 0.97 1.18 0.99
5 0.96 1.20 1.20 1.37 0.97 1.17 1.16
6 1.01 1.15 1.17 1.39 0.92 1.15 1.22
7 1.00 1.10 1.14 1.45 0.85 1.14 1.21
8 0.95 0.90 0.95 1.04 0.69 0.94 1.15
9 0.78 0.67 0.71 0.68 0.50 0.66 0.96
10 0.59 0.44 0.48 0.37 0.33 0.44 0.72
11 0.50 0.21 0.25 0.05 0.14 0.17 0.61
Average 0.77 0.85 0.88 0.92 0.68 0.85 0.93
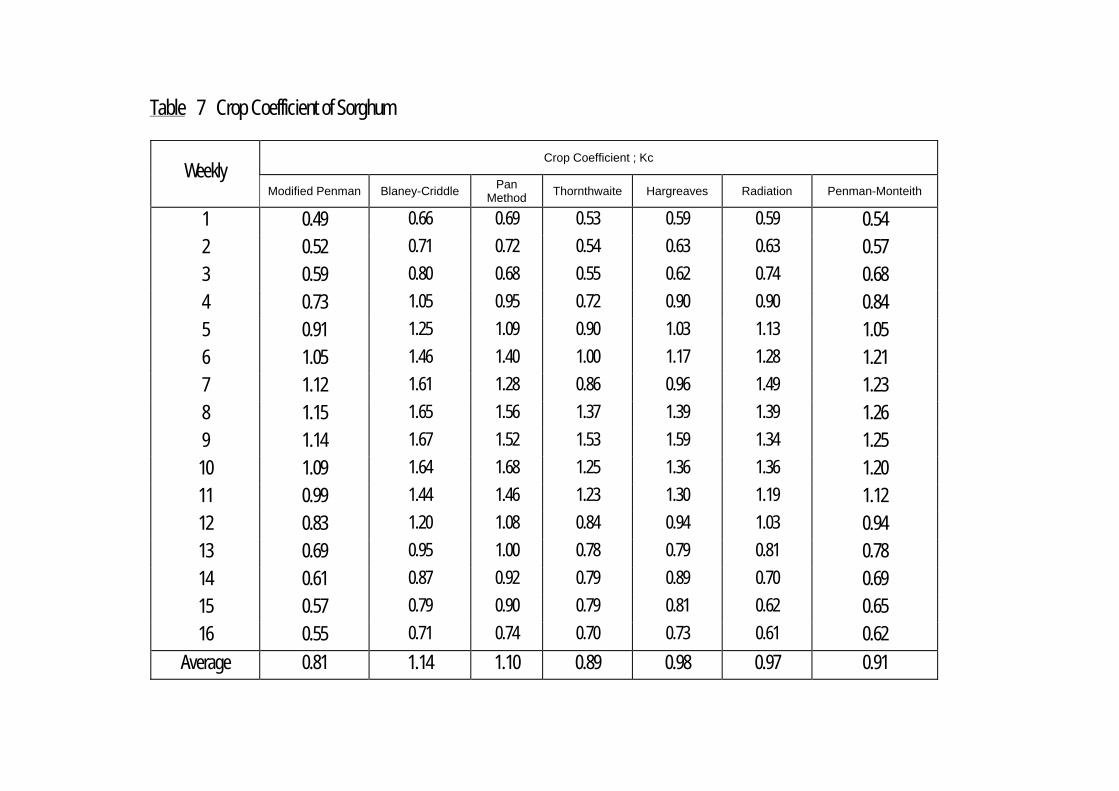
Table 7 Crop Coefficient of Sorghum
Crop Coefficient ; Kc Weekly
Modified Penman
Blaney-Criddle Pan
Method Thornthwaite Hargreaves Radiation Penman-Monteith
1 0.49 0.66 0.69 0.53 0.59 0.59 0.54
2 0.52 0.71 0.72 0.54 0.63 0.63 0.57
3 0.59 0.80 0.68 0.55 0.62 0.74 0.68
4 0.73 1.05 0.95 0.72 0.90 0.90 0.84
5 0.91 1.25 1.09 0.90 1.03 1.13 1.05
6 1.05 1.46 1.40 1.00 1.17 1.28 1.21
7 1.12 1.61 1.28 0.86 0.96 1.49 1.23
8 1.15 1.65 1.56 1.37 1.39 1.39 1.26
9 1.14 1.67 1.52 1.53 1.59 1.34 1.25
10 1.09 1.64 1.68 1.25 1.36 1.36 1.20
11 0.99 1.44 1.46 1.23 1.30 1.19 1.12
12 0.83 1.20 1.08 0.84 0.94 1.03 0.94
13 0.69 0.95 1.00 0.78 0.79 0.81 0.78
14 0.61 0.87 0.92 0.79 0.89 0.70 0.69
15 0.57 0.79 0.90 0.79 0.81 0.62 0.65
16 0.55 0.71 0.74 0.70 0.73 0.61 0.62
Average 0.81 1.14 1.10 0.89 0.98 0.97 0.91
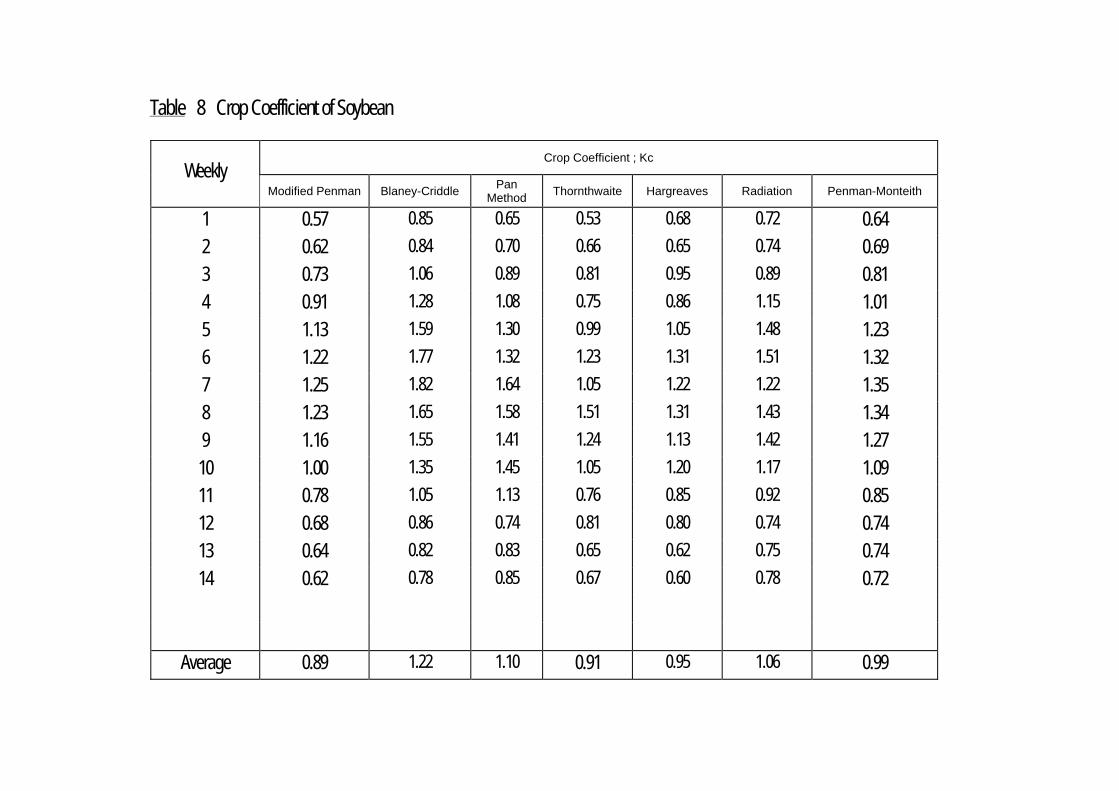
Table 8 Crop Coefficient of Soybean
Crop Coefficient ; Kc Weekly
Modified Penman
Blaney-Criddle Pan
Method Thornthwaite Hargreaves Radiation Penman-Monteith
1 0.57 0.85 0.65 0.53 0.68 0.72 0.64
2 0.62 0.84 0.70 0.66 0.65 0.74 0.69
3 0.73 1.06 0.89 0.81 0.95 0.89 0.81
4 0.91 1.28 1.08 0.75 0.86 1.15 1.01
5 1.13 1.59 1.30 0.99 1.05 1.48 1.23
6 1.22 1.77 1.32 1.23 1.31 1.51 1.32
7 1.25 1.82 1.64 1.05 1.22 1.22 1.35
8 1.23 1.65 1.58 1.51 1.31 1.43 1.34
9 1.16 1.55 1.41 1.24 1.13 1.42 1.27
10 1.00 1.35 1.45 1.05 1.20 1.17 1.09
11 0.78 1.05 1.13 0.76 0.85 0.92 0.85
12 0.68 0.86 0.74 0.81 0.80 0.74 0.74
13 0.64 0.82 0.83 0.65 0.62 0.75 0.74
14 0.62 0.78 0.85 0.67 0.60 0.78 0.72
Average 0.89 1.22 1.10 0.91 0.95 1.06 0.99
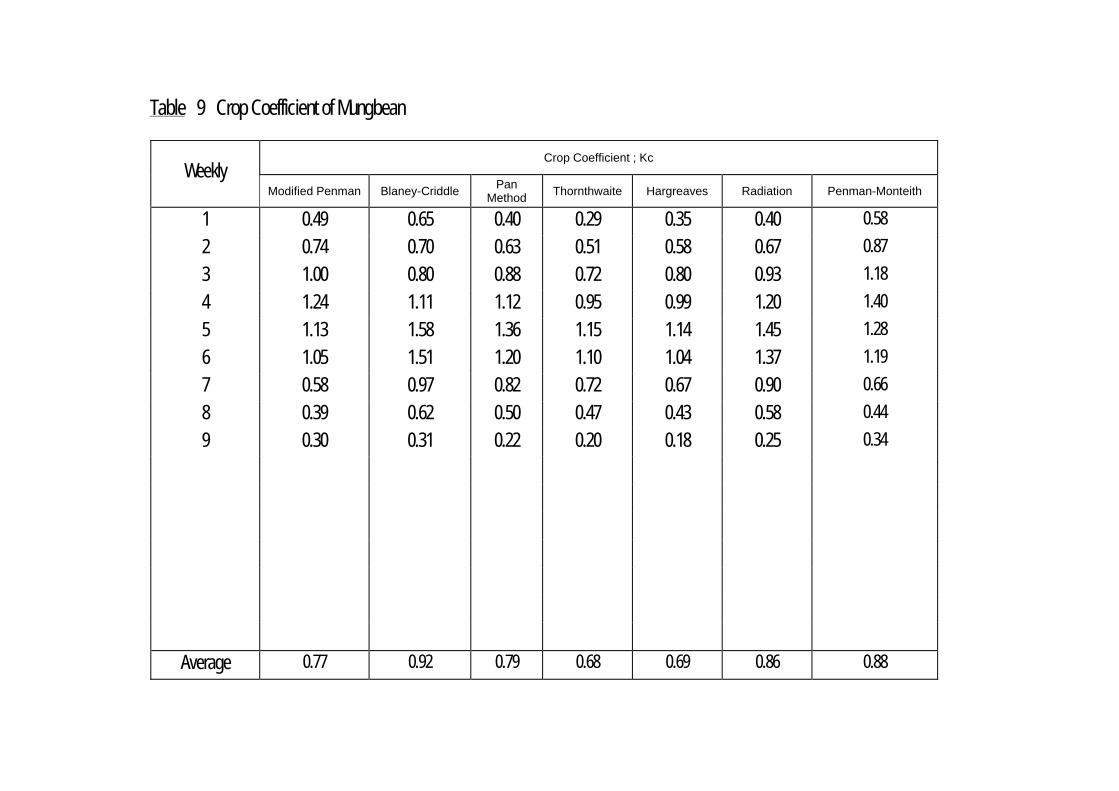
Table 9 Crop Coefficient of Mungbean
Crop Coefficient ; Kc Weekly
Modified Penman
Blaney-Criddle Pan
Method Thornthwaite Hargreaves Radiation Penman-Monteith
1 0.49 0.65 0.40 0.29 0.35 0.40 0.58
2 0.74 0.70 0.63 0.51 0.58 0.67 0.87
3 1.00 0.80 0.88 0.72 0.80 0.93 1.18
4 1.24 1.11 1.12 0.95 0.99 1.20 1.40
5 1.13 1.58 1.36 1.15 1.14 1.45 1.28
6 1.05 1.51 1.20 1.10 1.04 1.37 1.19
7 0.58 0.97 0.82 0.72 0.67 0.90 0.66
8 0.39 0.62 0.50 0.47 0.43 0.58 0.44
9 0.30 0.31 0.22 0.20 0.18 0.25 0.34
Average 0.77 0.92 0.79 0.68 0.69 0.86 0.88
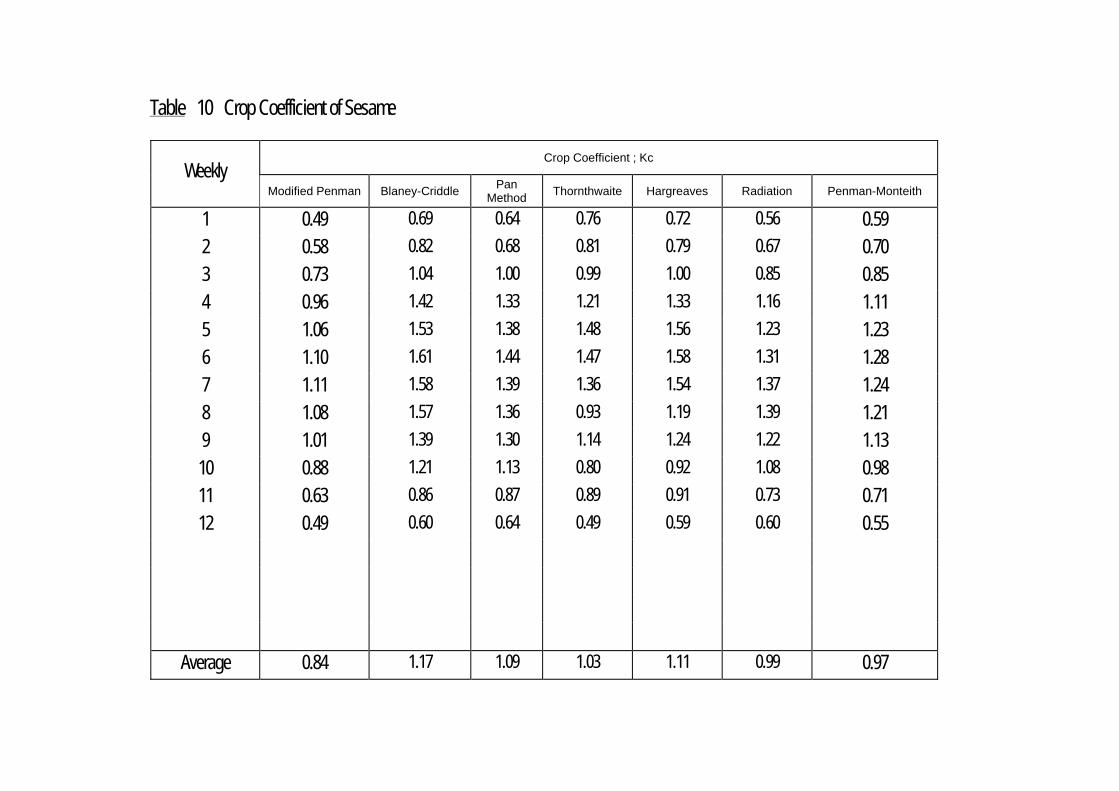
Table 10 Crop Coefficient of Sesame
Crop Coefficient ; Kc Weekly
Modified Penman
Blaney-Criddle Pan
Method Thornthwaite Hargreaves Radiation Penman-Monteith
1 0.49 0.69 0.64 0.76 0.72 0.56 0.59
2 0.58 0.82 0.68 0.81 0.79 0.67 0.70
3 0.73 1.04 1.00 0.99 1.00 0.85 0.85
4 0.96 1.42 1.33 1.21 1.33 1.16 1.11
5 1.06 1.53 1.38 1.48 1.56 1.23 1.23
6 1.10 1.61 1.44 1.47 1.58 1.31 1.28
7 1.11 1.58 1.39 1.36 1.54 1.37 1.24
8 1.08 1.57 1.36 0.93 1.19 1.39 1.21
9 1.01 1.39 1.30 1.14 1.24 1.22 1.13
10 0.88 1.21 1.13 0.80 0.92 1.08 0.98
11 0.63 0.86 0.87 0.89 0.91 0.73 0.71
12 0.49 0.60 0.64 0.49 0.59 0.60 0.55
Average 0.84 1.17 1.09 1.03 1.11 0.99 0.97
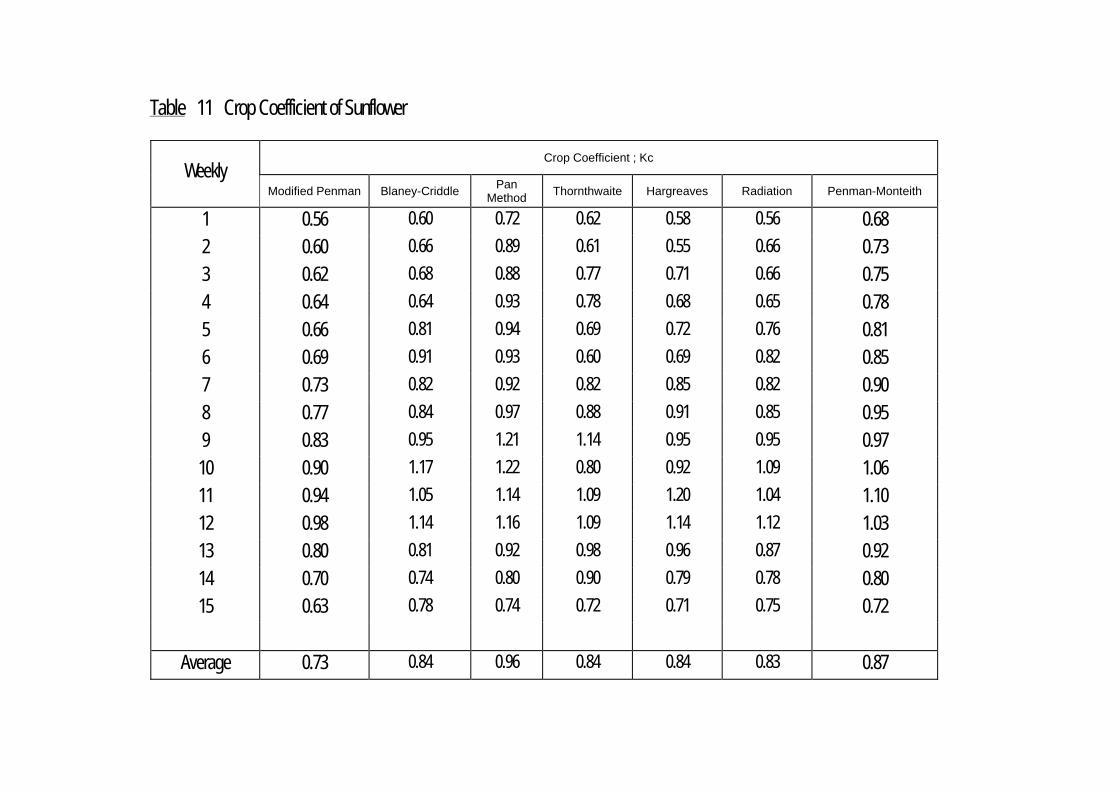
Table 11 Crop Coefficient of Sunflower
Crop Coefficient ; Kc Weekly
Modified Penman
Blaney-Criddle Pan
Method Thornthwaite Hargreaves Radiation Penman-Monteith
1 0.56 0.60 0.72 0.62 0.58 0.56 0.68
2 0.60 0.66 0.89 0.61 0.55 0.66 0.73
3 0.62 0.68 0.88 0.77 0.71 0.66 0.75
4 0.64 0.64 0.93 0.78 0.68 0.65 0.78
5 0.66 0.81 0.94 0.69 0.72 0.76 0.81
6 0.69 0.91 0.93 0.60 0.69 0.82 0.85
7 0.73 0.82 0.92 0.82 0.85 0.82 0.90
8 0.77 0.84 0.97 0.88 0.91 0.85 0.95
9 0.83 0.95 1.21 1.14 0.95 0.95 0.97
10 0.90 1.17 1.22 0.80 0.92 1.09 1.06
11 0.94 1.05 1.14 1.09 1.20 1.04 1.10
12 0.98 1.14 1.16 1.09 1.14 1.12 1.03
13 0.80 0.81 0.92 0.98 0.96 0.87 0.92
14 0.70 0.74 0.80 0.90 0.79 0.78 0.80
15 0.63 0.78 0.74 0.72 0.71 0.75 0.72
Average 0.73 0.84 0.96 0.84 0.84 0.83 0.87

Table 12 Crop Coefficient of Watermelon
Crop Coefficient ; Kc Weekly
Modified Penman
Blaney-Criddle Pan
Method Thornthwaite Hargreaves Radiation Penman-Monteith
1 0.67 0.73 0.80 0.93 0.58 0.77 1.02
2 0.86 1.00 1.09 1.25 0.73 0.93 1.14
3 1.21 1.44 1.67 1.75 1.07 1.31 1.60
4 1.44 1.64 1.79 1.90 1.21 1.61 1.90
5 1.59 1.83 1.77 2.23 1.33 1.73 2.10
6 1.48 1.87 1.54 2.07 1.25 1.60 1.90
7 1.35 1.84 1.58 1.92 1.19 1.51 1.73
8 1.12 1.32 1.44 1.60 1.03 1.25 1.44
9 0.80 0.99 0.88 1.04 0.70 0.92 1.03
10 0.60 0.78 0.83 0.63 0.52 0.67 0.75
11 0.52 0.71 0.65 0.52 0.47 0.59 0.65
12 0.41 0.56 0.52 0.41 0.35 0.47 0.52
Average 1.01 1.20 1.18 1.21 0.84 1.08 1.32
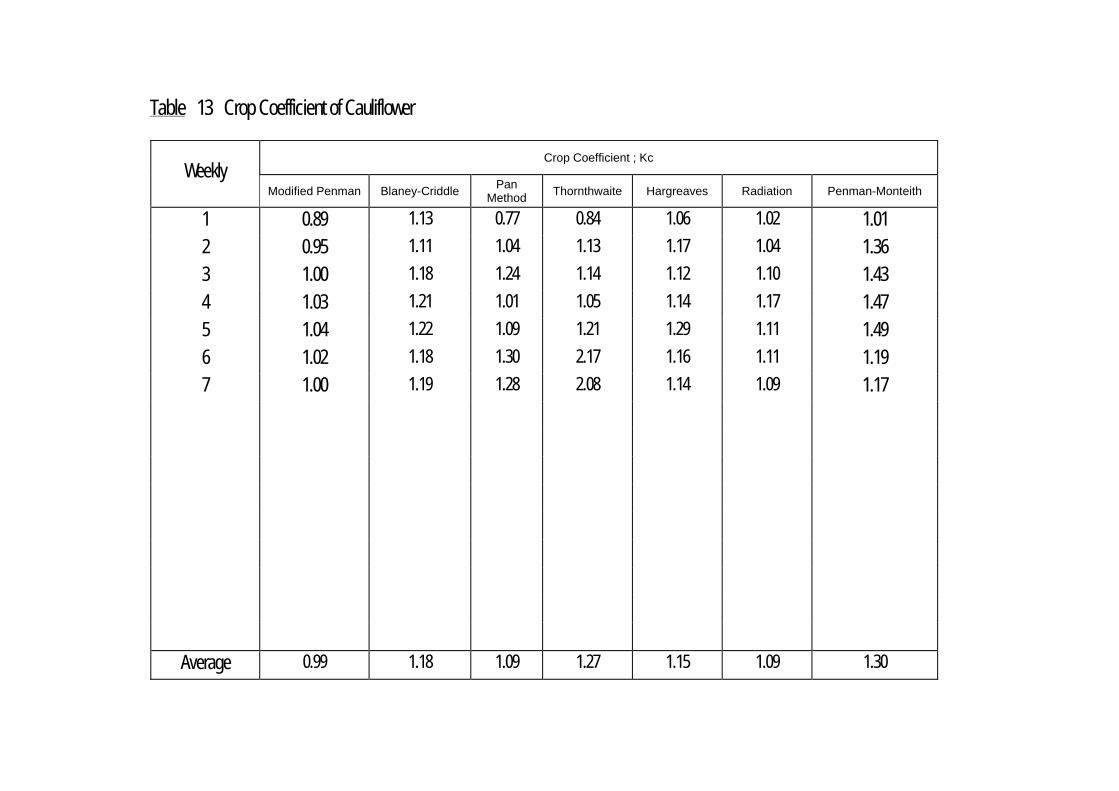
Table 13 Crop Coefficient of Cauliflower
Crop Coefficient ; Kc Weekly
Modified Penman
Blaney-Criddle Pan
Method Thornthwaite Hargreaves Radiation Penman-Monteith
1 0.89 1.13 0.77 0.84 1.06 1.02 1.01
2 0.95 1.11 1.04 1.13 1.17 1.04 1.36
3 1.00 1.18 1.24 1.14 1.12 1.10 1.43
4 1.03 1.21 1.01 1.05 1.14 1.17 1.47
5 1.04 1.22 1.09 1.21 1.29 1.11 1.49
6 1.02 1.18 1.30 2.17 1.16 1.11 1.19
7 1.00 1.19 1.28 2.08 1.14 1.09 1.17
Average 0.99 1.18 1.09 1.27 1.15 1.09 1.30
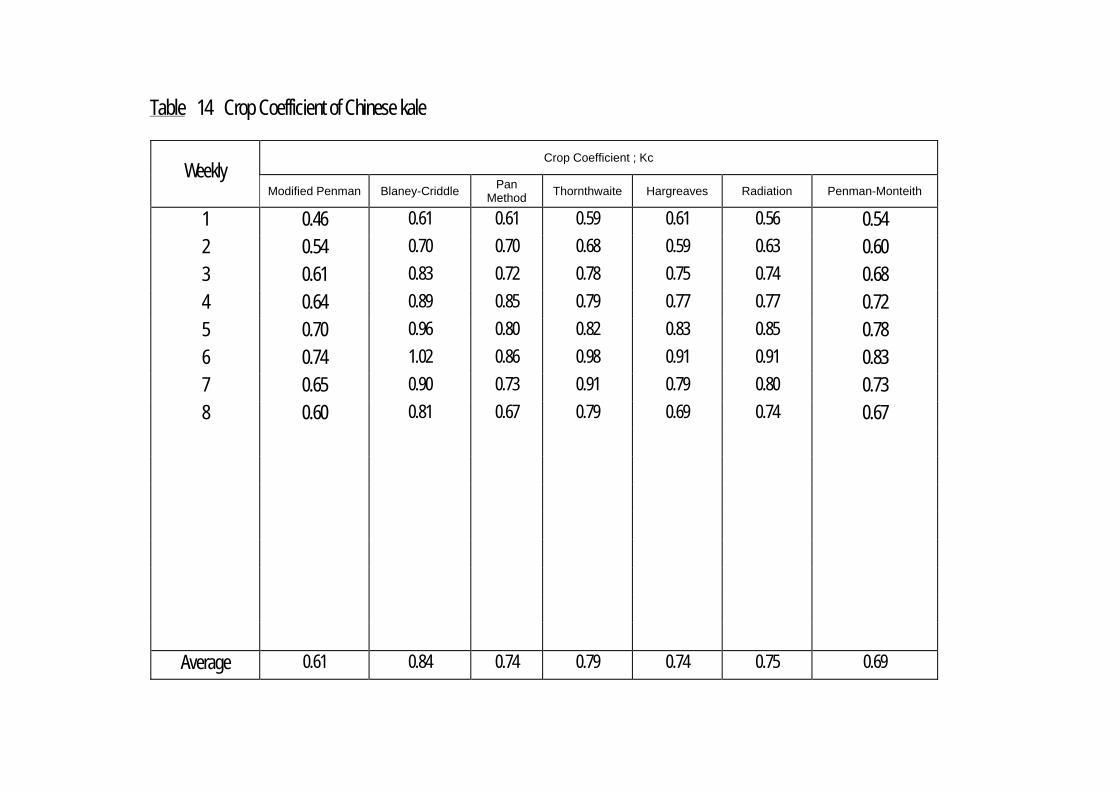
Table 14 Crop Coefficient of Chinese kale
Crop Coefficient ; Kc Weekly
Modified Penman
Blaney-Criddle Pan
Method Thornthwaite Hargreaves Radiation Penman-Monteith
1 0.46 0.61 0.61 0.59 0.61 0.56 0.54
2 0.54 0.70 0.70 0.68 0.59 0.63 0.60
3 0.61 0.83 0.72 0.78 0.75 0.74 0.68
4 0.64 0.89 0.85 0.79 0.77 0.77 0.72
5 0.70 0.96 0.80 0.82 0.83 0.85 0.78
6 0.74 1.02 0.86 0.98 0.91 0.91 0.83
7 0.65 0.90 0.73 0.91 0.79 0.80 0.73
8 0.60 0.81 0.67 0.79 0.69 0.74 0.67
Average 0.61 0.84 0.74 0.79 0.74 0.75 0.69
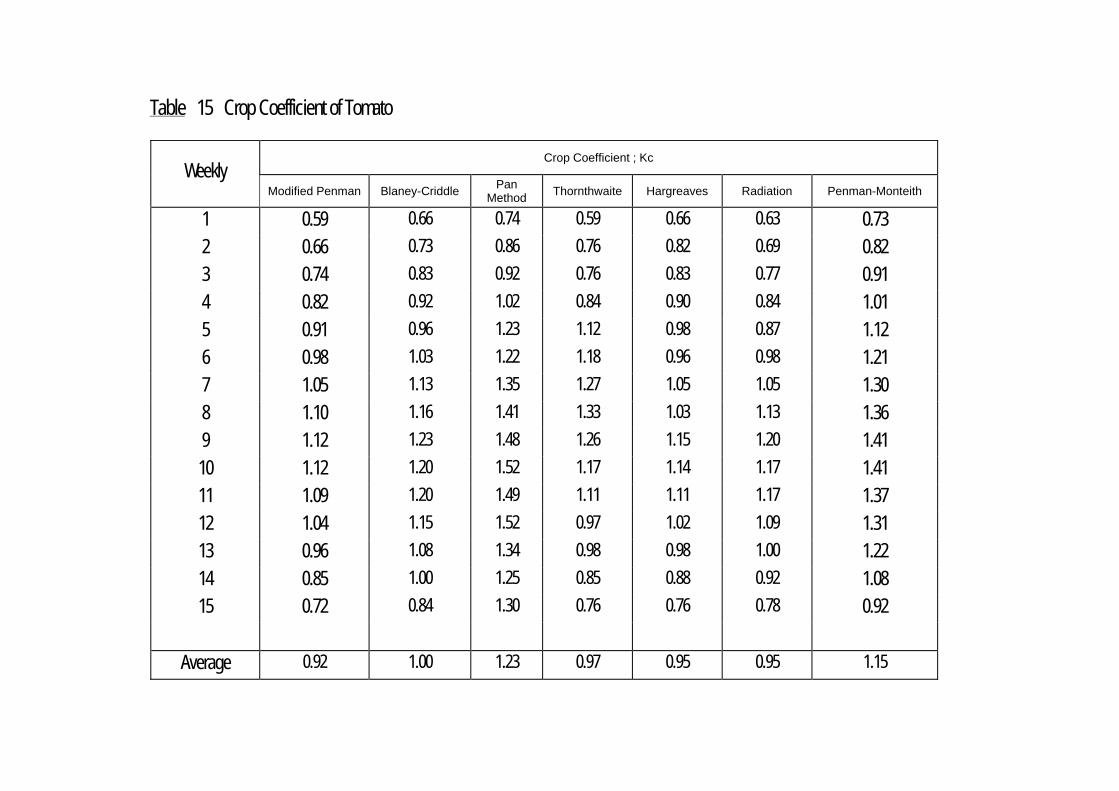
Table 15 Crop Coefficient of Tomato
Crop Coefficient ; Kc Weekly
Modified Penman
Blaney-Criddle Pan
Method Thornthwaite Hargreaves Radiation Penman-Monteith
1 0.59 0.66 0.74 0.59 0.66 0.63 0.73
2 0.66 0.73 0.86 0.76 0.82 0.69 0.82
3 0.74 0.83 0.92 0.76 0.83 0.77 0.91
4 0.82 0.92 1.02 0.84 0.90 0.84 1.01
5 0.91 0.96 1.23 1.12 0.98 0.87 1.12
6 0.98 1.03 1.22 1.18 0.96 0.98 1.21
7 1.05 1.13 1.35 1.27 1.05 1.05 1.30
8 1.10 1.16 1.41 1.33 1.03 1.13 1.36
9 1.12 1.23 1.48 1.26 1.15 1.20 1.41
10 1.12 1.20 1.52 1.17 1.14 1.17 1.41
11 1.09 1.20 1.49 1.11 1.11 1.17 1.37
12 1.04 1.15 1.52 0.97 1.02 1.09 1.31
13 0.96 1.08 1.34 0.98 0.98 1.00 1.22
14 0.85 1.00 1.25 0.85 0.88 0.92 1.08
15 0.72 0.84 1.30 0.76 0.76 0.78 0.92
Average 0.92 1.00 1.23 0.97 0.95 0.95 1.15
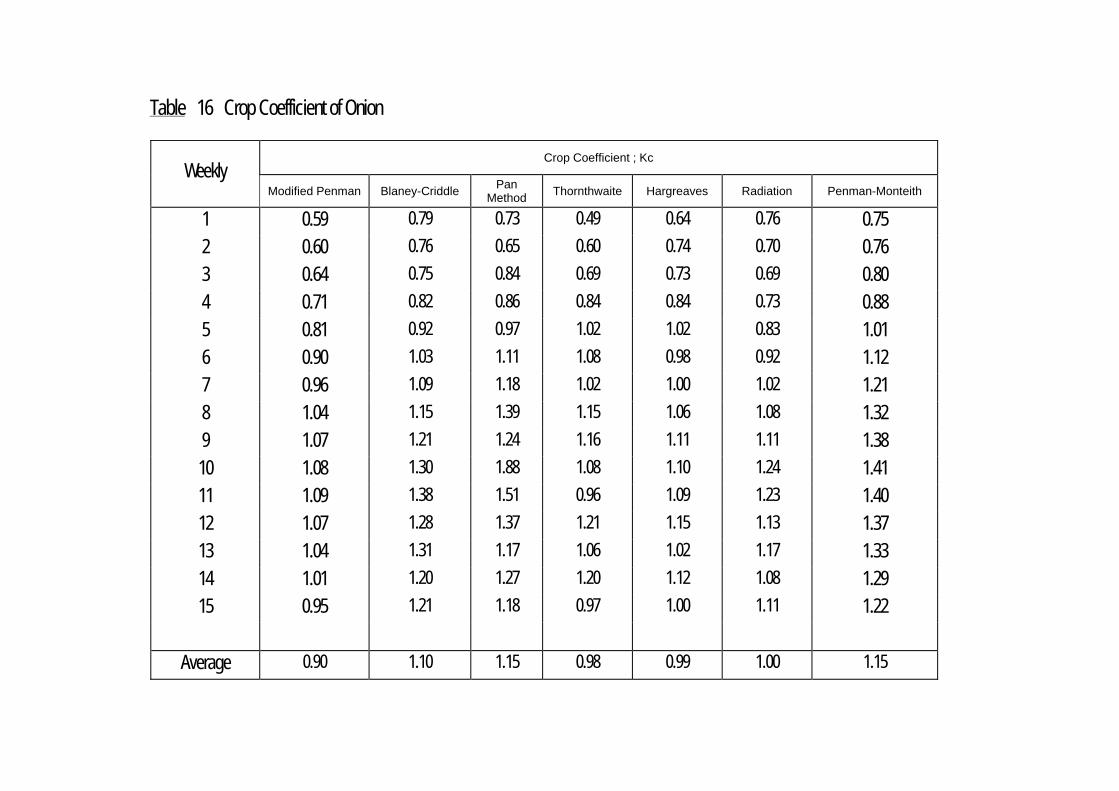
Table 16 Crop Coefficient of Onion
Crop Coefficient ; Kc Weekly
Modified Penman
Blaney-Criddle Pan
Method Thornthwaite Hargreaves Radiation Penman-Monteith
1 0.59 0.79 0.73 0.49 0.64 0.76 0.75
2 0.60 0.76 0.65 0.60 0.74 0.70 0.76
3 0.64 0.75 0.84 0.69 0.73 0.69 0.80
4 0.71 0.82 0.86 0.84 0.84 0.73 0.88
5 0.81 0.92 0.97 1.02 1.02 0.83 1.01
6 0.90 1.03 1.11 1.08 0.98 0.92 1.12
7 0.96 1.09 1.18 1.02 1.00 1.02 1.21
8 1.04 1.15 1.39 1.15 1.06 1.08 1.32
9 1.07 1.21 1.24 1.16 1.11 1.11 1.38
10 1.08 1.30 1.88 1.08 1.10 1.24 1.41
11 1.09 1.38 1.51 0.96 1.09 1.23 1.40
12 1.07 1.28 1.37 1.21 1.15 1.13 1.37
13 1.04 1.31 1.17 1.06 1.02 1.17 1.33
14 1.01 1.20 1.27 1.20 1.12 1.08 1.29
15 0.95 1.21 1.18 0.97 1.00 1.11 1.22
Average 0.90 1.10 1.15 0.98 0.99 1.00 1.15

Table 17 Crop Coefficient of Shallot
Crop Coefficient ; Kc Weekly
Modified Penman
Blaney-Criddle Pan
Method Thornthwaite Hargreaves Radiation Penman-Monteith
1 0.59 0.73 0.76 0.64 0.62 0.65 0.72
2 0.67 0.80 1.07 0.76 0.70 0.70 0.82
3 0.77 0.96 0.99 0.91 0.87 0.87 0.94
4 0.85 1.05 1.18 1.14 1.00 0.87 1.05
5 0.93 1.12 1.06 1.31 1.03 0.93 1.15
6 0.97 1.10 1.23 1.44 1.02 0.99 1.20
7 0.97 1.07 1.20 1.40 0.97 0.99 1.20
8 0.93 1.03 1.21 1.38 0.95 0.95 1.15
9 0.84 0.90 1.17 0.90 0.79 0.86 1.08
10 0.72 0.79 0.90 0.77 0.70 0.75 0.92
11 0.60 0.69 0.83 0.66 0.63 0.60 0.77
12 0.52 0.57 0.66 0.58 0.53 0.53 0.67
Average 0.78 0.89 1.01 0.95 0.81 0.81 0.97
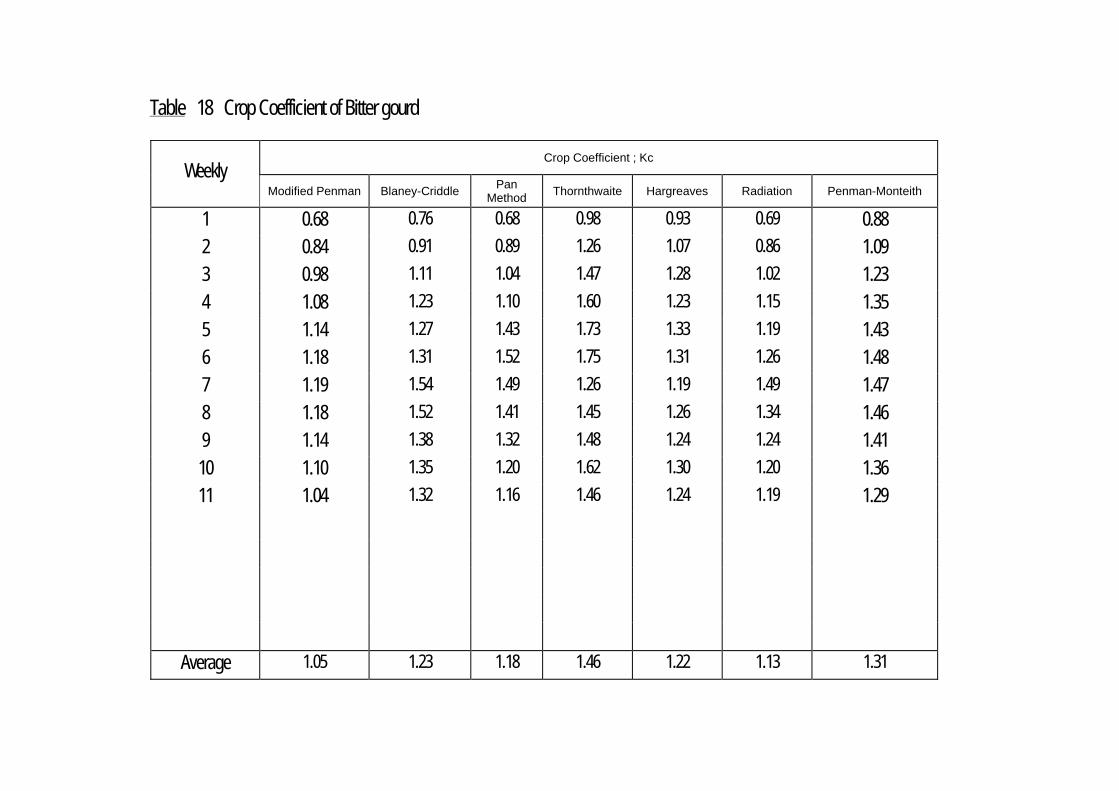
Table 18 Crop Coefficient of Bitter gourd
Crop Coefficient ; Kc Weekly
Modified Penman
Blaney-Criddle Pan
Method Thornthwaite Hargreaves Radiation Penman-Monteith
1 0.68 0.76 0.68 0.98 0.93 0.69 0.88
2 0.84 0.91 0.89 1.26 1.07 0.86 1.09
3 0.98 1.11 1.04 1.47 1.28 1.02 1.23
4 1.08 1.23 1.10 1.60 1.23 1.15 1.35
5 1.14 1.27 1.43 1.73 1.33 1.19 1.43
6 1.18 1.31 1.52 1.75 1.31 1.26 1.48
7 1.19 1.54 1.49 1.26 1.19 1.49 1.47
8 1.18 1.52 1.41 1.45 1.26 1.34 1.46
9 1.14 1.38 1.32 1.48 1.24 1.24 1.41
10 1.10 1.35 1.20 1.62 1.30 1.20 1.36
11 1.04 1.32 1.16 1.46 1.24 1.19 1.29
Average 1.05 1.23 1.18 1.46 1.22 1.13 1.31
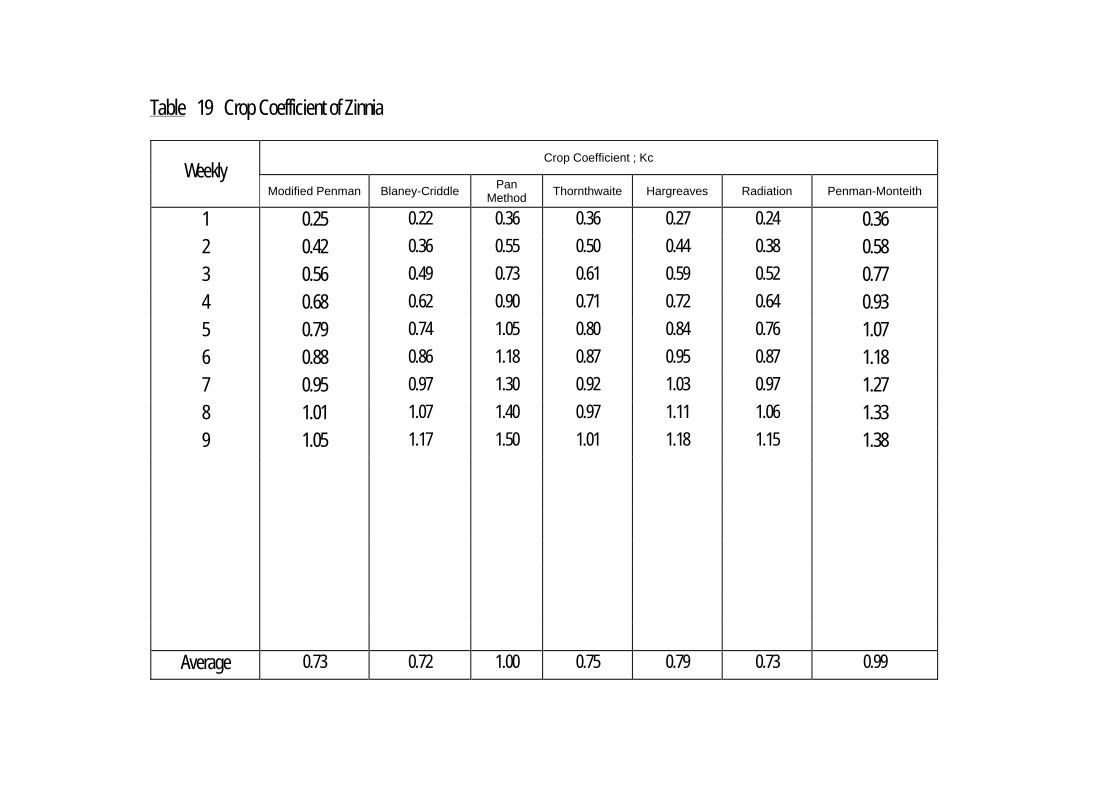
Table 19 Crop Coefficient of Zinnia
Crop Coefficient ; Kc Weekly
Modified Penman
Blaney-Criddle Pan
Method Thornthwaite Hargreaves Radiation Penman-Monteith
1 0.25 0.22 0.36 0.36 0.27 0.24 0.36
2 0.42 0.36 0.55 0.50 0.44 0.38 0.58
3 0.56 0.49 0.73 0.61 0.59 0.52 0.77
4 0.68 0.62 0.90 0.71 0.72 0.64 0.93
5 0.79 0.74 1.05 0.80 0.84 0.76 1.07
6 0.88 0.86 1.18 0.87 0.95 0.87 1.18
7 0.95 0.97 1.30 0.92 1.03 0.97 1.27
8 1.01 1.07 1.40 0.97 1.11 1.06 1.33
9 1.05 1.17 1.50 1.01 1.18 1.15 1.38
Average 0.73 0.72 1.00 0.75 0.79 0.73 0.99
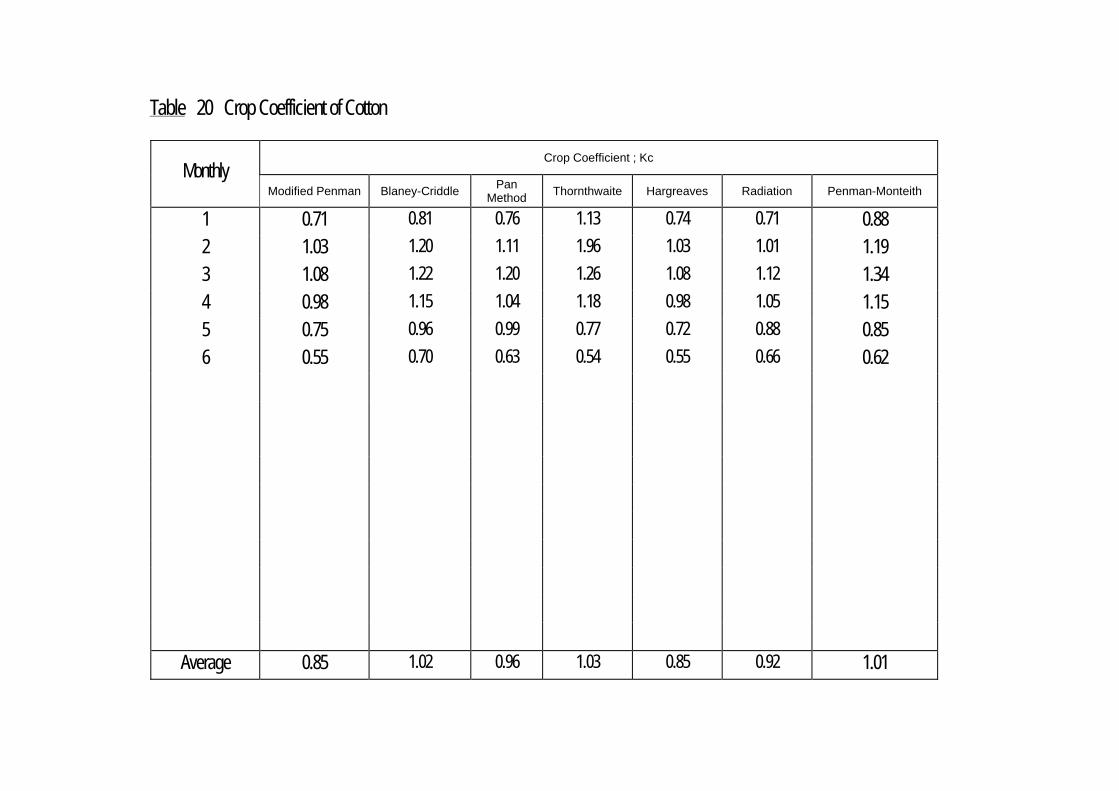
Table 20 Crop Coefficient of Cotton
Crop Coefficient ; Kc Monthly
Modified Penman
Blaney-Criddle Pan
Method Thornthwaite Hargreaves Radiation Penman-Monteith
1 0.71 0.81 0.76 1.13 0.74 0.71 0.88
2 1.03 1.20 1.11 1.96 1.03 1.01 1.19
3 1.08 1.22 1.20 1.26 1.08 1.12 1.34
4 0.98 1.15 1.04 1.18 0.98 1.05 1.15
5 0.75 0.96 0.99 0.77 0.72 0.88 0.85
6 0.55 0.70 0.63 0.54 0.55 0.66 0.62
Average 0.85 1.02 0.96 1.03 0.85 0.92 1.01

Table 21 Crop Coefficient of Sugarcane
Crop Coefficient ; Kc Monthly
Modified Penman
Blaney-Criddle Pan
Method Thornthwaite Hargreaves Radiation Penman-Monteith
1 0.47 0.56 0.56 0.56 0.60 0.53 0.65
2 0.68 0.83 0.84 0.71 0.83 0.80 0.86
3 0.85 1.04 0.94 0.88 1.00 1.04 1.13
4 1.03 1.28 1.27 1.06 1.16 1.21 1.35
5 1.20 1.54 1.73 1.18 1.35 1.41 1.56
6 1.00 1.17 1.50 1.14 1.19 1.06 1.29
7 0.86 0.98 1.23 0.80 1.16 0.96 1.20
8 0.65 0.68 0.74 0.93 0.88 0.63 0.93
9 0.50 0.57 0.48 0.53 0.55 0.53 0.63
10 0.42 0.53 0.45 0.44 0.48 0.48 0.52
Average 0.76 0.90 0.92 0.82 0.91 0.85 1.01
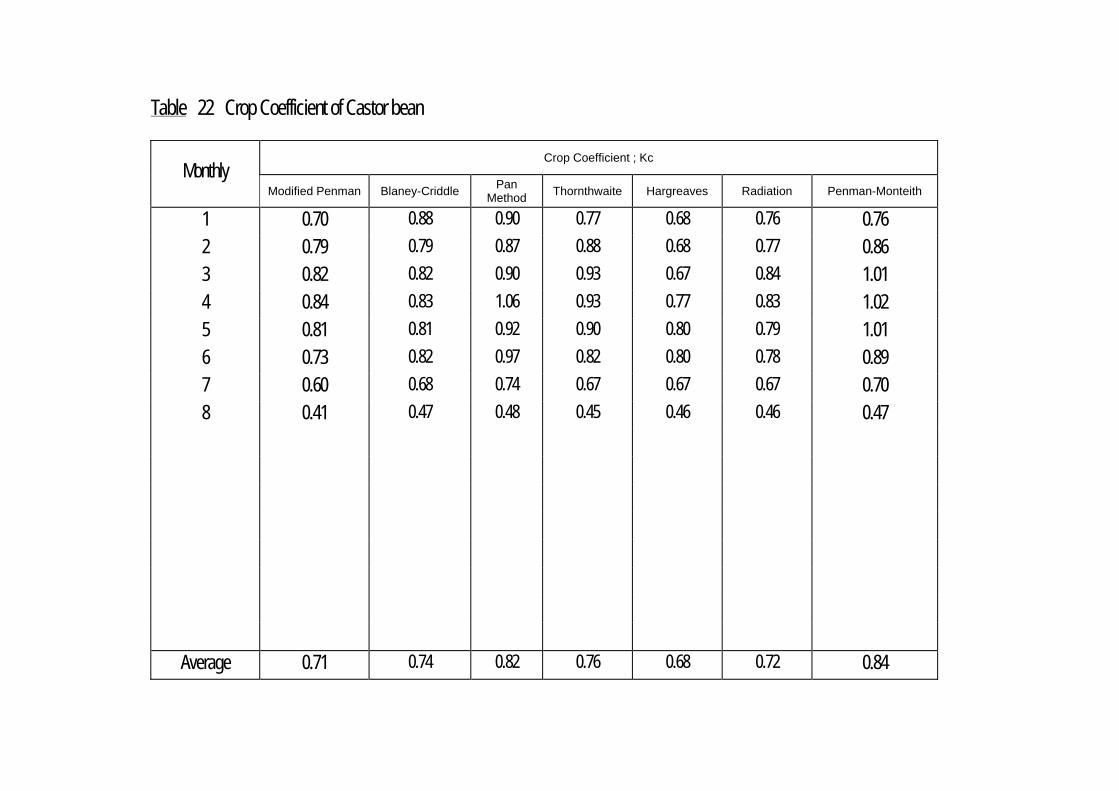
Table 22 Crop Coefficient of Castor bean
Crop Coefficient ; Kc Monthly
Modified Penman
Blaney-Criddle Pan
Method Thornthwaite Hargreaves Radiation Penman-Monteith
1 0.70 0.88 0.90 0.77 0.68 0.76 0.76
2 0.79 0.79 0.87 0.88 0.68 0.77 0.86
3 0.82 0.82 0.90 0.93 0.67 0.84 1.01
4 0.84 0.83 1.06 0.93 0.77 0.83 1.02
5 0.81 0.81 0.92 0.90 0.80 0.79 1.01
6 0.73 0.82 0.97 0.82 0.80 0.78 0.89
7 0.60 0.68 0.74 0.67 0.67 0.67 0.70
8 0.41 0.47 0.48 0.45 0.46 0.46 0.47
Average 0.71 0.74 0.82 0.76 0.68 0.72 0.84
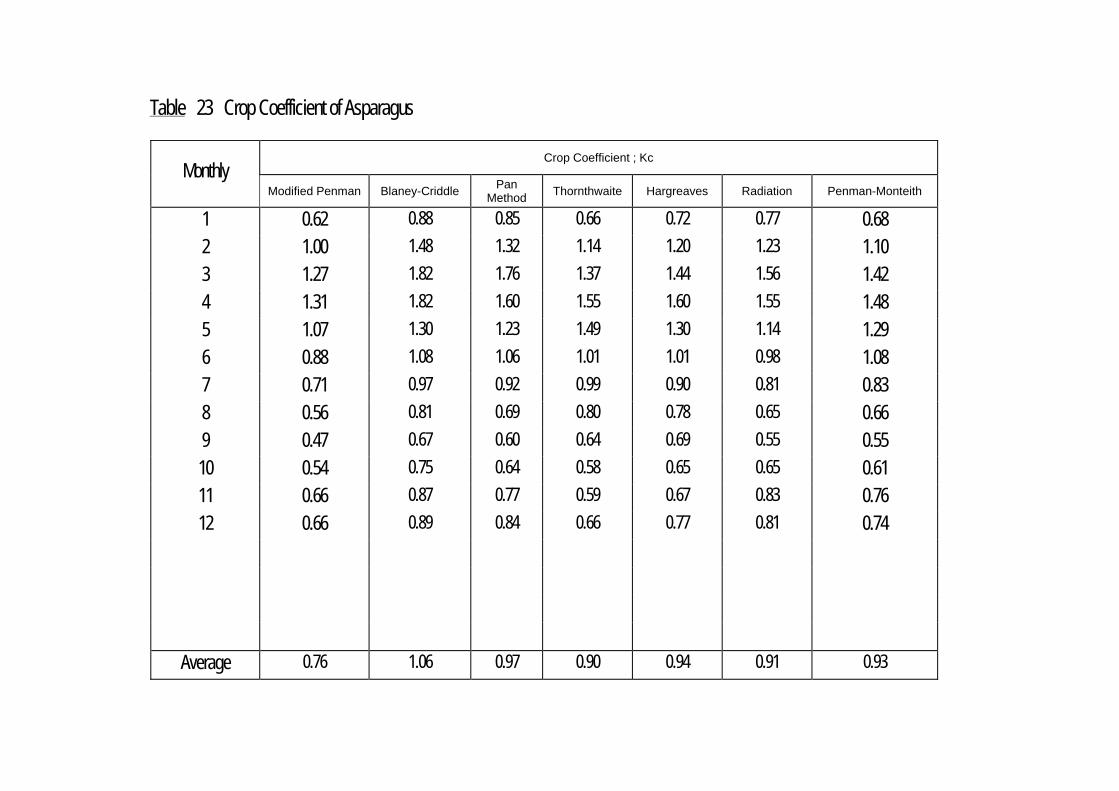
Table 23 Crop Coefficient of Asparagus
Crop Coefficient ; Kc Monthly
Modified Penman
Blaney-Criddle Pan
Method Thornthwaite Hargreaves Radiation Penman-Monteith
1 0.62 0.88 0.85 0.66 0.72 0.77 0.68
2 1.00 1.48 1.32 1.14 1.20 1.23 1.10
3 1.27 1.82 1.76 1.37 1.44 1.56 1.42
4 1.31 1.82 1.60 1.55 1.60 1.55 1.48
5 1.07 1.30 1.23 1.49 1.30 1.14 1.29
6 0.88 1.08 1.06 1.01 1.01 0.98 1.08
7 0.71 0.97 0.92 0.99 0.90 0.81 0.83
8 0.56 0.81 0.69 0.80 0.78 0.65 0.66
9 0.47 0.67 0.60 0.64 0.69 0.55 0.55
10 0.54 0.75 0.64 0.58 0.65 0.65 0.61
11 0.66 0.87 0.77 0.59 0.67 0.83 0.76
12 0.66 0.89 0.84 0.66 0.77 0.81 0.74
Average 0.76 1.06 0.97 0.90 0.94 0.91 0.93
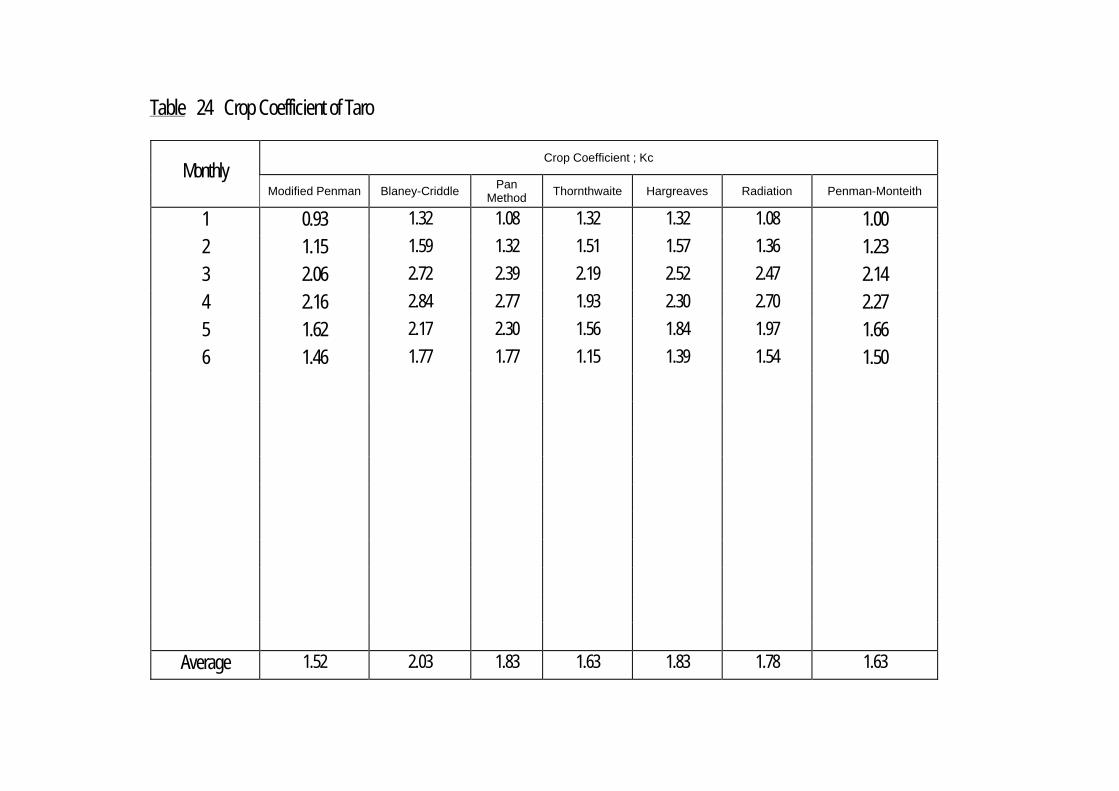
Table 24 Crop Coefficient of Taro
Crop Coefficient ; Kc Monthly
Modified Penman
Blaney-Criddle Pan
Method Thornthwaite Hargreaves Radiation Penman-Monteith
1 0.93 1.32 1.08 1.32 1.32 1.08 1.00
2 1.15 1.59 1.32 1.51 1.57 1.36 1.23
3 2.06 2.72 2.39 2.19 2.52 2.47 2.14
4 2.16 2.84 2.77 1.93 2.30 2.70 2.27
5 1.62 2.17 2.30 1.56 1.84 1.97 1.66
6 1.46 1.77 1.77 1.15 1.39 1.54 1.50
Average 1.52 2.03 1.83 1.63 1.83 1.78 1.63
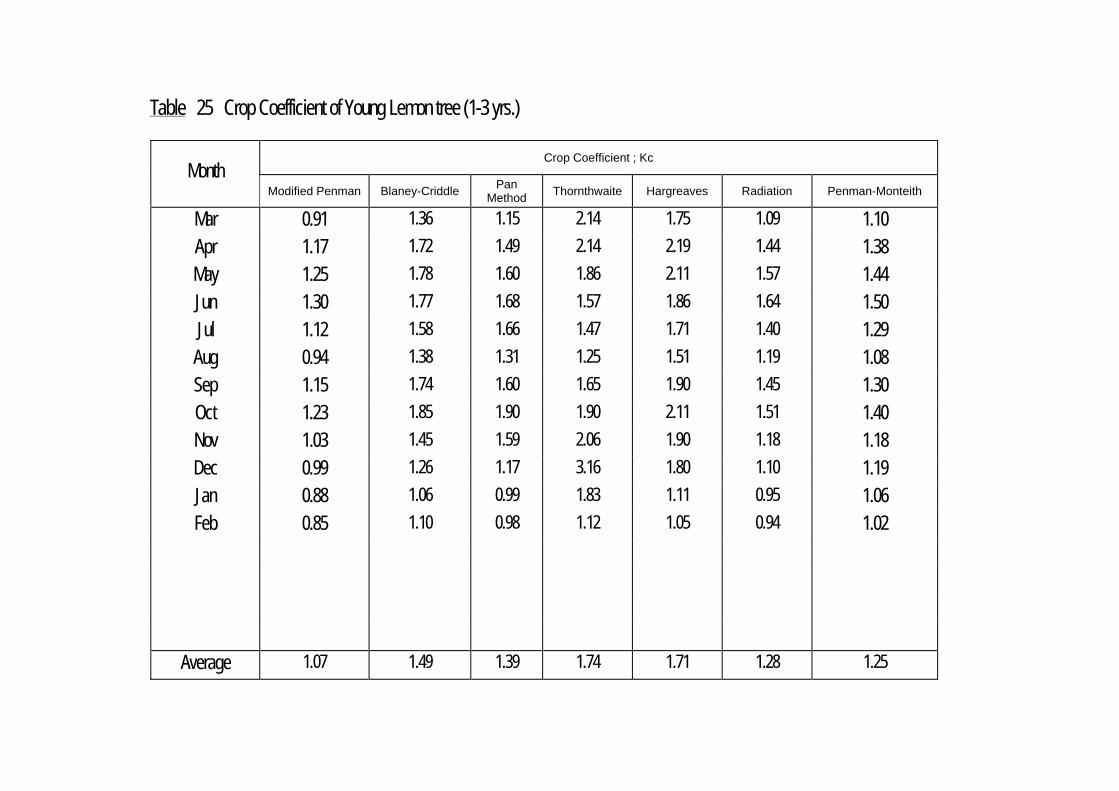
Table 25 Crop Coefficient of Young Lemon tree (1-3 yrs.)
Crop Coefficient ; Kc Month
Modified Penman
Blaney-Criddle Pan
Method Thornthwaite Hargreaves Radiation Penman-Monteith
Mar 0.91 1.36 1.15 2.14 1.75 1.09 1.10
Apr 1.17 1.72 1.49 2.14 2.19 1.44 1.38
May 1.25 1.78 1.60 1.86 2.11 1.57 1.44
Jun 1.30 1.77 1.68 1.57 1.86 1.64 1.50
Jul 1.12 1.58 1.66 1.47 1.71 1.40 1.29
Aug 0.94 1.38 1.31 1.25 1.51 1.19 1.08
Sep 1.15 1.74 1.60 1.65 1.90 1.45 1.30
Oct 1.23 1.85 1.90 1.90 2.11 1.51 1.40
Nov 1.03 1.45 1.59 2.06 1.90 1.18 1.18
Dec 0.99 1.26 1.17 3.16 1.80 1.10 1.19
Jan 0.88 1.06 0.99 1.83 1.11 0.95 1.06
Feb 0.85 1.10 0.98 1.12 1.05 0.94 1.02
Average 1.07 1.49 1.39 1.74 1.71 1.28 1.25
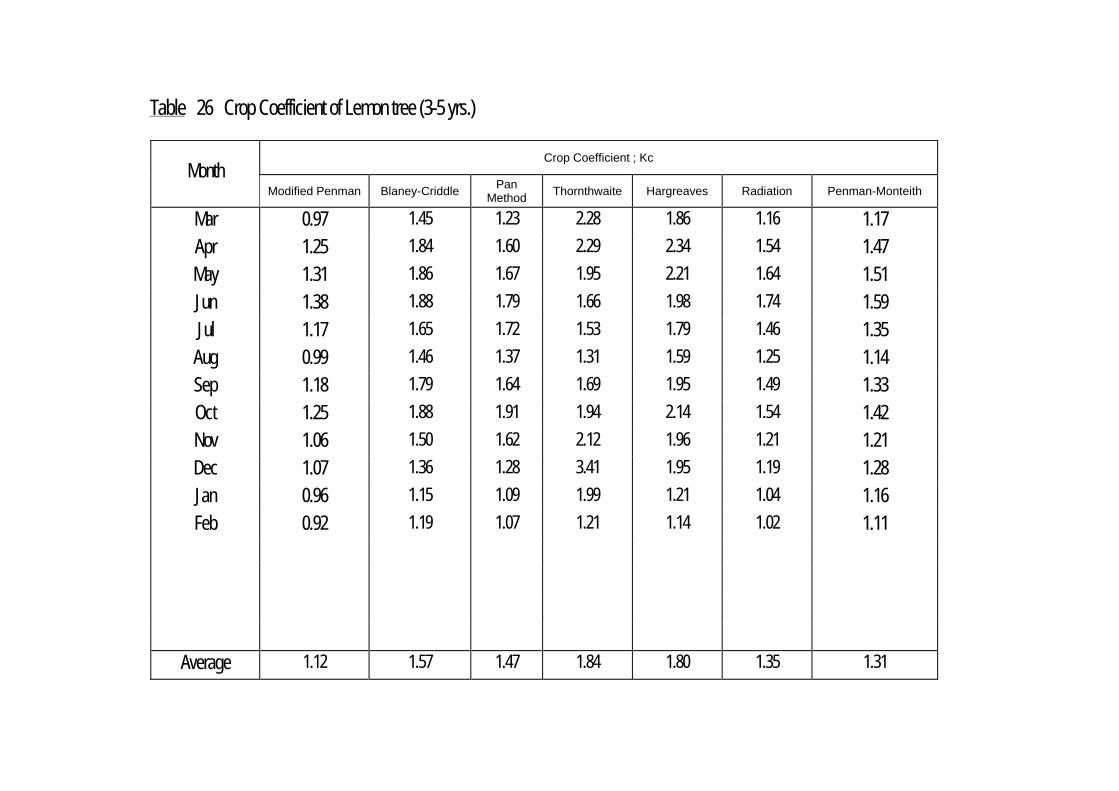
Table 26 Crop Coefficient of Lemon tree (3-5 yrs.)
Crop Coefficient ; Kc Month
Modified Penman
Blaney-Criddle Pan
Method Thornthwaite Hargreaves Radiation Penman-Monteith
Mar 0.97 1.45 1.23 2.28 1.86 1.16 1.17
Apr 1.25 1.84 1.60 2.29 2.34 1.54 1.47
May 1.31 1.86 1.67 1.95 2.21 1.64 1.51
Jun 1.38 1.88 1.79 1.66 1.98 1.74 1.59
Jul 1.17 1.65 1.72 1.53 1.79 1.46 1.35
Aug 0.99 1.46 1.37 1.31 1.59 1.25 1.14
Sep 1.18 1.79 1.64 1.69 1.95 1.49 1.33
Oct 1.25 1.88 1.91 1.94 2.14 1.54 1.42
Nov 1.06 1.50 1.62 2.12 1.96 1.21 1.21
Dec 1.07 1.36 1.28 3.41 1.95 1.19 1.28
Jan 0.96 1.15 1.09 1.99 1.21 1.04 1.16
Feb 0.92 1.19 1.07 1.21 1.14 1.02 1.11
Average 1.12 1.57 1.47 1.84 1.80 1.35 1.31

Table 27 Crop Coefficient of Mango tree
Crop Coefficient ; Kc Month
Modified Penman
Blaney-Criddle Pan
Method Thornthwaite Hargreaves Radiation Penman-Monteith
Jun 1.84 2.35 2.21 1.63 1.51 2.35 2.10
Jul 2.06 2.62 2.28 1.76 1.70 2.62 2.46
Aug 2.33 3.13 3.10 2.28 2.00 2.95 2.53
Sep 2.07 2.78 2.64 2.35 2.07 2.46 2.28
Oct 2.12 2.75 2.85 2.48 2.21 2.42 2.29
Nov 2.29 2.54 2.63 2.68 2.13 2.35 2.50
Dec 1.54 1.63 1.76 1.79 1.32 1.58 1.90
Jan 1.44 1.60 1.89 1.65 1.37 1.48 1.69
Feb 1.29 1.52 1.55 1.52 1.37 1.34 1.61
Mar 1.04 1.32 1.44 1.20 1.23 1.14 1.27
Apr 1.06 1.35 1.36 1.23 1.25 1.23 1.24
May 1.04 1.34 1.27 1.22 1.24 1.24 1.19
Average 1.60 1.98 1.99 1.74 1.59 1.82 1.92
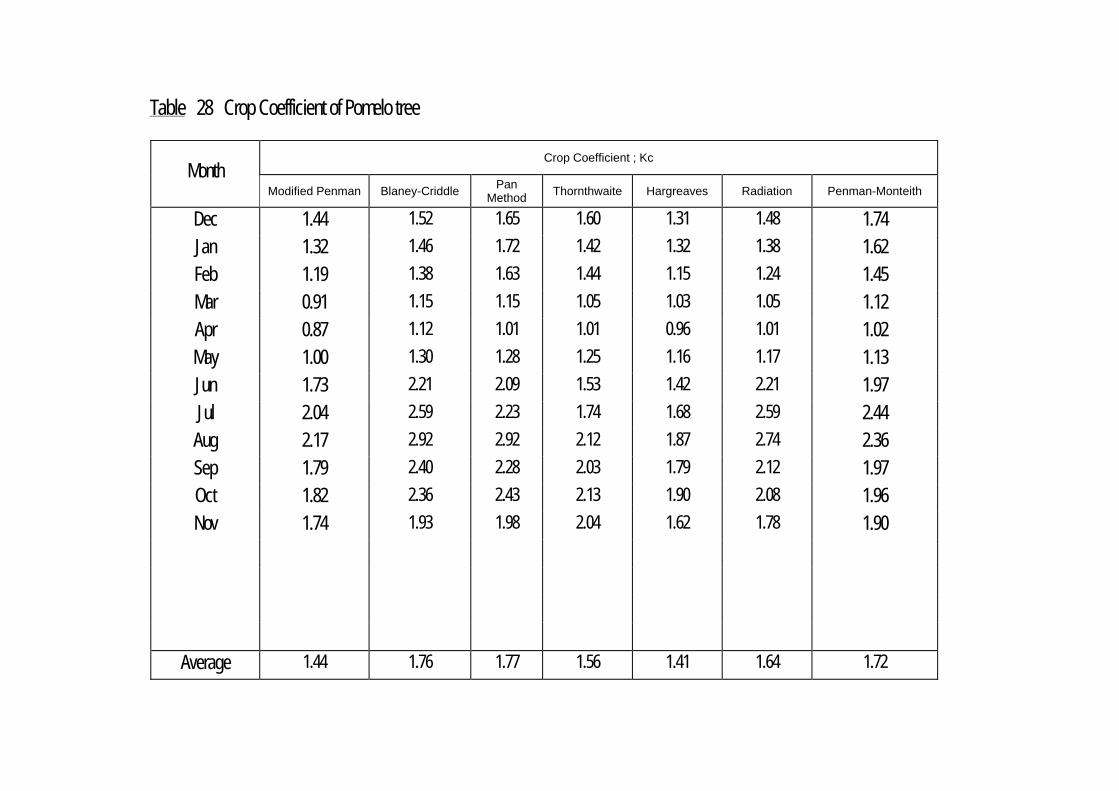
Table 28 Crop Coefficient of Pomelo tree
Crop Coefficient ; Kc Month
Modified Penman
Blaney-Criddle Pan
Method Thornthwaite Hargreaves Radiation Penman-Monteith
Dec 1.44 1.52 1.65 1.60 1.31 1.48 1.74
Jan 1.32 1.46 1.72 1.42 1.32 1.38 1.62
Feb 1.19 1.38 1.63 1.44 1.15 1.24 1.45
Mar 0.91 1.15 1.15 1.05 1.03 1.05 1.12
Apr 0.87 1.12 1.01 1.01 0.96 1.01 1.02
May 1.00 1.30 1.28 1.25 1.16 1.17 1.13
Jun 1.73 2.21 2.09 1.53 1.42 2.21 1.97
Jul 2.04 2.59 2.23 1.74 1.68 2.59 2.44
Aug 2.17 2.92 2.92 2.12 1.87 2.74 2.36
Sep 1.79 2.40 2.28 2.03 1.79 2.12 1.97
Oct 1.82 2.36 2.43 2.13 1.90 2.08 1.96
Nov 1.74 1.93 1.98 2.04 1.62 1.78 1.90
Average 1.44 1.76 1.77 1.56 1.41 1.64 1.72
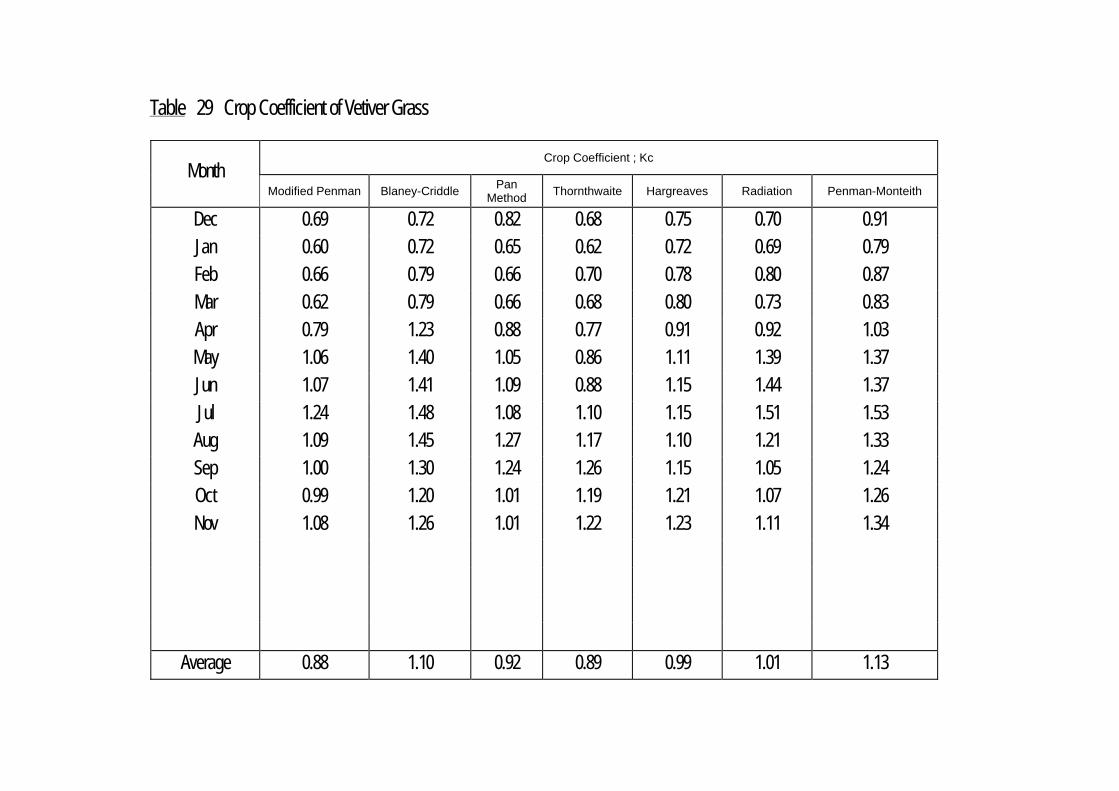
Table 29 Crop Coefficient of Vetiver Grass
Crop Coefficient ; Kc Month
Modified Penman
Blaney-Criddle Pan
Method Thornthwaite Hargreaves Radiation Penman-Monteith
Dec 0.69 0.72 0.82 0.68 0.75 0.70 0.91
Jan 0.60 0.72 0.65 0.62 0.72 0.69 0.79
Feb 0.66 0.79 0.66 0.70 0.78 0.80 0.87
Mar 0.62 0.79 0.66 0.68 0.80 0.73 0.83
Apr 0.79 1.23 0.88 0.77 0.91 0.92 1.03
May 1.06 1.40 1.05 0.86 1.11 1.39 1.37
Jun 1.07 1.41 1.09 0.88 1.15 1.44 1.37
Jul 1.24 1.48 1.08 1.10 1.15 1.51 1.53
Aug 1.09 1.45 1.27 1.17 1.10 1.21 1.33
Sep 1.00 1.30 1.24 1.26 1.15 1.05 1.24
Oct 0.99 1.20 1.01 1.19 1.21 1.07 1.26
Nov 1.08 1.26 1.01 1.22 1.23 1.11 1.34
Average 0.88 1.10 0.92 0.89 0.99 1.01 1.13
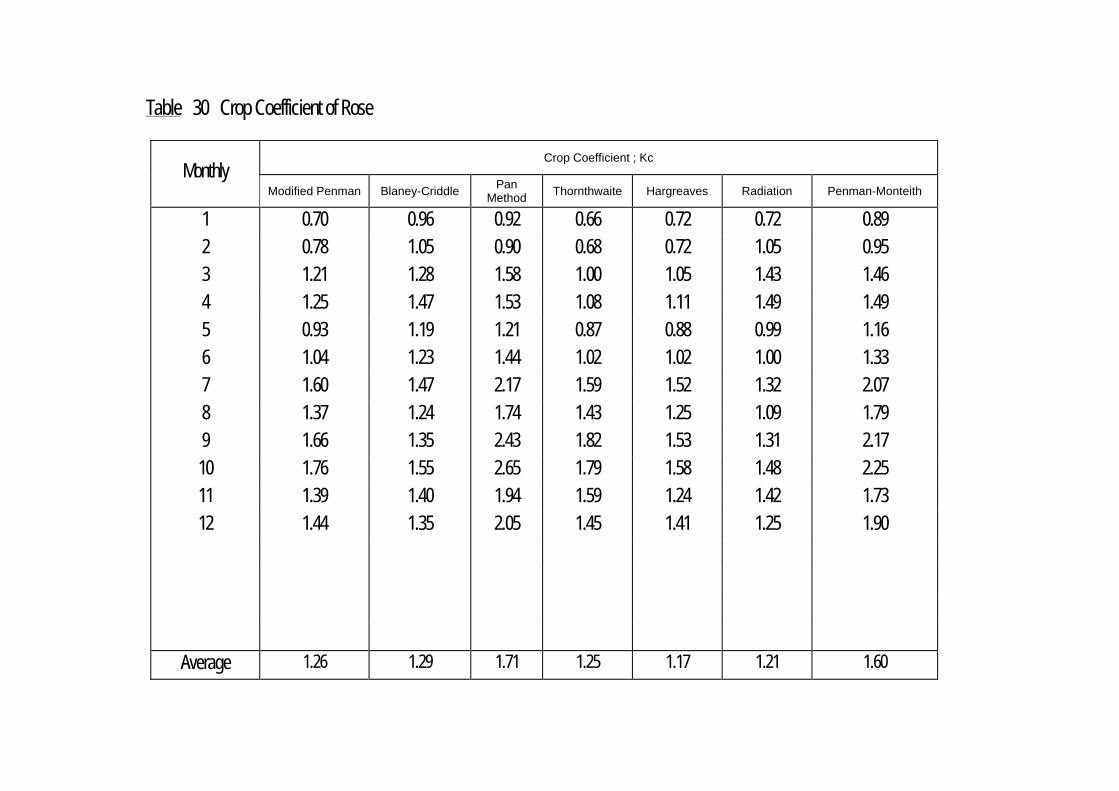
Table 30 Crop Coefficient of Rose
Crop Coefficient ; Kc Monthly
Modified Penman
Blaney-Criddle Pan
Method Thornthwaite Hargreaves Radiation Penman-Monteith
1 0.70 0.96 0.92 0.66 0.72 0.72 0.89
2 0.78 1.05 0.90 0.68 0.72 1.05 0.95
3 1.21 1.28 1.58 1.00 1.05 1.43 1.46
4 1.25 1.47 1.53 1.08 1.11 1.49 1.49
5 0.93 1.19 1.21 0.87 0.88 0.99 1.16
6 1.04 1.23 1.44 1.02 1.02 1.00 1.33
7 1.60 1.47 2.17 1.59 1.52 1.32 2.07
8 1.37 1.24 1.74 1.43 1.25 1.09 1.79
9 1.66 1.35 2.43 1.82 1.53 1.31 2.17
10 1.76 1.55 2.65 1.79 1.58 1.48 2.25
11 1.39 1.40 1.94 1.59 1.24 1.42 1.73
12 1.44 1.35 2.05 1.45 1.41 1.25 1.90
Average 1.26 1.29 1.71 1.25 1.17 1.21 1.60
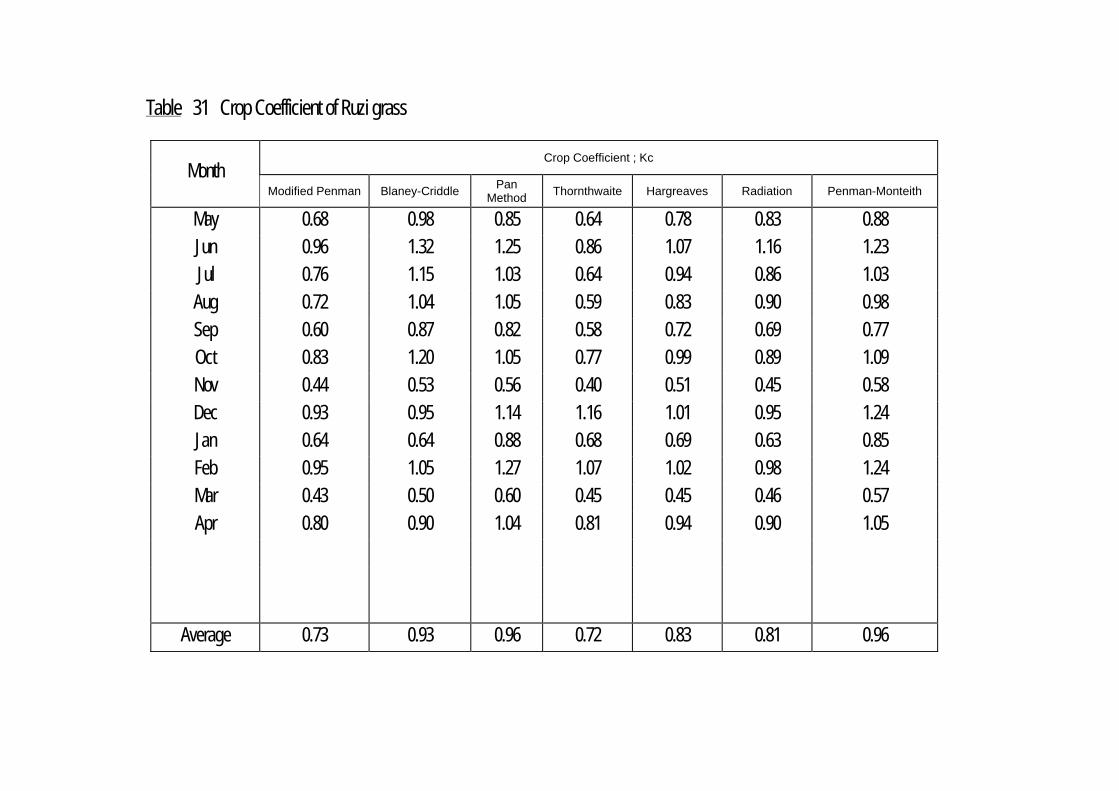
Table 31 Crop Coefficient of Ruzi grass
Crop Coefficient ; Kc Month
Modified Penman
Blaney-Criddle Pan
Method Thornthwaite Hargreaves Radiation Penman-Monteith
May 0.68 0.98 0.85 0.64 0.78 0.83 0.88
Jun 0.96 1.32 1.25 0.86 1.07 1.16 1.23
Jul 0.76 1.15 1.03 0.64 0.94 0.86 1.03
Aug 0.72 1.04 1.05 0.59 0.83 0.90 0.98
Sep 0.60 0.87 0.82 0.58 0.72 0.69 0.77
Oct 0.83 1.20 1.05 0.77 0.99 0.89 1.09
Nov 0.44 0.53 0.56 0.40 0.51 0.45 0.58
Dec 0.93 0.95 1.14 1.16 1.01 0.95 1.24
Jan 0.64 0.64 0.88 0.68 0.69 0.63 0.85
Feb 0.95 1.05 1.27 1.07 1.02 0.98 1.24
Mar 0.43 0.50 0.60 0.45 0.45 0.46 0.57
Apr 0.80 0.90 1.04 0.81 0.94 0.90 1.05
Average 0.73 0.93 0.96 0.72 0.83 0.81 0.96
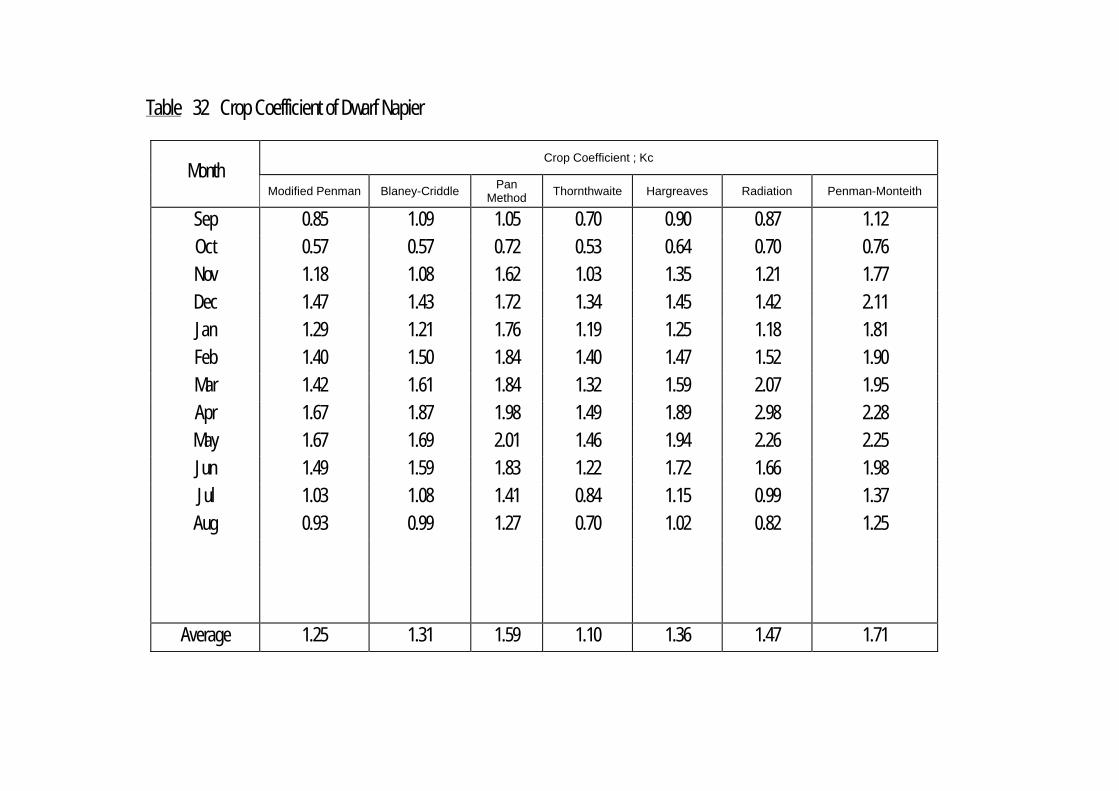
Table 32 Crop Coefficient of Dwarf Napier
Crop Coefficient ; Kc Month
Modified Penman
Blaney-Criddle Pan
Method Thornthwaite Hargreaves Radiation Penman-Monteith
Sep 0.85 1.09 1.05 0.70 0.90 0.87 1.12
Oct 0.57 0.57 0.72 0.53 0.64 0.70 0.76
Nov 1.18 1.08 1.62 1.03 1.35 1.21 1.77
Dec 1.47 1.43 1.72 1.34 1.45 1.42 2.11
Jan 1.29 1.21 1.76 1.19 1.25 1.18 1.81
Feb 1.40 1.50 1.84 1.40 1.47 1.52 1.90
Mar 1.42 1.61 1.84 1.32 1.59 2.07 1.95
Apr 1.67 1.87 1.98 1.49 1.89 2.98 2.28
May 1.67 1.69 2.01 1.46 1.94 2.26 2.25
Jun 1.49 1.59 1.83 1.22 1.72 1.66 1.98
Jul 1.03 1.08 1.41 0.84 1.15 0.99 1.37
Aug 0.93 0.99 1.27 0.70 1.02 0.82 1.25
Average 1.25 1.31 1.59 1.10 1.36 1.47 1.71
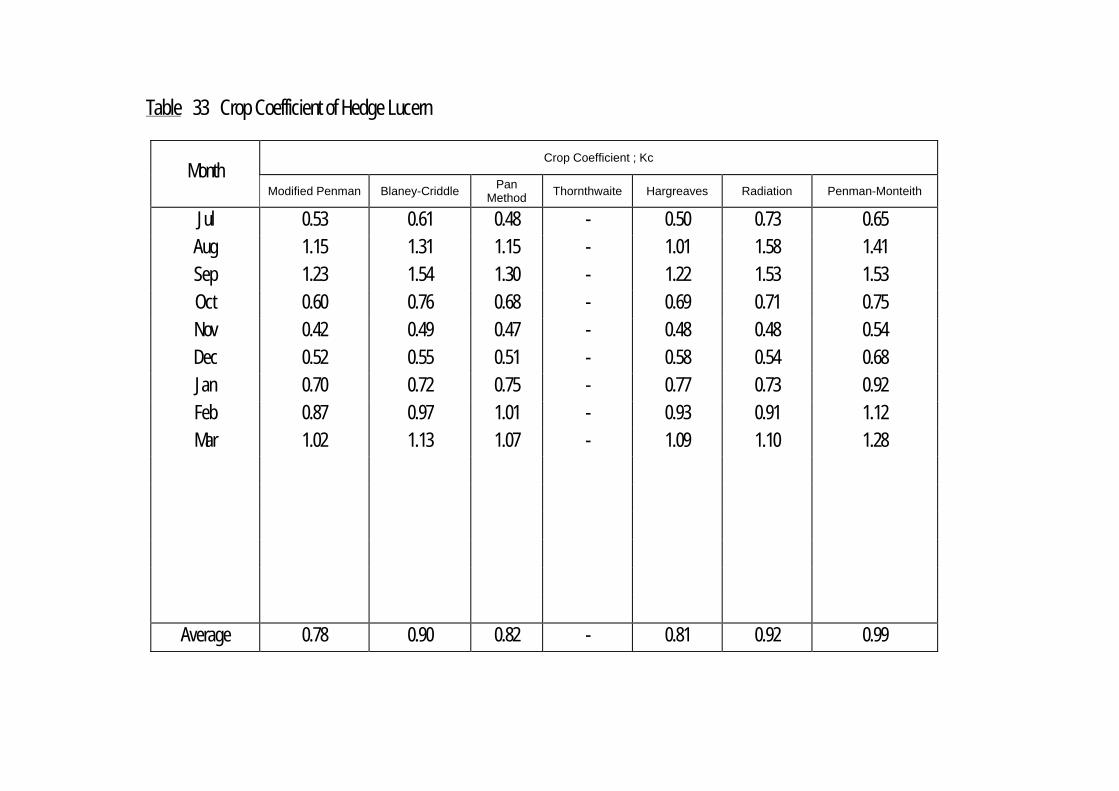
Table 33 Crop Coefficient of Hedge Lucern
Crop Coefficient ; Kc Month
Modified Penman
Blaney-Criddle Pan
Method Thornthwaite Hargreaves Radiation Penman-Monteith
Jul 0.53 0.61 0.48 - 0.50 0.73 0.65
Aug 1.15 1.31 1.15 - 1.01 1.58 1.41
Sep 1.23 1.54 1.30 - 1.22 1.53 1.53
Oct 0.60 0.76 0.68 - 0.69 0.71 0.75
Nov 0.42 0.49 0.47 - 0.48 0.48 0.54
Dec 0.52 0.55 0.51 - 0.58 0.54 0.68
Jan 0.70 0.72 0.75 - 0.77 0.73 0.92
Feb 0.87 0.97 1.01 - 0.93 0.91 1.12
Mar 1.02 1.13 1.07 - 1.09 1.10 1.28
Average 0.78 0.90 0.82 - 0.81 0.92 0.99
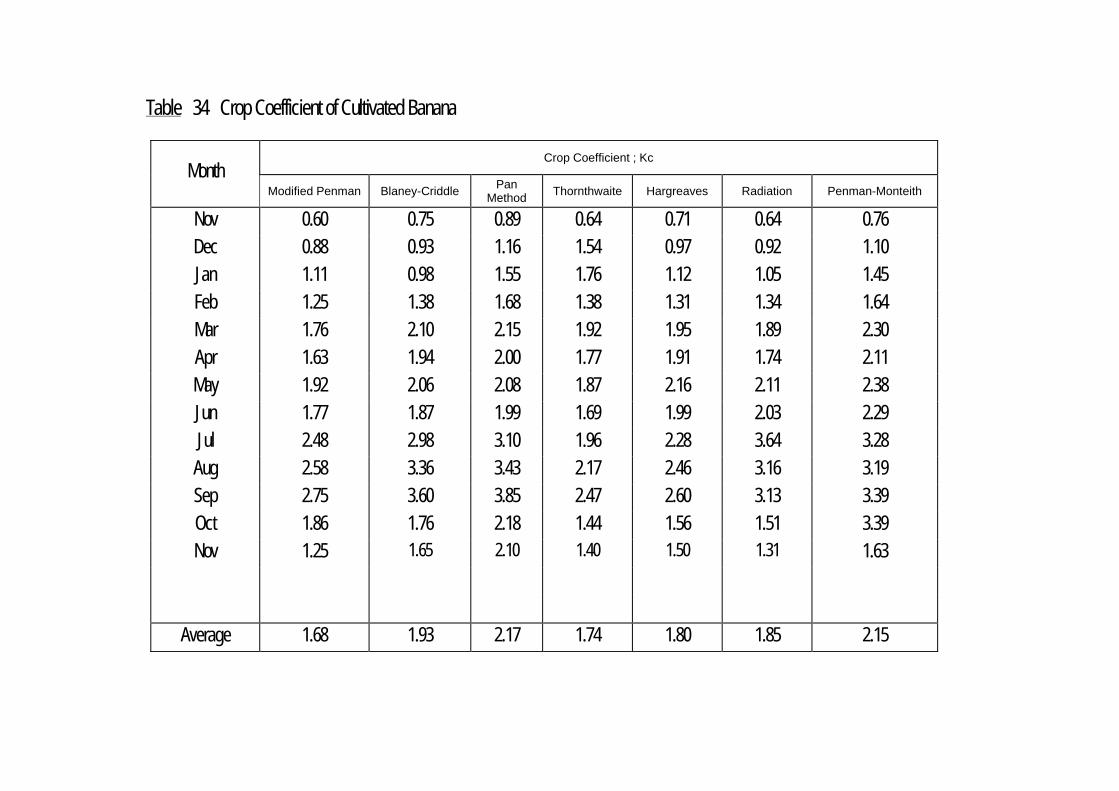
Table 34 Crop Coefficient of Cultivated Banana
Crop Coefficient ; Kc Month
Modified Penman
Blaney-Criddle Pan
Method Thornthwaite Hargreaves Radiation Penman-Monteith
Nov 0.60 0.75 0.89 0.64 0.71 0.64 0.76
Dec 0.88 0.93 1.16 1.54 0.97 0.92 1.10
Jan 1.11 0.98 1.55 1.76 1.12 1.05 1.45
Feb 1.25 1.38 1.68 1.38 1.31 1.34 1.64
Mar 1.76 2.10 2.15 1.92 1.95 1.89 2.30
Apr 1.63 1.94 2.00 1.77 1.91 1.74 2.11
May 1.92 2.06 2.08 1.87 2.16 2.11 2.38
Jun 1.77 1.87 1.99 1.69 1.99 2.03 2.29
Jul 2.48 2.98 3.10 1.96 2.28 3.64 3.28
Aug 2.58 3.36 3.43 2.17 2.46 3.16 3.19
Sep 2.75 3.60 3.85 2.47 2.60 3.13 3.39
Oct 1.86 1.76 2.18 1.44 1.56 1.51 3.39
Nov 1.25 1.65 2.10 1.40 1.50 1.31 1.63
Average 1.68 1.93 2.17 1.74 1.80 1.85 2.15
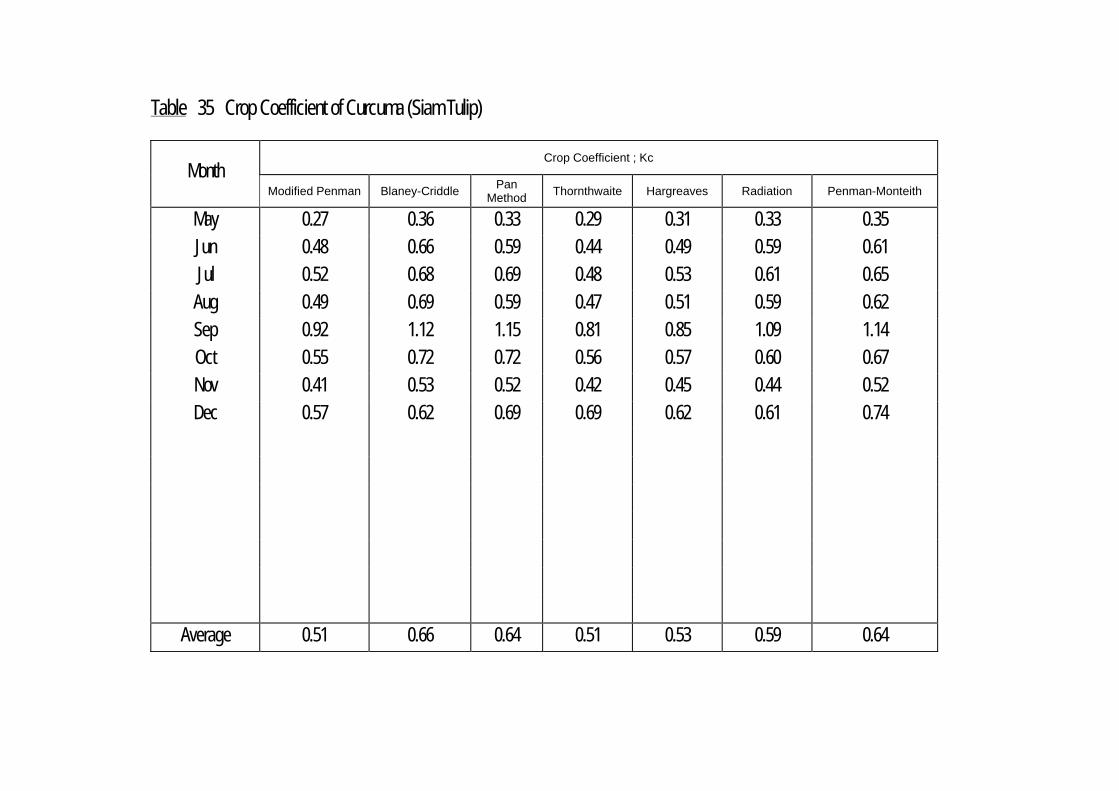
Table 35 Crop Coefficient of Curcuma (Siam Tulip)
Crop Coefficient ; Kc Month
Modified Penman
Blaney-Criddle Pan
Method Thornthwaite Hargreaves Radiation Penman-Monteith
May 0.27 0.36 0.33 0.29 0.31 0.33 0.35
Jun 0.48 0.66 0.59 0.44 0.49 0.59 0.61
Jul 0.52 0.68 0.69 0.48 0.53 0.61 0.65
Aug 0.49 0.69 0.59 0.47 0.51 0.59 0.62
Sep 0.92 1.12 1.15 0.81 0.85 1.09 1.14
Oct 0.55 0.72 0.72 0.56 0.57 0.60 0.67
Nov 0.41 0.53 0.52 0.42 0.45 0.44 0.52
Dec 0.57 0.62 0.69 0.69 0.62 0.61 0.74
Average 0.51 0.66 0.64 0.51 0.53 0.59 0.64
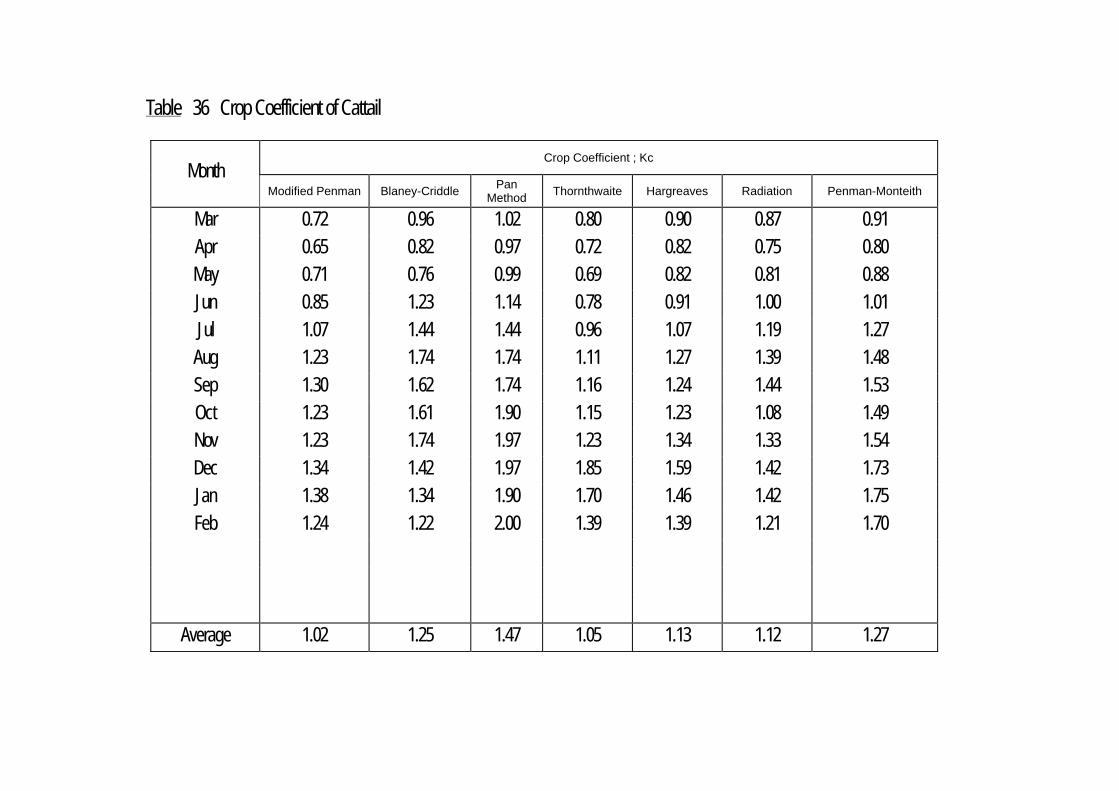
Table 36 Crop Coefficient of Cattail
Crop Coefficient ; Kc Month
Modified Penman
Blaney-Criddle Pan
Method Thornthwaite Hargreaves Radiation Penman-Monteith
Mar 0.72 0.96 1.02 0.80 0.90 0.87 0.91
Apr 0.65 0.82 0.97 0.72 0.82 0.75 0.80
May 0.71 0.76 0.99 0.69 0.82 0.81 0.88
Jun 0.85 1.23 1.14 0.78 0.91 1.00 1.01
Jul 1.07 1.44 1.44 0.96 1.07 1.19 1.27
Aug 1.23 1.74 1.74 1.11 1.27 1.39 1.48
Sep 1.30 1.62 1.74 1.16 1.24 1.44 1.53
Oct 1.23 1.61 1.90 1.15 1.23 1.08 1.49
Nov 1.23 1.74 1.97 1.23 1.34 1.33 1.54
Dec 1.34 1.42 1.97 1.85 1.59 1.42 1.73
Jan 1.38 1.34 1.90 1.70 1.46 1.42 1.75
Feb 1.24 1.22 2.00 1.39 1.39 1.21 1.70
Average 1.02 1.25 1.47 1.05 1.13 1.12 1.27
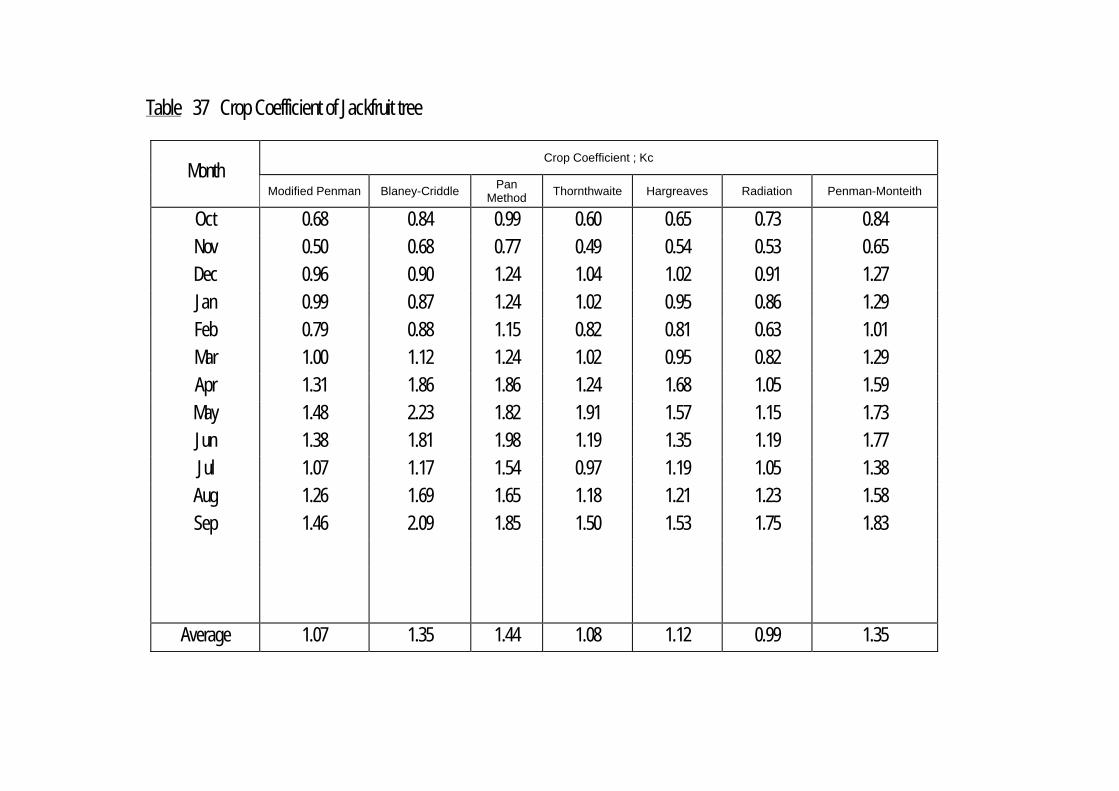
Table 37 Crop Coefficient of Jackfruit tree
Crop Coefficient ; Kc Month
Modified Penman
Blaney-Criddle Pan
Method Thornthwaite Hargreaves Radiation Penman-Monteith
Oct 0.68 0.84 0.99 0.60 0.65 0.73 0.84
Nov 0.50 0.68 0.77 0.49 0.54 0.53 0.65
Dec 0.96 0.90 1.24 1.04 1.02 0.91 1.27
Jan 0.99 0.87 1.24 1.02 0.95 0.86 1.29
Feb 0.79 0.88 1.15 0.82 0.81 0.63 1.01
Mar 1.00 1.12 1.24 1.02 0.95 0.82 1.29
Apr 1.31 1.86 1.86 1.24 1.68 1.05 1.59
May 1.48 2.23 1.82 1.91 1.57 1.15 1.73
Jun 1.38 1.81 1.98 1.19 1.35 1.19 1.77
Jul 1.07 1.17 1.54 0.97 1.19 1.05 1.38
Aug 1.26 1.69 1.65 1.18 1.21 1.23 1.58
Sep 1.46 2.09 1.85 1.50 1.53 1.75 1.83
Average 1.07 1.35 1.44 1.08 1.12 0.99 1.35
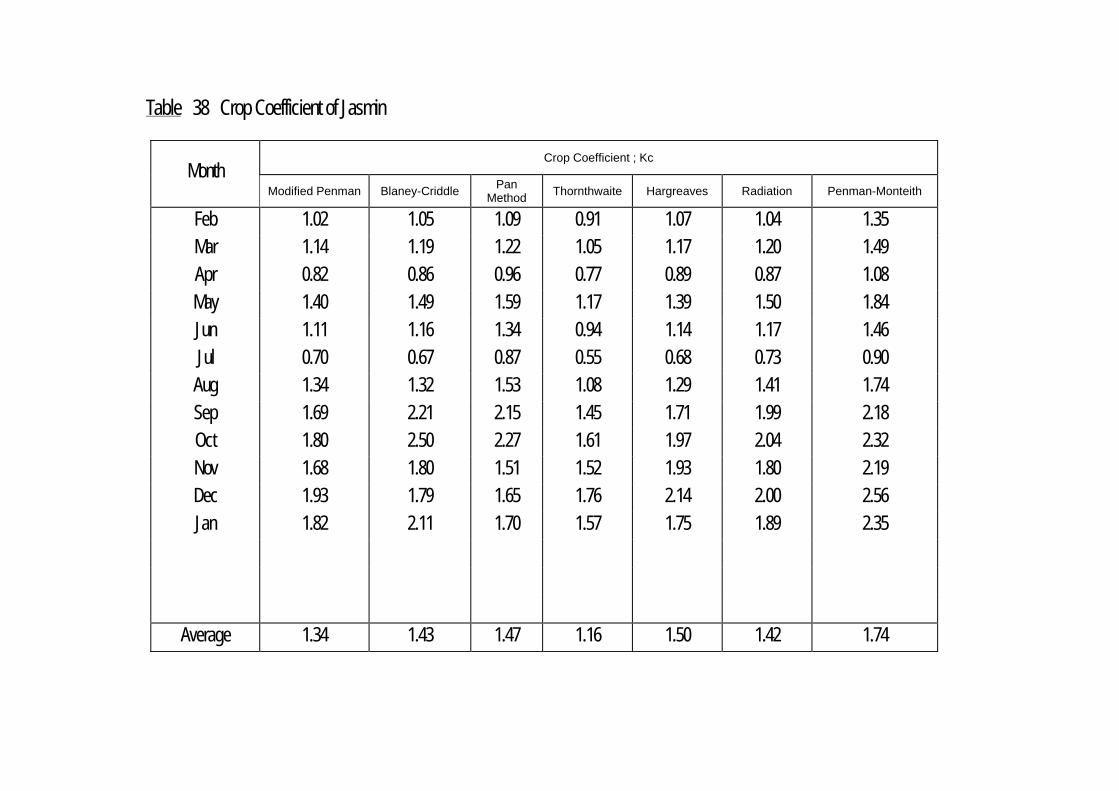
Table 38 Crop Coefficient of Jasmin
Crop Coefficient ; Kc Month
Modified Penman
Blaney-Criddle Pan
Method Thornthwaite Hargreaves Radiation Penman-Monteith
Feb 1.02 1.05 1.09 0.91 1.07 1.04 1.35
Mar 1.14 1.19 1.22 1.05 1.17 1.20 1.49
Apr 0.82 0.86 0.96 0.77 0.89 0.87 1.08
May 1.40 1.49 1.59 1.17 1.39 1.50 1.84
Jun 1.11 1.16 1.34 0.94 1.14 1.17 1.46
Jul 0.70 0.67 0.87 0.55 0.68 0.73 0.90
Aug 1.34 1.32 1.53 1.08 1.29 1.41 1.74
Sep 1.69 2.21 2.15 1.45 1.71 1.99 2.18
Oct 1.80 2.50 2.27 1.61 1.97 2.04 2.32
Nov 1.68 1.80 1.51 1.52 1.93 1.80 2.19
Dec 1.93 1.79 1.65 1.76 2.14 2.00 2.56
Jan 1.82 2.11 1.70 1.57 1.75 1.89 2.35
Average 1.34 1.43 1.47 1.16 1.50 1.42 1.74
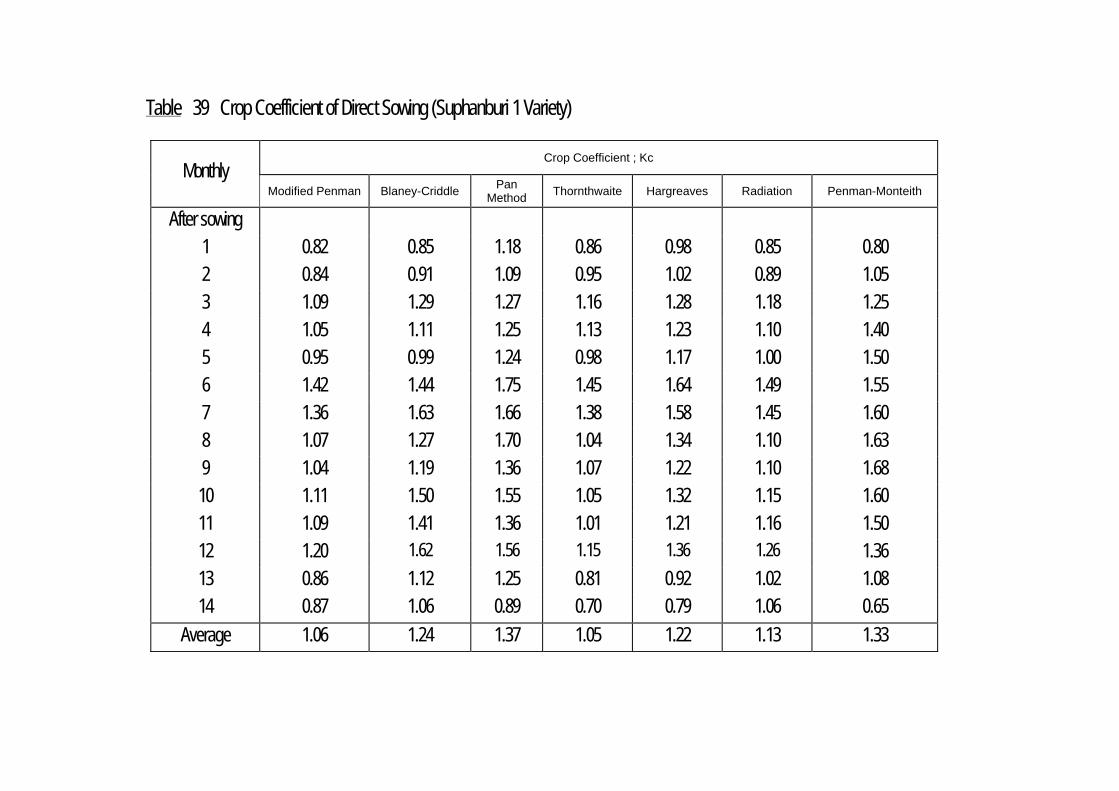
Table 39 Crop Coefficient of Direct Sowing (Suphanburi 1 Variety)
Crop Coefficient ; Kc Monthly
Modified Penman
Blaney-Criddle Pan
Method Thornthwaite Hargreaves Radiation Penman-Monteith
After sowing
1 0.82 0.85 1.18 0.86 0.98 0.85 0.80
2 0.84 0.91 1.09 0.95 1.02 0.89 1.05
3 1.09 1.29 1.27 1.16 1.28 1.18 1.25
4 1.05 1.11 1.25 1.13 1.23 1.10 1.40
5 0.95 0.99 1.24 0.98 1.17 1.00 1.50
6 1.42 1.44 1.75 1.45 1.64 1.49 1.55
7 1.36 1.63 1.66 1.38 1.58 1.45 1.60
8 1.07 1.27 1.70 1.04 1.34 1.10 1.63
9 1.04 1.19 1.36 1.07 1.22 1.10 1.68
10 1.11 1.50 1.55 1.05 1.32 1.15 1.60
11 1.09 1.41 1.36 1.01 1.21 1.16 1.50
12 1.20 1.62 1.56 1.15 1.36 1.26 1.36
13 0.86 1.12 1.25 0.81 0.92 1.02 1.08
14 0.87 1.06 0.89 0.70 0.79 1.06 0.65
Average 1.06 1.24 1.37 1.05 1.22 1.13 1.33
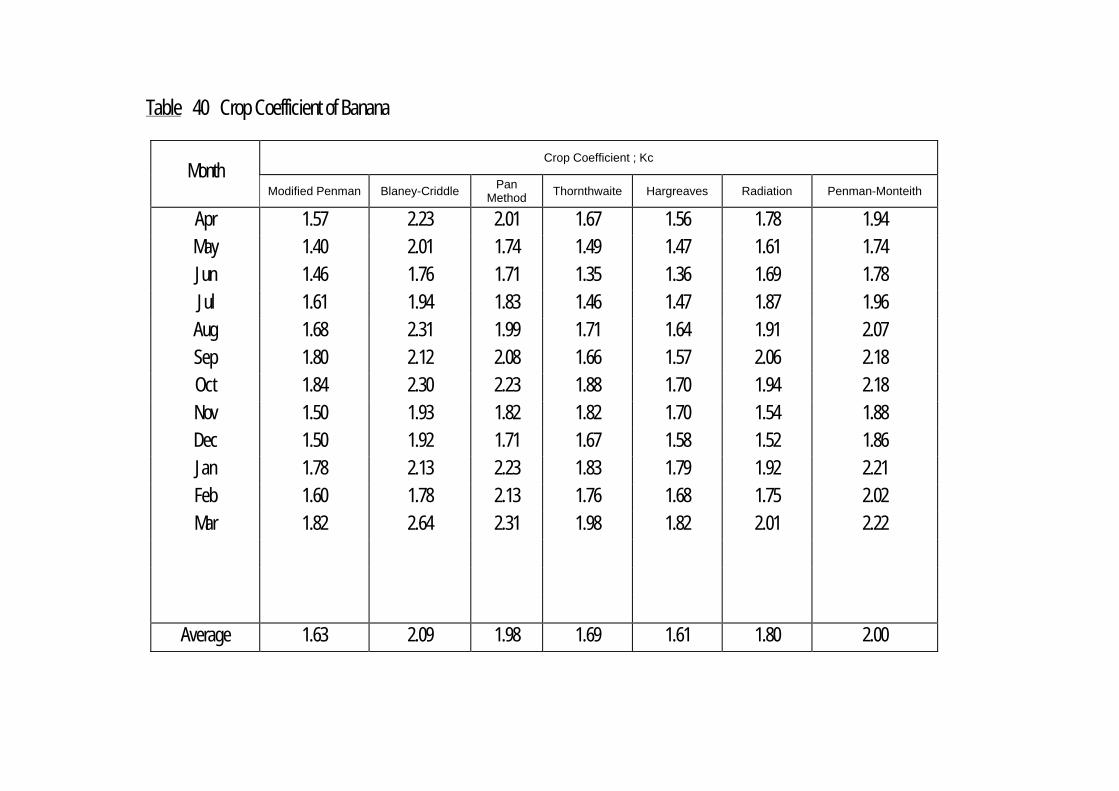
Table 40 Crop Coefficient of Banana
Crop Coefficient ; Kc Month
Modified Penman
Blaney-Criddle Pan
Method Thornthwaite Hargreaves Radiation Penman-Monteith
Apr 1.57 2.23 2.01 1.67 1.56 1.78 1.94
May 1.40 2.01 1.74 1.49 1.47 1.61 1.74
Jun 1.46 1.76 1.71 1.35 1.36 1.69 1.78
Jul 1.61 1.94 1.83 1.46 1.47 1.87 1.96
Aug 1.68 2.31 1.99 1.71 1.64 1.91 2.07
Sep 1.80 2.12 2.08 1.66 1.57 2.06 2.18
Oct 1.84 2.30 2.23 1.88 1.70 1.94 2.18
Nov 1.50 1.93 1.82 1.82 1.70 1.54 1.88
Dec 1.50 1.92 1.71 1.67 1.58 1.52 1.86
Jan 1.78 2.13 2.23 1.83 1.79 1.92 2.21
Feb 1.60 1.78 2.13 1.76 1.68 1.75 2.02
Mar 1.82 2.64 2.31 1.98 1.82 2.01 2.22
Average 1.63 2.09 1.98 1.69 1.61 1.80 2.00