Embed Size (px)
Citation preview
Tableau in THE BI Survey 13
1
Ta
ble
au
in T
he B
I Su
rve
y
13 BI SURVEY TH
E
The Customer Verdict
The world’s largest survey of
business intelligence software users
This document is a specially produced summary
by BARC of the headline results for Tableau
Tableau in THE BI Survey 13
2
Table of contents
Tableau in THE BI Survey 13 .................................................................................... 3
Introduction ............................................................................................................ 3
Tableau overview ................................................................................................... 3
Tableau customer responses ................................................................................. 4
User and use case demographics .......................................................................... 5
The product is often seen as an alternative to QlikTech. ........................................... 6
Peer Groups .............................................................................................................. 6
The KPIs ................................................................................................................... 7
Summary ................................................................................................................. 34
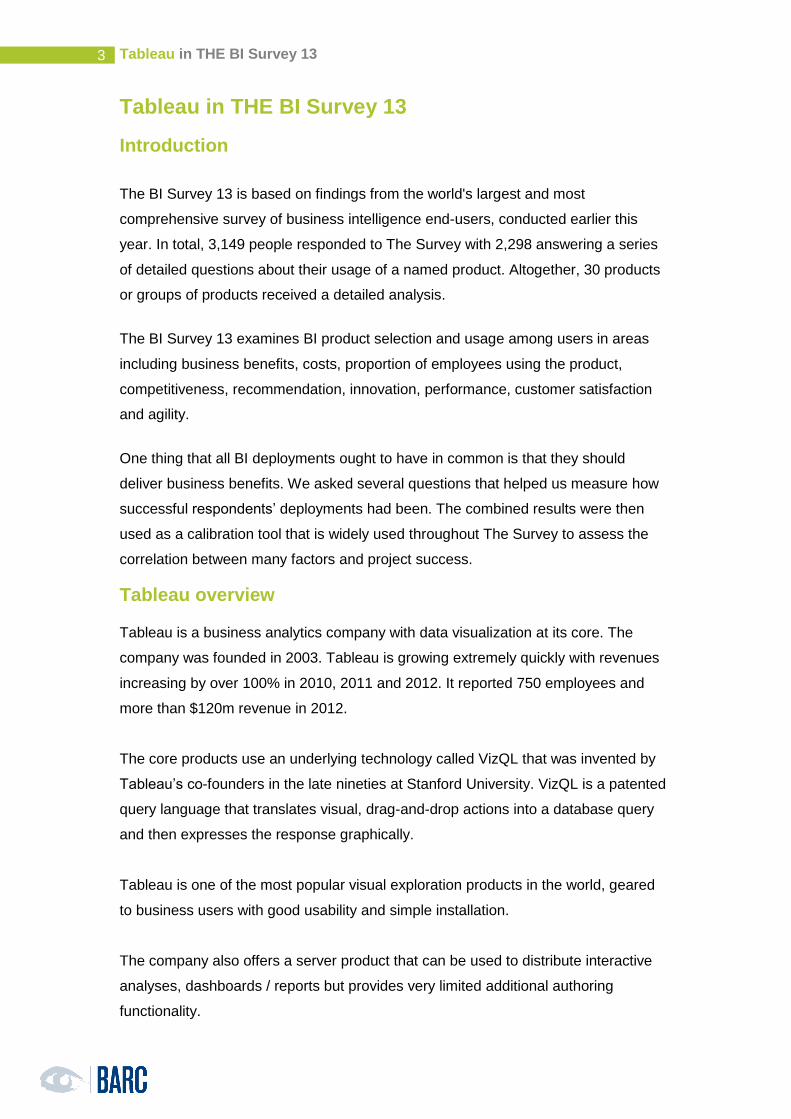
Tableau in THE BI Survey 13
3
Tableau in THE BI Survey 13
Introduction
The BI Survey 13 is based on findings from the world's largest and most
comprehensive survey of business intelligence end-users, conducted earlier this
year. In total, 3,149 people responded to The Survey with 2,298 answering a series
of detailed questions about their usage of a named product. Altogether, 30 products
or groups of products received a detailed analysis.
The BI Survey 13 examines BI product selection and usage among users in areas
including business benefits, costs, proportion of employees using the product,
competitiveness, recommendation, innovation, performance, customer satisfaction
and agility.
One thing that all BI deployments ought to have in common is that they should
deliver business benefits. We asked several questions that helped us measure how
successful respondents’ deployments had been. The combined results were then
used as a calibration tool that is widely used throughout The Survey to assess the
correlation between many factors and project success.
Tableau overview
Tableau is a business analytics company with data visualization at its core. The
company was founded in 2003. Tableau is growing extremely quickly with revenues
increasing by over 100% in 2010, 2011 and 2012. It reported 750 employees and
more than $120m revenue in 2012.
The core products use an underlying technology called VizQL that was invented by
Tableau’s co-founders in the late nineties at Stanford University. VizQL is a patented
query language that translates visual, drag-and-drop actions into a database query
and then expresses the response graphically.
Tableau is one of the most popular visual exploration products in the world, geared
to business users with good usability and simple installation.
The company also offers a server product that can be used to distribute interactive
analyses, dashboards / reports but provides very limited additional authoring
functionality.
Tableau in THE BI Survey 13
4
Tableau customer responses
This is the third year that Tableau features in The BI Survey. It appeared this year
with a healthy sample of 48 users.
Around 57 percent of participants said they were using Tableau version 8 and 36
percent version 7.
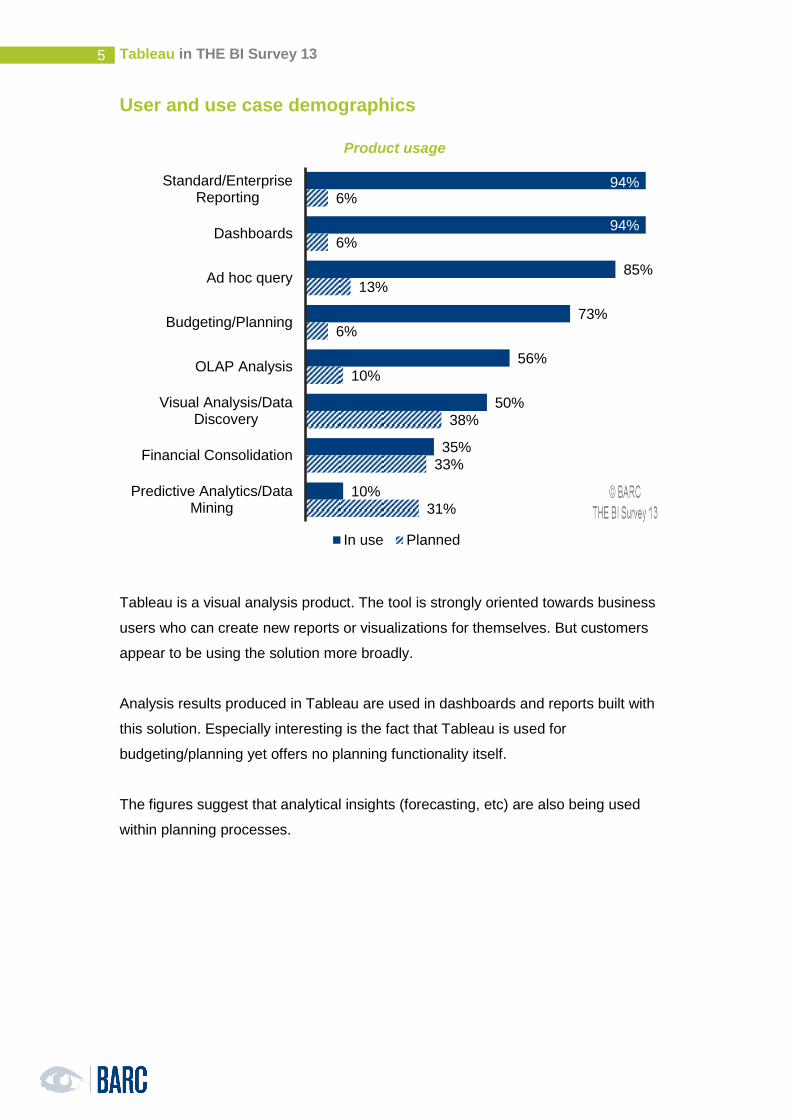
Tableau in THE BI Survey 13
5
User and use case demographics
Product usage
Tableau is a visual analysis product. The tool is strongly oriented towards business
users who can create new reports or visualizations for themselves. But customers
appear to be using the solution more broadly.
Analysis results produced in Tableau are used in dashboards and reports built with
this solution. Especially interesting is the fact that Tableau is used for
budgeting/planning yet offers no planning functionality itself.
The figures suggest that analytical insights (forecasting, etc) are also being used
within planning processes.
94%
94%
85%
73%
56%
50%
35%
10%
6%
6%
13%
6%
10%
38%
33%
31%
Standard/EnterpriseReporting
Dashboards
Ad hoc query
Budgeting/Planning
OLAP Analysis
Visual Analysis/DataDiscovery
Financial Consolidation
Predictive Analytics/DataMining
In use Planned
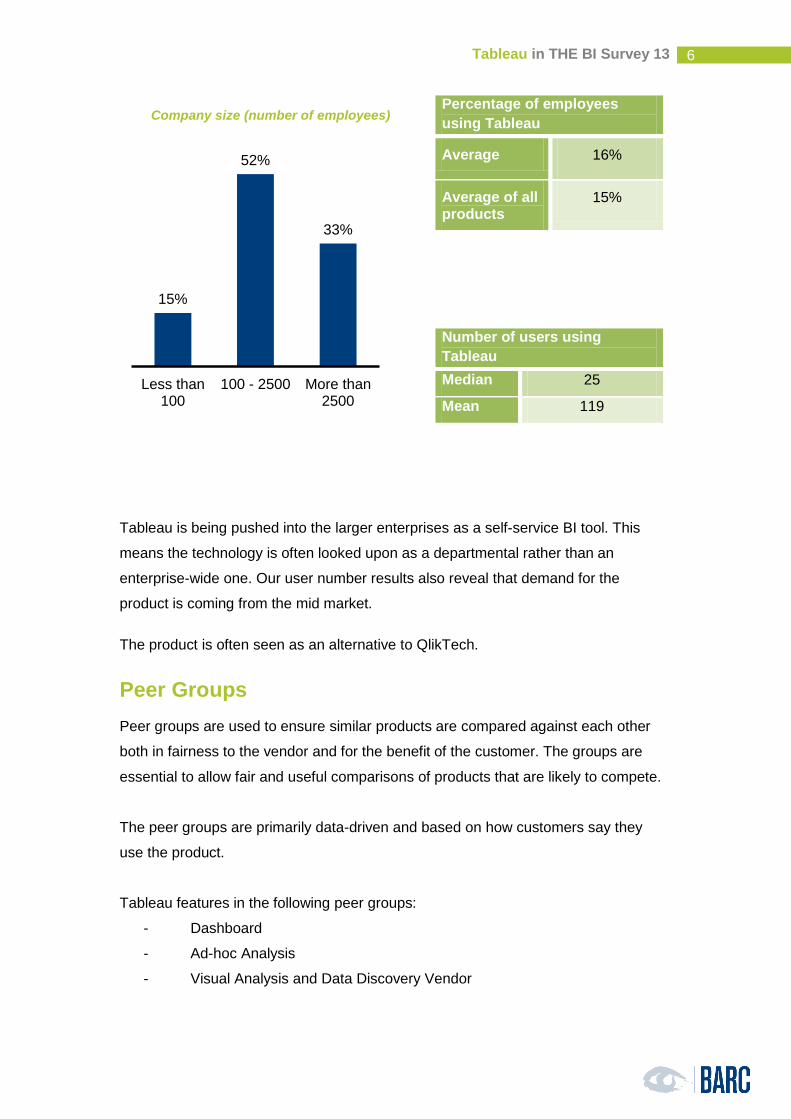
Tableau in THE BI Survey 13
6
Company size (number of employees)
Percentage of employees
using Tableau
Average 16%
Average of all products
15%
Number of users using
Tableau
Median 25
Mean 119
Tableau is being pushed into the larger enterprises as a self-service BI tool. This
means the technology is often looked upon as a departmental rather than an
enterprise-wide one. Our user number results also reveal that demand for the
product is coming from the mid market.
The product is often seen as an alternative to QlikTech.
Peer Groups
Peer groups are used to ensure similar products are compared against each other
both in fairness to the vendor and for the benefit of the customer. The groups are
essential to allow fair and useful comparisons of products that are likely to compete.
The peer groups are primarily data-driven and based on how customers say they
use the product.
Tableau features in the following peer groups:
- Dashboard
- Ad-hoc Analysis
- Visual Analysis and Data Discovery Vendor
15%
52%
33%
Less than100
100 - 2500 More than2500
Tableau in THE BI Survey 13
7
The KPIs
The BI Survey 13 provides the reader with well-designed dashboards packed with
concise information using aggregated KPIs, which can be absorbed at a glance. The
KPIs all follow these simple rules:
- Only measures that have a clear good/bad trend are used as the basis for
KPIs
- KPIs may be based on one or more measures from The BI Survey
- Only products with samples of at least 20 - 30 (depending on the KPI) for
each of the questions that feeds into the KPI are included
- Each KPI is normalized so that the overall sample always has a value of
1.0
- The KPIs are calculated so that better-than-average products always
have scores of greater than 1.0, while less good products score less than
1.0. When viewing the peer group KPI charts, note that the average for
each peer group will usually be either higher or lower than 1.0 because
the peer groups are all subsets of the overall sample.
The products are sorted by value, the better the product the higher the value. The
average is displayed as a green bar and separates the products into two groups, the
ones that have performed better than average and the ones that have performed
worse than average.
For more details on the KPIs, see the ‘KPIs and Dashboards’ document.
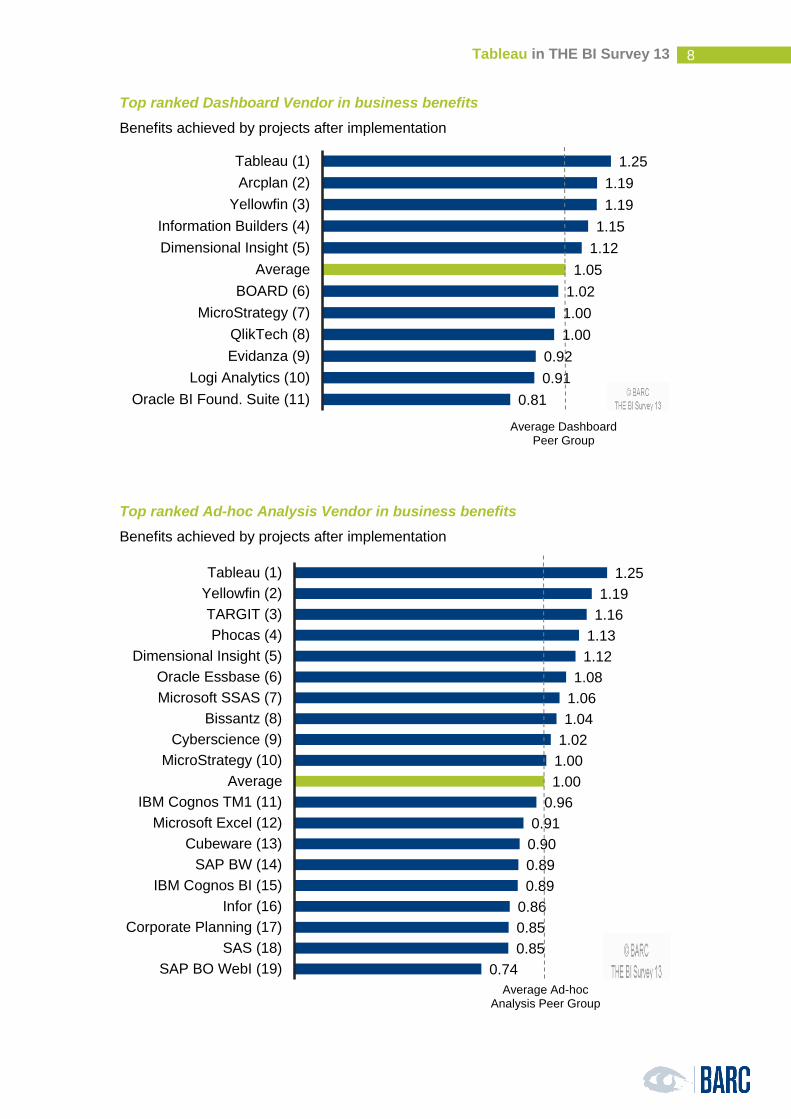
Tableau in THE BI Survey 13
8
Top ranked Dashboard Vendor in business benefits
Benefits achieved by projects after implementation
Top ranked Ad-hoc Analysis Vendor in business benefits
Benefits achieved by projects after implementation
1.25
1.19
1.19
1.15
1.12
1.05
1.02
1.00
1.00
0.92
0.91
0.81
Tableau (1)
Arcplan (2)
Yellowfin (3)
Information Builders (4)
Dimensional Insight (5)
Average
BOARD (6)
MicroStrategy (7)
QlikTech (8)
Evidanza (9)
Logi Analytics (10)
Oracle BI Found. Suite (11)
Average Dashboard Peer Group
1.25
1.19
1.16
1.13
1.12
1.08
1.06
1.04
1.02
1.00
1.00
0.96
0.91
0.90
0.89
0.89
0.86
0.85
0.85
0.74
Tableau (1)
Yellowfin (2)
TARGIT (3)
Phocas (4)
Dimensional Insight (5)
Oracle Essbase (6)
Microsoft SSAS (7)
Bissantz (8)
Cyberscience (9)
MicroStrategy (10)
Average
IBM Cognos TM1 (11)
Microsoft Excel (12)
Cubeware (13)
SAP BW (14)
IBM Cognos BI (15)
Infor (16)
Corporate Planning (17)
SAS (18)
SAP BO WebI (19)
Average Ad-hoc Analysis Peer Group
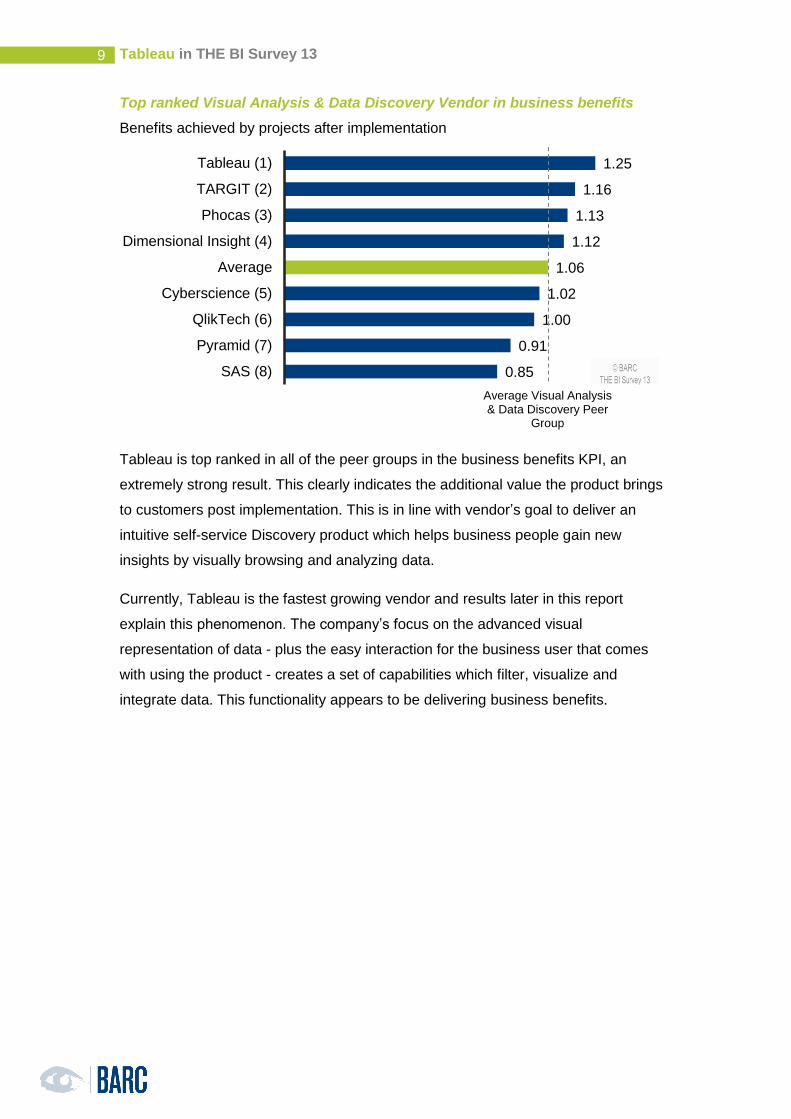
Tableau in THE BI Survey 13
9
Top ranked Visual Analysis & Data Discovery Vendor in business benefits
Benefits achieved by projects after implementation
Tableau is top ranked in all of the peer groups in the business benefits KPI, an
extremely strong result. This clearly indicates the additional value the product brings
to customers post implementation. This is in line with vendor’s goal to deliver an
intuitive self-service Discovery product which helps business people gain new
insights by visually browsing and analyzing data.
Currently, Tableau is the fastest growing vendor and results later in this report
explain this phenomenon. The company’s focus on the advanced visual
representation of data - plus the easy interaction for the business user that comes
with using the product - creates a set of capabilities which filter, visualize and
integrate data. This functionality appears to be delivering business benefits.
1.25
1.16
1.13
1.12
1.06
1.02
1.00
0.91
0.85
Tableau (1)
TARGIT (2)
Phocas (3)
Dimensional Insight (4)
Average
Cyberscience (5)
QlikTech (6)
Pyramid (7)
SAS (8)
Average Visual Analysis & Data Discovery Peer
Group
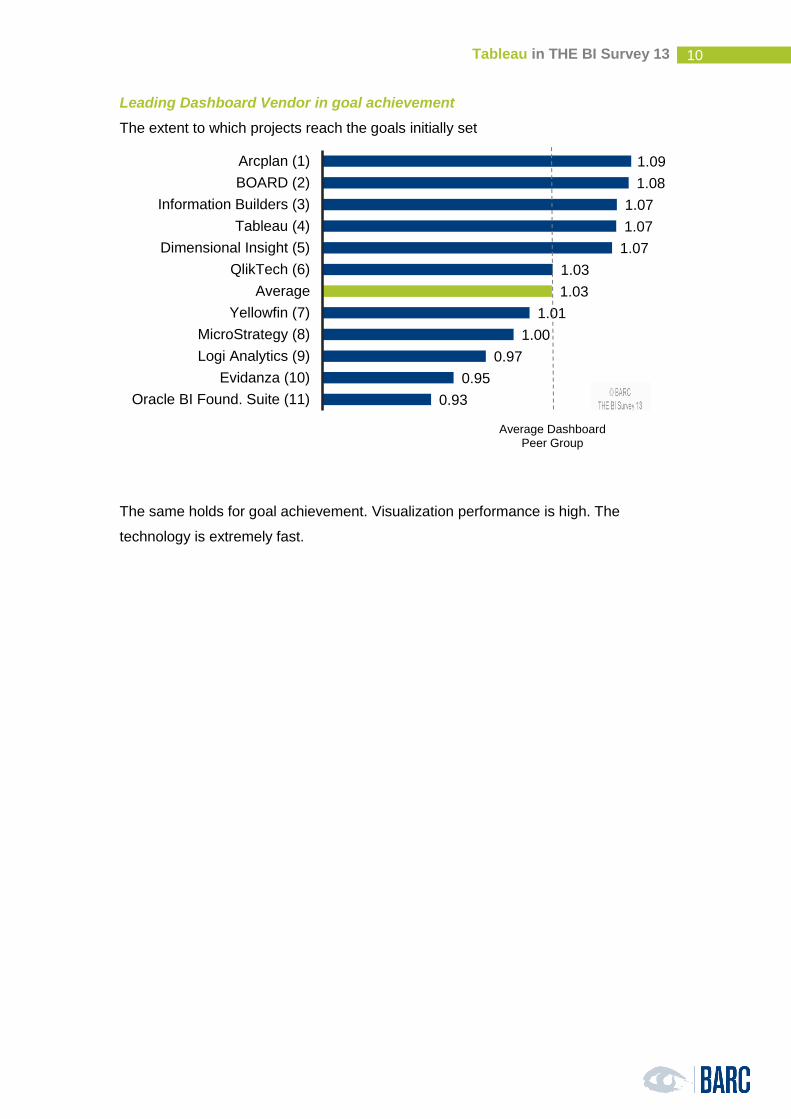
Tableau in THE BI Survey 13
10
Leading Dashboard Vendor in goal achievement
The extent to which projects reach the goals initially set
The same holds for goal achievement. Visualization performance is high. The
technology is extremely fast.
1.09
1.08
1.07
1.07
1.07
1.03
1.03
1.01
1.00
0.97
0.95
0.93
Arcplan (1)
BOARD (2)
Information Builders (3)
Tableau (4)
Dimensional Insight (5)
QlikTech (6)
Average
Yellowfin (7)
MicroStrategy (8)
Logi Analytics (9)
Evidanza (10)
Oracle BI Found. Suite (11)
Average Dashboard Peer Group
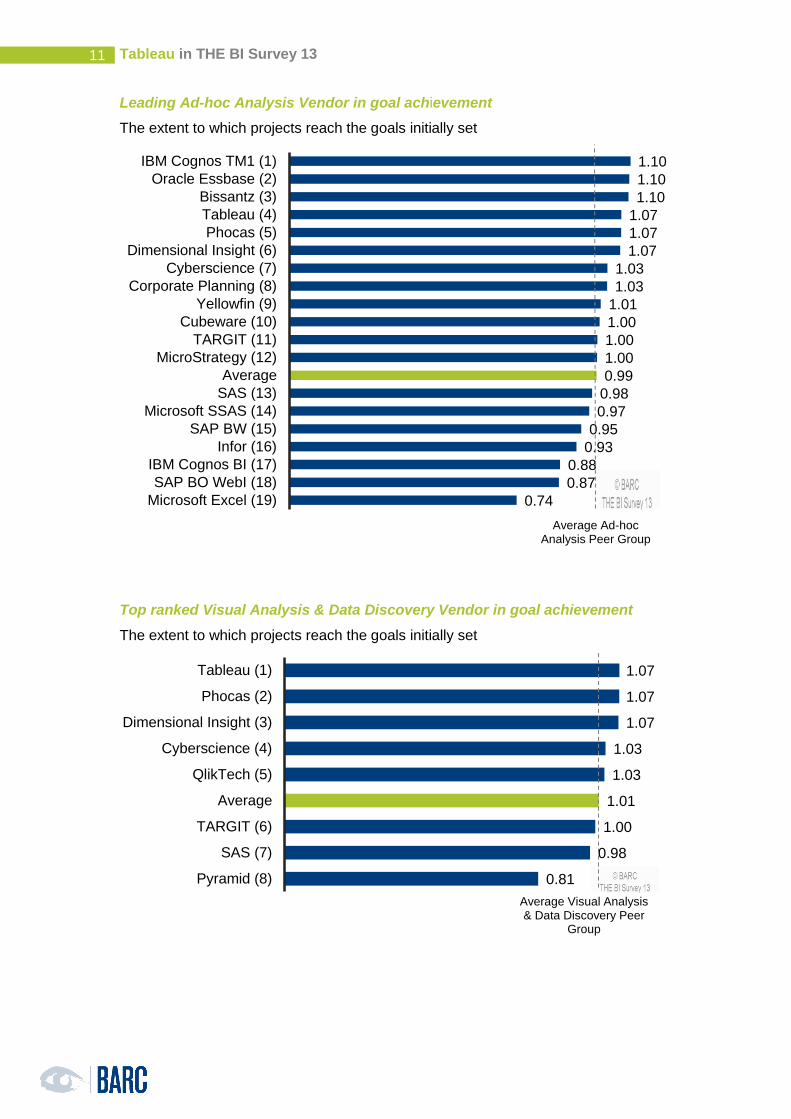
Tableau in THE BI Survey 13
11
Leading Ad-hoc Analysis Vendor in goal achievement
The extent to which projects reach the goals initially set
Top ranked Visual Analysis & Data Discovery Vendor in goal achievement
The extent to which projects reach the goals initially set
1.10
1.10
1.10
1.07
1.07
1.07
1.03
1.03
1.01
1.00
1.00
1.00
0.99
0.98
0.97
0.95
0.93
0.88
0.87
0.74
IBM Cognos TM1 (1)
Oracle Essbase (2)
Bissantz (3)
Tableau (4)
Phocas (5)
Dimensional Insight (6)
Cyberscience (7)
Corporate Planning (8)
Yellowfin (9)
Cubeware (10)
TARGIT (11)
MicroStrategy (12)
Average
SAS (13)
Microsoft SSAS (14)
SAP BW (15)
Infor (16)
IBM Cognos BI (17)
SAP BO WebI (18)
Microsoft Excel (19)
Average Ad-hoc Analysis Peer Group
1.07
1.07
1.07
1.03
1.03
1.01
1.00
0.98
0.81
Tableau (1)
Phocas (2)
Dimensional Insight (3)
Cyberscience (4)
QlikTech (5)
Average
TARGIT (6)
SAS (7)
Pyramid (8)
Average Visual Analysis & Data Discovery Peer
Group
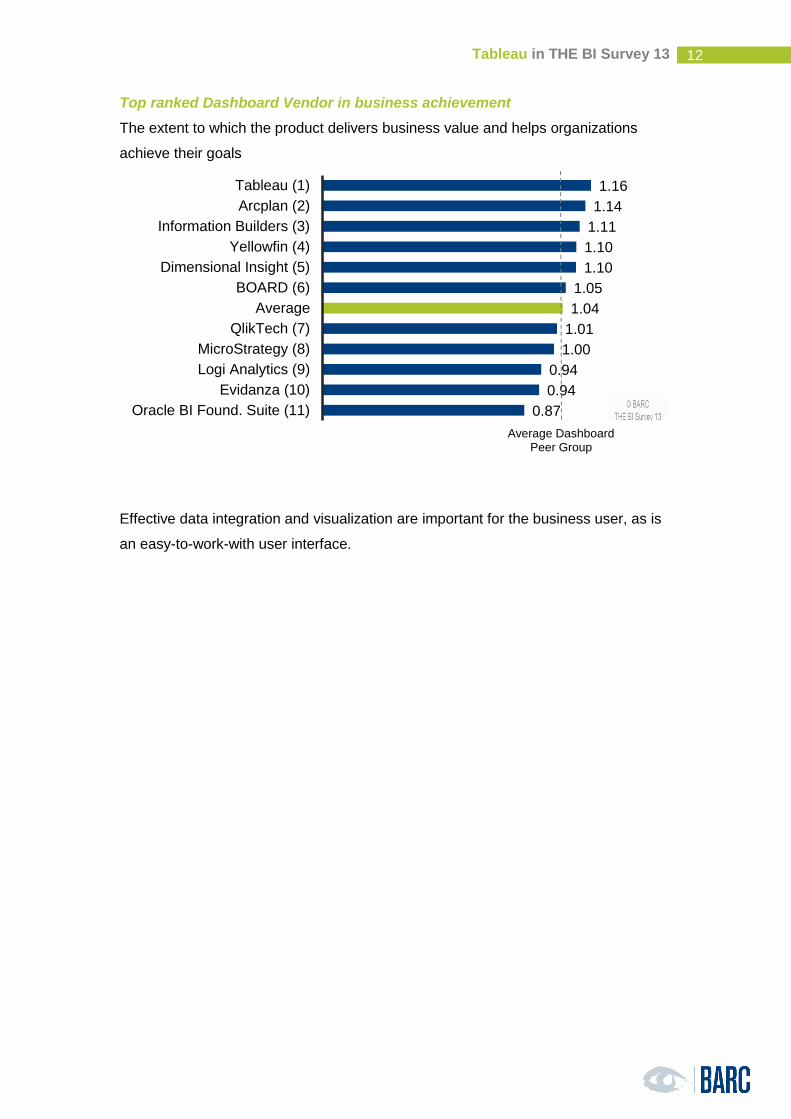
Tableau in THE BI Survey 13
12
Top ranked Dashboard Vendor in business achievement
The extent to which the product delivers business value and helps organizations
achieve their goals
Effective data integration and visualization are important for the business user, as is
an easy-to-work-with user interface.
1.16
1.14
1.11
1.10
1.10
1.05
1.04
1.01
1.00
0.94
0.94
0.87
Tableau (1)
Arcplan (2)
Information Builders (3)
Yellowfin (4)
Dimensional Insight (5)
BOARD (6)
Average
QlikTech (7)
MicroStrategy (8)
Logi Analytics (9)
Evidanza (10)
Oracle BI Found. Suite (11)
Average Dashboard Peer Group
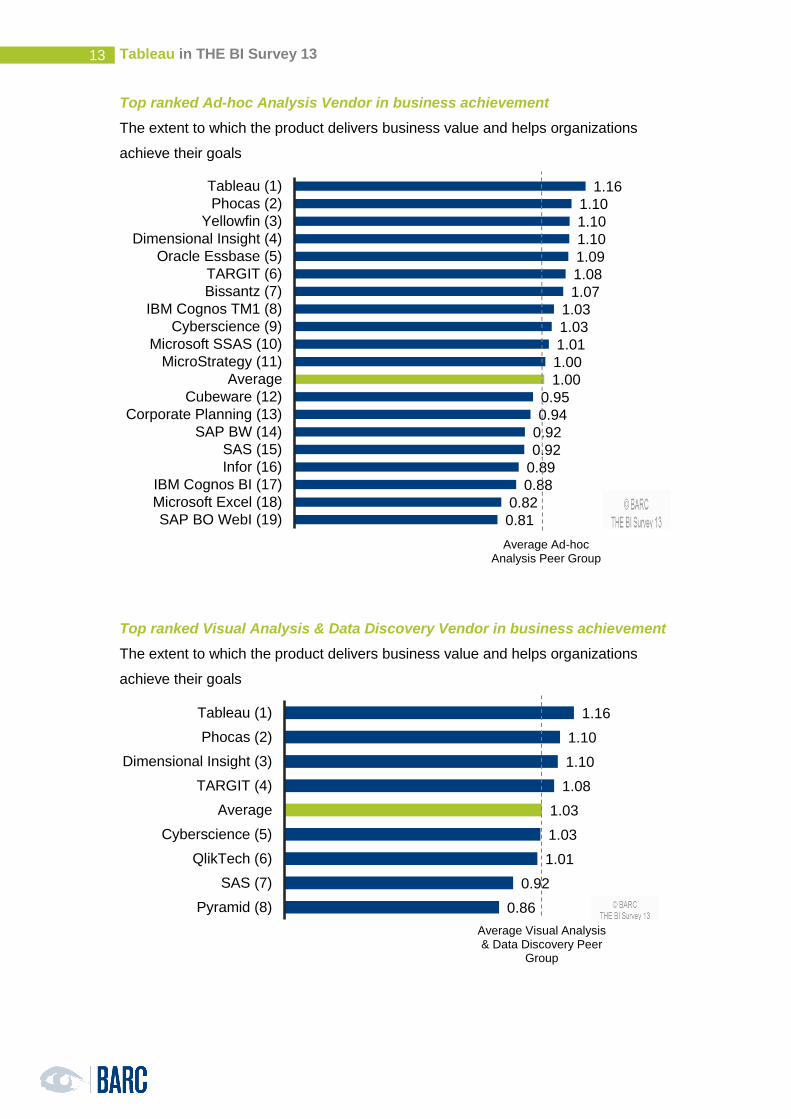
Tableau in THE BI Survey 13
13
Top ranked Ad-hoc Analysis Vendor in business achievement
The extent to which the product delivers business value and helps organizations
achieve their goals
Top ranked Visual Analysis & Data Discovery Vendor in business achievement
The extent to which the product delivers business value and helps organizations
achieve their goals
1.16
1.10
1.10
1.10
1.09
1.08
1.07
1.03
1.03
1.01
1.00
1.00
0.95
0.94
0.92
0.92
0.89
0.88
0.82
0.81
Tableau (1)
Phocas (2)
Yellowfin (3)
Dimensional Insight (4)
Oracle Essbase (5)
TARGIT (6)
Bissantz (7)
IBM Cognos TM1 (8)
Cyberscience (9)
Microsoft SSAS (10)
MicroStrategy (11)
Average
Cubeware (12)
Corporate Planning (13)
SAP BW (14)
SAS (15)
Infor (16)
IBM Cognos BI (17)
Microsoft Excel (18)
SAP BO WebI (19)
Average Ad-hoc Analysis Peer Group
1.16
1.10
1.10
1.08
1.03
1.03
1.01
0.92
0.86
Tableau (1)
Phocas (2)
Dimensional Insight (3)
TARGIT (4)
Average
Cyberscience (5)
QlikTech (6)
SAS (7)
Pyramid (8)
Average Visual Analysis & Data Discovery Peer
Group
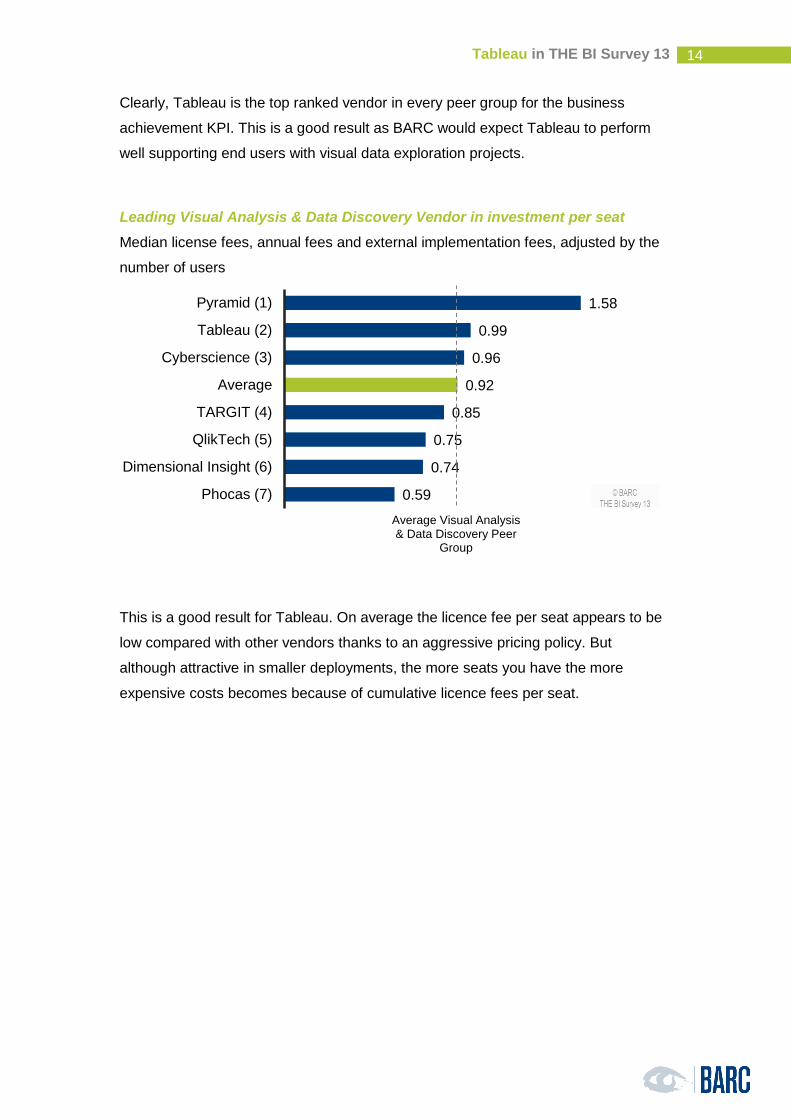
Tableau in THE BI Survey 13
14
Clearly, Tableau is the top ranked vendor in every peer group for the business
achievement KPI. This is a good result as BARC would expect Tableau to perform
well supporting end users with visual data exploration projects.
Leading Visual Analysis & Data Discovery Vendor in investment per seat
Median license fees, annual fees and external implementation fees, adjusted by the
number of users
This is a good result for Tableau. On average the licence fee per seat appears to be
low compared with other vendors thanks to an aggressive pricing policy. But
although attractive in smaller deployments, the more seats you have the more
expensive costs becomes because of cumulative licence fees per seat.
1.58
0.99
0.96
0.92
0.85
0.75
0.74
0.59
Pyramid (1)
Tableau (2)
Cyberscience (3)
Average
TARGIT (4)
QlikTech (5)
Dimensional Insight (6)
Phocas (7)
Average Visual Analysis & Data Discovery Peer
Group
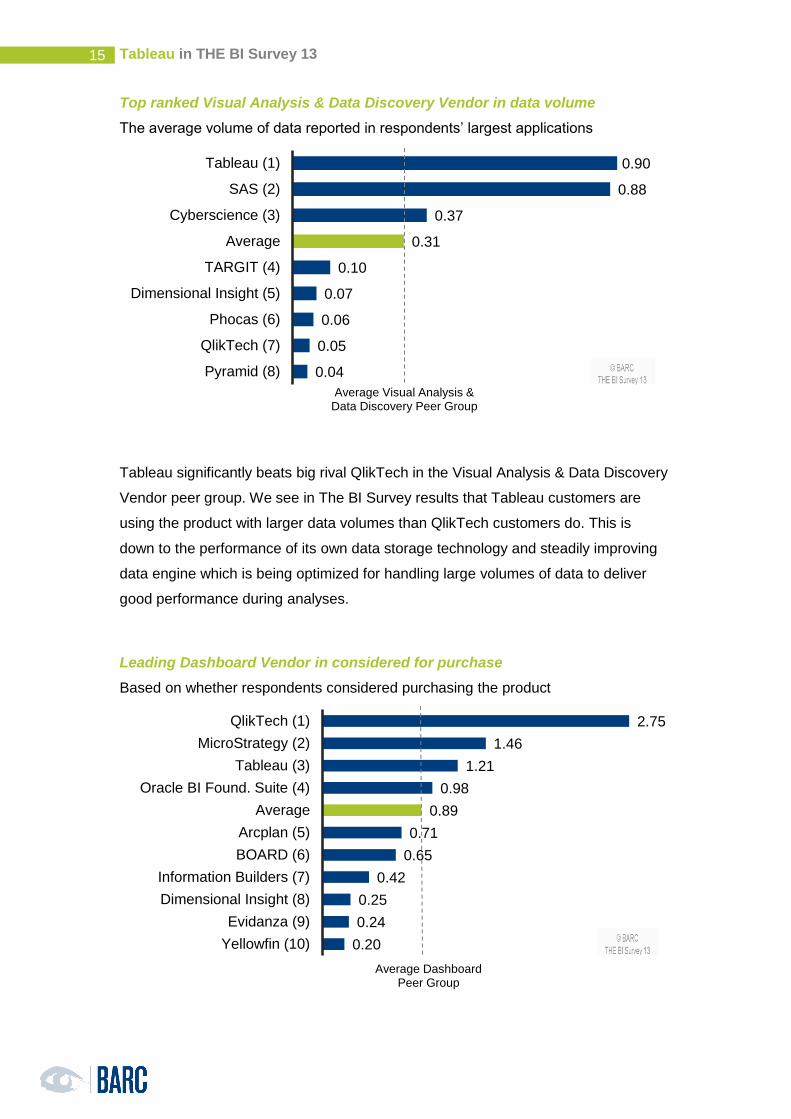
Tableau in THE BI Survey 13
15
Top ranked Visual Analysis & Data Discovery Vendor in data volume
The average volume of data reported in respondents’ largest applications
Tableau significantly beats big rival QlikTech in the Visual Analysis & Data Discovery
Vendor peer group. We see in The BI Survey results that Tableau customers are
using the product with larger data volumes than QlikTech customers do. This is
down to the performance of its own data storage technology and steadily improving
data engine which is being optimized for handling large volumes of data to deliver
good performance during analyses.
Leading Dashboard Vendor in considered for purchase
Based on whether respondents considered purchasing the product
0.90
0.88
0.37
0.31
0.10
0.07
0.06
0.05
0.04
Tableau (1)
SAS (2)
Cyberscience (3)
Average
TARGIT (4)
Dimensional Insight (5)
Phocas (6)
QlikTech (7)
Pyramid (8)
Average Visual Analysis & Data Discovery Peer Group
2.75
1.46
1.21
0.98
0.89
0.71
0.65
0.42
0.25
0.24
0.20
QlikTech (1)
MicroStrategy (2)
Tableau (3)
Oracle BI Found. Suite (4)
Average
Arcplan (5)
BOARD (6)
Information Builders (7)
Dimensional Insight (8)
Evidanza (9)
Yellowfin (10)
Average Dashboard Peer Group
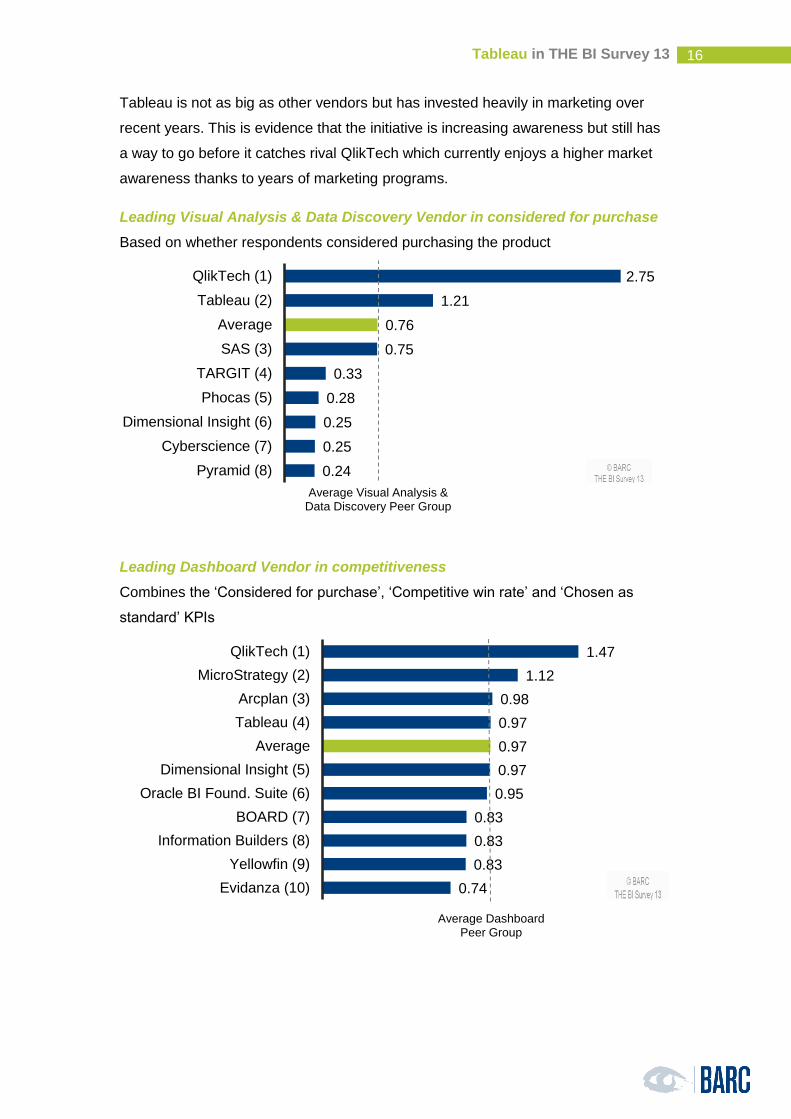
Tableau in THE BI Survey 13
16
Tableau is not as big as other vendors but has invested heavily in marketing over
recent years. This is evidence that the initiative is increasing awareness but still has
a way to go before it catches rival QlikTech which currently enjoys a higher market
awareness thanks to years of marketing programs.
Leading Visual Analysis & Data Discovery Vendor in considered for purchase
Based on whether respondents considered purchasing the product
Leading Dashboard Vendor in competitiveness
Combines the ‘Considered for purchase’, ‘Competitive win rate’ and ‘Chosen as
standard’ KPIs
2.75
1.21
0.76
0.75
0.33
0.28
0.25
0.25
0.24
QlikTech (1)
Tableau (2)
Average
SAS (3)
TARGIT (4)
Phocas (5)
Dimensional Insight (6)
Cyberscience (7)
Pyramid (8)
Average Visual Analysis & Data Discovery Peer Group
1.47
1.12
0.98
0.97
0.97
0.97
0.95
0.83
0.83
0.83
0.74
QlikTech (1)
MicroStrategy (2)
Arcplan (3)
Tableau (4)
Average
Dimensional Insight (5)
Oracle BI Found. Suite (6)
BOARD (7)
Information Builders (8)
Yellowfin (9)
Evidanza (10)
Average Dashboard Peer Group
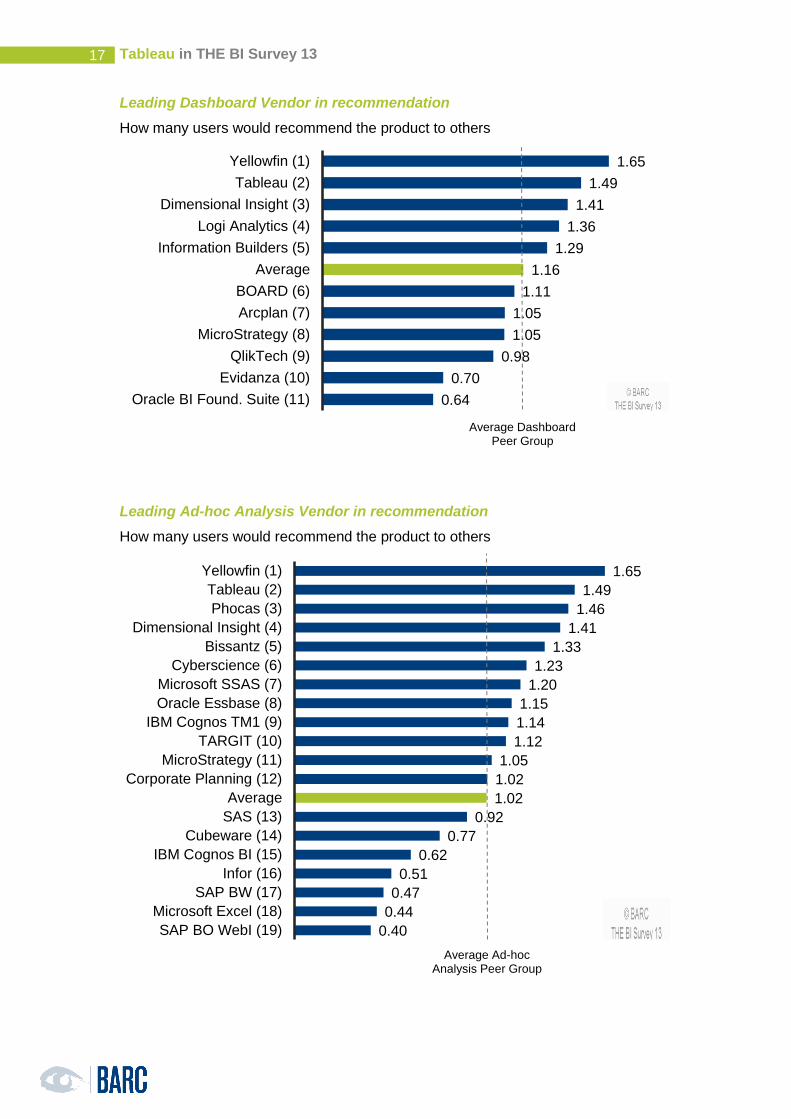
Tableau in THE BI Survey 13
17
Leading Dashboard Vendor in recommendation
How many users would recommend the product to others
Leading Ad-hoc Analysis Vendor in recommendation
How many users would recommend the product to others
1.65
1.49
1.41
1.36
1.29
1.16
1.11
1.05
1.05
0.98
0.70
0.64
Yellowfin (1)
Tableau (2)
Dimensional Insight (3)
Logi Analytics (4)
Information Builders (5)
Average
BOARD (6)
Arcplan (7)
MicroStrategy (8)
QlikTech (9)
Evidanza (10)
Oracle BI Found. Suite (11)
Average Dashboard Peer Group
1.65
1.49
1.46
1.41
1.33
1.23
1.20
1.15
1.14
1.12
1.05
1.02
1.02
0.92
0.77
0.62
0.51
0.47
0.44
0.40
Yellowfin (1)
Tableau (2)
Phocas (3)
Dimensional Insight (4)
Bissantz (5)
Cyberscience (6)
Microsoft SSAS (7)
Oracle Essbase (8)
IBM Cognos TM1 (9)
TARGIT (10)
MicroStrategy (11)
Corporate Planning (12)
Average
SAS (13)
Cubeware (14)
IBM Cognos BI (15)
Infor (16)
SAP BW (17)
Microsoft Excel (18)
SAP BO WebI (19)
Average Ad-hoc Analysis Peer Group
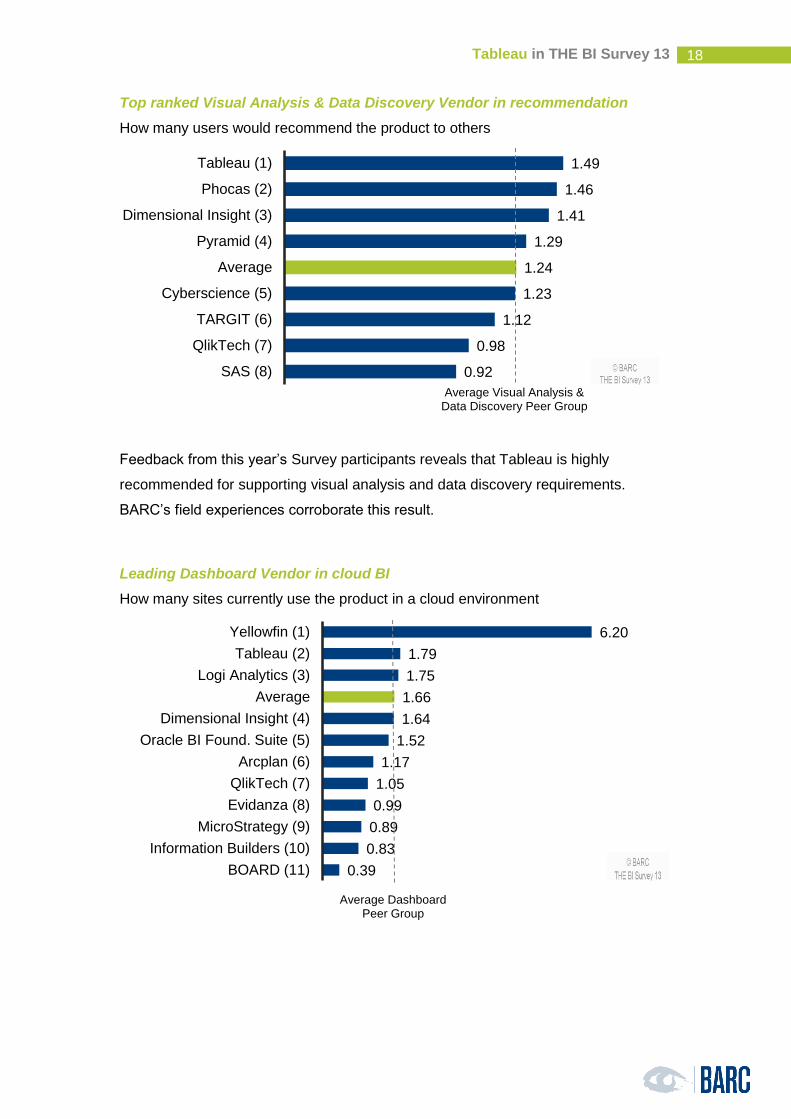
Tableau in THE BI Survey 13
18
Top ranked Visual Analysis & Data Discovery Vendor in recommendation
How many users would recommend the product to others
Feedback from this year’s Survey participants reveals that Tableau is highly
recommended for supporting visual analysis and data discovery requirements.
BARC’s field experiences corroborate this result.
Leading Dashboard Vendor in cloud BI
How many sites currently use the product in a cloud environment
1.49
1.46
1.41
1.29
1.24
1.23
1.12
0.98
0.92
Tableau (1)
Phocas (2)
Dimensional Insight (3)
Pyramid (4)
Average
Cyberscience (5)
TARGIT (6)
QlikTech (7)
SAS (8)
Average Visual Analysis & Data Discovery Peer Group
6.20
1.79
1.75
1.66
1.64
1.52
1.17
1.05
0.99
0.89
0.83
0.39
Yellowfin (1)
Tableau (2)
Logi Analytics (3)
Average
Dimensional Insight (4)
Oracle BI Found. Suite (5)
Arcplan (6)
QlikTech (7)
Evidanza (8)
MicroStrategy (9)
Information Builders (10)
BOARD (11)
Average Dashboard Peer Group
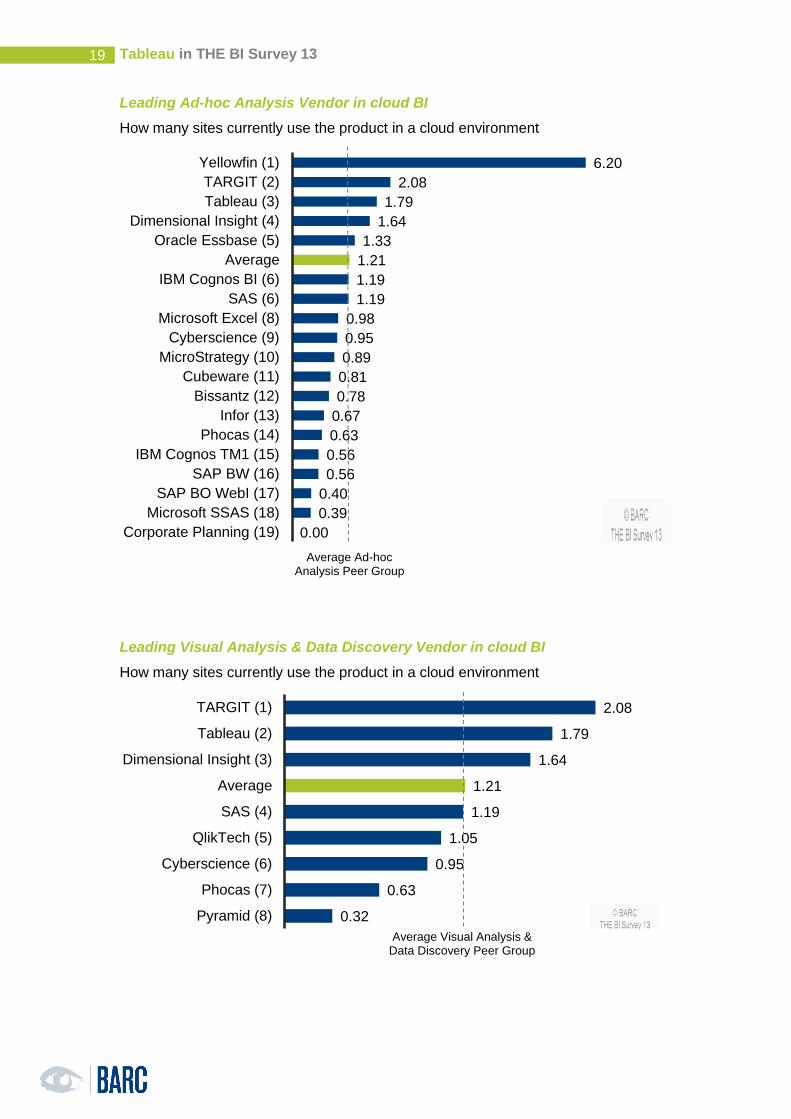
Tableau in THE BI Survey 13
19
Leading Ad-hoc Analysis Vendor in cloud BI
How many sites currently use the product in a cloud environment
Leading Visual Analysis & Data Discovery Vendor in cloud BI
How many sites currently use the product in a cloud environment
6.20
2.08
1.79
1.64
1.33
1.21
1.19
1.19
0.98
0.95
0.89
0.81
0.78
0.67
0.63
0.56
0.56
0.40
0.39
0.00
Yellowfin (1)
TARGIT (2)
Tableau (3)
Dimensional Insight (4)
Oracle Essbase (5)
Average
IBM Cognos BI (6)
SAS (6)
Microsoft Excel (8)
Cyberscience (9)
MicroStrategy (10)
Cubeware (11)
Bissantz (12)
Infor (13)
Phocas (14)
IBM Cognos TM1 (15)
SAP BW (16)
SAP BO WebI (17)
Microsoft SSAS (18)
Corporate Planning (19)
Average Ad-hoc Analysis Peer Group
2.08
1.79
1.64
1.21
1.19
1.05
0.95
0.63
0.32
TARGIT (1)
Tableau (2)
Dimensional Insight (3)
Average
SAS (4)
QlikTech (5)
Cyberscience (6)
Phocas (7)
Pyramid (8)
Average Visual Analysis & Data Discovery Peer Group
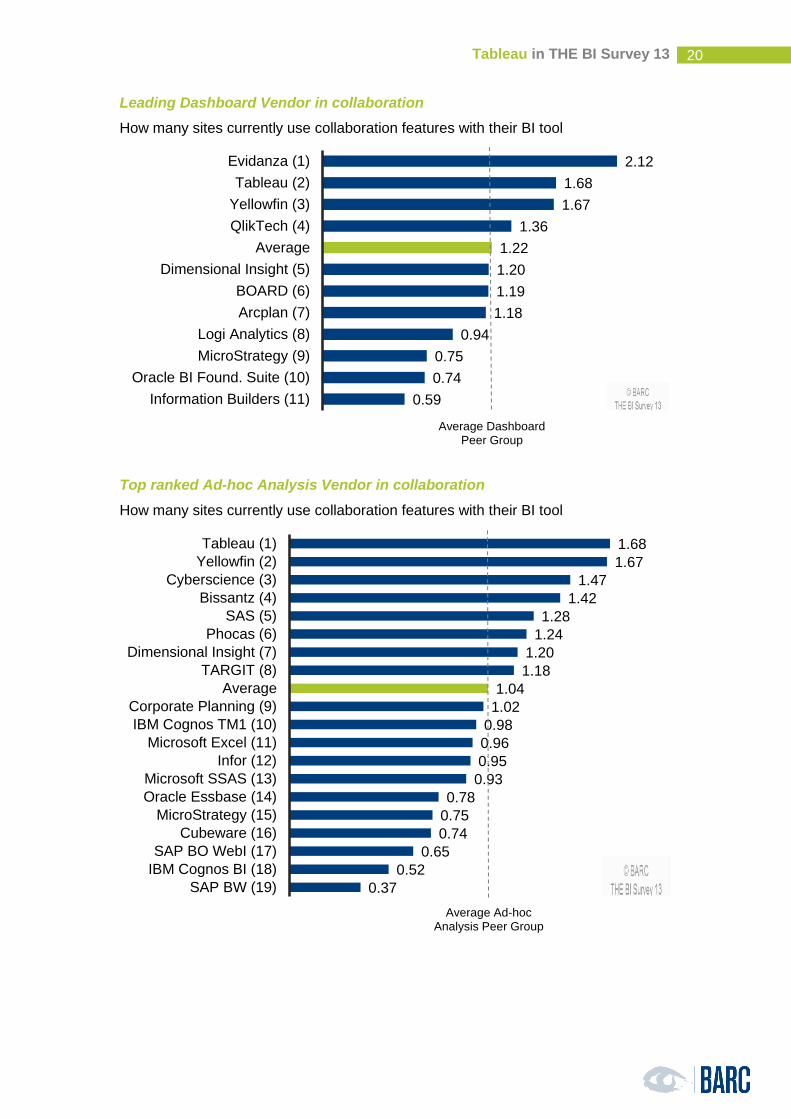
Tableau in THE BI Survey 13
20
Leading Dashboard Vendor in collaboration
How many sites currently use collaboration features with their BI tool
Top ranked Ad-hoc Analysis Vendor in collaboration
How many sites currently use collaboration features with their BI tool
2.12
1.68
1.67
1.36
1.22
1.20
1.19
1.18
0.94
0.75
0.74
0.59
Evidanza (1)
Tableau (2)
Yellowfin (3)
QlikTech (4)
Average
Dimensional Insight (5)
BOARD (6)
Arcplan (7)
Logi Analytics (8)
MicroStrategy (9)
Oracle BI Found. Suite (10)
Information Builders (11)
Average Dashboard Peer Group
1.68
1.67
1.47
1.42
1.28
1.24
1.20
1.18
1.04
1.02
0.98
0.96
0.95
0.93
0.78
0.75
0.74
0.65
0.52
0.37
Tableau (1)
Yellowfin (2)
Cyberscience (3)
Bissantz (4)
SAS (5)
Phocas (6)
Dimensional Insight (7)
TARGIT (8)
Average
Corporate Planning (9)
IBM Cognos TM1 (10)
Microsoft Excel (11)
Infor (12)
Microsoft SSAS (13)
Oracle Essbase (14)
MicroStrategy (15)
Cubeware (16)
SAP BO WebI (17)
IBM Cognos BI (18)
SAP BW (19)
Average Ad-hoc Analysis Peer Group
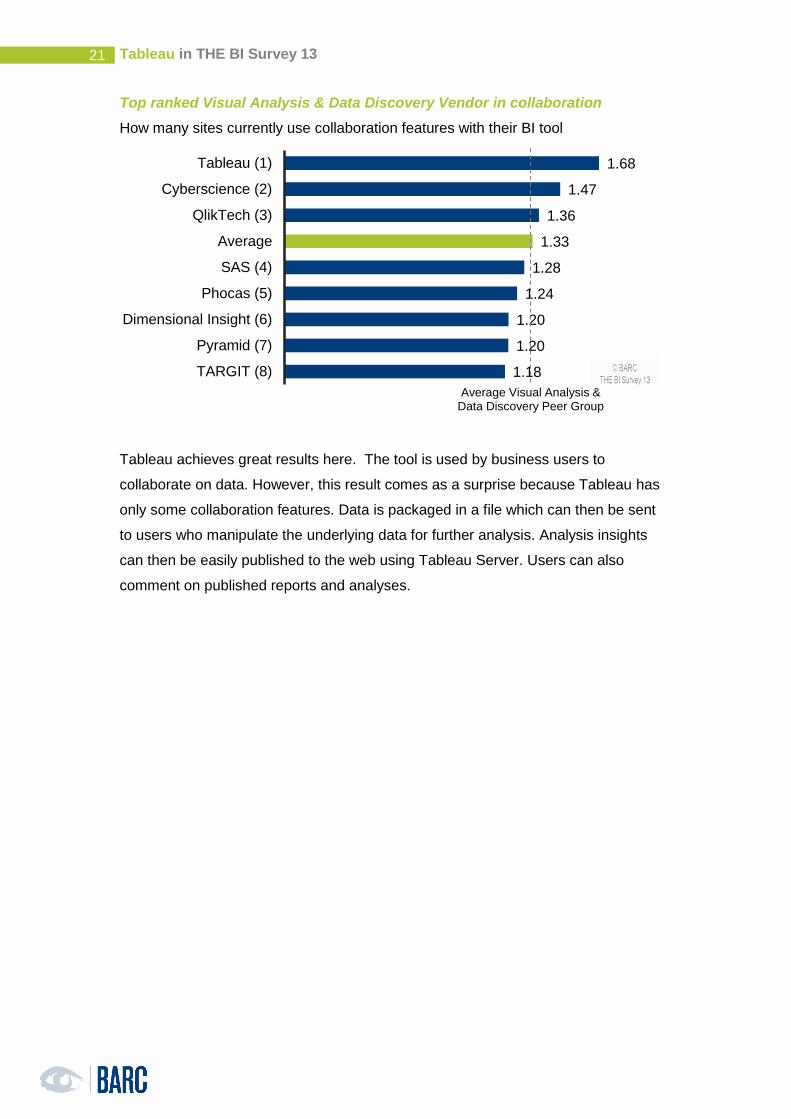
Tableau in THE BI Survey 13
21
Top ranked Visual Analysis & Data Discovery Vendor in collaboration
How many sites currently use collaboration features with their BI tool
Tableau achieves great results here. The tool is used by business users to
collaborate on data. However, this result comes as a surprise because Tableau has
only some collaboration features. Data is packaged in a file which can then be sent
to users who manipulate the underlying data for further analysis. Analysis insights
can then be easily published to the web using Tableau Server. Users can also
comment on published reports and analyses.
1.68
1.47
1.36
1.33
1.28
1.24
1.20
1.20
1.18
Tableau (1)
Cyberscience (2)
QlikTech (3)
Average
SAS (4)
Phocas (5)
Dimensional Insight (6)
Pyramid (7)
TARGIT (8)
Average Visual Analysis & Data Discovery Peer Group
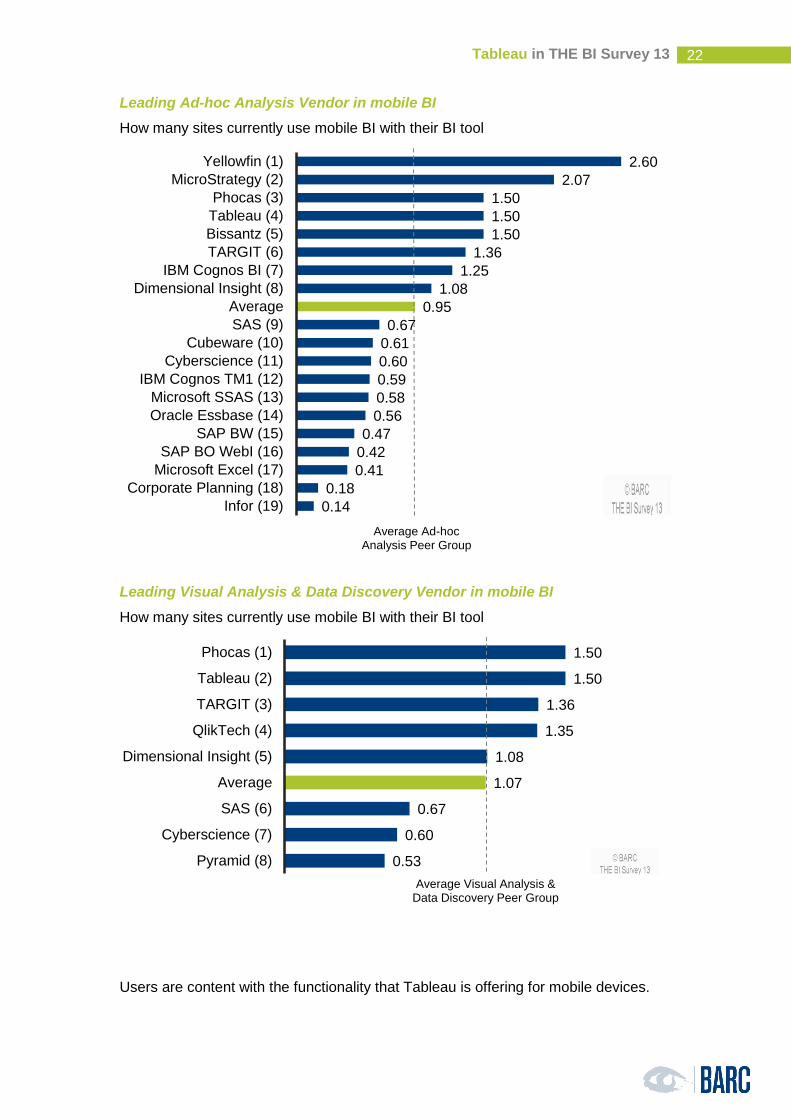
Tableau in THE BI Survey 13
22
Leading Ad-hoc Analysis Vendor in mobile BI
How many sites currently use mobile BI with their BI tool
Leading Visual Analysis & Data Discovery Vendor in mobile BI
How many sites currently use mobile BI with their BI tool
Users are content with the functionality that Tableau is offering for mobile devices.
2.60
2.07
1.50
1.50
1.50
1.36
1.25
1.08
0.95
0.67
0.61
0.60
0.59
0.58
0.56
0.47
0.42
0.41
0.18
0.14
Yellowfin (1)
MicroStrategy (2)
Phocas (3)
Tableau (4)
Bissantz (5)
TARGIT (6)
IBM Cognos BI (7)
Dimensional Insight (8)
Average
SAS (9)
Cubeware (10)
Cyberscience (11)
IBM Cognos TM1 (12)
Microsoft SSAS (13)
Oracle Essbase (14)
SAP BW (15)
SAP BO WebI (16)
Microsoft Excel (17)
Corporate Planning (18)
Infor (19)
Average Ad-hoc Analysis Peer Group
1.50
1.50
1.36
1.35
1.08
1.07
0.67
0.60
0.53
Phocas (1)
Tableau (2)
TARGIT (3)
QlikTech (4)
Dimensional Insight (5)
Average
SAS (6)
Cyberscience (7)
Pyramid (8)
Average Visual Analysis & Data Discovery Peer Group
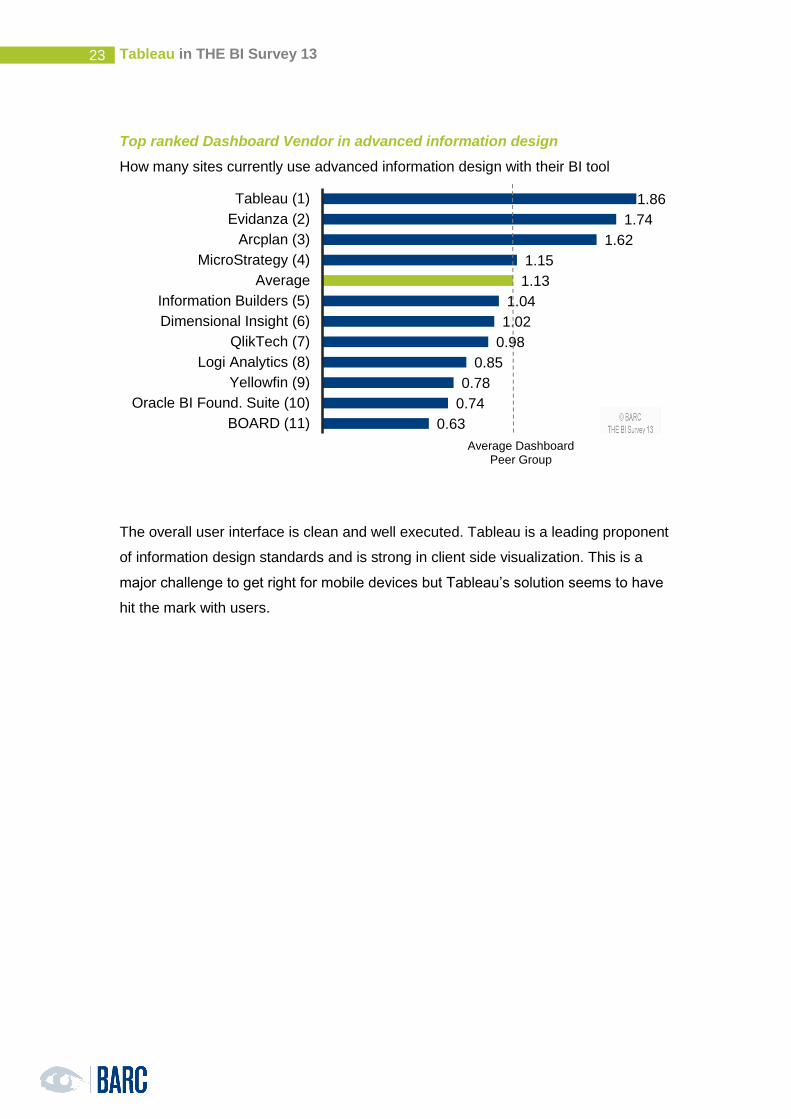
Tableau in THE BI Survey 13
23
Top ranked Dashboard Vendor in advanced information design
How many sites currently use advanced information design with their BI tool
The overall user interface is clean and well executed. Tableau is a leading proponent
of information design standards and is strong in client side visualization. This is a
major challenge to get right for mobile devices but Tableau’s solution seems to have
hit the mark with users.
1.86
1.74
1.62
1.15
1.13
1.04
1.02
0.98
0.85
0.78
0.74
0.63
Tableau (1)
Evidanza (2)
Arcplan (3)
MicroStrategy (4)
Average
Information Builders (5)
Dimensional Insight (6)
QlikTech (7)
Logi Analytics (8)
Yellowfin (9)
Oracle BI Found. Suite (10)
BOARD (11)
Average Dashboard Peer Group
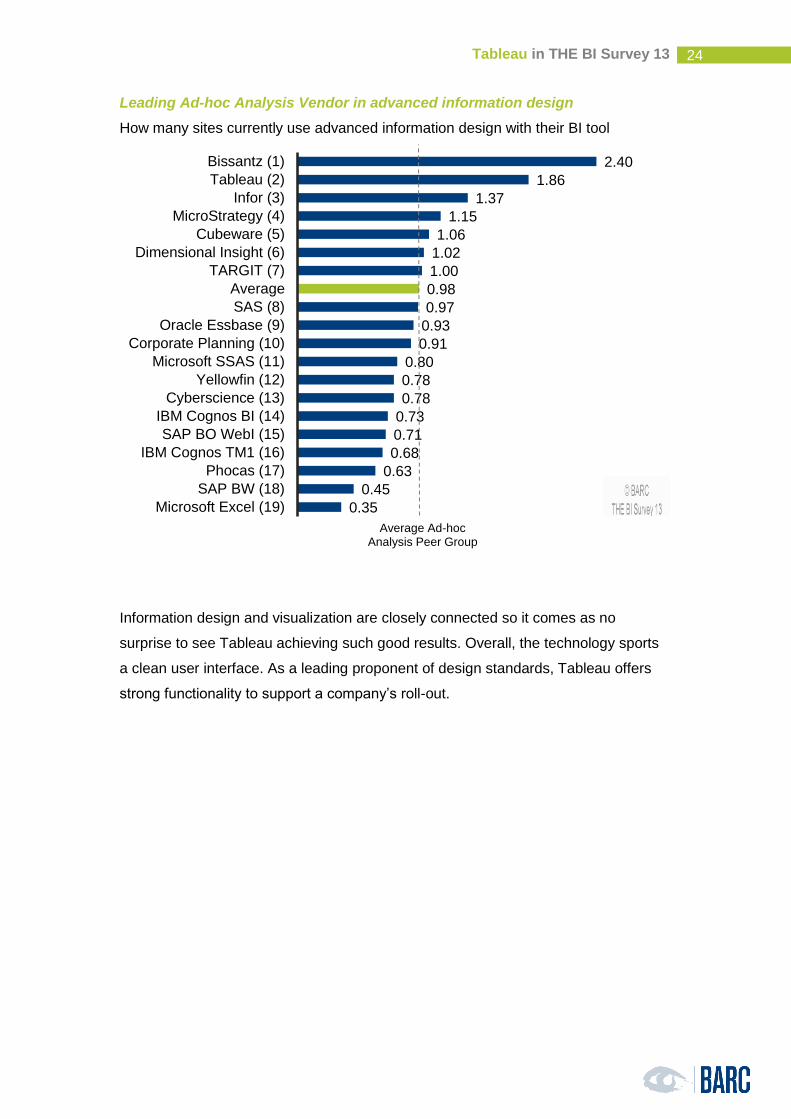
Tableau in THE BI Survey 13
24
Leading Ad-hoc Analysis Vendor in advanced information design
How many sites currently use advanced information design with their BI tool
Information design and visualization are closely connected so it comes as no
surprise to see Tableau achieving such good results. Overall, the technology sports
a clean user interface. As a leading proponent of design standards, Tableau offers
strong functionality to support a company’s roll-out.
2.40
1.86
1.37
1.15
1.06
1.02
1.00
0.98
0.97
0.93
0.91
0.80
0.78
0.78
0.73
0.71
0.68
0.63
0.45
0.35
Bissantz (1)
Tableau (2)
Infor (3)
MicroStrategy (4)
Cubeware (5)
Dimensional Insight (6)
TARGIT (7)
Average
SAS (8)
Oracle Essbase (9)
Corporate Planning (10)
Microsoft SSAS (11)
Yellowfin (12)
Cyberscience (13)
IBM Cognos BI (14)
SAP BO WebI (15)
IBM Cognos TM1 (16)
Phocas (17)
SAP BW (18)
Microsoft Excel (19)
Average Ad-hoc Analysis Peer Group
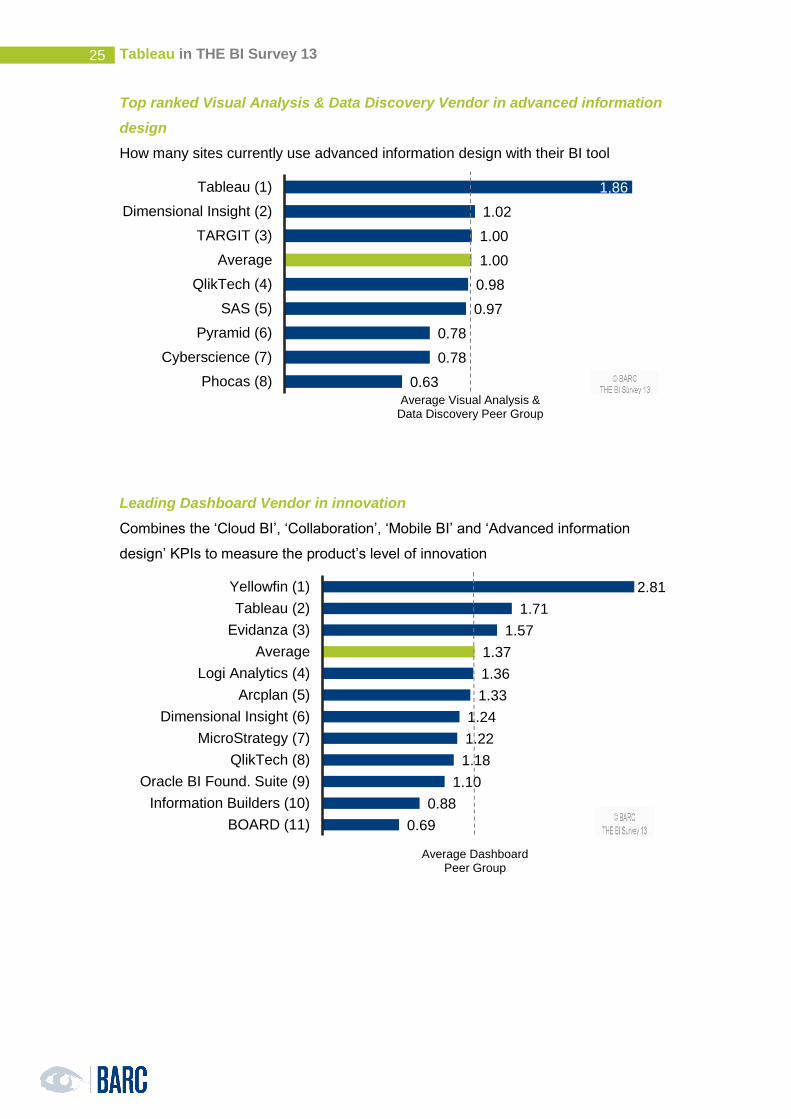
Tableau in THE BI Survey 13
25
Top ranked Visual Analysis & Data Discovery Vendor in advanced information
design
How many sites currently use advanced information design with their BI tool
Leading Dashboard Vendor in innovation
Combines the ‘Cloud BI’, ‘Collaboration’, ‘Mobile BI’ and ‘Advanced information
design’ KPIs to measure the product’s level of innovation
1,86
1.02
1.00
1.00
0.98
0.97
0.78
0.78
0.63
Tableau (1)
Dimensional Insight (2)
TARGIT (3)
Average
QlikTech (4)
SAS (5)
Pyramid (6)
Cyberscience (7)
Phocas (8)
Average Visual Analysis & Data Discovery Peer Group
2.81
1.71
1.57
1.37
1.36
1.33
1.24
1.22
1.18
1.10
0.88
0.69
Yellowfin (1)
Tableau (2)
Evidanza (3)
Average
Logi Analytics (4)
Arcplan (5)
Dimensional Insight (6)
MicroStrategy (7)
QlikTech (8)
Oracle BI Found. Suite (9)
Information Builders (10)
BOARD (11)
Average Dashboard Peer Group
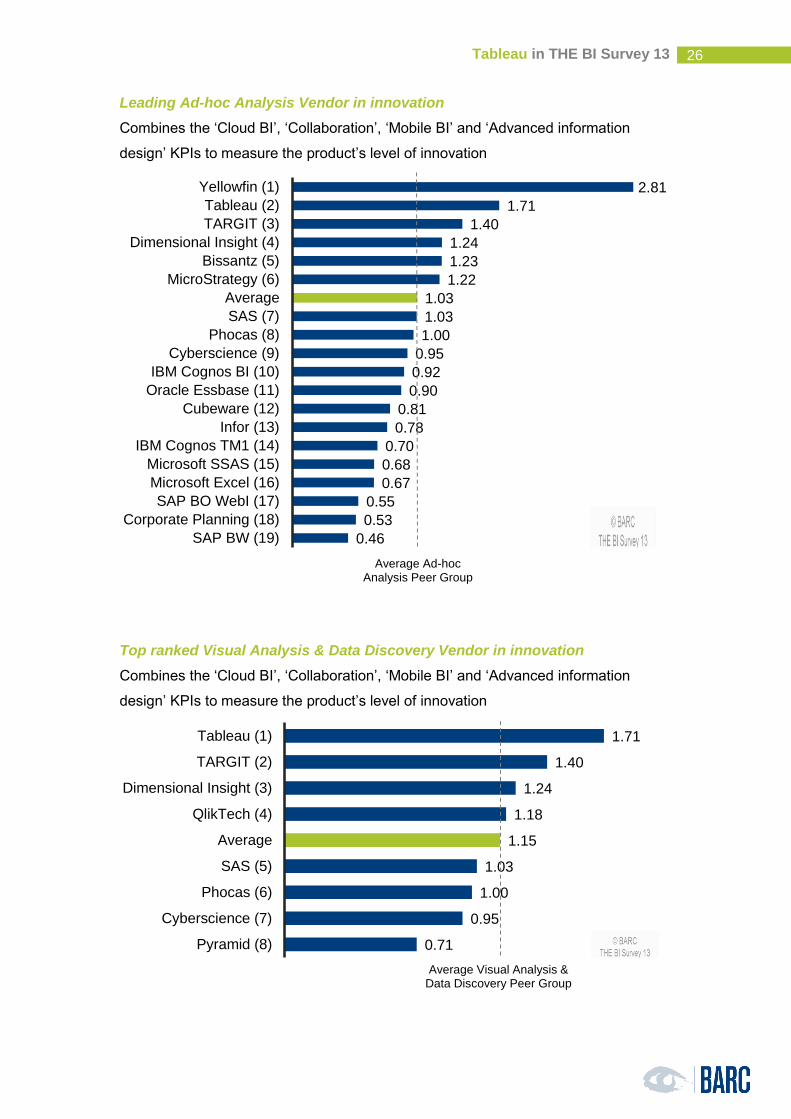
Tableau in THE BI Survey 13
26
Leading Ad-hoc Analysis Vendor in innovation
Combines the ‘Cloud BI’, ‘Collaboration’, ‘Mobile BI’ and ‘Advanced information
design’ KPIs to measure the product’s level of innovation
Top ranked Visual Analysis & Data Discovery Vendor in innovation
Combines the ‘Cloud BI’, ‘Collaboration’, ‘Mobile BI’ and ‘Advanced information
design’ KPIs to measure the product’s level of innovation
2.81
1.71
1.40
1.24
1.23
1.22
1.03
1.03
1.00
0.95
0.92
0.90
0.81
0.78
0.70
0.68
0.67
0.55
0.53
0.46
Yellowfin (1)
Tableau (2)
TARGIT (3)
Dimensional Insight (4)
Bissantz (5)
MicroStrategy (6)
Average
SAS (7)
Phocas (8)
Cyberscience (9)
IBM Cognos BI (10)
Oracle Essbase (11)
Cubeware (12)
Infor (13)
IBM Cognos TM1 (14)
Microsoft SSAS (15)
Microsoft Excel (16)
SAP BO WebI (17)
Corporate Planning (18)
SAP BW (19)
Average Ad-hoc Analysis Peer Group
1.71
1.40
1.24
1.18
1.15
1.03
1.00
0.95
0.71
Tableau (1)
TARGIT (2)
Dimensional Insight (3)
QlikTech (4)
Average
SAS (5)
Phocas (6)
Cyberscience (7)
Pyramid (8)
Average Visual Analysis & Data Discovery Peer Group
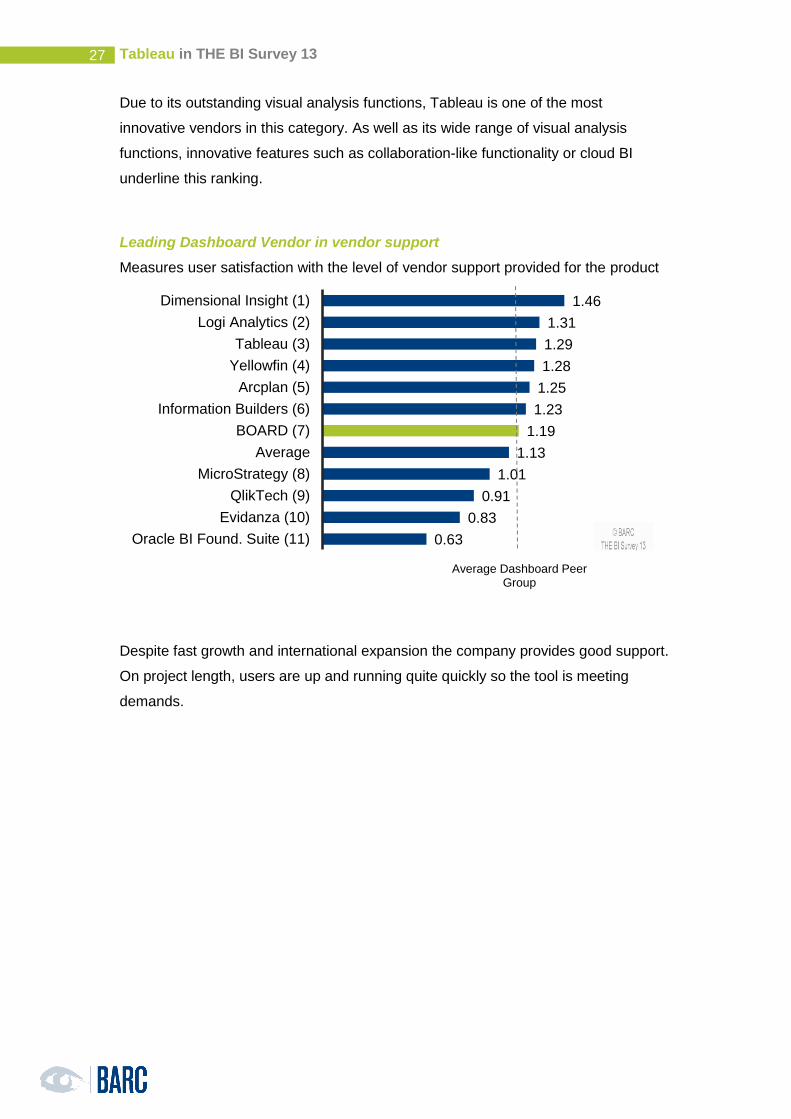
Tableau in THE BI Survey 13
27
Due to its outstanding visual analysis functions, Tableau is one of the most
innovative vendors in this category. As well as its wide range of visual analysis
functions, innovative features such as collaboration-like functionality or cloud BI
underline this ranking.
Leading Dashboard Vendor in vendor support
Measures user satisfaction with the level of vendor support provided for the product
Despite fast growth and international expansion the company provides good support.
On project length, users are up and running quite quickly so the tool is meeting
demands.
1.46
1.31
1.29
1.28
1.25
1.23
1.19
1.13
1.01
0.91
0.83
0.63
Dimensional Insight (1)
Logi Analytics (2)
Tableau (3)
Yellowfin (4)
Arcplan (5)
Information Builders (6)
BOARD (7)
Average
MicroStrategy (8)
QlikTech (9)
Evidanza (10)
Oracle BI Found. Suite (11)
Average Dashboard Peer Group
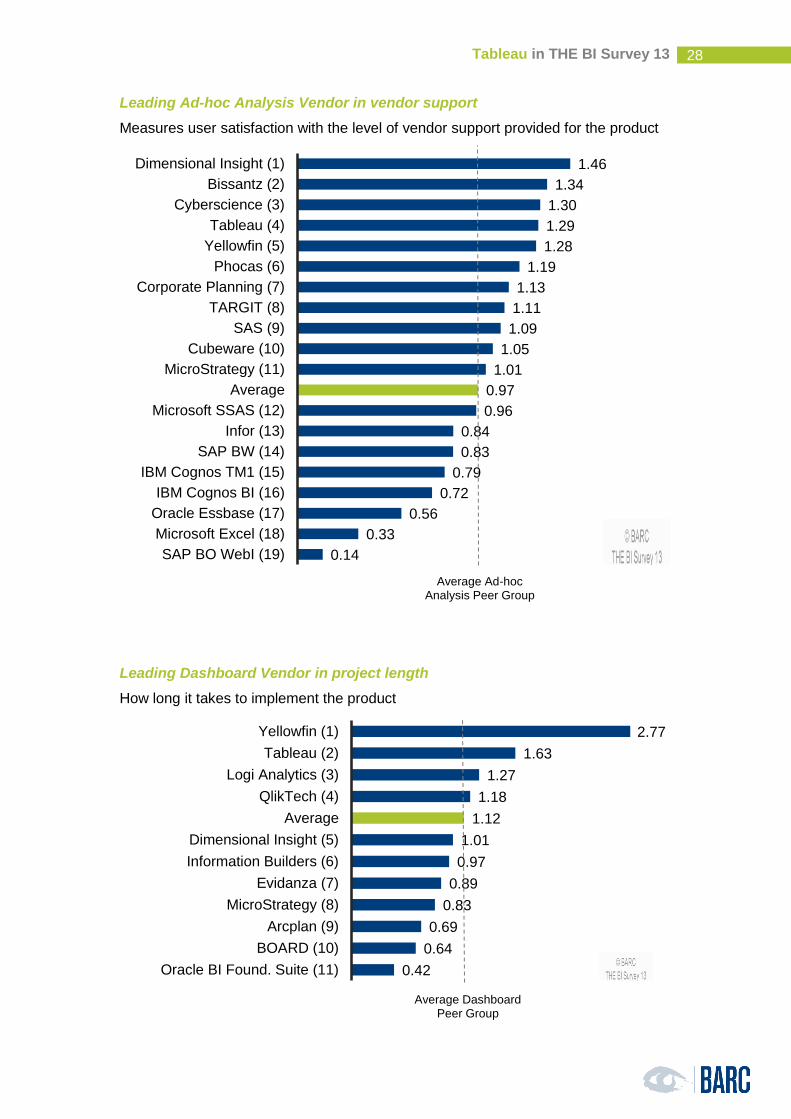
Tableau in THE BI Survey 13
28
Leading Ad-hoc Analysis Vendor in vendor support
Measures user satisfaction with the level of vendor support provided for the product
Leading Dashboard Vendor in project length
How long it takes to implement the product
1.46
1.34
1.30
1.29
1.28
1.19
1.13
1.11
1.09
1.05
1.01
0.97
0.96
0.84
0.83
0.79
0.72
0.56
0.33
0.14
Dimensional Insight (1)
Bissantz (2)
Cyberscience (3)
Tableau (4)
Yellowfin (5)
Phocas (6)
Corporate Planning (7)
TARGIT (8)
SAS (9)
Cubeware (10)
MicroStrategy (11)
Average
Microsoft SSAS (12)
Infor (13)
SAP BW (14)
IBM Cognos TM1 (15)
IBM Cognos BI (16)
Oracle Essbase (17)
Microsoft Excel (18)
SAP BO WebI (19)
Average Ad-hoc Analysis Peer Group
2.77
1.63
1.27
1.18
1.12
1.01
0.97
0.89
0.83
0.69
0.64
0.42
Yellowfin (1)
Tableau (2)
Logi Analytics (3)
QlikTech (4)
Average
Dimensional Insight (5)
Information Builders (6)
Evidanza (7)
MicroStrategy (8)
Arcplan (9)
BOARD (10)
Oracle BI Found. Suite (11)
Average Dashboard Peer Group
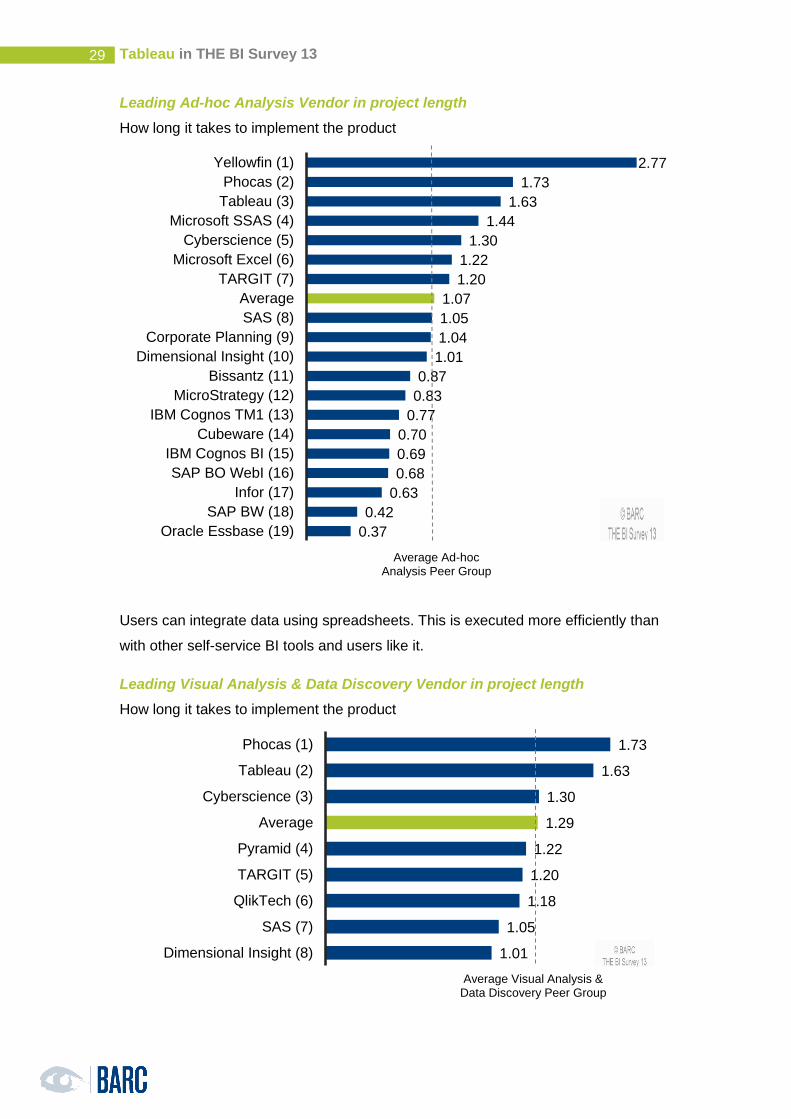
Tableau in THE BI Survey 13
29
Leading Ad-hoc Analysis Vendor in project length
How long it takes to implement the product
Users can integrate data using spreadsheets. This is executed more efficiently than
with other self-service BI tools and users like it.
Leading Visual Analysis & Data Discovery Vendor in project length
How long it takes to implement the product
2.77
1.73
1.63
1.44
1.30
1.22
1.20
1.07
1.05
1.04
1.01
0.87
0.83
0.77
0.70
0.69
0.68
0.63
0.42
0.37
Yellowfin (1)
Phocas (2)
Tableau (3)
Microsoft SSAS (4)
Cyberscience (5)
Microsoft Excel (6)
TARGIT (7)
Average
SAS (8)
Corporate Planning (9)
Dimensional Insight (10)
Bissantz (11)
MicroStrategy (12)
IBM Cognos TM1 (13)
Cubeware (14)
IBM Cognos BI (15)
SAP BO WebI (16)
Infor (17)
SAP BW (18)
Oracle Essbase (19)
Average Ad-hoc Analysis Peer Group
1.73
1.63
1.30
1.29
1.22
1.20
1.18
1.05
1.01
Phocas (1)
Tableau (2)
Cyberscience (3)
Average
Pyramid (4)
TARGIT (5)
QlikTech (6)
SAS (7)
Dimensional Insight (8)
Average Visual Analysis & Data Discovery Peer Group
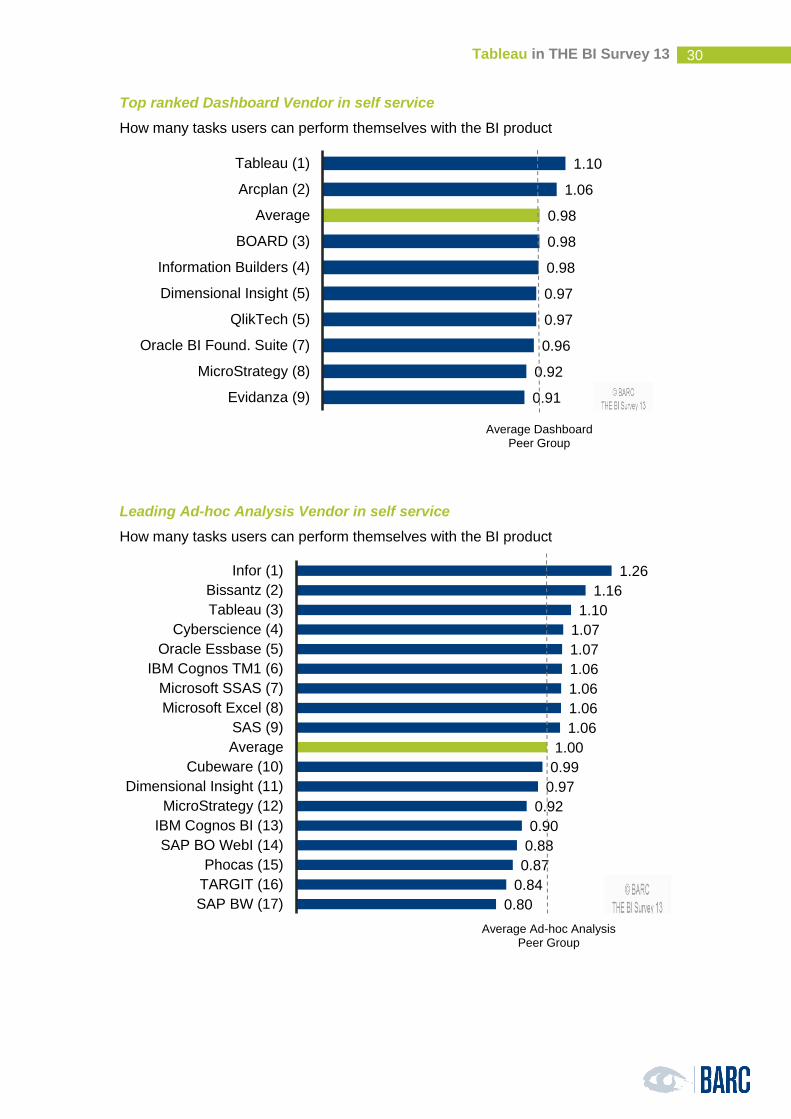
Tableau in THE BI Survey 13
30
Top ranked Dashboard Vendor in self service
How many tasks users can perform themselves with the BI product
Leading Ad-hoc Analysis Vendor in self service
How many tasks users can perform themselves with the BI product
1.10
1.06
0.98
0.98
0.98
0.97
0.97
0.96
0.92
0.91
Tableau (1)
Arcplan (2)
Average
BOARD (3)
Information Builders (4)
Dimensional Insight (5)
QlikTech (5)
Oracle BI Found. Suite (7)
MicroStrategy (8)
Evidanza (9)
Average Dashboard Peer Group
1.26
1.16
1.10
1.07
1.07
1.06
1.06
1.06
1.06
1.00
0.99
0.97
0.92
0.90
0.88
0.87
0.84
0.80
Infor (1)
Bissantz (2)
Tableau (3)
Cyberscience (4)
Oracle Essbase (5)
IBM Cognos TM1 (6)
Microsoft SSAS (7)
Microsoft Excel (8)
SAS (9)
Average
Cubeware (10)
Dimensional Insight (11)
MicroStrategy (12)
IBM Cognos BI (13)
SAP BO WebI (14)
Phocas (15)
TARGIT (16)
SAP BW (17)
Average Ad-hoc Analysis Peer Group
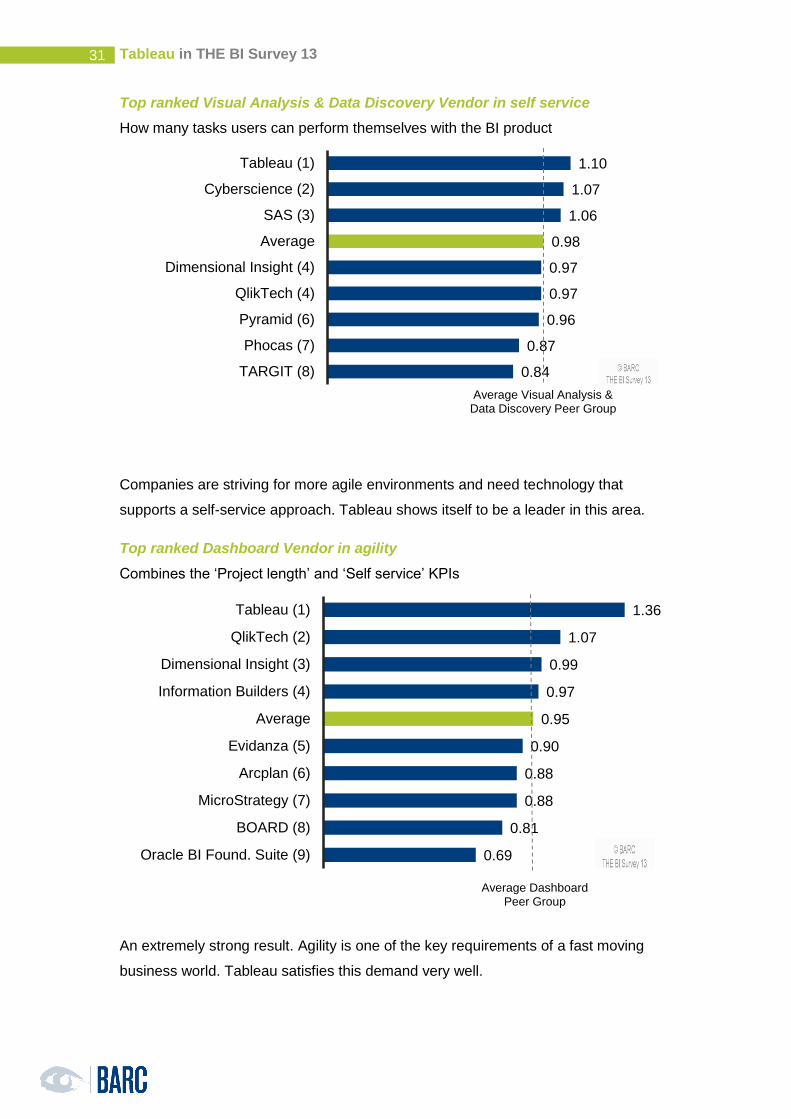
Tableau in THE BI Survey 13
31
Top ranked Visual Analysis & Data Discovery Vendor in self service
How many tasks users can perform themselves with the BI product
Companies are striving for more agile environments and need technology that
supports a self-service approach. Tableau shows itself to be a leader in this area.
Top ranked Dashboard Vendor in agility
Combines the ‘Project length’ and ‘Self service’ KPIs
An extremely strong result. Agility is one of the key requirements of a fast moving
business world. Tableau satisfies this demand very well.
1.10
1.07
1.06
0.98
0.97
0.97
0.96
0.87
0.84
Tableau (1)
Cyberscience (2)
SAS (3)
Average
Dimensional Insight (4)
QlikTech (4)
Pyramid (6)
Phocas (7)
TARGIT (8)
Average Visual Analysis & Data Discovery Peer Group
1.36
1.07
0.99
0.97
0.95
0.90
0.88
0.88
0.81
0.69
Tableau (1)
QlikTech (2)
Dimensional Insight (3)
Information Builders (4)
Average
Evidanza (5)
Arcplan (6)
MicroStrategy (7)
BOARD (8)
Oracle BI Found. Suite (9)
Average Dashboard Peer Group
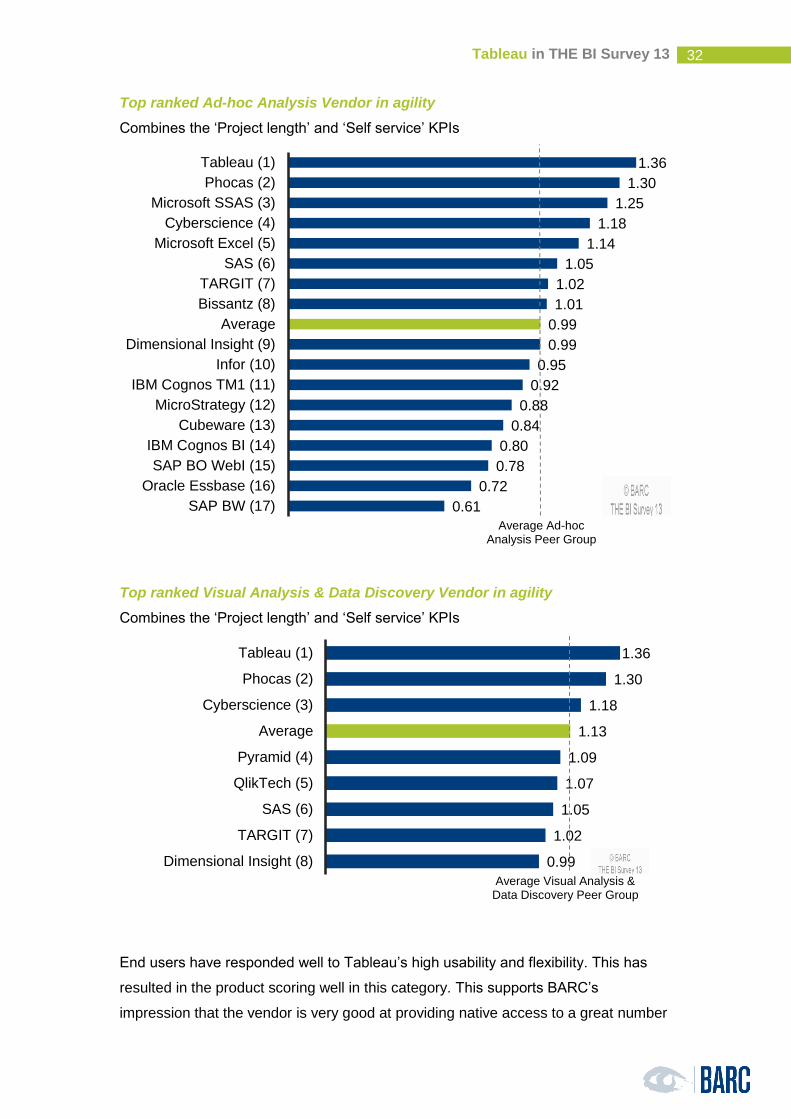
Tableau in THE BI Survey 13
32
Top ranked Ad-hoc Analysis Vendor in agility
Combines the ‘Project length’ and ‘Self service’ KPIs
Top ranked Visual Analysis & Data Discovery Vendor in agility
Combines the ‘Project length’ and ‘Self service’ KPIs
End users have responded well to Tableau’s high usability and flexibility. This has
resulted in the product scoring well in this category. This supports BARC’s
impression that the vendor is very good at providing native access to a great number
1.36
1.30
1.25
1.18
1.14
1.05
1.02
1.01
0.99
0.99
0.95
0.92
0.88
0.84
0.80
0.78
0.72
0.61
Tableau (1)
Phocas (2)
Microsoft SSAS (3)
Cyberscience (4)
Microsoft Excel (5)
SAS (6)
TARGIT (7)
Bissantz (8)
Average
Dimensional Insight (9)
Infor (10)
IBM Cognos TM1 (11)
MicroStrategy (12)
Cubeware (13)
IBM Cognos BI (14)
SAP BO WebI (15)
Oracle Essbase (16)
SAP BW (17)
Average Ad-hoc Analysis Peer Group
1.36
1.30
1.18
1.13
1.09
1.07
1.05
1.02
0.99
Tableau (1)
Phocas (2)
Cyberscience (3)
Average
Pyramid (4)
QlikTech (5)
SAS (6)
TARGIT (7)
Dimensional Insight (8)
Average Visual Analysis & Data Discovery Peer Group
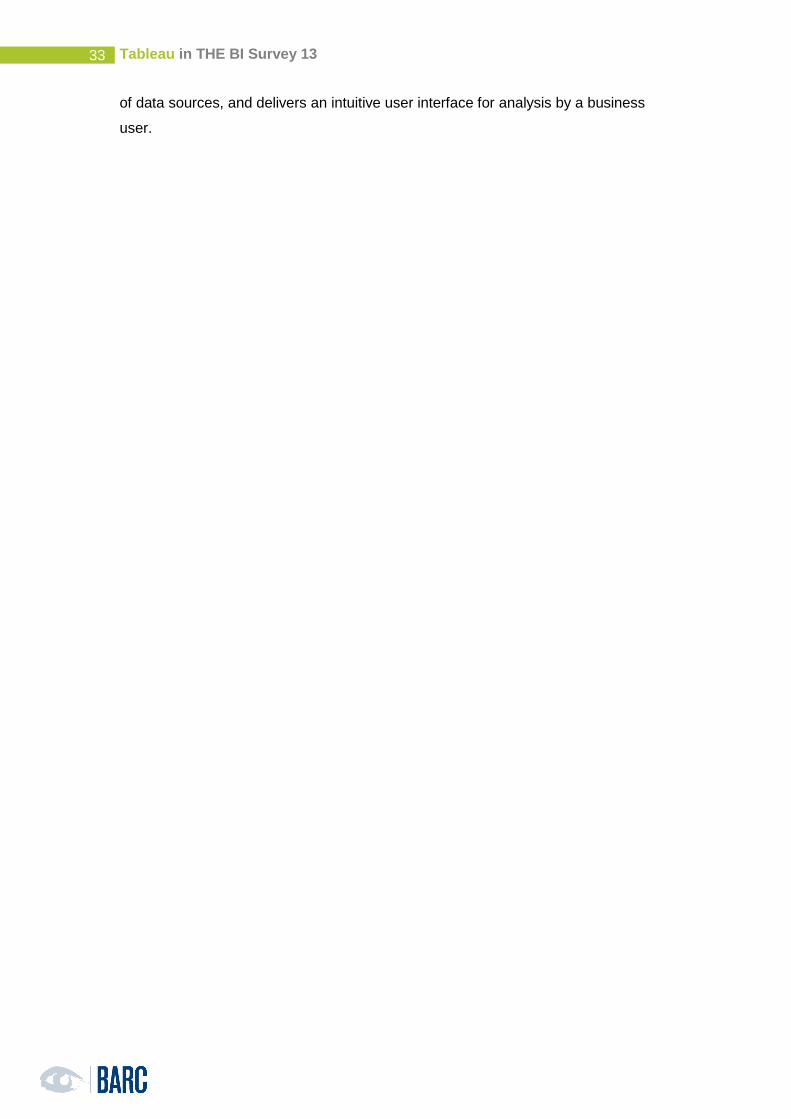
Tableau in THE BI Survey 13
33
of data sources, and delivers an intuitive user interface for analysis by a business
user.
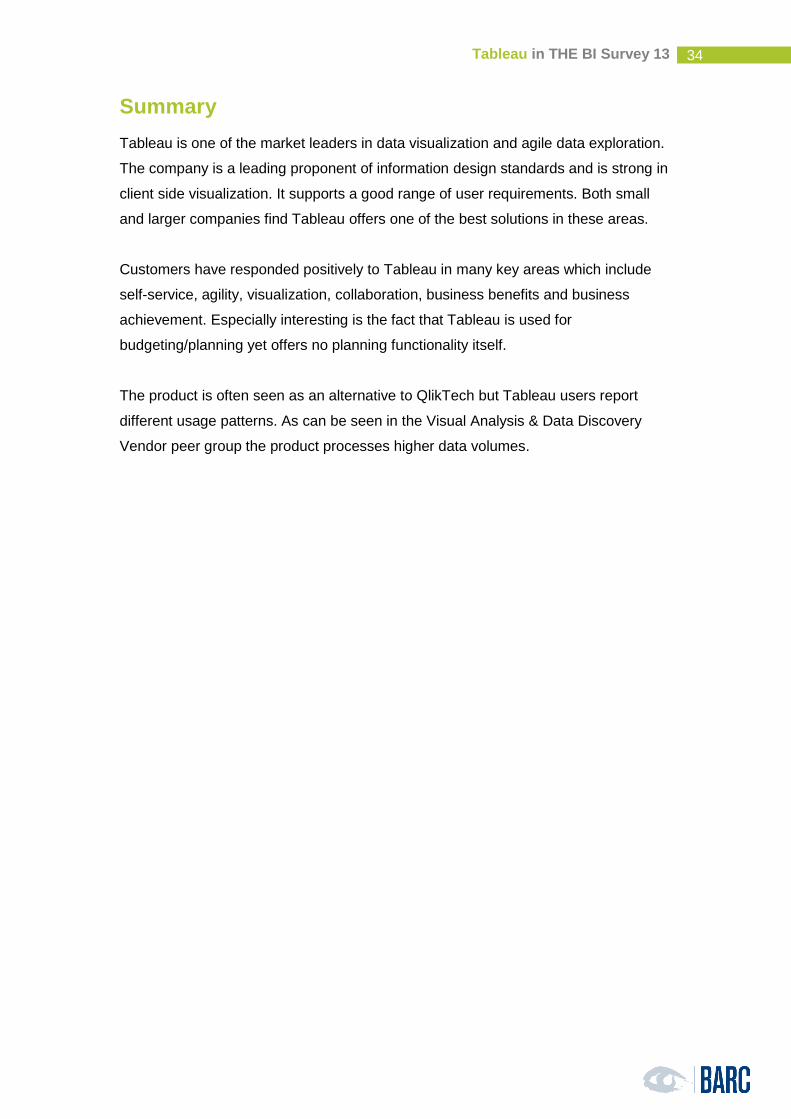
Tableau in THE BI Survey 13
34
Summary
Tableau is one of the market leaders in data visualization and agile data exploration.
The company is a leading proponent of information design standards and is strong in
client side visualization. It supports a good range of user requirements. Both small
and larger companies find Tableau offers one of the best solutions in these areas.
Customers have responded positively to Tableau in many key areas which include
self-service, agility, visualization, collaboration, business benefits and business
achievement. Especially interesting is the fact that Tableau is used for
budgeting/planning yet offers no planning functionality itself.
The product is often seen as an alternative to QlikTech but Tableau users report
different usage patterns. As can be seen in the Visual Analysis & Data Discovery
Vendor peer group the product processes higher data volumes.

Copyright © BARC GmbH 2013. All rights reserved.
Business Application Research Center - BARC GmbH
Berliner Platz 7
97080 Würzburg
Germany
+49 (0)931 880651-0


![Tableau Presantation.ppt [Kompatibilitetstilstand] · Why Tableau Tableau a great Tool for visualization, BI and data analytics. • Ideal for complex visualization • Interactive](https://img.pdfslide.net/doc/110x75/5ec5464447074405911878d3/tableau-kompatibilitetstilstand-why-tableau-tableau-a-great-tool-for-visualization.jpg)