Embed Size (px)
Citation preview
_____________________________
Tactical Network Planning for Food Aid Distribution in Kenya
Marie-Ève Rancourt Jean-François Cordeau Gilbert Laporte Ben Watkins February 2013 CIRRELT-2013-09
G1V 0A6
Bureaux de Montréal : Bureaux de Québec :
Université de Montréal Université Laval C.P. 6128, succ. Centre-ville 2325, de la Terrasse, bureau 2642 Montréal (Québec) Québec (Québec) Canada H3C 3J7 Canada G1V 0A6 Téléphone : 514 343-7575 Téléphone : 418 656-2073 Télécopie : 514 343-7121 Télécopie : 418 656-2624
www.cirrelt.ca
Tactical Network Planning for Food Aid Distribution in Kenya
Marie-Ève Rancourt1,2,*, Jean-François Cordeau1,3, Gilbert Laporte1,4, Ben Watkins5
1 Interuniversity Research Centre on Enterprise Networks, Logistics and Transportation (CIRRELT) 2 Department of Management and Technology, Université du Québec à Montréal, P.O. Box 8888,
Succursale Centre-ville, Montréal, Canada H3C 3P8 3 Department of Logistics and Operations Management, HEC Montréal, 3000 chemin de la Côte-
Sainte-Catherine, Montréal, Canada H3T 2A7 4 Department of Management Sciences, HEC Montréal, 3000 chemin de la Côte-Sainte-Catherine,
Montréal, Canada H3T 2A7 5 Kimetrica, Eldama Ravine Road, P.O. Box 1327-00621, Nairobi, Kenya
Abstract. In Sub-Saharan Africa, the annual seasonal patterns cause frequent and regular
shocks which make the population more vulnerable to food insecurity. Kenya is affected by
periodic droughts at the beginning and at the end of two irregular rainy seasons, which have a
profound effect on seasonal food crises. This project aims at providing a mathematical
programming based methodology for the design of food aid distribution networks in Kenya. It can
also be applied to other developing countries. We present a location model to determine a set of
distribution centers, where the food is directly distributed to the beneficiaries, for the region of
Garissa in Kenya. Our model takes into account the welfare of all stakeholders involved in the
response system: the government of Kenya, the World Food Programme, the Red Cross, and the
beneficiaries. We describe how we have combined need assessment and population data to plan
food distribution in Garissa. We also show how we have used GIS data on the road network to
establish a set of potential distribution centers. In addition to the results obtained by solving our
primary model, we present the several sensitivity analyses and variants of the basic covering
model.
Keywords: Food aid, network design, location problem, stakeholder welfare.
Acknowledgements. We thank the Kenya Red Cross Society and the World Food Programme
for their kind cooperation. Thanks are also due to Benoit Crevier for his help with programming
and to Ola Jabali for providing valuable references. This work was partly funded by the Natural
Sciences and Engineering Research Council of Canada under grants 39682-10 and 227837-09.
This support is gratefully acknowledged.
Results and views expressed in this publication are the sole responsibility of the authors and do not necessarily reflect those of CIRRELT.
Les résultats et opinions contenus dans cette publication ne reflètent pas nécessairement la position du CIRRELT et n'engagent pas sa responsabilité.
_____________________________
* Corresponding author: [email protected]
Dépôt légal – Bibliothèque et Archives nationales du Québec Bibliothèque et Archives Canada, 2013
© Copyright Rancourt, Cordeau, Laporte, Watkins and CIRRELT, 2013
1 Introduction
According to the United Nations World Food Programme (2012), hunger and malnutrition pose
the largest risks to worldwide health. Many developing countries suffer from food shortages, but
Sub-Saharan Africa is the only region in the world that is constantly suffering from widespread
chronic food insecurity and persistent threats (Shaw, 2009). Seasonalities have always had an
important impact on hunger and poverty in rural Africa. The annual patterns of the two dry
and two rainy seasons cause frequent and regular shocks which make people vulnerable to food
insecurity and hamper their opportunities to move out of poverty. Relatively little attention has
been paid to the implications of seasonalities on food insecurity and rural poverty, despite the fact
that they generate short-term hunger and seasonal food crises every year (Devereux, 2012). Because
seasonalities are repetitive, rural households and communities have developed coping strategies to
buffer their effects, like pastoralist livelihood systems (Young, 1992).
Food aid is an instrument used to reduce insecurity in poor nations. Although food aid has
often been criticized (see Bourn and Blench, 1990; Barrett, 2006; Margolies and Hoddinott, 2012),
it remains an important component of humanitarian operations. Food aid management entails
humanitarian operations evolving within highly complex supply chains. As mentioned by Van
Wassenhove (2006) and Christopher and Tatham (2011), logistics is now being recognized to be
an integral part of relief operations. In the last decade, humanitarian organizations have started
adopting supply chain management methodologies to increase their performance and enhance co-
ordination between the actors involved in assistance operations. For example, the World Food
Programme (WFP) has made continuous efforts to expand its logistics capacity and to improve the
efficiency of its transportation operations, which has enabled it to acquire an acknowledged exper-
tise in moving large amounts of food commodities, often in difficult circumstances, throughout the
developing world (see Shaw, 2011).
Haddow and Bullock (2004) have distinguished four phases for disaster management operations
of humanitarian organisations: response, recovery, mitigation and preparedness. Figure 1 provides
an overview of the cycle of these phases and their meanings. In disaster management, one typically
considers that the shocks (disasters) occur before the response phase. These shocks are typically
unpredictable and devastating, and they only last a relatively short period of time, like in the case
of earthquakes and tsunamis. Our problem is related to preparedness and planning continuous relief
operations rather that to the immediate response (see Kovacs and Spens, 2007; Celik et al., 2012,
for a distinction between disaster relief and development aid work). For long-term development
operations, such as food aid distribution in Sub-Saharan Africa, the context is different because
1
Tactical Network Planning for Food Aid Distribution in Kenya
CIRRELT-2013-09
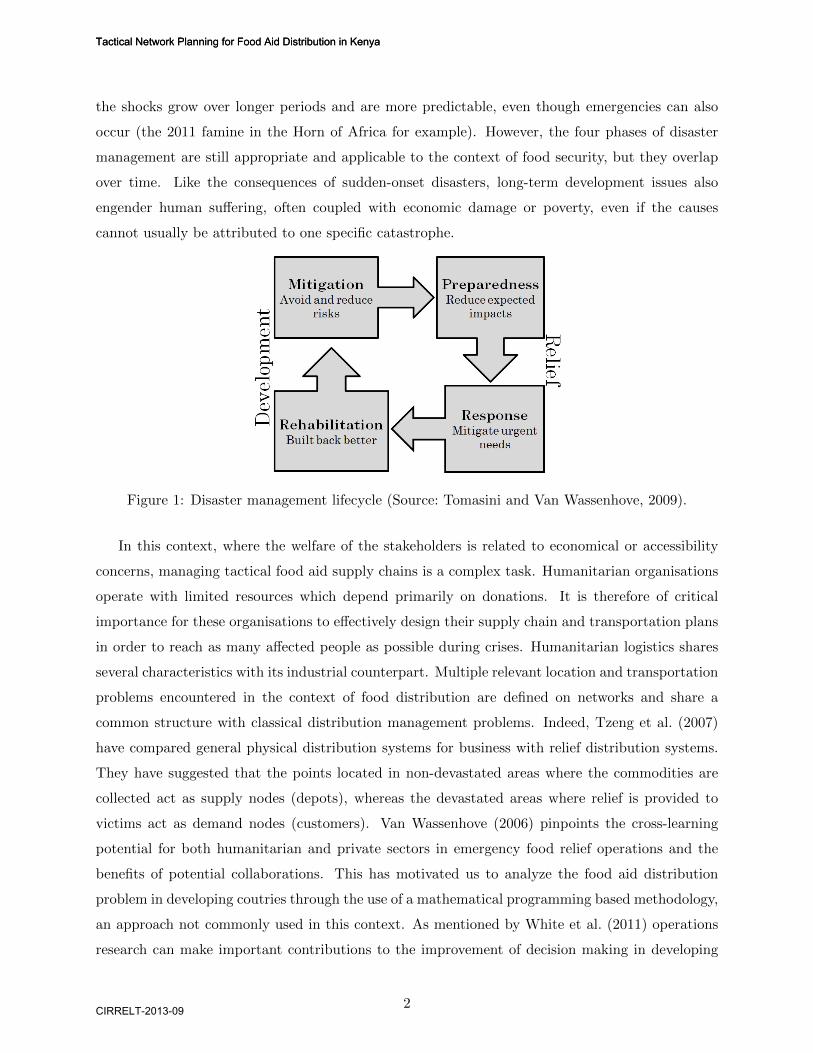
the shocks grow over longer periods and are more predictable, even though emergencies can also
occur (the 2011 famine in the Horn of Africa for example). However, the four phases of disaster
management are still appropriate and applicable to the context of food security, but they overlap
over time. Like the consequences of sudden-onset disasters, long-term development issues also
engender human suffering, often coupled with economic damage or poverty, even if the causes
cannot usually be attributed to one specific catastrophe.
Figure 1: Disaster management lifecycle (Source: Tomasini and Van Wassenhove, 2009).
In this context, where the welfare of the stakeholders is related to economical or accessibility
concerns, managing tactical food aid supply chains is a complex task. Humanitarian organisations
operate with limited resources which depend primarily on donations. It is therefore of critical
importance for these organisations to effectively design their supply chain and transportation plans
in order to reach as many affected people as possible during crises. Humanitarian logistics shares
several characteristics with its industrial counterpart. Multiple relevant location and transportation
problems encountered in the context of food distribution are defined on networks and share a
common structure with classical distribution management problems. Indeed, Tzeng et al. (2007)
have compared general physical distribution systems for business with relief distribution systems.
They have suggested that the points located in non-devastated areas where the commodities are
collected act as supply nodes (depots), whereas the devastated areas where relief is provided to
victims act as demand nodes (customers). Van Wassenhove (2006) pinpoints the cross-learning
potential for both humanitarian and private sectors in emergency food relief operations and the
benefits of potential collaborations. This has motivated us to analyze the food aid distribution
problem in developing coutries through the use of a mathematical programming based methodology,
an approach not commonly used in this context. As mentioned by White et al. (2011) operations
research can make important contributions to the improvement of decision making in developing
2
Tactical Network Planning for Food Aid Distribution in Kenya
CIRRELT-2013-09
Tactical Network Planning for Food Aid Distribution in Kenya
CIRRELT-2013-09
countries although it is of limited use to help reduce poverty. We believe that the results obtained
by exploiting such a methodology can provide a valuable perspective for decision makers responsible
food relief management.
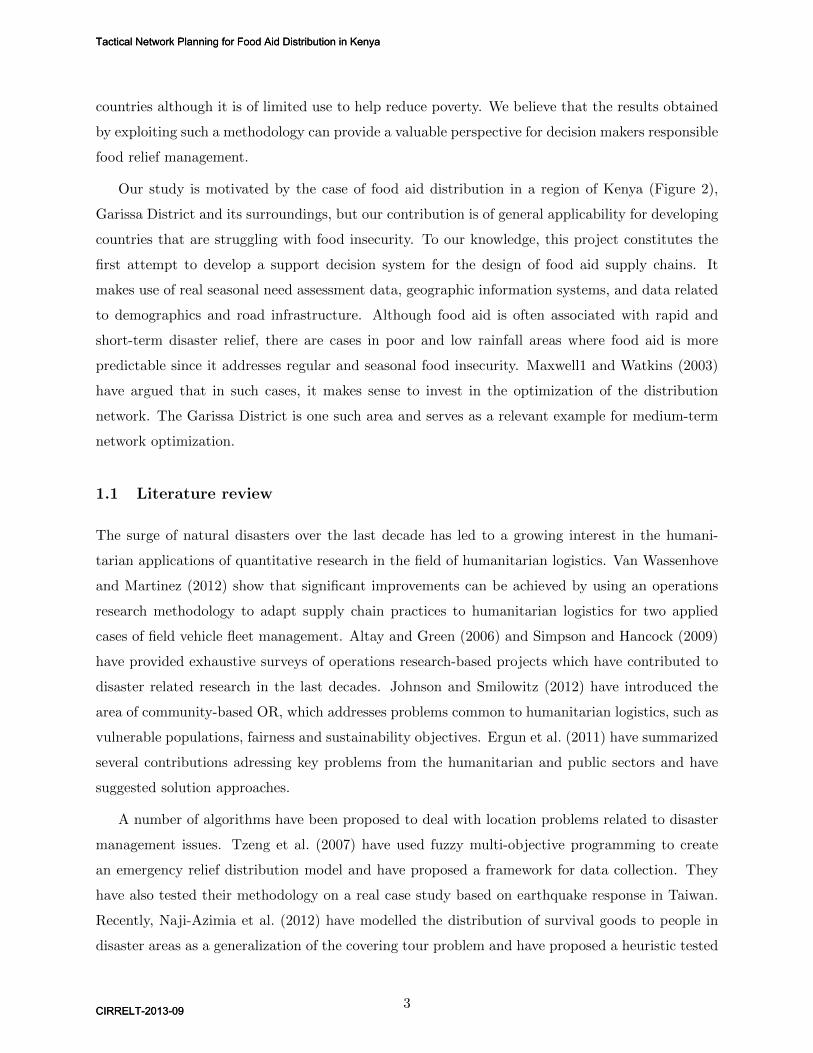
Our study is motivated by the case of food aid distribution in a region of Kenya (Figure 2),
Garissa District and its surroundings, but our contribution is of general applicability for developing
countries that are struggling with food insecurity. To our knowledge, this project constitutes the
first attempt to develop a support decision system for the design of food aid supply chains. It
makes use of real seasonal need assessment data, geographic information systems, and data related
to demographics and road infrastructure. Although food aid is often associated with rapid and
short-term disaster relief, there are cases in poor and low rainfall areas where food aid is more
predictable since it addresses regular and seasonal food insecurity. Maxwell1 and Watkins (2003)
have argued that in such cases, it makes sense to invest in the optimization of the distribution
network. The Garissa District is one such area and serves as a relevant example for medium-term
network optimization.
1.1 Literature review
The surge of natural disasters over the last decade has led to a growing interest in the humani-
tarian applications of quantitative research in the field of humanitarian logistics. Van Wassenhove
and Martinez (2012) show that significant improvements can be achieved by using an operations
research methodology to adapt supply chain practices to humanitarian logistics for two applied
cases of field vehicle fleet management. Altay and Green (2006) and Simpson and Hancock (2009)
have provided exhaustive surveys of operations research-based projects which have contributed to
disaster related research in the last decades. Johnson and Smilowitz (2012) have introduced the
area of community-based OR, which addresses problems common to humanitarian logistics, such as
vulnerable populations, fairness and sustainability objectives. Ergun et al. (2011) have summarized
several contributions adressing key problems from the humanitarian and public sectors and have
suggested solution approaches.
A number of algorithms have been proposed to deal with location problems related to disaster
management issues. Tzeng et al. (2007) have used fuzzy multi-objective programming to create
an emergency relief distribution model and have proposed a framework for data collection. They
have also tested their methodology on a real case study based on earthquake response in Taiwan.
Recently, Naji-Azimia et al. (2012) have modelled the distribution of survival goods to people in
disaster areas as a generalization of the covering tour problem and have proposed a heuristic tested
3
Tactical Network Planning for Food Aid Distribution in Kenya
CIRRELT-2013-09
Tactical Network Planning for Food Aid Distribution in Kenya
CIRRELT-2013-09
Figure 2: Map of Kenya (Source: Nation Online, 2012).
on randomly generated data. Campbell and Jones (2011) have studied the problem of prepositioning
supplies in the context of preparation for disaster by considering risk and inventory levels. They
have first solved the problem analytically for one depot and then incorporated their results into a
heuristic for a p-median problem.
White et al. (2011) have provided a broad overview of operations research applications in de-
veloping countries and have also discussed its relevance for long-term development. We refer the
reader to Celik et al. (2012) for a recent complete tutorial on humanitarian logistics. These authors
have highlighted the importance of long-term development issues although most of the operations
research-based methodologies developed for the field of humanitarian logistics are related to disaster
management problems.
4
Tactical Network Planning for Food Aid Distribution in Kenya
CIRRELT-2013-09
Tactical Network Planning for Food Aid Distribution in Kenya
CIRRELT-2013-09
Two projects have been conducted in collaboration with the World Food Programme regarding
food aid planning. De Angelis et al. (2007) have proposed a routing and scheduling for emergency air
deliveries of food aid in Angola. Alvarenga et al. (2010) have designed a simulation tool to generate
an optimal shipment schedule which takes into account transportation lead times, transportation
capacities, land transportation storage and handling costs while considering the current state of
the supply chain network. This tool first simulates port operations, and then optimizes the truck
shipping routes and schedules for food shipments to the main warehouses of a country. However,
to our knowledge, none of the projects presented in this literature review directly applies to food
aid network planning at the last-mile distribution level.
The problem considered in this paper is related to long-term humanitarian operations and
consists in designing a tactical network for food aid distribution. This problem can be modeled
as an uncapacitated facility location problem, which has been largely studied by location scien-
tists. Mathematical models and classification schemes for location problems have been reviewed by
ReVelle et al. (2008) and Daskin (2008). Melo et al. (2009) have presented applications of facility lo-
cation models to supply chain network design arising in various industries and have highlighted the
current state-of-the-art contributions. Although many sophisticated exact branch-and-bound algo-
rithms have been developed (see Erlenkotter, 1978; Koerkel, 1989), a number of simple heuristics
have also been proved to be very successful (see Kratica et al., 2001; Michel and Van Hentenryck,
2004). In this project, we solve the problem with a general purpose mixed integer programming
solver. However, the main challenge of the project lies more in modeling the problem, carrying out
data collection and processing, and performing analyses for a real case study than on algorithmic
development. Data collection and processing is fraught with difficulties in developing countries like
Kenya. It was facilitated by the fact that the fourth author runs a consulting company involved
in projects related to food aid distribution in Kenya, and the first author made a one-month field
trip in August 2012 to gather first-hand information.
2 Problem context and motivation
We now present the context of food aid distribution in Kenya. We describe the humanitarian
operations activities associated with the food distribution supply chain, and we explain the roles
of the main stakeholders involved in the process.
5
Tactical Network Planning for Food Aid Distribution in Kenya
CIRRELT-2013-09
Tactical Network Planning for Food Aid Distribution in Kenya
CIRRELT-2013-09
2.1 Seasonalities and assessment
Rainfalls are highly variable in Kenya; there are two rainy seasons and two intervening dry seasons.
The long rain season lasts from March until June, and is followed by a long dry season from June
to October. The second rainy season is shorter and lasts from October to December, followed by
another dry period from December to March. All parts of the country are subject to periodic
droughts at the beginning and at the end of the two rainy seasons, which has a profound effect
on settlement patterns and on the Kenyan population affected by nutrition crises. The severity of
the droughts has a deep influence on the ability of the affected population to recover from food
insecurity, which drives the food aid needs for the following periods. The most vulnerable regions
of Kenya are the arid and semi-arid regions in which agro-pastoralism and pastoralism are the
dominant livelihood systems (see Bourn and Blench, 1999).
To account for the effects of seasonalties, the Kenya Food Security Steering Group (KFSSG)
conducts a need assessment for food aid twice a year, after each rainy season. The KFSSG is a
joint group of specialists from the Government of Kenya (GoK), the United Nations (UN), non-
governmental organizations (NGOs), and district level teams (see Government of Kenya, 2012a).
The assessments consist in determining the number of beneficiaries and the ratio entitlements at the
district and division levels across the country. The ratio entitlement corresponds to the percentage
of a standard food ration that the beneficiaries are entitled to receive, and is calculated on the
basis of their nutritional requirements. This ratio depends on the severity of the seasonal food
scarcity. A full ratio entitlement, commonly called a food basket, is made up of 400 g of cereal,
60 g of pulses, 25 g of oil (fortified with vitamine A and D), 50 g of fortified blended food (corn
soya blend), 15 g of sugar, and 15 g of iodized salt. To determine the number of beneficiaries and
the ratio entitlement, the KFSSG analyzes the available information on the food security situation
and other relevant indicators, such as price data, field assessment and livelihood economic contexts.
The results of the assessment are valid for a six-month period, i.e. until the following assessment
plan is implemented.
The pastoralist populations practice seasonal migrations depending on resource availabilities
for their livestock. They allow them to exploit more land in order to suit their food production and
survive in arid regions, but the women and the children who remain in pastoralist settlements are
often left behind with few resources. Pastoralist households are indeed among the most vulnerable
groups in this society. Sanford and Habtu (2000) expose the shortcomings of early warning and
response systems in the pastoral areas. The need to develop service delivery models which meet the
particular demands of the pastoral communities and the effects of seasonal food scarcity is of critical
6
Tactical Network Planning for Food Aid Distribution in Kenya
CIRRELT-2013-09
Tactical Network Planning for Food Aid Distribution in Kenya
CIRRELT-2013-09
importance. Managing food aid supply chains in such complex environments is a real challenge
for humanitarian organisations. This project aims to provide a methodology for designing and
managing tactical food aid distribution networks. Our study takes into account the results of the
2012 short rains assessment for the district of Garissa and its surroundings, a district characterized
by semi-arid lands and pastoralist populations.
The district of Garissa is important for food aid in Kenya. Over the period ranging from
September 2004 to August 2011, during each six-month period, an average of 83,483 people of this
district have received food aid. This corresponds to about 5% of the 1,823,588 people who have
received food aid in Kenya, making it the sixth most important district out of the 28 in which aid is
distributed, behind Turkana, Wajir, Makueni, Mandera and Kitui. On average, 35% of the district
population has been receiving aid. During the most difficult period, this number reached 62%.
Only five districts have a higher percentage of the population receiving aid (the district receiving
the most is Marsabit, with 60% on average).
Importantly, the district of Garissa has been receiving aid more consistently than the country
as a whole. Indeed, the variation in the number of its beneficiaries is lower than it is at the national
level: the coefficient of variation in the number of beneficiaries across six-month periods in Garissa
is 0.45, and 0.51 at the country level. Only Turkana, Marsabit, Samburu, Mandera, Wajir, Tana
River and Kwale, receive aid more consistently. These are all semi-arid regions prone to drought.
As suggested by Maxwell1 and Watkins (2003), in Garissa like in these other districts, the relatively
stable number of beneficiaries has led to a fixed distribution system which justifies the need for an
optimized network.
2.2 Food aid supply chain
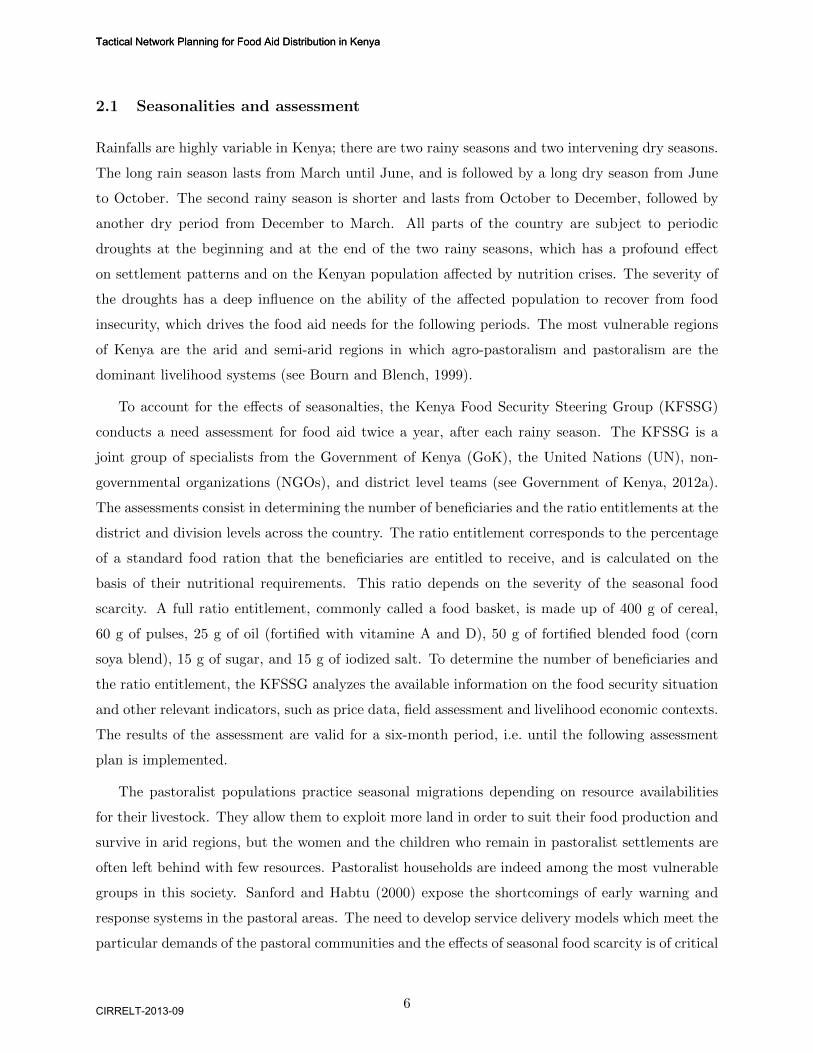
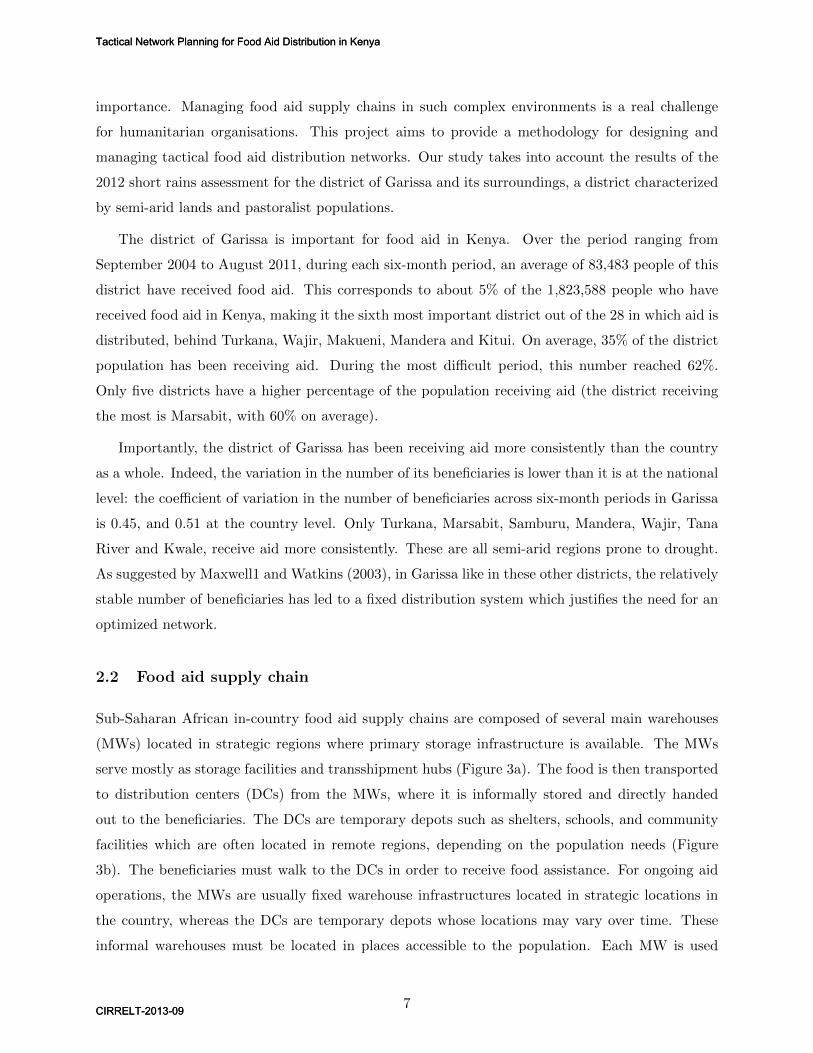
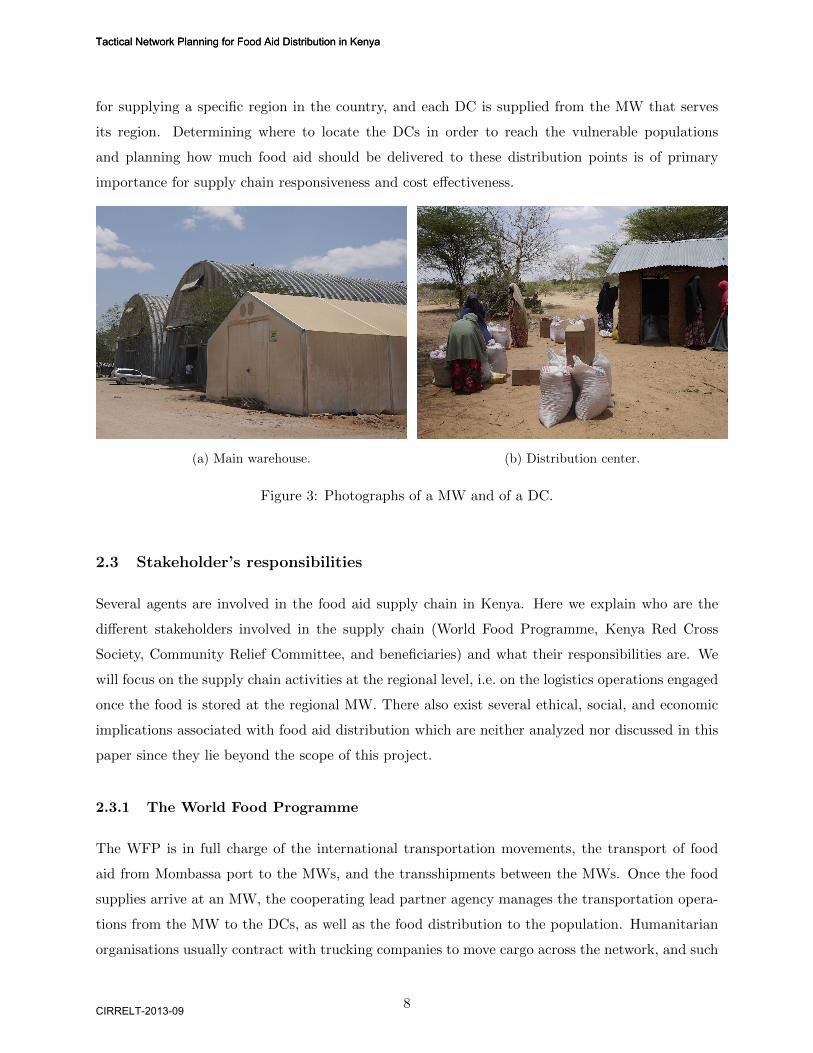
Sub-Saharan African in-country food aid supply chains are composed of several main warehouses
(MWs) located in strategic regions where primary storage infrastructure is available. The MWs
serve mostly as storage facilities and transshipment hubs (Figure 3a). The food is then transported
to distribution centers (DCs) from the MWs, where it is informally stored and directly handed
out to the beneficiaries. The DCs are temporary depots such as shelters, schools, and community
facilities which are often located in remote regions, depending on the population needs (Figure
3b). The beneficiaries must walk to the DCs in order to receive food assistance. For ongoing aid
operations, the MWs are usually fixed warehouse infrastructures located in strategic locations in
the country, whereas the DCs are temporary depots whose locations may vary over time. These
informal warehouses must be located in places accessible to the population. Each MW is used
7
Tactical Network Planning for Food Aid Distribution in Kenya
CIRRELT-2013-09
Tactical Network Planning for Food Aid Distribution in Kenya
CIRRELT-2013-09
for supplying a specific region in the country, and each DC is supplied from the MW that serves
its region. Determining where to locate the DCs in order to reach the vulnerable populations
and planning how much food aid should be delivered to these distribution points is of primary
importance for supply chain responsiveness and cost effectiveness.
(a) Main warehouse. (b) Distribution center.
Figure 3: Photographs of a MW and of a DC.
2.3 Stakeholder’s responsibilities
Several agents are involved in the food aid supply chain in Kenya. Here we explain who are the
different stakeholders involved in the supply chain (World Food Programme, Kenya Red Cross
Society, Community Relief Committee, and beneficiaries) and what their responsibilities are. We
will focus on the supply chain activities at the regional level, i.e. on the logistics operations engaged
once the food is stored at the regional MW. There also exist several ethical, social, and economic
implications associated with food aid distribution which are neither analyzed nor discussed in this
paper since they lie beyond the scope of this project.
2.3.1 The World Food Programme
The WFP is in full charge of the international transportation movements, the transport of food
aid from Mombassa port to the MWs, and the transshipments between the MWs. Once the food
supplies arrive at an MW, the cooperating lead partner agency manages the transportation opera-
tions from the MW to the DCs, as well as the food distribution to the population. Humanitarian
organisations usually contract with trucking companies to move cargo across the network, and such
8
Tactical Network Planning for Food Aid Distribution in Kenya
CIRRELT-2013-09
Tactical Network Planning for Food Aid Distribution in Kenya
CIRRELT-2013-09
secondary transport operations are generally very costly. While not taking the lead for contracting
with transporters, the WFP fixes the transportation rates and reimburses the cooperating lead
partner agency for transportation costs. The WFP is also engaged in offering guidance on logistics
activities, such as storage and handling of commodities, as well as providing training on food aid
distribution practices, reporting and warehousing when necessary.
2.3.2 The Kenya Red Cross Society
In the district of Garissa and its surroundings, the Kenya Red Cross Society (KRCS) acts as the
cooperating lead partner for food assistance, which implies that it is responsible for the reception
and storage of food at the MW. As mentioned above, the KRCS is also mandated to organize
secondary transport operations and to distribute commodities provided by the WFP or the GoK to
the beneficiaries. The KRCS must maintain records and facilitate monitoring for all commodities
received at the MW and distributed at the DCs. The KRCS must also take reasonable measures to
ensure that food assistance reaches the beneficiaries within a reasonable delay and in the condition
in which it has been received. In order to be qualified for conducting food aid distribution, the KRCS
staff receives a training on the community based food aid targeting and distribution system (World
Food Programme and Government of Kenya, 2005). The KRCS acts as facilitator and monitor
to ensure that the principles established for food aid distribution in Kenya are properly followed
during the settlement process following the assessment, and during the monthly food distribution
operations. The organization thus continuously assists the community during the different phases
of the food aid distribution.
2.3.3 Community Relief Committee
The community members of each DC elect a Community Relief Committee (CRC) comprised of
seven to 17 members. After being trained by the KRCS, the CRC becomes mainly in charge of
the beneficiary registration and of the food aid distribution. The CRC is thus responsible for the
targeting of the beneficiaries, record keeping as well as setting arrangements to call beneficiaries
during the monthly distributions, and dealing with absences and complaints. The CRC must
make arrangements to provide accessible temporary storage, to receive and handle the food, and
to ensure security at the DC. The purpose of the relief committee is to give more responsibilities
to the community and enhance information transparency. The CRC acts as a link between the
KRCS and the community, including the beneficiaries. This system aims to provide a better
understanding of the food distribution mechanisms for the people receiving assistance and to help
9
Tactical Network Planning for Food Aid Distribution in Kenya
CIRRELT-2013-09
Tactical Network Planning for Food Aid Distribution in Kenya
CIRRELT-2013-09
the beneficiaries make decision for themselves rather than being controlled by agencies remote
from their environment. An important component for ensuring better access to information is
the participation of women within the relief committee since humanitarian organisations strive
to encourage the presence of the women in assistance projects (see World Food Programme and
Government of Kenya, 2005).
2.3.4 Beneficiaries
The beneficiaries are the people within the communities who receive food assistance through dif-
ferent aid programmes. Ideally, they should be targeted because they are the most vulnerable
people in the community. They must travel and collect their food at their assigned DC on the
day of the distribution. As far as possible, the organizations hand-out food aid to women. For the
food distribution to be successful, the community should get involved in the process and should
participate in the meetings organized by the KRCS and the CRC.
3 Problem formulation
We propose a mathematical programming based methodology to determine where to locate the
DCs, how much food to deliver to them and which populations they should serve. The regional
food aid distribution network can be formulated on a directed graph G = (V,A), where V is a set
of nodes and A is a set of arcs. The set V can be partitioned into{{v0}, V1, V2
}, where v0 is an
MW supplying a specific affected region, V1 is a set of population agglomerations, and V2 is a set
of potential locations for DCs. The number of tonnes of food required by the population located
at node vi ∈ V1 is equal to qi. Let us also define Wi as the set of potential DCs located within a
coverage radius r km of vi, with vi ∈ V1 and Wi ⊆ V2. The route taken by a transporter to go from
v0 to vj ∈ V2 is represented by an arc (v0, vj), and the path taken by the population vi to walk up
from vi ∈ V1 to vj ∈ V2, is represented by an arc (vi, vj).
3.1 Mathematical model based on social welfare costs
The model must take into account the anticipated food assistance needs and must optimize the
social welfare of all the stakeholders involved in the food distribution. We define the following
variables:
10
Tactical Network Planning for Food Aid Distribution in Kenya
CIRRELT-2013-09
Tactical Network Planning for Food Aid Distribution in Kenya
CIRRELT-2013-09
xij : the proportion of population at vi needing a hand-out from a DC at vj , with i ∈ V1,
and vj ∈Wi;
yj : a binary variable equal to 1 if and only if DC vj is in operation during the planning
horizon, with vj ∈ V2.
The tactical food aid network design problem is formulated as follows:
Model 1
minimize∑i∈V1
∑j∈Wi
αij xij +∑i∈V1
∑j∈Wi
βj qi xij +∑j∈V2
γj yj
subject to
∑j∈Wi
xij = 1 i ∈ V1 (1)
xij ≤ yj i ∈ V1, j ∈Wi (2)
xij ≥ 0 i ∈ V1, j ∈Wi (3)
yj ∈ {0, 1} j ∈ V2. (4)
The objective is to minimize the weighted cost of all the stakeholders involved in the food
distribution process at the regional level. The first term of the objective function is the total
access cost for the beneficiaries to travel and collect their food at the DCs, the second term is the
supply cost paid by the WFP for transporting the food from the MW to the DCs, and the last
term accounts for the DC managing and hand-out costs which are under the KRCS responsibility.
The coefficient αij represents the cost borne by the population at vi needing a hand-out from
DC at vj ; the coefficient βj represents the cost per tonne borne by the WFP to transport food
destined to the DC located at vj ; the coefficient γj represents the fixed cost of locating a DC at
vj . The determination of these coefficients is explicited in Section 3.2.2. Constraints (1) ensure
that the demand of each population is satisfied, while constraints (2) stipulate that the population
points can only be served from open DCs. Constraints (3) and (4) are standard non-negativity and
integrality constraints. Note that if an optimal solution implies that a population agglomeration
of beneficiaries is being served from multiple DCs, then the population must be equidistant to all
DCs from which it is partially served. These beneficiaries can thus be arbitrarily assigned entirely
to any of these DCs to ensure integrality.
11
Tactical Network Planning for Food Aid Distribution in Kenya
CIRRELT-2013-09
Tactical Network Planning for Food Aid Distribution in Kenya
CIRRELT-2013-09
3.2 The case of Garissa and its surrounding
We now explain how the graph G was constructed for the region of Garissa and its surroundings. We
describe how the different parameters were determined through the use of geographic information
system data. We also explain how the parameters in the objective function were determined, which
entails the evaluation of all the corresponding stakeholder welfare costs.
3.2.1 Network
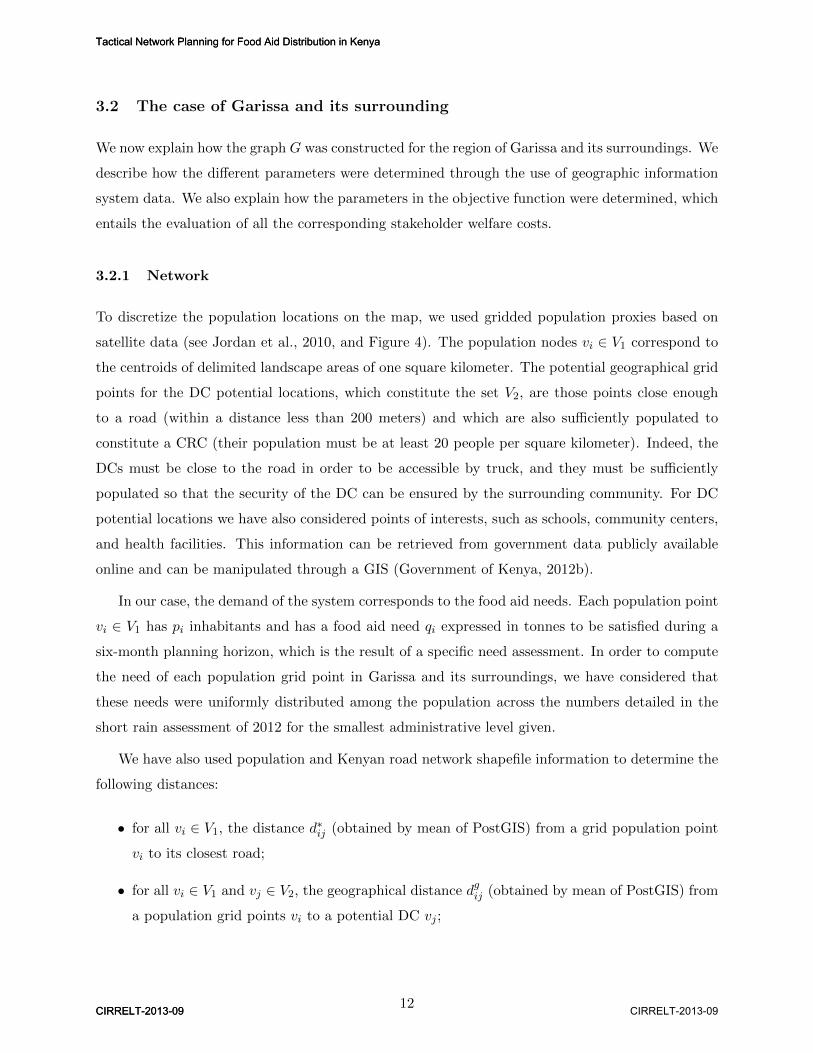
To discretize the population locations on the map, we used gridded population proxies based on
satellite data (see Jordan et al., 2010, and Figure 4). The population nodes vi ∈ V1 correspond to
the centroids of delimited landscape areas of one square kilometer. The potential geographical grid
points for the DC potential locations, which constitute the set V2, are those points close enough
to a road (within a distance less than 200 meters) and which are also sufficiently populated to
constitute a CRC (their population must be at least 20 people per square kilometer). Indeed, the
DCs must be close to the road in order to be accessible by truck, and they must be sufficiently
populated so that the security of the DC can be ensured by the surrounding community. For DC
potential locations we have also considered points of interests, such as schools, community centers,
and health facilities. This information can be retrieved from government data publicly available
online and can be manipulated through a GIS (Government of Kenya, 2012b).
In our case, the demand of the system corresponds to the food aid needs. Each population point
vi ∈ V1 has pi inhabitants and has a food aid need qi expressed in tonnes to be satisfied during a
six-month planning horizon, which is the result of a specific need assessment. In order to compute
the need of each population grid point in Garissa and its surroundings, we have considered that
these needs were uniformly distributed among the population across the numbers detailed in the
short rain assessment of 2012 for the smallest administrative level given.
We have also used population and Kenyan road network shapefile information to determine the
following distances:
• for all vi ∈ V1, the distance d∗ij (obtained by mean of PostGIS) from a grid population point
vi to its closest road;
• for all vi ∈ V1 and vj ∈ V2, the geographical distance dgij (obtained by mean of PostGIS) from
a population grid points vi to a potential DC vj ;
12
Tactical Network Planning for Food Aid Distribution in Kenya
CIRRELT-2013-09 CIRRELT-2013-09
Tactical Network Planning for Food Aid Distribution in Kenya
CIRRELT-2013-09
• for all vj ∈ V2, the road distance dr0j (obtained by mean of Google API) from the Garissa
MW to a potential DC vj .
Figure 4: Population data for Kenya (Jordan et al., 2010).
3.2.2 Objective function
In the context of food aid distribution, several costs affect both the beneficiaries and the humani-
tarian organisations involved. These stakeholders, the beneficiaries, the KRCS and the WFP, have
their own responsibilities in the supply chain, which translate into different objectives. In order to
determine a global social welfare function, we have evaluated the values of all these responsibilities
in terms of Kenya shillings (KSh). For the humanitarian organizations, these are management,
transportation, and hand-out costs; for the beneficiaries, these are access costs.
Beneficiary access costs
The beneficiary access costs are opportunity costs measured by evaluating the productive activ-
ities sacrificed for collecting food assistance. The access cost is thus a value associated with the
time taken by a beneficiary to walk from her location to her assigned DC. We have assumed that
the beneficiaries use a least duration path to walk from vi to vj at an off-road pace of 4 km/h.
The walking time from vi to vj is thus equal to the 0.25 h/km, times the geographical distance.
To evaluate the value of walking time, we have used the minimum wage rate for unskilled labor
13
Tactical Network Planning for Food Aid Distribution in Kenya
CIRRELT-2013-09
Tactical Network Planning for Food Aid Distribution in Kenya
CIRRELT-2013-09
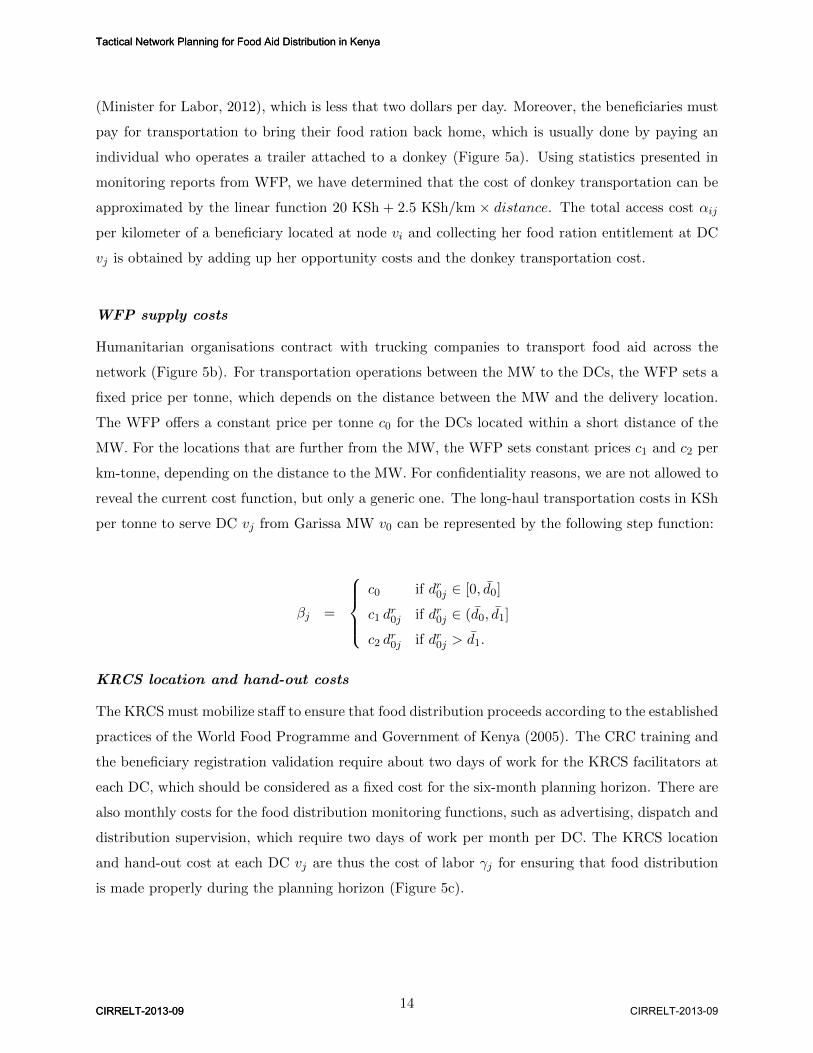
(Minister for Labor, 2012), which is less that two dollars per day. Moreover, the beneficiaries must
pay for transportation to bring their food ration back home, which is usually done by paying an
individual who operates a trailer attached to a donkey (Figure 5a). Using statistics presented in
monitoring reports from WFP, we have determined that the cost of donkey transportation can be
approximated by the linear function 20 KSh + 2.5 KSh/km × distance. The total access cost αij
per kilometer of a beneficiary located at node vi and collecting her food ration entitlement at DC
vj is obtained by adding up her opportunity costs and the donkey transportation cost.
WFP supply costs
Humanitarian organisations contract with trucking companies to transport food aid across the
network (Figure 5b). For transportation operations between the MW to the DCs, the WFP sets a
fixed price per tonne, which depends on the distance between the MW and the delivery location.
The WFP offers a constant price per tonne c0 for the DCs located within a short distance of the
MW. For the locations that are further from the MW, the WFP sets constant prices c1 and c2 per
km-tonne, depending on the distance to the MW. For confidentiality reasons, we are not allowed to
reveal the current cost function, but only a generic one. The long-haul transportation costs in KSh
per tonne to serve DC vj from Garissa MW v0 can be represented by the following step function:
βj =
c0 if dr0j ∈ [0, d0]
c1 dr0j if dr0j ∈ (d0, d1]
c2 dr0j if dr0j > d1.
KRCS location and hand-out costs
The KRCS must mobilize staff to ensure that food distribution proceeds according to the established
practices of the World Food Programme and Government of Kenya (2005). The CRC training and
the beneficiary registration validation require about two days of work for the KRCS facilitators at
each DC, which should be considered as a fixed cost for the six-month planning horizon. There are
also monthly costs for the food distribution monitoring functions, such as advertising, dispatch and
distribution supervision, which require two days of work per month per DC. The KRCS location
and hand-out cost at each DC vj are thus the cost of labor γj for ensuring that food distribution
is made properly during the planning horizon (Figure 5c).
14
Tactical Network Planning for Food Aid Distribution in Kenya
CIRRELT-2013-09 CIRRELT-2013-09
Tactical Network Planning for Food Aid Distribution in Kenya
CIRRELT-2013-09
(a) Donkey transportation. (b) Ground transportation. (c) Monitoring activities.
Figure 5: Photographs of some stakeholder activities.
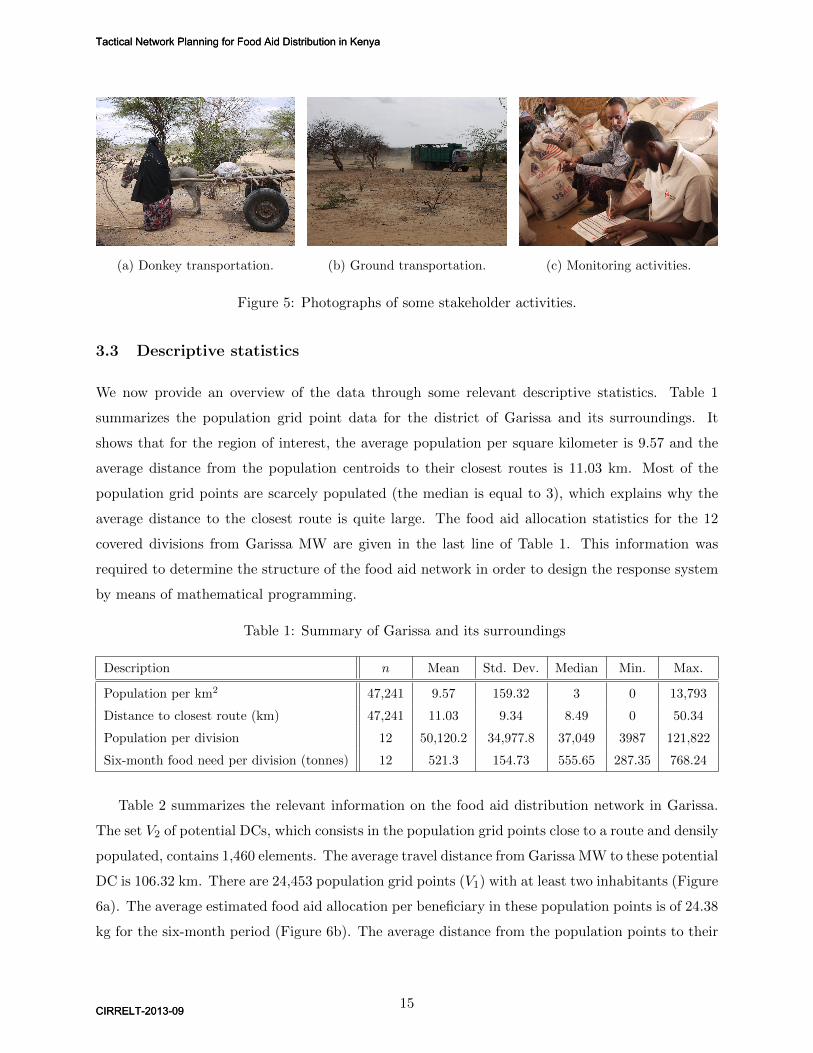
3.3 Descriptive statistics
We now provide an overview of the data through some relevant descriptive statistics. Table 1
summarizes the population grid point data for the district of Garissa and its surroundings. It
shows that for the region of interest, the average population per square kilometer is 9.57 and the
average distance from the population centroids to their closest routes is 11.03 km. Most of the
population grid points are scarcely populated (the median is equal to 3), which explains why the
average distance to the closest route is quite large. The food aid allocation statistics for the 12
covered divisions from Garissa MW are given in the last line of Table 1. This information was
required to determine the structure of the food aid network in order to design the response system
by means of mathematical programming.
Table 1: Summary of Garissa and its surroundings
Description n Mean Std. Dev. Median Min. Max.
Population per km2 47,241 9.57 159.32 3 0 13,793
Distance to closest route (km) 47,241 11.03 9.34 8.49 0 50.34
Population per division 12 50,120.2 34,977.8 37,049 3987 121,822
Six-month food need per division (tonnes) 12 521.3 154.73 555.65 287.35 768.24
Table 2 summarizes the relevant information on the food aid distribution network in Garissa.
The set V2 of potential DCs, which consists in the population grid points close to a route and densily
populated, contains 1,460 elements. The average travel distance from Garissa MW to these potential
DC is 106.32 km. There are 24,453 population grid points (V1) with at least two inhabitants (Figure
6a). The average estimated food aid allocation per beneficiary in these population points is of 24.38
kg for the six-month period (Figure 6b). The average distance from the population points to their
15
Tactical Network Planning for Food Aid Distribution in Kenya
CIRRELT-2013-09
Tactical Network Planning for Food Aid Distribution in Kenya
CIRRELT-2013-09
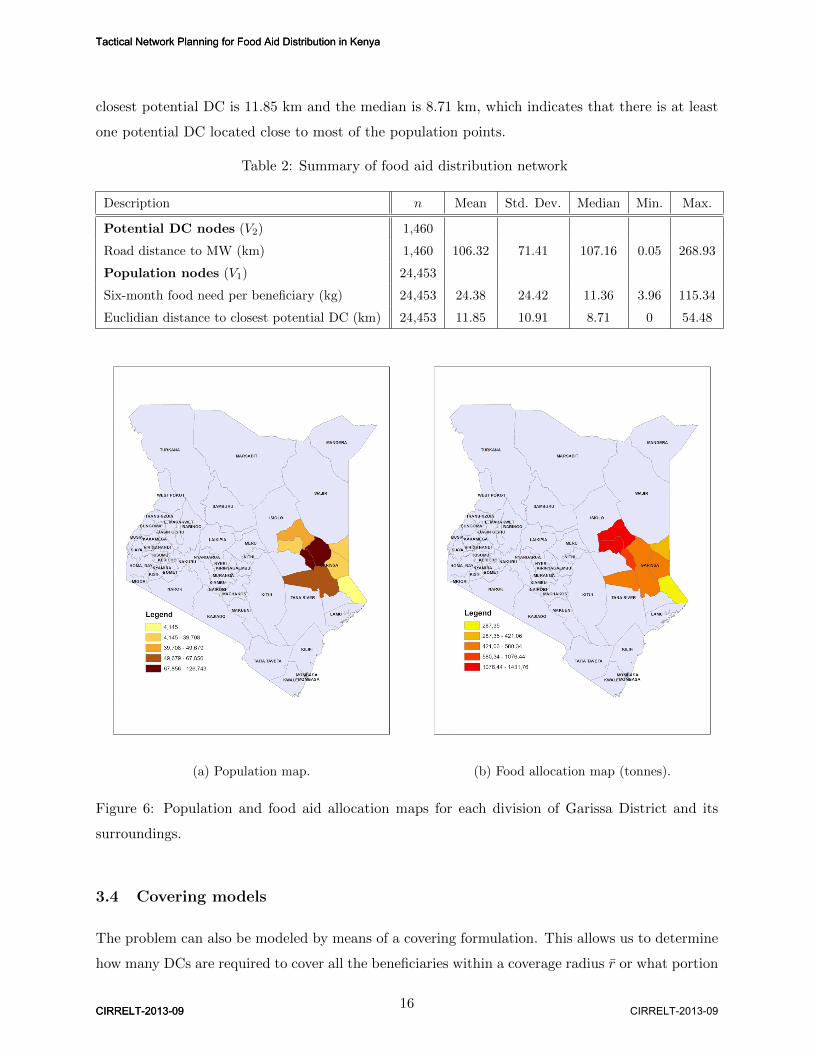
closest potential DC is 11.85 km and the median is 8.71 km, which indicates that there is at least
one potential DC located close to most of the population points.
Table 2: Summary of food aid distribution network
Description n Mean Std. Dev. Median Min. Max.
Potential DC nodes (V2) 1,460
Road distance to MW (km) 1,460 106.32 71.41 107.16 0.05 268.93
Population nodes (V1) 24,453
Six-month food need per beneficiary (kg) 24,453 24.38 24.42 11.36 3.96 115.34
Euclidian distance to closest potential DC (km) 24,453 11.85 10.91 8.71 0 54.48
(a) Population map. (b) Food allocation map (tonnes).
Figure 6: Population and food aid allocation maps for each division of Garissa District and its
surroundings.
3.4 Covering models
The problem can also be modeled by means of a covering formulation. This allows us to determine
how many DCs are required to cover all the beneficiaries within a coverage radius r or what portion
16
Tactical Network Planning for Food Aid Distribution in Kenya
CIRRELT-2013-09 CIRRELT-2013-09
Tactical Network Planning for Food Aid Distribution in Kenya
CIRRELT-2013-09
of the population would be covered by fixing the number of DCs to a given value p. We thus define
the following variables:
yj : a binary variable equal to 1 if and only if DC vj is in operation during the planning
horizon, with vj ∈ V2;
zi : a binary variable equal to 1 if and only if population vj is covered by at least one DC
during the planning horizon, with vi ∈ V1.
We also define the following parameters:
πij : a binary parameter equal to 1 if and only if the distance from the population vi to
DC vj does not exceed r, with vi ∈ V1 and vj ∈ V2.
A first problem is to maximize the need coverage with p DCs:
Model 2
maximize∑j∈V2
pi zi
subject to
zi ≤∑j∈V2
πij yj ∀i ∈ V1 (5)
∑j∈V2
yj = p (6)
zi ∈ {0, 1} ∀i ∈ V1 (7)
yj ∈ {0, 1} ∀j ∈ V2. (8)
A second problem of interest is to minimize the number p of DCs to cover all the beneficiaries
within a coverage radius r:
Model 3
minimize p
17
Tactical Network Planning for Food Aid Distribution in Kenya
CIRRELT-2013-09
Tactical Network Planning for Food Aid Distribution in Kenya
CIRRELT-2013-09
subject to
∑j∈Wi
πij yj ≥ 1 ∀i ∈ V1 (9)
∑j∈V2
yj = p (10)
yj ∈ {0, 1} ∀j ∈ V2. (11)
4 Computational results
In this section, we describe the computational results obtained by solving different optimization
problems for the case of Garissa and its surroundings. We first provide the results of some sensitivity
analyses before illustrating optimal response systems.
4.1 Sensitivity analyses
The objective of this section is to better understand the impact of the response system structure
on the stakeholder welfare. To this end, we have conducted several sensitivity analyses by varying
some parameters and solving the problems formulated in Section 3. These were solved by means
of CPLEX 12.8.0 and by setting the optimality gap to 2%. We consider that this is a reasonable
gap given the precision of the data.
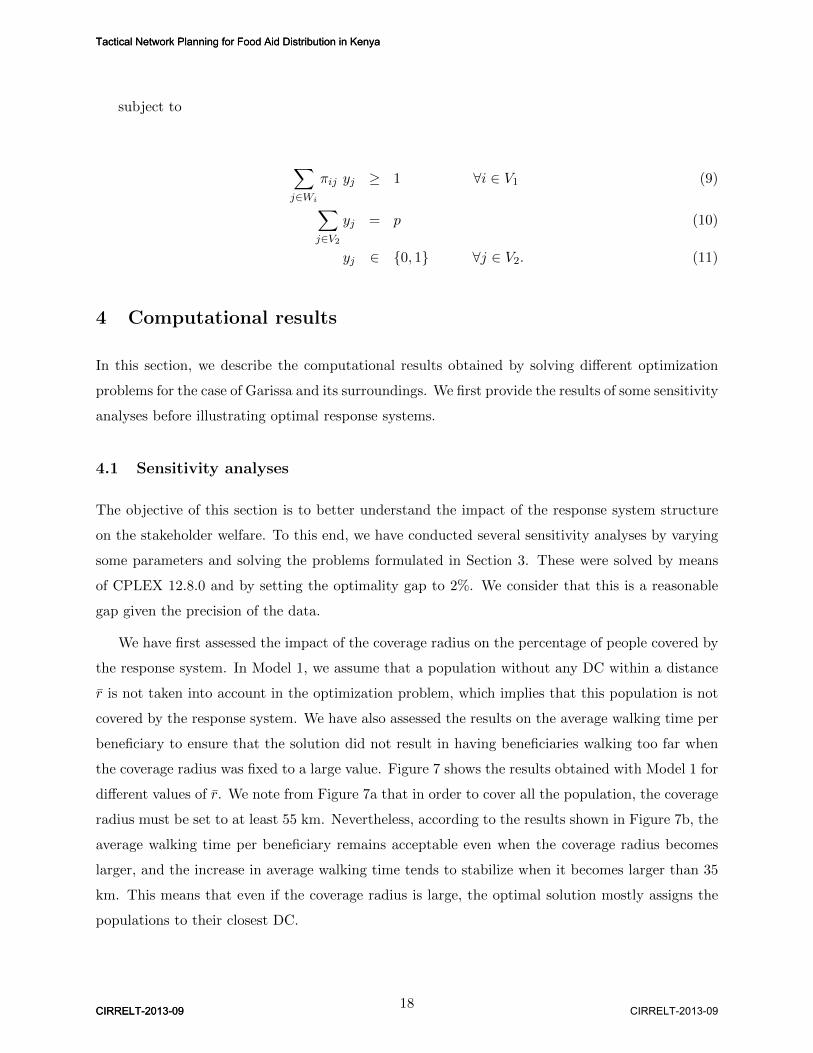
We have first assessed the impact of the coverage radius on the percentage of people covered by
the response system. In Model 1, we assume that a population without any DC within a distance
r is not taken into account in the optimization problem, which implies that this population is not
covered by the response system. We have also assessed the results on the average walking time per
beneficiary to ensure that the solution did not result in having beneficiaries walking too far when
the coverage radius was fixed to a large value. Figure 7 shows the results obtained with Model 1 for
different values of r. We note from Figure 7a that in order to cover all the population, the coverage
radius must be set to at least 55 km. Nevertheless, according to the results shown in Figure 7b, the
average walking time per beneficiary remains acceptable even when the coverage radius becomes
larger, and the increase in average walking time tends to stabilize when it becomes larger than 35
km. This means that even if the coverage radius is large, the optimal solution mostly assigns the
populations to their closest DC.
18
Tactical Network Planning for Food Aid Distribution in Kenya
CIRRELT-2013-09 CIRRELT-2013-09
Tactical Network Planning for Food Aid Distribution in Kenya
CIRRELT-2013-09
0
5
10
15
20P
erce
ntag
e of
peo
ple
not c
over
ed (
%)
5 15 25 35 45 55 65 75Coverage radius (km)
(a) Percentage of the population not covered as a func-
tion of the coverage radius.
1
2
3
4
5
Ave
rage
wal
king
tim
e pe
r be
nefic
iary
(ho
urs)
5 15 25 35 45 55 65 75Coverage radius (km)
(b) Average walking time per beneficiary as a function
of the coverage radius.
Figure 7: Percentage of the population not covered and average walking time per beneficiary as a
function of the coverage radius.
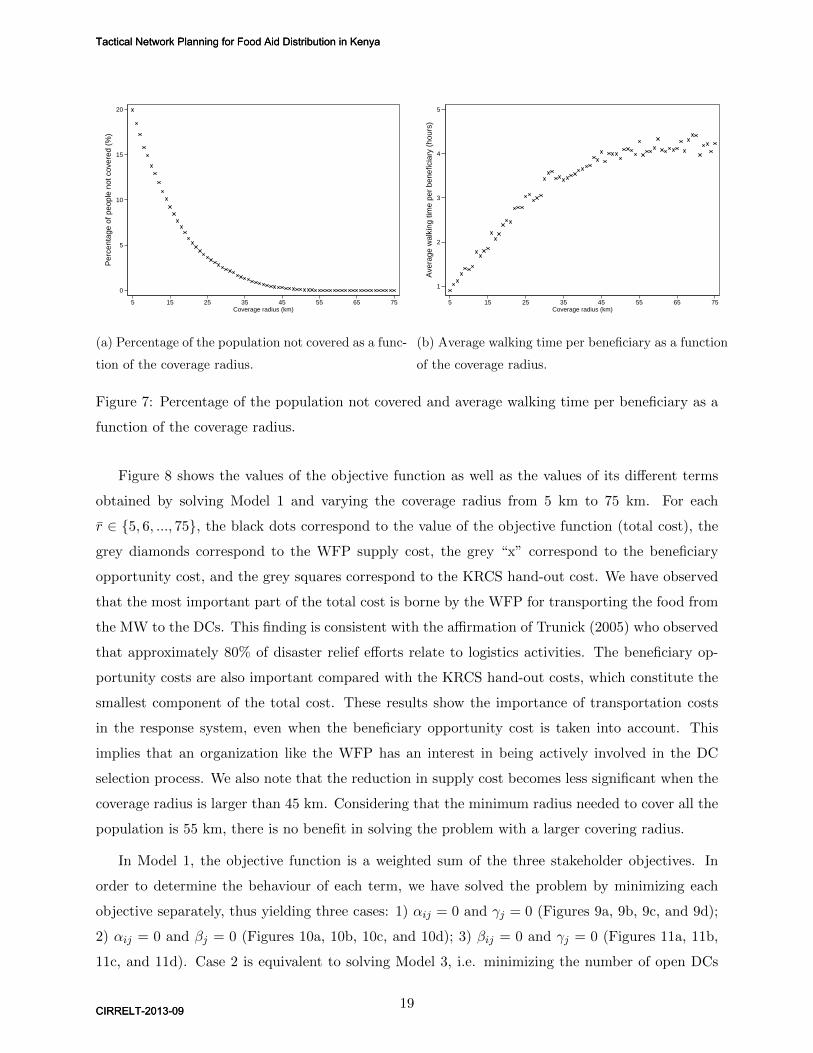
Figure 8 shows the values of the objective function as well as the values of its different terms
obtained by solving Model 1 and varying the coverage radius from 5 km to 75 km. For each
r ∈ {5, 6, ..., 75}, the black dots correspond to the value of the objective function (total cost), the
grey diamonds correspond to the WFP supply cost, the grey “x” correspond to the beneficiary
opportunity cost, and the grey squares correspond to the KRCS hand-out cost. We have observed
that the most important part of the total cost is borne by the WFP for transporting the food from
the MW to the DCs. This finding is consistent with the affirmation of Trunick (2005) who observed
that approximately 80% of disaster relief efforts relate to logistics activities. The beneficiary op-
portunity costs are also important compared with the KRCS hand-out costs, which constitute the
smallest component of the total cost. These results show the importance of transportation costs
in the response system, even when the beneficiary opportunity cost is taken into account. This
implies that an organization like the WFP has an interest in being actively involved in the DC
selection process. We also note that the reduction in supply cost becomes less significant when the
coverage radius is larger than 45 km. Considering that the minimum radius needed to cover all the
population is 55 km, there is no benefit in solving the problem with a larger covering radius.
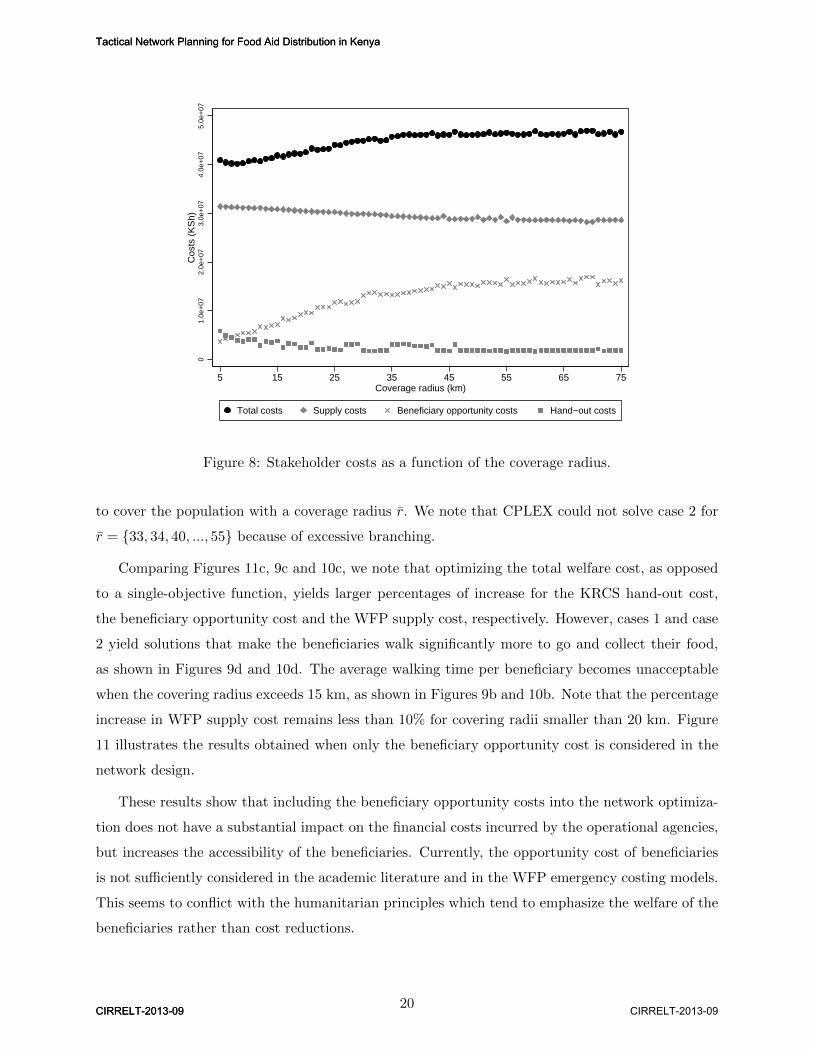
In Model 1, the objective function is a weighted sum of the three stakeholder objectives. In
order to determine the behaviour of each term, we have solved the problem by minimizing each
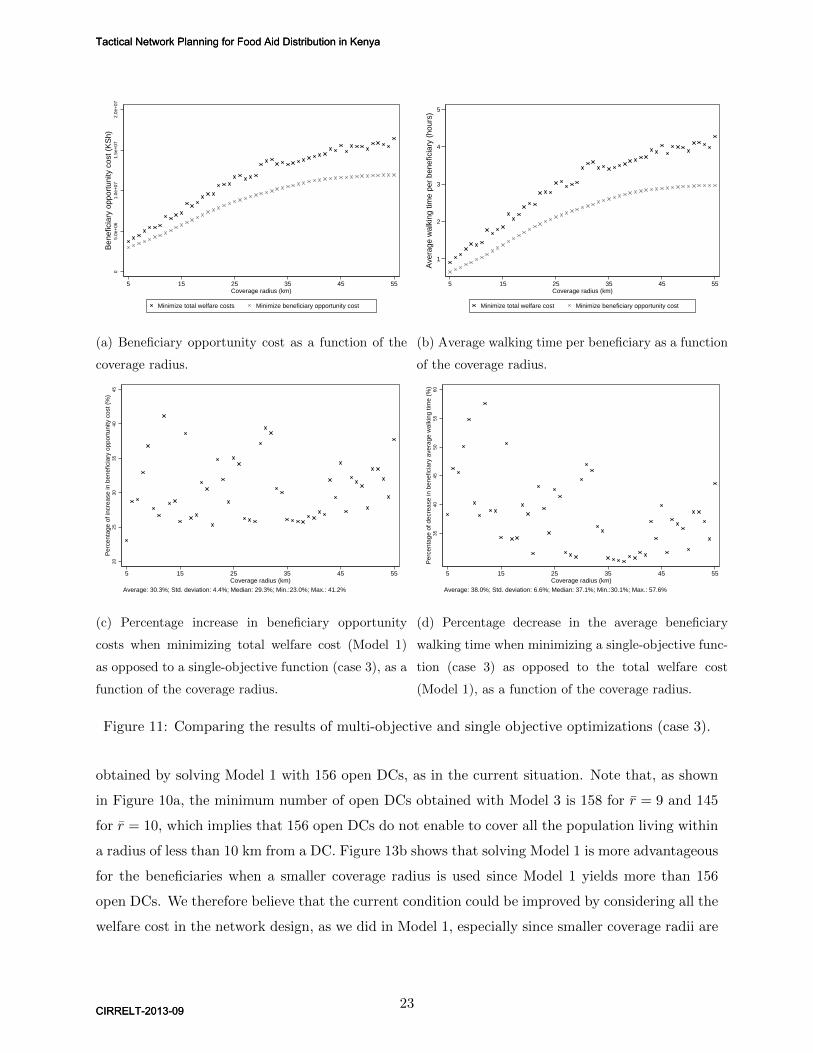
objective separately, thus yielding three cases: 1) αij = 0 and γj = 0 (Figures 9a, 9b, 9c, and 9d);
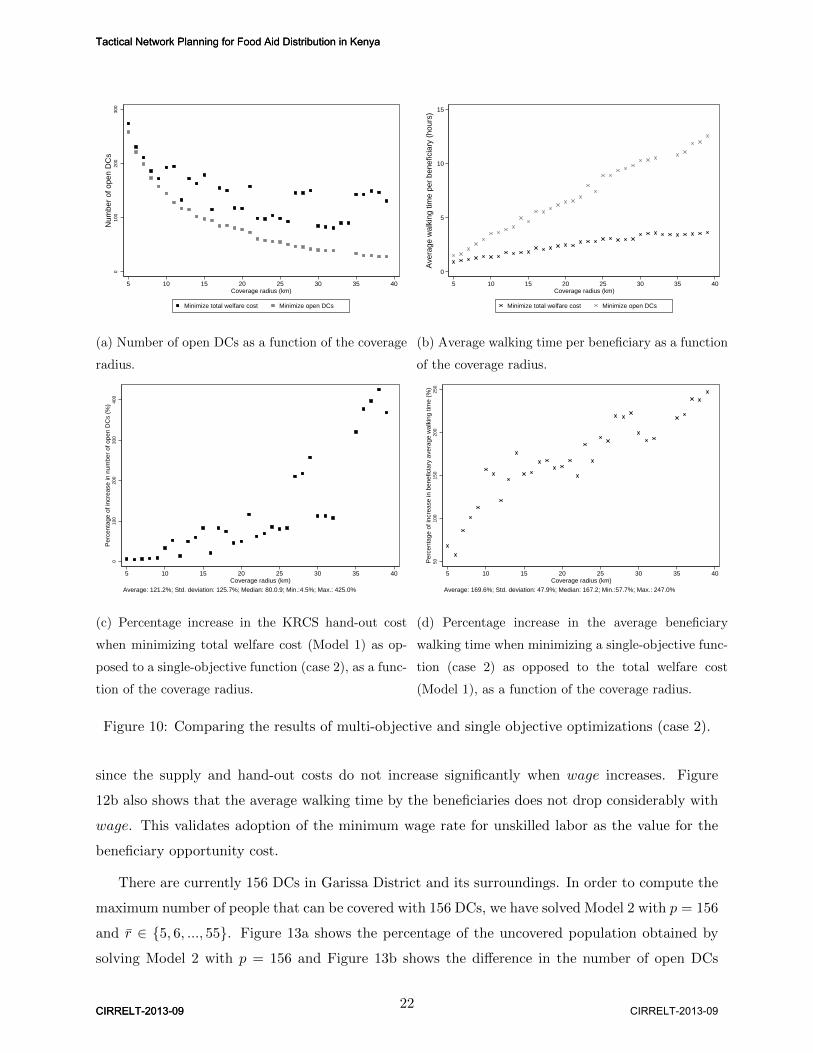
2) αij = 0 and βj = 0 (Figures 10a, 10b, 10c, and 10d); 3) βij = 0 and γj = 0 (Figures 11a, 11b,
11c, and 11d). Case 2 is equivalent to solving Model 3, i.e. minimizing the number of open DCs
19
Tactical Network Planning for Food Aid Distribution in Kenya
CIRRELT-2013-09
Tactical Network Planning for Food Aid Distribution in Kenya
CIRRELT-2013-09
01.
0e+
072.
0e+
073.
0e+
074.
0e+
075.
0e+
07C
osts
(K
Sh)
5 15 25 35 45 55 65 75Coverage radius (km)
Total costs Supply costs Beneficiary opportunity costs Hand−out costs
Figure 8: Stakeholder costs as a function of the coverage radius.
to cover the population with a coverage radius r. We note that CPLEX could not solve case 2 for
r = {33, 34, 40, ..., 55} because of excessive branching.
Comparing Figures 11c, 9c and 10c, we note that optimizing the total welfare cost, as opposed
to a single-objective function, yields larger percentages of increase for the KRCS hand-out cost,
the beneficiary opportunity cost and the WFP supply cost, respectively. However, cases 1 and case
2 yield solutions that make the beneficiaries walk significantly more to go and collect their food,
as shown in Figures 9d and 10d. The average walking time per beneficiary becomes unacceptable
when the covering radius exceeds 15 km, as shown in Figures 9b and 10b. Note that the percentage
increase in WFP supply cost remains less than 10% for covering radii smaller than 20 km. Figure
11 illustrates the results obtained when only the beneficiary opportunity cost is considered in the
network design.
These results show that including the beneficiary opportunity costs into the network optimiza-
tion does not have a substantial impact on the financial costs incurred by the operational agencies,
but increases the accessibility of the beneficiaries. Currently, the opportunity cost of beneficiaries
is not sufficiently considered in the academic literature and in the WFP emergency costing models.
This seems to conflict with the humanitarian principles which tend to emphasize the welfare of the
beneficiaries rather than cost reductions.
20
Tactical Network Planning for Food Aid Distribution in Kenya
CIRRELT-2013-09 CIRRELT-2013-09
Tactical Network Planning for Food Aid Distribution in Kenya
CIRRELT-2013-09
2.0e
+07
2.5e
+07
3.0e
+07
3.5e
+07
Sup
ply
cost
(K
Sh)
5 15 25 35 45 55Coverage radius (km)
Minimize total welfare cost Minimize supply cost
(a) WFP supply costs as a function of the coverage
radius.
0
5
10
15
20
Ave
rage
wal
king
tim
e pe
r be
nefic
iary
(ho
urs)
5 15 25 35 45 55Coverage radius (km)
Minimize total welfare cost Minimize supply cost
(b) Average walking time per beneficiary as a function
of the coverage radius.
010
2030
40P
erce
ntag
e of
incr
ease
in s
uppl
y co
st (
%)
5 15 25 35 45 55Coverage radius (km)
Average: 19.3%; Std. deviation: 12.8%; Median: 17.5; Min.:1.7%; Max.: 44.2%
(c) Percentage increase in the WFP supply cost when
minimizing total welfare cost (Model 1) as opposed to
a single-objective function (case 1), as a function of
the coverage radius.
100
150
200
250
300
Per
cent
age
of in
crea
se in
ben
efic
iary
ave
rage
wal
king
tim
e (%
)
5 15 25 35 45 55Coverage radius (km)
Average: 231.5%; Std. deviation: 49.3%; Median: 227.1; Min.:102.7%; Max.: 321.1%
(d) Percentage increase in the average beneficiary
walking time when minimizing a single-objective func-
tion (case 1) as opposed to the total welfare cost
(Model 1), as a function of the coverage radius.
Figure 9: Comparing the results of multi-objective and single objective optimizations (case 1).
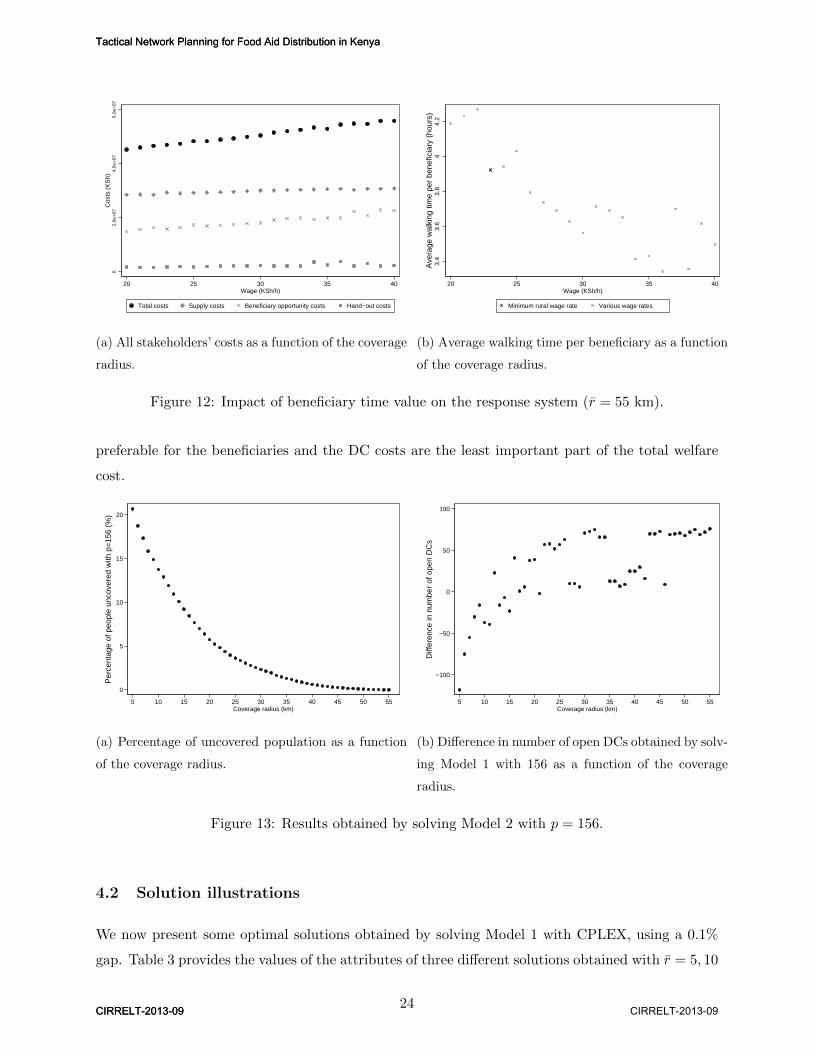
Moreover, to ensure that the beneficiaries are not underestimated in the parameterization of
the mathematical model, we have solved Model 1 with various values of the hourly wage rate. In
the initial parameterization, we have estimated the beneficiaries’ opportunity costs by valuing their
time proportionally to the minimum wage rate for unskilled labor (wage = 22 KSh/h). We have
thus solved Model 1 for each wage ∈ {20, 21, ..., 40} to evaluate the impact of the value given to the
beneficiaries’ time on the response system. The results yielded by this experiment are illustrated
in Figure 12. We note from Figure 12a that the total cost of the response systems is mostly due
to the increase in beneficiary opportunity costs, which is mostly explained by the increase of αij
21
Tactical Network Planning for Food Aid Distribution in Kenya
CIRRELT-2013-09
Tactical Network Planning for Food Aid Distribution in Kenya
CIRRELT-2013-09
010
020
030
0N
umbe
r of
ope
n D
Cs
5 10 15 20 25 30 35 40Coverage radius (km)
Minimize total welfare cost Minimize open DCs
(a) Number of open DCs as a function of the coverage
radius.
0
5
10
15
Ave
rage
wal
king
tim
e pe
r be
nefic
iary
(ho
urs)
5 10 15 20 25 30 35 40Coverage radius (km)
Minimize total welfare cost Minimize open DCs
(b) Average walking time per beneficiary as a function
of the coverage radius.
010
020
030
040
0P
erce
ntag
e of
incr
ease
in n
umbe
r of
ope
n D
Cs
(%)
5 10 15 20 25 30 35 40Coverage radius (km)
Average: 121.2%; Std. deviation: 125.7%; Median: 80.0.9; Min.:4.5%; Max.: 425.0%
(c) Percentage increase in the KRCS hand-out cost
when minimizing total welfare cost (Model 1) as op-
posed to a single-objective function (case 2), as a func-
tion of the coverage radius.
5010
015
020
025
0P
erce
ntag
e of
incr
ease
in b
enef
icia
ry a
vera
ge w
alki
ng ti
me
(%)
5 10 15 20 25 30 35 40Coverage radius (km)
Average: 169.6%; Std. deviation: 47.9%; Median: 167.2; Min.:57.7%; Max.: 247.0%
(d) Percentage increase in the average beneficiary
walking time when minimizing a single-objective func-
tion (case 2) as opposed to the total welfare cost
(Model 1), as a function of the coverage radius.
Figure 10: Comparing the results of multi-objective and single objective optimizations (case 2).
since the supply and hand-out costs do not increase significantly when wage increases. Figure
12b also shows that the average walking time by the beneficiaries does not drop considerably with
wage. This validates adoption of the minimum wage rate for unskilled labor as the value for the
beneficiary opportunity cost.
There are currently 156 DCs in Garissa District and its surroundings. In order to compute the
maximum number of people that can be covered with 156 DCs, we have solved Model 2 with p = 156
and r ∈ {5, 6, ..., 55}. Figure 13a shows the percentage of the uncovered population obtained by
solving Model 2 with p = 156 and Figure 13b shows the difference in the number of open DCs
22
Tactical Network Planning for Food Aid Distribution in Kenya
CIRRELT-2013-09 CIRRELT-2013-09
Tactical Network Planning for Food Aid Distribution in Kenya
CIRRELT-2013-09
05.
0e+
061.
0e+
071.
5e+
072.
0e+
07B
enef
icia
ry o
ppor
tuni
ty c
ost (
KS
h)
5 15 25 35 45 55Coverage radius (km)
Minimize total welfare costs Minimize beneficiary opportunity cost
(a) Beneficiary opportunity cost as a function of the
coverage radius.
1
2
3
4
5
Ave
rage
wal
king
tim
e pe
r be
nefic
iary
(ho
urs)
5 15 25 35 45 55Coverage radius (km)
Minimize total welfare cost Minimize beneficiary opportunity cost
(b) Average walking time per beneficiary as a function
of the coverage radius.
2025
3035
4045
Per
cent
age
of in
crea
se in
ben
efic
iary
opp
ortu
nity
cos
t (%
)
5 15 25 35 45 55Coverage radius (km)
Average: 30.3%; Std. deviation: 4.4%; Median: 29.3%; Min.:23.0%; Max.: 41.2%
(c) Percentage increase in beneficiary opportunity
costs when minimizing total welfare cost (Model 1)
as opposed to a single-objective function (case 3), as a
function of the coverage radius.
3540
4550
5560
Per
cent
age
of d
ecre
ase
in b
enef
icia
ry a
vera
ge w
alki
ng ti
me
(%)
5 15 25 35 45 55Coverage radius (km)
Average: 38.0%; Std. deviation: 6.6%; Median: 37.1%; Min.:30.1%; Max.: 57.6%
(d) Percentage decrease in the average beneficiary
walking time when minimizing a single-objective func-
tion (case 3) as opposed to the total welfare cost
(Model 1), as a function of the coverage radius.
Figure 11: Comparing the results of multi-objective and single objective optimizations (case 3).
obtained by solving Model 1 with 156 open DCs, as in the current situation. Note that, as shown
in Figure 10a, the minimum number of open DCs obtained with Model 3 is 158 for r = 9 and 145
for r = 10, which implies that 156 open DCs do not enable to cover all the population living within
a radius of less than 10 km from a DC. Figure 13b shows that solving Model 1 is more advantageous
for the beneficiaries when a smaller coverage radius is used since Model 1 yields more than 156
open DCs. We therefore believe that the current condition could be improved by considering all the
welfare cost in the network design, as we did in Model 1, especially since smaller coverage radii are
23
Tactical Network Planning for Food Aid Distribution in Kenya
CIRRELT-2013-09
Tactical Network Planning for Food Aid Distribution in Kenya
CIRRELT-2013-09
02.
0e+
074.
0e+
076.
0e+
07C
osts
(K
Sh)
20 25 30 35 40Wage (KSh/h)
Total costs Supply costs Beneficiary opportunity costs Hand−out costs
(a) All stakeholders’ costs as a function of the coverage
radius.
3.4
3.6
3.8
44.
2A
vera
ge w
alki
ng ti
me
per
bene
ficia
ry (
hour
s)
20 25 30 35 40Wage (KSh/h)
Minimum rural wage rate Various wage rates
(b) Average walking time per beneficiary as a function
of the coverage radius.
Figure 12: Impact of beneficiary time value on the response system (r = 55 km).
preferable for the beneficiaries and the DC costs are the least important part of the total welfare
cost.
0
5
10
15
20
Per
cent
age
of p
eopl
e un
cove
red
with
p=
156
(%)
5 10 15 20 25 30 35 40 45 50 55Coverage radius (km)
(a) Percentage of uncovered population as a function
of the coverage radius.
−100
−50
0
50
100
Diff
eren
ce in
num
ber
of o
pen
DC
s
5 10 15 20 25 30 35 40 45 50 55Coverage radius (km)
(b) Difference in number of open DCs obtained by solv-
ing Model 1 with 156 as a function of the coverage
radius.
Figure 13: Results obtained by solving Model 2 with p = 156.
4.2 Solution illustrations
We now present some optimal solutions obtained by solving Model 1 with CPLEX, using a 0.1%
gap. Table 3 provides the values of the attributes of three different solutions obtained with r = 5, 10
24
Tactical Network Planning for Food Aid Distribution in Kenya
CIRRELT-2013-09 CIRRELT-2013-09
Tactical Network Planning for Food Aid Distribution in Kenya
CIRRELT-2013-09
and 55 km, and Figure 14 illustrates the two extreme case solutions on a map. We do not claim
that these solutions are those that should be implemented since it is up to the decision maker to
assess the impact of various parameters on the design of the food distribution network while taking
into account the interest of the various stakeholders. We believe, however, that a multicriteria
optimization tool such as the one we have described helps generate good quality solutions from
which the decision maker can choose. This represents an improvement over the current practice
where most decisions are made without a strong analytical support.
Table 3: Characteristics of three representative optimal solutions
Solution Costs DCs Beneficiary statistics CPLEX
r Total Beneficiary Supply Hand-out # Not covered Average walk CPU time
(%) time (hr) (sec)
55 46,078,345.46 15,457,251.17 28,688,800.29 1,932,294 91 0 3.99 2,0345.71
25 43,438,031.79 11,029,998.54 30,135,995.25 2,272,038 107 3.62 2.84 2,297.95
5 40,671,491.26 3,688,771.978 31,376,943.28 5,605,776 264 19.94 0.89 10,331.91
(a) Solution with r = 55 km. (b) Solution with r = 5 km.
Figure 14: Optimal solutions with r = 55 km and r = 5 km.
5 Conclusions
We have considered a tactical location problem arising in food aid distribution in Kenya. The
problem was modeled and solved by means of a mathematical programming methodology. Several
sensitivity analyses were conducted to validate the results provided by the model and to study the
effects of various parameters on the solutions. We have shown how mathematical programming can
25
Tactical Network Planning for Food Aid Distribution in Kenya
CIRRELT-2013-09
Tactical Network Planning for Food Aid Distribution in Kenya
CIRRELT-2013-09
be used to design last-mile food aid distribution network using real data for the case of Garissa
District in Kenya. Our results show that the most important part of the total cost is related to
transporting the food from the district warehouse to the distribution centers. We have also shown
the importance of valuing the beneficiary time, which is by itself a new contribution.
This paper bridges part of the gap between theory and practice in the development of human-
itarian logistics support decision tools. Solving this problem contributes to the long-term food
security of the country. A decision tool such as the one we have developed can help decision makers
handle simultaneously the objective of several decision makers and select a suitable solution from
those that are generated. This tool should be welcome in the context of food aid distribution in
developing countries such as Kenya.
26
Tactical Network Planning for Food Aid Distribution in Kenya
CIRRELT-2013-09 CIRRELT-2013-09
Tactical Network Planning for Food Aid Distribution in Kenya
CIRRELT-2013-09
References
N. Altay and W.G. III Green. OR/MS research in disaster operation management. European
Journal of Operational Research, 175:475–493, 2006.
R. Alvarenga, O. Ergun, J. Li, F. Mata, N. Shekhani, D. Slaton, J. Stone, A. Vasudevan, and
E. Yang. World Food Programme East African corridor optimization. Technical report, H.
Milton Stewart School of Industrial and Systems Engineering, Georgia Institute of Technology,
Atlanta, 2010.
C.B. Barrett. Food aids intended and unintended consequences. Technical report, The Food and
Agriculture Organization of the United Nations, ESA Working Paper No. 06-05, 2006.
D. Bourn and R. Blench. Does food aid depress food production? the disincentive dilemma in the
african context. Technical report, The World Bank, Policy Research Working Paper Series 460,
1990.
D. Bourn and R. Blench. Can livestock and wildlife co-exist? an interdisciplinary review and
annotated bibliography of livestock, wildlife and people in the semi-arid rangelands of Eastern
Africa. Technical report, Overseas Development Institute, London, 1999.
A.M. Campbell and P.C. Jones. Prepositioning supplies in preparation for disasters. European
Journal of Operational Research, 209:156–165, 2011.
M. Celik, O. Ergun, B. Johnson, P. Keskinocak, A. Lorca, P. Pekgn, and J. Swann. Humanitarian
logistics. Tutorials in Operations Research, 2012. INFORMS, pages 18–149.
M. Christopher and P. Tatham, editors. Humanitarian Logistics. Meeting the Challenge of Preparing
and Responding to Disasters, pages 1–14. Kogan Page, London, 2011.
M.S. Daskin. What you should know about location modeling. Naval Research Logistics, 55:
283–294, 2008.
V. De Angelis, M. Mecoli, C. Nikoi, and G. Storchi. Multiperiod integrated routing and scheduling
of World Food Programme cargo planes in Angola. Computers and Operations Research, 34:
16011615, 2007.
S. Devereux. Seasonal Food Crises and Social Protection in Africa, chapter 6. Routledge, London,
2012.
O. Ergun, P. Keskinocak, and J.L. Swann. Introduction to the special issue on humanitarian
applications: Doing good with good OR. Interfaces, 41:215–222, 2011.
27
Tactical Network Planning for Food Aid Distribution in Kenya
CIRRELT-2013-09
Tactical Network Planning for Food Aid Distribution in Kenya
CIRRELT-2013-09
D. Erlenkotter. A dual-based procedure for uncapacitated facility location: General solution pro-
cedures and computational experience. Operations Research, 26:992–1009, 1978.
Government of Kenya. Food security in Kenya, October 2012a.
Government of Kenya. Kenya open data, September 2012b.
G.D. Haddow and J.A. Bullock. Introduction to Emergency Management. Butterworth-Heinemann,
Amsterdam, 2004.
M.P. Johnson and K. Smilowitz. Community-based operations research. In International Series in
Operations Research and Management Science, pages 37–65. Springer, New York, 2012.
L. Jordan, B. Watkins, P. Biegon, M. Mwangi, and R. Rose. Practical approach to spatial estimation
of disaster-affected populations. International Journal of Applied Geospatial Research, 1:31–48,
2010.
M. Koerkel. On the exact solution of large-scale simple plant location problems. European Journal
of Operational Research, 39:157–173, 1989.
G. Kovacs and K. M. Spens. Humanitarian logistics in disaster relief operations. International
Journal of Physical Distribution & Logistics Management, 37:99–114, 2007.
J. Kratica, D. Tosic, V. Filipovic, and I. Ljubic. Solving the simple plant location problems by
genetic algorithm. RAIRO Operations Research, 35:127–142, 2001.
A. Margolies and J. Hoddinott. United nations university, world institute for development eco-
nomics research. Technical report, The Food and Agriculture Organization of the United Nations,
UNU-WIDER Working Paper No. 2012/34, 2012.
D. Maxwell1 and B. Watkins. Humanitarian information systems and emergencies in the greater
Horn of Africa: logical components and logical linkages. Disasters, 27:72–90, 2003.
M.T. Melo, S. Nickel, and F. Saldanha da Gama. Facility location and supply chain management
– A review. European Journal of Operational Research, 196:401–412, 2009.
L. Michel and P. Van Hentenryck. A simple tabu search for warehouse location. European Journal
of Operational Research, 157:576–591, 2004.
Minister for Labor. Basic minimum consolidated wages. Labour Institutions Act No.22, 2012.
28
Tactical Network Planning for Food Aid Distribution in Kenya
CIRRELT-2013-09 CIRRELT-2013-09
Tactical Network Planning for Food Aid Distribution in Kenya
CIRRELT-2013-09
Z. Naji-Azimia, J. Renaud, A. Ruiz, and M. Salarid. A covering tour approach to the location
of satellite distribution centers to supply humanitarian aid. European Journal of Operational
Research, 222:596–605, 2012.
Nation Online. Map of Kenya, February 2012.
C.S. ReVelle, H.A. Eiselt, and M.S. Daskin. A bibliography for some fundamental problem cat-
egories in discrete location science. European Journal of Operational Research, 184:817–848,
2008.
S. Sanford and Y. Habtu. Emergency response intervention in pastoral areas of Ethiopia. U.K.
Departement of International Development, 2000.
D.J. Shaw. Global food and agricultural institutions. Routledge, New York, 2009.
D.J. Shaw. The world’s largest humanitarian agency. Palgrave Macmillan, New York, 2011.
N. Simpson and P. Hancock. Fifty years of operational research and emergency response. Journal
of the Operational Research Society, 60:S126–S139, 2009.
R. Tomasini and L.N. Van Wassenhove. Humanitarian Logistics. Palgrave Macmillan, Basingstoke,
2009.
J.A. Trunick. Logistics when it counts. Logistics Today, 46:38, 2005.
G.-H. Tzeng, H.-J. Cheng, and T.D. Huang. Multi-objective optimal planning for designing relief
delivery systems. Transportation Research Part E: Logistics and Transportation Review, 43:
673–686, 2007.
L.N. Van Wassenhove. Humanitarian aid logistics: supply chain management in high gear. Journal
of the Operational Research Society, 57:475–489, 2006.
L.N. Van Wassenhove and A.J.P. Martinez. Using or to adapt supply chain management best
practices to humanitarian logistics. International Transactions in Operational Research, 19:307–
322, 2012.
L. White, H. Smith, and C. Currie. OR in developing countries: A review. European Journal of
Operational Research, 208:1–11, 2011.
World Food Programme. Hunger, February 2012.
World Food Programme and Government of Kenya. Community based food aid targeting and
distribution in Kenya, 2005. Field Manual.
29
Tactical Network Planning for Food Aid Distribution in Kenya
CIRRELT-2013-09
Tactical Network Planning for Food Aid Distribution in Kenya
CIRRELT-2013-09
H. Young. Food Scarcity and Famine: Assessment and Response. Oxfam Practical Health Guide
No. 7. Oxfam UK and Ireland, 1992.
30
Tactical Network Planning for Food Aid Distribution in Kenya
CIRRELT-2013-09
Tactical Network Planning for Food Aid Distribution in Kenya
CIRRELT-2013-09


![2019-04-27 OnTarget First Aid Training Flyer [print]...Gun Range/Gunshot Wound Basic First Aid* Topics Covered: Gunshot Wound Basics: Tactical Treatment Ballistics and the Effects](https://img.pdfslide.net/doc/110x75/5f4849042f6f1a4a393115fb/2019-04-27-ontarget-first-aid-training-flyer-print-gun-rangegunshot-wound.jpg)