Embed Size (px)
Citation preview
Taiwan Mobile Co., Ltd. and Subsidiaries Consolidated Financial Statements for the Three Months Ended March 31, 2017 and 2016 and Independent Auditors’ Review Report
- 2 -
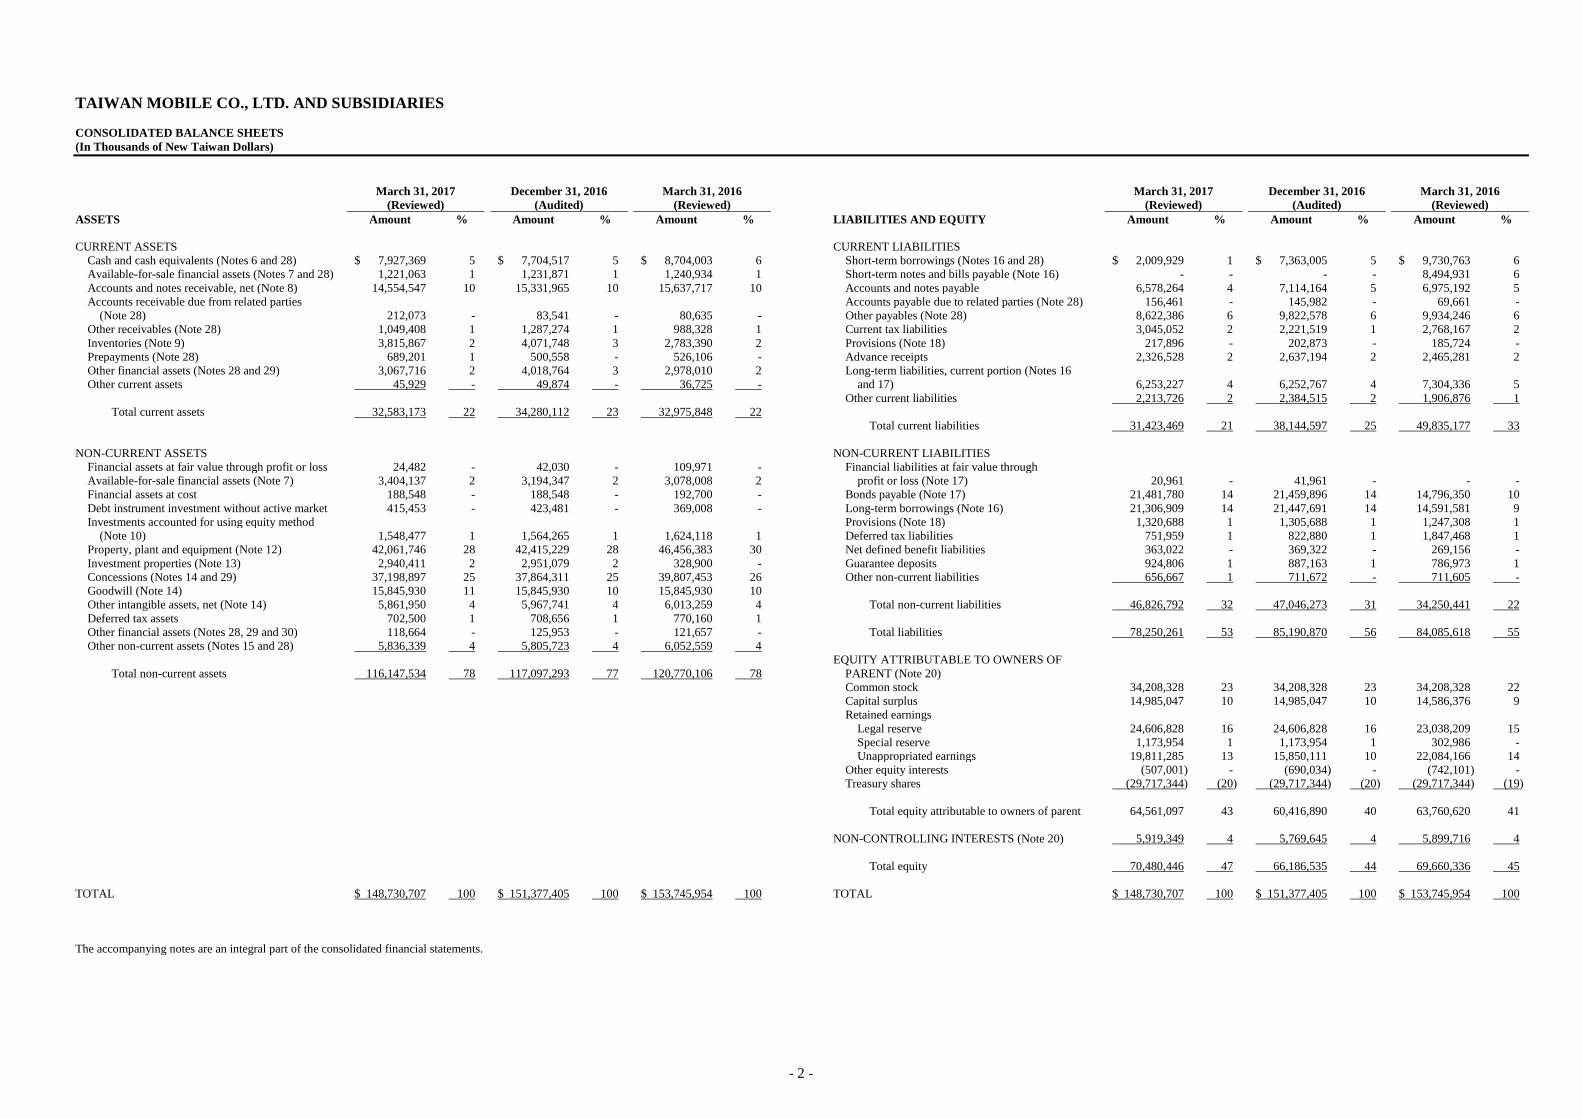
TAIWAN MOBILE CO., LTD. AND SUBSIDIARIES
CONSOLIDATED BALANCE SHEETS
(In Thousands of New Taiwan Dollars)
March 31, 2017
(Reviewed)
December 31, 2016
(Audited)
March 31, 2016
(Reviewed)
March 31, 2017
(Reviewed)
December 31, 2016
(Audited)
March 31, 2016
(Reviewed)
ASSETS Amount % Amount % Amount % LIABILITIES AND EQUITY Amount % Amount % Amount %
CURRENT ASSETS CURRENT LIABILITIES
Cash and cash equivalents (Notes 6 and 28) $ 7,927,369 5 $ 7,704,517 5 $ 8,704,003 6 Short-term borrowings (Notes 16 and 28) $ 2,009,929 1 $ 7,363,005 5 $ 9,730,763 6
Available-for-sale financial assets (Notes 7 and 28) 1,221,063 1 1,231,871 1 1,240,934 1 Short-term notes and bills payable (Note 16) - - - - 8,494,931 6
Accounts and notes receivable, net (Note 8) 14,554,547 10 15,331,965 10 15,637,717 10 Accounts and notes payable 6,578,264 4 7,114,164 5 6,975,192 5
Accounts receivable due from related parties Accounts payable due to related parties (Note 28) 156,461 - 145,982 - 69,661 -
(Note 28) 212,073 - 83,541 - 80,635 - Other payables (Note 28) 8,622,386 6 9,822,578 6 9,934,246 6
Other receivables (Note 28) 1,049,408 1 1,287,274 1 988,328 1 Current tax liabilities 3,045,052 2 2,221,519 1 2,768,167 2
Inventories (Note 9) 3,815,867 2 4,071,748 3 2,783,390 2 Provisions (Note 18) 217,896 - 202,873 - 185,724 -
Prepayments (Note 28) 689,201 1 500,558 - 526,106 - Advance receipts 2,326,528 2 2,637,194 2 2,465,281 2
Other financial assets (Notes 28 and 29) 3,067,716 2 4,018,764 3 2,978,010 2 Long-term liabilities, current portion (Notes 16
Other current assets 45,929 - 49,874 - 36,725 - and 17) 6,253,227 4 6,252,767 4 7,304,336 5
Other current liabilities 2,213,726 2 2,384,515 2 1,906,876 1
Total current assets 32,583,173 22 34,280,112 23 32,975,848 22
Total current liabilities 31,423,469 21 38,144,597 25 49,835,177 33
NON-CURRENT ASSETS NON-CURRENT LIABILITIES
Financial assets at fair value through profit or loss 24,482 - 42,030 - 109,971 - Financial liabilities at fair value through
Available-for-sale financial assets (Note 7) 3,404,137 2 3,194,347 2 3,078,008 2 profit or loss (Note 17) 20,961 - 41,961 - - -
Financial assets at cost 188,548 - 188,548 - 192,700 - Bonds payable (Note 17) 21,481,780 14 21,459,896 14 14,796,350 10
Debt instrument investment without active market 415,453 - 423,481 - 369,008 - Long-term borrowings (Note 16) 21,306,909 14 21,447,691 14 14,591,581 9
Investments accounted for using equity method Provisions (Note 18) 1,320,688 1 1,305,688 1 1,247,308 1
(Note 10) 1,548,477 1 1,564,265 1 1,624,118 1 Deferred tax liabilities 751,959 1 822,880 1 1,847,468 1
Property, plant and equipment (Note 12) 42,061,746 28 42,415,229 28 46,456,383 30 Net defined benefit liabilities 363,022 - 369,322 - 269,156 -
Investment properties (Note 13) 2,940,411 2 2,951,079 2 328,900 - Guarantee deposits 924,806 1 887,163 1 786,973 1
Concessions (Notes 14 and 29) 37,198,897 25 37,864,311 25 39,807,453 26 Other non-current liabilities 656,667 1 711,672 - 711,605 -
Goodwill (Note 14) 15,845,930 11 15,845,930 10 15,845,930 10
Other intangible assets, net (Note 14) 5,861,950 4 5,967,741 4 6,013,259 4 Total non-current liabilities 46,826,792 32 47,046,273 31 34,250,441 22
Deferred tax assets 702,500 1 708,656 1 770,160 1
Other financial assets (Notes 28, 29 and 30) 118,664 - 125,953 - 121,657 - Total liabilities 78,250,261 53 85,190,870 56 84,085,618 55
Other non-current assets (Notes 15 and 28) 5,836,339 4 5,805,723 4 6,052,559 4
EQUITY ATTRIBUTABLE TO OWNERS OF
Total non-current assets 116,147,534 78 117,097,293 77 120,770,106 78 PARENT (Note 20)
Common stock 34,208,328 23 34,208,328 23 34,208,328 22
Capital surplus 14,985,047 10 14,985,047 10 14,586,376 9
Retained earnings
Legal reserve 24,606,828 16 24,606,828 16 23,038,209 15
Special reserve 1,173,954 1 1,173,954 1 302,986 -
Unappropriated earnings 19,811,285 13 15,850,111 10 22,084,166 14
Other equity interests (507,001) - (690,034) - (742,101) -
Treasury shares (29,717,344) (20) (29,717,344) (20) (29,717,344) (19)
Total equity attributable to owners of parent 64,561,097 43 60,416,890 40 63,760,620 41
NON-CONTROLLING INTERESTS (Note 20) 5,919,349 4 5,769,645 4 5,899,716 4
Total equity 70,480,446 47 66,186,535 44 69,660,336 45
TOTAL $ 148,730,707 100 $ 151,377,405 100 $ 153,745,954 100 TOTAL $ 148,730,707 100 $ 151,377,405 100 $ 153,745,954 100
The accompanying notes are an integral part of the consolidated financial statements.
- 3 -
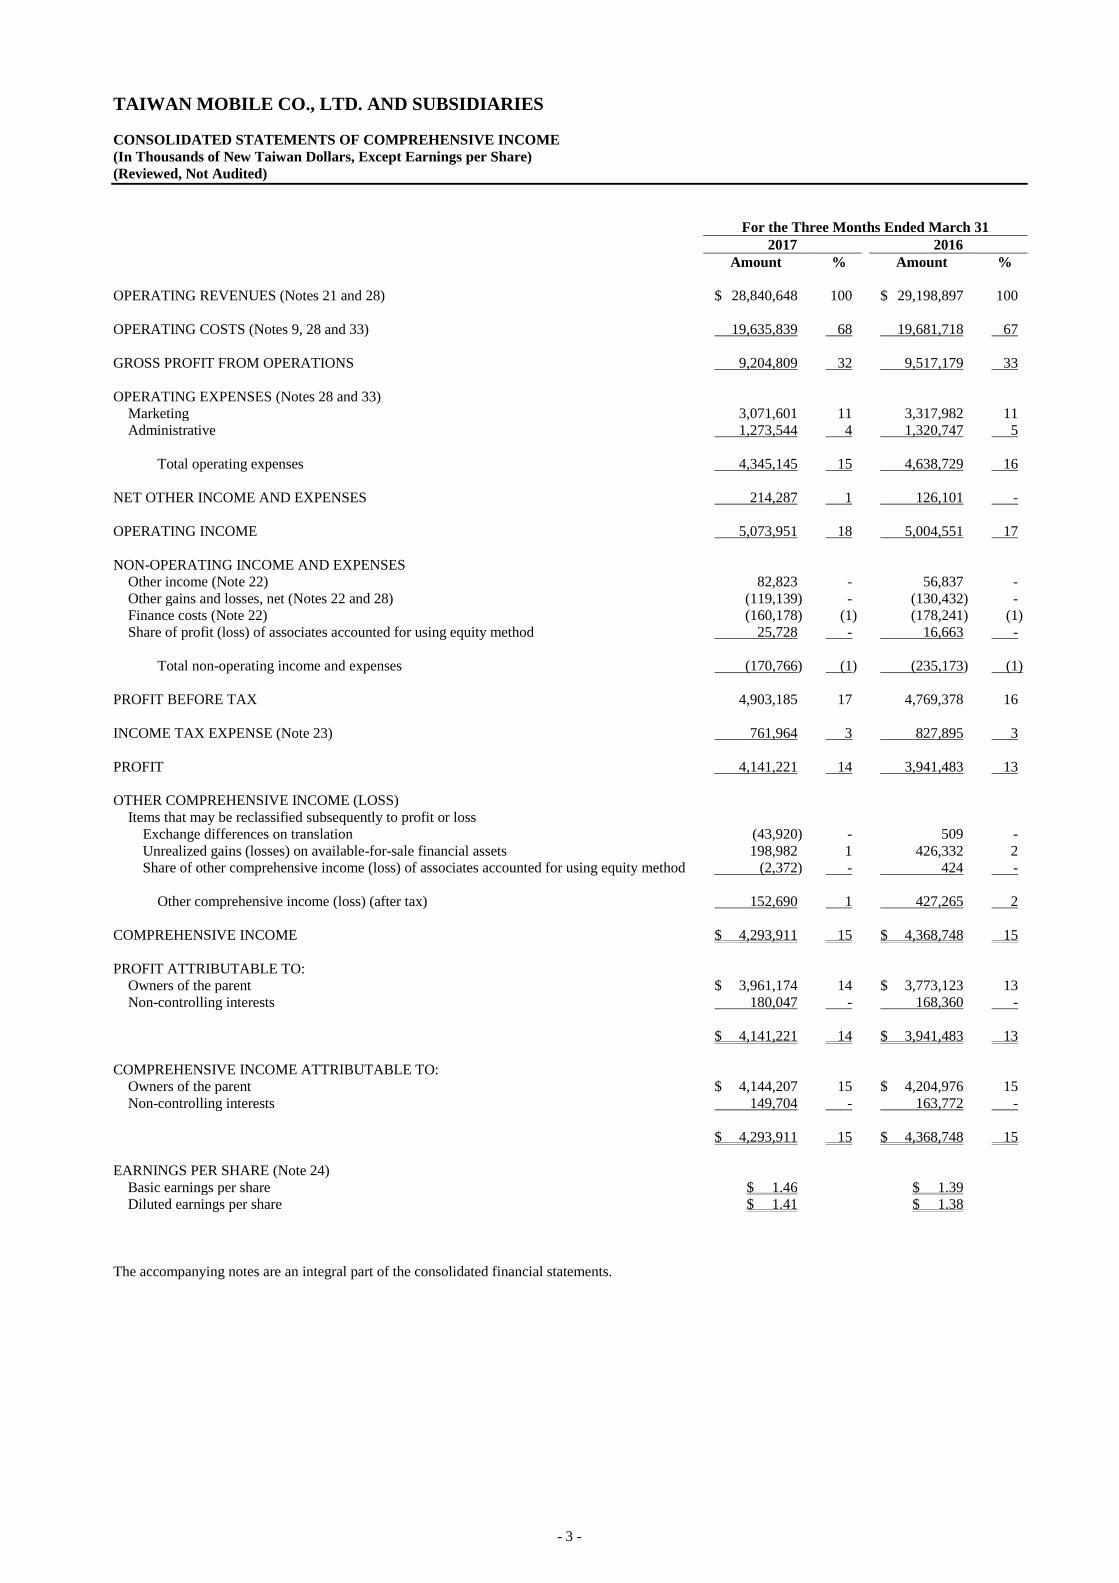
TAIWAN MOBILE CO., LTD. AND SUBSIDIARIES
CONSOLIDATED STATEMENTS OF COMPREHENSIVE INCOME
(In Thousands of New Taiwan Dollars, Except Earnings per Share)
(Reviewed, Not Audited)
For the Three Months Ended March 31
2017 2016
Amount % Amount %
OPERATING REVENUES (Notes 21 and 28) $ 28,840,648 100 $ 29,198,897 100
OPERATING COSTS (Notes 9, 28 and 33) 19,635,839 68 19,681,718 67
GROSS PROFIT FROM OPERATIONS 9,204,809 32 9,517,179 33
OPERATING EXPENSES (Notes 28 and 33)
Marketing 3,071,601 11 3,317,982 11
Administrative 1,273,544 4 1,320,747 5
Total operating expenses 4,345,145 15 4,638,729 16
NET OTHER INCOME AND EXPENSES 214,287 1 126,101 -
OPERATING INCOME 5,073,951 18 5,004,551 17
NON-OPERATING INCOME AND EXPENSES
Other income (Note 22) 82,823 - 56,837 -
Other gains and losses, net (Notes 22 and 28) (119,139) - (130,432) -
Finance costs (Note 22) (160,178) (1) (178,241) (1)
Share of profit (loss) of associates accounted for using equity method 25,728 - 16,663 -
Total non-operating income and expenses (170,766) (1) (235,173) (1)
PROFIT BEFORE TAX 4,903,185 17 4,769,378 16
INCOME TAX EXPENSE (Note 23) 761,964 3 827,895 3
PROFIT 4,141,221 14 3,941,483 13
OTHER COMPREHENSIVE INCOME (LOSS)
Items that may be reclassified subsequently to profit or loss
Exchange differences on translation (43,920) - 509 -
Unrealized gains (losses) on available-for-sale financial assets 198,982 1 426,332 2
Share of other comprehensive income (loss) of associates accounted for using equity method (2,372) - 424 -
Other comprehensive income (loss) (after tax) 152,690 1 427,265 2
COMPREHENSIVE INCOME $ 4,293,911 15 $ 4,368,748 15
PROFIT ATTRIBUTABLE TO:
Owners of the parent $ 3,961,174 14 $ 3,773,123 13
Non-controlling interests 180,047 - 168,360 -
$ 4,141,221 14 $ 3,941,483 13
COMPREHENSIVE INCOME ATTRIBUTABLE TO:
Owners of the parent $ 4,144,207 15 $ 4,204,976 15
Non-controlling interests 149,704 - 163,772 -
$ 4,293,911 15 $ 4,368,748 15
EARNINGS PER SHARE (Note 24)
Basic earnings per share $ 1.46 $ 1.39
Diluted earnings per share $ 1.41 $ 1.38
The accompanying notes are an integral part of the consolidated financial statements.
- 4 -
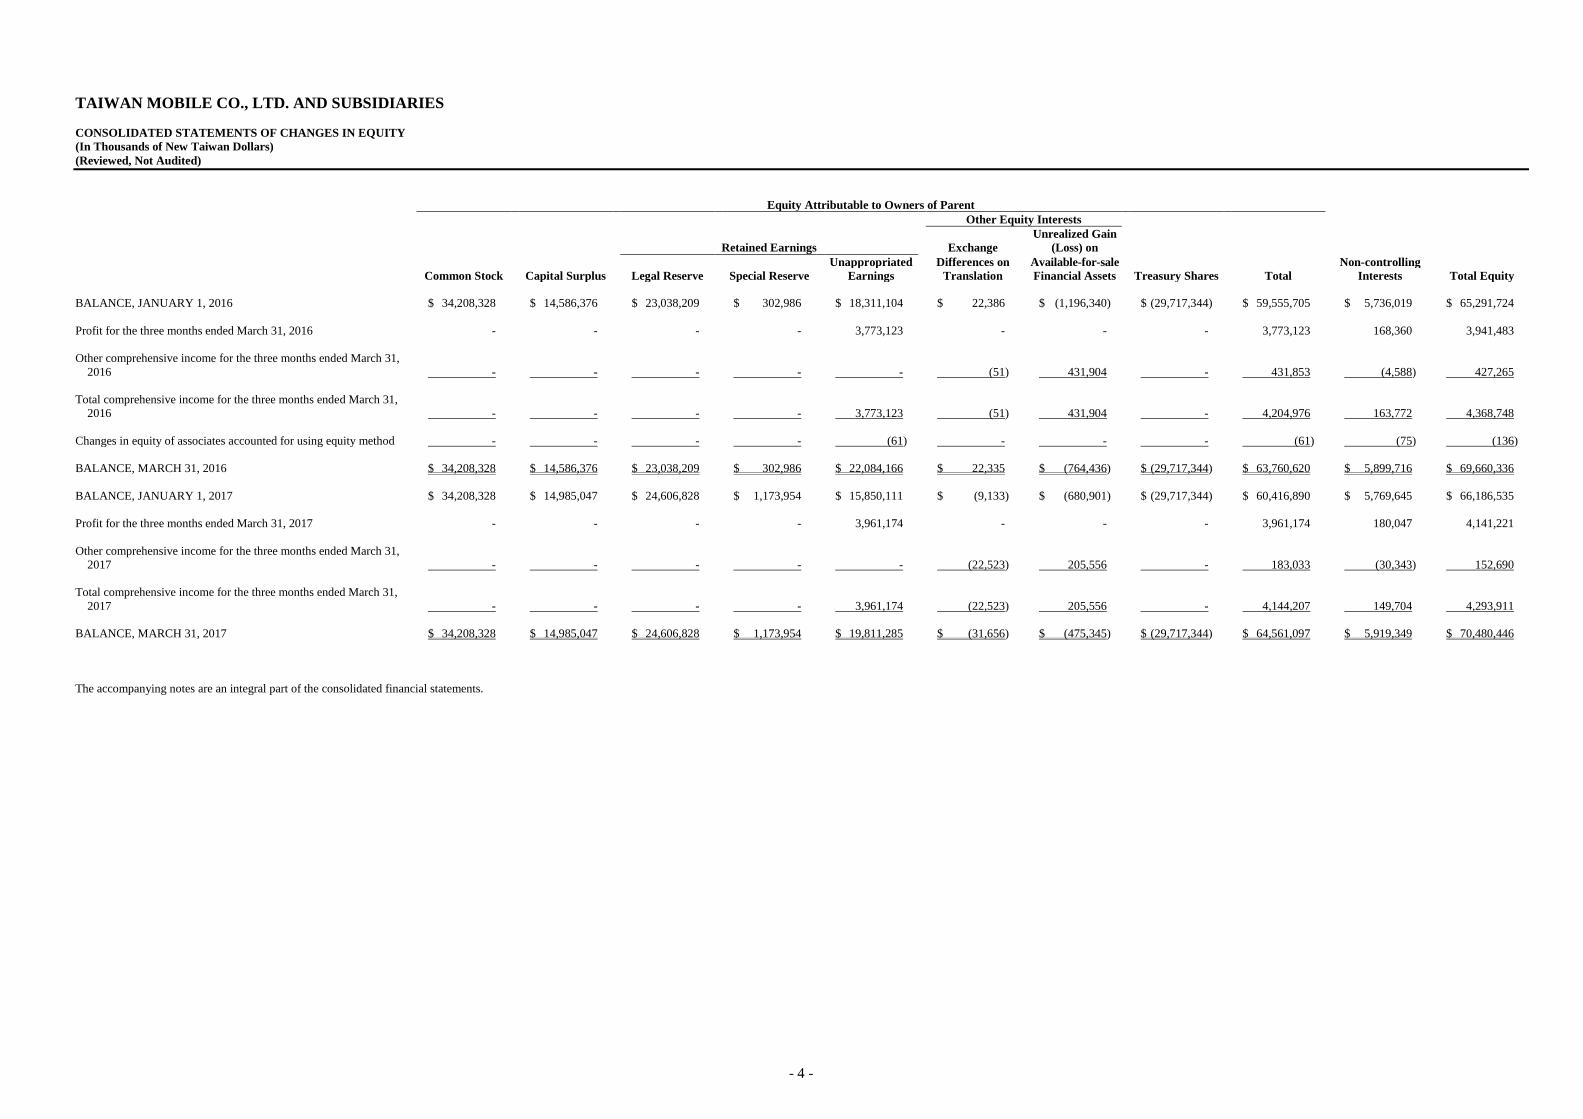
TAIWAN MOBILE CO., LTD. AND SUBSIDIARIES
CONSOLIDATED STATEMENTS OF CHANGES IN EQUITY
(In Thousands of New Taiwan Dollars)
(Reviewed, Not Audited)
Equity Attributable to Owners of Parent
Other Equity Interests
Unrealized Gain
Retained Earnings Exchange (Loss) on
Unappropriated Differences on Available-for-sale Non-controlling
Common Stock Capital Surplus Legal Reserve Special Reserve Earnings Translation Financial Assets Treasury Shares Total Interests Total Equity
BALANCE, JANUARY 1, 2016 $ 34,208,328 $ 14,586,376 $ 23,038,209 $ 302,986 $ 18,311,104 $ 22,386 $ (1,196,340) $ (29,717,344) $ 59,555,705 $ 5,736,019 $ 65,291,724
Profit for the three months ended March 31, 2016 - - - - 3,773,123 - - - 3,773,123 168,360 3,941,483
Other comprehensive income for the three months ended March 31,
2016 - - - - - (51) 431,904 - 431,853 (4,588) 427,265
Total comprehensive income for the three months ended March 31,
2016 - - - - 3,773,123 (51) 431,904 - 4,204,976 163,772 4,368,748
Changes in equity of associates accounted for using equity method - - - - (61) - - - (61) (75) (136)
BALANCE, MARCH 31, 2016 $ 34,208,328 $ 14,586,376 $ 23,038,209 $ 302,986 $ 22,084,166 $ 22,335 $ (764,436) $ (29,717,344) $ 63,760,620 $ 5,899,716 $ 69,660,336
BALANCE, JANUARY 1, 2017 $ 34,208,328 $ 14,985,047 $ 24,606,828 $ 1,173,954 $ 15,850,111 $ (9,133) $ (680,901) $ (29,717,344) $ 60,416,890 $ 5,769,645 $ 66,186,535
Profit for the three months ended March 31, 2017 - - - - 3,961,174 - - - 3,961,174 180,047 4,141,221
Other comprehensive income for the three months ended March 31,
2017 - - - - - (22,523) 205,556 - 183,033 (30,343) 152,690
Total comprehensive income for the three months ended March 31,
2017 - - - - 3,961,174 (22,523) 205,556 - 4,144,207 149,704 4,293,911
BALANCE, MARCH 31, 2017 $ 34,208,328 $ 14,985,047 $ 24,606,828 $ 1,173,954 $ 19,811,285 $ (31,656) $ (475,345) $ (29,717,344) $ 64,561,097 $ 5,919,349 $ 70,480,446
The accompanying notes are an integral part of the consolidated financial statements.
- 5 -
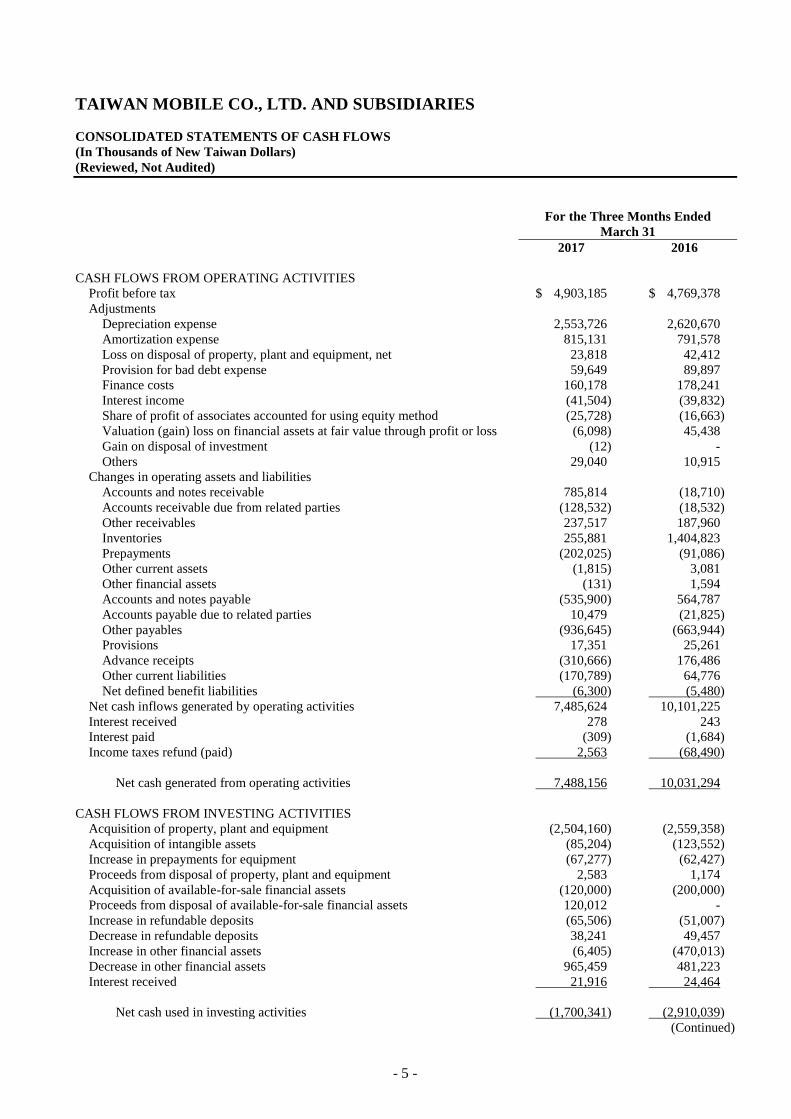
TAIWAN MOBILE CO., LTD. AND SUBSIDIARIES
CONSOLIDATED STATEMENTS OF CASH FLOWS
(In Thousands of New Taiwan Dollars)
(Reviewed, Not Audited)
For the Three Months Ended
March 31
2017 2016
CASH FLOWS FROM OPERATING ACTIVITIES
Profit before tax $ 4,903,185 $ 4,769,378
Adjustments
Depreciation expense 2,553,726 2,620,670
Amortization expense 815,131 791,578
Loss on disposal of property, plant and equipment, net 23,818 42,412
Provision for bad debt expense 59,649 89,897
Finance costs 160,178 178,241
Interest income (41,504) (39,832)
Share of profit of associates accounted for using equity method (25,728) (16,663)
Valuation (gain) loss on financial assets at fair value through profit or loss (6,098) 45,438
Gain on disposal of investment (12) -
Others 29,040 10,915
Changes in operating assets and liabilities
Accounts and notes receivable 785,814 (18,710)
Accounts receivable due from related parties (128,532) (18,532)
Other receivables 237,517 187,960
Inventories 255,881 1,404,823
Prepayments (202,025) (91,086)
Other current assets (1,815) 3,081
Other financial assets (131) 1,594
Accounts and notes payable (535,900) 564,787
Accounts payable due to related parties 10,479 (21,825)
Other payables (936,645) (663,944)
Provisions 17,351 25,261
Advance receipts (310,666) 176,486
Other current liabilities (170,789) 64,776
Net defined benefit liabilities (6,300) (5,480)
Net cash inflows generated by operating activities 7,485,624 10,101,225
Interest received 278 243
Interest paid (309) (1,684)
Income taxes refund (paid) 2,563 (68,490)
Net cash generated from operating activities 7,488,156 10,031,294
CASH FLOWS FROM INVESTING ACTIVITIES
Acquisition of property, plant and equipment (2,504,160) (2,559,358)
Acquisition of intangible assets (85,204) (123,552)
Increase in prepayments for equipment (67,277) (62,427)
Proceeds from disposal of property, plant and equipment 2,583 1,174
Acquisition of available-for-sale financial assets (120,000) (200,000)
Proceeds from disposal of available-for-sale financial assets 120,012 -
Increase in refundable deposits (65,506) (51,007)
Decrease in refundable deposits 38,241 49,457
Increase in other financial assets (6,405) (470,013)
Decrease in other financial assets 965,459 481,223
Interest received 21,916 24,464
Net cash used in investing activities (1,700,341) (2,910,039)
(Continued)
- 6 -
TAIWAN MOBILE CO., LTD. AND SUBSIDIARIES
CONSOLIDATED STATEMENTS OF CASH FLOWS
(In Thousands of New Taiwan Dollars)
(Reviewed, Not Audited)
For the Three Months Ended
March 31
2017 2016
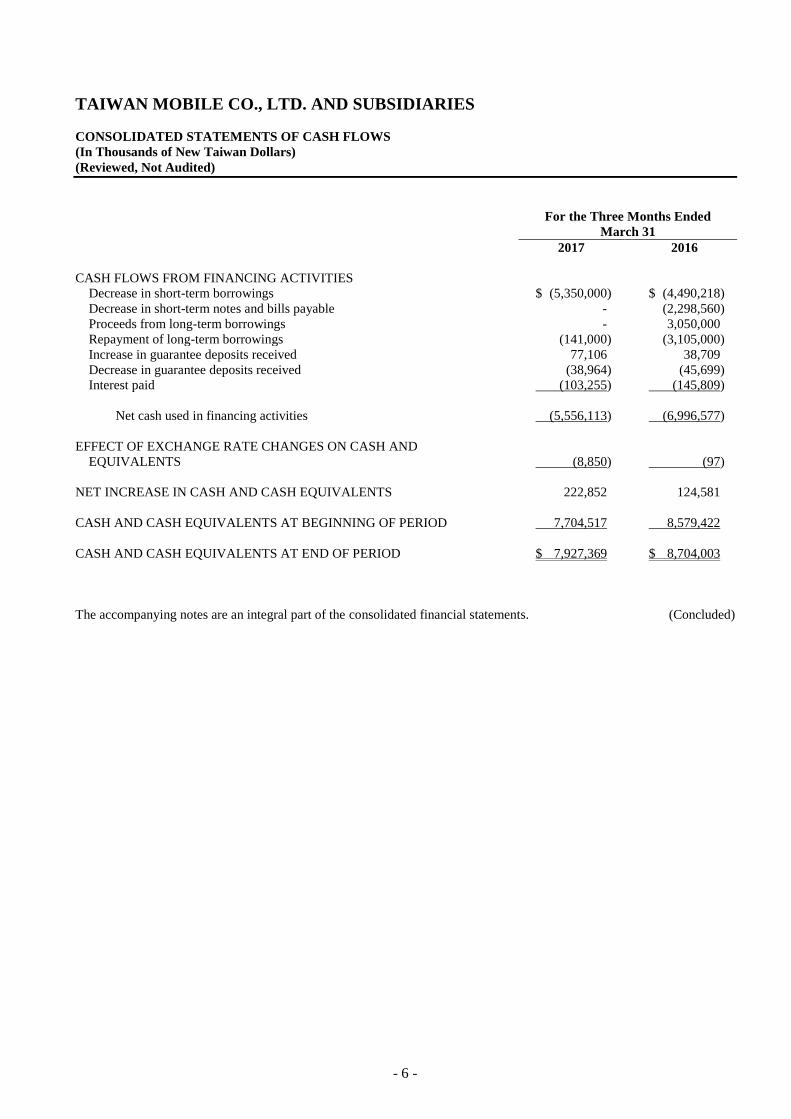
CASH FLOWS FROM FINANCING ACTIVITIES
Decrease in short-term borrowings $ (5,350,000) $ (4,490,218)
Decrease in short-term notes and bills payable - (2,298,560)
Proceeds from long-term borrowings - 3,050,000
Repayment of long-term borrowings (141,000) (3,105,000)
Increase in guarantee deposits received 77,106 38,709
Decrease in guarantee deposits received (38,964) (45,699)
Interest paid (103,255) (145,809)
Net cash used in financing activities (5,556,113) (6,996,577)
EFFECT OF EXCHANGE RATE CHANGES ON CASH AND
EQUIVALENTS (8,850) (97)
NET INCREASE IN CASH AND CASH EQUIVALENTS 222,852 124,581
CASH AND CASH EQUIVALENTS AT BEGINNING OF PERIOD 7,704,517 8,579,422
CASH AND CASH EQUIVALENTS AT END OF PERIOD $ 7,927,369 $ 8,704,003
The accompanying notes are an integral part of the consolidated financial statements. (Concluded)
- 7 -
TAIWAN MOBILE CO., LTD. AND SUBSIDIARIES
NOTES TO CONSOLIDATED FINANCIAL STATEMENTS
FOR THE THREE MONTHS ENDED MARCH 31, 2017 AND 2016
(In Thousands of New Taiwan Dollars, Unless Stated Otherwise)
(Reviewed, Not Audited)
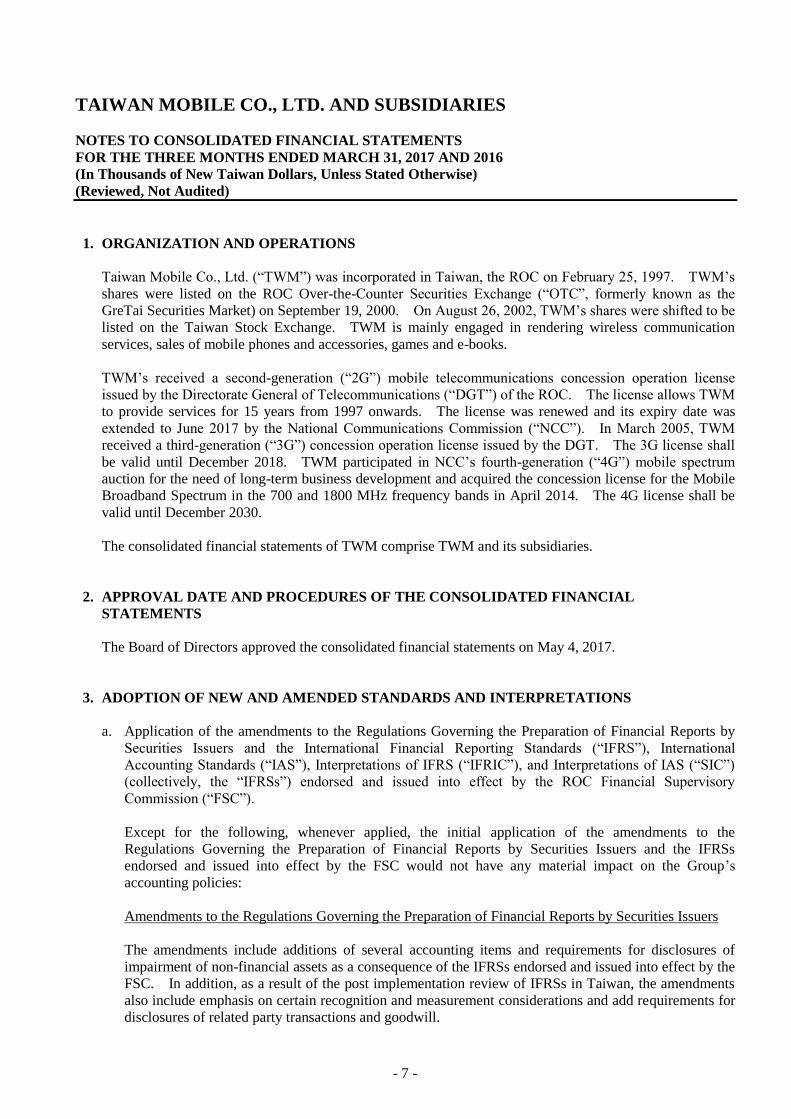
1. ORGANIZATION AND OPERATIONS
Taiwan Mobile Co., Ltd. (“TWM”) was incorporated in Taiwan, the ROC on February 25, 1997. TWM’s
shares were listed on the ROC Over-the-Counter Securities Exchange (“OTC”, formerly known as the
GreTai Securities Market) on September 19, 2000. On August 26, 2002, TWM’s shares were shifted to be
listed on the Taiwan Stock Exchange. TWM is mainly engaged in rendering wireless communication
services, sales of mobile phones and accessories, games and e-books.
TWM’s received a second-generation (“2G”) mobile telecommunications concession operation license
issued by the Directorate General of Telecommunications (“DGT”) of the ROC. The license allows TWM
to provide services for 15 years from 1997 onwards. The license was renewed and its expiry date was
extended to June 2017 by the National Communications Commission (“NCC”). In March 2005, TWM
received a third-generation (“3G”) concession operation license issued by the DGT. The 3G license shall
be valid until December 2018. TWM participated in NCC’s fourth-generation (“4G”) mobile spectrum
auction for the need of long-term business development and acquired the concession license for the Mobile
Broadband Spectrum in the 700 and 1800 MHz frequency bands in April 2014. The 4G license shall be
valid until December 2030.
The consolidated financial statements of TWM comprise TWM and its subsidiaries.
2. APPROVAL DATE AND PROCEDURES OF THE CONSOLIDATED FINANCIAL
STATEMENTS
The Board of Directors approved the consolidated financial statements on May 4, 2017.
3. ADOPTION OF NEW AND AMENDED STANDARDS AND INTERPRETATIONS
a. Application of the amendments to the Regulations Governing the Preparation of Financial Reports by
Securities Issuers and the International Financial Reporting Standards (“IFRS”), International
Accounting Standards (“IAS”), Interpretations of IFRS (“IFRIC”), and Interpretations of IAS (“SIC”)
(collectively, the “IFRSs”) endorsed and issued into effect by the ROC Financial Supervisory
Commission (“FSC”).
Except for the following, whenever applied, the initial application of the amendments to the
Regulations Governing the Preparation of Financial Reports by Securities Issuers and the IFRSs
endorsed and issued into effect by the FSC would not have any material impact on the Group’s
accounting policies:
Amendments to the Regulations Governing the Preparation of Financial Reports by Securities Issuers
The amendments include additions of several accounting items and requirements for disclosures of
impairment of non-financial assets as a consequence of the IFRSs endorsed and issued into effect by the
FSC. In addition, as a result of the post implementation review of IFRSs in Taiwan, the amendments
also include emphasis on certain recognition and measurement considerations and add requirements for
disclosures of related party transactions and goodwill.
- 8 -
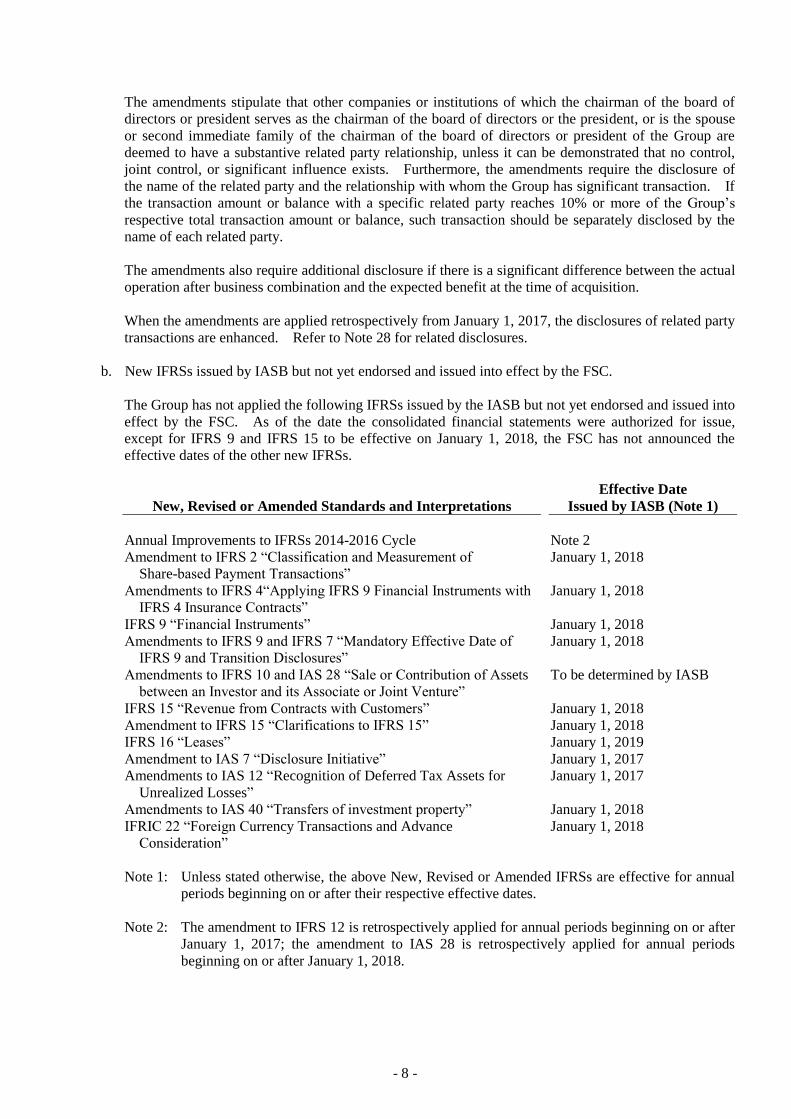
The amendments stipulate that other companies or institutions of which the chairman of the board of
directors or president serves as the chairman of the board of directors or the president, or is the spouse
or second immediate family of the chairman of the board of directors or president of the Group are
deemed to have a substantive related party relationship, unless it can be demonstrated that no control,
joint control, or significant influence exists. Furthermore, the amendments require the disclosure of
the name of the related party and the relationship with whom the Group has significant transaction. If
the transaction amount or balance with a specific related party reaches 10% or more of the Group’s
respective total transaction amount or balance, such transaction should be separately disclosed by the
name of each related party.
The amendments also require additional disclosure if there is a significant difference between the actual
operation after business combination and the expected benefit at the time of acquisition.
When the amendments are applied retrospectively from January 1, 2017, the disclosures of related party
transactions are enhanced. Refer to Note 28 for related disclosures.
b. New IFRSs issued by IASB but not yet endorsed and issued into effect by the FSC.
The Group has not applied the following IFRSs issued by the IASB but not yet endorsed and issued into
effect by the FSC. As of the date the consolidated financial statements were authorized for issue,
except for IFRS 9 and IFRS 15 to be effective on January 1, 2018, the FSC has not announced the
effective dates of the other new IFRSs.
New, Revised or Amended Standards and Interpretations
Effective Date
Issued by IASB (Note 1)
Annual Improvements to IFRSs 2014-2016 Cycle Note 2
Amendment to IFRS 2 “Classification and Measurement of
Share-based Payment Transactions”
January 1, 2018
Amendments to IFRS 4“Applying IFRS 9 Financial Instruments with
IFRS 4 Insurance Contracts”
January 1, 2018
IFRS 9 “Financial Instruments” January 1, 2018
Amendments to IFRS 9 and IFRS 7 “Mandatory Effective Date of
IFRS 9 and Transition Disclosures”
January 1, 2018
Amendments to IFRS 10 and IAS 28 “Sale or Contribution of Assets
between an Investor and its Associate or Joint Venture”
To be determined by IASB
IFRS 15 “Revenue from Contracts with Customers” January 1, 2018
Amendment to IFRS 15 “Clarifications to IFRS 15” January 1, 2018
IFRS 16 “Leases” January 1, 2019
Amendment to IAS 7 “Disclosure Initiative” January 1, 2017
Amendments to IAS 12 “Recognition of Deferred Tax Assets for
Unrealized Losses”
January 1, 2017
Amendments to IAS 40 “Transfers of investment property” January 1, 2018
IFRIC 22 “Foreign Currency Transactions and Advance
Consideration”
January 1, 2018
Note 1: Unless stated otherwise, the above New, Revised or Amended IFRSs are effective for annual
periods beginning on or after their respective effective dates.
Note 2: The amendment to IFRS 12 is retrospectively applied for annual periods beginning on or after
January 1, 2017; the amendment to IAS 28 is retrospectively applied for annual periods
beginning on or after January 1, 2018.
- 9 -
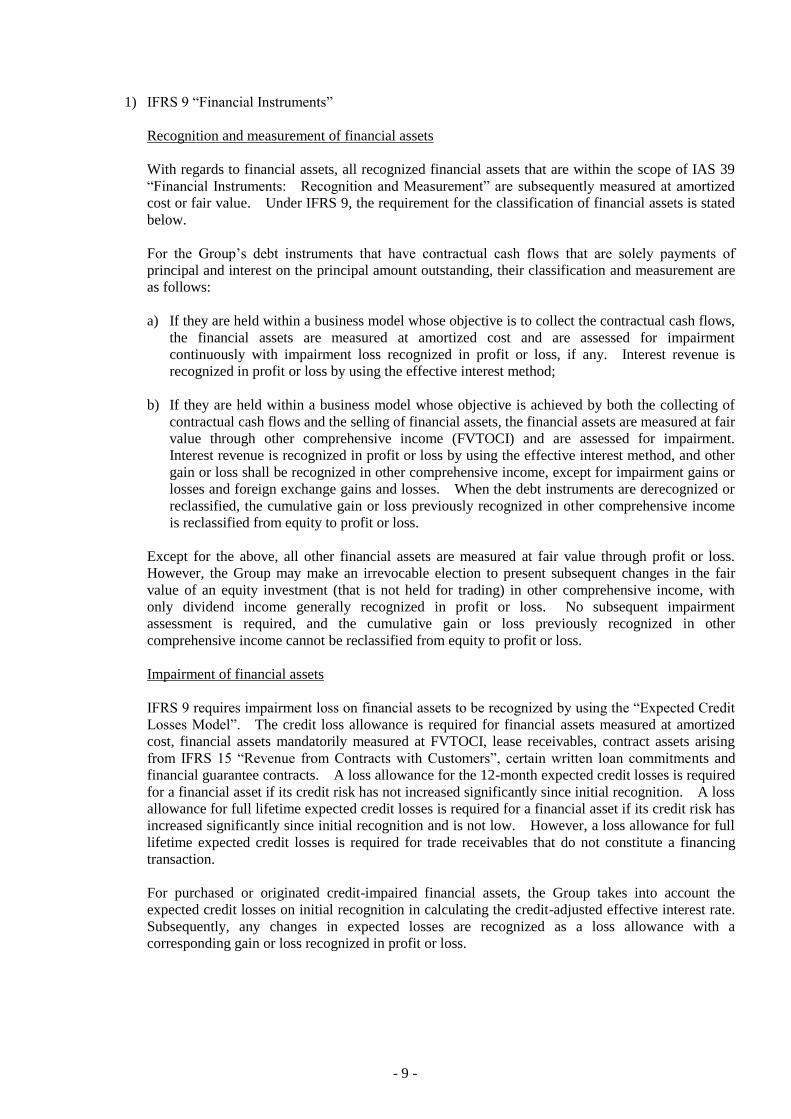
1) IFRS 9 “Financial Instruments”
Recognition and measurement of financial assets
With regards to financial assets, all recognized financial assets that are within the scope of IAS 39
“Financial Instruments: Recognition and Measurement” are subsequently measured at amortized
cost or fair value. Under IFRS 9, the requirement for the classification of financial assets is stated
below.
For the Group’s debt instruments that have contractual cash flows that are solely payments of
principal and interest on the principal amount outstanding, their classification and measurement are
as follows:
a) If they are held within a business model whose objective is to collect the contractual cash flows,
the financial assets are measured at amortized cost and are assessed for impairment
continuously with impairment loss recognized in profit or loss, if any. Interest revenue is
recognized in profit or loss by using the effective interest method;
b) If they are held within a business model whose objective is achieved by both the collecting of
contractual cash flows and the selling of financial assets, the financial assets are measured at fair
value through other comprehensive income (FVTOCI) and are assessed for impairment.
Interest revenue is recognized in profit or loss by using the effective interest method, and other
gain or loss shall be recognized in other comprehensive income, except for impairment gains or
losses and foreign exchange gains and losses. When the debt instruments are derecognized or
reclassified, the cumulative gain or loss previously recognized in other comprehensive income
is reclassified from equity to profit or loss.
Except for the above, all other financial assets are measured at fair value through profit or loss.
However, the Group may make an irrevocable election to present subsequent changes in the fair
value of an equity investment (that is not held for trading) in other comprehensive income, with
only dividend income generally recognized in profit or loss. No subsequent impairment
assessment is required, and the cumulative gain or loss previously recognized in other
comprehensive income cannot be reclassified from equity to profit or loss.
Impairment of financial assets
IFRS 9 requires impairment loss on financial assets to be recognized by using the “Expected Credit
Losses Model”. The credit loss allowance is required for financial assets measured at amortized
cost, financial assets mandatorily measured at FVTOCI, lease receivables, contract assets arising
from IFRS 15 “Revenue from Contracts with Customers”, certain written loan commitments and
financial guarantee contracts. A loss allowance for the 12-month expected credit losses is required
for a financial asset if its credit risk has not increased significantly since initial recognition. A loss
allowance for full lifetime expected credit losses is required for a financial asset if its credit risk has
increased significantly since initial recognition and is not low. However, a loss allowance for full
lifetime expected credit losses is required for trade receivables that do not constitute a financing
transaction.
For purchased or originated credit-impaired financial assets, the Group takes into account the
expected credit losses on initial recognition in calculating the credit-adjusted effective interest rate.
Subsequently, any changes in expected losses are recognized as a loss allowance with a
corresponding gain or loss recognized in profit or loss.
- 10 -
Transition
Financial instruments that have been derecognized prior to the effective date of IFRS 9 cannot be
reversed to apply IFRS 9 when it becomes effective. Under IFRS 9, the requirements for
classification, measurement and impairment of financial assets are applied retrospectively with the
difference between the previous carrying amount and the carrying amount at the date of initial
application recognized in the current period and restatement of prior periods is not required.
2) IFRS 15 “Revenue from Contracts with Customers” and related amendment
IFRS 15 establishes the principles that apply to report revenue arising from a contract with a
customer. This standard will replace IAS 18 Revenue, IAS 11 Construction Contracts, and related
interpretations.
When adopting IFRS 15, the Group recognizes revenue by the following steps:
a) Identify the contract with the customer;
b) Identify the performance obligations in the contract;
c) Determine the transaction price;
d) Allocate the transaction price to the performance obligations in the contract; and
e) Recognize revenue when the entity satisfies a performance obligation.
IFRS 15 establishes the principles that incremental costs of obtaining a contract will be recognized
as an asset to the extent the Group expects to recover those costs. Such asset will be amortized on
a basis that is consistent with the transfer to the customer of the goods or services during the
contract period to which the asset relates. This will lead to the later recognition of charges for
certain customer-obtaining costs.
IFRS 15 and related amendment require that when another party is involved in providing goods or
services to a customer, the Group is a principal if it controls the specified good or service before
that good or service is transferred to a customer.
When IFRS 15 and related amendment are effective, the Group may elect to apply this standard
either retrospectively to each period presented or to recognize the accumulated adjustment at the
date of initial application.
3) IFRS 16 “Leases”
IFRS 16 sets out the accounting standards for leases that will supersede IAS 17 and a number of
related interpretations.
Under IFRS 16, if the Group is a lessee, it shall recognize right-of-use assets and lease liabilities for
all leases on the consolidated balance sheets except for low-value and short-term leases. The
Group may elect to apply the accounting method similar to the accounting for operating lease under
IAS 17 to the low-value and short-term leases. On the consolidated statements of comprehensive
income, the Group should present the depreciation expense charged on the right-of-use asset
separately from interest expense accrued on the lease liability; interest is computed by using
effective interest method. On the consolidated statements of cash flows, cash payments for the
principal portion of the lease liability and for interest portion are classified within financing
activities.
The application of IFRS 16 is not expected to have a material impact on the accounting of the
Group as lessor.
When IFRS 16 becomes effective, the Group may elect to apply this Standard either retrospectively
to each prior reporting period presented or retrospectively with the cumulative effect of the initial
application of this Standard recognized at the date of initial application.
- 11 -
Except for the above potential impact, as of the date the consolidated financial statements were
authorized for issue, the Group is continuously assessing the possible impact that the application of
other standards and interpretations will have on the Group’s financial position and financial
performance, and will disclose the relevant impact when the assessment is completed.
4. SUMMARY OF SIGNIFICANT ACCOUNTING POLICIES
Except for the following description, the significant accounting policies adopted for the consolidated
financial statements are the same as those adopted for the consolidated financial statements for the year
ended December 31, 2016.
Statement of Compliance
The consolidated financial statements have been prepared in accordance with the “Regulations Governing
the Preparation of Financial Reports by Securities Issuers” and IAS 34 Interim Financial Reporting
endorsed and issued into effect by the FSC. The consolidated financial statements do not include all the
information which should be disclosed in the annual consolidated financial statements in accordance with
the IFRSs endorsed and issued into effect by the FSC.
Basis of Consolidation
a. The basis of preparing the consolidated financial statements is the same as that of the consolidated
financial statements for the year ended December 31, 2016.
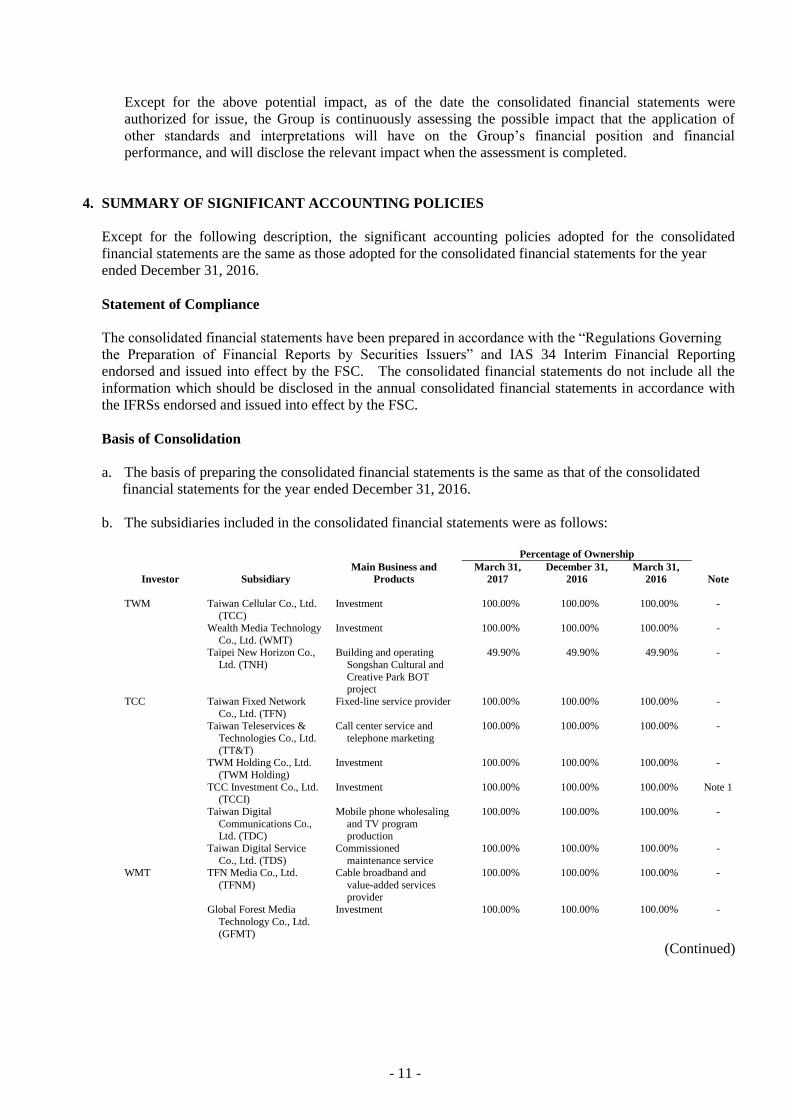
b. The subsidiaries included in the consolidated financial statements were as follows:
Percentage of Ownership
Investor Subsidiary
Main Business and
Products
March 31,
2017
December 31,
2016
March 31,
2016 Note
TWM Taiwan Cellular Co., Ltd. (TCC)
Investment 100.00% 100.00% 100.00% -
Wealth Media Technology
Co., Ltd. (WMT)
Investment 100.00% 100.00% 100.00% -
Taipei New Horizon Co.,
Ltd. (TNH)
Building and operating
Songshan Cultural and
Creative Park BOT project
49.90% 49.90% 49.90% -
TCC Taiwan Fixed Network
Co., Ltd. (TFN)
Fixed-line service provider 100.00% 100.00% 100.00% -
Taiwan Teleservices &
Technologies Co., Ltd.
(TT&T)
Call center service and
telephone marketing
100.00% 100.00% 100.00% -
TWM Holding Co., Ltd.
(TWM Holding)
Investment 100.00% 100.00% 100.00% -
TCC Investment Co., Ltd. (TCCI)
Investment 100.00% 100.00% 100.00% Note 1
Taiwan Digital
Communications Co., Ltd. (TDC)
Mobile phone wholesaling
and TV program production
100.00% 100.00% 100.00% -
Taiwan Digital Service
Co., Ltd. (TDS)
Commissioned
maintenance service
100.00% 100.00% 100.00% -
WMT TFN Media Co., Ltd.
(TFNM)
Cable broadband and
value-added services provider
100.00% 100.00% 100.00% -
Global Forest Media
Technology Co., Ltd.
(GFMT)
Investment 100.00% 100.00% 100.00% -
(Continued)
- 12 -
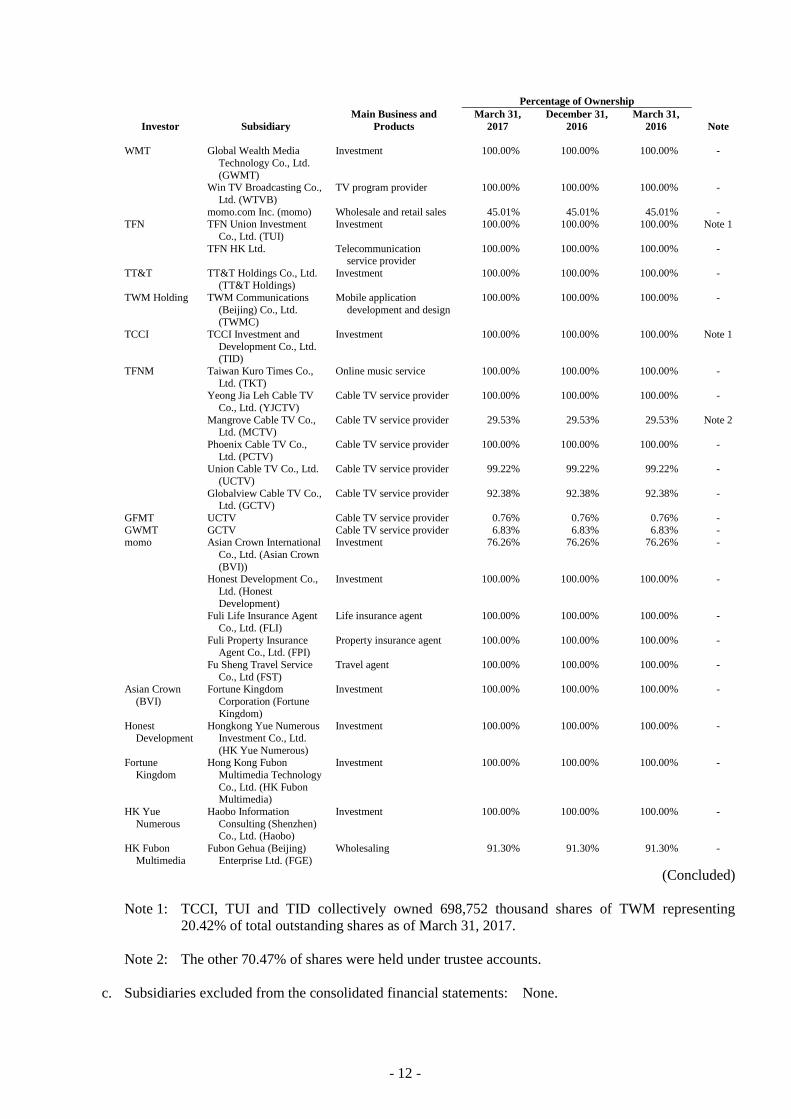
Percentage of Ownership
Investor Subsidiary
Main Business and
Products
March 31,
2017
December 31,
2016
March 31,
2016 Note
WMT Global Wealth Media
Technology Co., Ltd.
(GWMT)
Investment 100.00% 100.00% 100.00% -
Win TV Broadcasting Co.,
Ltd. (WTVB)
TV program provider 100.00% 100.00% 100.00% -
momo.com Inc. (momo) Wholesale and retail sales 45.01% 45.01% 45.01% - TFN TFN Union Investment
Co., Ltd. (TUI)
Investment 100.00% 100.00% 100.00% Note 1
TFN HK Ltd. Telecommunication service provider
100.00% 100.00% 100.00% -
TT&T TT&T Holdings Co., Ltd. (TT&T Holdings)
Investment 100.00% 100.00% 100.00% -
TWM Holding TWM Communications
(Beijing) Co., Ltd. (TWMC)
Mobile application
development and design
100.00% 100.00% 100.00% -
TCCI TCCI Investment and
Development Co., Ltd. (TID)
Investment 100.00% 100.00% 100.00% Note 1
TFNM Taiwan Kuro Times Co.,
Ltd. (TKT)
Online music service 100.00% 100.00% 100.00% -
Yeong Jia Leh Cable TV
Co., Ltd. (YJCTV)
Cable TV service provider 100.00% 100.00% 100.00% -
Mangrove Cable TV Co., Ltd. (MCTV)
Cable TV service provider 29.53% 29.53% 29.53% Note 2
Phoenix Cable TV Co.,
Ltd. (PCTV)
Cable TV service provider 100.00% 100.00% 100.00% -
Union Cable TV Co., Ltd.
(UCTV)
Cable TV service provider 99.22% 99.22% 99.22% -
Globalview Cable TV Co., Ltd. (GCTV)
Cable TV service provider 92.38% 92.38% 92.38% -
GFMT UCTV Cable TV service provider 0.76% 0.76% 0.76% -
GWMT GCTV Cable TV service provider 6.83% 6.83% 6.83% - momo Asian Crown International
Co., Ltd. (Asian Crown
(BVI))
Investment 76.26% 76.26% 76.26% -
Honest Development Co.,
Ltd. (Honest
Development)
Investment 100.00% 100.00% 100.00% -
Fuli Life Insurance Agent
Co., Ltd. (FLI)
Life insurance agent 100.00% 100.00% 100.00% -
Fuli Property Insurance Agent Co., Ltd. (FPI)
Property insurance agent 100.00% 100.00% 100.00% -
Fu Sheng Travel Service
Co., Ltd (FST)
Travel agent 100.00% 100.00% 100.00% -
Asian Crown
(BVI)
Fortune Kingdom
Corporation (Fortune
Kingdom)
Investment 100.00% 100.00% 100.00% -
Honest
Development
Hongkong Yue Numerous
Investment Co., Ltd.
(HK Yue Numerous)
Investment 100.00% 100.00% 100.00% -
Fortune
Kingdom
Hong Kong Fubon
Multimedia Technology
Co., Ltd. (HK Fubon Multimedia)
Investment 100.00% 100.00% 100.00% -
HK Yue
Numerous
Haobo Information
Consulting (Shenzhen) Co., Ltd. (Haobo)
Investment 100.00% 100.00% 100.00% -
HK Fubon
Multimedia
Fubon Gehua (Beijing)
Enterprise Ltd. (FGE)
Wholesaling 91.30% 91.30% 91.30% -
(Concluded)
Note 1: TCCI, TUI and TID collectively owned 698,752 thousand shares of TWM representing
20.42% of total outstanding shares as of March 31, 2017.
Note 2: The other 70.47% of shares were held under trustee accounts.
c. Subsidiaries excluded from the consolidated financial statements: None.
- 13 -
Employee Benefits
Defined benefit pension cost for an interim period is calculated on a year-to-date basis by using the
actuarially determined pension cost rate at the end of the prior fiscal year.
Income Tax
Income tax expense represents the sum of the tax currently payable and deferred tax. The interim-period
income tax expense is accrued using the tax rate that would be applicable to expected total annual earnings,
that is, the estimated average annual effective income tax rate applied to the profit before tax of the
interim-period.
5. CRITICAL ACCOUNTING JUDGMENTS AND KEY SOURCES OF ESTIMATION
UNCERTAINTY
The same critical accounting judgments and key sources of estimation uncertainty have been followed in
these consolidated financial statements as were applied in the preparation of the consolidated financial
statements for the year ended December 31, 2016.
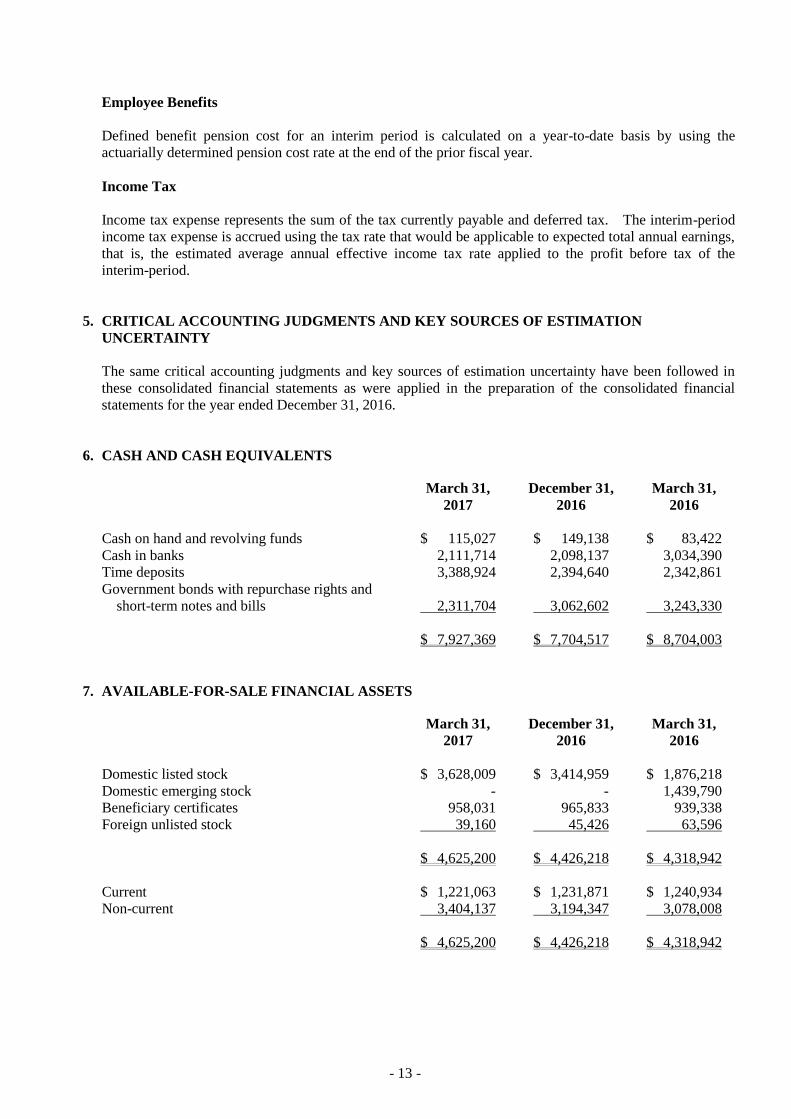
6. CASH AND CASH EQUIVALENTS
March 31,
2017
December 31,
2016
March 31,
2016
Cash on hand and revolving funds $ 115,027 $ 149,138 $ 83,422
Cash in banks 2,111,714 2,098,137 3,034,390
Time deposits 3,388,924 2,394,640 2,342,861
Government bonds with repurchase rights and
short-term notes and bills 2,311,704 3,062,602 3,243,330
$ 7,927,369 $ 7,704,517 $ 8,704,003
7. AVAILABLE-FOR-SALE FINANCIAL ASSETS
March 31,
2017
December 31,
2016
March 31,
2016
Domestic listed stock $ 1,876,218 $ 3,628,009 $ 3,414,959 $ 1,876,218
Domestic emerging stock 1,439,790 - - 1,439,790
Beneficiary certificates 939,338 958,031 965,833 939,338
Foreign unlisted stock 63,596 39,160 45,426 63,596
$ 4,625,200 $ 4,426,218 $ 4,318,942
Current $ 1,221,063 $ 1,231,871 $ 1,240,934
Non-current 3,404,137 3,194,347 3,078,008
$ 4,625,200 $ 4,426,218 $ 4,318,942
- 14 -
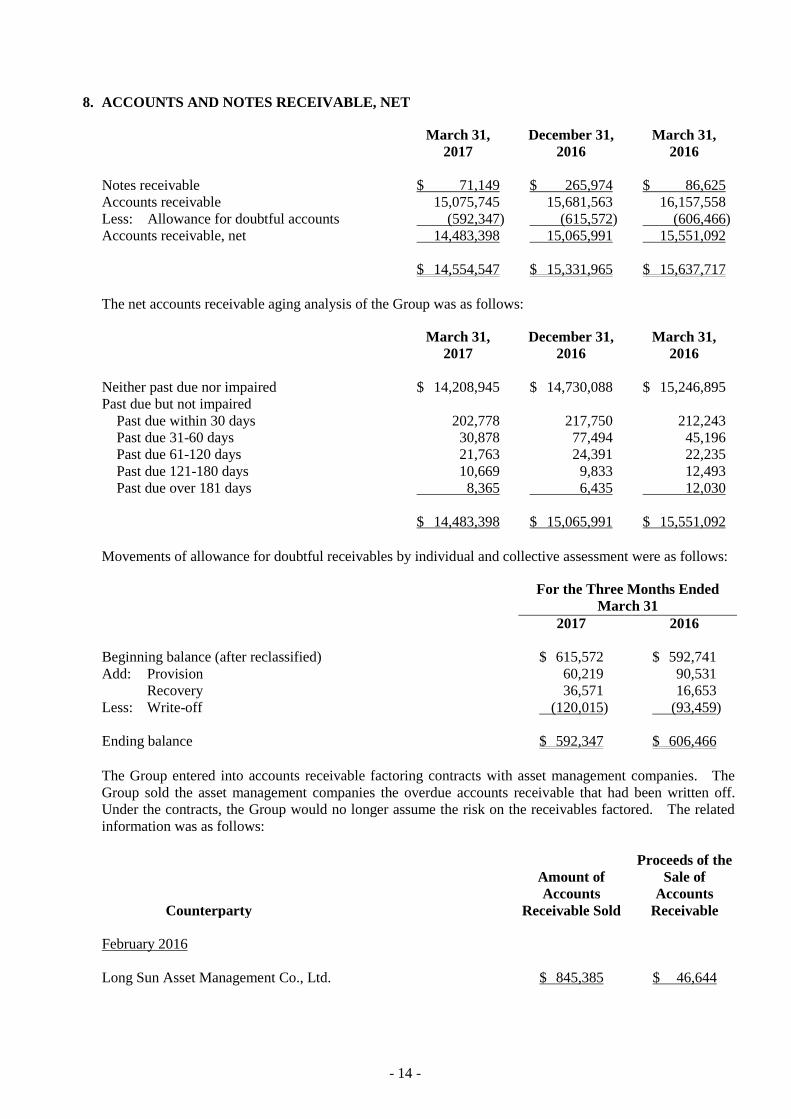
8. ACCOUNTS AND NOTES RECEIVABLE, NET
March 31,
2017
December 31,
2016
March 31,
2016
Notes receivable $ 71,149 $ 265,974 $ 86,625
Accounts receivable 15,075,745 15,681,563 16,157,558
Less: Allowance for doubtful accounts (592,347) (615,572) (606,466)
Accounts receivable, net 14,483,398 15,065,991 15,551,092
$ 14,554,547 $ 15,331,965 $ 15,637,717
The net accounts receivable aging analysis of the Group was as follows:
March 31,
2017
December 31,
2016
March 31,
2016
Neither past due nor impaired $ 14,208,945 $ 14,730,088 $ 15,246,895
Past due but not impaired
Past due within 30 days 202,778 217,750 212,243
Past due 31-60 days 30,878 77,494 45,196
Past due 61-120 days 21,763 24,391 22,235
Past due 121-180 days 10,669 9,833 12,493
Past due over 181 days 8,365 6,435 12,030
$ 14,483,398 $ 15,065,991 $ 15,551,092
Movements of allowance for doubtful receivables by individual and collective assessment were as follows:
For the Three Months Ended
March 31
2017 2016
Beginning balance (after reclassified) $ 615,572 $ 592,741
Add: Provision 60,219 90,531
Recovery 36,571 16,653
Less: Write-off (120,015) (93,459)
Ending balance $ 592,347 $ 606,466
The Group entered into accounts receivable factoring contracts with asset management companies. The
Group sold the asset management companies the overdue accounts receivable that had been written off.
Under the contracts, the Group would no longer assume the risk on the receivables factored. The related
information was as follows:
Counterparty
Amount of
Accounts
Receivable Sold
Proceeds of the
Sale of
Accounts
Receivable
February 2016
Long Sun Asset Management Co., Ltd. $ 845,385 $ 46,644
- 15 -
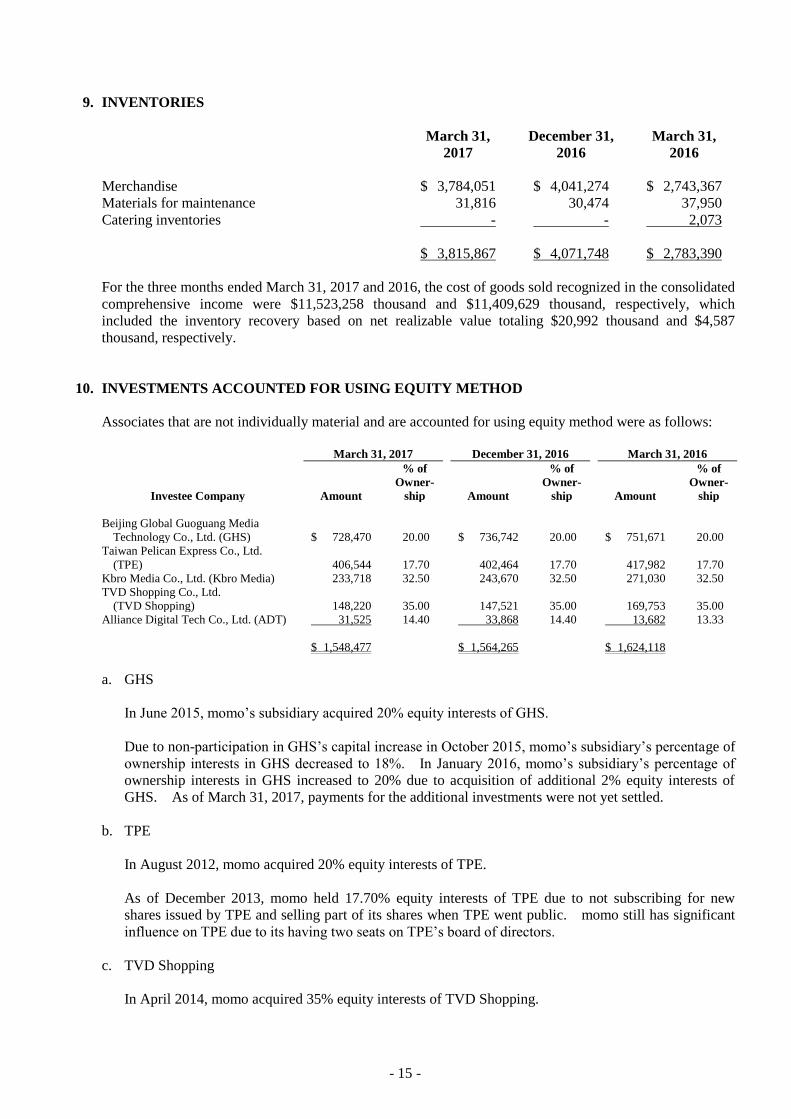
9. INVENTORIES
March 31,
2017
December 31,
2016
March 31,
2016
Merchandise $ 3,784,051 $ 4,041,274 $ 2,743,367
Materials for maintenance 31,816 30,474 37,950
Catering inventories - - 2,073
$ 3,815,867 $ 4,071,748 $ 2,783,390
For the three months ended March 31, 2017 and 2016, the cost of goods sold recognized in the consolidated
comprehensive income were $11,523,258 thousand and $11,409,629 thousand, respectively, which
included the inventory recovery based on net realizable value totaling $20,992 thousand and $4,587
thousand, respectively.
10. INVESTMENTS ACCOUNTED FOR USING EQUITY METHOD
Associates that are not individually material and are accounted for using equity method were as follows:
March 31, 2017 December 31, 2016 March 31, 2016
Investee Company Amount
% of
Owner-
ship Amount
% of
Owner-
ship Amount
% of
Owner-
ship
Beijing Global Guoguang Media
Technology Co., Ltd. (GHS) $ 728,470 20.00 $ 736,742 20.00 $ 751,671 20.00
Taiwan Pelican Express Co., Ltd.
(TPE) 406,544 17.70 402,464 17.70 417,982 17.70
Kbro Media Co., Ltd. (Kbro Media) 233,718 32.50 243,670 32.50 271,030 32.50
TVD Shopping Co., Ltd.
(TVD Shopping) 148,220 35.00 147,521 35.00 169,753 35.00
Alliance Digital Tech Co., Ltd. (ADT) 31,525 14.40 33,868 14.40 13,682 13.33
$ 1,548,477 $ 1,564,265 $ 1,624,118
a. GHS
In June 2015, momo’s subsidiary acquired 20% equity interests of GHS.
Due to non-participation in GHS’s capital increase in October 2015, momo’s subsidiary’s percentage of
ownership interests in GHS decreased to 18%. In January 2016, momo’s subsidiary’s percentage of
ownership interests in GHS increased to 20% due to acquisition of additional 2% equity interests of
GHS. As of March 31, 2017, payments for the additional investments were not yet settled.
b. TPE
In August 2012, momo acquired 20% equity interests of TPE.
As of December 2013, momo held 17.70% equity interests of TPE due to not subscribing for new
shares issued by TPE and selling part of its shares when TPE went public. momo still has significant
influence on TPE due to its having two seats on TPE’s board of directors.
c. TVD Shopping
In April 2014, momo acquired 35% equity interests of TVD Shopping.
- 16 -
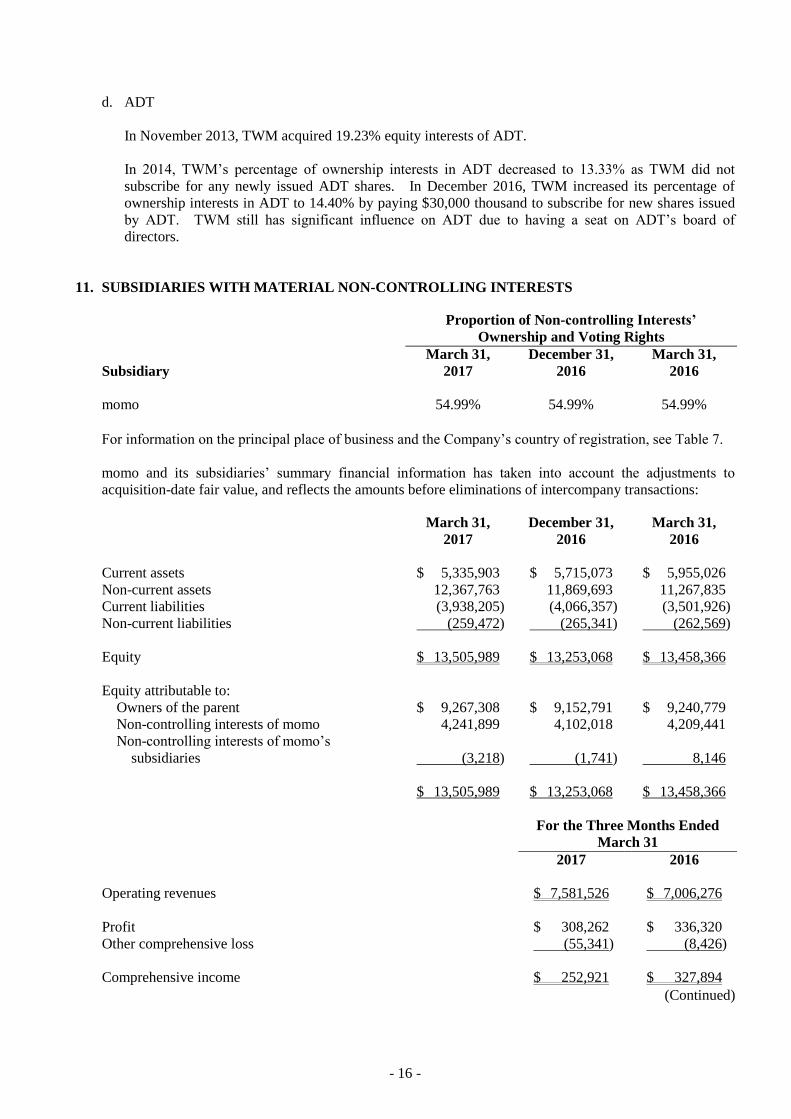
d. ADT
In November 2013, TWM acquired 19.23% equity interests of ADT.
In 2014, TWM’s percentage of ownership interests in ADT decreased to 13.33% as TWM did not
subscribe for any newly issued ADT shares. In December 2016, TWM increased its percentage of
ownership interests in ADT to 14.40% by paying $30,000 thousand to subscribe for new shares issued
by ADT. TWM still has significant influence on ADT due to having a seat on ADT’s board of
directors.
11. SUBSIDIARIES WITH MATERIAL NON-CONTROLLING INTERESTS
Proportion of Non-controlling Interests’
Ownership and Voting Rights
Subsidiary
March 31,
2017
December 31,
2016
March 31,
2016
momo 54.99% 54.99% 54.99%
For information on the principal place of business and the Company’s country of registration, see Table 7.
momo and its subsidiaries’ summary financial information has taken into account the adjustments to
acquisition-date fair value, and reflects the amounts before eliminations of intercompany transactions:
March 31,
2017
December 31,
2016
March 31,
2016
Current assets $ 5,335,903 $ 5,715,073 $ 5,955,026
Non-current assets 12,367,763 11,869,693 11,267,835
Current liabilities (3,938,205) (4,066,357) (3,501,926)
Non-current liabilities (259,472) (265,341) (262,569)
Equity $ 13,505,989 $ 13,253,068 $ 13,458,366
Equity attributable to:
Owners of the parent $ 9,267,308 $ 9,152,791 $ 9,240,779
Non-controlling interests of momo 4,241,899 4,102,018 4,209,441
Non-controlling interests of momo’s
subsidiaries (3,218) (1,741) 8,146
$ 13,505,989 $ 13,253,068 $ 13,458,366
For the Three Months Ended
March 31
2017 2016
Operating revenues $ 7,581,526 $ 7,006,276
Profit $ 308,262 $ 336,320
Other comprehensive loss (55,341) (8,426)
Comprehensive income $ 252,921 $ 327,894
(Continued)
- 17 -
For the Three Months Ended
March 31
2017 2016
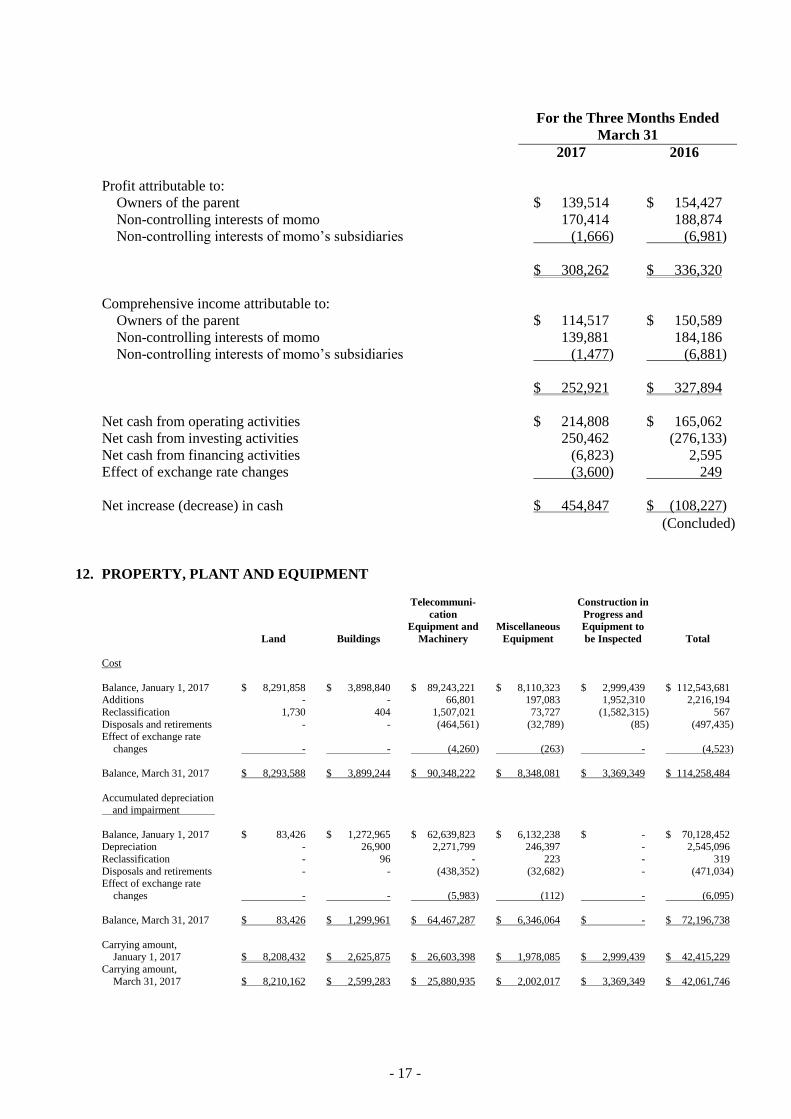
Profit attributable to:
Owners of the parent $ 139,514 $ 154,427
Non-controlling interests of momo 170,414 188,874
Non-controlling interests of momo’s subsidiaries (1,666) (6,981)
$ 308,262 $ 336,320
Comprehensive income attributable to:
Owners of the parent $ 114,517 $ 150,589
Non-controlling interests of momo 139,881 184,186
Non-controlling interests of momo’s subsidiaries (1,477) (6,881)
$ 252,921 $ 327,894
Net cash from operating activities $ 214,808 $ 165,062
Net cash from investing activities 250,462 (276,133)
Net cash from financing activities (6,823) 2,595
Effect of exchange rate changes (3,600) 249
Net increase (decrease) in cash $ 454,847 $ (108,227)
(Concluded)
12. PROPERTY, PLANT AND EQUIPMENT
Land Buildings
Telecommuni-
cation
Equipment and
Machinery
Miscellaneous
Equipment
Construction in
Progress and
Equipment to
be Inspected Total
Cost
Balance, January 1, 2017 $ 8,291,858 $ 3,898,840 $ 89,243,221 $ 8,110,323 $ 2,999,439 $ 112,543,681 Additions - - 66,801 197,083 1,952,310 2,216,194
Reclassification 1,730 404 1,507,021 73,727 (1,582,315 ) 567
Disposals and retirements - - (464,561 ) (32,789 ) (85 ) (497,435 ) Effect of exchange rate
changes - - (4,260 ) (263 ) - (4,523 )
Balance, March 31, 2017 $ 8,293,588 $ 3,899,244 $ 90,348,222 $ 8,348,081 $ 3,369,349 $ 114,258,484
Accumulated depreciation and impairment
Balance, January 1, 2017 $ 83,426 $ 1,272,965 $ 62,639,823 $ 6,132,238 $ - $ 70,128,452 Depreciation - 26,900 2,271,799 246,397 - 2,545,096
Reclassification - 96 - 223 - 319
Disposals and retirements - - (438,352 ) (32,682 ) - (471,034 ) Effect of exchange rate
changes - - (5,983 ) (112 ) - (6,095 )
Balance, March 31, 2017 $ 83,426 $ 1,299,961 $ 64,467,287 $ 6,346,064 $ - $ 72,196,738
Carrying amount, January 1, 2017 $ 8,208,432 $ 2,625,875 $ 26,603,398 $ 1,978,085 $ 2,999,439 $ 42,415,229
Carrying amount,
March 31, 2017 $ 8,210,162 $ 2,599,283 $ 25,880,935 $ 2,002,017 $ 3,369,349 $ 42,061,746
- 18 -
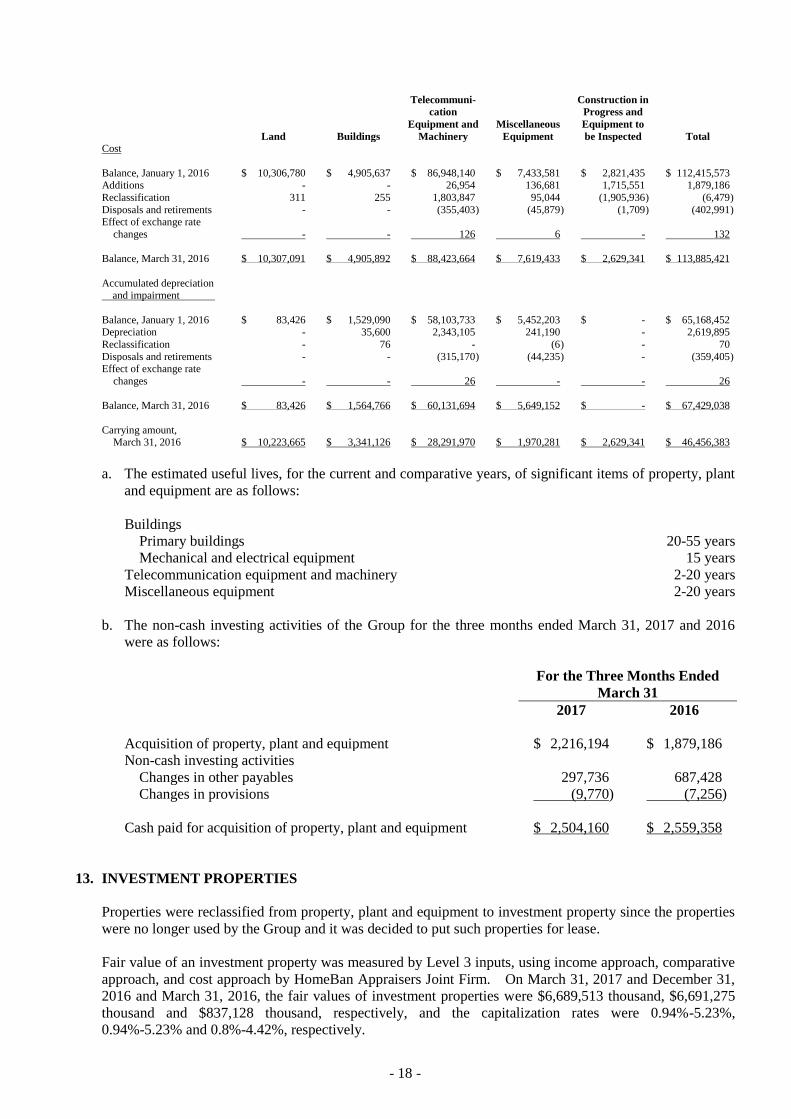
Land Buildings
Telecommuni-
cation
Equipment and
Machinery
Miscellaneous
Equipment
Construction in
Progress and
Equipment to
be Inspected Total
Cost
Balance, January 1, 2016 $ 10,306,780 $ 4,905,637 $ 86,948,140 $ 7,433,581 $ 2,821,435 $ 112,415,573 Additions - - 26,954 136,681 1,715,551 1,879,186
Reclassification 311 255 1,803,847 95,044 (1,905,936 ) (6,479 )
Disposals and retirements - - (355,403 ) (45,879 ) (1,709 ) (402,991 ) Effect of exchange rate
changes - - 126 6 - 132
Balance, March 31, 2016 $ 10,307,091 $ 4,905,892 $ 88,423,664 $ 7,619,433 $ 2,629,341 $ 113,885,421
Accumulated depreciation and impairment
Balance, January 1, 2016 $ 83,426 $ 1,529,090 $ 58,103,733 $ 5,452,203 $ - $ 65,168,452 Depreciation - 35,600 2,343,105 241,190 - 2,619,895
Reclassification - 76 - (6 ) - 70
Disposals and retirements - - (315,170 ) (44,235 ) - (359,405 ) Effect of exchange rate
changes - - 26 - - 26
Balance, March 31, 2016 $ 83,426 $ 1,564,766 $ 60,131,694 $ 5,649,152 $ - $ 67,429,038
Carrying amount, March 31, 2016 $ 10,223,665 $ 3,341,126 $ 28,291,970 $ 1,970,281 $ 2,629,341 $ 46,456,383
a. The estimated useful lives, for the current and comparative years, of significant items of property, plant
and equipment are as follows:
Buildings
Primary buildings 20-55 years
Mechanical and electrical equipment 15 years
Telecommunication equipment and machinery 2-20 years
Miscellaneous equipment 2-20 years
b. The non-cash investing activities of the Group for the three months ended March 31, 2017 and 2016
were as follows:
For the Three Months Ended
March 31
2017 2016
Acquisition of property, plant and equipment $ 2,216,194 $ 1,879,186
Non-cash investing activities
Changes in other payables 297,736 687,428
Changes in provisions (9,770) (7,256)
Cash paid for acquisition of property, plant and equipment $ 2,504,160 $ 2,559,358
13. INVESTMENT PROPERTIES
Properties were reclassified from property, plant and equipment to investment property since the properties
were no longer used by the Group and it was decided to put such properties for lease.
Fair value of an investment property was measured by Level 3 inputs, using income approach, comparative
approach, and cost approach by HomeBan Appraisers Joint Firm. On March 31, 2017 and December 31,
2016 and March 31, 2016, the fair values of investment properties were $6,689,513 thousand, $6,691,275
thousand and $837,128 thousand, respectively, and the capitalization rates were 0.94%-5.23%,
0.94%-5.23% and 0.8%-4.42%, respectively.
- 19 -
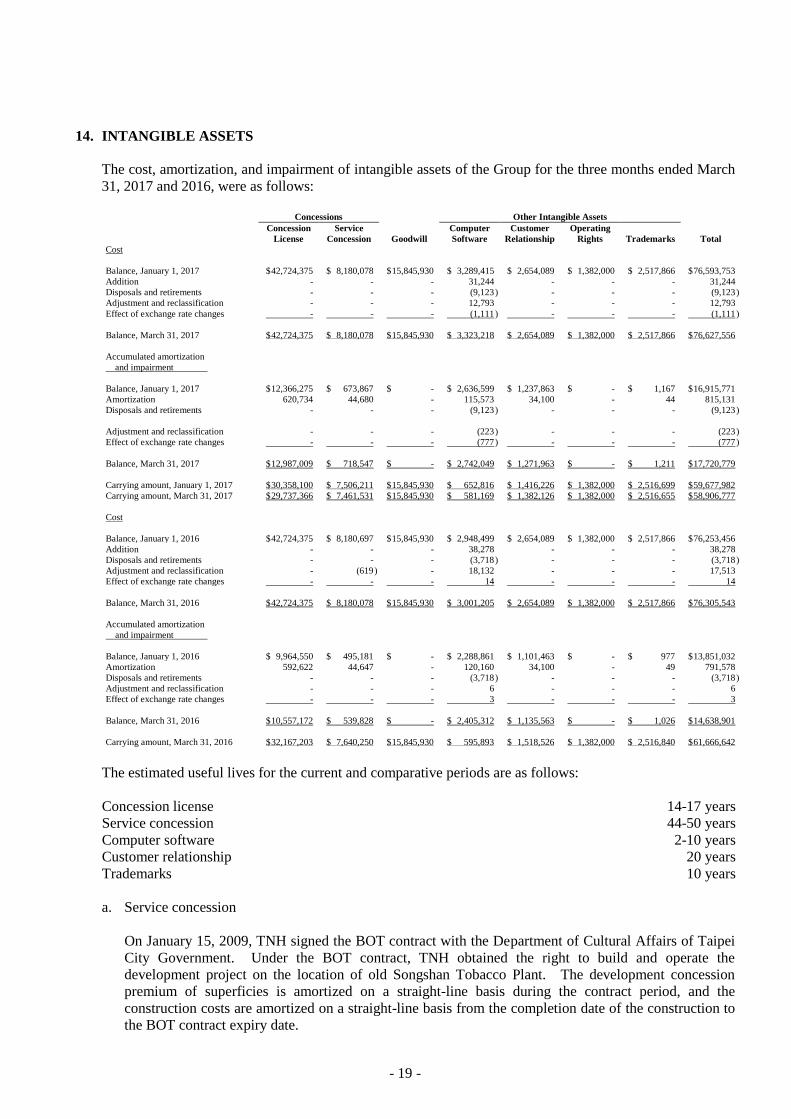
14. INTANGIBLE ASSETS
The cost, amortization, and impairment of intangible assets of the Group for the three months ended March
31, 2017 and 2016, were as follows:
Concessions Other Intangible Assets
Concession
License
Service
Concession Goodwill
Computer
Software
Customer
Relationship
Operating
Rights Trademarks Total
Cost
Balance, January 1, 2017 $ 42,724,375 $ 8,180,078 $ 15,845,930 $ 3,289,415 $ 2,654,089 $ 1,382,000 $ 2,517,866 $ 76,593,753
Addition - - - 31,244 - - - 31,244
Disposals and retirements - - - (9,123 ) - - - (9,123 )
Adjustment and reclassification - - - 12,793 - - - 12,793
Effect of exchange rate changes - - - (1,111 ) - - - (1,111 )
Balance, March 31, 2017 $ 42,724,375 $ 8,180,078 $ 15,845,930 $ 3,323,218 $ 2,654,089 $ 1,382,000 $ 2,517,866 $ 76,627,556
Accumulated amortization
and impairment
Balance, January 1, 2017 $ 12,366,275 $ 673,867 $ - $ 2,636,599 $ 1,237,863 $ - $ 1,167 $ 16,915,771
Amortization 620,734 44,680 - 115,573 34,100 - 44 815,131
Disposals and retirements - - - (9,123 ) - - - (9,123 )
Adjustment and reclassification - - - (223 ) - - - (223 )
Effect of exchange rate changes - - - (777 ) - - - (777 )
Balance, March 31, 2017 $ 12,987,009 $ 718,547 $ - $ 2,742,049 $ 1,271,963 $ - $ 1,211 $ 17,720,779
Carrying amount, January 1, 2017 $ 30,358,100 $ 7,506,211 $ 15,845,930 $ 652,816 $ 1,416,226 $ 1,382,000 $ 2,516,699 $ 59,677,982
Carrying amount, March 31, 2017 $ 29,737,366 $ 7,461,531 $ 15,845,930 $ 581,169 $ 1,382,126 $ 1,382,000 $ 2,516,655 $ 58,906,777
Cost
Balance, January 1, 2016 $ 42,724,375 $ 8,180,697 $ 15,845,930 $ 2,948,499 $ 2,654,089 $ 1,382,000 $ 2,517,866 $ 76,253,456
Addition - - - 38,278 - - - 38,278
Disposals and retirements - - - (3,718 ) - - - (3,718 )
Adjustment and reclassification - (619 ) - 18,132 - - - 17,513
Effect of exchange rate changes - - - 14 - - - 14
Balance, March 31, 2016 $ 42,724,375 $ 8,180,078 $ 15,845,930 $ 3,001,205 $ 2,654,089 $ 1,382,000 $ 2,517,866 $ 76,305,543
Accumulated amortization
and impairment
Balance, January 1, 2016 $ 9,964,550 $ 495,181 $ - $ 2,288,861 $ 1,101,463 $ - $ 977 $ 13,851,032
Amortization 592,622 44,647 - 120,160 34,100 - 49 791,578
Disposals and retirements - - - (3,718 ) - - - (3,718 )
Adjustment and reclassification - - - 6 - - - 6
Effect of exchange rate changes - - - 3 - - - 3
Balance, March 31, 2016 $ 10,557,172 $ 539,828 $ - $ 2,405,312 $ 1,135,563 $ - $ 1,026 $ 14,638,901
Carrying amount, March 31, 2016 $ 32,167,203 $ 7,640,250 $ 15,845,930 $ 595,893 $ 1,518,526 $ 1,382,000 $ 2,516,840 $ 61,666,642
The estimated useful lives for the current and comparative periods are as follows:
Concession license 14-17 years
Service concession 44-50 years
Computer software 2-10 years
Customer relationship 20 years
Trademarks 10 years
a. Service concession
On January 15, 2009, TNH signed the BOT contract with the Department of Cultural Affairs of Taipei
City Government. Under the BOT contract, TNH obtained the right to build and operate the
development project on the location of old Songshan Tobacco Plant. The development concession
premium of superficies is amortized on a straight-line basis during the contract period, and the
construction costs are amortized on a straight-line basis from the completion date of the construction to
the BOT contract expiry date.
- 20 -
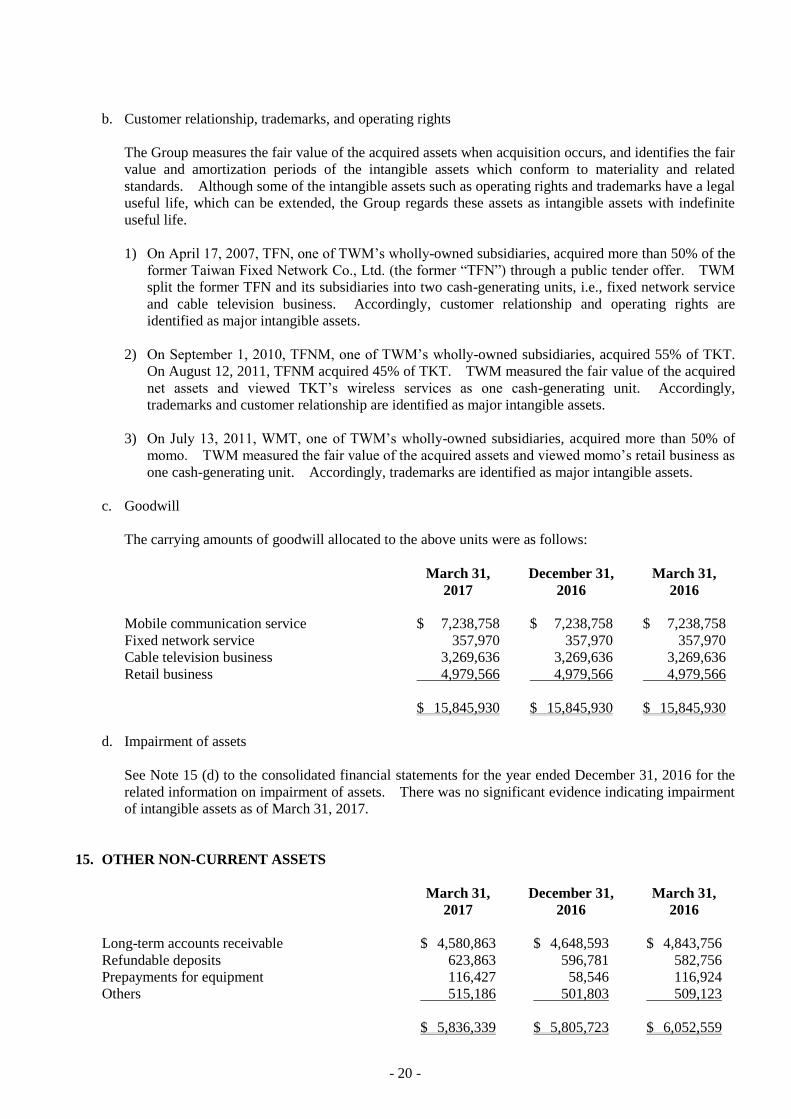
b. Customer relationship, trademarks, and operating rights
The Group measures the fair value of the acquired assets when acquisition occurs, and identifies the fair
value and amortization periods of the intangible assets which conform to materiality and related
standards. Although some of the intangible assets such as operating rights and trademarks have a legal
useful life, which can be extended, the Group regards these assets as intangible assets with indefinite
useful life.
1) On April 17, 2007, TFN, one of TWM’s wholly-owned subsidiaries, acquired more than 50% of the
former Taiwan Fixed Network Co., Ltd. (the former “TFN”) through a public tender offer. TWM
split the former TFN and its subsidiaries into two cash-generating units, i.e., fixed network service
and cable television business. Accordingly, customer relationship and operating rights are
identified as major intangible assets.
2) On September 1, 2010, TFNM, one of TWM’s wholly-owned subsidiaries, acquired 55% of TKT.
On August 12, 2011, TFNM acquired 45% of TKT. TWM measured the fair value of the acquired
net assets and viewed TKT’s wireless services as one cash-generating unit. Accordingly,
trademarks and customer relationship are identified as major intangible assets.
3) On July 13, 2011, WMT, one of TWM’s wholly-owned subsidiaries, acquired more than 50% of
momo. TWM measured the fair value of the acquired assets and viewed momo’s retail business as
one cash-generating unit. Accordingly, trademarks are identified as major intangible assets.
c. Goodwill
The carrying amounts of goodwill allocated to the above units were as follows:
March 31,
2017
December 31,
2016
March 31,
2016
Mobile communication service $ 7,238,758 $ 7,238,758 $ 7,238,758
Fixed network service 357,970 357,970 357,970
Cable television business 3,269,636 3,269,636 3,269,636
Retail business 4,979,566 4,979,566 4,979,566
$ 15,845,930 $ 15,845,930 $ 15,845,930
d. Impairment of assets
See Note 15 (d) to the consolidated financial statements for the year ended December 31, 2016 for the
related information on impairment of assets. There was no significant evidence indicating impairment
of intangible assets as of March 31, 2017.
15. OTHER NON-CURRENT ASSETS
March 31,
2017
December 31,
2016
March 31,
2016
Long-term accounts receivable $ 4,580,863 $ 4,648,593 $ 4,843,756
Refundable deposits 623,863 596,781 582,756
Prepayments for equipment 116,427 58,546 116,924
Others 515,186 501,803 509,123
$ 5,836,339 $ 5,805,723 $ 6,052,559
- 21 -
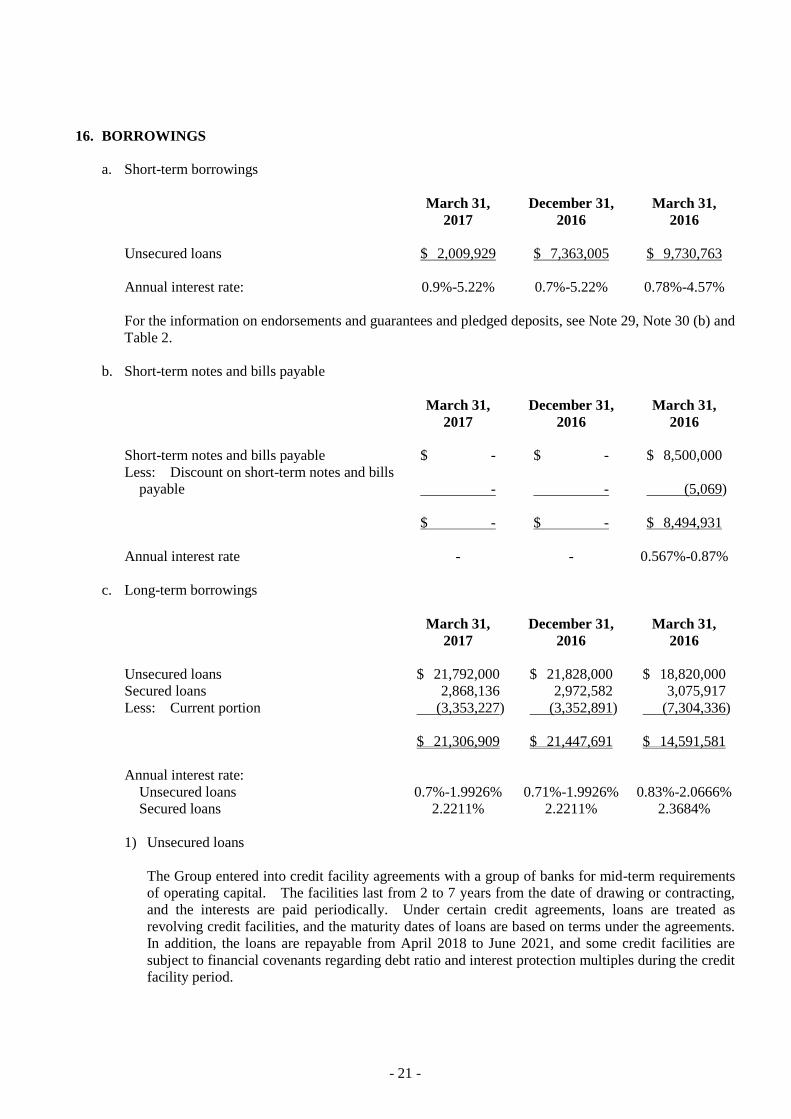
16. BORROWINGS
a. Short-term borrowings
March 31,
2017
December 31,
2016
March 31,
2016
Unsecured loans $ 2,009,929 $ 7,363,005 $ 9,730,763
Annual interest rate: 0.9%-5.22% 0.7%-5.22% 0.78%-4.57%
For the information on endorsements and guarantees and pledged deposits, see Note 29, Note 30 (b) and
Table 2.
b. Short-term notes and bills payable
March 31,
2017
December 31,
2016
March 31,
2016
Short-term notes and bills payable $ - $ - $ 8,500,000
Less: Discount on short-term notes and bills
payable - - (5,069)
$ - $ - $ 8,494,931
Annual interest rate - - 0.567%-0.87%
c. Long-term borrowings
March 31,
2017
December 31,
2016
March 31,
2016
Unsecured loans $ 21,792,000 $ 21,828,000 $ 18,820,000
Secured loans 2,868,136 2,972,582 3,075,917
Less: Current portion (3,353,227) (3,352,891) (7,304,336)
$ 21,306,909 $ 21,447,691 $ 14,591,581
Annual interest rate:
Unsecured loans 0.7%-1.9926% 0.71%-1.9926% 0.83%-2.0666%
Secured loans 2.2211% 2.2211% 2.3684%
1) Unsecured loans
The Group entered into credit facility agreements with a group of banks for mid-term requirements
of operating capital. The facilities last from 2 to 7 years from the date of drawing or contracting,
and the interests are paid periodically. Under certain credit agreements, loans are treated as
revolving credit facilities, and the maturity dates of loans are based on terms under the agreements.
In addition, the loans are repayable from April 2018 to June 2021, and some credit facilities are
subject to financial covenants regarding debt ratio and interest protection multiples during the credit
facility period.
- 22 -
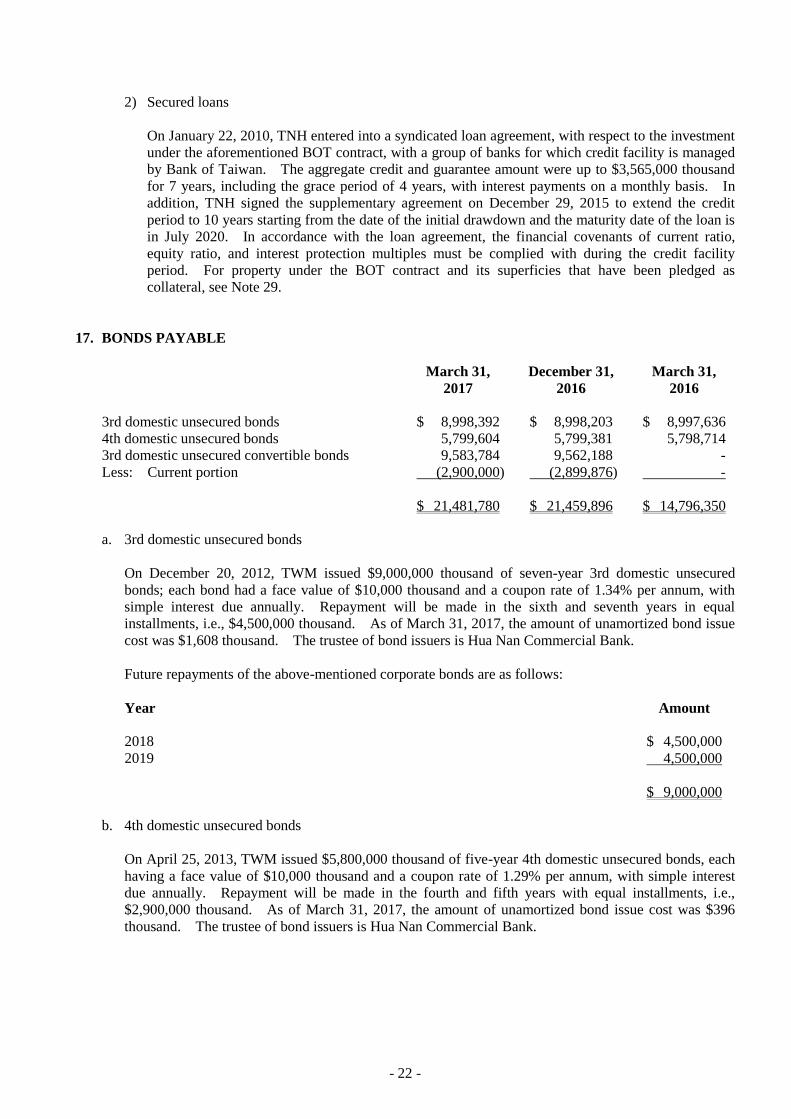
2) Secured loans
On January 22, 2010, TNH entered into a syndicated loan agreement, with respect to the investment
under the aforementioned BOT contract, with a group of banks for which credit facility is managed
by Bank of Taiwan. The aggregate credit and guarantee amount were up to $3,565,000 thousand
for 7 years, including the grace period of 4 years, with interest payments on a monthly basis. In
addition, TNH signed the supplementary agreement on December 29, 2015 to extend the credit
period to 10 years starting from the date of the initial drawdown and the maturity date of the loan is
in July 2020. In accordance with the loan agreement, the financial covenants of current ratio,
equity ratio, and interest protection multiples must be complied with during the credit facility
period. For property under the BOT contract and its superficies that have been pledged as
collateral, see Note 29.
17. BONDS PAYABLE
March 31,
2017
December 31,
2016
March 31,
2016
3rd domestic unsecured bonds $ 8,998,392 $ 8,998,203 $ 8,997,636
4th domestic unsecured bonds 5,799,604 5,799,381 5,798,714
3rd domestic unsecured convertible bonds 9,583,784 9,562,188 -
Less: Current portion (2,900,000) (2,899,876) -
$ 21,481,780 $ 21,459,896 $ 14,796,350
a. 3rd domestic unsecured bonds
On December 20, 2012, TWM issued $9,000,000 thousand of seven-year 3rd domestic unsecured
bonds; each bond had a face value of $10,000 thousand and a coupon rate of 1.34% per annum, with
simple interest due annually. Repayment will be made in the sixth and seventh years in equal
installments, i.e., $4,500,000 thousand. As of March 31, 2017, the amount of unamortized bond issue
cost was $1,608 thousand. The trustee of bond issuers is Hua Nan Commercial Bank.
Future repayments of the above-mentioned corporate bonds are as follows:
Year Amount
2018 $ 4,500,000
2019 4,500,000
$ 9,000,000
b. 4th domestic unsecured bonds
On April 25, 2013, TWM issued $5,800,000 thousand of five-year 4th domestic unsecured bonds, each
having a face value of $10,000 thousand and a coupon rate of 1.29% per annum, with simple interest
due annually. Repayment will be made in the fourth and fifth years with equal installments, i.e.,
$2,900,000 thousand. As of March 31, 2017, the amount of unamortized bond issue cost was $396
thousand. The trustee of bond issuers is Hua Nan Commercial Bank.
- 23 -
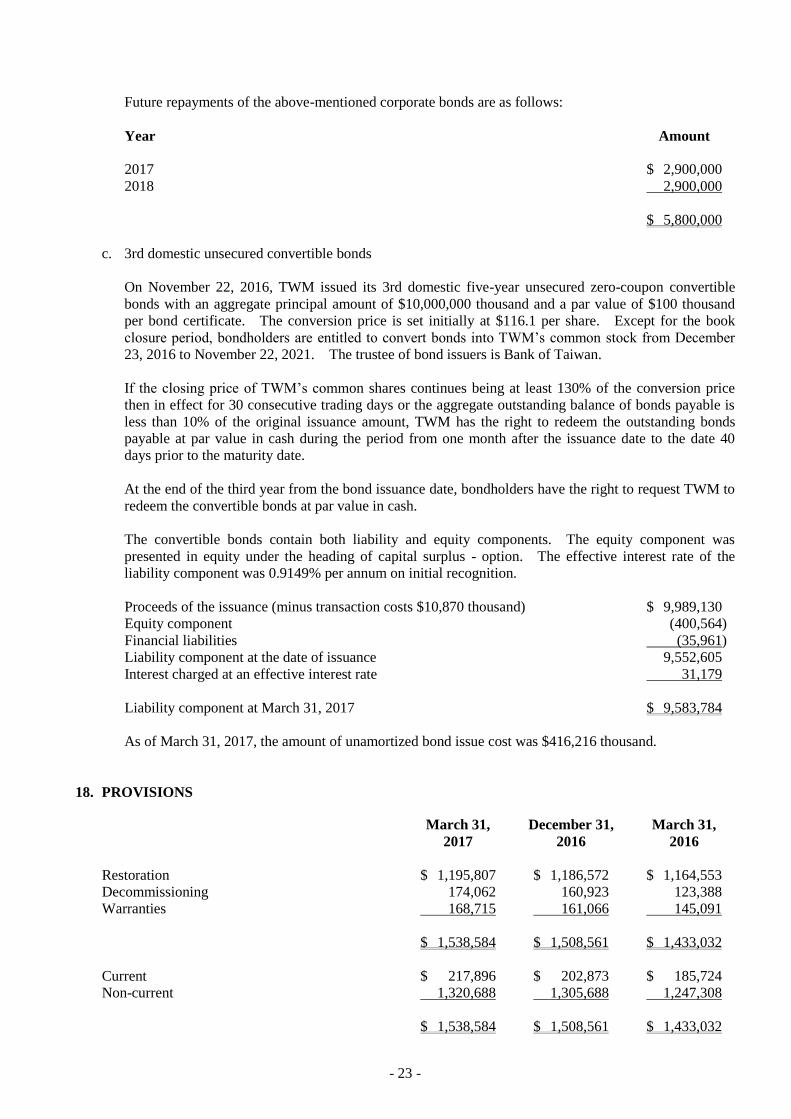
Future repayments of the above-mentioned corporate bonds are as follows:
Year Amount
2017 $ 2,900,000
2018 2,900,000
$ 5,800,000
c. 3rd domestic unsecured convertible bonds
On November 22, 2016, TWM issued its 3rd domestic five-year unsecured zero-coupon convertible
bonds with an aggregate principal amount of $10,000,000 thousand and a par value of $100 thousand
per bond certificate. The conversion price is set initially at $116.1 per share. Except for the book
closure period, bondholders are entitled to convert bonds into TWM’s common stock from December
23, 2016 to November 22, 2021. The trustee of bond issuers is Bank of Taiwan.
If the closing price of TWM’s common shares continues being at least 130% of the conversion price
then in effect for 30 consecutive trading days or the aggregate outstanding balance of bonds payable is
less than 10% of the original issuance amount, TWM has the right to redeem the outstanding bonds
payable at par value in cash during the period from one month after the issuance date to the date 40
days prior to the maturity date.
At the end of the third year from the bond issuance date, bondholders have the right to request TWM to
redeem the convertible bonds at par value in cash.
The convertible bonds contain both liability and equity components. The equity component was
presented in equity under the heading of capital surplus - option. The effective interest rate of the
liability component was 0.9149% per annum on initial recognition.
Proceeds of the issuance (minus transaction costs $10,870 thousand) $ 9,989,130
Equity component (400,564)
Financial liabilities (35,961)
Liability component at the date of issuance 9,552,605
Interest charged at an effective interest rate 31,179
Liability component at March 31, 2017 $ 9,583,784
As of March 31, 2017, the amount of unamortized bond issue cost was $416,216 thousand.
18. PROVISIONS
March 31,
2017
December 31,
2016
March 31,
2016
Restoration $ 1,195,807 $ 1,186,572 $ 1,164,553
Decommissioning 174,062 160,923 123,388
Warranties 168,715 161,066 145,091
$ 1,538,584 $ 1,508,561 $ 1,433,032
Current $ 217,896 $ 202,873 $ 185,724
Non-current 1,320,688 1,305,688 1,247,308
$ 1,538,584 $ 1,508,561 $ 1,433,032
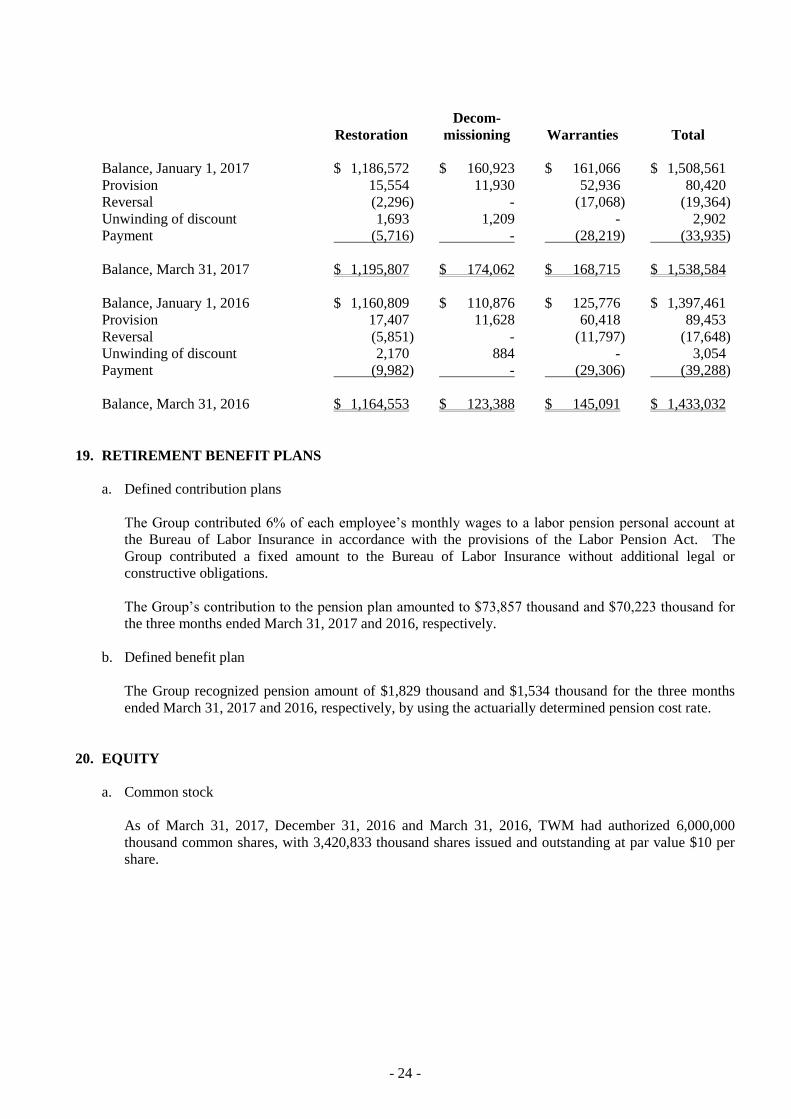
- 24 -
Restoration
Decom-
missioning Warranties Total
Balance, January 1, 2017 $ 1,186,572 $ 160,923 $ 161,066 $ 1,508,561
Provision 15,554 11,930 52,936 80,420
Reversal (2,296) - (17,068) (19,364)
Unwinding of discount 1,693 1,209 - 2,902
Payment (5,716) - (28,219) (33,935)
Balance, March 31, 2017 $ 1,195,807 $ 174,062 $ 168,715 $ 1,538,584
Balance, January 1, 2016 $ 1,160,809 $ 110,876 $ 125,776 $ 1,397,461
Provision 17,407 11,628 60,418 89,453
Reversal (5,851) - (11,797) (17,648)
Unwinding of discount 2,170 884 - 3,054
Payment (9,982) - (29,306) (39,288)
Balance, March 31, 2016 $ 1,164,553 $ 123,388 $ 145,091 $ 1,433,032
19. RETIREMENT BENEFIT PLANS
a. Defined contribution plans
The Group contributed 6% of each employee’s monthly wages to a labor pension personal account at
the Bureau of Labor Insurance in accordance with the provisions of the Labor Pension Act. The
Group contributed a fixed amount to the Bureau of Labor Insurance without additional legal or
constructive obligations.
The Group’s contribution to the pension plan amounted to $73,857 thousand and $70,223 thousand for
the three months ended March 31, 2017 and 2016, respectively.
b. Defined benefit plan
The Group recognized pension amount of $1,829 thousand and $1,534 thousand for the three months
ended March 31, 2017 and 2016, respectively, by using the actuarially determined pension cost rate.
20. EQUITY
a. Common stock
As of March 31, 2017, December 31, 2016 and March 31, 2016, TWM had authorized 6,000,000
thousand common shares, with 3,420,833 thousand shares issued and outstanding at par value $10 per
share.
- 25 -
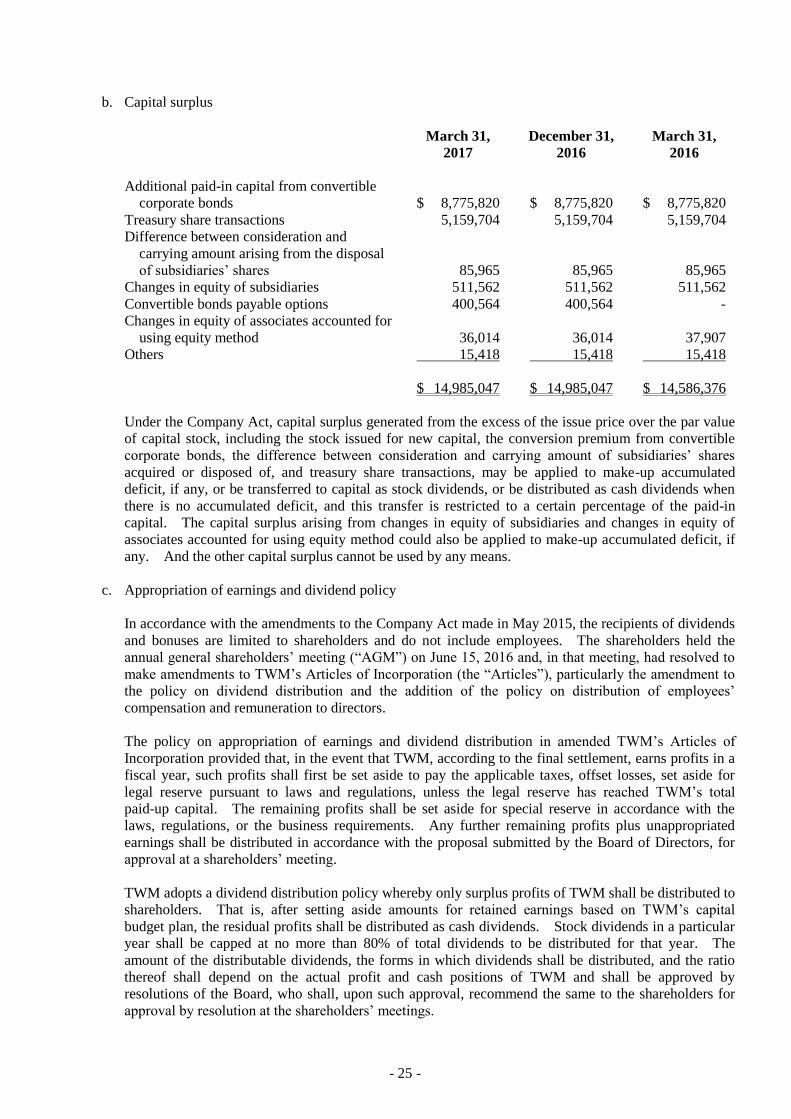
b. Capital surplus
March 31,
2017
December 31,
2016
March 31,
2016
Additional paid-in capital from convertible
corporate bonds $ 8,775,820 $ 8,775,820 $ 8,775,820
Treasury share transactions 5,159,704 5,159,704 5,159,704
Difference between consideration and
carrying amount arising from the disposal
of subsidiaries’ shares 85,965 85,965 85,965
Changes in equity of subsidiaries 511,562 511,562 511,562
Convertible bonds payable options 400,564 400,564 -
Changes in equity of associates accounted for
using equity method 36,014 36,014 37,907
Others 15,418 15,418 15,418
$ 14,985,047 $ 14,985,047 $ 14,586,376
Under the Company Act, capital surplus generated from the excess of the issue price over the par value
of capital stock, including the stock issued for new capital, the conversion premium from convertible
corporate bonds, the difference between consideration and carrying amount of subsidiaries’ shares
acquired or disposed of, and treasury share transactions, may be applied to make-up accumulated
deficit, if any, or be transferred to capital as stock dividends, or be distributed as cash dividends when
there is no accumulated deficit, and this transfer is restricted to a certain percentage of the paid-in
capital. The capital surplus arising from changes in equity of subsidiaries and changes in equity of
associates accounted for using equity method could also be applied to make-up accumulated deficit, if
any. And the other capital surplus cannot be used by any means.
c. Appropriation of earnings and dividend policy
In accordance with the amendments to the Company Act made in May 2015, the recipients of dividends
and bonuses are limited to shareholders and do not include employees. The shareholders held the
annual general shareholders’ meeting (“AGM”) on June 15, 2016 and, in that meeting, had resolved to
make amendments to TWM’s Articles of Incorporation (the “Articles”), particularly the amendment to
the policy on dividend distribution and the addition of the policy on distribution of employees’
compensation and remuneration to directors.
The policy on appropriation of earnings and dividend distribution in amended TWM’s Articles of
Incorporation provided that, in the event that TWM, according to the final settlement, earns profits in a
fiscal year, such profits shall first be set aside to pay the applicable taxes, offset losses, set aside for
legal reserve pursuant to laws and regulations, unless the legal reserve has reached TWM’s total
paid-up capital. The remaining profits shall be set aside for special reserve in accordance with the
laws, regulations, or the business requirements. Any further remaining profits plus unappropriated
earnings shall be distributed in accordance with the proposal submitted by the Board of Directors, for
approval at a shareholders’ meeting.
TWM adopts a dividend distribution policy whereby only surplus profits of TWM shall be distributed to
shareholders. That is, after setting aside amounts for retained earnings based on TWM’s capital
budget plan, the residual profits shall be distributed as cash dividends. Stock dividends in a particular
year shall be capped at no more than 80% of total dividends to be distributed for that year. The
amount of the distributable dividends, the forms in which dividends shall be distributed, and the ratio
thereof shall depend on the actual profit and cash positions of TWM and shall be approved by
resolutions of the Board, who shall, upon such approval, recommend the same to the shareholders for
approval by resolution at the shareholders’ meetings.
- 26 -
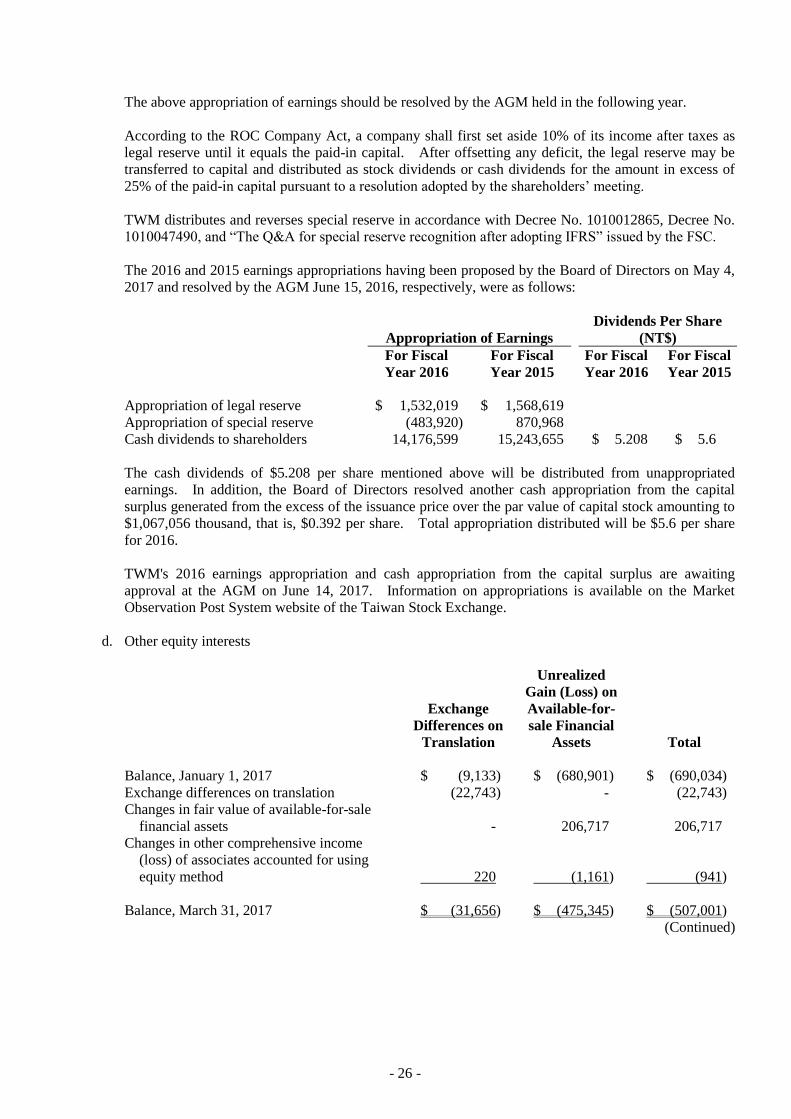
The above appropriation of earnings should be resolved by the AGM held in the following year.
According to the ROC Company Act, a company shall first set aside 10% of its income after taxes as
legal reserve until it equals the paid-in capital. After offsetting any deficit, the legal reserve may be
transferred to capital and distributed as stock dividends or cash dividends for the amount in excess of
25% of the paid-in capital pursuant to a resolution adopted by the shareholders’ meeting.
TWM distributes and reverses special reserve in accordance with Decree No. 1010012865, Decree No.
1010047490, and “The Q&A for special reserve recognition after adopting IFRS” issued by the FSC.
The 2016 and 2015 earnings appropriations having been proposed by the Board of Directors on May 4,
2017 and resolved by the AGM June 15, 2016, respectively, were as follows:
Appropriation of Earnings
Dividends Per Share
(NT$)
For Fiscal
Year 2016
For Fiscal
Year 2015
For Fiscal
Year 2016
For Fiscal
Year 2015
Appropriation of legal reserve $ 1,532,019 $ 1,568,619
Appropriation of special reserve (483,920) 870,968
Cash dividends to shareholders 14,176,599 15,243,655 $ 5.208 $ 5.6
The cash dividends of $5.208 per share mentioned above will be distributed from unappropriated
earnings. In addition, the Board of Directors resolved another cash appropriation from the capital
surplus generated from the excess of the issuance price over the par value of capital stock amounting to
$1,067,056 thousand, that is, $0.392 per share. Total appropriation distributed will be $5.6 per share
for 2016.
TWM's 2016 earnings appropriation and cash appropriation from the capital surplus are awaiting
approval at the AGM on June 14, 2017. Information on appropriations is available on the Market
Observation Post System website of the Taiwan Stock Exchange.
d. Other equity interests
Exchange
Differences on
Translation
Unrealized
Gain (Loss) on
Available-for-
sale Financial
Assets Total
Balance, January 1, 2017 $ (9,133) $ (680,901) $ (690,034)
Exchange differences on translation (22,743) - (22,743)
Changes in fair value of available-for-sale
financial assets - 206,717 206,717
Changes in other comprehensive income
(loss) of associates accounted for using
equity method 220 (1,161) (941)
Balance, March 31, 2017 $ (31,656) $ (475,345) $ (507,001)
(Continued)
- 27 -
Exchange
Differences on
Translation
Unrealized
Gain (Loss) on
Available-for-
sale Financial
Assets Total
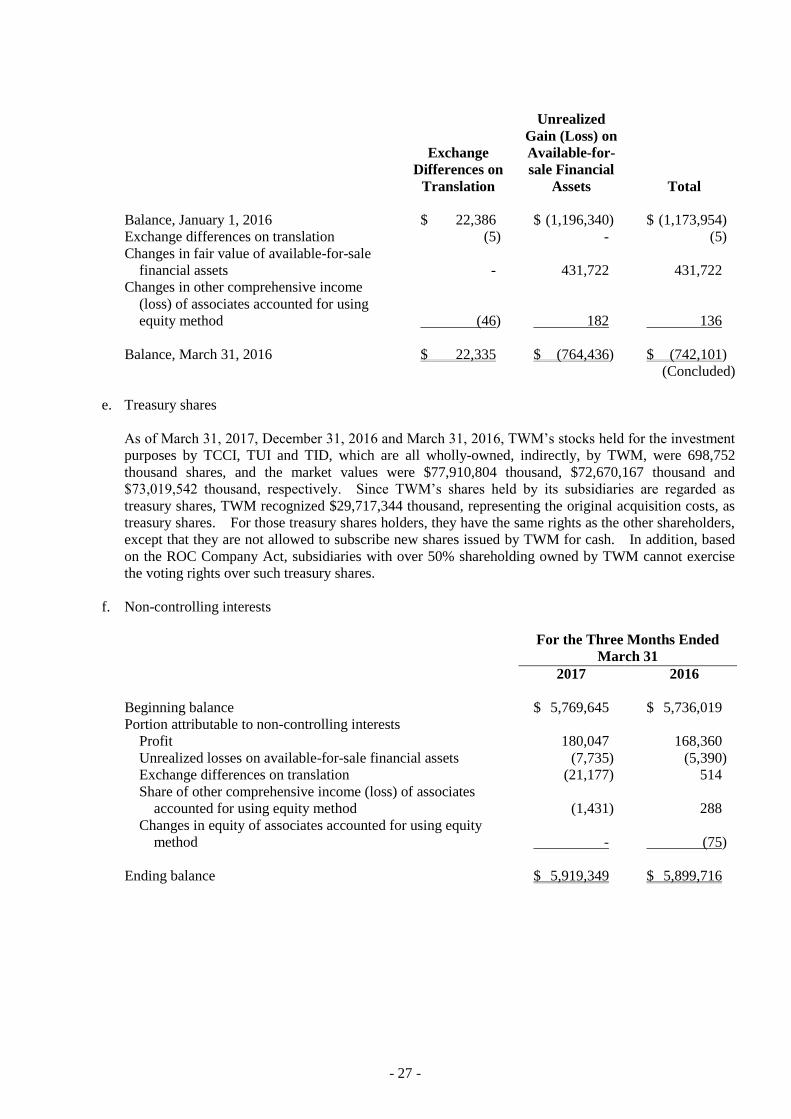
Balance, January 1, 2016 $ 22,386 $ (1,196,340) $ (1,173,954)
Exchange differences on translation (5) - (5)
Changes in fair value of available-for-sale
financial assets - 431,722 431,722
Changes in other comprehensive income
(loss) of associates accounted for using
equity method (46) 182 136
Balance, March 31, 2016 $ 22,335 $ (764,436) $ (742,101)
(Concluded)
e. Treasury shares
As of March 31, 2017, December 31, 2016 and March 31, 2016, TWM’s stocks held for the investment
purposes by TCCI, TUI and TID, which are all wholly-owned, indirectly, by TWM, were 698,752
thousand shares, and the market values were $77,910,804 thousand, $72,670,167 thousand and
$73,019,542 thousand, respectively. Since TWM’s shares held by its subsidiaries are regarded as
treasury shares, TWM recognized $29,717,344 thousand, representing the original acquisition costs, as
treasury shares. For those treasury shares holders, they have the same rights as the other shareholders,
except that they are not allowed to subscribe new shares issued by TWM for cash. In addition, based
on the ROC Company Act, subsidiaries with over 50% shareholding owned by TWM cannot exercise
the voting rights over such treasury shares.
f. Non-controlling interests
For the Three Months Ended
March 31
2017 2016
Beginning balance $ 5,769,645 $ 5,736,019
Portion attributable to non-controlling interests
Profit 180,047 168,360
Unrealized losses on available-for-sale financial assets (7,735) (5,390)
Exchange differences on translation (21,177) 514
Share of other comprehensive income (loss) of associates
accounted for using equity method (1,431) 288
Changes in equity of associates accounted for using equity
method - (75)
Ending balance $ 5,919,349 $ 5,899,716
- 28 -
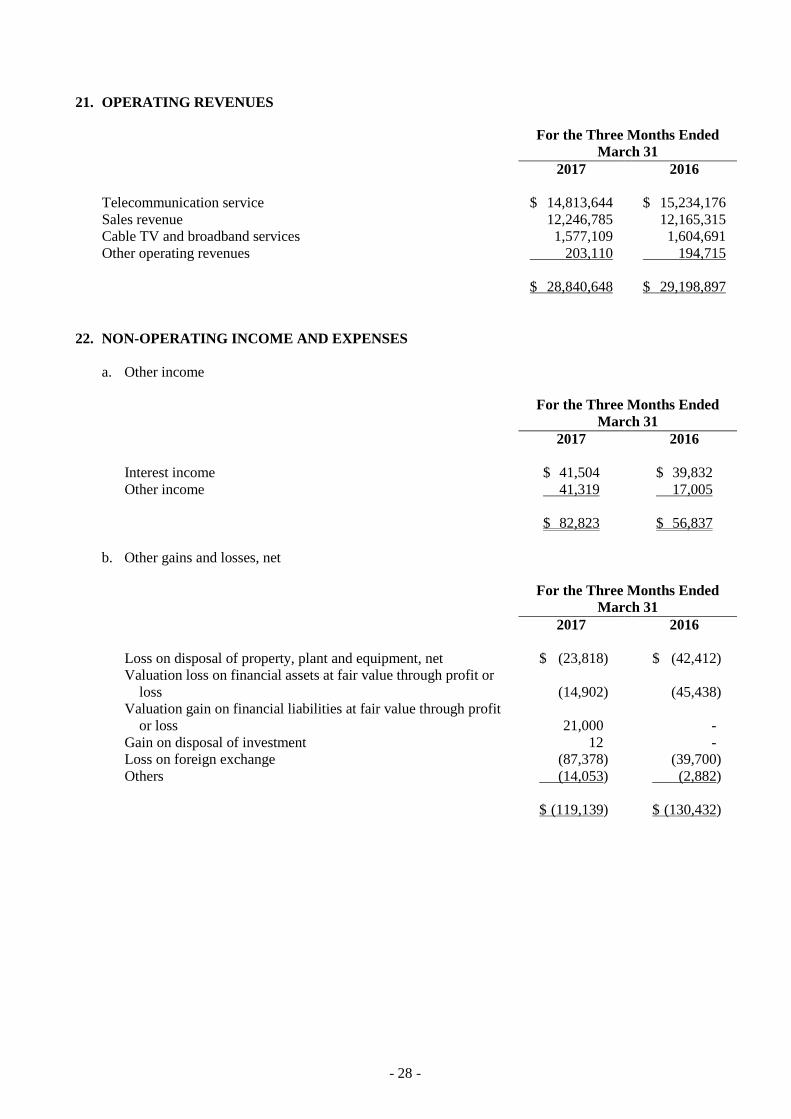
21. OPERATING REVENUES
For the Three Months Ended
March 31
2017 2016
Telecommunication service $ 14,813,644 $ 15,234,176
Sales revenue 12,246,785 12,165,315
Cable TV and broadband services 1,577,109 1,604,691
Other operating revenues 203,110 194,715
$ 28,840,648 $ 29,198,897
22. NON-OPERATING INCOME AND EXPENSES
a. Other income
For the Three Months Ended
March 31
2017 2016
Interest income $ 41,504 $ 39,832
Other income 41,319 17,005
$ 82,823 $ 56,837
b. Other gains and losses, net
For the Three Months Ended
March 31
2017 2016
Loss on disposal of property, plant and equipment, net $ (23,818) $ (42,412)
Valuation loss on financial assets at fair value through profit or
loss (14,902) (45,438)
Valuation gain on financial liabilities at fair value through profit
or loss 21,000 -
Gain on disposal of investment 12 -
Loss on foreign exchange (87,378) (39,700)
Others (14,053) (2,882)
$ (119,139) $ (130,432)
- 29 -
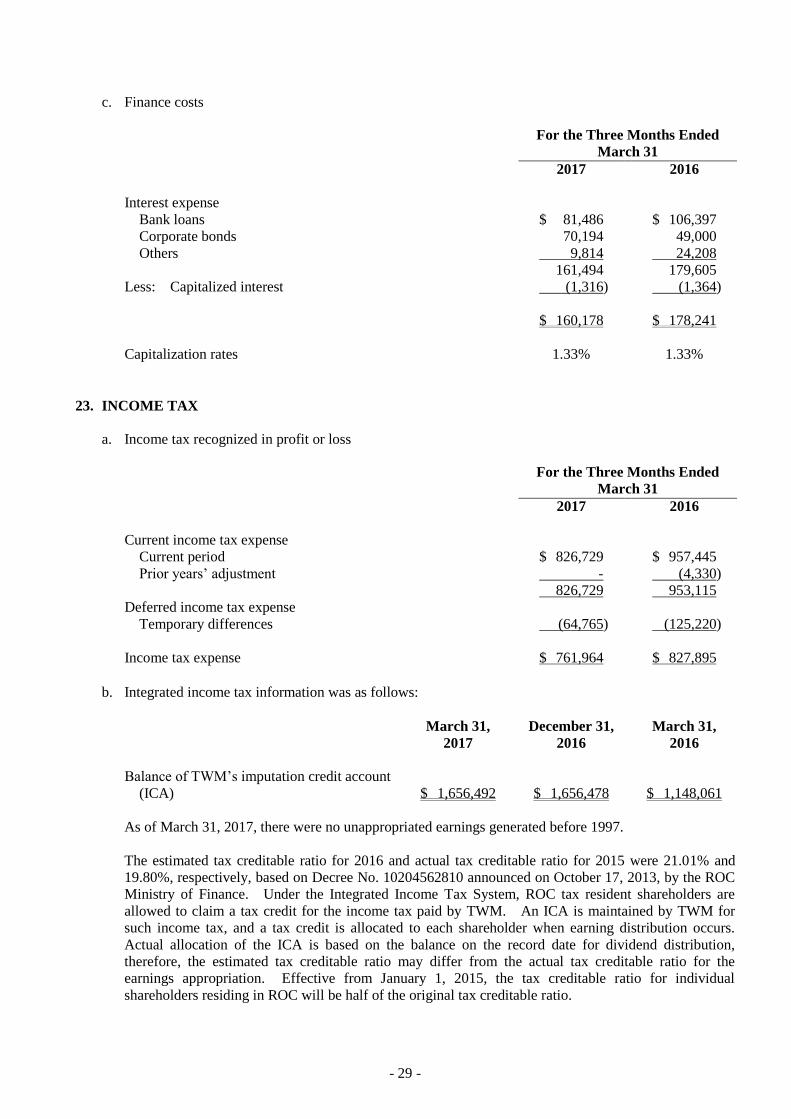
c. Finance costs
For the Three Months Ended
March 31
2017 2016
Interest expense
Bank loans $ 81,486 $ 106,397
Corporate bonds 70,194 49,000
Others 9,814 24,208
161,494 179,605
Less: Capitalized interest (1,316) (1,364)
$ 160,178 $ 178,241
Capitalization rates 1.33% 1.33%
23. INCOME TAX
a. Income tax recognized in profit or loss
For the Three Months Ended
March 31
2017 2016
Current income tax expense
Current period $ 826,729 $ 957,445
Prior years’ adjustment - (4,330)
826,729 953,115
Deferred income tax expense
Temporary differences (64,765) (125,220)
Income tax expense $ 761,964 $ 827,895
b. Integrated income tax information was as follows:
March 31,
2017
December 31,
2016
March 31,
2016
Balance of TWM’s imputation credit account
(ICA) $ 1,656,492 $ 1,656,478 $ 1,148,061
As of March 31, 2017, there were no unappropriated earnings generated before 1997.
The estimated tax creditable ratio for 2016 and actual tax creditable ratio for 2015 were 21.01% and
19.80%, respectively, based on Decree No. 10204562810 announced on October 17, 2013, by the ROC
Ministry of Finance. Under the Integrated Income Tax System, ROC tax resident shareholders are
allowed to claim a tax credit for the income tax paid by TWM. An ICA is maintained by TWM for
such income tax, and a tax credit is allocated to each shareholder when earning distribution occurs.
Actual allocation of the ICA is based on the balance on the record date for dividend distribution,
therefore, the estimated tax creditable ratio may differ from the actual tax creditable ratio for the
earnings appropriation. Effective from January 1, 2015, the tax creditable ratio for individual
shareholders residing in ROC will be half of the original tax creditable ratio.
- 30 -
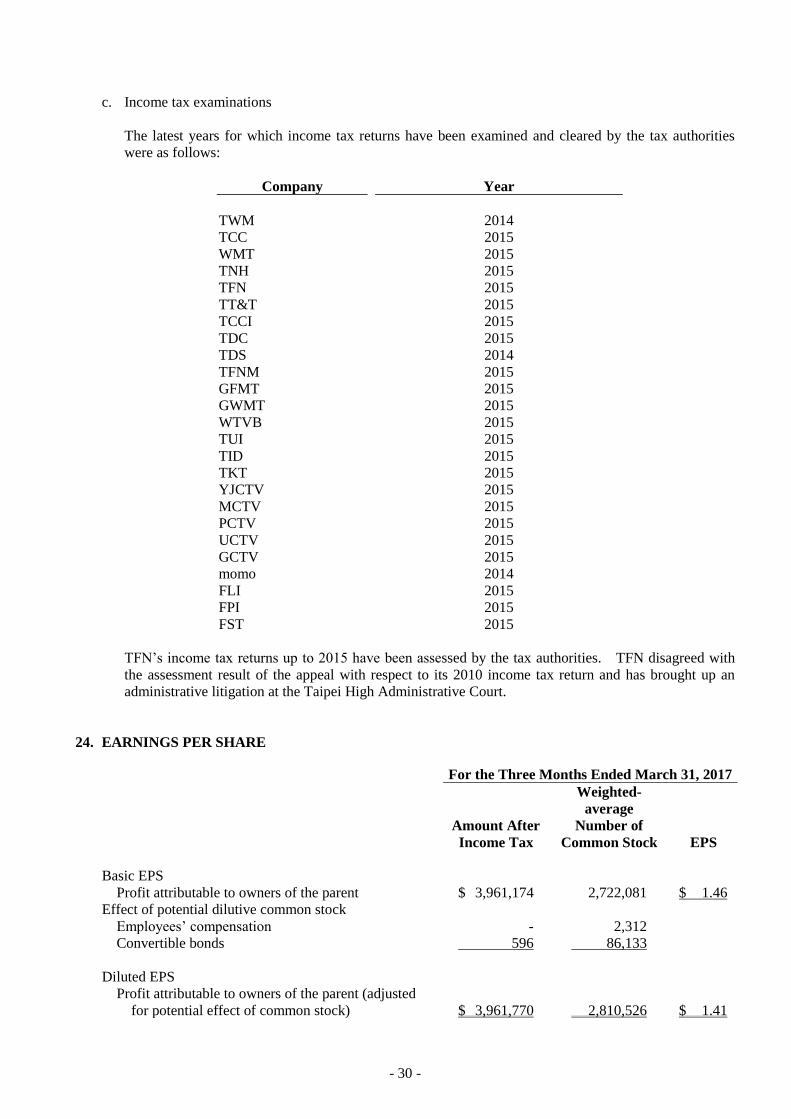
c. Income tax examinations
The latest years for which income tax returns have been examined and cleared by the tax authorities
were as follows:
Company Year
TWM 2014
TCC 2015
WMT 2015
TNH 2015
TFN 2015
TT&T 2015
TCCI 2015
TDC 2015
TDS 2014
TFNM 2015
GFMT 2015
GWMT 2015
WTVB 2015
TUI 2015
TID 2015
TKT 2015
YJCTV 2015
MCTV 2015
PCTV 2015
UCTV 2015
GCTV 2015
momo 2014
FLI 2015
FPI 2015
FST 2015
TFN’s income tax returns up to 2015 have been assessed by the tax authorities. TFN disagreed with
the assessment result of the appeal with respect to its 2010 income tax return and has brought up an
administrative litigation at the Taipei High Administrative Court.
24. EARNINGS PER SHARE
For the Three Months Ended March 31, 2017
Amount After
Income Tax
Weighted-
average
Number of
Common Stock EPS
Basic EPS
Profit attributable to owners of the parent $ 3,961,174 2,722,081 $ 1.46
Effect of potential dilutive common stock
Employees’ compensation - 2,312
Convertible bonds 596 86,133
Diluted EPS
Profit attributable to owners of the parent (adjusted
for potential effect of common stock) $ 3,961,770 2,810,526 $ 1.41
- 31 -
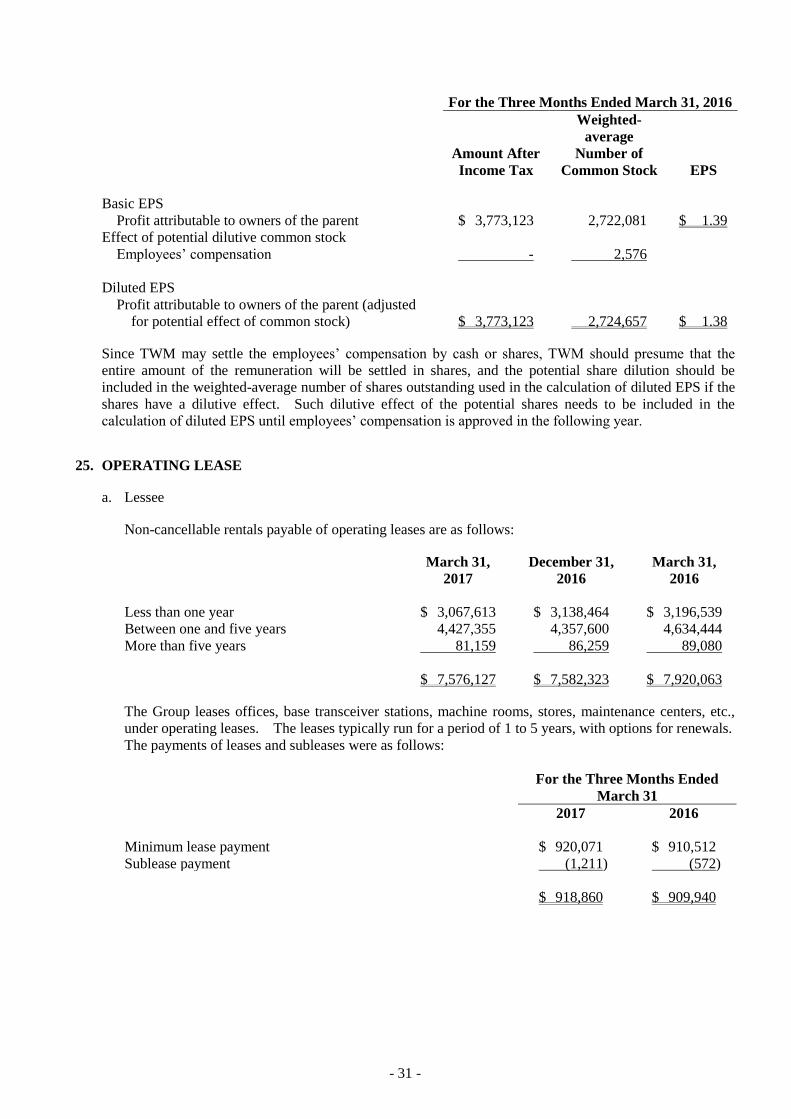
For the Three Months Ended March 31, 2016
Amount After
Income Tax
Weighted-
average
Number of
Common Stock EPS
Basic EPS
Profit attributable to owners of the parent $ 3,773,123 2,722,081 $ 1.39
Effect of potential dilutive common stock
Employees’ compensation - 2,576
Diluted EPS
Profit attributable to owners of the parent (adjusted
for potential effect of common stock) $ 3,773,123 2,724,657 $ 1.38
Since TWM may settle the employees’ compensation by cash or shares, TWM should presume that the
entire amount of the remuneration will be settled in shares, and the potential share dilution should be
included in the weighted-average number of shares outstanding used in the calculation of diluted EPS if the
shares have a dilutive effect. Such dilutive effect of the potential shares needs to be included in the
calculation of diluted EPS until employees’ compensation is approved in the following year.
25. OPERATING LEASE
a. Lessee
Non-cancellable rentals payable of operating leases are as follows:
March 31,
2017
December 31,
2016
March 31,
2016
Less than one year $ 3,067,613 $ 3,138,464 $ 3,196,539
Between one and five years 4,427,355 4,357,600 4,634,444
More than five years 81,159 86,259 89,080
$ 7,576,127 $ 7,582,323 $ 7,920,063
The Group leases offices, base transceiver stations, machine rooms, stores, maintenance centers, etc.,
under operating leases. The leases typically run for a period of 1 to 5 years, with options for renewals.
The payments of leases and subleases were as follows:
For the Three Months Ended
March 31
2017 2016
Minimum lease payment $ 920,071 $ 910,512
Sublease payment (1,211) (572)
$ 918,860 $ 909,940
- 32 -
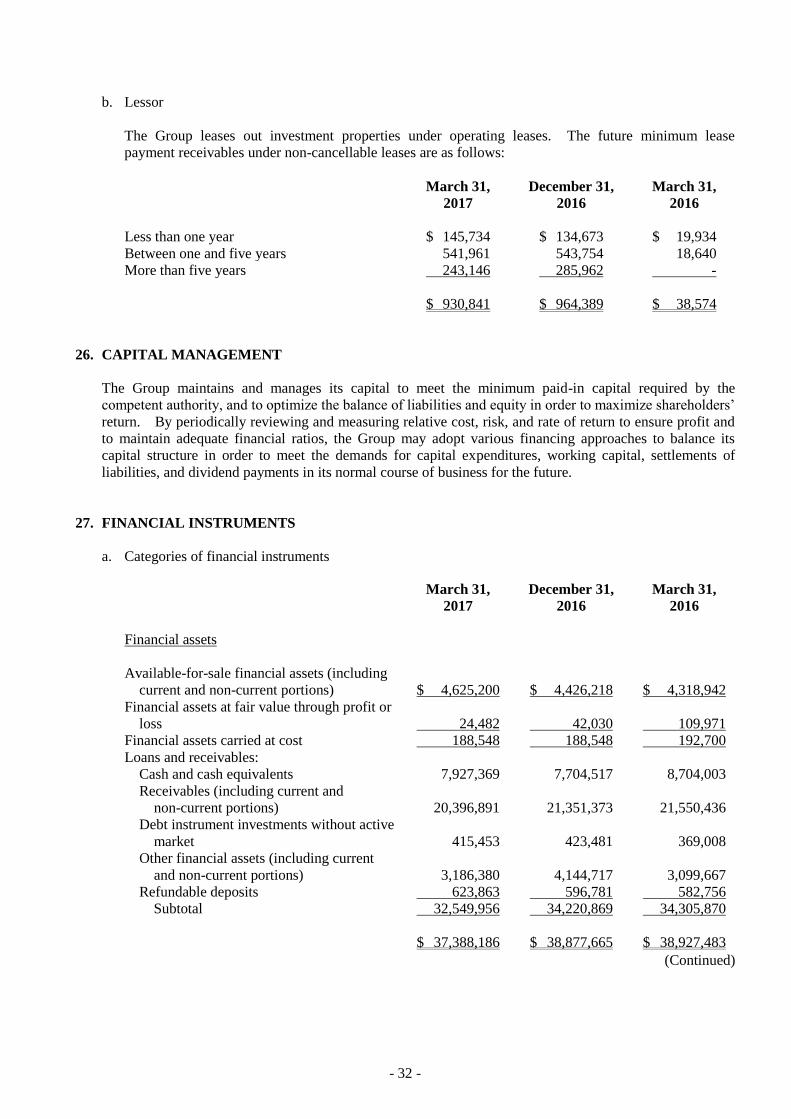
b. Lessor
The Group leases out investment properties under operating leases. The future minimum lease
payment receivables under non-cancellable leases are as follows:
March 31,
2017
December 31,
2016
March 31,
2016
Less than one year $ 145,734 $ 134,673 $ 19,934
Between one and five years 541,961 543,754 18,640
More than five years 243,146 285,962 -
$ 930,841 $ 964,389 $ 38,574
26. CAPITAL MANAGEMENT
The Group maintains and manages its capital to meet the minimum paid-in capital required by the
competent authority, and to optimize the balance of liabilities and equity in order to maximize shareholders’
return. By periodically reviewing and measuring relative cost, risk, and rate of return to ensure profit and
to maintain adequate financial ratios, the Group may adopt various financing approaches to balance its
capital structure in order to meet the demands for capital expenditures, working capital, settlements of
liabilities, and dividend payments in its normal course of business for the future.
27. FINANCIAL INSTRUMENTS
a. Categories of financial instruments
March 31,
2017
December 31,
2016
March 31,
2016
Financial assets
Available-for-sale financial assets (including
current and non-current portions) $ 4,625,200 $ 4,426,218 $ 4,318,942
Financial assets at fair value through profit or
loss 24,482 42,030 109,971
Financial assets carried at cost 188,548 188,548 192,700
Loans and receivables:
Cash and cash equivalents 7,927,369 7,704,517 8,704,003
Receivables (including current and
non-current portions) 20,396,891 21,351,373 21,550,436
Debt instrument investments without active
market 415,453 423,481 369,008
Other financial assets (including current
and non-current portions) 3,186,380 4,144,717 3,099,667
Refundable deposits 623,863 596,781 582,756
Subtotal 32,549,956 34,220,869 34,305,870
$ 37,388,186 $ 38,877,665 $ 38,927,483
(Continued)
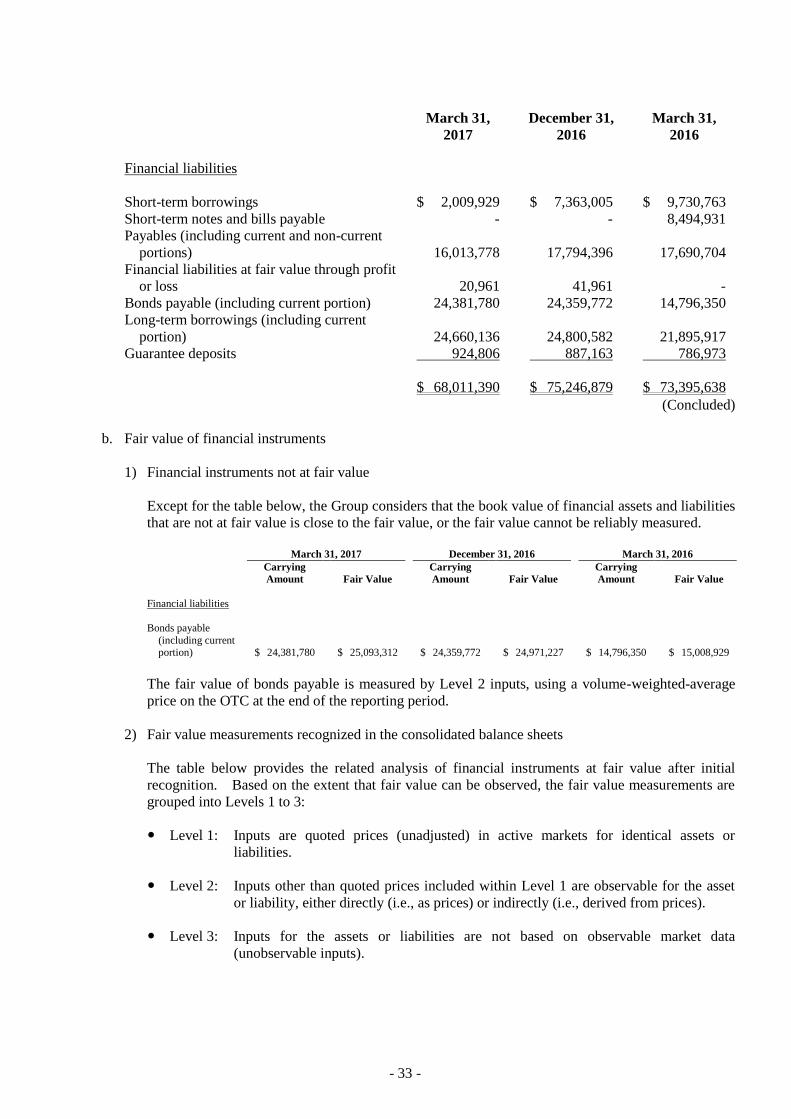
- 33 -
March 31,
2017
December 31,
2016
March 31,
2016
Financial liabilities
Short-term borrowings $ 2,009,929 $ 7,363,005 $ 9,730,763
Short-term notes and bills payable - - 8,494,931
Payables (including current and non-current
portions) 16,013,778 17,794,396 17,690,704
Financial liabilities at fair value through profit
or loss 20,961 41,961 -
Bonds payable (including current portion) 24,381,780 24,359,772 14,796,350
Long-term borrowings (including current
portion) 24,660,136 24,800,582 21,895,917
Guarantee deposits 924,806 887,163 786,973
$ 68,011,390 $ 75,246,879 $ 73,395,638
(Concluded)
b. Fair value of financial instruments
1) Financial instruments not at fair value
Except for the table below, the Group considers that the book value of financial assets and liabilities
that are not at fair value is close to the fair value, or the fair value cannot be reliably measured.
March 31, 2017 December 31, 2016 March 31, 2016
Carrying
Amount Fair Value Carrying
Amount Fair Value Carrying
Amount Fair Value
Financial liabilities
Bonds payable
(including current portion) $ 24,381,780 $ 25,093,312 $ 24,359,772 $ 24,971,227 $ 14,796,350 $ 15,008,929
The fair value of bonds payable is measured by Level 2 inputs, using a volume-weighted-average
price on the OTC at the end of the reporting period.
2) Fair value measurements recognized in the consolidated balance sheets
The table below provides the related analysis of financial instruments at fair value after initial
recognition. Based on the extent that fair value can be observed, the fair value measurements are
grouped into Levels 1 to 3:
Level 1: Inputs are quoted prices (unadjusted) in active markets for identical assets or
liabilities.
Level 2: Inputs other than quoted prices included within Level 1 are observable for the asset
or liability, either directly (i.e., as prices) or indirectly (i.e., derived from prices).
Level 3: Inputs for the assets or liabilities are not based on observable market data
(unobservable inputs).
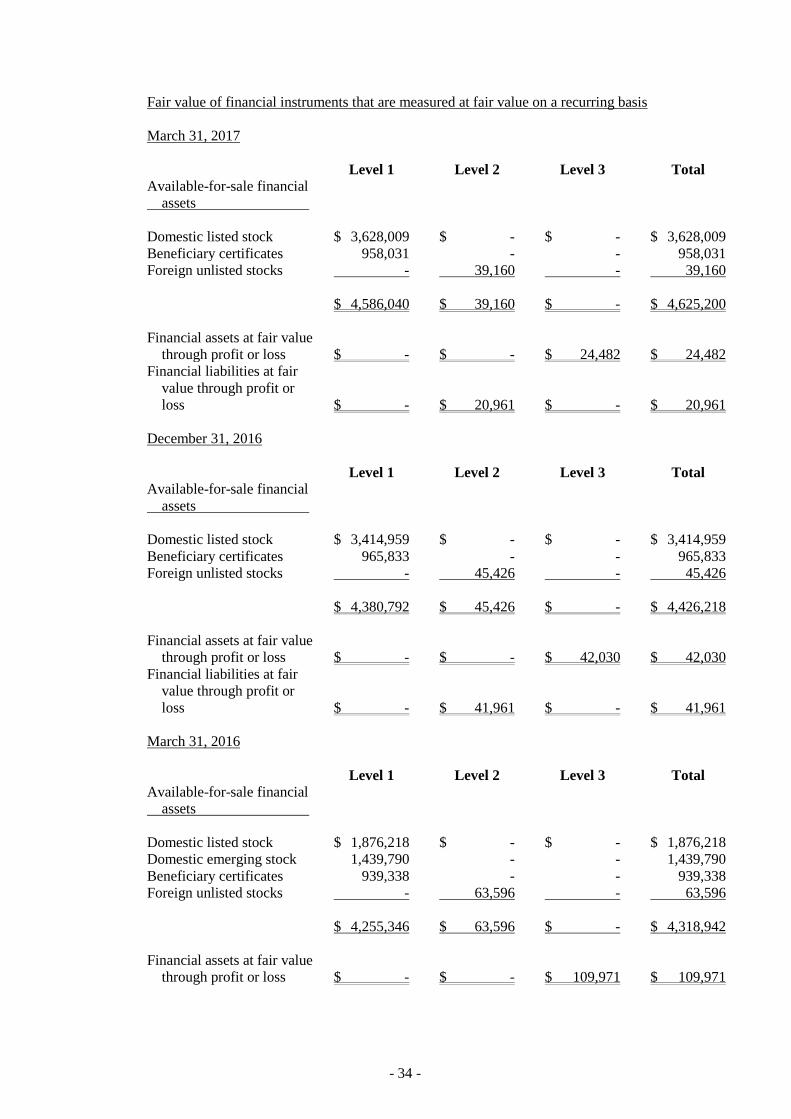
- 34 -
Fair value of financial instruments that are measured at fair value on a recurring basis
March 31, 2017
Level 1 Level 2 Level 3 Total
Available-for-sale financial
assets
Domestic listed stock $ 3,628,009 $ - $ - $ 3,628,009
Beneficiary certificates 958,031 - - 958,031
Foreign unlisted stocks - 39,160 - 39,160
$ 4,586,040 $ 39,160 $ - $ 4,625,200
Financial assets at fair value
through profit or loss $ - $ - $ 24,482 $ 24,482
Financial liabilities at fair
value through profit or
loss $ - $ 20,961 $ - $ 20,961
December 31, 2016
Level 1 Level 2 Level 3 Total
Available-for-sale financial
assets
Domestic listed stock $ 3,414,959 $ - $ - $ 3,414,959
Beneficiary certificates 965,833 - - 965,833
Foreign unlisted stocks - 45,426 - 45,426
$ 4,380,792 $ 45,426 $ - $ 4,426,218
Financial assets at fair value
through profit or loss $ - $ - $ 42,030 $ 42,030
Financial liabilities at fair
value through profit or
loss $ - $ 41,961 $ - $ 41,961
March 31, 2016
Level 1 Level 2 Level 3 Total
Available-for-sale financial
assets
Domestic listed stock $ 1,876,218 $ - $ - $ 1,876,218
Domestic emerging stock 1,439,790 - - 1,439,790
Beneficiary certificates 939,338 - - 939,338
Foreign unlisted stocks - 63,596 - 63,596
$ 4,255,346 $ 63,596 $ - $ 4,318,942
Financial assets at fair value
through profit or loss $ - $ - $ 109,971 $ 109,971
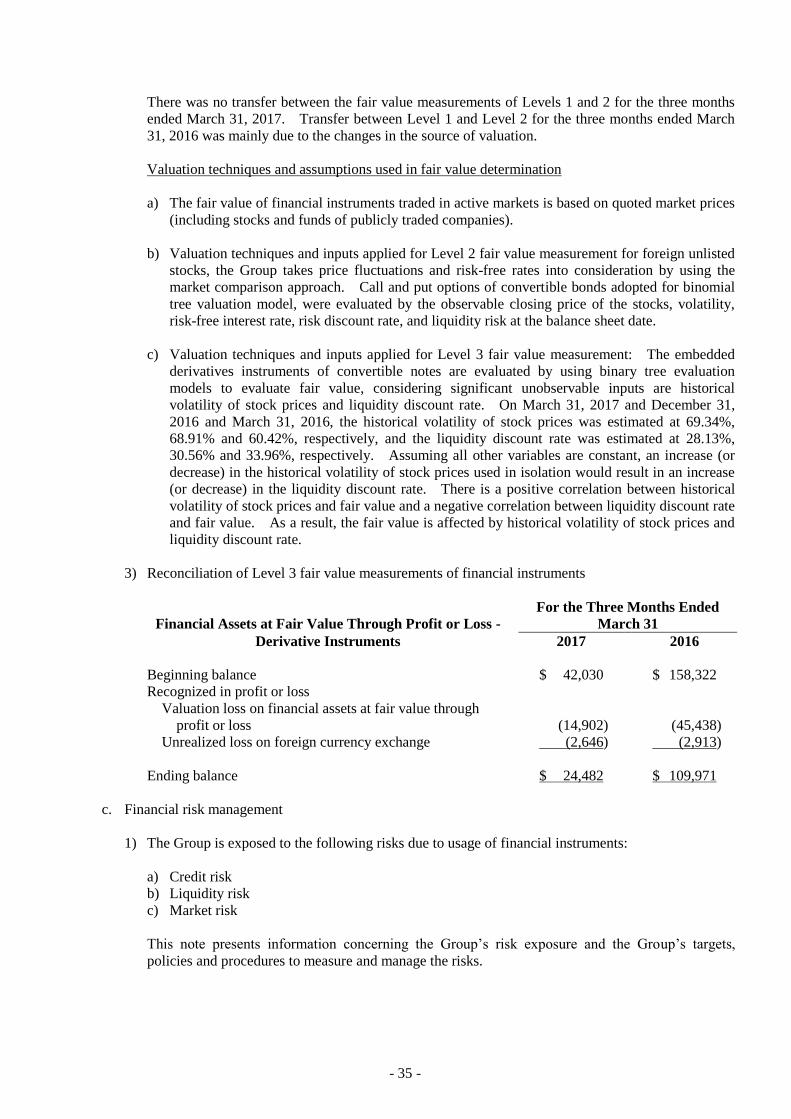
- 35 -
There was no transfer between the fair value measurements of Levels 1 and 2 for the three months
ended March 31, 2017. Transfer between Level 1 and Level 2 for the three months ended March
31, 2016 was mainly due to the changes in the source of valuation.
Valuation techniques and assumptions used in fair value determination
a) The fair value of financial instruments traded in active markets is based on quoted market prices
(including stocks and funds of publicly traded companies).
b) Valuation techniques and inputs applied for Level 2 fair value measurement for foreign unlisted
stocks, the Group takes price fluctuations and risk-free rates into consideration by using the
market comparison approach. Call and put options of convertible bonds adopted for binomial
tree valuation model, were evaluated by the observable closing price of the stocks, volatility,
risk-free interest rate, risk discount rate, and liquidity risk at the balance sheet date.
c) Valuation techniques and inputs applied for Level 3 fair value measurement: The embedded
derivatives instruments of convertible notes are evaluated by using binary tree evaluation
models to evaluate fair value, considering significant unobservable inputs are historical
volatility of stock prices and liquidity discount rate. On March 31, 2017 and December 31,
2016 and March 31, 2016, the historical volatility of stock prices was estimated at 69.34%,
68.91% and 60.42%, respectively, and the liquidity discount rate was estimated at 28.13%,
30.56% and 33.96%, respectively. Assuming all other variables are constant, an increase (or
decrease) in the historical volatility of stock prices used in isolation would result in an increase
(or decrease) in the liquidity discount rate. There is a positive correlation between historical
volatility of stock prices and fair value and a negative correlation between liquidity discount rate
and fair value. As a result, the fair value is affected by historical volatility of stock prices and
liquidity discount rate.
3) Reconciliation of Level 3 fair value measurements of financial instruments
Financial Assets at Fair Value Through Profit or Loss - For the Three Months Ended
March 31
Derivative Instruments 2017 2016
Beginning balance $ 42,030 $ 158,322
Recognized in profit or loss
Valuation loss on financial assets at fair value through
profit or loss (14,902) (45,438)
Unrealized loss on foreign currency exchange (2,646) (2,913)
Ending balance $ 24,482 $ 109,971
c. Financial risk management
1) The Group is exposed to the following risks due to usage of financial instruments:
a) Credit risk
b) Liquidity risk
c) Market risk
This note presents information concerning the Group’s risk exposure and the Group’s targets,
policies and procedures to measure and manage the risks.
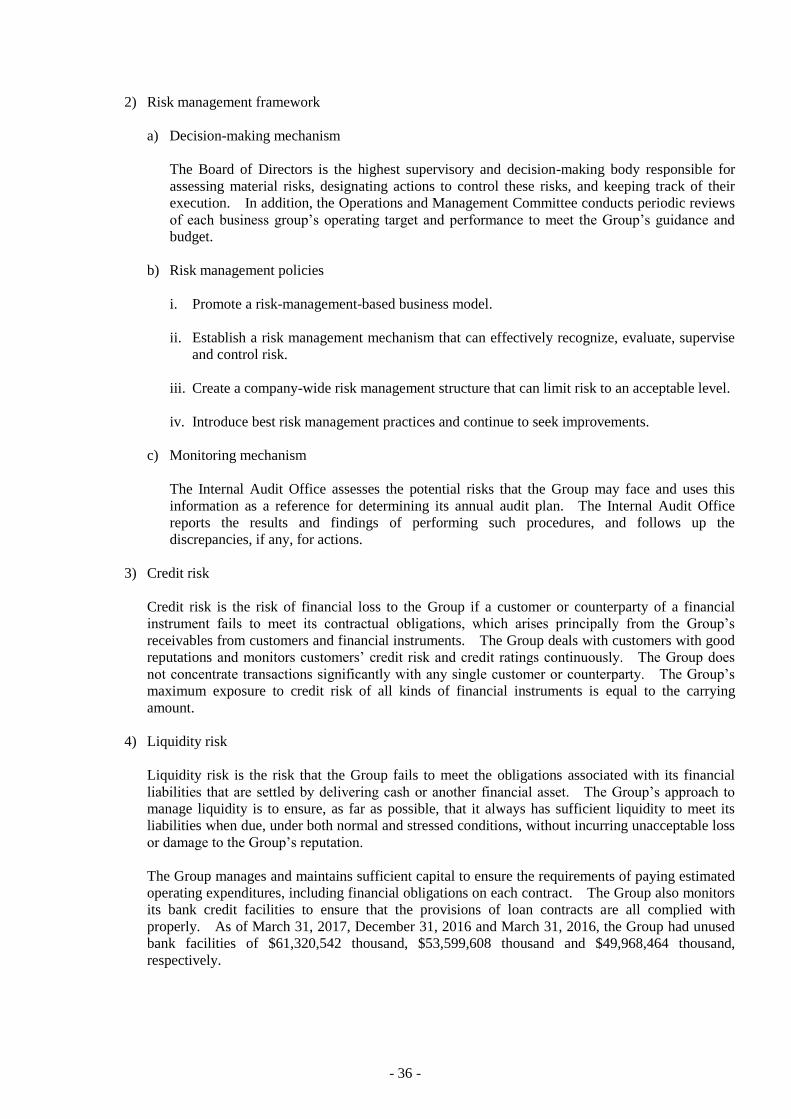
- 36 -
2) Risk management framework
a) Decision-making mechanism
The Board of Directors is the highest supervisory and decision-making body responsible for
assessing material risks, designating actions to control these risks, and keeping track of their
execution. In addition, the Operations and Management Committee conducts periodic reviews
of each business group’s operating target and performance to meet the Group’s guidance and
budget.
b) Risk management policies
i. Promote a risk-management-based business model.
ii. Establish a risk management mechanism that can effectively recognize, evaluate, supervise
and control risk.
iii. Create a company-wide risk management structure that can limit risk to an acceptable level.
iv. Introduce best risk management practices and continue to seek improvements.
c) Monitoring mechanism
The Internal Audit Office assesses the potential risks that the Group may face and uses this
information as a reference for determining its annual audit plan. The Internal Audit Office
reports the results and findings of performing such procedures, and follows up the
discrepancies, if any, for actions.
3) Credit risk
Credit risk is the risk of financial loss to the Group if a customer or counterparty of a financial
instrument fails to meet its contractual obligations, which arises principally from the Group’s
receivables from customers and financial instruments. The Group deals with customers with good
reputations and monitors customers’ credit risk and credit ratings continuously. The Group does
not concentrate transactions significantly with any single customer or counterparty. The Group’s
maximum exposure to credit risk of all kinds of financial instruments is equal to the carrying
amount.
4) Liquidity risk
Liquidity risk is the risk that the Group fails to meet the obligations associated with its financial
liabilities that are settled by delivering cash or another financial asset. The Group’s approach to
manage liquidity is to ensure, as far as possible, that it always has sufficient liquidity to meet its
liabilities when due, under both normal and stressed conditions, without incurring unacceptable loss
or damage to the Group’s reputation.
The Group manages and maintains sufficient capital to ensure the requirements of paying estimated
operating expenditures, including financial obligations on each contract. The Group also monitors
its bank credit facilities to ensure that the provisions of loan contracts are all complied with
properly. As of March 31, 2017, December 31, 2016 and March 31, 2016, the Group had unused
bank facilities of $61,320,542 thousand, $53,599,608 thousand and $49,968,464 thousand,
respectively.
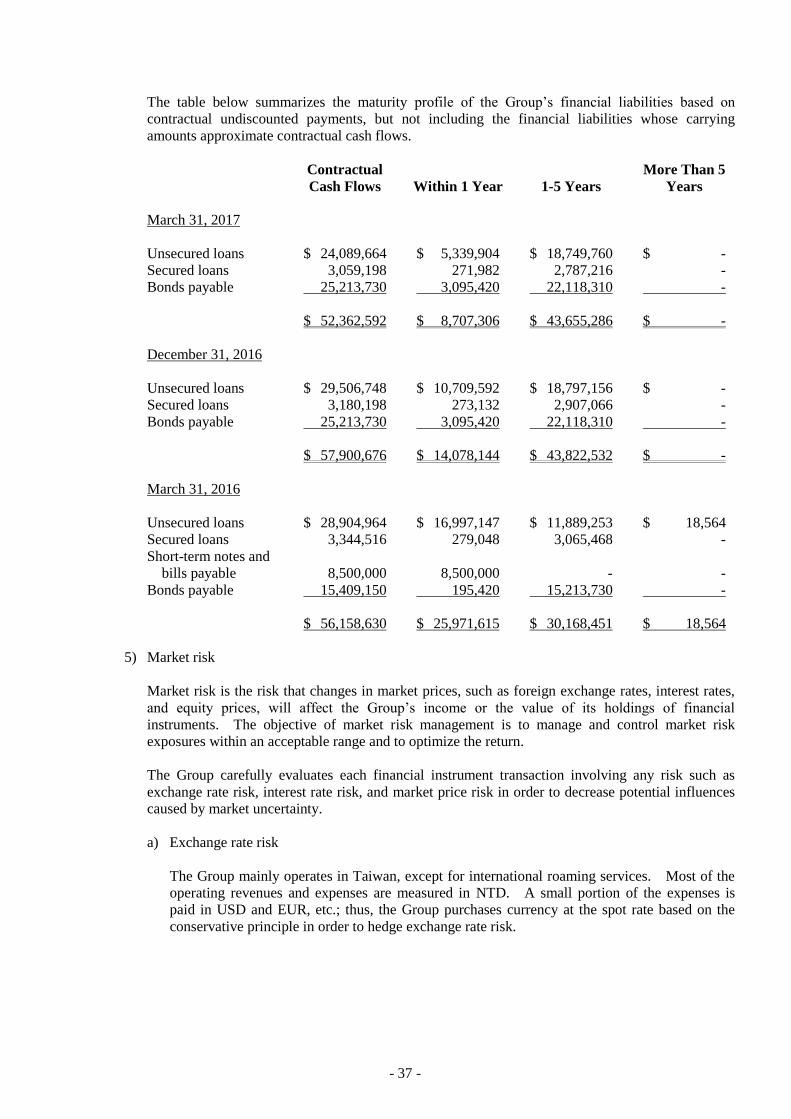
- 37 -
The table below summarizes the maturity profile of the Group’s financial liabilities based on
contractual undiscounted payments, but not including the financial liabilities whose carrying
amounts approximate contractual cash flows.
Contractual
Cash Flows Within 1 Year 1-5 Years
More Than 5
Years
March 31, 2017
Unsecured loans $ 24,089,664 $ 5,339,904 $ 18,749,760 $ -
Secured loans 3,059,198 271,982 2,787,216 -
Bonds payable 25,213,730 3,095,420 22,118,310 -
$ 52,362,592 $ 8,707,306 $ 43,655,286 $ -
December 31, 2016
Unsecured loans $ 29,506,748 $ 10,709,592 $ 18,797,156 $ -
Secured loans 3,180,198 273,132 2,907,066 -
Bonds payable 25,213,730 3,095,420 22,118,310 -
$ 57,900,676 $ 14,078,144 $ 43,822,532 $ -
March 31, 2016
Unsecured loans $ 28,904,964 $ 16,997,147 $ 11,889,253 $ 18,564
Secured loans 3,344,516 279,048 3,065,468 -
Short-term notes and
bills payable 8,500,000 8,500,000 - -
Bonds payable 15,409,150 195,420 15,213,730 -
$ 56,158,630 $ 25,971,615 $ 30,168,451 $ 18,564
5) Market risk
Market risk is the risk that changes in market prices, such as foreign exchange rates, interest rates,
and equity prices, will affect the Group’s income or the value of its holdings of financial
instruments. The objective of market risk management is to manage and control market risk
exposures within an acceptable range and to optimize the return.
The Group carefully evaluates each financial instrument transaction involving any risk such as
exchange rate risk, interest rate risk, and market price risk in order to decrease potential influences
caused by market uncertainty.
a) Exchange rate risk
The Group mainly operates in Taiwan, except for international roaming services. Most of the
operating revenues and expenses are measured in NTD. A small portion of the expenses is
paid in USD and EUR, etc.; thus, the Group purchases currency at the spot rate based on the
conservative principle in order to hedge exchange rate risk.
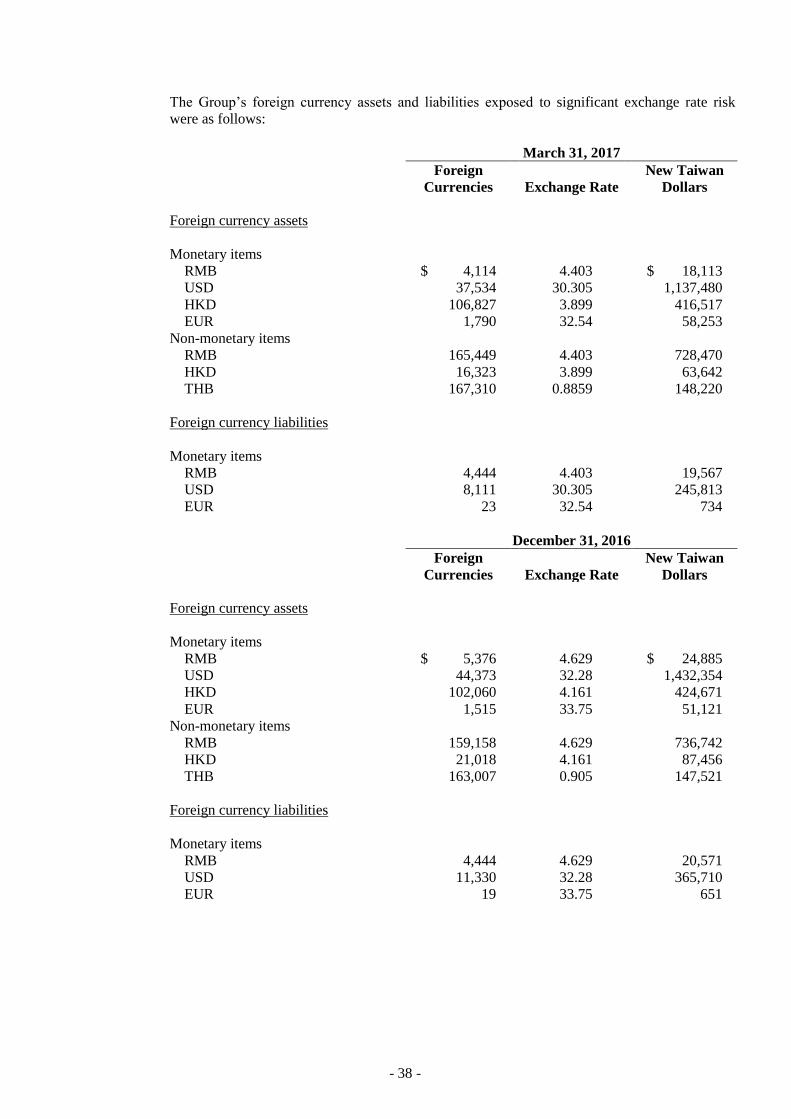
- 38 -
The Group’s foreign currency assets and liabilities exposed to significant exchange rate risk
were as follows:
March 31, 2017
Foreign
Currencies Exchange Rate
New Taiwan
Dollars
Foreign currency assets
Monetary items
RMB $ 4,114 4.403 $ 18,113
USD 37,534 30.305 1,137,480
HKD 106,827 3.899 416,517
EUR 1,790 32.54 58,253
Non-monetary items
RMB 165,449 4.403 728,470
HKD 16,323 3.899 63,642
THB 167,310 0.8859 148,220
Foreign currency liabilities
Monetary items
RMB 4,444 4.403 19,567
USD 8,111 30.305 245,813
EUR 23 32.54 734
December 31, 2016
Foreign
Currencies Exchange Rate
New Taiwan
Dollars
Foreign currency assets
Monetary items
RMB $ 5,376 4.629 $ 24,885
USD 44,373 32.28 1,432,354
HKD 102,060 4.161 424,671
EUR 1,515 33.75 51,121
Non-monetary items
RMB 159,158 4.629 736,742
HKD 21,018 4.161 87,456
THB 163,007 0.905 147,521
Foreign currency liabilities
Monetary items
RMB 4,444 4.629 20,571
USD 11,330 32.28 365,710
EUR 19 33.75 651
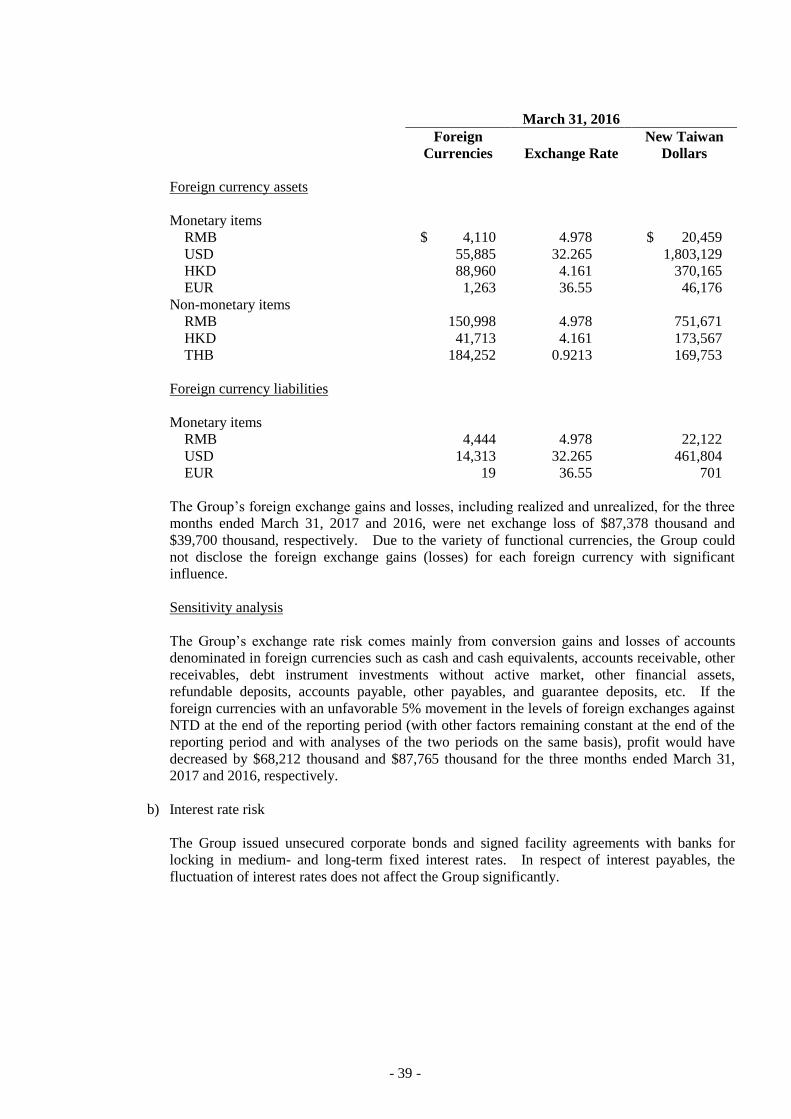
- 39 -
March 31, 2016
Foreign
Currencies Exchange Rate
New Taiwan
Dollars
Foreign currency assets
Monetary items
RMB $ 4,110 4.978 $ 20,459
USD 55,885 32.265 1,803,129
HKD 88,960 4.161 370,165
EUR 1,263 36.55 46,176
Non-monetary items
RMB 150,998 4.978 751,671
HKD 41,713 4.161 173,567
THB 184,252 0.9213 169,753
Foreign currency liabilities
Monetary items
RMB 4,444 4.978 22,122
USD 14,313 32.265 461,804
EUR 19 36.55 701
The Group’s foreign exchange gains and losses, including realized and unrealized, for the three
months ended March 31, 2017 and 2016, were net exchange loss of $87,378 thousand and
$39,700 thousand, respectively. Due to the variety of functional currencies, the Group could
not disclose the foreign exchange gains (losses) for each foreign currency with significant
influence.
Sensitivity analysis
The Group’s exchange rate risk comes mainly from conversion gains and losses of accounts
denominated in foreign currencies such as cash and cash equivalents, accounts receivable, other
receivables, debt instrument investments without active market, other financial assets,
refundable deposits, accounts payable, other payables, and guarantee deposits, etc. If the
foreign currencies with an unfavorable 5% movement in the levels of foreign exchanges against
NTD at the end of the reporting period (with other factors remaining constant at the end of the
reporting period and with analyses of the two periods on the same basis), profit would have
decreased by $68,212 thousand and $87,765 thousand for the three months ended March 31,
2017 and 2016, respectively.
b) Interest rate risk
The Group issued unsecured corporate bonds and signed facility agreements with banks for
locking in medium- and long-term fixed interest rates. In respect of interest payables, the
fluctuation of interest rates does not affect the Group significantly.
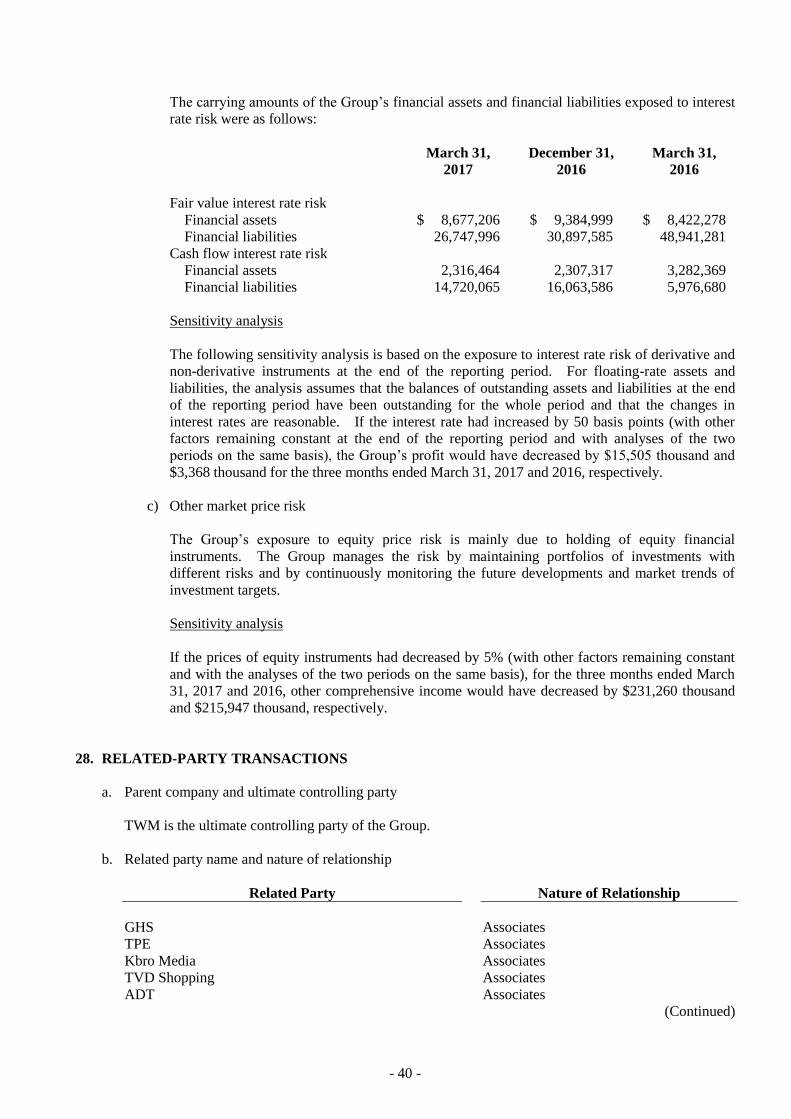
- 40 -
The carrying amounts of the Group’s financial assets and financial liabilities exposed to interest
rate risk were as follows:
March 31,
2017
December 31,
2016
March 31,
2016
Fair value interest rate risk
Financial assets $ 8,677,206 $ 9,384,999 $ 8,422,278
Financial liabilities 26,747,996 30,897,585 48,941,281
Cash flow interest rate risk
Financial assets 2,316,464 2,307,317 3,282,369
Financial liabilities 14,720,065 16,063,586 5,976,680
Sensitivity analysis
The following sensitivity analysis is based on the exposure to interest rate risk of derivative and
non-derivative instruments at the end of the reporting period. For floating-rate assets and
liabilities, the analysis assumes that the balances of outstanding assets and liabilities at the end
of the reporting period have been outstanding for the whole period and that the changes in
interest rates are reasonable. If the interest rate had increased by 50 basis points (with other
factors remaining constant at the end of the reporting period and with analyses of the two
periods on the same basis), the Group’s profit would have decreased by $15,505 thousand and
$3,368 thousand for the three months ended March 31, 2017 and 2016, respectively.
c) Other market price risk
The Group’s exposure to equity price risk is mainly due to holding of equity financial
instruments. The Group manages the risk by maintaining portfolios of investments with
different risks and by continuously monitoring the future developments and market trends of
investment targets.
Sensitivity analysis
If the prices of equity instruments had decreased by 5% (with other factors remaining constant
and with the analyses of the two periods on the same basis), for the three months ended March
31, 2017 and 2016, other comprehensive income would have decreased by $231,260 thousand
and $215,947 thousand, respectively.
28. RELATED-PARTY TRANSACTIONS
a. Parent company and ultimate controlling party
TWM is the ultimate controlling party of the Group.
b. Related party name and nature of relationship
Related Party Nature of Relationship
GHS Associates
TPE Associates
Kbro Media Associates
TVD Shopping Associates
ADT Associates
(Continued)
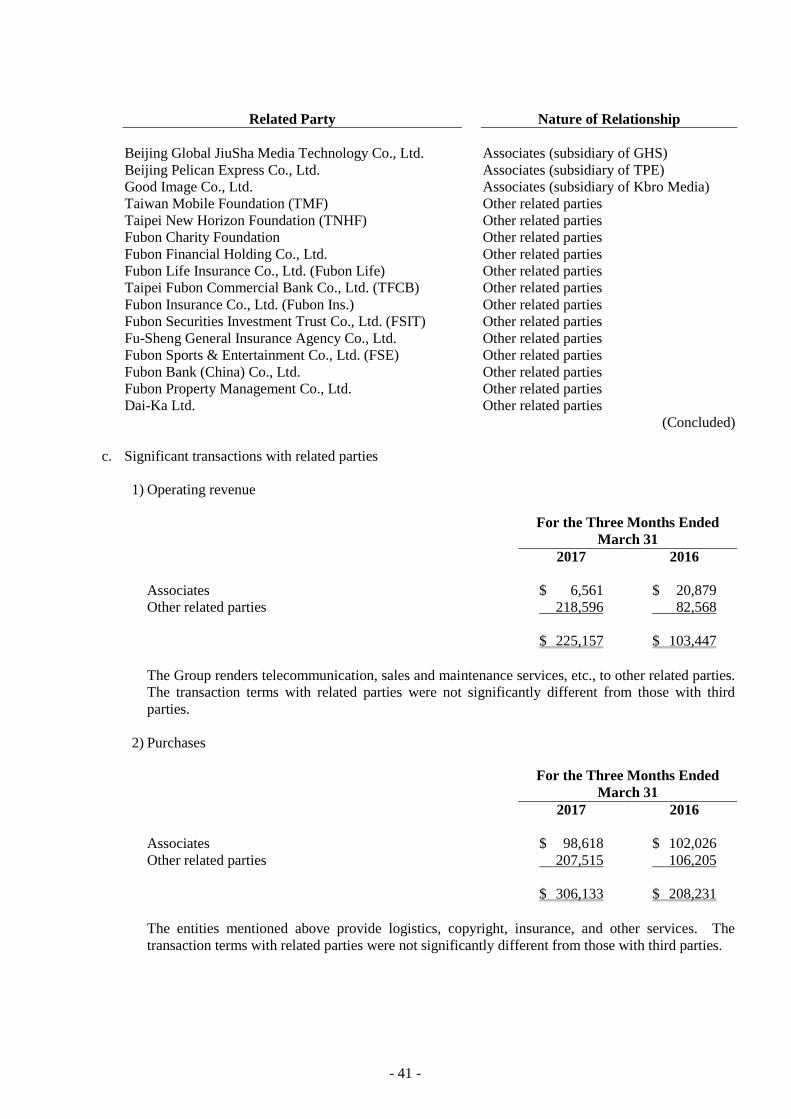
- 41 -
Related Party Nature of Relationship
Beijing Global JiuSha Media Technology Co., Ltd. Associates (subsidiary of GHS)
Beijing Pelican Express Co., Ltd. Associates (subsidiary of TPE)
Good Image Co., Ltd. Associates (subsidiary of Kbro Media)
Taiwan Mobile Foundation (TMF) Other related parties
Taipei New Horizon Foundation (TNHF) Other related parties
Fubon Charity Foundation Other related parties
Fubon Financial Holding Co., Ltd. Other related parties
Fubon Life Insurance Co., Ltd. (Fubon Life) Other related parties
Taipei Fubon Commercial Bank Co., Ltd. (TFCB) Other related parties
Fubon Insurance Co., Ltd. (Fubon Ins.) Other related parties
Fubon Securities Investment Trust Co., Ltd. (FSIT) Other related parties
Fu-Sheng General Insurance Agency Co., Ltd. Other related parties
Fubon Sports & Entertainment Co., Ltd. (FSE) Other related parties
Fubon Bank (China) Co., Ltd. Other related parties
Fubon Property Management Co., Ltd. Other related parties
Dai-Ka Ltd. Other related parties
(Concluded)
c. Significant transactions with related parties
1) Operating revenue
For the Three Months Ended
March 31
2017 2016
Associates $ 6,561 $ 20,879
Other related parties 218,596 82,568
$ 225,157 $ 103,447
The Group renders telecommunication, sales and maintenance services, etc., to other related parties.
The transaction terms with related parties were not significantly different from those with third
parties.
2) Purchases
For the Three Months Ended
March 31
2017 2016
Associates $ 98,618 $ 102,026
Other related parties 207,515 106,205
$ 306,133 $ 208,231
The entities mentioned above provide logistics, copyright, insurance, and other services. The
transaction terms with related parties were not significantly different from those with third parties.
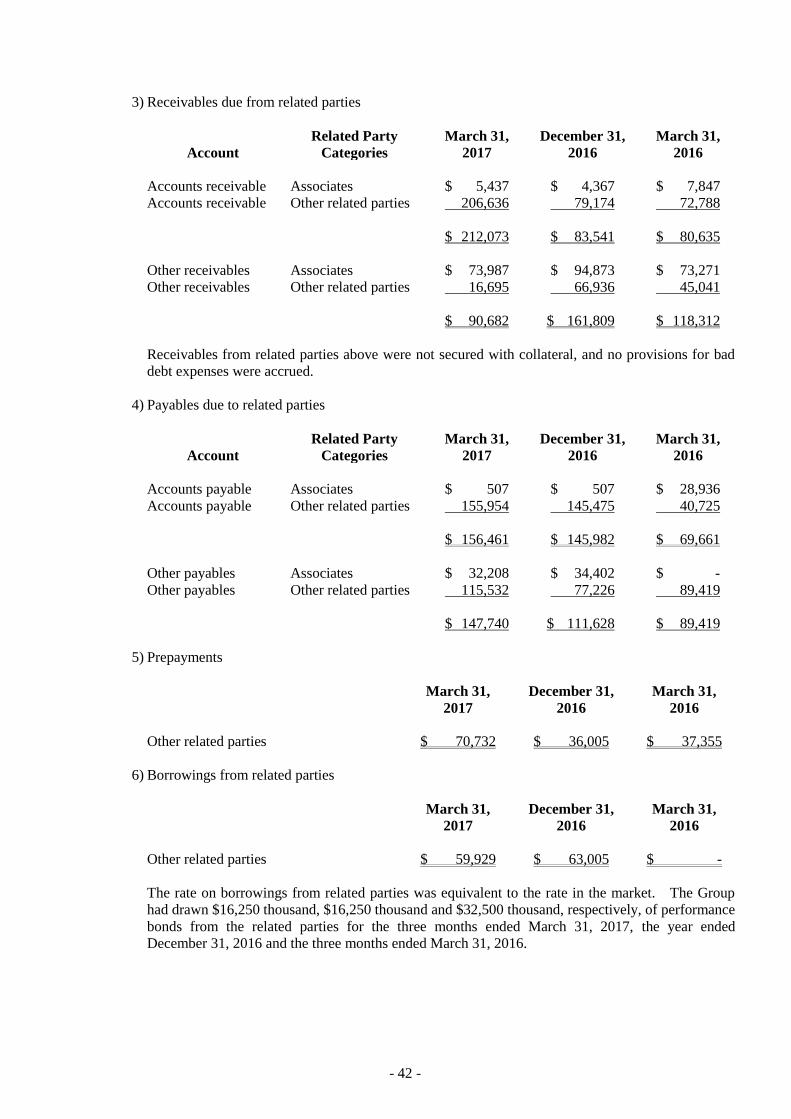
- 42 -
3) Receivables due from related parties
Account
Related Party
Categories March 31,
2017
December 31,
2016
March 31,
2016
Accounts receivable Associates $ 5,437 $ 4,367 $ 7,847
Accounts receivable Other related parties 206,636 79,174 72,788
$ 212,073 $ 83,541 $ 80,635
Other receivables Associates $ 73,987 $ 94,873 $ 73,271
Other receivables Other related parties 16,695 66,936 45,041
$ 90,682 $ 161,809 $ 118,312
Receivables from related parties above were not secured with collateral, and no provisions for bad
debt expenses were accrued.
4) Payables due to related parties
Account
Related Party
Categories March 31,
2017
December 31,
2016
March 31,
2016
Accounts payable Associates $ 507 $ 507 $ 28,936
Accounts payable Other related parties 155,954 145,475 40,725
$ 156,461 $ 145,982 $ 69,661
Other payables Associates $ 32,208 $ 34,402 $ -
Other payables Other related parties 115,532 77,226 89,419
$ 147,740 $ 111,628 $ 89,419
5) Prepayments
March 31,
2017
December 31,
2016
March 31,
2016
Other related parties $ 70,732 $ 36,005 $ 37,355
6) Borrowings from related parties
March 31,
2017
December 31,
2016
March 31,
2016
Other related parties $ 59,929 $ 63,005 $ -
The rate on borrowings from related parties was equivalent to the rate in the market. The Group
had drawn $16,250 thousand, $16,250 thousand and $32,500 thousand, respectively, of performance
bonds from the related parties for the three months ended March 31, 2017, the year ended
December 31, 2016 and the three months ended March 31, 2016.
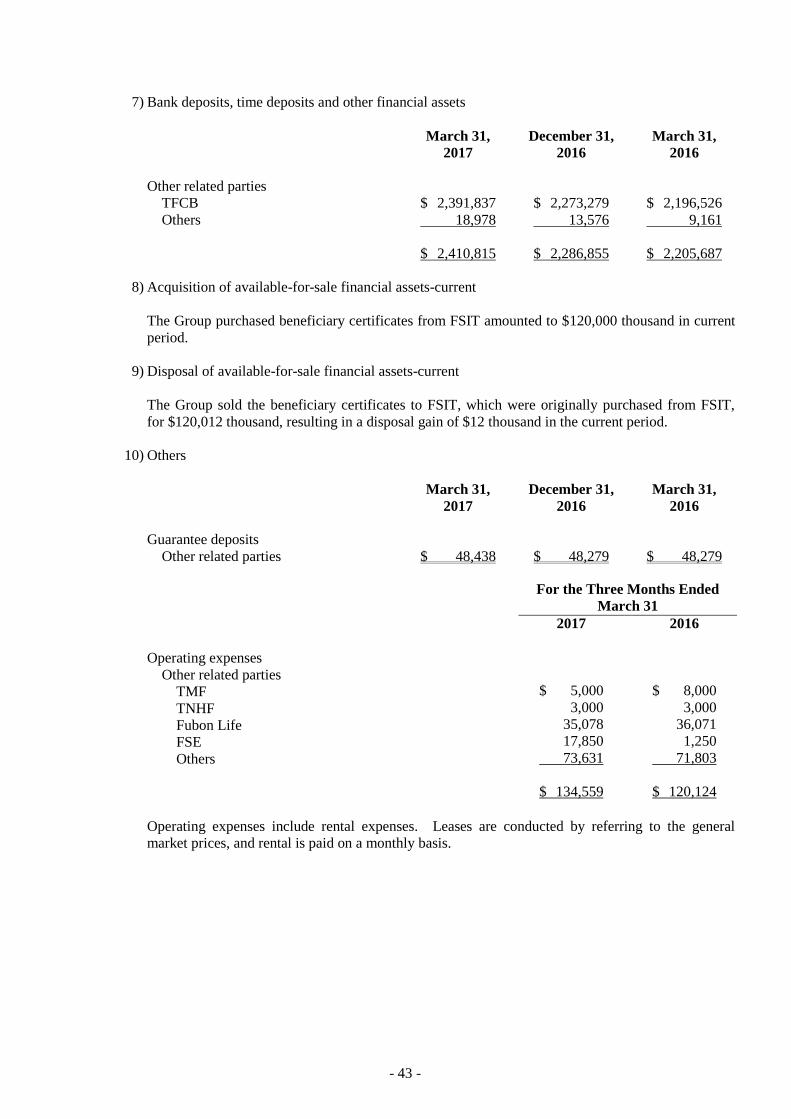
- 43 -
7) Bank deposits, time deposits and other financial assets
March 31,
2017
December 31,
2016
March 31,
2016
Other related parties
TFCB $ 2,391,837 $ 2,273,279 $ 2,196,526
Others 18,978 13,576 9,161
$ 2,410,815 $ 2,286,855 $ 2,205,687
8) Acquisition of available-for-sale financial assets-current
The Group purchased beneficiary certificates from FSIT amounted to $120,000 thousand in current
period.
9) Disposal of available-for-sale financial assets-current
The Group sold the beneficiary certificates to FSIT, which were originally purchased from FSIT,
for $120,012 thousand, resulting in a disposal gain of $12 thousand in the current period.
10) Others
March 31,
2017
December 31,
2016
March 31,
2016
Guarantee deposits
Other related parties $ 48,438 $ 48,279 $ 48,279
For the Three Months Ended
March 31
2017 2016
Operating expenses
Other related parties
TMF $ 5,000 $ 8,000
TNHF 3,000 3,000
Fubon Life 35,078 36,071
FSE 17,850 1,250
Others 73,631 71,803
$ 134,559 $ 120,124
Operating expenses include rental expenses. Leases are conducted by referring to the general
market prices, and rental is paid on a monthly basis.
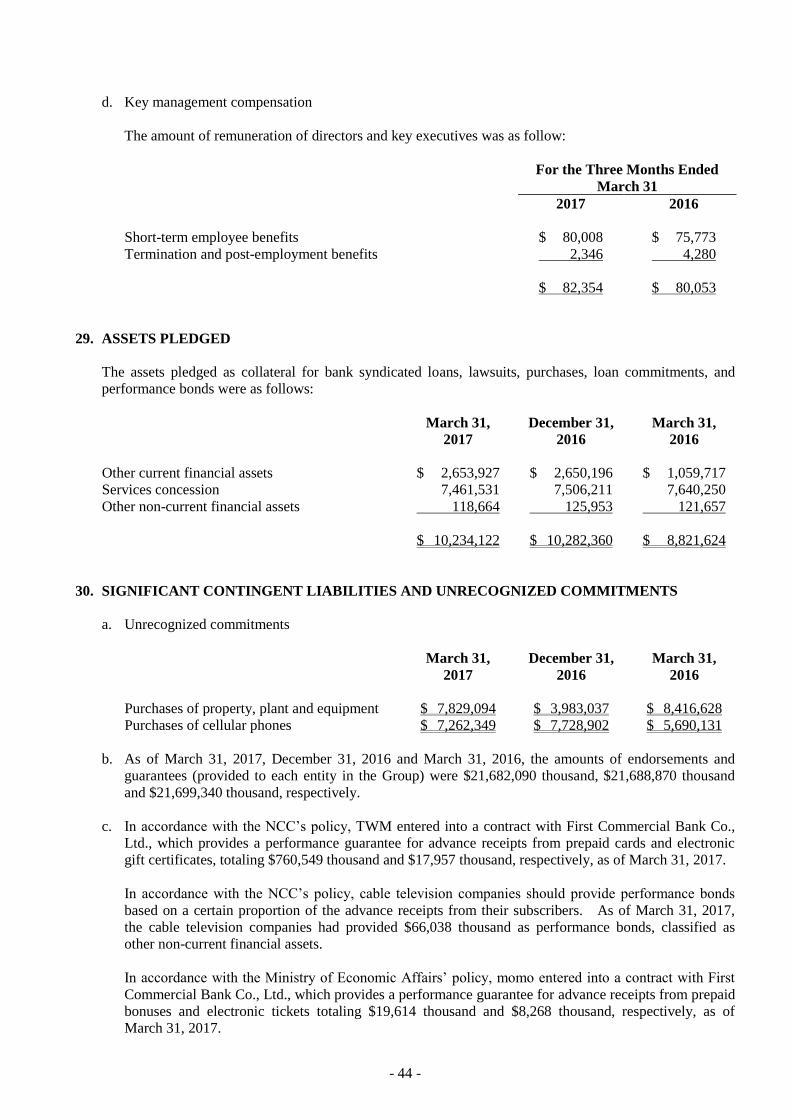
- 44 -
d. Key management compensation
The amount of remuneration of directors and key executives was as follow:
For the Three Months Ended
March 31
2017 2016
Short-term employee benefits $ 80,008 $ 75,773
Termination and post-employment benefits 2,346 4,280
$ 82,354 $ 80,053
29. ASSETS PLEDGED
The assets pledged as collateral for bank syndicated loans, lawsuits, purchases, loan commitments, and
performance bonds were as follows:
March 31,
2017
December 31,
2016
March 31,
2016
Other current financial assets $ 2,653,927 $ 2,650,196 $ 1,059,717
Services concession 7,461,531 7,506,211 7,640,250
Other non-current financial assets 118,664 125,953 121,657
$ 10,234,122 $ 10,282,360 $ 8,821,624
30. SIGNIFICANT CONTINGENT LIABILITIES AND UNRECOGNIZED COMMITMENTS
a. Unrecognized commitments
March 31,
2017
December 31,
2016
March 31,
2016
Purchases of property, plant and equipment $ 7,829,094 $ 3,983,037 $ 8,416,628
Purchases of cellular phones $ 7,262,349 $ 7,728,902 $ 5,690,131
b. As of March 31, 2017, December 31, 2016 and March 31, 2016, the amounts of endorsements and
guarantees (provided to each entity in the Group) were $21,682,090 thousand, $21,688,870 thousand
and $21,699,340 thousand, respectively.
c. In accordance with the NCC’s policy, TWM entered into a contract with First Commercial Bank Co.,
Ltd., which provides a performance guarantee for advance receipts from prepaid cards and electronic
gift certificates, totaling $760,549 thousand and $17,957 thousand, respectively, as of March 31, 2017.
In accordance with the NCC’s policy, cable television companies should provide performance bonds
based on a certain proportion of the advance receipts from their subscribers. As of March 31, 2017,
the cable television companies had provided $66,038 thousand as performance bonds, classified as
other non-current financial assets.
In accordance with the Ministry of Economic Affairs’ policy, momo entered into a contract with First
Commercial Bank Co., Ltd., which provides a performance guarantee for advance receipts from prepaid
bonuses and electronic tickets totaling $19,614 thousand and $8,268 thousand, respectively, as of
March 31, 2017.
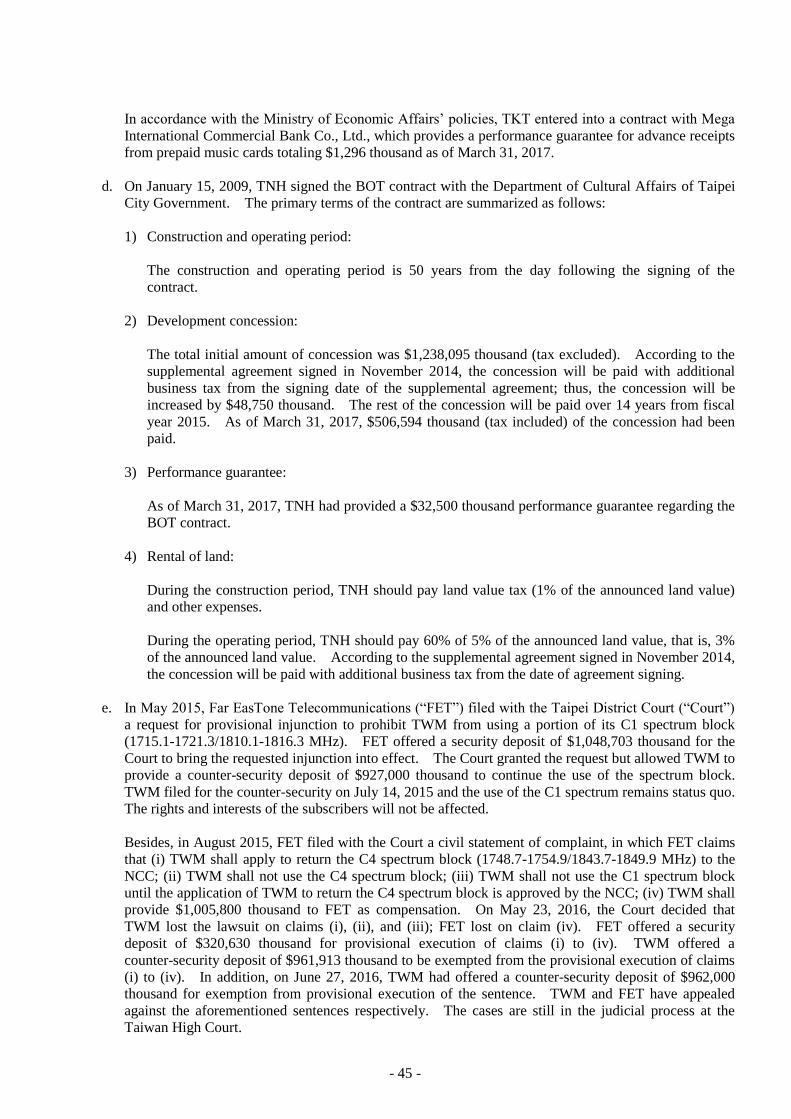
- 45 -
In accordance with the Ministry of Economic Affairs’ policies, TKT entered into a contract with Mega
International Commercial Bank Co., Ltd., which provides a performance guarantee for advance receipts
from prepaid music cards totaling $1,296 thousand as of March 31, 2017.
d. On January 15, 2009, TNH signed the BOT contract with the Department of Cultural Affairs of Taipei
City Government. The primary terms of the contract are summarized as follows:
1) Construction and operating period:
The construction and operating period is 50 years from the day following the signing of the
contract.
2) Development concession:
The total initial amount of concession was $1,238,095 thousand (tax excluded). According to the
supplemental agreement signed in November 2014, the concession will be paid with additional
business tax from the signing date of the supplemental agreement; thus, the concession will be
increased by $48,750 thousand. The rest of the concession will be paid over 14 years from fiscal
year 2015. As of March 31, 2017, $506,594 thousand (tax included) of the concession had been
paid.
3) Performance guarantee:
As of March 31, 2017, TNH had provided a $32,500 thousand performance guarantee regarding the
BOT contract.
4) Rental of land:
During the construction period, TNH should pay land value tax (1% of the announced land value)
and other expenses.
During the operating period, TNH should pay 60% of 5% of the announced land value, that is, 3%
of the announced land value. According to the supplemental agreement signed in November 2014,
the concession will be paid with additional business tax from the date of agreement signing.
e. In May 2015, Far EasTone Telecommunications (“FET”) filed with the Taipei District Court (“Court”)
a request for provisional injunction to prohibit TWM from using a portion of its C1 spectrum block
(1715.1-1721.3/1810.1-1816.3 MHz). FET offered a security deposit of $1,048,703 thousand for the
Court to bring the requested injunction into effect. The Court granted the request but allowed TWM to
provide a counter-security deposit of $927,000 thousand to continue the use of the spectrum block.
TWM filed for the counter-security on July 14, 2015 and the use of the C1 spectrum remains status quo.
The rights and interests of the subscribers will not be affected.
Besides, in August 2015, FET filed with the Court a civil statement of complaint, in which FET claims
that (i) TWM shall apply to return the C4 spectrum block (1748.7-1754.9/1843.7-1849.9 MHz) to the
NCC; (ii) TWM shall not use the C4 spectrum block; (iii) TWM shall not use the C1 spectrum block
until the application of TWM to return the C4 spectrum block is approved by the NCC; (iv) TWM shall
provide $1,005,800 thousand to FET as compensation. On May 23, 2016, the Court decided that
TWM lost the lawsuit on claims (i), (ii), and (iii); FET lost on claim (iv). FET offered a security
deposit of $320,630 thousand for provisional execution of claims (i) to (iv). TWM offered a
counter-security deposit of $961,913 thousand to be exempted from the provisional execution of claims
(i) to (iv). In addition, on June 27, 2016, TWM had offered a counter-security deposit of $962,000
thousand for exemption from provisional execution of the sentence. TWM and FET have appealed
against the aforementioned sentences respectively. The cases are still in the judicial process at the
Taiwan High Court.
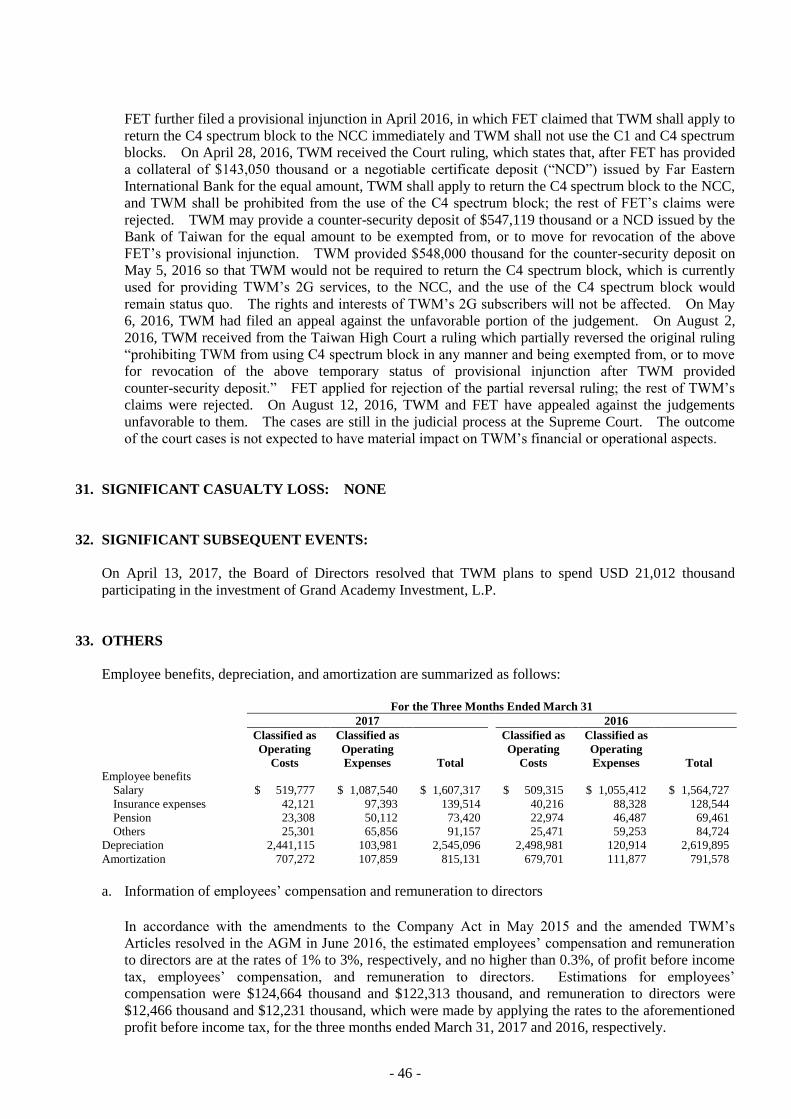
- 46 -
FET further filed a provisional injunction in April 2016, in which FET claimed that TWM shall apply to
return the C4 spectrum block to the NCC immediately and TWM shall not use the C1 and C4 spectrum
blocks. On April 28, 2016, TWM received the Court ruling, which states that, after FET has provided
a collateral of $143,050 thousand or a negotiable certificate deposit (“NCD”) issued by Far Eastern
International Bank for the equal amount, TWM shall apply to return the C4 spectrum block to the NCC,
and TWM shall be prohibited from the use of the C4 spectrum block; the rest of FET’s claims were
rejected. TWM may provide a counter-security deposit of $547,119 thousand or a NCD issued by the
Bank of Taiwan for the equal amount to be exempted from, or to move for revocation of the above
FET’s provisional injunction. TWM provided $548,000 thousand for the counter-security deposit on
May 5, 2016 so that TWM would not be required to return the C4 spectrum block, which is currently
used for providing TWM’s 2G services, to the NCC, and the use of the C4 spectrum block would
remain status quo. The rights and interests of TWM’s 2G subscribers will not be affected. On May
6, 2016, TWM had filed an appeal against the unfavorable portion of the judgement. On August 2,
2016, TWM received from the Taiwan High Court a ruling which partially reversed the original ruling
“prohibiting TWM from using C4 spectrum block in any manner and being exempted from, or to move
for revocation of the above temporary status of provisional injunction after TWM provided
counter-security deposit.” FET applied for rejection of the partial reversal ruling; the rest of TWM’s
claims were rejected. On August 12, 2016, TWM and FET have appealed against the judgements
unfavorable to them. The cases are still in the judicial process at the Supreme Court. The outcome
of the court cases is not expected to have material impact on TWM’s financial or operational aspects.
31. SIGNIFICANT CASUALTY LOSS: NONE
32. SIGNIFICANT SUBSEQUENT EVENTS:
On April 13, 2017, the Board of Directors resolved that TWM plans to spend USD 21,012 thousand
participating in the investment of Grand Academy Investment, L.P.
33. OTHERS
Employee benefits, depreciation, and amortization are summarized as follows:
For the Three Months Ended March 31
2017 2016
Classified as
Operating
Costs
Classified as
Operating
Expenses Total
Classified as
Operating
Costs
Classified as
Operating
Expenses Total
Employee benefits
Salary $ 519,777 $ 1,087,540 $ 1,607,317 $ 509,315 $ 1,055,412 $ 1,564,727
Insurance expenses 42,121 97,393 139,514 40,216 88,328 128,544
Pension 23,308 50,112 73,420 22,974 46,487 69,461
Others 25,301 65,856 91,157 25,471 59,253 84,724
Depreciation 2,441,115 103,981 2,545,096 2,498,981 120,914 2,619,895
Amortization 707,272 107,859 815,131 679,701 111,877 791,578
a. Information of employees’ compensation and remuneration to directors
In accordance with the amendments to the Company Act in May 2015 and the amended TWM’s
Articles resolved in the AGM in June 2016, the estimated employees’ compensation and remuneration
to directors are at the rates of 1% to 3%, respectively, and no higher than 0.3%, of profit before income
tax, employees’ compensation, and remuneration to directors. Estimations for employees’
compensation were $124,664 thousand and $122,313 thousand, and remuneration to directors were
$12,466 thousand and $12,231 thousand, which were made by applying the rates to the aforementioned
profit before income tax, for the three months ended March 31, 2017 and 2016, respectively.
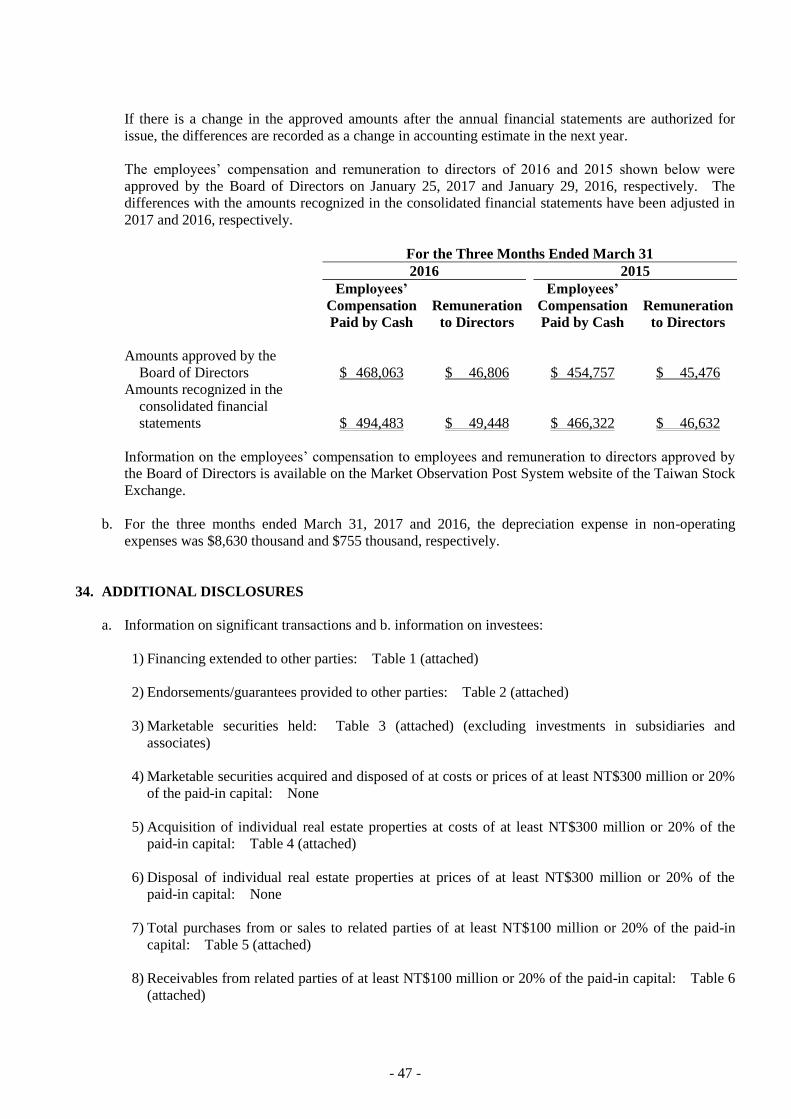
- 47 -
If there is a change in the approved amounts after the annual financial statements are authorized for
issue, the differences are recorded as a change in accounting estimate in the next year.
The employees’ compensation and remuneration to directors of 2016 and 2015 shown below were
approved by the Board of Directors on January 25, 2017 and January 29, 2016, respectively. The
differences with the amounts recognized in the consolidated financial statements have been adjusted in
2017 and 2016, respectively.
For the Three Months Ended March 31
2016 2015
Employees’
Compensation
Paid by Cash
Remuneration
to Directors
Employees’
Compensation
Paid by Cash
Remuneration
to Directors
Amounts approved by the
Board of Directors $ 468,063 $ 46,806 $ 454,757 $ 45,476
Amounts recognized in the
consolidated financial
statements $ 494,483 $ 49,448 $ 466,322 $ 46,632
Information on the employees’ compensation to employees and remuneration to directors approved by
the Board of Directors is available on the Market Observation Post System website of the Taiwan Stock
Exchange.
b. For the three months ended March 31, 2017 and 2016, the depreciation expense in non-operating
expenses was $8,630 thousand and $755 thousand, respectively.
34. ADDITIONAL DISCLOSURES
a. Information on significant transactions and b. information on investees:
1) Financing extended to other parties: Table 1 (attached)
2) Endorsements/guarantees provided to other parties: Table 2 (attached)
3) Marketable securities held: Table 3 (attached) (excluding investments in subsidiaries and
associates)
4) Marketable securities acquired and disposed of at costs or prices of at least NT$300 million or 20%
of the paid-in capital: None
5) Acquisition of individual real estate properties at costs of at least NT$300 million or 20% of the
paid-in capital: Table 4 (attached)
6) Disposal of individual real estate properties at prices of at least NT$300 million or 20% of the
paid-in capital: None
7) Total purchases from or sales to related parties of at least NT$100 million or 20% of the paid-in
capital: Table 5 (attached)
8) Receivables from related parties of at least NT$100 million or 20% of the paid-in capital: Table 6
(attached)
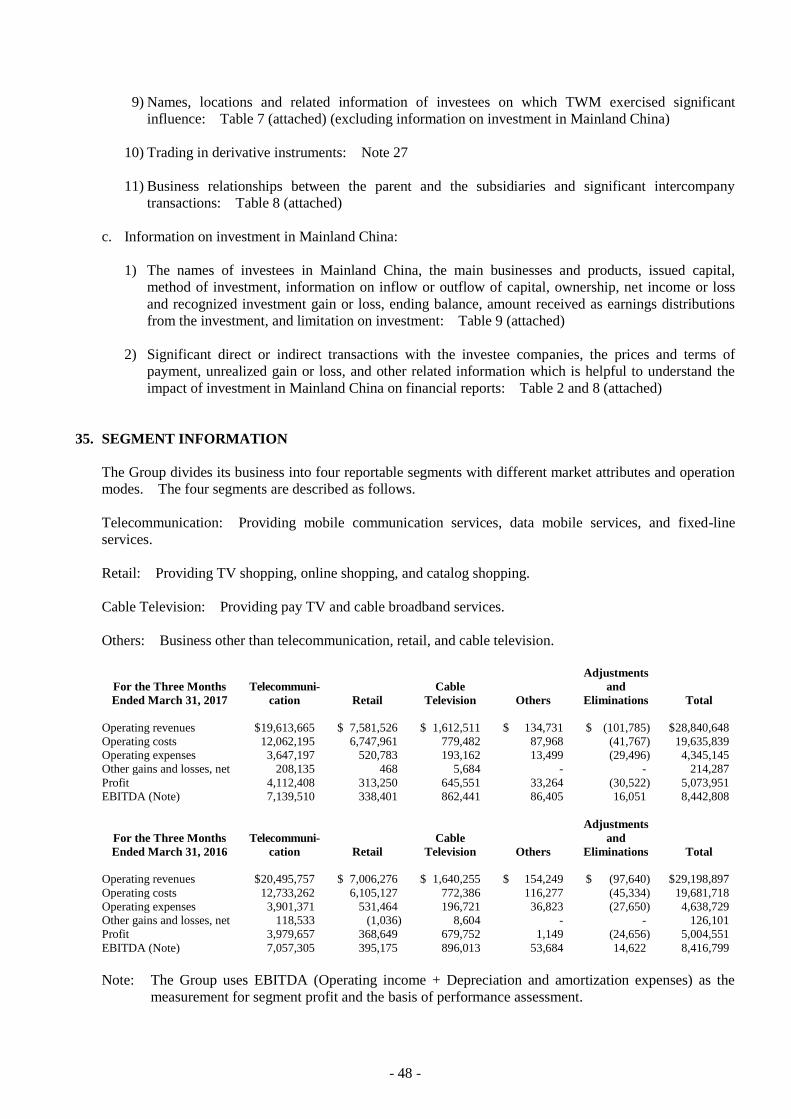
- 48 -
9) Names, locations and related information of investees on which TWM exercised significant
influence: Table 7 (attached) (excluding information on investment in Mainland China)
10) Trading in derivative instruments: Note 27
11) Business relationships between the parent and the subsidiaries and significant intercompany
transactions: Table 8 (attached)
c. Information on investment in Mainland China:
1) The names of investees in Mainland China, the main businesses and products, issued capital,
method of investment, information on inflow or outflow of capital, ownership, net income or loss
and recognized investment gain or loss, ending balance, amount received as earnings distributions
from the investment, and limitation on investment: Table 9 (attached)
2) Significant direct or indirect transactions with the investee companies, the prices and terms of
payment, unrealized gain or loss, and other related information which is helpful to understand the
impact of investment in Mainland China on financial reports: Table 2 and 8 (attached)
35. SEGMENT INFORMATION
The Group divides its business into four reportable segments with different market attributes and operation
modes. The four segments are described as follows.
Telecommunication: Providing mobile communication services, data mobile services, and fixed-line
services.
Retail: Providing TV shopping, online shopping, and catalog shopping.
Cable Television: Providing pay TV and cable broadband services.
Others: Business other than telecommunication, retail, and cable television.
For the Three Months
Ended March 31, 2017 Telecommuni-
cation Retail
Cable
Television Others
Adjustments
and
Eliminations Total
Operating revenues $ 19,613,665 $ 7,581,526 $ 1,612,511 $ 134,731 $ (101,785) $ 28,840,648
Operating costs 12,062,195 6,747,961 779,482 87,968 (41,767) 19,635,839
Operating expenses 3,647,197 520,783 193,162 13,499 (29,496) 4,345,145
Other gains and losses, net 208,135 468 5,684 - - 214,287
Profit 4,112,408 313,250 645,551 33,264 (30,522) 5,073,951
EBITDA (Note) 7,139,510 338,401 862,441 86,405 16,051 8,442,808
For the Three Months
Ended March 31, 2016
Telecommuni-
cation Retail
Cable
Television Others
Adjustments
and
Eliminations Total
Operating revenues $ 20,495,757 $ 7,006,276 $ 1,640,255 $ 154,249 $ (97,640) $ 29,198,897
Operating costs 12,733,262 6,105,127 772,386 116,277 (45,334) 19,681,718
Operating expenses 3,901,371 531,464 196,721 36,823 (27,650) 4,638,729
Other gains and losses, net 118,533 (1,036) 8,604 - - 126,101
Profit 3,979,657 368,649 679,752 1,149 (24,656) 5,004,551
EBITDA (Note) 7,057,305 395,175 896,013 53,684 14,622 8,416,799
Note: The Group uses EBITDA (Operating income + Depreciation and amortization expenses) as the
measurement for segment profit and the basis of performance assessment.
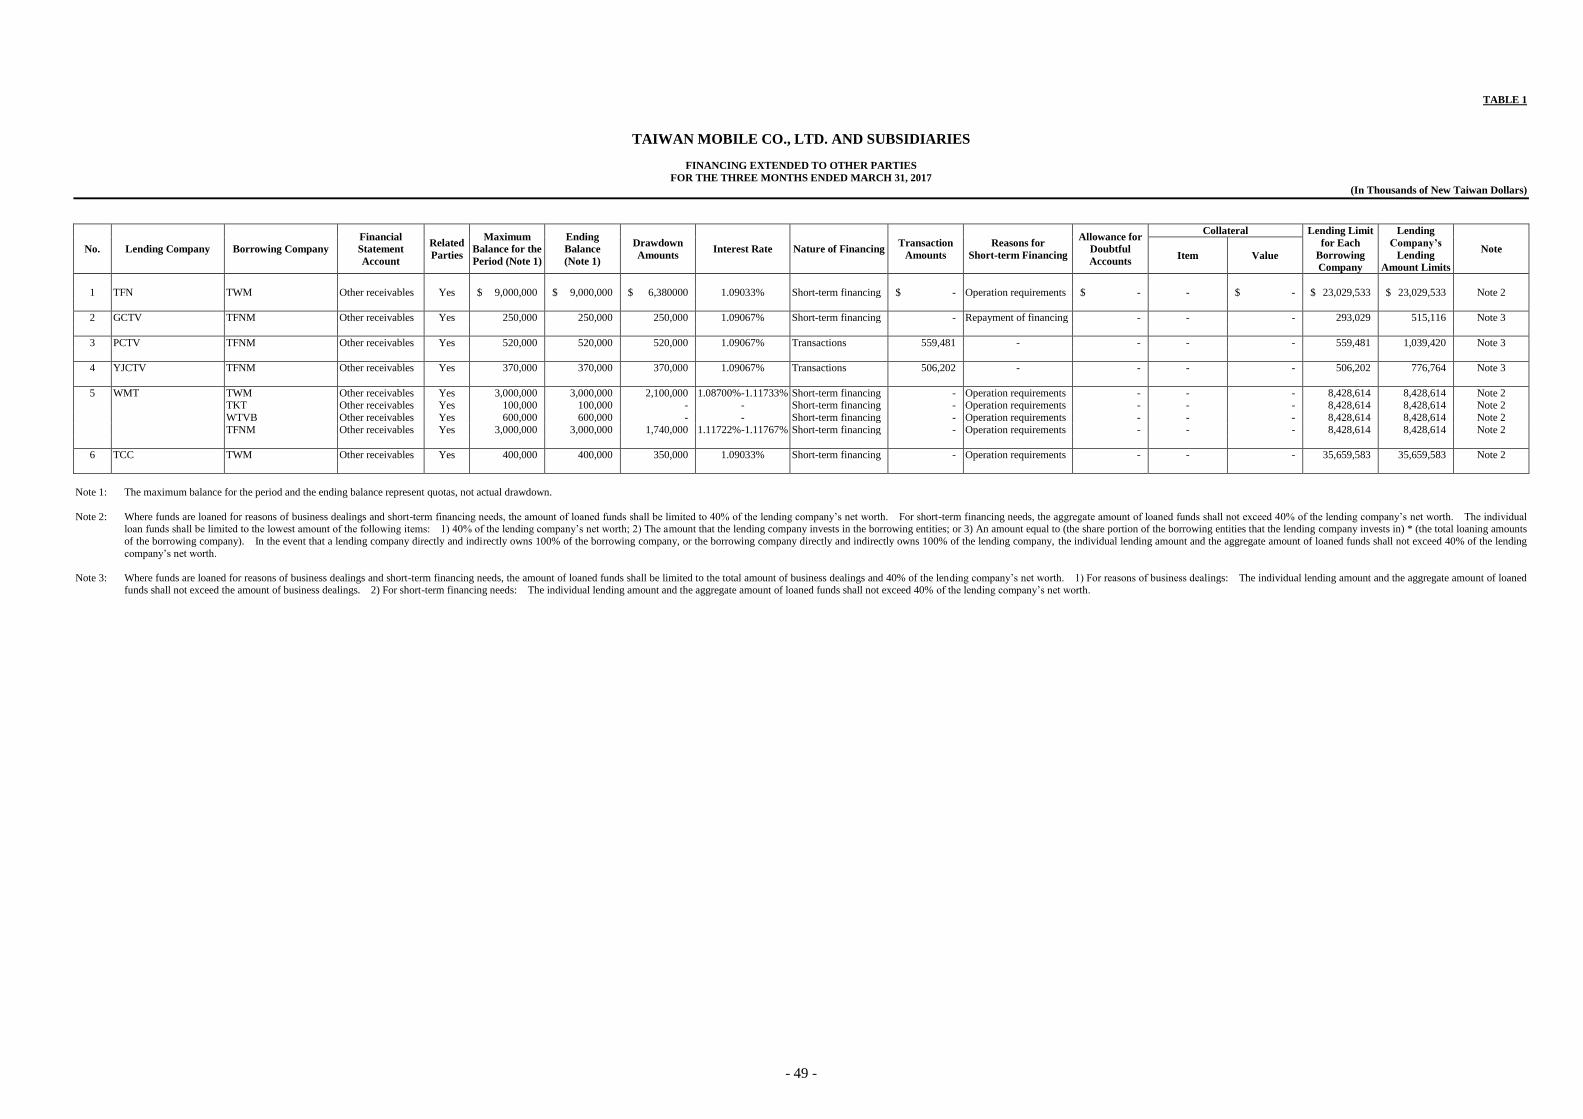
- 49 -
TABLE 1
TAIWAN MOBILE CO., LTD. AND SUBSIDIARIES
FINANCING EXTENDED TO OTHER PARTIES
FOR THE THREE MONTHS ENDED MARCH 31, 2017
(In Thousands of New Taiwan Dollars)
No. Lending Company Borrowing Company
Financial
Statement
Account
Related
Parties
Maximum
Balance for the
Period (Note 1)
Ending
Balance
(Note 1)
Drawdown
Amounts Interest Rate Nature of Financing
Transaction
Amounts
Reasons for
Short-term Financing
Allowance for
Doubtful
Accounts
Collateral Lending Limit
for Each
Borrowing
Company
Lending
Company’s
Lending
Amount Limits
Note Item Value
1 TFN TWM Other receivables Yes $ 9,000,000 $ 9,000,000 $ 6,380000 1.09033% Short-term financing $ - Operation requirements $ - - $ - $ 23,029,533 $ 23,029,533 Note 2
2 GCTV TFNM Other receivables Yes 250,000 250,000 250,000 1.09067% Short-term financing - Repayment of financing - - - 293,029 515,116 Note 3
3 PCTV TFNM Other receivables Yes 520,000 520,000 520,000 1.09067% Transactions 559,481 - - - - 559,481 1,039,420 Note 3
4 YJCTV TFNM Other receivables Yes 370,000 370,000 370,000 1.09067% Transactions 506,202 - - - - 506,202 776,764 Note 3
5 WMT TWM Other receivables Yes 3,000,000 3,000,000 2,100,000 1.08700%-1.11733% Short-term financing - Operation requirements - - - 8,428,614 8,428,614 Note 2 TKT Other receivables Yes 100,000 100,000 - - Short-term financing - Operation requirements - - - 8,428,614 8,428,614 Note 2
WTVB Other receivables Yes 600,000 600,000 - - Short-term financing - Operation requirements - - - 8,428,614 8,428,614 Note 2
TFNM Other receivables Yes 3,000,000 3,000,000 1,740,000 1.11722%-1.11767% Short-term financing - Operation requirements - - - 8,428,614 8,428,614 Note 2
6 TCC TWM Other receivables Yes 400,000 400,000 350,000 1.09033% Short-term financing - Operation requirements - - - 35,659,583 35,659,583 Note 2
Note 1: The maximum balance for the period and the ending balance represent quotas, not actual drawdown.
Note 2: Where funds are loaned for reasons of business dealings and short-term financing needs, the amount of loaned funds shall be limited to 40% of the lending company’s net worth. For short-term financing needs, the aggregate amount of loaned funds shall not exceed 40% of the lending company’s net worth. The individual loan funds shall be limited to the lowest amount of the following items: 1) 40% of the lending company’s net worth; 2) The amount that the lending company invests in the borrowing entities; or 3) An amount equal to (the share portion of the borrowing entities that the lending company invests in) * (the total loaning amounts
of the borrowing company). In the event that a lending company directly and indirectly owns 100% of the borrowing company, or the borrowing company directly and indirectly owns 100% of the lending company, the individual lending amount and the aggregate amount of loaned funds shall not exceed 40% of the lending
company’s net worth.
Note 3: Where funds are loaned for reasons of business dealings and short-term financing needs, the amount of loaned funds shall be limited to the total amount of business dealings and 40% of the lending company’s net worth. 1) For reasons of business dealings: The individual lending amount and the aggregate amount of loaned funds shall not exceed the amount of business dealings. 2) For short-term financing needs: The individual lending amount and the aggregate amount of loaned funds shall not exceed 40% of the lending company’s net worth.
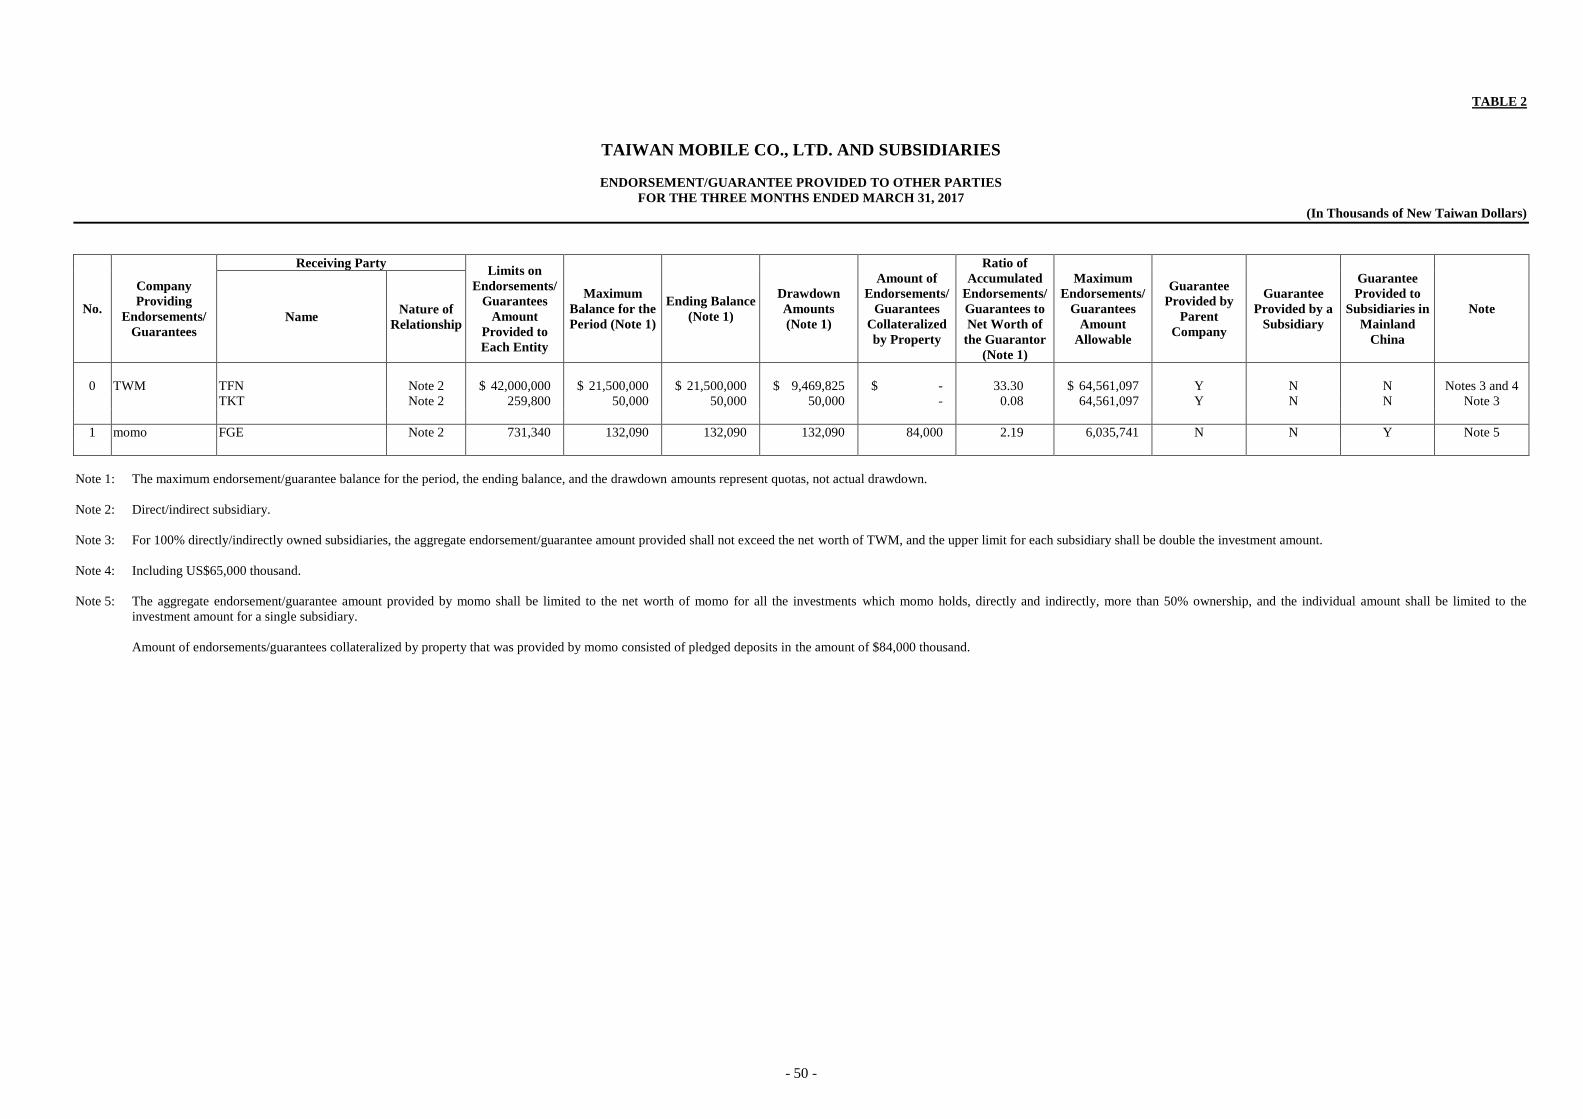
- 50 -
TABLE 2
TAIWAN MOBILE CO., LTD. AND SUBSIDIARIES
ENDORSEMENT/GUARANTEE PROVIDED TO OTHER PARTIES
FOR THE THREE MONTHS ENDED MARCH 31, 2017
(In Thousands of New Taiwan Dollars)
No.
Company
Providing
Endorsements/
Guarantees
Receiving Party Limits on
Endorsements/
Guarantees
Amount
Provided to
Each Entity
Maximum
Balance for the
Period (Note 1)
Ending Balance
(Note 1)
Drawdown
Amounts
(Note 1)
Amount of
Endorsements/
Guarantees
Collateralized
by Property
Ratio of
Accumulated
Endorsements/
Guarantees to
Net Worth of
the Guarantor
(Note 1)
Maximum
Endorsements/
Guarantees
Amount
Allowable
Guarantee
Provided by
Parent
Company
Guarantee
Provided by a
Subsidiary
Guarantee
Provided to
Subsidiaries in
Mainland
China
Note Name
Nature of
Relationship
0 TWM TFN Note 2 $ 42,000,000 $ 21,500,000 $ 21,500,000 $ 9,469,825 $ - 33.30 $ 64,561,097 Y N N Notes 3 and 4
TKT Note 2 259,800 50,000 50,000 50,000 - 0.08 64,561,097 Y N N Note 3
1 momo FGE Note 2 731,340 132,090 132,090 132,090 84,000 2.19 6,035,741 N N Y Note 5
Note 1: The maximum endorsement/guarantee balance for the period, the ending balance, and the drawdown amounts represent quotas, not actual drawdown.
Note 2: Direct/indirect subsidiary.
Note 3: For 100% directly/indirectly owned subsidiaries, the aggregate endorsement/guarantee amount provided shall not exceed the net worth of TWM, and the upper limit for each subsidiary shall be double the investment amount.
Note 4: Including US$65,000 thousand.
Note 5: The aggregate endorsement/guarantee amount provided by momo shall be limited to the net worth of momo for all the investments which momo holds, directly and indirectly, more than 50% ownership, and the individual amount shall be limited to the
investment amount for a single subsidiary.
Amount of endorsements/guarantees collateralized by property that was provided by momo consisted of pledged deposits in the amount of $84,000 thousand.
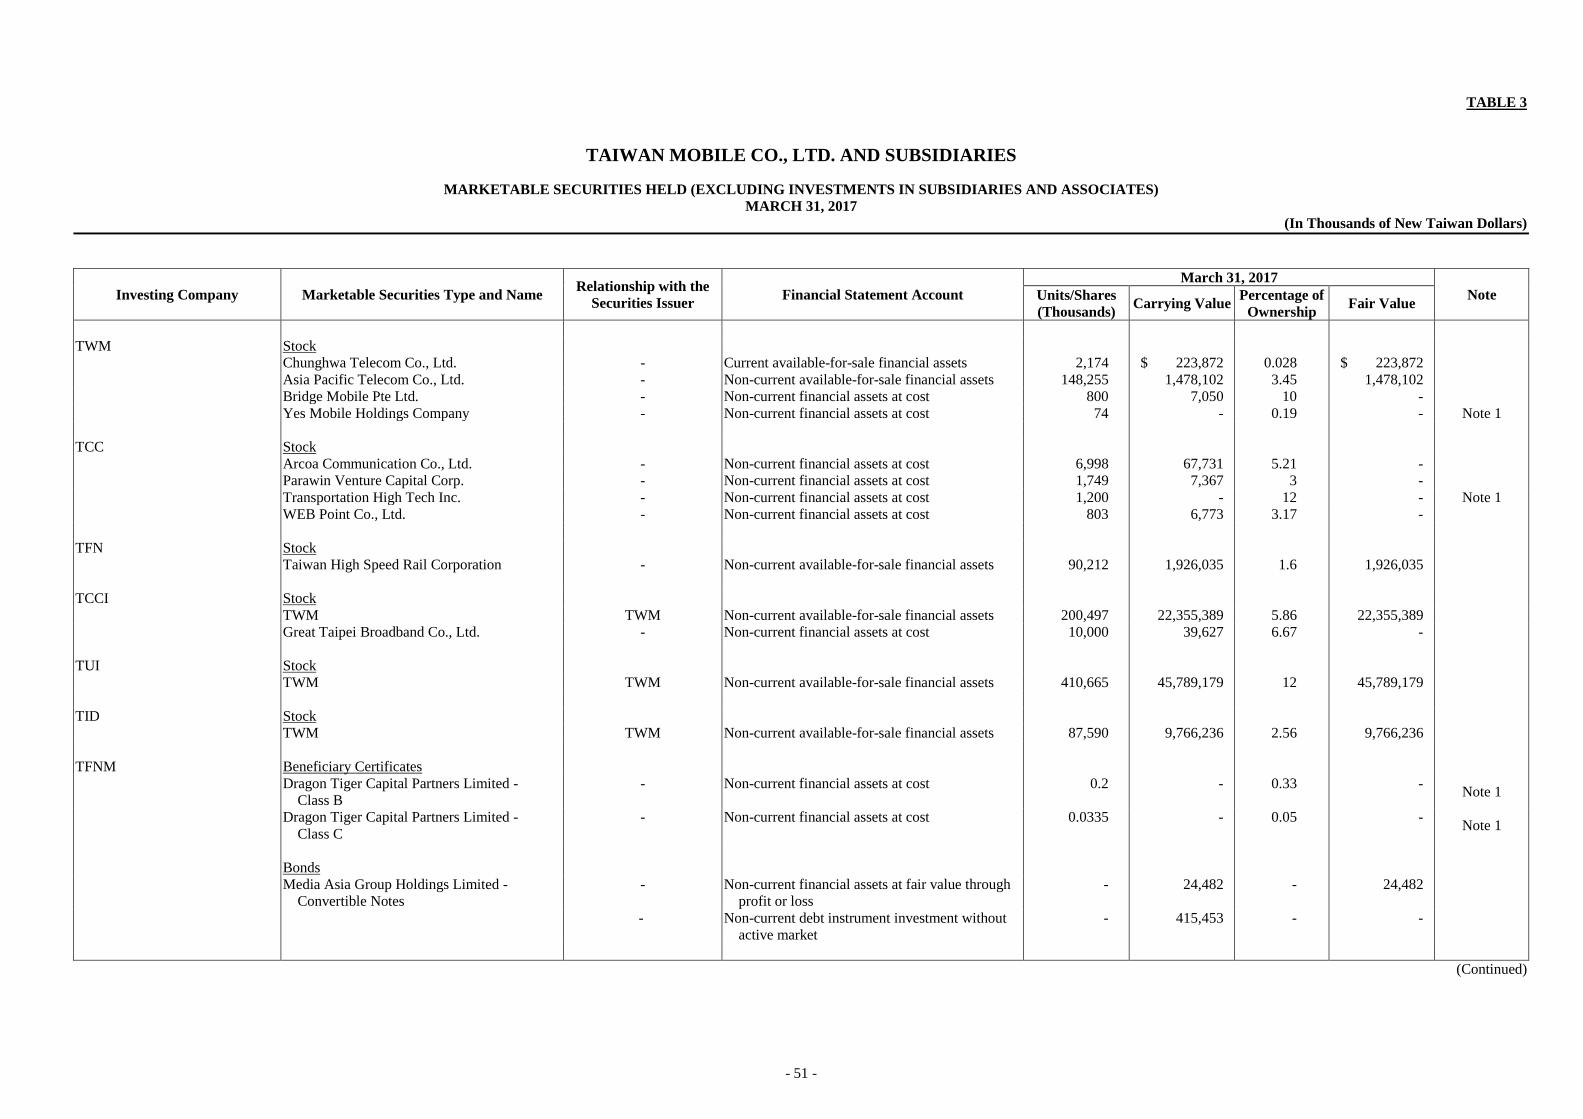
- 51 -
TABLE 3
TAIWAN MOBILE CO., LTD. AND SUBSIDIARIES
MARKETABLE SECURITIES HELD (EXCLUDING INVESTMENTS IN SUBSIDIARIES AND ASSOCIATES)
MARCH 31, 2017
(In Thousands of New Taiwan Dollars)
Investing Company Marketable Securities Type and Name Relationship with the
Securities Issuer Financial Statement Account
March 31, 2017
Note Units/Shares
(Thousands) Carrying Value
Percentage of
Ownership Fair Value
TWM Stock
Chunghwa Telecom Co., Ltd. - Current available-for-sale financial assets 2,174 $ 223,872 0.028 $ 223,872
Asia Pacific Telecom Co., Ltd. - Non-current available-for-sale financial assets 148,255 1,478,102 3.45 1,478,102
Bridge Mobile Pte Ltd. - Non-current financial assets at cost 800 7,050 10 -
Yes Mobile Holdings Company - Non-current financial assets at cost 74 - 0.19 - Note 1
TCC Stock
Arcoa Communication Co., Ltd. - Non-current financial assets at cost 6,998 67,731 5.21 -
Parawin Venture Capital Corp. - Non-current financial assets at cost 1,749 7,367 3 -
Transportation High Tech Inc. - Non-current financial assets at cost 1,200 - 12 - Note 1
WEB Point Co., Ltd. - Non-current financial assets at cost 803 6,773 3.17 -
TFN Stock
Taiwan High Speed Rail Corporation - Non-current available-for-sale financial assets 90,212 1,926,035 1.6 1,926,035
TCCI Stock
TWM TWM Non-current available-for-sale financial assets 200,497 22,355,389 5.86 22,355,389
Great Taipei Broadband Co., Ltd. - Non-current financial assets at cost 10,000 39,627 6.67 -
TUI Stock
TWM TWM Non-current available-for-sale financial assets 410,665 45,789,179 12 45,789,179
TID Stock
TWM TWM Non-current available-for-sale financial assets 87,590 9,766,236 2.56 9,766,236
TFNM Beneficiary Certificates
Dragon Tiger Capital Partners Limited -
Class B
- Non-current financial assets at cost 0.2 - 0.33 - Note 1
Dragon Tiger Capital Partners Limited -
Class C
- Non-current financial assets at cost 0.0335 - 0.05 - Note 1
Bonds
Media Asia Group Holdings Limited -
Convertible Notes
- Non-current financial assets at fair value through
profit or loss
- 24,482 - 24,482
- Non-current debt instrument investment without
active market
- 415,453 - -
(Continued)
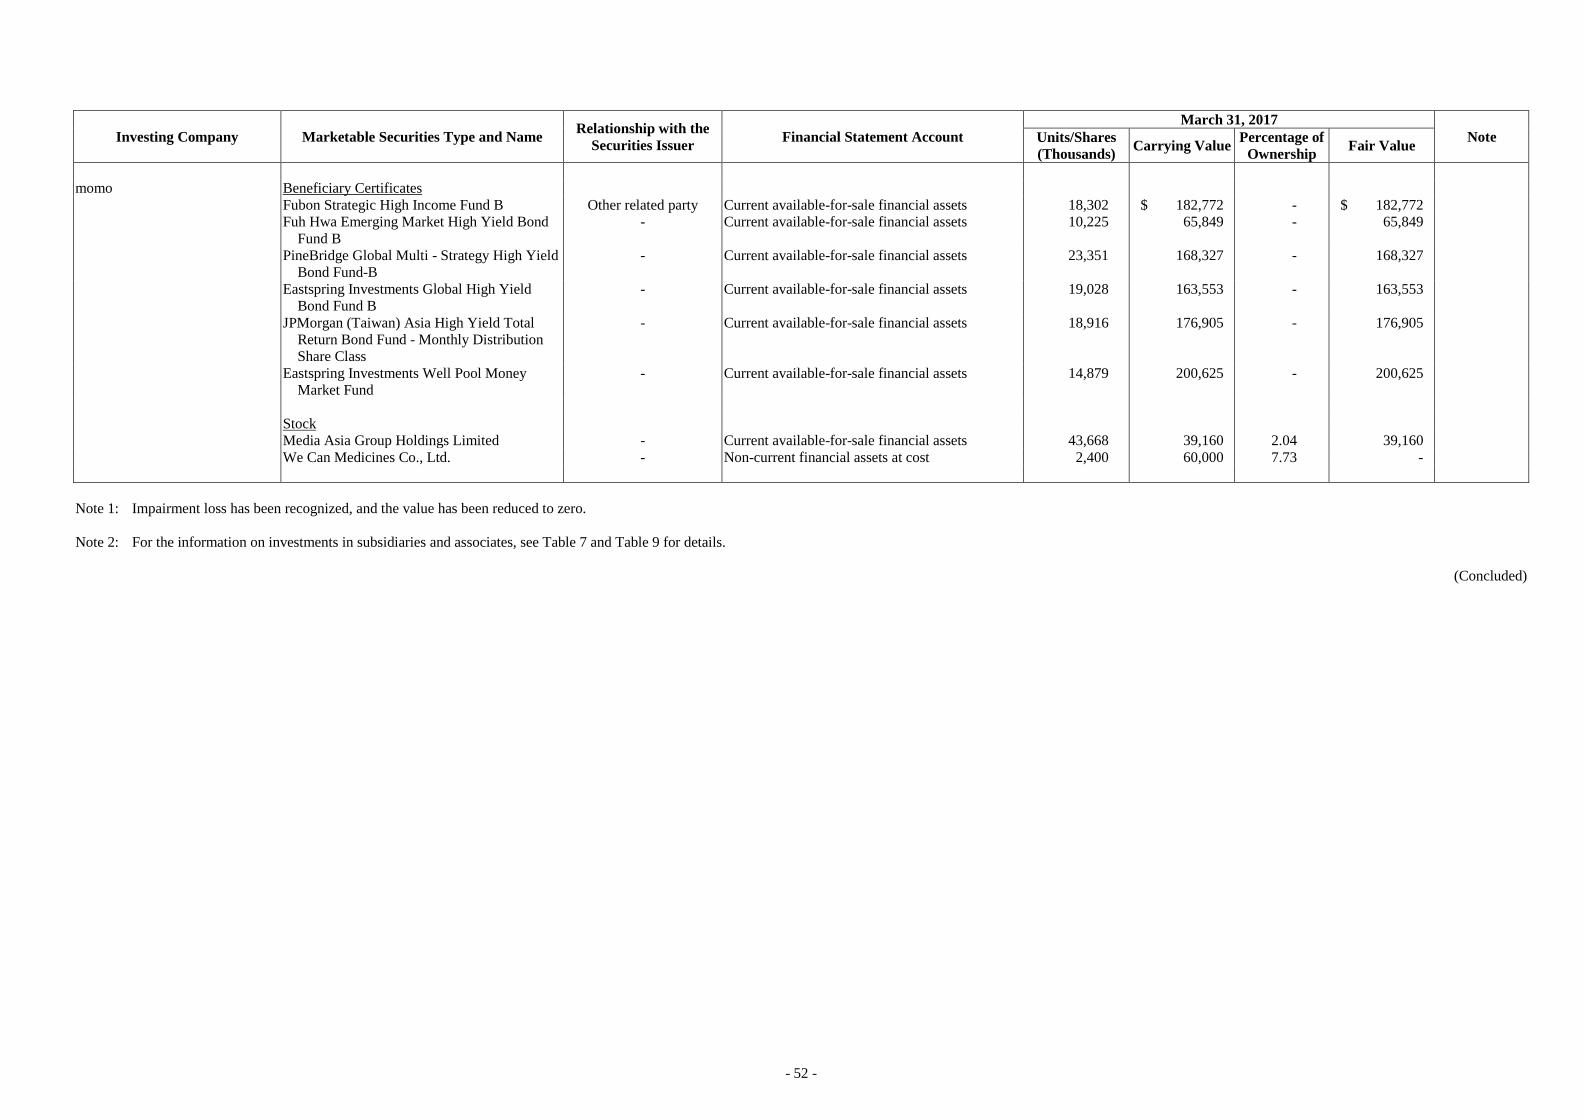
- 52 -
Investing Company Marketable Securities Type and Name Relationship with the
Securities Issuer Financial Statement Account
March 31, 2017
Note Units/Shares
(Thousands) Carrying Value
Percentage of
Ownership Fair Value
momo Beneficiary Certificates
Fubon Strategic High Income Fund B Other related party Current available-for-sale financial assets 18,302 $ 182,772 - $ 182,772
Fuh Hwa Emerging Market High Yield Bond
Fund B
- Current available-for-sale financial assets 10,225 65,849 - 65,849
PineBridge Global Multi - Strategy High Yield
Bond Fund-B
- Current available-for-sale financial assets 23,351 168,327 - 168,327
Eastspring Investments Global High Yield
Bond Fund B
- Current available-for-sale financial assets 19,028 163,553 - 163,553
JPMorgan (Taiwan) Asia High Yield Total
Return Bond Fund - Monthly Distribution
Share Class
- Current available-for-sale financial assets 18,916 176,905 - 176,905
Eastspring Investments Well Pool Money
Market Fund
- Current available-for-sale financial assets 14,879 200,625 - 200,625
Stock
Media Asia Group Holdings Limited - Current available-for-sale financial assets 43,668 39,160 2.04 39,160
We Can Medicines Co., Ltd. - Non-current financial assets at cost 2,400 60,000 7.73 -
Note 1: Impairment loss has been recognized, and the value has been reduced to zero.
Note 2: For the information on investments in subsidiaries and associates, see Table 7 and Table 9 for details.
(Concluded)
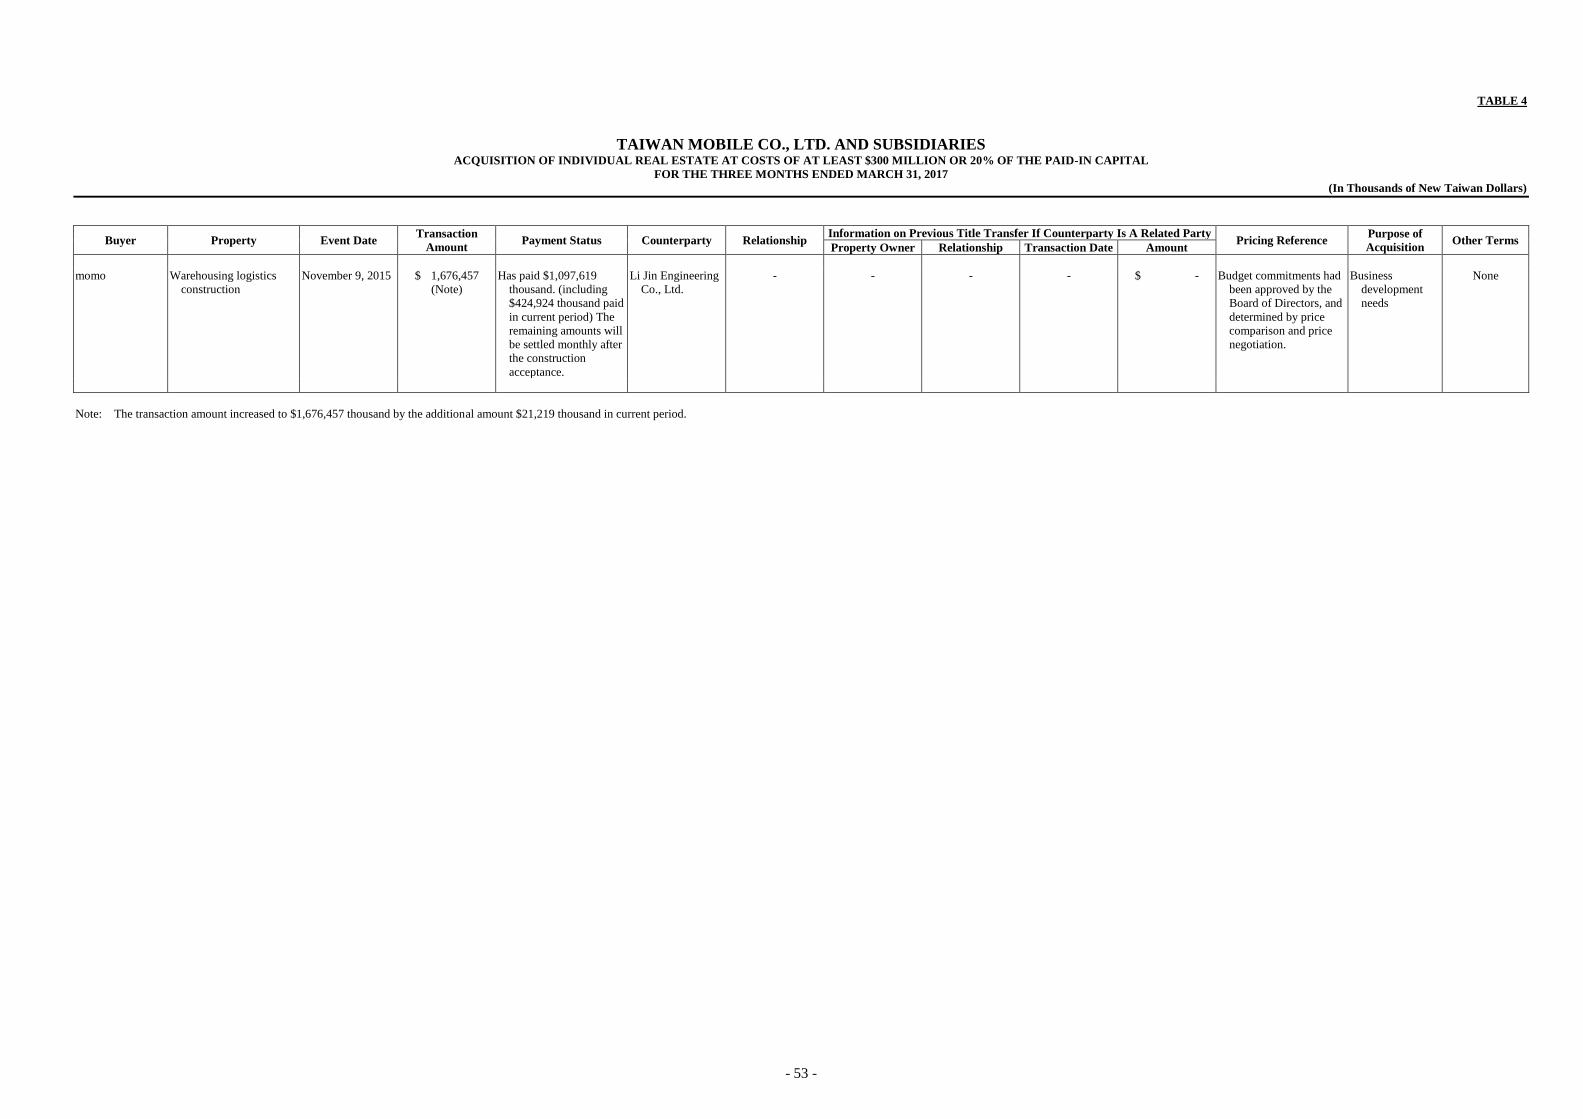
- 53 -
TABLE 4
TAIWAN MOBILE CO., LTD. AND SUBSIDIARIES ACQUISITION OF INDIVIDUAL REAL ESTATE AT COSTS OF AT LEAST $300 MILLION OR 20% OF THE PAID-IN CAPITAL
FOR THE THREE MONTHS ENDED MARCH 31, 2017
(In Thousands of New Taiwan Dollars)
Buyer Property Event Date Transaction
Amount Payment Status Counterparty Relationship
Information on Previous Title Transfer If Counterparty Is A Related Party Pricing Reference
Purpose of
Acquisition Other Terms
Property Owner Relationship Transaction Date Amount
momo Warehousing logistics
construction
November 9, 2015 $ 1,676,457
(Note)
Has paid $1,097,619
thousand. (including
$424,924 thousand paid
in current period) The
remaining amounts will
be settled monthly after
the construction
acceptance.
Li Jin Engineering
Co., Ltd.
- - - - $ - Budget commitments had
been approved by the
Board of Directors, and
determined by price
comparison and price
negotiation.
Business
development
needs
None
Note: The transaction amount increased to $1,676,457 thousand by the additional amount $21,219 thousand in current period.
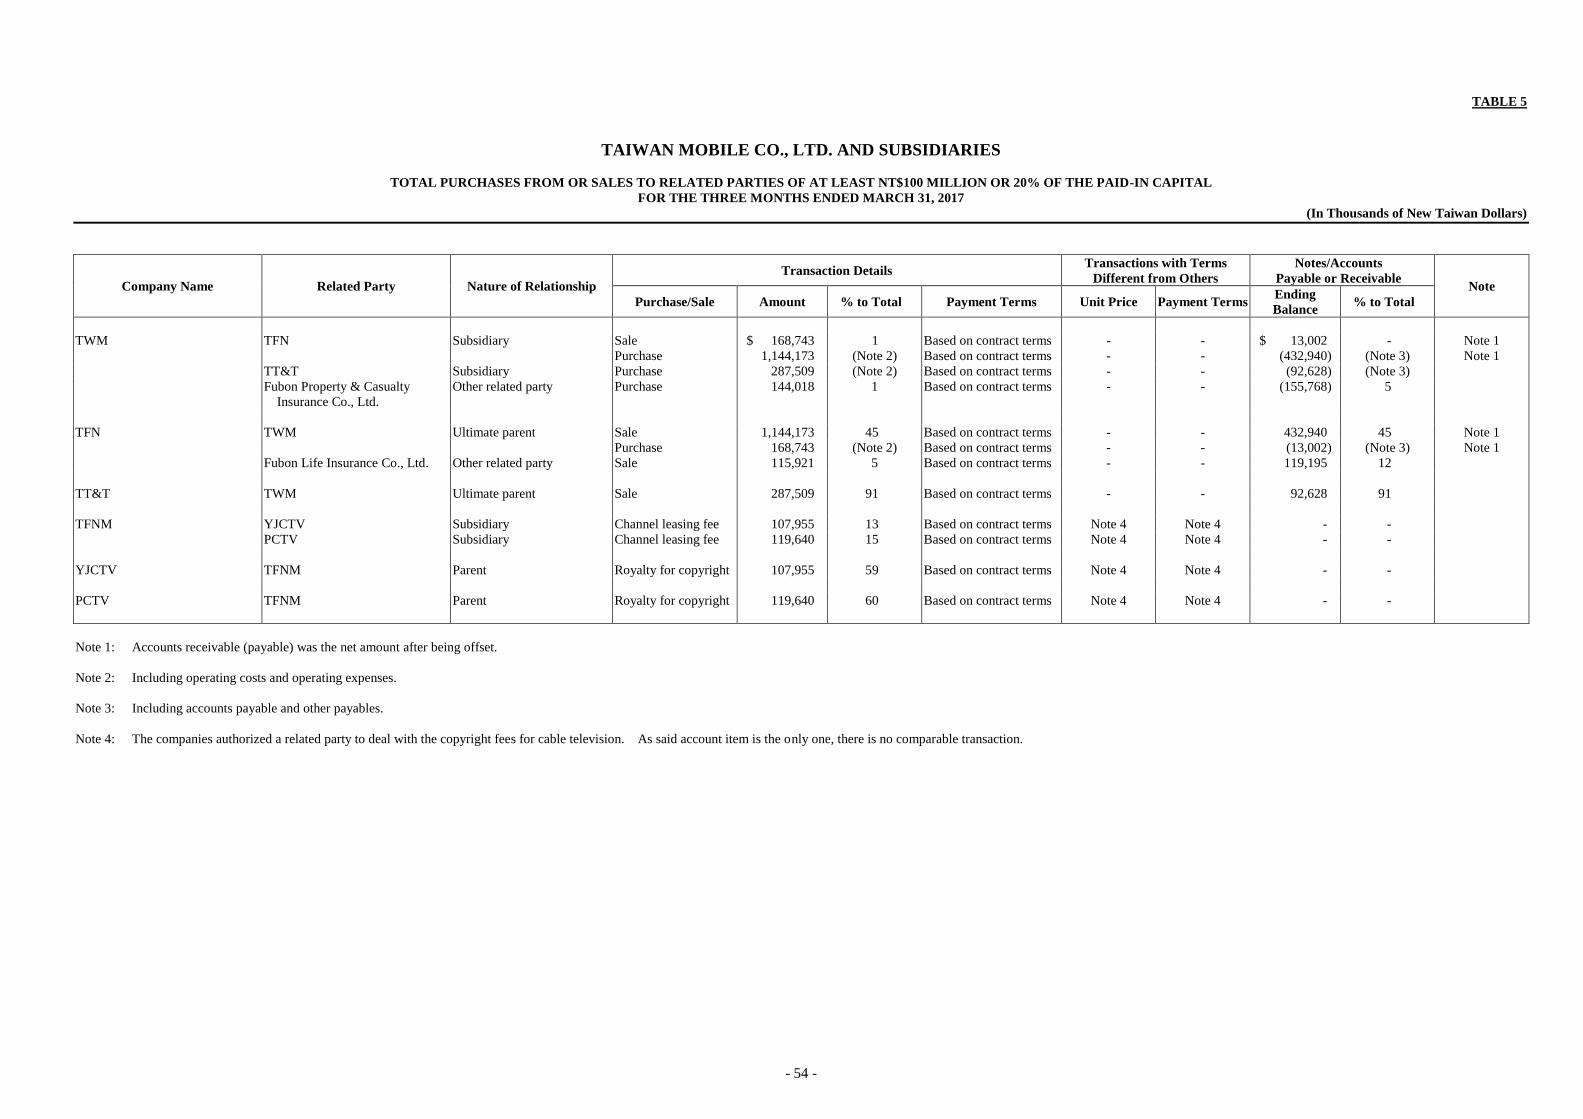
- 54 -
TABLE 5
TAIWAN MOBILE CO., LTD. AND SUBSIDIARIES
TOTAL PURCHASES FROM OR SALES TO RELATED PARTIES OF AT LEAST NT$100 MILLION OR 20% OF THE PAID-IN CAPITAL
FOR THE THREE MONTHS ENDED MARCH 31, 2017
(In Thousands of New Taiwan Dollars)
Company Name Related Party Nature of Relationship
Transaction Details Transactions with Terms
Different from Others
Notes/Accounts
Payable or Receivable Note
Purchase/Sale Amount % to Total Payment Terms Unit Price Payment Terms Ending
Balance % to Total
TWM TFN Subsidiary Sale $ 168,743 1 Based on contract terms - - $ 13,002 - Note 1
Purchase 1,144,173 (Note 2) Based on contract terms - - (432,940) (Note 3) Note 1
TT&T Subsidiary Purchase 287,509 (Note 2) Based on contract terms - - (92,628) (Note 3)
Fubon Property & Casualty
Insurance Co., Ltd.
Other related party Purchase 144,018 1 Based on contract terms - - (155,768) 5
TFN TWM Ultimate parent Sale 1,144,173 45 Based on contract terms - - 432,940 45 Note 1
Purchase 168,743 (Note 2) Based on contract terms - - (13,002) (Note 3) Note 1
Fubon Life Insurance Co., Ltd. Other related party Sale 115,921 5 Based on contract terms - - 119,195 12
TT&T TWM Ultimate parent Sale 287,509 91 Based on contract terms - - 92,628 91
TFNM YJCTV Subsidiary Channel leasing fee 107,955 13 Based on contract terms Note 4 Note 4 - -
PCTV Subsidiary Channel leasing fee 119,640 15 Based on contract terms Note 4 Note 4 - -
YJCTV TFNM Parent Royalty for copyright 107,955 59 Based on contract terms Note 4 Note 4 - -
PCTV TFNM Parent Royalty for copyright 119,640 60 Based on contract terms Note 4 Note 4 - -
Note 1: Accounts receivable (payable) was the net amount after being offset.
Note 2: Including operating costs and operating expenses.
Note 3: Including accounts payable and other payables.
Note 4: The companies authorized a related party to deal with the copyright fees for cable television. As said account item is the only one, there is no comparable transaction.
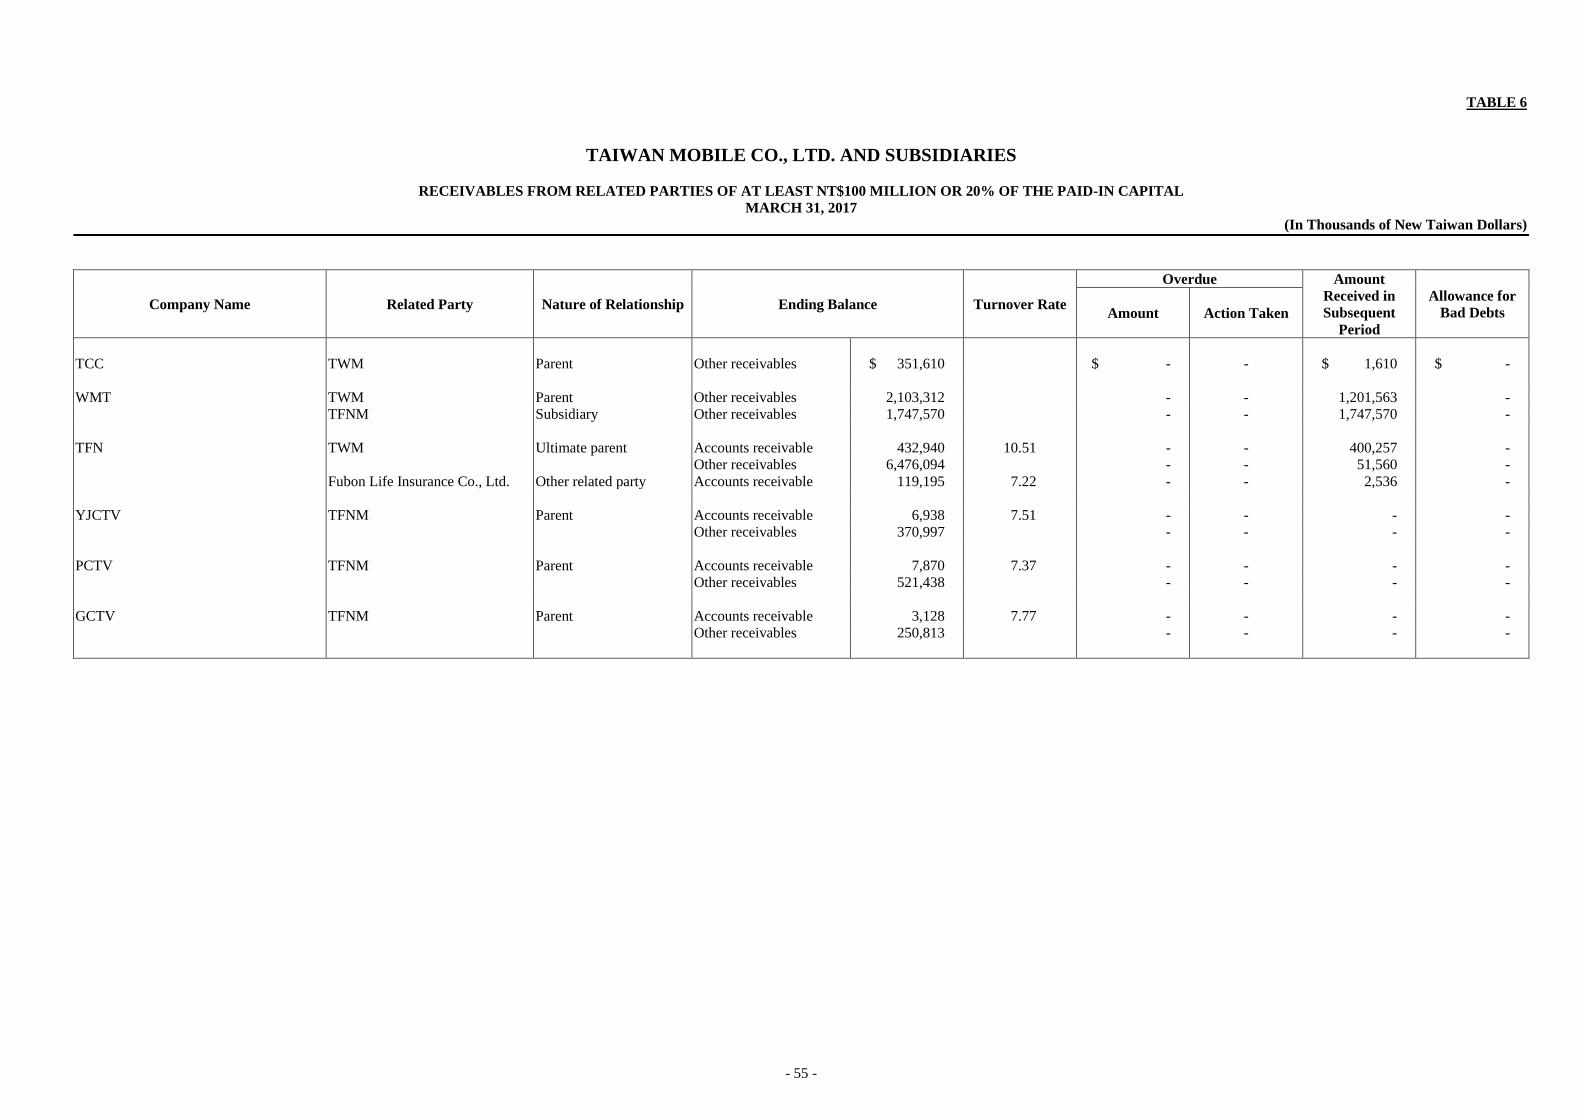
- 55 -
TABLE 6
TAIWAN MOBILE CO., LTD. AND SUBSIDIARIES
RECEIVABLES FROM RELATED PARTIES OF AT LEAST NT$100 MILLION OR 20% OF THE PAID-IN CAPITAL
MARCH 31, 2017
(In Thousands of New Taiwan Dollars)
Company Name Related Party Nature of Relationship Ending Balance Turnover Rate
Overdue Amount
Received in
Subsequent
Period
Allowance for
Bad Debts Amount Action Taken
TCC TWM Parent Other receivables $ 351,610 $ - - $ 1,610 $ -
WMT TWM Parent Other receivables 2,103,312 - - 1,201,563 -
TFNM Subsidiary Other receivables 1,747,570 - - 1,747,570 -
TFN TWM Ultimate parent Accounts receivable 432,940 10.51 - - 400,257 -
Other receivables 6,476,094 - - 51,560 -
Fubon Life Insurance Co., Ltd. Other related party Accounts receivable 119,195 7.22 - - 2,536 -
YJCTV TFNM Parent Accounts receivable 6,938 7.51 - - - -
Other receivables 370,997 - - - -
PCTV TFNM Parent Accounts receivable 7,870 7.37 - - - -
Other receivables 521,438 - - - -
GCTV TFNM Parent Accounts receivable 3,128 7.77 - - - -
Other receivables 250,813 - - - -
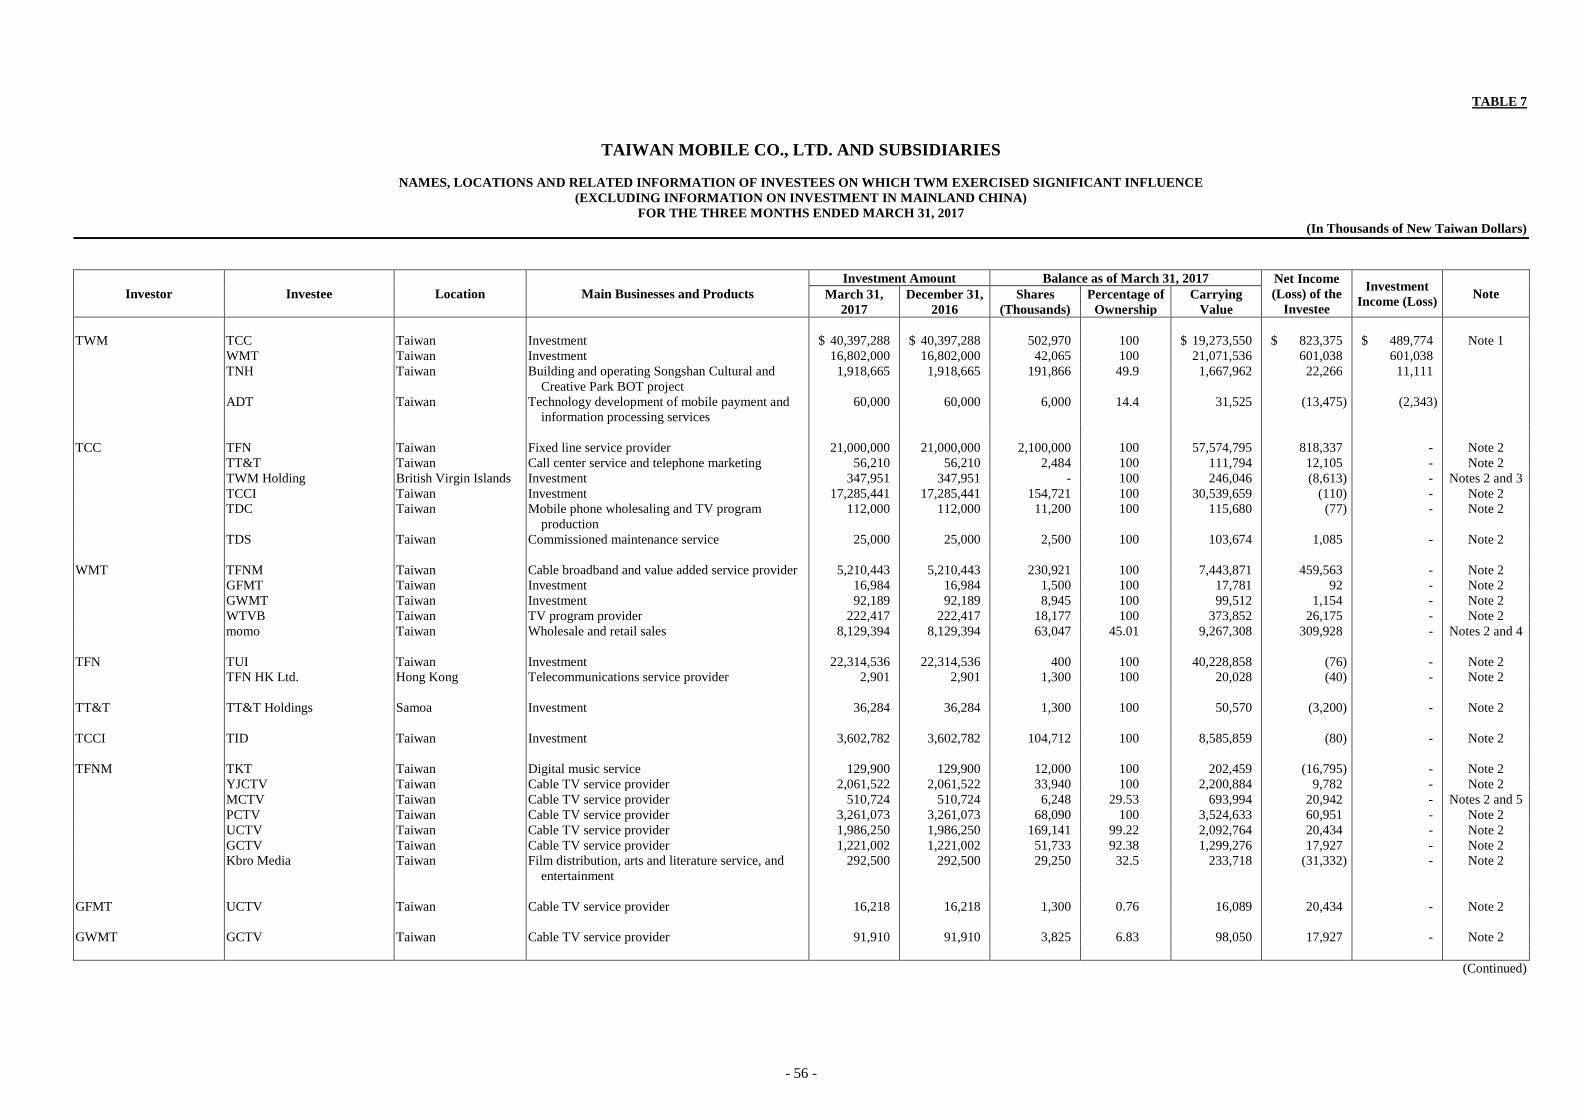
- 56 -
TABLE 7
TAIWAN MOBILE CO., LTD. AND SUBSIDIARIES
NAMES, LOCATIONS AND RELATED INFORMATION OF INVESTEES ON WHICH TWM EXERCISED SIGNIFICANT INFLUENCE
(EXCLUDING INFORMATION ON INVESTMENT IN MAINLAND CHINA)
FOR THE THREE MONTHS ENDED MARCH 31, 2017
(In Thousands of New Taiwan Dollars)
Investor Investee Location Main Businesses and Products
Investment Amount Balance as of March 31, 2017 Net Income
(Loss) of the
Investee
Investment
Income (Loss) Note March 31,
2017
December 31,
2016
Shares
(Thousands)
Percentage of
Ownership
Carrying
Value
TWM TCC Taiwan Investment $ 40,397,288 $ 40,397,288 502,970 100 $ 19,273,550 $ 823,375 $ 489,774 Note 1
WMT Taiwan Investment 16,802,000 16,802,000 42,065 100 21,071,536 601,038 601,038
TNH Taiwan Building and operating Songshan Cultural and
Creative Park BOT project
1,918,665 1,918,665 191,866 49.9 1,667,962 22,266 11,111
ADT Taiwan Technology development of mobile payment and
information processing services
60,000 60,000 6,000 14.4 31,525 (13,475) (2,343)
TCC TFN Taiwan Fixed line service provider 21,000,000 21,000,000 2,100,000 100 57,574,795 818,337 - Note 2
TT&T Taiwan Call center service and telephone marketing 56,210 56,210 2,484 100 111,794 12,105 - Note 2
TWM Holding British Virgin Islands Investment 347,951 347,951 - 100 246,046 (8,613) - Notes 2 and 3
TCCI Taiwan Investment 17,285,441 17,285,441 154,721 100 30,539,659 (110) - Note 2
TDC Taiwan Mobile phone wholesaling and TV program
production
112,000 112,000 11,200 100 115,680 (77) - Note 2
TDS Taiwan Commissioned maintenance service 25,000 25,000 2,500 100 103,674 1,085 - Note 2
WMT TFNM Taiwan Cable broadband and value added service provider 5,210,443 5,210,443 230,921 100 7,443,871 459,563 - Note 2
GFMT Taiwan Investment 16,984 16,984 1,500 100 17,781 92 - Note 2
GWMT Taiwan Investment 92,189 92,189 8,945 100 99,512 1,154 - Note 2
WTVB Taiwan TV program provider 222,417 222,417 18,177 100 373,852 26,175 - Note 2
momo Taiwan Wholesale and retail sales 8,129,394 8,129,394 63,047 45.01 9,267,308 309,928 - Notes 2 and 4
TFN TUI Taiwan Investment 22,314,536 22,314,536 400 100 40,228,858 (76) - Note 2
TFN HK Ltd. Hong Kong Telecommunications service provider 2,901 2,901 1,300 100 20,028 (40) - Note 2
TT&T TT&T Holdings Samoa Investment 36,284 36,284 1,300 100 50,570 (3,200) - Note 2
TCCI TID Taiwan Investment 3,602,782 3,602,782 104,712 100 8,585,859 (80) - Note 2
TFNM TKT Taiwan Digital music service 129,900 129,900 12,000 100 202,459 (16,795) - Note 2
YJCTV Taiwan Cable TV service provider 2,061,522 2,061,522 33,940 100 2,200,884 9,782 - Note 2
MCTV Taiwan Cable TV service provider 510,724 510,724 6,248 29.53 693,994 20,942 - Notes 2 and 5
PCTV Taiwan Cable TV service provider 3,261,073 3,261,073 68,090 100 3,524,633 60,951 - Note 2
UCTV Taiwan Cable TV service provider 1,986,250 1,986,250 169,141 99.22 2,092,764 20,434 - Note 2
GCTV Taiwan Cable TV service provider 1,221,002 1,221,002 51,733 92.38 1,299,276 17,927 - Note 2
Kbro Media Taiwan Film distribution, arts and literature service, and
entertainment
292,500 292,500 29,250 32.5 233,718 (31,332) - Note 2
GFMT UCTV Taiwan Cable TV service provider 16,218 16,218 1,300 0.76 16,089 20,434 - Note 2
GWMT GCTV Taiwan Cable TV service provider 91,910 91,910 3,825 6.83 98,050 17,927 - Note 2
(Continued)
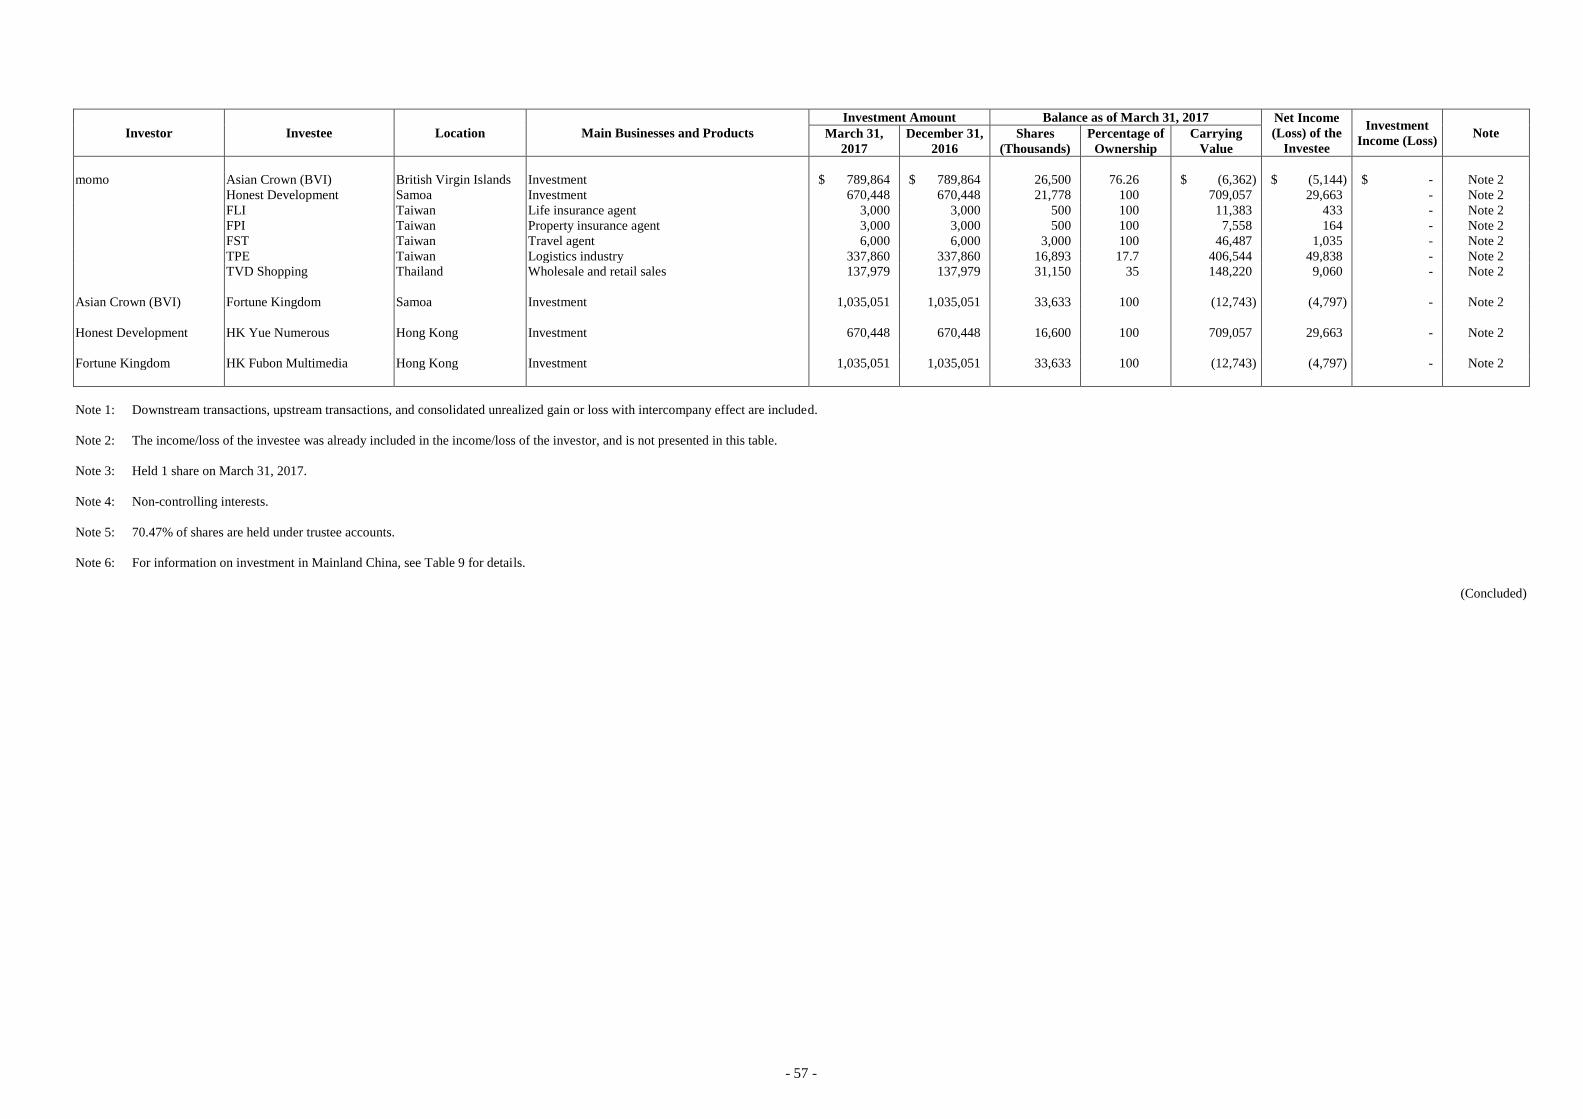
- 57 -
Investor Investee Location Main Businesses and Products
Investment Amount Balance as of March 31, 2017 Net Income
(Loss) of the
Investee
Investment
Income (Loss) Note March 31,
2017
December 31,
2016
Shares
(Thousands)
Percentage of
Ownership
Carrying
Value
momo Asian Crown (BVI) British Virgin Islands Investment $ 789,864 $ 789,864 26,500 76.26 $ (6,362) $ (5,144) $ - Note 2
Honest Development Samoa Investment 670,448 670,448 21,778 100 709,057 29,663 - Note 2
FLI Taiwan Life insurance agent 3,000 3,000 500 100 11,383 433 - Note 2
FPI Taiwan Property insurance agent 3,000 3,000 500 100 7,558 164 - Note 2
FST Taiwan Travel agent 6,000 6,000 3,000 100 46,487 1,035 - Note 2
TPE Taiwan Logistics industry 337,860 337,860 16,893 17.7 406,544 49,838 - Note 2
TVD Shopping Thailand Wholesale and retail sales 137,979 137,979 31,150 35 148,220 9,060 - Note 2
Asian Crown (BVI) Fortune Kingdom Samoa Investment 1,035,051 1,035,051 33,633 100 (12,743) (4,797) - Note 2
Honest Development HK Yue Numerous Hong Kong Investment 670,448 670,448 16,600 100 709,057 29,663 - Note 2
Fortune Kingdom HK Fubon Multimedia Hong Kong Investment 1,035,051 1,035,051 33,633 100 (12,743) (4,797) - Note 2
Note 1: Downstream transactions, upstream transactions, and consolidated unrealized gain or loss with intercompany effect are included.
Note 2: The income/loss of the investee was already included in the income/loss of the investor, and is not presented in this table.
Note 3: Held 1 share on March 31, 2017.
Note 4: Non-controlling interests.
Note 5: 70.47% of shares are held under trustee accounts.
Note 6: For information on investment in Mainland China, see Table 9 for details.
(Concluded)
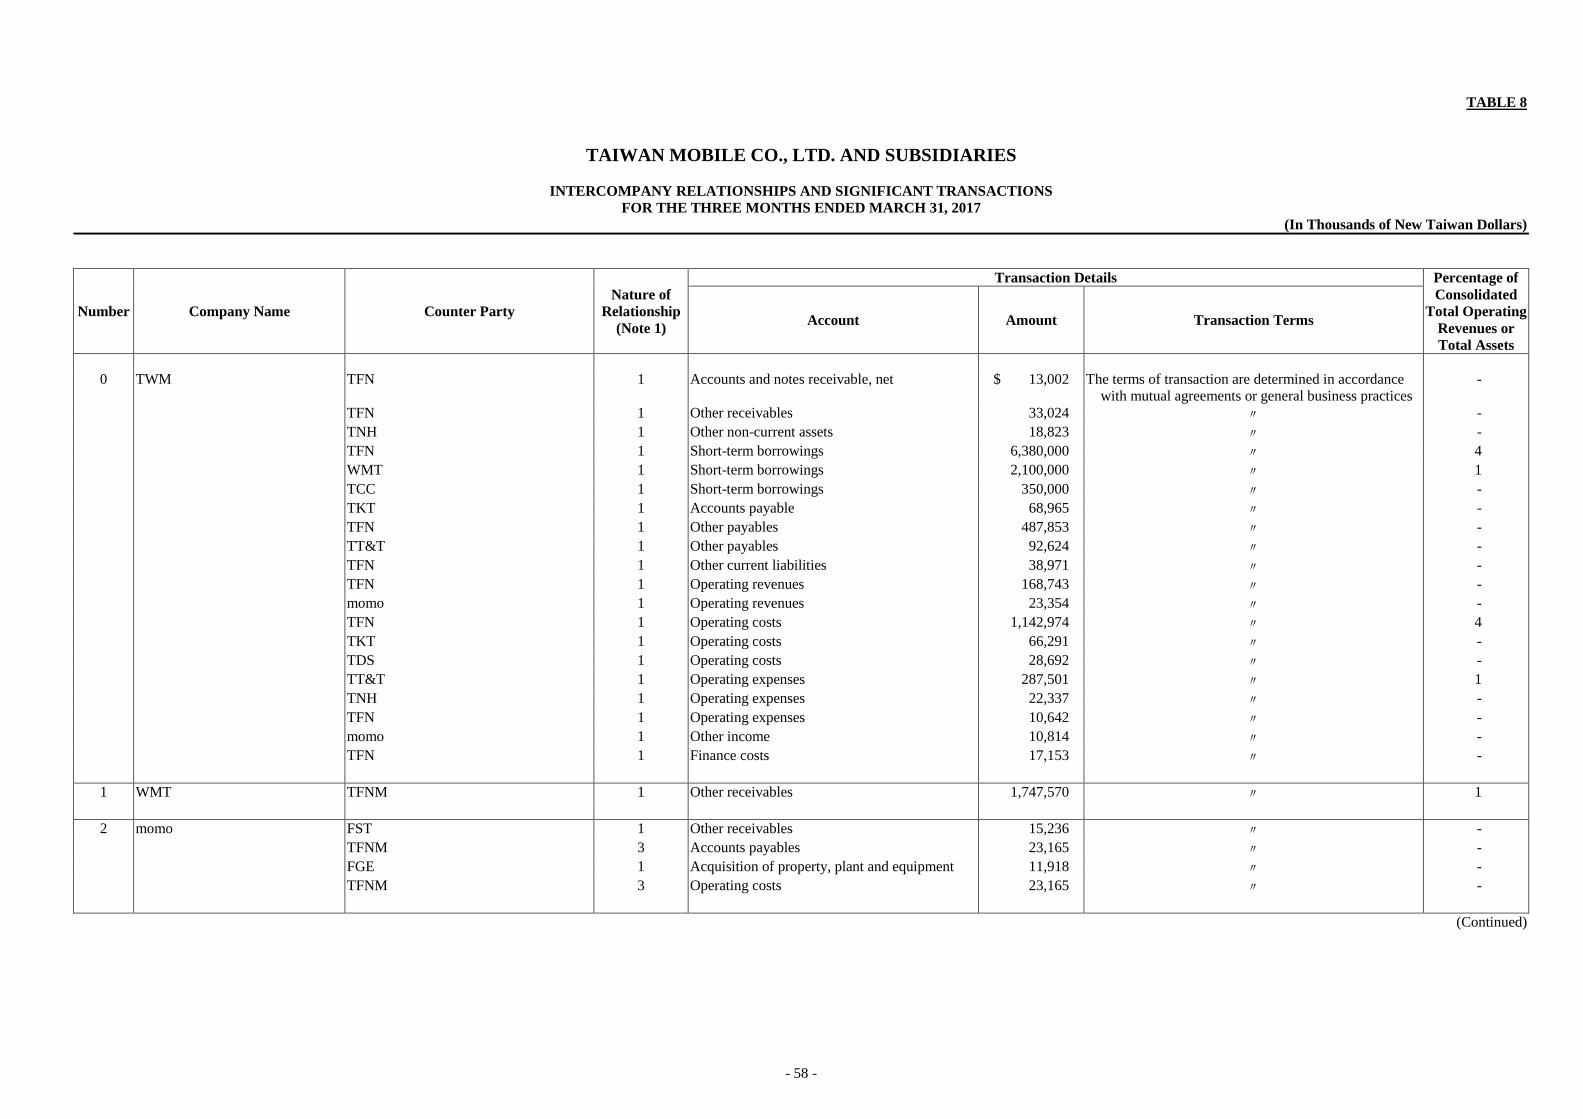
- 58 -
TABLE 8
TAIWAN MOBILE CO., LTD. AND SUBSIDIARIES
INTERCOMPANY RELATIONSHIPS AND SIGNIFICANT TRANSACTIONS
FOR THE THREE MONTHS ENDED MARCH 31, 2017
(In Thousands of New Taiwan Dollars)
Number Company Name Counter Party
Nature of
Relationship
(Note 1)
Transaction Details Percentage of
Consolidated
Total Operating
Revenues or
Total Assets
Account Amount Transaction Terms
0 TWM TFN 1 Accounts and notes receivable, net $ 13,002 The terms of transaction are determined in accordance
with mutual agreements or general business practices
-
TFN 1 Other receivables 33,024 〃 -
TNH 1 Other non-current assets 18,823 〃 -
TFN 1 Short-term borrowings 6,380,000 〃 4
WMT 1 Short-term borrowings 2,100,000 〃 1
TCC 1 Short-term borrowings 350,000 〃 -
TKT 1 Accounts payable 68,965 〃 -
TFN 1 Other payables 487,853 〃 -
TT&T 1 Other payables 92,624 〃 -
TFN 1 Other current liabilities 38,971 〃 -
TFN 1 Operating revenues 168,743 〃 -
momo 1 Operating revenues 23,354 〃 -
TFN 1 Operating costs 1,142,974 〃 4
TKT 1 Operating costs 66,291 〃 -
TDS 1 Operating costs 28,692 〃 -
TT&T 1 Operating expenses 287,501 〃 1
TNH 1 Operating expenses 22,337 〃 -
TFN 1 Operating expenses 10,642 〃 -
momo 1 Other income 10,814 〃 -
TFN 1 Finance costs 17,153 〃 -
1 WMT TFNM 1 Other receivables 1,747,570 〃 1
2 momo FST 1 Other receivables 15,236 〃 -
TFNM 3 Accounts payables 23,165 〃 -
FGE 1 Acquisition of property, plant and equipment 11,918 〃 -
TFNM 3 Operating costs 23,165 〃 -
(Continued)
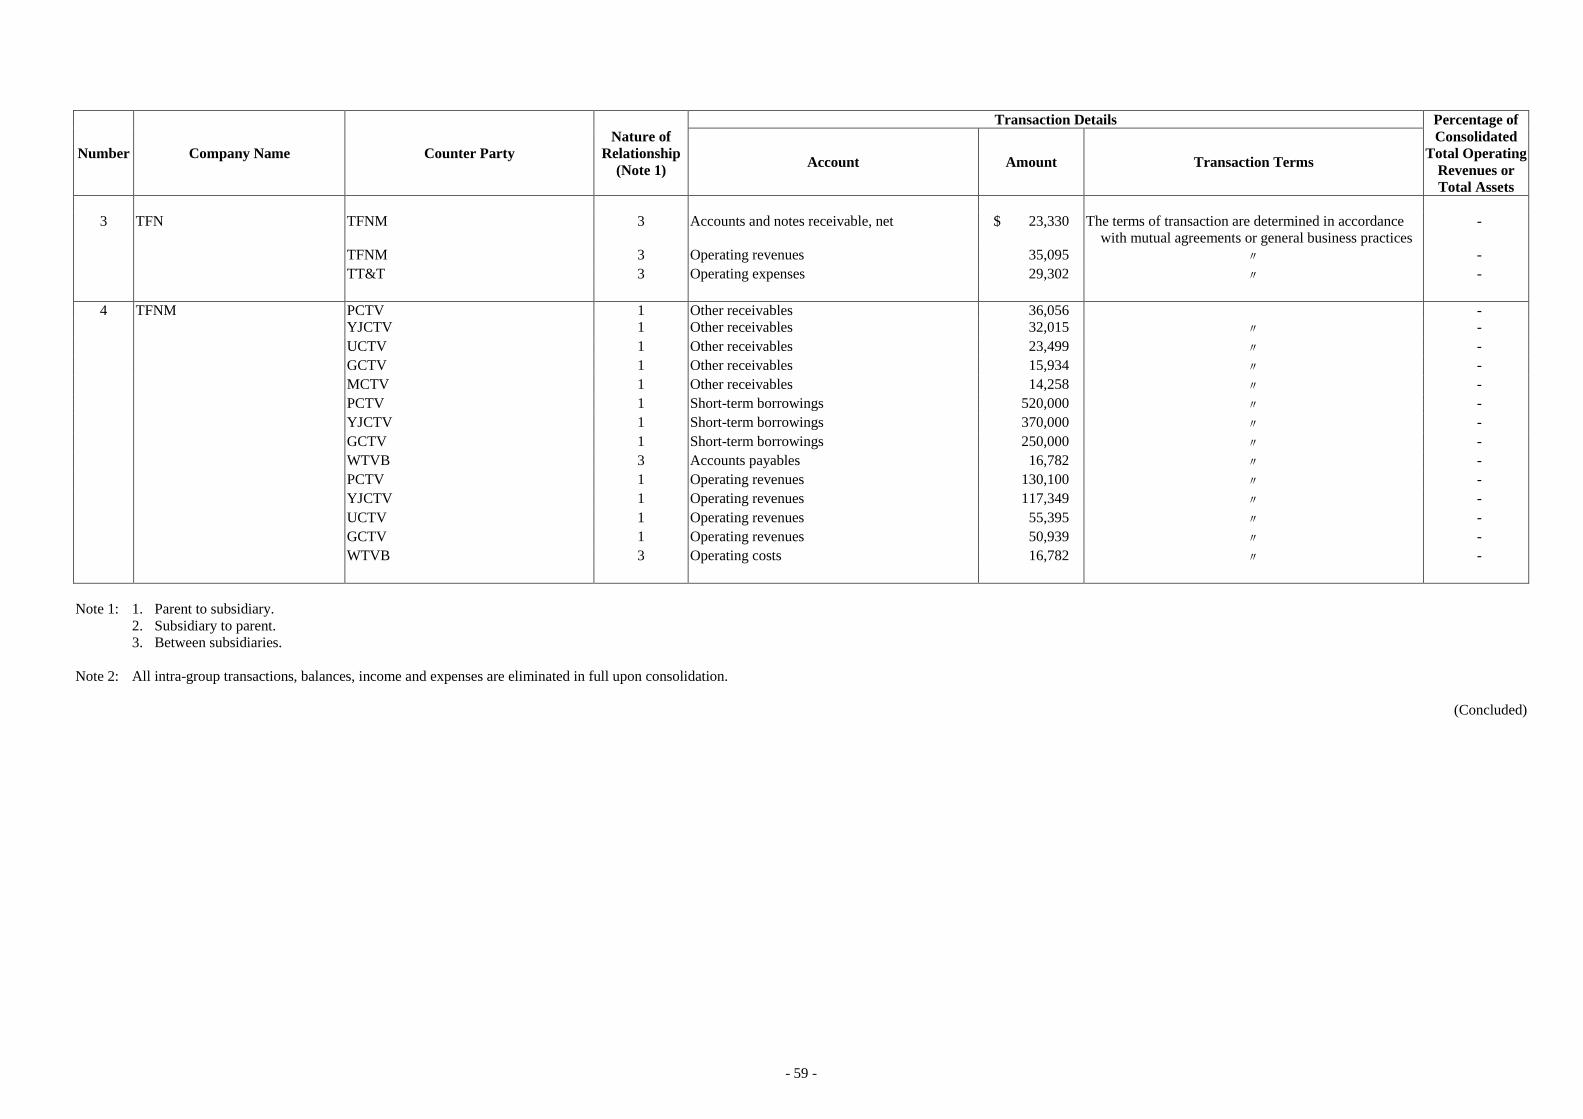
- 59 -
Number Company Name Counter Party
Nature of
Relationship
(Note 1)
Transaction Details Percentage of
Consolidated
Total Operating
Revenues or
Total Assets
Account Amount Transaction Terms
3 TFN TFNM 3 Accounts and notes receivable, net $ 23,330 The terms of transaction are determined in accordance
with mutual agreements or general business practices
-
TFNM 3 Operating revenues 35,095 〃 -
TT&T 3 Operating expenses 29,302 〃 -
4 TFNM PCTV 1 Other receivables 36,056 -
YJCTV 1 Other receivables 32,015 〃 -
UCTV 1 Other receivables 23,499 〃 -
GCTV 1 Other receivables 15,934 〃 -
MCTV 1 Other receivables 14,258 〃 -
PCTV 1 Short-term borrowings 520,000 〃 -
YJCTV 1 Short-term borrowings 370,000 〃 -
GCTV 1 Short-term borrowings 250,000 〃 -
WTVB 3 Accounts payables 16,782 〃 -
PCTV 1 Operating revenues 130,100 〃 -
YJCTV 1 Operating revenues 117,349 〃 -
UCTV 1 Operating revenues 55,395 〃 -
GCTV 1 Operating revenues 50,939 〃 -
WTVB 3 Operating costs 16,782 〃 -
Note 1: 1. Parent to subsidiary.
2. Subsidiary to parent.
3. Between subsidiaries.
Note 2: All intra-group transactions, balances, income and expenses are eliminated in full upon consolidation.
(Concluded)
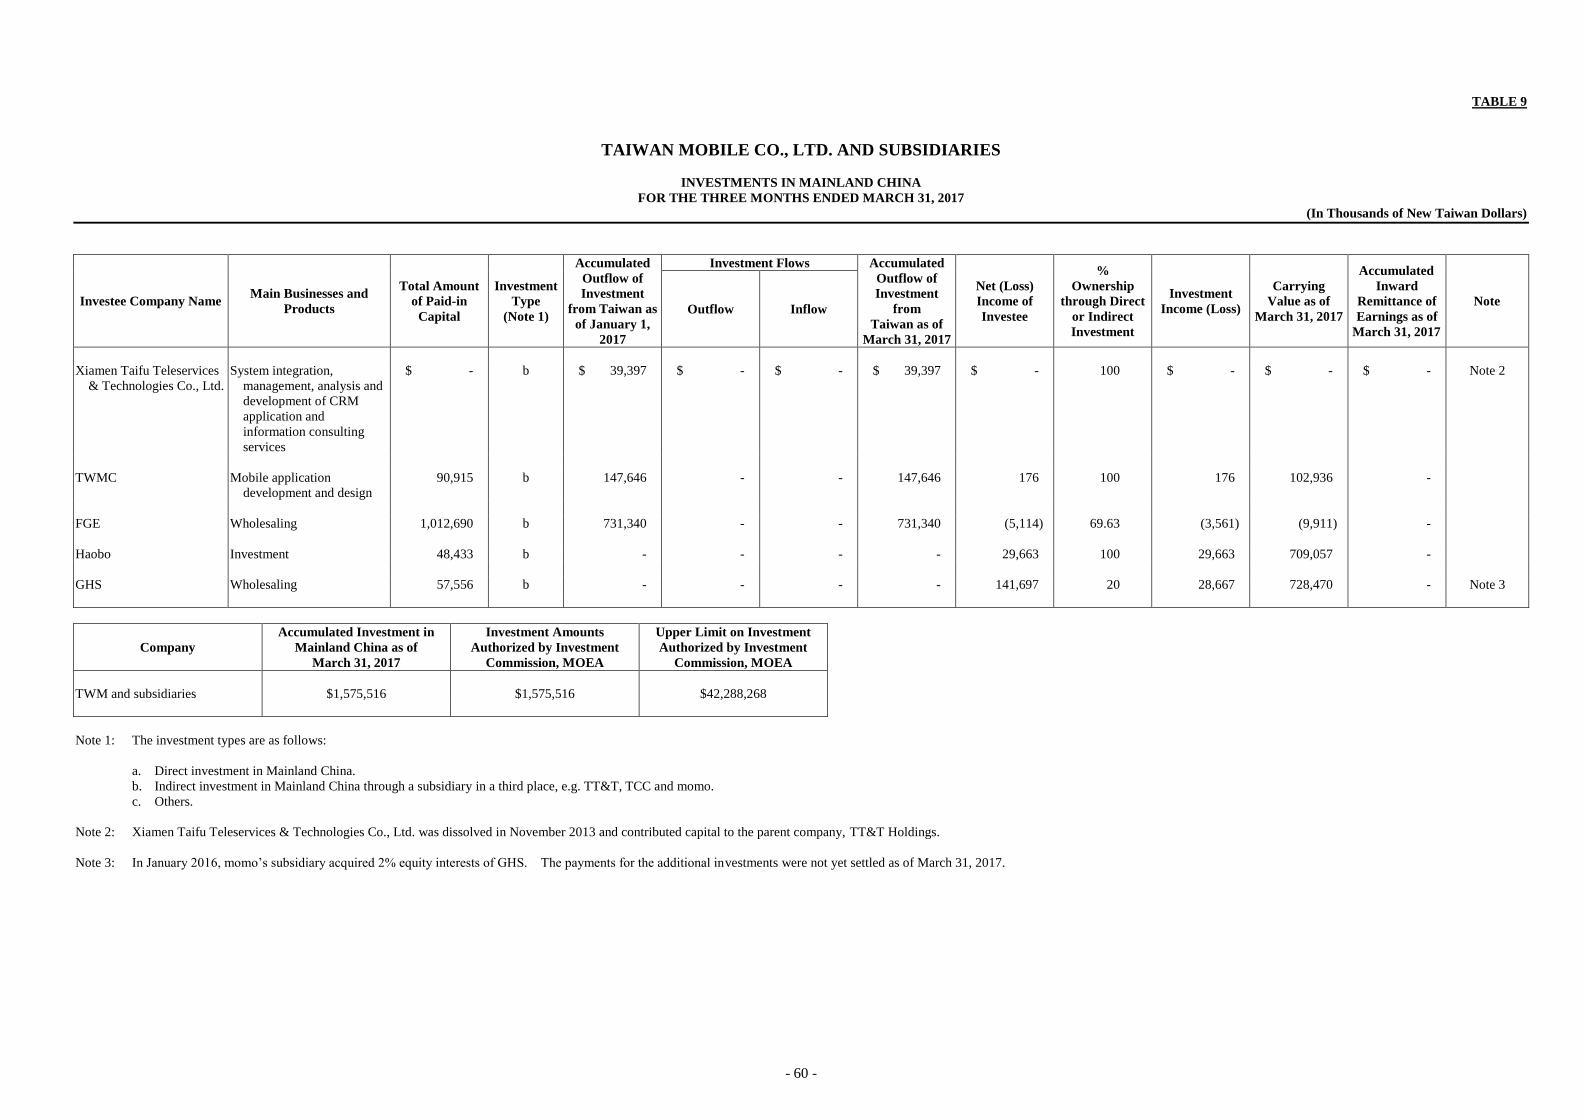
- 60 -
TABLE 9
TAIWAN MOBILE CO., LTD. AND SUBSIDIARIES
INVESTMENTS IN MAINLAND CHINA
FOR THE THREE MONTHS ENDED MARCH 31, 2017
(In Thousands of New Taiwan Dollars)
Investee Company Name Main Businesses and
Products
Total Amount
of Paid-in
Capital
Investment
Type
(Note 1)
Accumulated
Outflow of
Investment
from Taiwan as
of January 1,
2017
Investment Flows Accumulated
Outflow of
Investment
from
Taiwan as of
March 31, 2017
Net (Loss)
Income of
Investee
%
Ownership
through Direct
or Indirect
Investment
Investment
Income (Loss)
Carrying
Value as of
March 31, 2017
Accumulated
Inward
Remittance of
Earnings as of
March 31, 2017
Note Outflow Inflow
Xiamen Taifu Teleservices
& Technologies Co., Ltd.
System integration,
management, analysis and
development of CRM
application and
information consulting
services
$ - b $ 39,397 $ - $ - $ 39,397 $ - 100 $ - $ - $ - Note 2
TWMC Mobile application
development and design
90,915 b 147,646 - - 147,646 176 100 176 102,936 -
FGE Wholesaling 1,012,690 b 731,340 - - 731,340 (5,114) 69.63 (3,561) (9,911) -
Haobo Investment 48,433 b - - - - 29,663 100 29,663 709,057 -
GHS Wholesaling 57,556 b - - - - 141,697 20 28,667 728,470 - Note 3
Company
Accumulated Investment in
Mainland China as of
March 31, 2017
Investment Amounts
Authorized by Investment
Commission, MOEA
Upper Limit on Investment
Authorized by Investment
Commission, MOEA
TWM and subsidiaries $1,575,516 $1,575,516 $42,288,268
Note 1: The investment types are as follows:
a. Direct investment in Mainland China.
b. Indirect investment in Mainland China through a subsidiary in a third place, e.g. TT&T, TCC and momo.
c. Others.
Note 2: Xiamen Taifu Teleservices & Technologies Co., Ltd. was dissolved in November 2013 and contributed capital to the parent company, TT&T Holdings.
Note 3: In January 2016, momo’s subsidiary acquired 2% equity interests of GHS. The payments for the additional investments were not yet settled as of March 31, 2017.