Embed Size (px)
Citation preview

Tamar Klaiman, PhD, MPH; Athena Pantazis, MPH; Anjali Chainani, MPH; Betty Bekemeier,
PhD, MPH, FAAN
Identifying Positive Deviant Local Health Departments in Maternal and
Child Health

Acknowledgement
• Funding provided by the Robert Wood Johnson Foundation Public Health Services and Systems Mentored Research Award

Research Objective
To identify and learn from LHD jurisdictions
that perform better than expected in MCH outcomes compared to peers
Framework: Positive Deviance
• Used to identify and learn from units that perform beyond expectations
• Defined by context• Performance Improvement
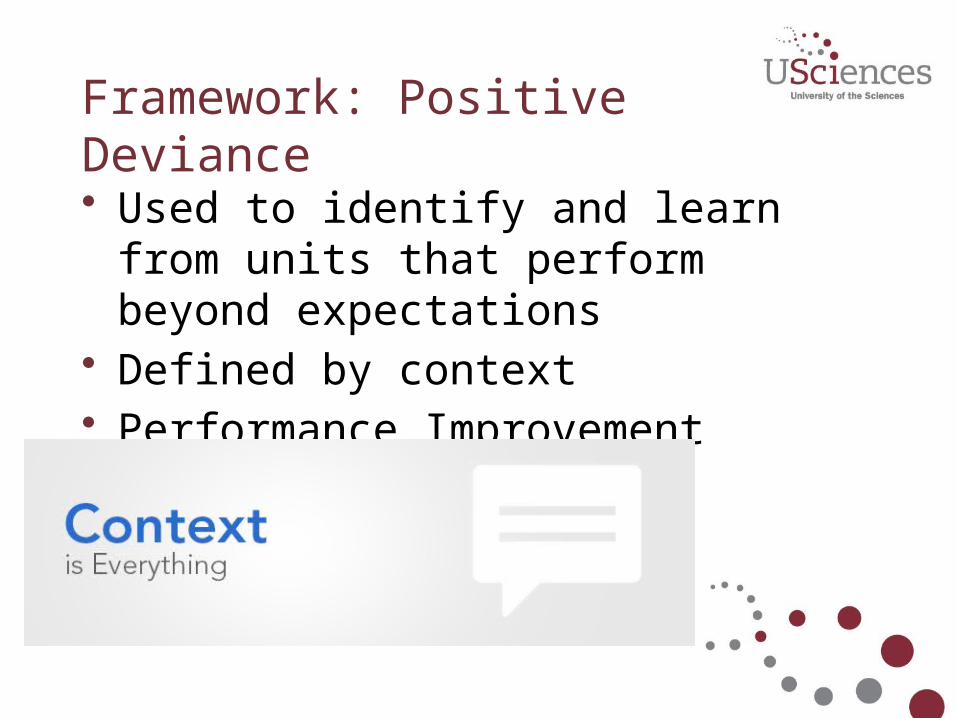
Framework: Positive Deviance Method
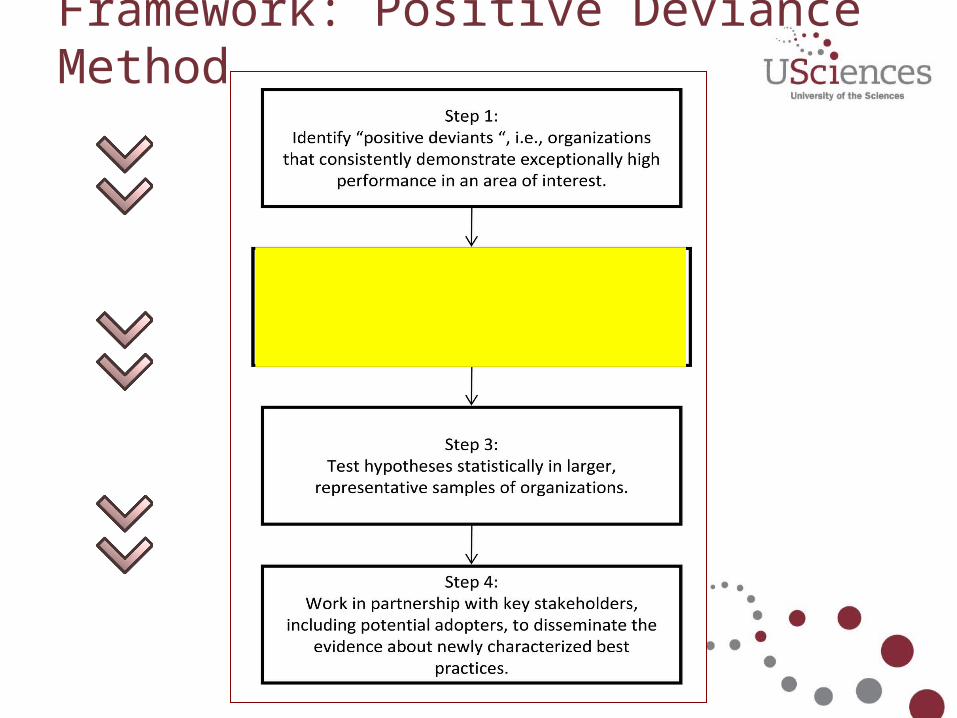
Framework: Realist Evaluation (Pawson and Tilley)
Outcome
Mechanism
ContextContext: LHD environment (budget, population, geography)Mechanisms: leadership, partnerships, service provisionsOutcomes:• Teen pregnancy rates• Low birth weight• Pre-natal care• Infant mortality rate
C + M = O
Methods• 2009-2010 Public Health Activities and Services
Tracking (PHAST) data – WA (n=35), FL (n=67 ), NY [n=48 (excluded NYC and 9
additional LHDs)] uniquely detailed and matched annual MCH-related county-level expenditure data
C+M=O Variables
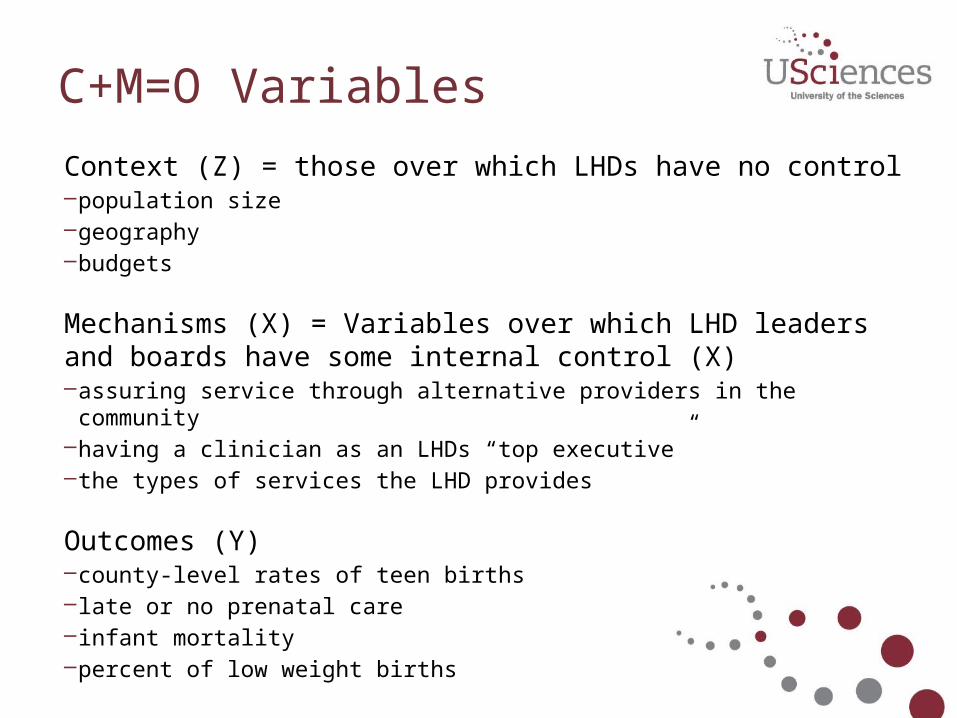
Context (Z) = those over which LHDs have no control – population size – geography – budgets
Mechanisms (X) = Variables over which LHD leaders and boards have some internal control (X)– assuring service through alternative providers in the community– having a clinician as an LHDs “top executive” – the types of services the LHD provides
Outcomes (Y) – county-level rates of teen births– late or no prenatal care– infant mortality– percent of low weight births
Methods: Quantitative
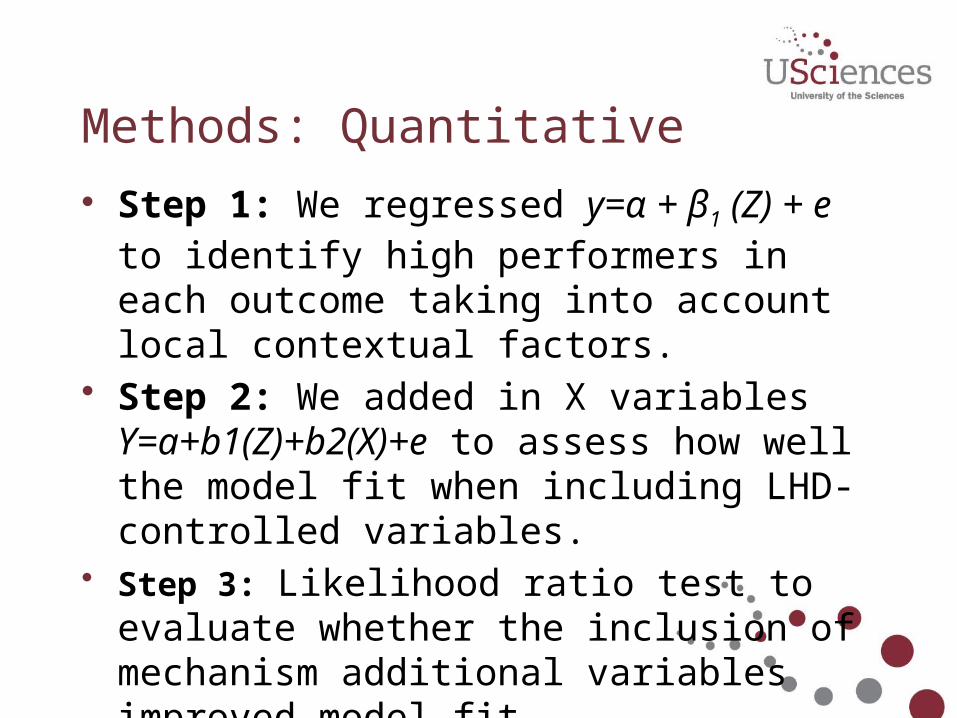
• Step 1: We regressed y=α + β1 (Z) + e to identify high performers in each outcome taking into account local contextual factors.
• Step 2: We added in X variables Y=a+b1(Z)+b2(X)+e to assess how well the model fit when including LHD-controlled variables.
• Step 3: Likelihood ratio test to evaluate whether the inclusion of mechanism additional variables improved model fit.
See: Klaiman, T.; Pantazis, A.; Bekemeier, B. (2014). “A Method for Identifying Positive Deviant Local Health Departments in Maternal and Child Health.” Frontiers in Public Health Systems and Services Research. 3(2): Article 5. Available at http://uknowledge.uky.edu/frontiersinphssr/vol3/iss2/5/
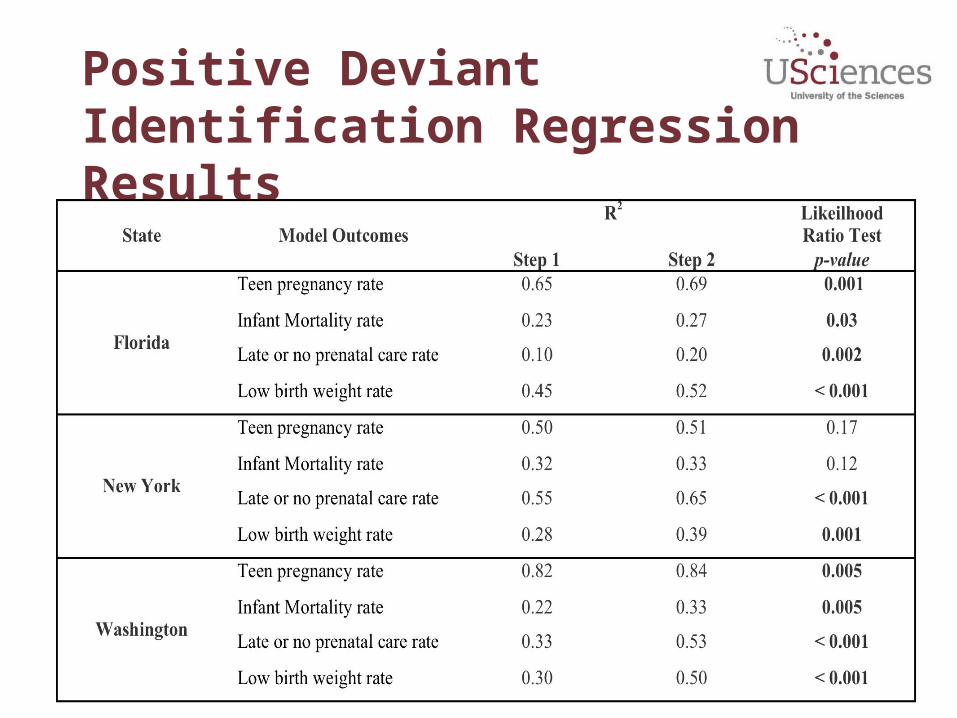
Positive Deviant Identification Regression Results
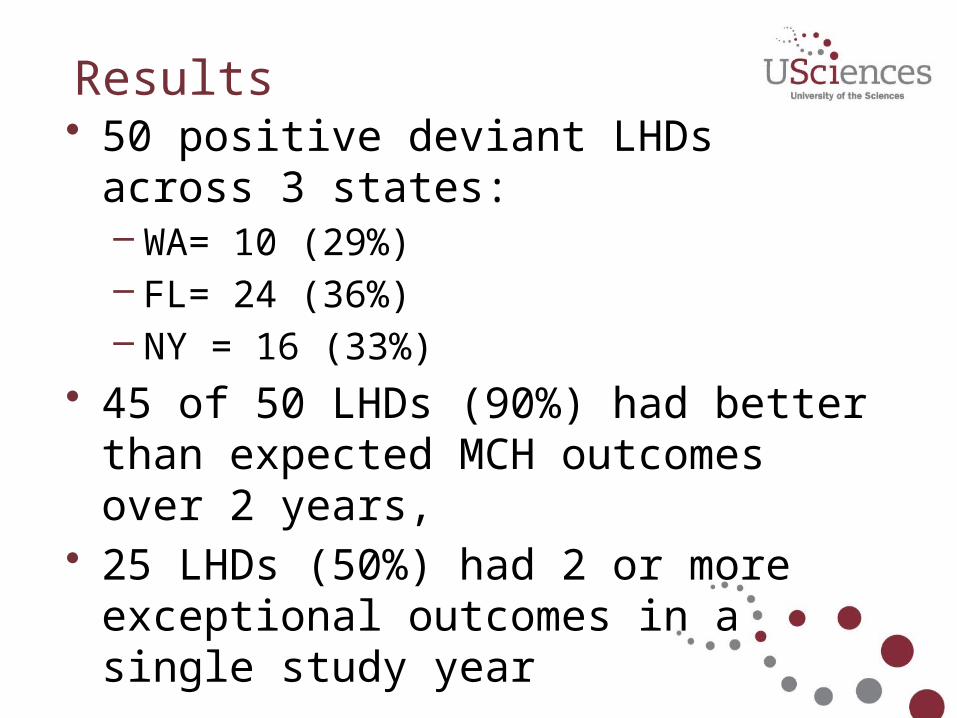
Results• 50 positive deviant LHDs across 3 states:
– WA= 10 (29%)– FL= 24 (36%)– NY = 16 (33%)
• 45 of 50 LHDs (90%) had better than expected MCH outcomes over 2 years,
• 25 LHDs (50%) had 2 or more exceptional outcomes in a single study year
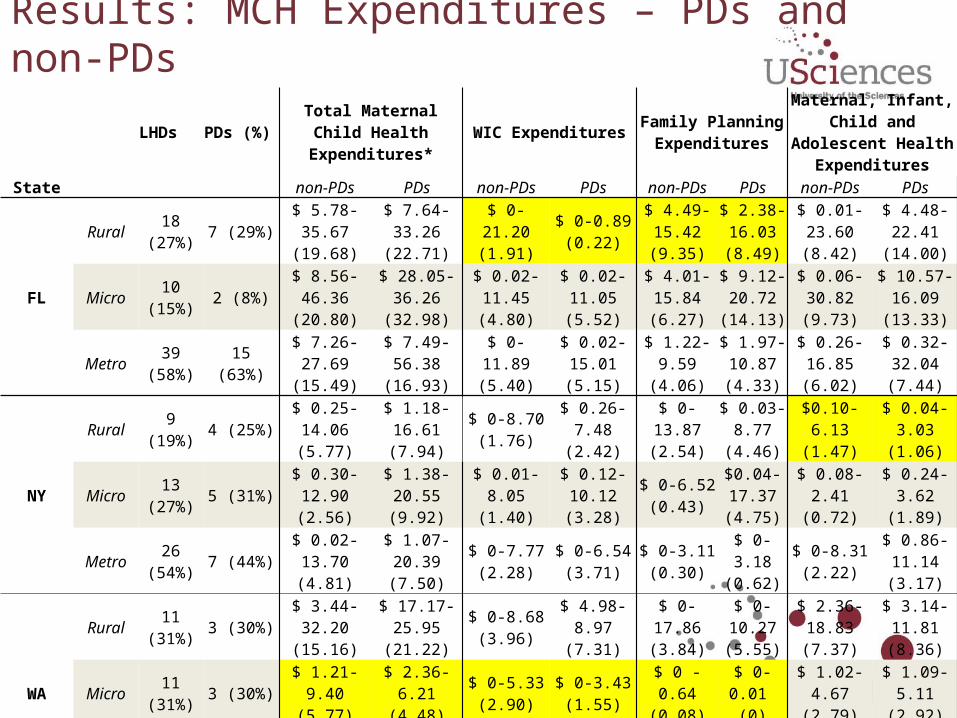
Results: MCH Expenditures – PDs and non-PDs
LHDs PDs (%)Total Maternal Child Health
Expenditures*WIC Expenditures
Family Planning Expenditures
Maternal, Infant, Child and
Adolescent Health Expenditures
State non-PDs PDs non-PDs PDs non-PDs PDs non-PDs PDs
FL
Rural18
(27%)7 (29%)
$ 5.78-35.67
(19.68)
$ 7.64-33.26
(22.71)
$ 0-21.20 (1.91)
$ 0-0.89 (0.22)
$ 4.49-15.42 (9.35)
$ 2.38-16.03 (8.49)
$ 0.01-23.60 (8.42)
$ 4.48-22.41
(14.00)
Micro10
(15%)2 (8%)
$ 8.56-46.36
(20.80)
$ 28.05-36.26
(32.98)
$ 0.02-11.45 (4.80)
$ 0.02-11.05 (5.52)
$ 4.01-15.84 (6.27)
$ 9.12-20.72
(14.13)
$ 0.06-30.82 (9.73)
$ 10.57-16.09
(13.33)
Metro39
(58%)15 (63%)
$ 7.26-27.69
(15.49)
$ 7.49-56.38
(16.93)
$ 0-11.89 (5.40)
$ 0.02-15.01 (5.15)
$ 1.22-9.59
(4.06)
$ 1.97-10.87 (4.33)
$ 0.26-16.85 (6.02)
$ 0.32-32.04 (7.44)
NY
Rural9
(19%)4 (25%)
$ 0.25-14.06 (5.77)
$ 1.18-16.61 (7.94)
$ 0-8.70 (1.76)
$ 0.26-7.48
(2.42)
$ 0-13.87 (2.54)
$ 0.03-8.77
(4.46)
$0.10-6.13
(1.47)
$ 0.04-3.03
(1.06)
Micro13
(27%)5 (31%)
$ 0.30-12.90 (2.56)
$ 1.38-20.55 (9.92)
$ 0.01-8.05
(1.40)
$ 0.12-10.12 (3.28)
$ 0-6.52 (0.43)
$0.04-17.37 (4.75)
$ 0.08-2.41
(0.72)
$ 0.24-3.62
(1.89)
Metro26
(54%)7 (44%)
$ 0.02-13.70 (4.81)
$ 1.07-20.39 (7.50)
$ 0-7.77 (2.28)
$ 0-6.54 (3.71)
$ 0-3.11 (0.30)
$ 0-3.18 (0.62)
$ 0-8.31 (2.22)
$ 0.86-11.14 (3.17)
WA
Rural11
(31%)3 (30%)
$ 3.44-32.20
(15.16)
$ 17.17-25.95
(21.22)
$ 0-8.68 (3.96)
$ 4.98-8.97
(7.31)
$ 0-17.86 (3.84)
$ 0-10.27 (5.55)
$ 2.36-18.83 (7.37)
$ 3.14-11.81 (8.36)
Micro11
(31%)3 (30%)
$ 1.21-9.40 (5.77)
$ 2.36-6.21 (4.48)
$ 0-5.33 (2.90)
$ 0-3.43 (1.55)
$ 0 - 0.64 (0.08)
$ 0-0.01 (0)
$ 1.02-4.67
(2.79)
$ 1.09-5.11
(2.92)
Metro13
(37%)4 (40%)
$ 0.82-27.52 (9.30)
$ 0.73-11.71 (7.32)
$ 0-4.71 (1.78)
$ 0-4.98 (2.76)
$ 0-10.09 (2.15)
$ 0-2.87 (1.14)
$ 0.82-18.78 (5.36)
$ 0.73-5.36
(3.42)
Combined
Rural38
(25%)14 (28%)
$0.25-35.67
(15.44)
$1.18 - 33.21
(17.68)
$ 0-21.20 (2.56)
$ 0-8.97 (2.34)
$ 0-17.86 (6.18)
$ 0-16.03 (6.61)
$ 0.01-23.60 (6.71)
$ 0.04-22.41 (8.73)
Micro34
(23%)10 (20%)
$0.30-46.36 (9.72)
$ 1.38 - 35.26
(13.05)
$ 0-11.45 (3.00)
$ 0-11.05 (3.21)
$ 0-15.84 (2.31)
$ 0-20.72 (5.23)
$ 0.06-30.82 (4.40)
$ 0.23-16.09 (4.62)
Metro78
(52%)26 (52%)
$ 0.17-27.69
(10.50)
$0.73 - 56.37
(13.00)
$ 0-11.87 (3.64)
$ 0-15.01 (4.40)
$ 0-10.09 (2.36)
$ 0-10.87 (2.86)
$ 0.01-18.78 (4.50)
$ 0.32 - 32.04 (5.75)
Next Steps
• Positive deviance can be used to ID high performers
• Mechanisms matter, but it is not clear how
• Conducting in-depth analysis to identify the mechanisms that lead to exceptional outcomes

Thank you!• Robert Wood Johnson Foundation• Research Assistants
– Anjali Chainani, MPH, MSW & Athena Pantazis, MA, MPH
• Interviewees• Advisory Council
– Betty Bekemeier, PhD, MPH, FAAN – Barry Kling, MSPH – Michael Stoto, PhD– JoAnne Fischer – Carol Brady

Questions??