Embed Size (px)
Citation preview
This report has been prepared at the request of the TEITI MSG charged with the implementation of the Extractive Industries Transparency Initiative in Tanzania. The views expressed in the report are those of the Independent Reconcilers and in no way reflect the official opinion of MSG. This report has been prepared exclusively for use by MSG members and must not be used by other parties, nor for any purposes other than those for which it is intended.
TANZANIAN EXTRACTIVE INDUSTRIES TRANSPARENCY INITIATIVE (TEITI)
RECONCILIATION REPORT FOR THE PERIOD 1 JULY 2011 TO 30 JUNE 2012
June 2014
TEITI Reconciliation report for the year ended 30 June 2012
Moore Stephens LLP | P a g e 2
Table of Contents
1. INTRODUCTION ............................................................................................................................ 6
1.1. Background ............................................................................................................................... 6
1.2. Objective ................................................................................................................................... 6
1.3. Nature and extent of our work ................................................................................................... 6
2. EXECUTIVE SUMMARY ............................................................................................................... 7
2.1. Completeness and accuracy of data ......................................................................................... 7
2.2. Payment Reconciliation............................................................................................................. 8
2.3. Government revenues.............................................................................................................10
3. APPROACH AND METHODOLOGY ..........................................................................................13
3.1. Scoping study ..........................................................................................................................13
3.2. Capacity building workshop ....................................................................................................13
3.3. Reconciliation process ............................................................................................................13
3.4. Reliability and credibility of EITI data ......................................................................................14
3.5. Basis of reporting ....................................................................................................................14
4. OVERVIEW OF THE EXTRACTIVE SECTOR IN TANZANIA....................................................15
4.1. Oil and Gas sector ..................................................................................................................15
4.2. Mining Sector ..........................................................................................................................18
5. DETERMINATION OF THE RECONCILIATION SCOPE ...........................................................22
5.1. Sectors and Activities ..............................................................................................................22
5.2. Payment flows .........................................................................................................................26
5.3. Extractive companies ..............................................................................................................29
5.4. Flow chart of payment flows ...................................................................................................30
6. RECONCILIATION SCOPE .........................................................................................................31
6.1. Taxes and revenues covered ..................................................................................................31
6.2. Extractive companies ..............................................................................................................33
6.3. Government Entities ................................................................................................................34
7. RECONCILIATION RESULTS ....................................................................................................35
7.1. Reconciliation by extractive Company ....................................................................................35
7.2. Reconciliation by revenue stream ...........................................................................................37
7.3. Adjustments ............................................................................................................................39
7.4. Unreconciled differences.........................................................................................................47
8. REPORTED DATA ......................................................................................................................52
8.1. Analysis of Government revenues ..........................................................................................52
8.2. Social payments ......................................................................................................................55
8.3. Production declared by extractive companies ........................................................................56
TEITI Reconciliation report for the year ended 30 June 2012
Moore Stephens LLP | P a g e 3
9. RECOMMENDATIONS ................................................................................................................58
9.1. Lessons learned from the 2012 reconciliation ........................................................................58
9.2. Follow up of the recommendations of the 2011 and 2010 EITI Reports ................................61
ANNEXES ..............................................................................................................................................63
Annex 1: Reporting template and Supporting Schedule ....................................................................64
Annex 2: List of extractive companies paying taxes below the materiality threshold ........................70
Annex 3: Tracking table of certified declaration forms .......................................................................72
Annex 4: Extractive companies profile ...............................................................................................74
Annex 5: Reconciliation sheets by company .....................................................................................77
Annex 6: Persons contacted or involved in the 2012 TEITI reconciliation .......................................121
TEITI Reconciliation report for the year ended 30 June 2012
Moore Stephens LLP | P a g e 4
LIST OF ABBREVIATIONS
BGM Bulyanhulu Gold Mine
BL Broker Licence
Bn Billion
BoE Barrel of Oil Equivalent
BZGM Buzwagi Gold Mine
CDC Centers for Disease Control and Prevention
CED Customs & Excise Department
CGT Capital Gains Tax
CIT Corporate Income Tax
CNG Compressed Natural Gas
crt carat
CSO Civil Society Organisation
DL Dealer Licence
DRD Domestic Revenue Department
EIB European Investment Bank
EITI Extractive Industries Transparency Initiative
EMP Environmental Management Plan
ESIA Environmental and Social Impact Assessment
GGM Geita Gold Mine
GPM Golden Pride Mine
IFAC International Federation of Accountants
ISA International Standard on Auditing
kg Kilogram
lb Pound
LNG Liquefied Natural Gas
LTD Large Taxpayers Department
MDA Mining Development Agreement
MEM Ministry of Energy and Minerals
ML Mining Licence
MMSCF Million Standard cubic feet
MoF Ministry of Finance
MSG Multi-Stakeholder Group
NLGM New Luika Gold Mine
NMGM North Mara Gold Mine
NSSF National Social Security Fund
PAYE Pay-As-You-Earn
PL Prospecting Licence
PML Primary Mining Licence
PPF Parastatal Pension Fund
PSA Production Sharing Agreement
RL Retention Licence
TEITI Reconciliation report for the year ended 30 June 2012
Moore Stephens LLP | P a g e 5
LIST OF ABBREVIATIONS
SCF Standard Cubic feet
SDL Skills and Development Levy
SML Special Mining Licence
TANESCO Tanzania Electric Supply Company Ltd
TCF Trillion Cubic Feet
TDFL Tanzania Development Finance Co Ltd
TEITI Tanzania Extractive Industries Transparency Initiative
TGM Tulawaka Gold Mine
TMAA Tanzania Minerals Audit Agency
toz Troy Ounces (1 toz = 1.0971 oz)
TPDC Tanzania Petroleum Development Corporation
TRA Tanzania Revenue Authority
TTM TanzaniteOne Tanzanite Mine
TzS Tanzanian shilling
US$ United States Dollar
VAT Value Added Tax
WDM Williamson Diamond Mine
TEITI Reconciliation report for the year ended 30 June 2012
Moore Stephens LLP | P a g e 6
1. INTRODUCTION
1.1. Background
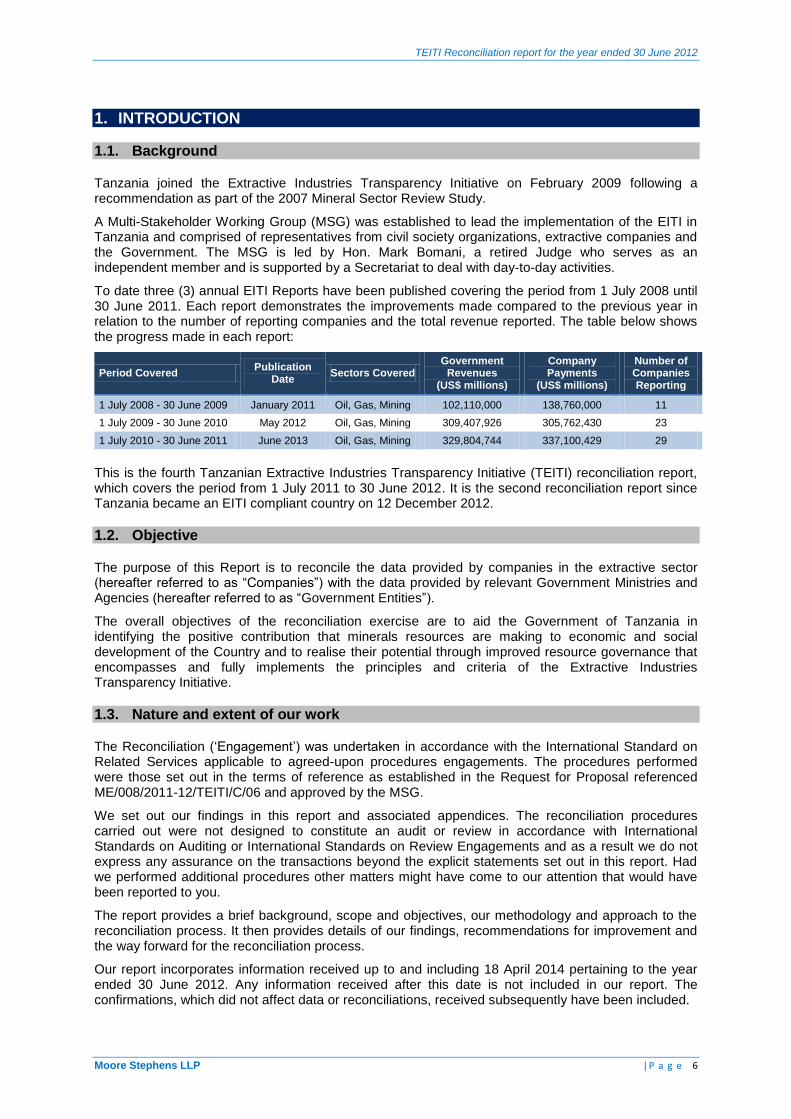
Tanzania joined the Extractive Industries Transparency Initiative on February 2009 following a recommendation as part of the 2007 Mineral Sector Review Study.
A Multi-Stakeholder Working Group (MSG) was established to lead the implementation of the EITI in Tanzania and comprised of representatives from civil society organizations, extractive companies and the Government. The MSG is led by Hon. Mark Bomani, a retired Judge who serves as an independent member and is supported by a Secretariat to deal with day-to-day activities.
To date three (3) annual EITI Reports have been published covering the period from 1 July 2008 until 30 June 2011. Each report demonstrates the improvements made compared to the previous year in relation to the number of reporting companies and the total revenue reported. The table below shows the progress made in each report:
Period Covered Publication
Date Sectors Covered
Government Revenues
(US$ millions)
Company Payments
(US$ millions)
Number of Companies Reporting
1 July 2008 - 30 June 2009 January 2011 Oil, Gas, Mining 102,110,000 138,760,000 11
1 July 2009 - 30 June 2010 May 2012 Oil, Gas, Mining 309,407,926 305,762,430 23
1 July 2010 - 30 June 2011 June 2013 Oil, Gas, Mining 329,804,744 337,100,429 29
This is the fourth Tanzanian Extractive Industries Transparency Initiative (TEITI) reconciliation report, which covers the period from 1 July 2011 to 30 June 2012. It is the second reconciliation report since Tanzania became an EITI compliant country on 12 December 2012.
1.2. Objective
The purpose of this Report is to reconcile the data provided by companies in the extractive sector (hereafter referred to as “Companies”) with the data provided by relevant Government Ministries and Agencies (hereafter referred to as “Government Entities”).
The overall objectives of the reconciliation exercise are to aid the Government of Tanzania in identifying the positive contribution that minerals resources are making to economic and social development of the Country and to realise their potential through improved resource governance that encompasses and fully implements the principles and criteria of the Extractive Industries Transparency Initiative.
1.3. Nature and extent of our work
The Reconciliation (‘Engagement’) was undertaken in accordance with the International Standard on Related Services applicable to agreed-upon procedures engagements. The procedures performed were those set out in the terms of reference as established in the Request for Proposal referenced ME/008/2011-12/TEITI/C/06 and approved by the MSG.
We set out our findings in this report and associated appendices. The reconciliation procedures carried out were not designed to constitute an audit or review in accordance with International Standards on Auditing or International Standards on Review Engagements and as a result we do not express any assurance on the transactions beyond the explicit statements set out in this report. Had we performed additional procedures other matters might have come to our attention that would have been reported to you.
The report provides a brief background, scope and objectives, our methodology and approach to the reconciliation process. It then provides details of our findings, recommendations for improvement and the way forward for the reconciliation process.
Our report incorporates information received up to and including 18 April 2014 pertaining to the year ended 30 June 2012. Any information received after this date is not included in our report. The confirmations, which did not affect data or reconciliations, received subsequently have been included.
TEITI Reconciliation report for the year ended 30 June 2012
Moore Stephens LLP | P a g e 7
2. EXECUTIVE SUMMARY
2.1. Completeness and accuracy of data
A schedule of payments made to Government Entities, broken down by company, was used as the basis for our reconciliation. A total of 99.79% of payments have been selected and included in the reconciliation. This was achieved by including all companies making payments in excess of TZS 0.15 million. The revenues collected from the remaining companies which were submitted by MEM, TRA and TPDC during the scoping phase were included in this report through a unilateral disclosure by companies and Government Entities.
The list of the extractive companies selected by the MSG for the 2012 reconciliation exercise included 26 mining companies and 20 Oil and Gas companies. The following mining companies were removed from this list because they do not possess mineral rights, they are only service providers to mineral sector:
TOL Gases Ltd Minesite Tanzania Ltd Midwest Minerals Processor Ltd
All companies included in the reconciliation scope have returned their reporting templates, except:
Geo Can Resources Co Ltd hasn’t submitted a reporting template. The receipts reported by Government Entities in respect of this company were, TZS 221,979,150 (0.03% of the total extractive sector revenue); and
Maweni Limestone Ltd has submitted on 21 May 2014 its reporting template using rounded
numbers. In addition the payment flow details were not provided. Consequently, the data submitted were not reconciled.
All Government Entities included in the reconciliation scope have returned their reporting templates, except the following Local authorities:
Local Authorities
Geita Kilwa Nzega
Kahama Mbeya Simanjiro
Only annual figures were declared by Tarime and Kinondoni. These Local Authorities were contacted to send their detailed schedules.
In addition, PPF submitted an excel sheet containing details of payments which was not in the format requested by the 2012 reconciliation guidelines. We decided to accept PPF declarations for the purpose of the preparation of this report.
Of the 43 companies included in the reconciliation scope, 12 companies did not submit a certified reporting template. These Companies are set out in the table below:
Mining Companies Oil & Gas Companies
Geita Gold Mining Ltd M&P Exploration Production (T) Ltd
Resolute (Tanzania) Ltd Ras Al Khaimah Gas Tanzania Ltd
Tanzania Portland Cement Co Ltd Etabllissements Maurel & Prom
Tanga Cement Company Ltd Tullow Tanzania B.V
Willy Enteprises
State Mining Corporation
Maweni Limestone Ltd
Dhahabu Resources Tanzania Ltd
With regard to Government Entities, we have not received a letter from the Controller and Auditor General confirming that the accounts for the Government Entities were audited under International Standards, as defined in the instructions for the preparation of Reporting Templates. Only TPDC and the local authorities Ilala and Biharamulo have submitted a reporting template certified by the Controller and Auditor General.
TEITI Reconciliation report for the year ended 30 June 2012
Moore Stephens LLP | P a g e 8
Delays in the reconciliation exercise were caused by the time required for production of information
by companies and Government Entities. These delays complicated the collection of supporting documents to update the information provided in the original data collection templates.
2.2. Payment Reconciliation
The net difference between the payments declared by extractive companies and the Government at the beginning of the reconciliation amounted to TzS 76,617,307,388 or 10.53% of the total
amount declared by the Government, which is detailed as follows:
Extractive companies
(TzS) Government
(TzS) Difference
(TzS) %
Total payments declared 804,100,750,134 727,483,442,746 76,617,307,388 10.53%
At the end of our reconciliation, the remaining net differences amounted to TzS 2,148,537,981 or 0.28% of the total Payments declared by the Government:
Extractive companies
(TzS) Government
(TzS) Difference
(TzS) %
Total payments declared 759,817,251,440 757,668,713,459 2,148,537,981 0.28%
After adjustment, the net difference of TzS 2,148,537,981 represents the aggregate of the positive differences amounting to TzS 8,864,011,207 and the negative differences of TzS (6,715,473,226) which are detailed in Section 7.4 of this report.
Details of adjustments made to the reporting entities’ initial amounts and the unresolved residual differences are presented in Sections 7.3 of this report.
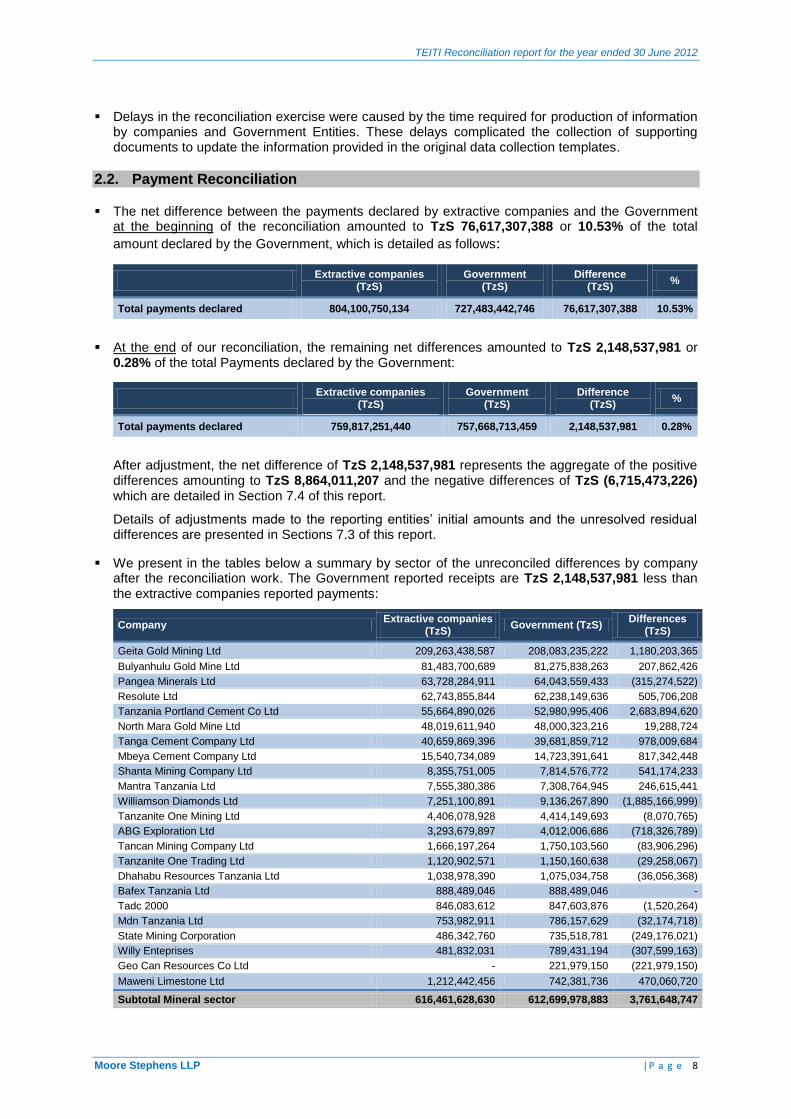
We present in the tables below a summary by sector of the unreconciled differences by company after the reconciliation work. The Government reported receipts are TzS 2,148,537,981 less than the extractive companies reported payments:
Company Extractive companies
(TzS) Government (TzS)
Differences (TzS)
Geita Gold Mining Ltd 209,263,438,587 208,083,235,222 1,180,203,365
Bulyanhulu Gold Mine Ltd 81,483,700,689 81,275,838,263 207,862,426
Pangea Minerals Ltd 63,728,284,911 64,043,559,433 (315,274,522)
Resolute Ltd 62,743,855,844 62,238,149,636 505,706,208
Tanzania Portland Cement Co Ltd 55,664,890,026 52,980,995,406 2,683,894,620
North Mara Gold Mine Ltd 48,019,611,940 48,000,323,216 19,288,724
Tanga Cement Company Ltd 40,659,869,396 39,681,859,712 978,009,684
Mbeya Cement Company Ltd 15,540,734,089 14,723,391,641 817,342,448
Shanta Mining Company Ltd 8,355,751,005 7,814,576,772 541,174,233
Mantra Tanzania Ltd 7,555,380,386 7,308,764,945 246,615,441
Williamson Diamonds Ltd 7,251,100,891 9,136,267,890 (1,885,166,999)
Tanzanite One Mining Ltd 4,406,078,928 4,414,149,693 (8,070,765)
ABG Exploration Ltd 3,293,679,897 4,012,006,686 (718,326,789)
Tancan Mining Company Ltd 1,666,197,264 1,750,103,560 (83,906,296)
Tanzanite One Trading Ltd 1,120,902,571 1,150,160,638 (29,258,067)
Dhahabu Resources Tanzania Ltd 1,038,978,390 1,075,034,758 (36,056,368)
Bafex Tanzania Ltd 888,489,046 888,489,046 -
Tadc 2000 846,083,612 847,603,876 (1,520,264)
Mdn Tanzania Ltd 753,982,911 786,157,629 (32,174,718)
State Mining Corporation 486,342,760 735,518,781 (249,176,021)
Willy Enteprises 481,832,031 789,431,194 (307,599,163)
Geo Can Resources Co Ltd - 221,979,150 (221,979,150)
Maweni Limestone Ltd 1,212,442,456 742,381,736 470,060,720
Subtotal Mineral sector 616,461,628,630 612,699,978,883 3,761,648,747
TEITI Reconciliation report for the year ended 30 June 2012
Moore Stephens LLP | P a g e 9
Company Extractive companies
(TzS) Government (TzS)
Differences (TzS)
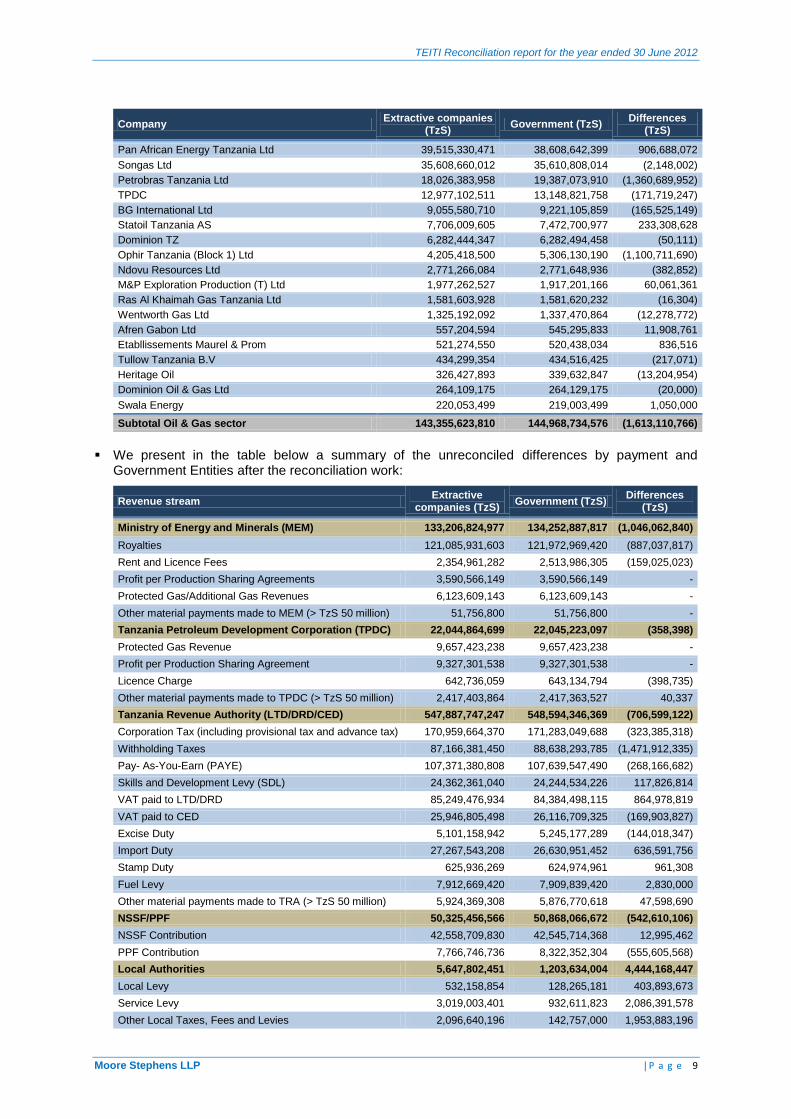
Pan African Energy Tanzania Ltd 39,515,330,471 38,608,642,399 906,688,072
Songas Ltd 35,608,660,012 35,610,808,014 (2,148,002)
Petrobras Tanzania Ltd 18,026,383,958 19,387,073,910 (1,360,689,952)
TPDC 12,977,102,511 13,148,821,758 (171,719,247)
BG International Ltd 9,055,580,710 9,221,105,859 (165,525,149)
Statoil Tanzania AS 7,706,009,605 7,472,700,977 233,308,628
Dominion TZ 6,282,444,347 6,282,494,458 (50,111)
Ophir Tanzania (Block 1) Ltd 4,205,418,500 5,306,130,190 (1,100,711,690)
Ndovu Resources Ltd 2,771,266,084 2,771,648,936 (382,852)
M&P Exploration Production (T) Ltd 1,977,262,527 1,917,201,166 60,061,361
Ras Al Khaimah Gas Tanzania Ltd 1,581,603,928 1,581,620,232 (16,304)
Wentworth Gas Ltd 1,325,192,092 1,337,470,864 (12,278,772)
Afren Gabon Ltd 557,204,594 545,295,833 11,908,761
Etabllissements Maurel & Prom 521,274,550 520,438,034 836,516
Tullow Tanzania B.V 434,299,354 434,516,425 (217,071)
Heritage Oil 326,427,893 339,632,847 (13,204,954)
Dominion Oil & Gas Ltd 264,109,175 264,129,175 (20,000)
Swala Energy 220,053,499 219,003,499 1,050,000
Subtotal Oil & Gas sector 143,355,623,810 144,968,734,576 (1,613,110,766)
We present in the table below a summary of the unreconciled differences by payment and
Government Entities after the reconciliation work:
Revenue stream Extractive
companies (TzS) Government (TzS)
Differences (TzS)
Ministry of Energy and Minerals (MEM) 133,206,824,977 134,252,887,817 (1,046,062,840)
Royalties 121,085,931,603 121,972,969,420 (887,037,817)
Rent and Licence Fees 2,354,961,282 2,513,986,305 (159,025,023)
Profit per Production Sharing Agreements 3,590,566,149 3,590,566,149 -
Protected Gas/Additional Gas Revenues 6,123,609,143 6,123,609,143 -
Other material payments made to MEM (> TzS 50 million) 51,756,800 51,756,800 -
Tanzania Petroleum Development Corporation (TPDC) 22,044,864,699 22,045,223,097 (358,398)
Protected Gas Revenue 9,657,423,238 9,657,423,238 -
Profit per Production Sharing Agreement 9,327,301,538 9,327,301,538 -
Licence Charge 642,736,059 643,134,794 (398,735)
Other material payments made to TPDC (> TzS 50 million) 2,417,403,864 2,417,363,527 40,337
Tanzania Revenue Authority (LTD/DRD/CED) 547,887,747,247 548,594,346,369 (706,599,122)
Corporation Tax (including provisional tax and advance tax) 170,959,664,370 171,283,049,688 (323,385,318)
Withholding Taxes 87,166,381,450 88,638,293,785 (1,471,912,335)
Pay- As-You-Earn (PAYE) 107,371,380,808 107,639,547,490 (268,166,682)
Skills and Development Levy (SDL) 24,362,361,040 24,244,534,226 117,826,814
VAT paid to LTD/DRD 85,249,476,934 84,384,498,115 864,978,819
VAT paid to CED 25,946,805,498 26,116,709,325 (169,903,827)
Excise Duty 5,101,158,942 5,245,177,289 (144,018,347)
Import Duty 27,267,543,208 26,630,951,452 636,591,756
Stamp Duty 625,936,269 624,974,961 961,308
Fuel Levy 7,912,669,420 7,909,839,420 2,830,000
Other material payments made to TRA (> TzS 50 million) 5,924,369,308 5,876,770,618 47,598,690
NSSF/PPF 50,325,456,566 50,868,066,672 (542,610,106)
NSSF Contribution 42,558,709,830 42,545,714,368 12,995,462
PPF Contribution 7,766,746,736 8,322,352,304 (555,605,568)
Local Authorities 5,647,802,451 1,203,634,004 4,444,168,447
Local Levy 532,158,854 128,265,181 403,893,673
Service Levy 3,019,003,401 932,611,823 2,086,391,578
Other Local Taxes, Fees and Levies 2,096,640,196 142,757,000 1,953,883,196
TEITI Reconciliation report for the year ended 30 June 2012
Moore Stephens LLP | P a g e 10
Revenue stream Extractive
companies (TzS) Government (TzS)
Differences (TzS)
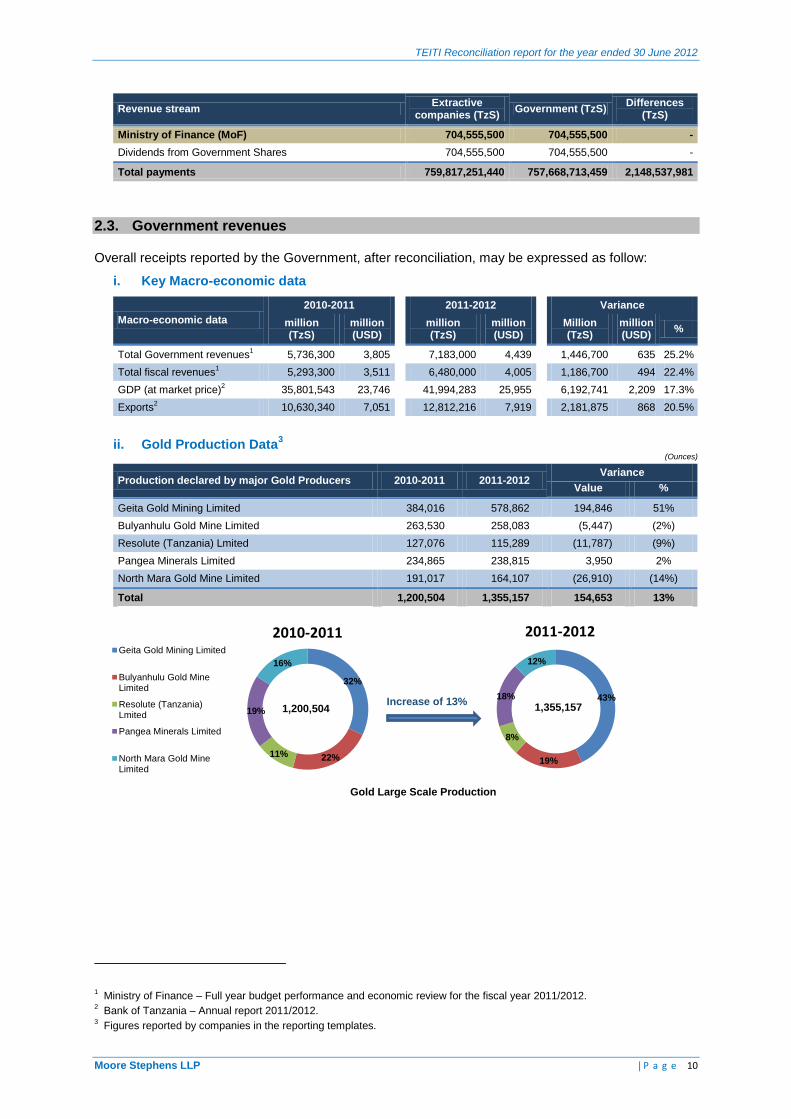
Ministry of Finance (MoF) 704,555,500 704,555,500 -
Dividends from Government Shares 704,555,500 704,555,500 -
Total payments 759,817,251,440 757,668,713,459 2,148,537,981
2.3. Government revenues
Overall receipts reported by the Government, after reconciliation, may be expressed as follow:
i. Key Macro-economic data
Macro-economic data
2010-2011 2011-2012 Variance
million (TzS)
million (USD)
million (TzS)
million (USD)
Million (TzS)
million (USD)
%
Total Government revenues1 5,736,300 3,805 7,183,000 4,439 1,446,700 635 25.2%
Total fiscal revenues1 5,293,300 3,511 6,480,000 4,005 1,186,700 494 22.4%
GDP (at market price)2 35,801,543 23,746 41,994,283 25,955 6,192,741 2,209 17.3%
Exports2 10,630,340 7,051 12,812,216 7,919 2,181,875 868 20.5%
ii. Gold Production Data3
(Ounces)
Production declared by major Gold Producers 2010-2011 2011-2012 Variance
Value %
Geita Gold Mining Limited 384,016 578,862 194,846 51%
Bulyanhulu Gold Mine Limited 263,530 258,083 (5,447) (2%)
Resolute (Tanzania) Lmited 127,076 115,289 (11,787) (9%)
Pangea Minerals Limited 234,865 238,815 3,950 2%
North Mara Gold Mine Limited 191,017 164,107 (26,910) (14%)
Total 1,200,504 1,355,157 154,653 13%
1 Ministry of Finance – Full year budget performance and economic review for the fiscal year 2011/2012.
2 Bank of Tanzania – Annual report 2011/2012.
3 Figures reported by companies in the reporting templates.
32%
22% 11%
19%
16%
2010-2011 Geita Gold Mining Limited
Bulyanhulu Gold MineLimited
Resolute (Tanzania)Lmited
Pangea Minerals Limited
North Mara Gold MineLimited
1,200,504 43%
19%
8%
18%
12%
2011-2012
1,355,157 Increase of 13%
Gold Large Scale Production
TEITI Reconciliation report for the year ended 30 June 2012
Moore Stephens LLP | P a g e 11
98%
2%
2010-2011
Pan African Energy
Maurel et Prom29,400,092,097
98%
2%
2011-2012
36,290,916,427
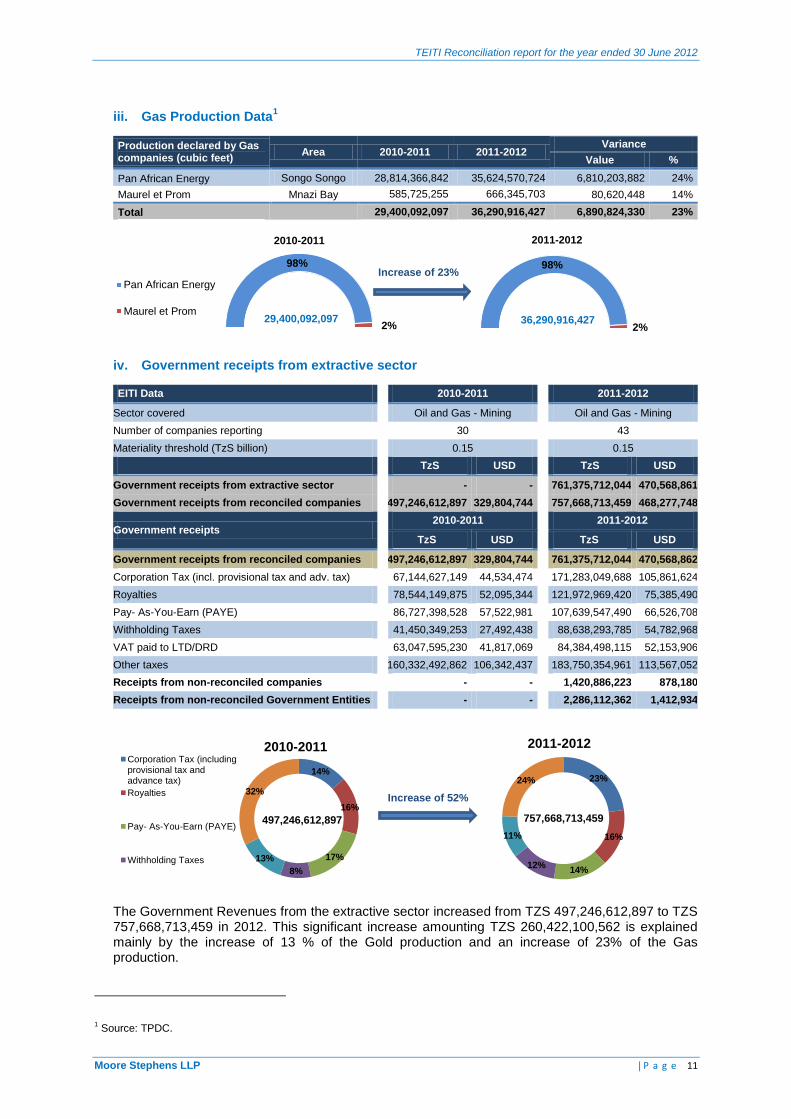
iii. Gas Production Data
1
Production declared by Gas companies (cubic feet)
Area 2010-2011 2011-2012 Variance
Value %
Pan African Energy Songo Songo 28,814,366,842 35,624,570,724 6,810,203,882 24%
Maurel et Prom Mnazi Bay 585,725,255 666,345,703 80,620,448 14%
Total
29,400,092,097 36,290,916,427 6,890,824,330 23%
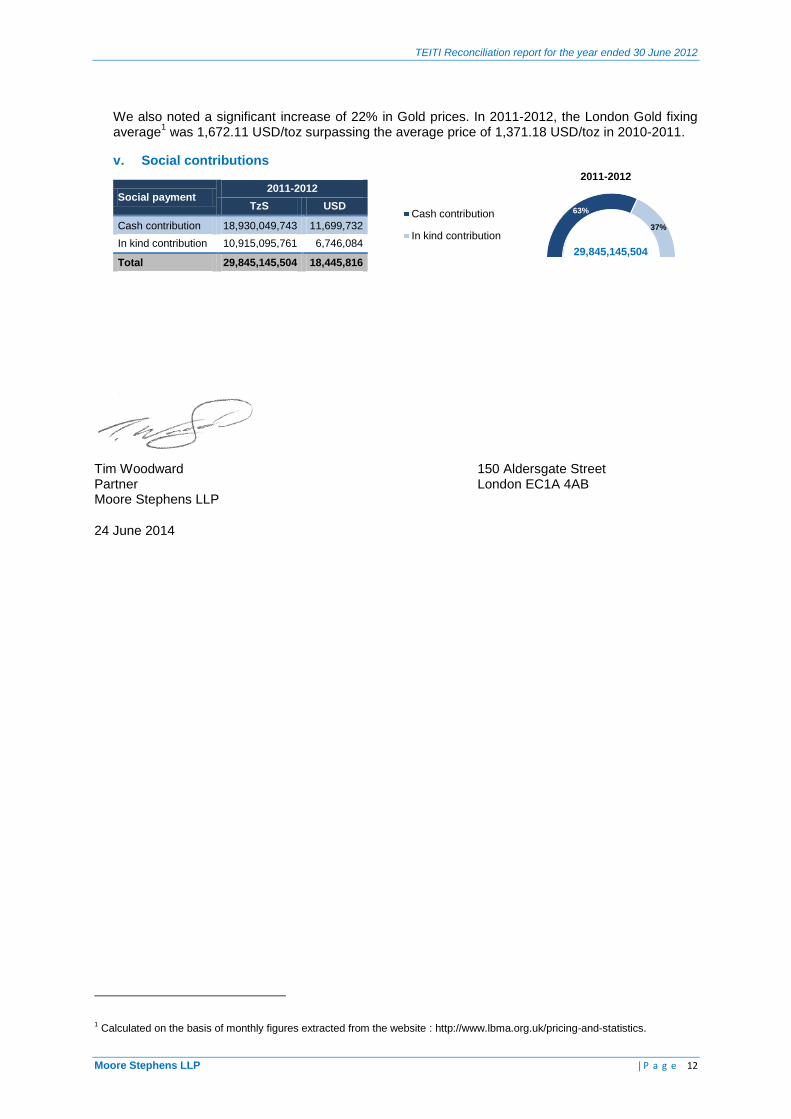
iv. Government receipts from extractive sector
EITI Data
2010-2011
2011-2012
Sector covered
Oil and Gas - Mining
Oil and Gas - Mining
Number of companies reporting
30
43
Materiality threshold (TzS billion)
0.15
0.15
TzS USD
TzS USD
Government receipts from extractive sector
- -
761,375,712,044 470,568,861
Government receipts from reconciled companies 497,246,612,897 329,804,744
757,668,713,459 468,277,748
Government receipts 2010-2011
2011-2012
TzS USD
TzS USD
Government receipts from reconciled companies 497,246,612,897 329,804,744
761,375,712,044 470,568,862
Corporation Tax (incl. provisional tax and adv. tax)
67,144,627,149 44,534,474
171,283,049,688 105,861,624
Royalties
78,544,149,875 52,095,344
121,972,969,420 75,385,490
Pay- As-You-Earn (PAYE)
86,727,398,528 57,522,981
107,639,547,490 66,526,708
Withholding Taxes
41,450,349,253 27,492,438
88,638,293,785 54,782,968
VAT paid to LTD/DRD
63,047,595,230 41,817,069
84,384,498,115 52,153,906
Other taxes 160,332,492,862 106,342,437
183,750,354,961 113,567,052
Receipts from non-reconciled companies
- -
1,420,886,223 878,180
Receipts from non-reconciled Government Entities
- -
2,286,112,362 1,412,934
The Government Revenues from the extractive sector increased from TZS 497,246,612,897 to TZS 757,668,713,459 in 2012. This significant increase amounting TZS 260,422,100,562 is explained mainly by the increase of 13 % of the Gold production and an increase of 23% of the Gas production.
1 Source: TPDC.
14%
16%
17%
8%
13%
32%
2010-2011 Corporation Tax (includingprovisional tax andadvance tax)
Royalties
Pay- As-You-Earn (PAYE)
Withholding Taxes
497,246,612,897
23%
16%
14% 12%
11%
24%
2011-2012
757,668,713,459
Increase of 52%
Increase of 23%
TEITI Reconciliation report for the year ended 30 June 2012
Moore Stephens LLP | P a g e 12
63%
37%
2011-2012
Cash contribution
In kind contribution
29,845,145,504
We also noted a significant increase of 22% in Gold prices. In 2011-2012, the London Gold fixing average
1 was 1,672.11 USD/toz surpassing the average price of 1,371.18 USD/toz in 2010-2011.
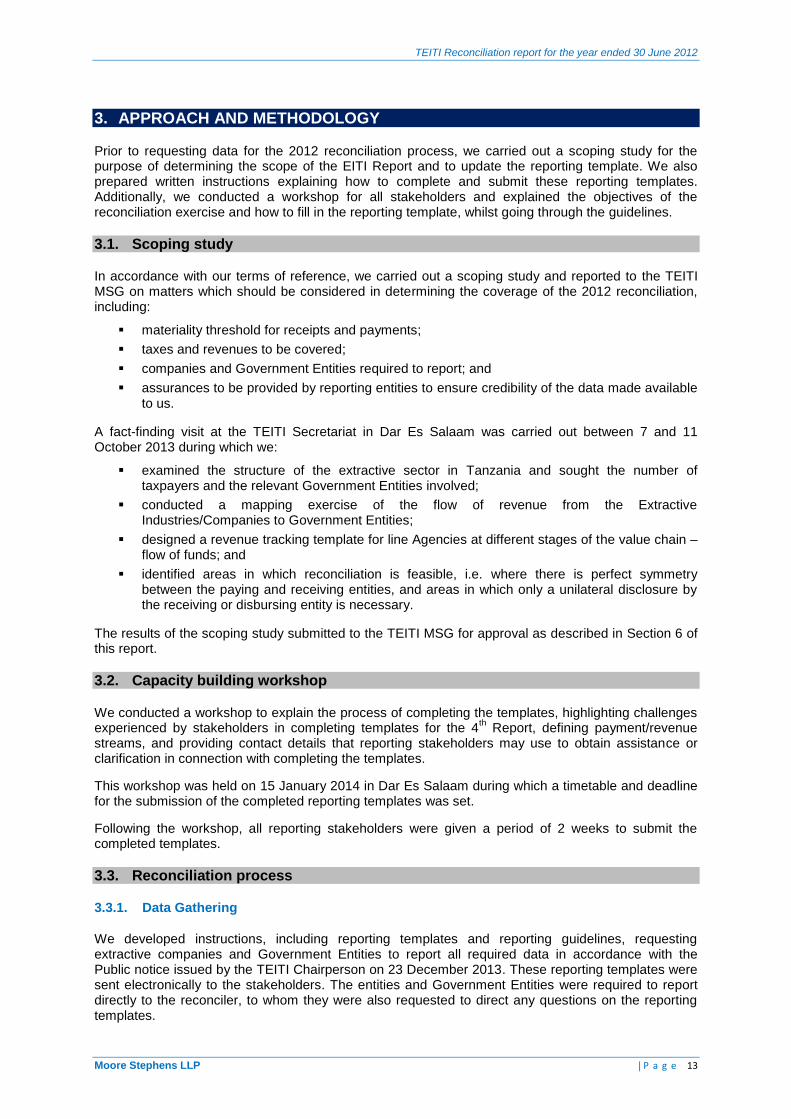
v. Social contributions
Social payment 2011-2012
TzS USD
Cash contribution 18,930,049,743 11,699,732
In kind contribution 10,915,095,761 6,746,084
Total 29,845,145,504 18,445,816
Tim Woodward 150 Aldersgate Street Partner London EC1A 4AB Moore Stephens LLP
24 June 2014
1 Calculated on the basis of monthly figures extracted from the website : http://www.lbma.org.uk/pricing-and-statistics.
TEITI Reconciliation report for the year ended 30 June 2012
Moore Stephens LLP | P a g e 13
3. APPROACH AND METHODOLOGY
Prior to requesting data for the 2012 reconciliation process, we carried out a scoping study for the purpose of determining the scope of the EITI Report and to update the reporting template. We also prepared written instructions explaining how to complete and submit these reporting templates. Additionally, we conducted a workshop for all stakeholders and explained the objectives of the reconciliation exercise and how to fill in the reporting template, whilst going through the guidelines.
3.1. Scoping study
In accordance with our terms of reference, we carried out a scoping study and reported to the TEITI MSG on matters which should be considered in determining the coverage of the 2012 reconciliation, including:
materiality threshold for receipts and payments;
taxes and revenues to be covered;
companies and Government Entities required to report; and
assurances to be provided by reporting entities to ensure credibility of the data made available to us.
A fact-finding visit at the TEITI Secretariat in Dar Es Salaam was carried out between 7 and 11 October 2013 during which we:
examined the structure of the extractive sector in Tanzania and sought the number of taxpayers and the relevant Government Entities involved;
conducted a mapping exercise of the flow of revenue from the Extractive Industries/Companies to Government Entities;
designed a revenue tracking template for line Agencies at different stages of the value chain – flow of funds; and
identified areas in which reconciliation is feasible, i.e. where there is perfect symmetry between the paying and receiving entities, and areas in which only a unilateral disclosure by the receiving or disbursing entity is necessary.
The results of the scoping study submitted to the TEITI MSG for approval as described in Section 6 of this report.
3.2. Capacity building workshop
We conducted a workshop to explain the process of completing the templates, highlighting challenges experienced by stakeholders in completing templates for the 4
th Report, defining payment/revenue
streams, and providing contact details that reporting stakeholders may use to obtain assistance or clarification in connection with completing the templates.
This workshop was held on 15 January 2014 in Dar Es Salaam during which a timetable and deadline for the submission of the completed reporting templates was set.
Following the workshop, all reporting stakeholders were given a period of 2 weeks to submit the completed templates.
3.3. Reconciliation process
3.3.1. Data Gathering
We developed instructions, including reporting templates and reporting guidelines, requesting extractive companies and Government Entities to report all required data in accordance with the Public notice issued by the TEITI Chairperson on 23 December 2013. These reporting templates were sent electronically to the stakeholders. The entities and Government Entities were required to report directly to the reconciler, to whom they were also requested to direct any questions on the reporting templates.
TEITI Reconciliation report for the year ended 30 June 2012
Moore Stephens LLP | P a g e 14
The TEITI MSG agreed that the deadline for reporting would be 31 January 2014, while that for the submission of the certified reporting templates was set at 7 February 2014.
We obtained supporting payment schedules for various payments made by the Companies, which included details such as date of payment, type of tax and flag receipt numbers. The Government Entities made a database of all amounts they received from extractive companies for the year ended 30 June 2012 available to us.
3.3.2. Data compilation and resolution of differences
The process of compiling the data and resolving or justifying differences was carried out between February and April 2014. In carrying out the reconciliation, we performed the following procedures:
figures reported by extractive companies were compared item-by-item to figures reported by Government Entities. As a result, all differences identified have been listed item-by-item in relation to each Government Entity and extractive company;
where data reported by extractive companies agreed with the data reported by the Government Entities, the Government figures were considered to be confirmed and no further action was undertaken; and
the Government Entities and the Companies were asked to provide supporting documents and/or confirmation for any adjustment to the information provided on the original data collection templates.
In cases where we were unable to resolve differences, we visited the reporting entities and reviewed additional supporting documentation evidencing the payments declared. In certain cases, these differences remained unresolved, which we have summarised in Section 7.3 of this report.
3.4. Reliability and credibility of EITI data
In order to comply with EITI Requirements 12 and 13 and to ensure the credibility of data submitted:
Companies and Government Entities were requested to have their reporting templates signed by a Senior Official;
Companies and Government Entities were requested to submit the breakdown of payments and receipts date-by-date and receipt-by-receipt in the supporting schedule;
Companies, including TPDC, were requested to provide us with confirmation of the truth and fairness of the information disclosed in the template from their auditors and to confirm that the information disclosed was prepared in accordance with the template instructions. The information provided by companies in this respect is set out in Annex 3;
Government Entities, including local authorities, were requested to obtain confirmation from the Auditor General that the transactions reported in the template are in accordance with instructions issued by TEITI, are complete and are in agreement with the accounts of Government for the year ended 30 June 2012. The information provided by Government Entities in this respect is also set out in Annex 3;
the Auditor General was also required to provide a letter confirming that the accounts of the Government Entities were audited in accordance with International Standards; and
for any changes made to the original data reported on the templates, the agencies and companies were asked to provide supporting documents and/or confirmation before any adjustments were accepted.
3.5. Basis of reporting
The reconciliation has been carried out on a cash accounting basis. Accordingly, any payment made prior to 1 July 2011 was excluded. The same applies to any payments made after 30 June 2012.
For the payments made in foreign currency, the reporting entities were required to report in the currency of payment. The payments made in US Dollars have been converted to TZS at the average rate for the period per Oanda of USD 1= TZS 1,617.99
1.
1 http://www.oanda.com.
TEITI Reconciliation report for the year ended 30 June 2012
Moore Stephens LLP | P a g e 15
4. OVERVIEW OF THE EXTRACTIVE SECTOR IN TANZANIA
4.1. Oil and Gas sector
4.1.1. Background and profile of the Oil and Gas sector in Tanzania
For the past 60 years Tanzania has been exploring for oil and gas. To date no oil has been discovered, although the first natural gas discovery was made in 1974 at Songo Songo Island (Lindi Region). The second discovery was made at Mnazi Bay (Mtwara Region) in 1982.
The first National Energy Policy of Tanzania was formulated in April 1992, following structural changes that resulted in the changing role of Government. These changes were driven by markets becoming more liberal, meaning that the Government needed to assume a more prominent role in promoting the growth of a private sector led economy. Additionally, the Government aimed to contribute to social economic development and, in the long-term, to eradicate poverty.
The policy was revised in 2003 to create an environment conducive for energy development in the country. The Policy envisioned the energy sector effectively contributing to the growth of the national economy and thereby improving the standard of living for the entire nation in a sustainable and environmentally sound manner
1.
This new policy accelerated the growth of the energy sector, including oil and gas exploration that has led to increased discovery of natural gas in the country. Today over 45 billion cubic meters of natural gas has been discovered from both onshore and offshore basins and more gas discoveries are anticipated
2.
In 2000, in partnership with private companies3, the Government of Tanzania (through Tanzania
Electric Supply Company Ltd (TANESCO) and Tanzania Petroleum Development Corporation (TPDC)), implemented the Songo Songo Gas to Electricity Project. In this project PanAfrican Energy Tanzania (PAT) developed the Songo Songo gas field to produce natural gas. Songas Company then constructed and operated natural gas pipelines from Songo Songo Island to Dar Es Salaam (232 km). This natural gas is used as the principal fuel supply for five gas turbines in the generation of electricity and for industrial use as a source of energy.
Tanzania’s upstream oil and gas sector is currently enjoying a boom experienced following major discoveries of natural gas by Statoil, Ophir Energy and BG Group. These discoveries mean that in 2012 Tanzania’s total estimated natural gas reserves quadrupled from 10 trillion to 40 trillion cubic feet. Offshore gas fields at Songo Songo and Mnazi Bay are currently in the process of being developed by Pan African Energy and Maurel and Prom in connection with the Tanzania Petroleum Development Corporation (TPDC). However, despite 50 years of exploration activity, Tanzania still has no proven oil reserves and remains dependent on imported petroleum products.
Today, gas is used to generate electricity to feed the national grid. Further expansions are underway including 532 km of 36 inch pipeline, which is being constructed to transport natural gas from Mtwara and Lindi to Dar Es Salaam. A further 25km of 24 inch subsea spur line will connect Songo Songo Island to Somanga Fungi, Lindi Region. The Government, in collaboration with stakeholders, are developing various utilisation options such as domestic (households and car fuel) and power generation. Investment in LNG and CNG processing plants is also being sought.
1 Source: The Petroleum (Exploration and Production) Act, 1980.
2 Source: http://www.mem.go.tz/aboutus/MEMOverview/TheEnergySector/tabid/121/language/en-US/Default.aspx.
3 The main project sponsor was AES Sirocco (USA), a large electricity company operating worldwide. The other sponsor is Pan
African Energy, formerly Ocelot International, a gas development company, with operations in several African countries. Project investors are AES, Pan African Energy, TANESCO, TPDC, CDC, TDFL, EIB and World Bank, the latter two through the Government of Tanzania. Source: http://www.tpdc-tz.com/songo_songo.htm.
TEITI Reconciliation report for the year ended 30 June 2012
Moore Stephens LLP | P a g e 16
4.1.2. Key legislation and regulatory structure
The key legislation regulating the Tanzanian upstream oil and gas sector is the Petroleum (Exploration and Production) Act 1980 (the Petroleum Act 1980), which vests title to all petroleum within Tanzania and the territorial waters of the United Republic of Tanzania.
The large discoveries of natural gas have prompted the Tanzanian Government to develop a Natural Gas Policy. The policy was completed on 10th October 2013 and will supplement Tanzania’s existing 2003 National Energy Policy.
Under the Petroleum Act 1980, the oil and gas industry in Tanzania is regulated by the Ministry for Energy and Minerals (MEM), which sets industry-specific policies, strategies and laws. The MEM co-ordinates the TPDC, which regulates upstream activities and the Energy and Water Utilities Regulatory Authority (EWURA), which regulates downstream activities.
The TPDC was established in 1969 by the Tanzanian Government under the Tanzania Petroleum Corporation (Establishment) Order (GN No. 140 of 1969). It is the TPDC through which the MEM implements its petroleum exploration and development policies.
The role of TPDC is set out in the Tanzania Petroleum Corporation (Establishment) Order as being:
to promote and monitor exploration for oil and gas; to develop and produce oil and gas; to conduct research relating to development of the oil and gas industry in Tanzania; to manage the exploration for oil and gas; to advise the Government on petroleum production data; to undertake the management of strategic fuel reserves; and to undertake trading in petroleum products.
The TPDC is also a signatory to all production sharing agreements (PSAs) entered into in Tanzania. The TPDC monitors the implementation of PSAs and advises the Tanzanian Government on various compliance issues.
4.1.3. Licencing1
Rights to explore for and produce petroleum in Tanzania are obtained by entering into a PSA with the Tanzanian Government and the TPDC. Under the agreement, the Tanzanian Government grants petroleum exploration and development licences to the TPDC, which in turn engages the oil company to carry out petroleum exploration and production operations on its behalf. Standard terms for the PSA, which are negotiable, are set out in Tanzania’s 2008 Model PSA (MPSA) and the Petroleum Act 1980. Applications for licences and for entry into PSAs are done both through licensing rounds and by application.
The negotiated terms of the PSA’s form the basis of the licences. The legislative framework offers considerable flexibility to the Government in negotiating acceptable proceeds sharing terms with oil companies. An exploration licence normally consists of 60 blocks (each block being a 5 minute x 5 minute geographical unit) but the Petroleum (Exploration and Production) Act 1980 does provide flexibility for more than one licence to be granted and, in certain cases, for a licence to comprise more or less than 60 blocks. The Act also provides provisions for exploration, appraisal, development and production periods.
Exploration is permitted for up to 11 years; divided into one initial and two renewable periods of 4, 4 and 3 years respectively. Appraisal normally takes 2 years but can take more if necessary. Development and Production is awarded for 25 years with the possibility of an extension for a further 20 years. According to the Model Producing Sharing Agreement 2008, the annual licence charges include a 4 US$/km2 fee in the first 2 years of exploration; a 8 US$/km2 fee in the first 4 year extension period and a 16 US$/km2 fee in the second 4 and 3 years extension periods.
1 Source: http://www.tpdc-tz.com/tpdc/legal_fiscal.php
TEITI Reconciliation report for the year ended 30 June 2012
Moore Stephens LLP | P a g e 17
In the event of a commercial discovery, the holder of an exploration licence has the right to a development licence, subject to the development plan ensuring the most efficient and beneficial use of the resources discovered.
The Tanzania Petroleum Development Corporation (TPDC) has announced that the Fourth Tanzania Deep Offshore and North Lake Tanganyika Licensing Round will be launched on 25 October 2013, during the 2nd Tanzania Oil and Gas Conference and Exhibition, in Dar Es Salaam, Tanzania. This round has been delayed since September 2012 whilst awaiting the approval of the new ‘Natural Gas Policy’.
The latest announcement states that the fourth round will offer seven offshore blocks, located in water depths between 2,000-3,000 metres, as well as the North Lake Tanganyika block onshore. The blocks offered exclude offshore Blocks 1B and 1C which are reserved for the Government and the TPDC who will look to gain a strategic partner to explore these areas through a competitive process. The round will conclude on 15 May 2014
1.
4.1.4. Taxation
The fiscal terms applicable to upstream petroleum activities in Tanzania are governed primarily by terms of the Petroleum Act 1980, the Income Tax Act, No. 11 of 2004 (the Income Tax Act) and any PSA entered into as set out below:
Royalty: under Section 81 of the Petroleum Act, a registered holder of a development licence must pay a royalty to the government;
Cost recovery; Profit oil: the remainder of the crude oil and natural gas produced is shared between the
contractor and the TPDC; Taxation: the contractor is subject to income tax under the Income Tax Act at the standard
corporate income tax rate of 30 per cent; Customs duties: under the MPSA, all machinery, equipment, vehicles, materials, supplies,
consumable items and moveable property imported for use in petroleum activities can be imported and exported free of all duties and taxes;
Other: the contractor must pay the TPDC an annual charge in respect of any exploration licence ranging from $4–16/sq km (indexed to dollar inflation rates) depending on the period of exploration; and
Repatriation of profits – the payment of dividends is subject to a withholding tax of 10 per cent.
The 2013 PSA includes a signature bonus of $2.5 million and a production bonus of at least $5 million. Royalty rates have been increased to 12.5 per cent of total oil and gas production for onshore or shallow operations and 7.5 per cent of total deep offshore production.
The 2013 model PSA also notes specifically that any assignment or transfer under the PSA shall be subject to the relevant taxation law.
1 http://www.tz-licensing-round.com/
TEITI Reconciliation report for the year ended 30 June 2012
Moore Stephens LLP | P a g e 18
4.2. Mining Sector
4.2.1. Background and profile of the mining sector in Tanzania1
Tanzania has over 800,000 Km2 of varied geological terrains with potential mineral resources such as
gold in Archaean greenstone belts – south and east of Lake Victoria as well as in Proterozoic terrains in Mbeya, Sumbawanga, Tanga and Morogoro regions. Gold, base metals (Ni, Co, Pb, PGM, etc.), and Iron ore are found in Proterozoic rocks in the south-western, southern and eastern parts of the country. Diamond resources have been found and are sometimes mined in Kimberlite pipes in the central and southern portion of the Archaean craton (the Dodoman Craton) in the Shinyanga, Tabora and Singida regions.
Gemstones such as tanzanite, ruby, sapphire, spinnel, tourmaline topaz, scapolite, aquamarine, emeralds, amethyst and garnets (tsavorite, rhodolite, hessonite, almandite, pyrope, etc.) have been discovered in Proterozoic rocks to the east, west and south of the Archaean Craton along the Mozambican mobile Belt in Arusha, Tanga, Morogoro, Mtwara, Lindi, and Songea Regions. Industrial resources such as uranium, limestone, phosphates, coal, trona (soda ash), salt brines, and building materials are available in various geological environments across the country (Karoo to Quaternary).
In the 1980’s Tanzania had to undertake structural economic reforms aimed at promoting socio-economic development. Consistent with these reforms, the role of the Government has shifted from being the sole owner and operator of mines to merely being the regulator, the formulator of policy, guidelines and regulations and the promoter and facilitator of private investments in the mineral sector.
These reforms brought about changes in the mineral sector, which included formulation of the Mineral Policy of 1997, enactment of the Mining Act of 1998 and amendment of financial laws that created a conducive environment for private investment
2. The Mining Act of 1998 guaranteed investors’ security
of tenure, repatriation of capital and profits and transparency in the issuance and administration of mineral rights on a ‘first-come-first-served’ basis.
Despite the progress made following the Mineral Policy of 1997, the mineral sector continued to face some challenges. In particular, the sector has experienced low integration with other sectors of the economy; its contribution to GDP has been low relative to the growth in the sector; minimal inputs and low capacity of the Government to administer the sector; low levels of value addition of minerals; and environmental degradation.
The Mineral Policy of 2009 was formulated with the aims of strengthening integration of the mineral sector with other sectors of the economy; improving economic environment for investment; maximising benefits from mining; improving the legal environment; strengthening capacity for administration of the mineral sector; developing small scale miners; promoting and facilitating value addition to minerals; and strengthening environmental management
1. To implement the Mineral Policy of 2009, the Mining
Act of 2010 was enacted, repealing the Mining Act of 1998.
4.2.2. Legal context
The Mining Act of 2010 sets out the legal framework governing mineral exploration, exploitation and trading. Various mining regulations have been established under the Mining Act 2010 to regulate mining activities. These Mining Regulations and Rules are: the Mining (Mineral Rights) Regulations, 2010; the Mining (Mineral Trading) Regulations, 2010; the Mining (Mineral Beneficiation) Regulations, 2010; the Mining (Safety, Occupational Health and Environmental Protection) Regulations, 2010; the Mining (Environmental Protection for Small Scale Mining) Regulations, 2010; The Mining Development Agreement Model 2010; and the Mining (Radioactive Minerals) Regulations, 2010.
1 The Mineral Policy of Tanzania – September 2009.
2 The Mineral Policy of Tanzania, 1997.
TEITI Reconciliation report for the year ended 30 June 2012
Moore Stephens LLP | P a g e 19
Other regulations that were grandfathered from the Mining Act of 1998 and have been adopted by the Mining Act 2010 include: The Mining (Salt and Iodation) Regulations, 1999; the Mining (Dispute Settlement Resolution) Rules, 1999; the Mining (Mineral Controlled Area) Regulations, 2001; and the Mining (Diamond Trading) Regulations, 2003.
The Mining Act of 2010 and its Regulations are therefore the legal instrument to regulate exploration, mining, beneficiation and mineral trading. The Act promotes and regulates local and foreign participation in investment as follows:
large and medium scale exploration and mining is open to 100% local, 100% foreign or joint venture local/foreign companies;
small scale exploration and mining is set for only Tanzanian companies and individuals;
gemstone exploration and mining is set for joint venture of 50% local and 50% foreign or 100% local;
mineral trading is set for either 100% local or not less than 25% local and not more than 75% foreign; and
mineral beneficiation activities also allowed for both local and foreign sole or through joint venture projects.
Under the Mining Act 2010 a Tax Stability guarantee is offered within a Mining Development Agreement (MDA). Under the MDA mining ventures with Special Mining Licences may enter into an MDA with the Government to provide a tax stabilisation assurance for a large project of over US$100 million investment for the full life of the project with review milestones every 5 years.
One of the main focuses of the new rules fell on the issue of the government's participation in mining projects, as a means to extract economic benefit and provide a measure of control and knowledge transfer. Under the 2010 act, the government may now negotiate with any mineral right to acquire free-carried interest and state participation in any mining operations (with no obligation to contribute to development or operating expenses) under a special mining license.
The level of government's free-carried interest is not set by the 2010 act; the ownership in future mining projects will therefore be based on the level of investment in each individual joint venture. The mining Act 2010 also directs mining projects to provide compensation, relocation and resettlement plans. The plans must be implemented before commencement of the project under the Land Act.
4.2.3. Licencing
The Mining Act (2010) establishes state ownership of minerals and provides rights and conditions to explore, develop and produce such minerals. The Act groups minerals into categories for the purpose of defining incentives, penalties, specialized skills development and mineral administration. The categories of minerals are as follows: gemstones; diamonds; building materials; industrial minerals; metallic minerals and energy minerals.
Licencing procedures for exploration and mining for the aforementioned group of minerals are streamlined to ensure transparency and fairness by conferring ownership of mineral rights based on the "first-come-first-served" principle. According to Regulation 5 of the Mining (Mineral Rights) Regulations 2010, there are four 4 types of licences grouped into two categories that include prospecting licences issued to undertake exploration and mining licences that are issued to undertake mining operations under the Mining Act of 2010.
i. A Prospecting Licence (PL) may last 9 years and is issued for an initial period of 4 years renewable for a 3 year period followed by a final 2 year renewal. 50% of the licence area must be relinquished following each renewal. In the case of an application for a Prospecting Licence for gemstones, the period may not exceed two years and is not subject to renewal. The area of each Prospecting Licence is set at a maximum of 300 km
2. For a Prospecting Licence for gemstones or building
materials the maximum area shall be 10 km2.
ii. A Retention Licence (RL) may be granted to a holder of a Prospecting Licence, other than a Prospecting Licence for building materials or gemstones, for a period not exceeding 5 years when an exploration programme and feasibility studies have identified the existence of a significant ore Entity, which cannot be immediately developed as a mine due to adverse market conditions. The licence may be renewed for a single period of 5 years.
TEITI Reconciliation report for the year ended 30 June 2012
Moore Stephens LLP | P a g e 20
iii. A Special Mining Licence (SML) is granted in respect of the development and production stages of
a large mining operation of over US$100 million investments. The licence may be granted for a period covering the life of the mine or a period not exceeding 25 years if the exploitation of the deposit (according to feasibility study) exceeds 25 years of the proposed mine. An SML may be renewed for a period not exceeding twenty-five years. The minimum size of an SML is 35 km
2 other
than superficial and 70 km2 superficial.
iv. A Mining Licence (ML) may be granted for a period not exceeding 10 years. It may be renewed for a period not exceeding 10 years. The size of each ML shall be as follows: for a Mining Licence for all minerals other than building materials or gemstones the maximum area shall be 10 km
2; and for
an ML for building materials the maximum area is 1 km2.
v. A Primary Mining Licence (PML), which is only granted to citizens of Tanzania, confers on the holder the exclusive right to carry out mining operations. The licence is granted for a period of 5 years and may be renewed for the same period. The holder of one or several PMLs may apply to convert the licence or licences to a Mining Licence. For PMLs for all minerals other than building materials the maximum size shall be 10 hectares. For PMLs for building materials the maximum size shall be 5 hectares.
Trading licences are also issued under the Mining Act of 2010 to permit individuals and companies to conduct trading activities in the country and abroad. Trading activities are therefore permitted through the following licences:
Broker Licence (BL) which is only issued to citizens of Tanzania, allowing them to buy minerals from mine sites and to sell to dealers within the country;
Dealer Licence (DL) granted to citizens of Tanzania or to joint ventures of not less than a 25% local shareholding, allowing them to buy minerals from brokers and to export to any destination after obtaining mineral export permits including a Kimberley Certificate in the case of diamonds.
Mineral beneficiation licences include: Processing Licences that allow individuals and companies to process mineral ores; Smelting Licences that enable companies and individuals to establish smelter plants for metal smelting; and Refining Licences to allow refinery activities to be undertaken.
4.2.4. Taxation
Royalties on minerals are regulated by the Mining Act, 2010 and are charged on gross value for diamonds, gemstone and uranium at 5%; precious metals (gold, silver, copper, platinum, etc.) at 4%, polished and cut gemstones at 1% and others (building materials, salt, industrial minerals) at 3%.
Applicable legislations under the fiscal regime are the Income Tax Act 2008 (revised edition of the Income Tax Act 2003), Financial Laws (Miscellaneous Amendments) Act 1997, the Value Added Act 1997, the Road and Fuel Toll 1985 and the Finance Act 2013.
In Tanzania mining companies are required to pay an income tax (corporate tax) of 30% on income derived from mining operations. Import duty for mining equipment and supplies directly related to mining operations are exempted up to one year after the start of the mine; thereafter a cap limit of 5% applies. Import duty is exempted on exploration equipment.
Usually Value Added Tax (VAT) on domestic sales is 18%, whilst exports are Zero rated for VAT purposes. There is a VAT special relief provided to mining companies on certain goods and services and VAT paid is fully refundable on these items.
There are also other taxes imposed, such as a 10% withholding tax on dividends; a withholding tax on technical services of 5% to residents and 15% to foreigners; fuel levy and excise duty on fuel is capped at US$200,000 per annum; and a Local Government levy is 0.3% on yearly turnover. However, there is a system of project ring-fencing whereby each mine must be taxed separately.
TEITI Reconciliation report for the year ended 30 June 2012
Moore Stephens LLP | P a g e 21
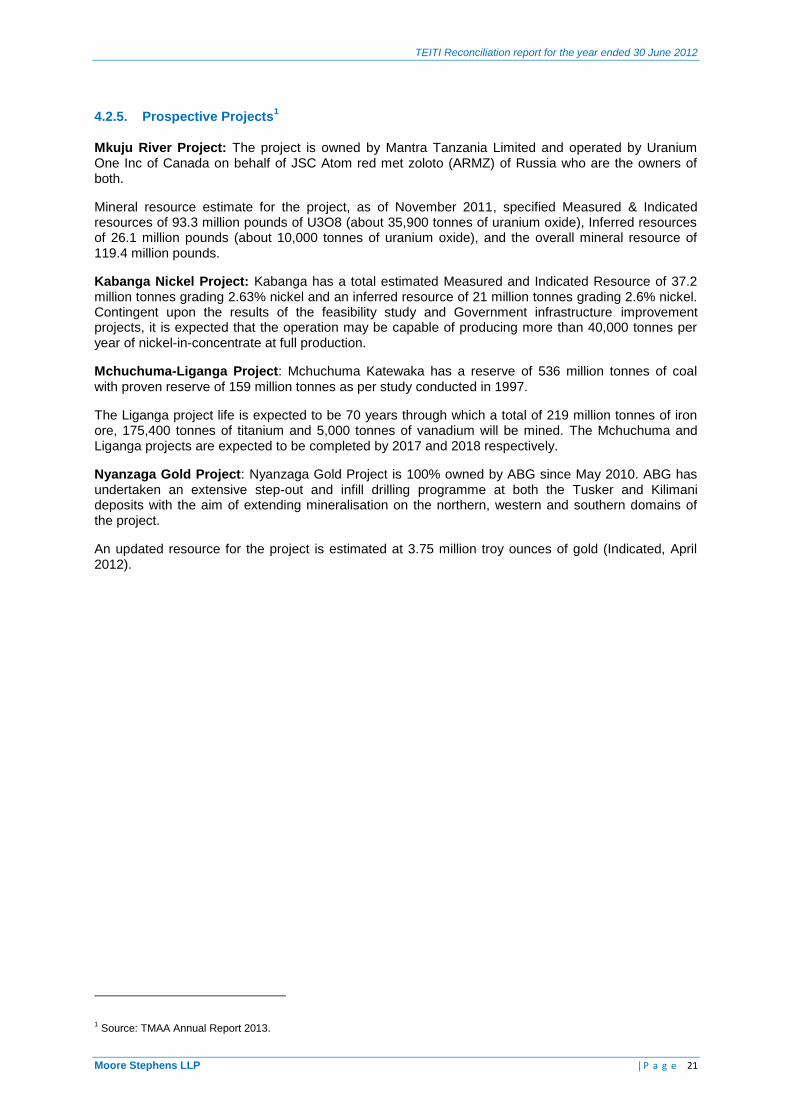
4.2.5. Prospective Projects
1
Mkuju River Project: The project is owned by Mantra Tanzania Limited and operated by Uranium One Inc of Canada on behalf of JSC Atom red met zoloto (ARMZ) of Russia who are the owners of both.
Mineral resource estimate for the project, as of November 2011, specified Measured & Indicated resources of 93.3 million pounds of U3O8 (about 35,900 tonnes of uranium oxide), Inferred resources of 26.1 million pounds (about 10,000 tonnes of uranium oxide), and the overall mineral resource of 119.4 million pounds.
Kabanga Nickel Project: Kabanga has a total estimated Measured and Indicated Resource of 37.2 million tonnes grading 2.63% nickel and an inferred resource of 21 million tonnes grading 2.6% nickel. Contingent upon the results of the feasibility study and Government infrastructure improvement projects, it is expected that the operation may be capable of producing more than 40,000 tonnes per year of nickel-in-concentrate at full production.
Mchuchuma-Liganga Project: Mchuchuma Katewaka has a reserve of 536 million tonnes of coal
with proven reserve of 159 million tonnes as per study conducted in 1997.
The Liganga project life is expected to be 70 years through which a total of 219 million tonnes of iron ore, 175,400 tonnes of titanium and 5,000 tonnes of vanadium will be mined. The Mchuchuma and Liganga projects are expected to be completed by 2017 and 2018 respectively.
Nyanzaga Gold Project: Nyanzaga Gold Project is 100% owned by ABG since May 2010. ABG has undertaken an extensive step-out and infill drilling programme at both the Tusker and Kilimani deposits with the aim of extending mineralisation on the northern, western and southern domains of the project.
An updated resource for the project is estimated at 3.75 million troy ounces of gold (Indicated, April 2012).
1 Source: TMAA Annual Report 2013.
TEITI Reconciliation report for the year ended 30 June 2012
Moore Stephens LLP | P a g e 22
5. DETERMINATION OF THE RECONCILIATION SCOPE
Our work included a general understanding of the extractive sector in Tanzania. We also consulted with Government Entities in order to collect relevant information on the size of the extractive sector in Tanzania and its contribution to the economy and to Government revenues, as a part of the process to establish the prospective scope of the 2012 reconciliation.
We have taken into account all the available information presented to us during our fieldwork, including the subsequent comments and information of the Tanzania’s EITI Multi-Stakeholder Working Group.
5.1. Sectors and Activities
5.1.1. Oil & Gas Sector
According to the information made available by TPDC, no oil has been produced until now, while significant gas discoveries were made.
Natural gas activities are currently taking place onshore and shallow waters, deep offshore and inland rift basins. As of December 2012, there were 26 Production Sharing Agreements signed with 18 oil exploration companies. Over 110,000 km
2 of 2D seismic data have been acquired onshore, shelf,
offshore as well as from inland rift basins. As of February 2013 a total of 21,632 km2 of 3D seismic
data had been acquired from the deep sea. A total of 67 wells for both exploration and development have been drilled between 1952 and 2013, of which 53 wells are in onshore basins and 14 in the offshore basins.
Natural gas discoveries totalling around 8 trillion cubic feet (TCF) have been made from the onshore gas fields at Songo Songo, Mnazi Bay, Mkuranga, Kiliwani North and Ntorya. As of June 2013 natural gas discoveries of about 42.7 TCF (7.5 billion barrels of oil equivalent – BoE) have been made from both on- and off-shore basins. The deep sea discoveries have brought about new exploration targets for hydrocarbons in Tanzania and the whole of Western Indian Ocean Region
1.
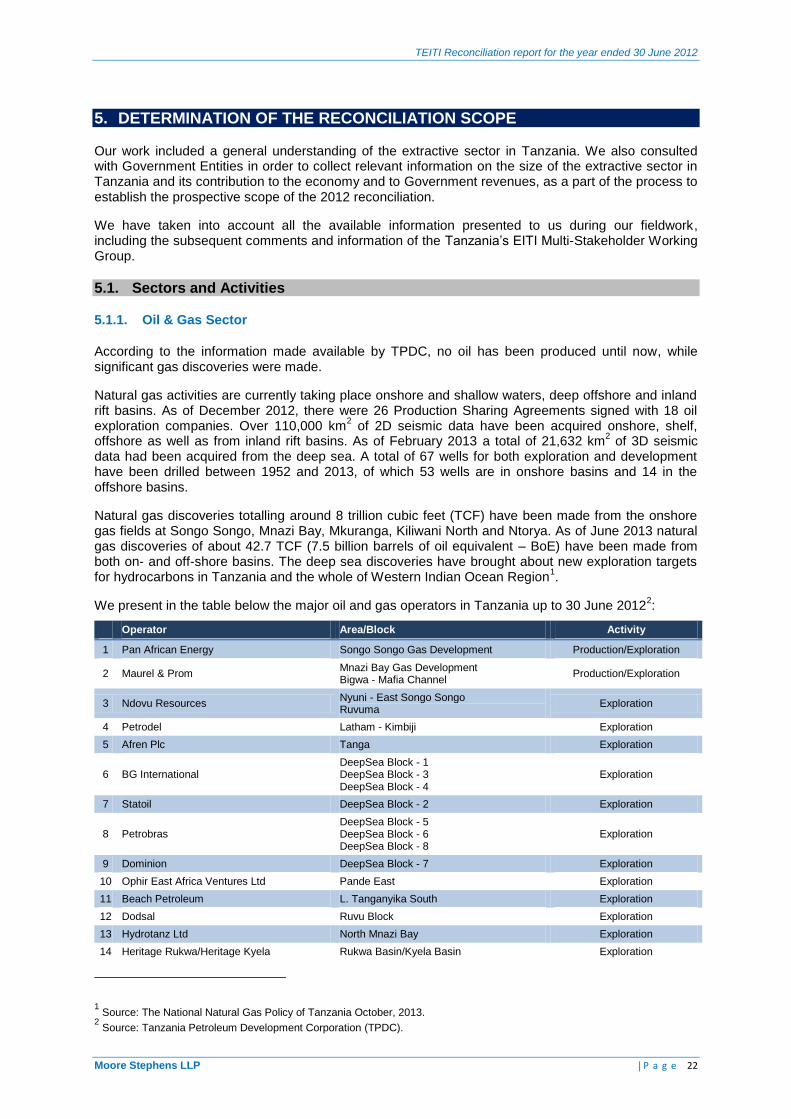
We present in the table below the major oil and gas operators in Tanzania up to 30 June 20122:
Operator Area/Block Activity
1 Pan African Energy Songo Songo Gas Development Production/Exploration
2 Maurel & Prom Mnazi Bay Gas Development Bigwa - Mafia Channel
Production/Exploration
3 Ndovu Resources Nyuni - East Songo Songo Ruvuma
Exploration
4 Petrodel Latham - Kimbiji Exploration
5 Afren Plc Tanga Exploration
6 BG International DeepSea Block - 1 DeepSea Block - 3 DeepSea Block - 4
Exploration
7 Statoil DeepSea Block - 2 Exploration
8 Petrobras DeepSea Block - 5 DeepSea Block - 6 DeepSea Block - 8
Exploration
9 Dominion DeepSea Block - 7 Exploration
10 Ophir East Africa Ventures Ltd Pande East Exploration
11 Beach Petroleum L. Tanganyika South Exploration
12 Dodsal Ruvu Block Exploration
13 Hydrotanz Ltd North Mnazi Bay Exploration
14 Heritage Rukwa/Heritage Kyela Rukwa Basin/Kyela Basin Exploration
1 Source: The National Natural Gas Policy of Tanzania October, 2013.
2 Source: Tanzania Petroleum Development Corporation (TPDC).
TEITI Reconciliation report for the year ended 30 June 2012
Moore Stephens LLP | P a g e 23
Operator Area/Block Activity
15 Swala Energy Kilosa-Kilombero Basin Pangani Basin
Exploration
16 Motherland Homes Malagarasi Basin Exploration
17 Tanzania Petroleum Development Corporation
Kisangire - Lukurilo Mandawa Selous West Songo Songo
Production/Exploration
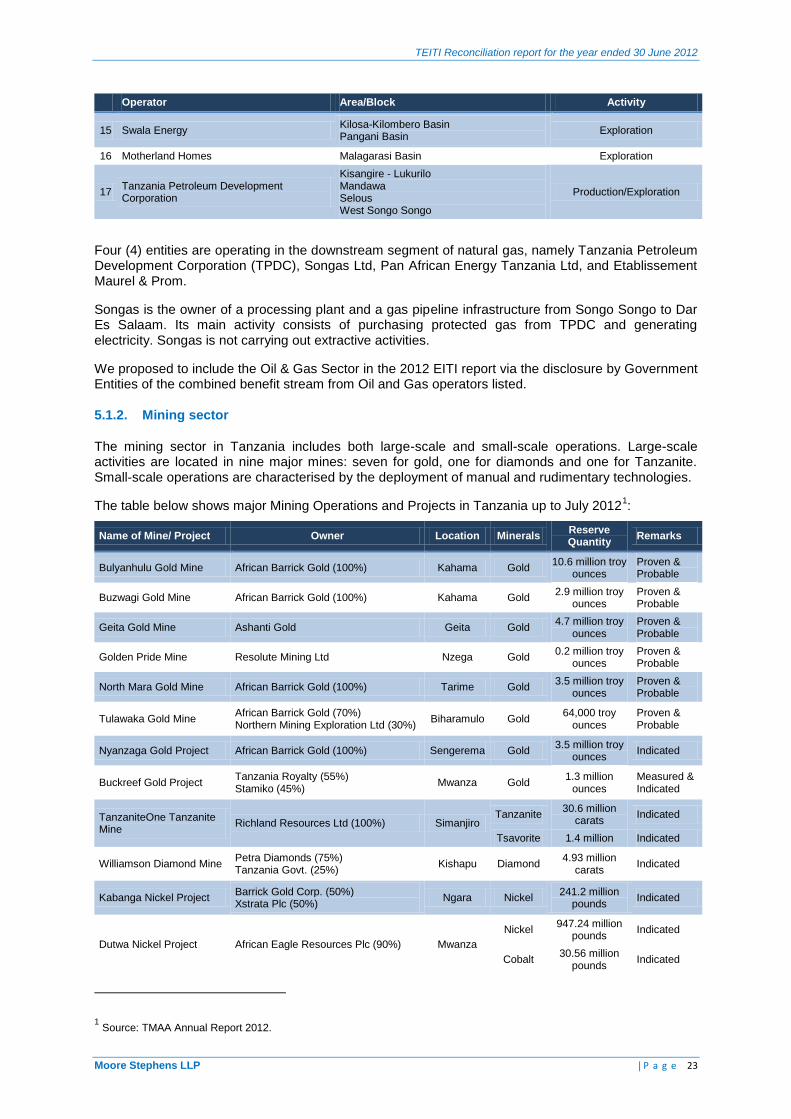
Four (4) entities are operating in the downstream segment of natural gas, namely Tanzania Petroleum Development Corporation (TPDC), Songas Ltd, Pan African Energy Tanzania Ltd, and Etablissement Maurel & Prom.
Songas is the owner of a processing plant and a gas pipeline infrastructure from Songo Songo to Dar Es Salaam. Its main activity consists of purchasing protected gas from TPDC and generating electricity. Songas is not carrying out extractive activities.
We proposed to include the Oil & Gas Sector in the 2012 EITI report via the disclosure by Government Entities of the combined benefit stream from Oil and Gas operators listed.
5.1.2. Mining sector
The mining sector in Tanzania includes both large-scale and small-scale operations. Large-scale activities are located in nine major mines: seven for gold, one for diamonds and one for Tanzanite. Small-scale operations are characterised by the deployment of manual and rudimentary technologies.
The table below shows major Mining Operations and Projects in Tanzania up to July 20121:
Name of Mine/ Project Owner Location Minerals Reserve Quantity
Remarks
Bulyanhulu Gold Mine African Barrick Gold (100%) Kahama Gold 10.6 million troy
ounces Proven & Probable
Buzwagi Gold Mine African Barrick Gold (100%) Kahama Gold 2.9 million troy
ounces Proven & Probable
Geita Gold Mine Ashanti Gold Geita Gold 4.7 million troy
ounces Proven & Probable
Golden Pride Mine Resolute Mining Ltd Nzega Gold 0.2 million troy
ounces Proven & Probable
North Mara Gold Mine African Barrick Gold (100%) Tarime Gold 3.5 million troy
ounces Proven & Probable
Tulawaka Gold Mine African Barrick Gold (70%) Northern Mining Exploration Ltd (30%)
Biharamulo Gold 64,000 troy
ounces Proven & Probable
Nyanzaga Gold Project African Barrick Gold (100%) Sengerema Gold 3.5 million troy
ounces Indicated
Buckreef Gold Project Tanzania Royalty (55%) Stamiko (45%)
Mwanza Gold 1.3 million
ounces Measured & Indicated
TanzaniteOne Tanzanite Mine
Richland Resources Ltd (100%) Simanjiro Tanzanite
30.6 million carats
Indicated
Tsavorite 1.4 million Indicated
Williamson Diamond Mine Petra Diamonds (75%) Tanzania Govt. (25%)
Kishapu Diamond 4.93 million
carats Indicated
Kabanga Nickel Project Barrick Gold Corp. (50%) Xstrata Plc (50%)
Ngara Nickel 241.2 million
pounds Indicated
Dutwa Nickel Project African Eagle Resources Plc (90%) Mwanza
Nickel 947.24 million
pounds Indicated
Cobalt 30.56 million
pounds Indicated
1 Source: TMAA Annual Report 2012.
TEITI Reconciliation report for the year ended 30 June 2012
Moore Stephens LLP | P a g e 24
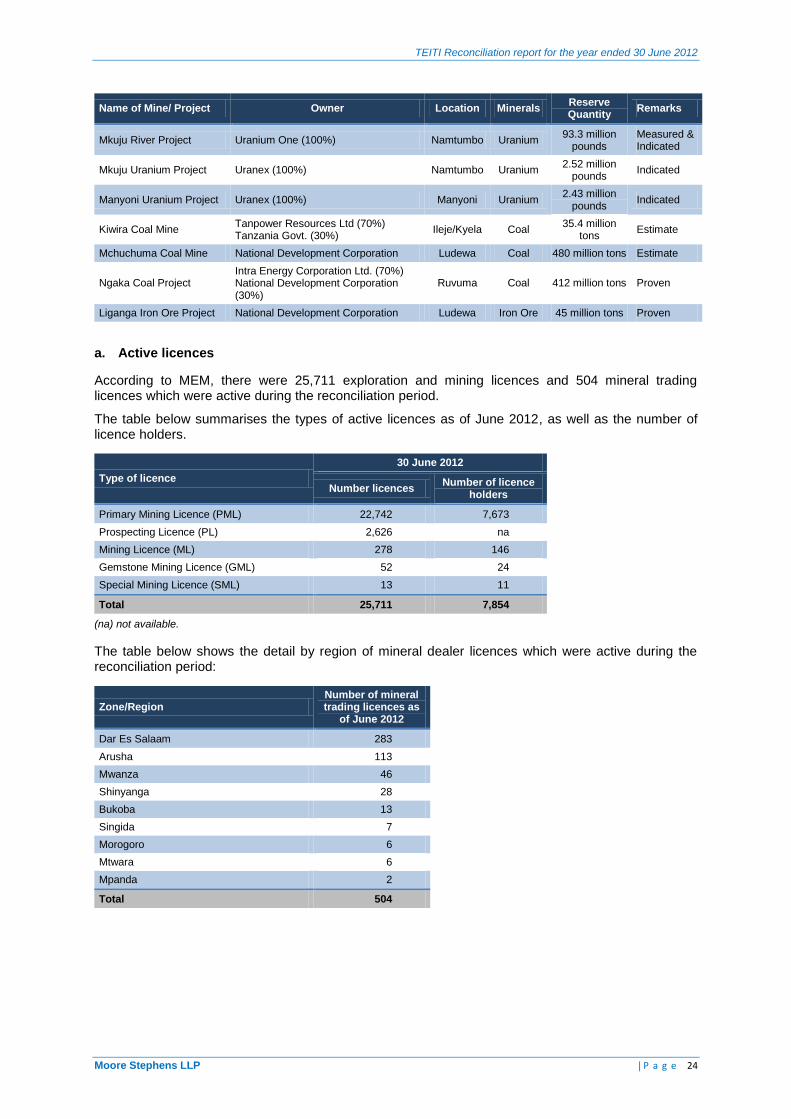
Name of Mine/ Project Owner Location Minerals Reserve Quantity
Remarks
Mkuju River Project Uranium One (100%) Namtumbo Uranium 93.3 million
pounds Measured & Indicated
Mkuju Uranium Project Uranex (100%) Namtumbo Uranium 2.52 million
pounds Indicated
Manyoni Uranium Project Uranex (100%) Manyoni Uranium 2.43 million
pounds Indicated
Kiwira Coal Mine Tanpower Resources Ltd (70%) Tanzania Govt. (30%)
Ileje/Kyela Coal 35.4 million
tons Estimate
Mchuchuma Coal Mine National Development Corporation Ludewa Coal 480 million tons Estimate
Ngaka Coal Project Intra Energy Corporation Ltd. (70%) National Development Corporation (30%)
Ruvuma Coal 412 million tons Proven
Liganga Iron Ore Project National Development Corporation Ludewa Iron Ore 45 million tons Proven
a. Active licences
According to MEM, there were 25,711 exploration and mining licences and 504 mineral trading licences which were active during the reconciliation period.
The table below summarises the types of active licences as of June 2012, as well as the number of licence holders.
Type of licence
30 June 2012
Number licences Number of licence
holders
Primary Mining Licence (PML) 22,742 7,673
Prospecting Licence (PL) 2,626 na
Mining Licence (ML) 278 146
Gemstone Mining Licence (GML) 52 24
Special Mining Licence (SML) 13 11
Total 25,711 7,854
(na) not available.
The table below shows the detail by region of mineral dealer licences which were active during the reconciliation period:
Zone/Region Number of mineral trading licences as
of June 2012
Dar Es Salaam 283
Arusha 113
Mwanza 46
Shinyanga 28
Bukoba 13
Singida 7
Morogoro 6
Mtwara 6
Mpanda 2
Total 504
TEITI Reconciliation report for the year ended 30 June 2012
Moore Stephens LLP | P a g e 25
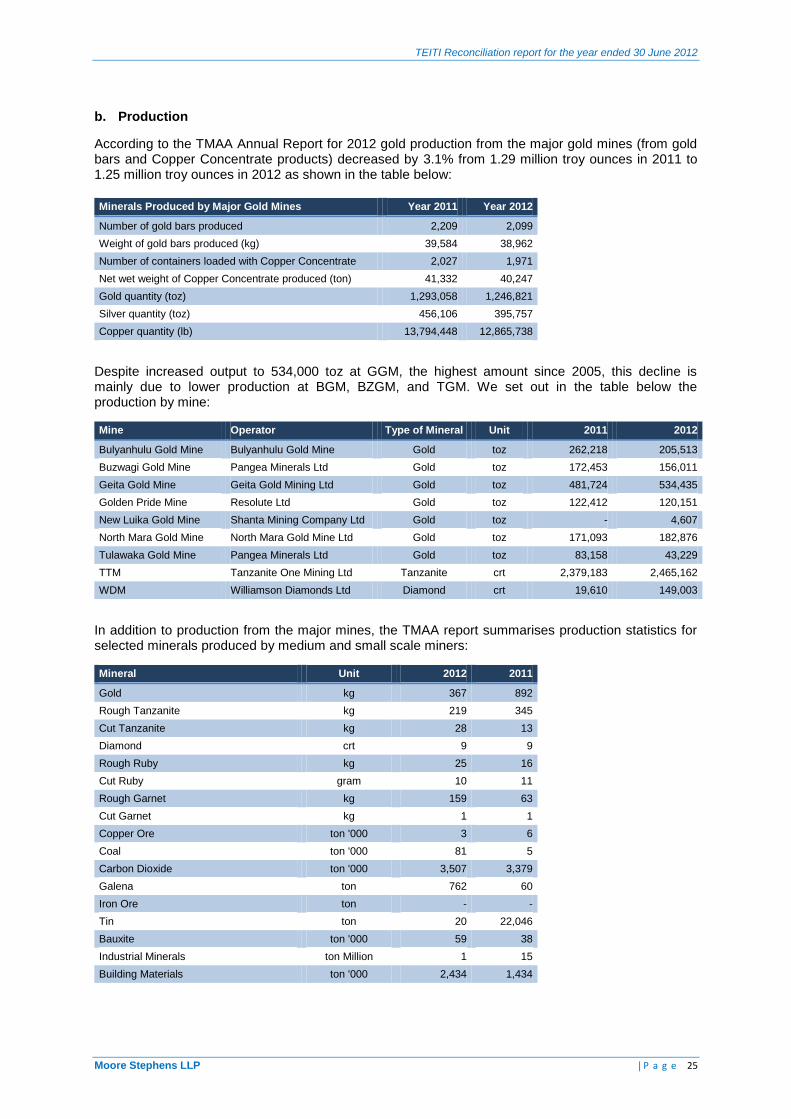
b. Production
According to the TMAA Annual Report for 2012 gold production from the major gold mines (from gold bars and Copper Concentrate products) decreased by 3.1% from 1.29 million troy ounces in 2011 to 1.25 million troy ounces in 2012 as shown in the table below:
Minerals Produced by Major Gold Mines Year 2011 Year 2012
Number of gold bars produced 2,209 2,099
Weight of gold bars produced (kg) 39,584 38,962
Number of containers loaded with Copper Concentrate 2,027 1,971
Net wet weight of Copper Concentrate produced (ton) 41,332 40,247
Gold quantity (toz) 1,293,058 1,246,821
Silver quantity (toz) 456,106 395,757
Copper quantity (lb) 13,794,448 12,865,738
Despite increased output to 534,000 toz at GGM, the highest amount since 2005, this decline is mainly due to lower production at BGM, BZGM, and TGM. We set out in the table below the production by mine:
Mine Operator Type of Mineral Unit 2011 2012
Bulyanhulu Gold Mine Bulyanhulu Gold Mine Gold toz 262,218 205,513
Buzwagi Gold Mine Pangea Minerals Ltd Gold toz 172,453 156,011
Geita Gold Mine Geita Gold Mining Ltd Gold toz 481,724 534,435
Golden Pride Mine Resolute Ltd Gold toz 122,412 120,151
New Luika Gold Mine Shanta Mining Company Ltd Gold toz - 4,607
North Mara Gold Mine North Mara Gold Mine Ltd Gold toz 171,093 182,876
Tulawaka Gold Mine Pangea Minerals Ltd Gold toz 83,158 43,229
TTM Tanzanite One Mining Ltd Tanzanite crt 2,379,183 2,465,162
WDM Williamson Diamonds Ltd Diamond crt 19,610 149,003
In addition to production from the major mines, the TMAA report summarises production statistics for selected minerals produced by medium and small scale miners:
Mineral Unit 2012 2011
Gold kg 367 892
Rough Tanzanite kg 219 345
Cut Tanzanite kg 28 13
Diamond crt 9 9
Rough Ruby kg 25 16
Cut Ruby gram 10 11
Rough Garnet kg 159 63
Cut Garnet kg 1 1
Copper Ore ton '000 3 6
Coal ton '000 81 5
Carbon Dioxide ton '000 3,507 3,379
Galena ton 762 60
Iron Ore ton - -
Tin ton 20 22,046
Bauxite ton '000 59 38
Industrial Minerals ton Million 1 15
Building Materials ton '000 2,434 1,434
TEITI Reconciliation report for the year ended 30 June 2012
Moore Stephens LLP | P a g e 26
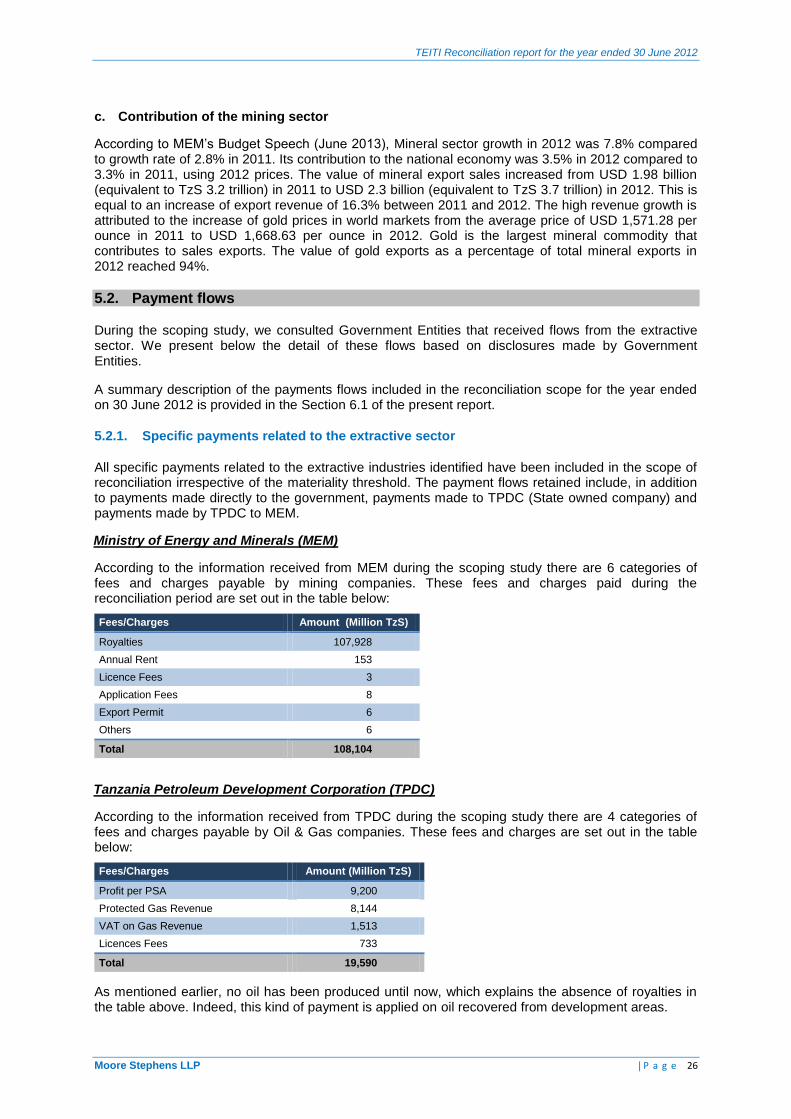
c. Contribution of the mining sector
According to MEM’s Budget Speech (June 2013), Mineral sector growth in 2012 was 7.8% compared to growth rate of 2.8% in 2011. Its contribution to the national economy was 3.5% in 2012 compared to 3.3% in 2011, using 2012 prices. The value of mineral export sales increased from USD 1.98 billion (equivalent to TzS 3.2 trillion) in 2011 to USD 2.3 billion (equivalent to TzS 3.7 trillion) in 2012. This is equal to an increase of export revenue of 16.3% between 2011 and 2012. The high revenue growth is attributed to the increase of gold prices in world markets from the average price of USD 1,571.28 per ounce in 2011 to USD 1,668.63 per ounce in 2012. Gold is the largest mineral commodity that contributes to sales exports. The value of gold exports as a percentage of total mineral exports in 2012 reached 94%.
5.2. Payment flows
During the scoping study, we consulted Government Entities that received flows from the extractive sector. We present below the detail of these flows based on disclosures made by Government Entities.
A summary description of the payments flows included in the reconciliation scope for the year ended on 30 June 2012 is provided in the Section 6.1 of the present report.
5.2.1. Specific payments related to the extractive sector
All specific payments related to the extractive industries identified have been included in the scope of reconciliation irrespective of the materiality threshold. The payment flows retained include, in addition to payments made directly to the government, payments made to TPDC (State owned company) and payments made by TPDC to MEM.
Ministry of Energy and Minerals (MEM)
According to the information received from MEM during the scoping study there are 6 categories of fees and charges payable by mining companies. These fees and charges paid during the reconciliation period are set out in the table below:
Fees/Charges Amount (Million TzS)
Royalties 107,928
Annual Rent 153
Licence Fees 3
Application Fees 8
Export Permit 6
Others 6
Total 108,104
Tanzania Petroleum Development Corporation (TPDC)
According to the information received from TPDC during the scoping study there are 4 categories of fees and charges payable by Oil & Gas companies. These fees and charges are set out in the table below:
Fees/Charges Amount (Million TzS)
Profit per PSA 9,200
Protected Gas Revenue 8,144
VAT on Gas Revenue 1,513
Licences Fees 733
Total 19,590
As mentioned earlier, no oil has been produced until now, which explains the absence of royalties in the table above. Indeed, this kind of payment is applied on oil recovered from development areas.
TEITI Reconciliation report for the year ended 30 June 2012
Moore Stephens LLP | P a g e 27
5.2.2. Common law taxes
Tanzania Revenue Authority
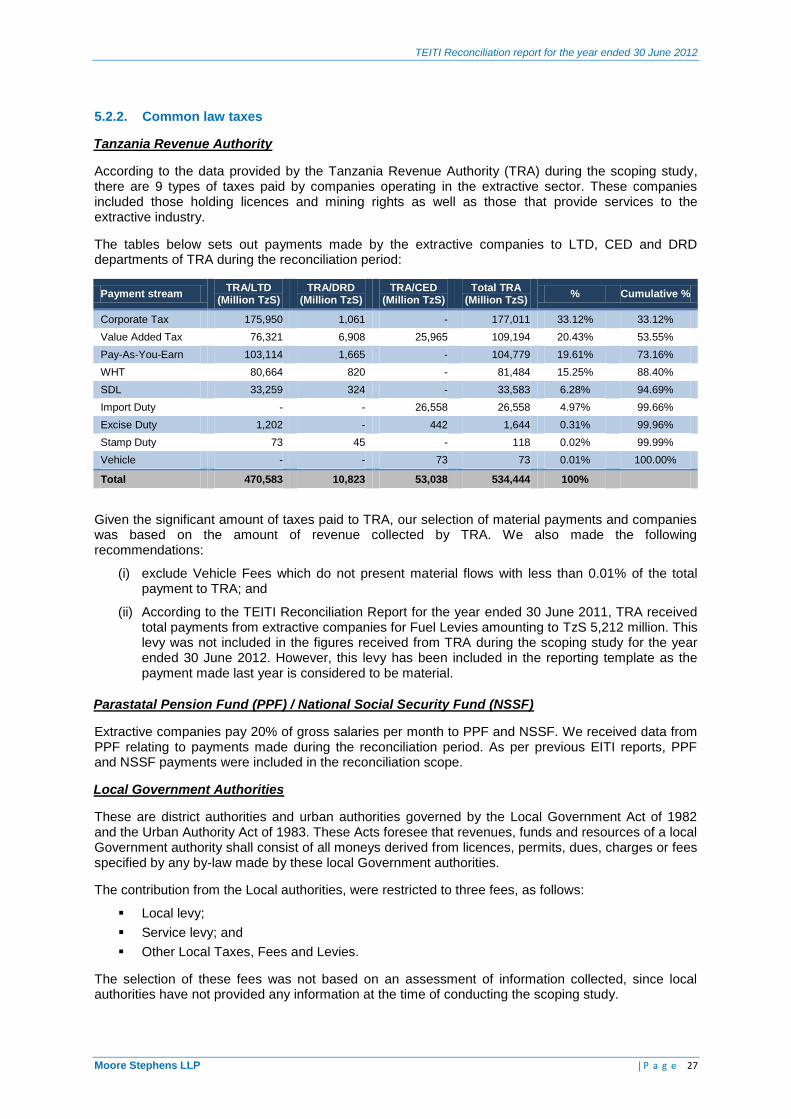
According to the data provided by the Tanzania Revenue Authority (TRA) during the scoping study, there are 9 types of taxes paid by companies operating in the extractive sector. These companies included those holding licences and mining rights as well as those that provide services to the extractive industry.
The tables below sets out payments made by the extractive companies to LTD, CED and DRD departments of TRA during the reconciliation period:
Payment stream TRA/LTD
(Million TzS) TRA/DRD
(Million TzS) TRA/CED
(Million TzS) Total TRA
(Million TzS) % Cumulative %
Corporate Tax 175,950 1,061 - 177,011 33.12% 33.12%
Value Added Tax 76,321 6,908 25,965 109,194 20.43% 53.55%
Pay-As-You-Earn 103,114 1,665 - 104,779 19.61% 73.16%
WHT 80,664 820 - 81,484 15.25% 88.40%
SDL 33,259 324 - 33,583 6.28% 94.69%
Import Duty - - 26,558 26,558 4.97% 99.66%
Excise Duty 1,202 - 442 1,644 0.31% 99.96%
Stamp Duty 73 45 - 118 0.02% 99.99%
Vehicle - - 73 73 0.01% 100.00%
Total 470,583 10,823 53,038 534,444 100%
Given the significant amount of taxes paid to TRA, our selection of material payments and companies was based on the amount of revenue collected by TRA. We also made the following recommendations:
(i) exclude Vehicle Fees which do not present material flows with less than 0.01% of the total payment to TRA; and
(ii) According to the TEITI Reconciliation Report for the year ended 30 June 2011, TRA received total payments from extractive companies for Fuel Levies amounting to TzS 5,212 million. This levy was not included in the figures received from TRA during the scoping study for the year ended 30 June 2012. However, this levy has been included in the reporting template as the payment made last year is considered to be material.
Parastatal Pension Fund (PPF) / National Social Security Fund (NSSF)
Extractive companies pay 20% of gross salaries per month to PPF and NSSF. We received data from PPF relating to payments made during the reconciliation period. As per previous EITI reports, PPF and NSSF payments were included in the reconciliation scope.
Local Government Authorities
These are district authorities and urban authorities governed by the Local Government Act of 1982 and the Urban Authority Act of 1983. These Acts foresee that revenues, funds and resources of a local Government authority shall consist of all moneys derived from licences, permits, dues, charges or fees specified by any by-law made by these local Government authorities.
The contribution from the Local authorities, were restricted to three fees, as follows:
Local levy;
Service levy; and
Other Local Taxes, Fees and Levies.
The selection of these fees was not based on an assessment of information collected, since local authorities have not provided any information at the time of conducting the scoping study.
TEITI Reconciliation report for the year ended 30 June 2012
Moore Stephens LLP | P a g e 28
These payments are immaterial in the context of Tanzanian EITI Reconciliation Exercise, but they are included because they are important to the areas served by local councils.
Currently the local district authorities, responsible for the collection of local levies from mining companies are: Biharamulo, Geita, Ilala, Kahama, Kilwa, Kinondoni, Kishapu, Mbeya, Mtwara, Nzega, Simanjiro, Tanga and Tarime.
Ministry of Finance
We have included dividends received by the Government from State owned companies (TPDC) or from extractive companies where the Government holds shares as well as revenues received from the sale of Government shareholdings in these companies, if applicable.
It should be noted that no payment flows related to barter arrangements involving infrastructure works as set out in EITI Requirement 9-f have been identified nor confirmed by Government Entities.
5.2.3. Other payment flows and information
We have included in the reporting template through a unilateral declaration of extractive companies the following categories of payments and other information:
others taxes and fees;
social payments; and
volumes of produced and exported mining products.
a. Others taxes and fees
This category includes all other material taxes and fees (> TzS 50 million) not listed elsewhere on the TEITI reporting template. This category will be included under each Government Entity in order to avoid any misunderstanding from the reporting entities and to facilitate the reconciliation work.
b. Social payments
These payments consist of all contributions made by extractive companies to promote local development and to finance social projects in accordance with EITI Requirement 9. This Requirement encourages MSGs to apply a high standard of transparency to social payments and transfers, the parties involved in the transactions and the materiality of these payments and transfers to other benefit streams, including the recognition that these payments may be reported even though it is not possible to reconcile them.
These contributions can be voluntary or compulsory and can be made in cash or in-kind depending on individual contracts or agreements. This category includes, inter alia: health infrastructure, school infrastructure, road infrastructure, and other projects and donations for local communities.
The social payments are included in the 2011 EITI scope through a unilateral disclosure of extractive companies. These payments can be summarised as follows:
No. Category
1 Corporate Social Responsibility in kind payments
2 Corporate Social Responsibility cash payments
c. Volumes and value of produced and exported mineral products
In order to prepare for the implementation of the new EITI Rules (May 2013) and to have comparative information for future years, we recommend that the volume and value of exports are disclosed unilaterally by the extractive companies for the current reconciliation exercise. As a result we have proposed in the reporting template a separate section for that purpose to be filled in by the extractive companies.
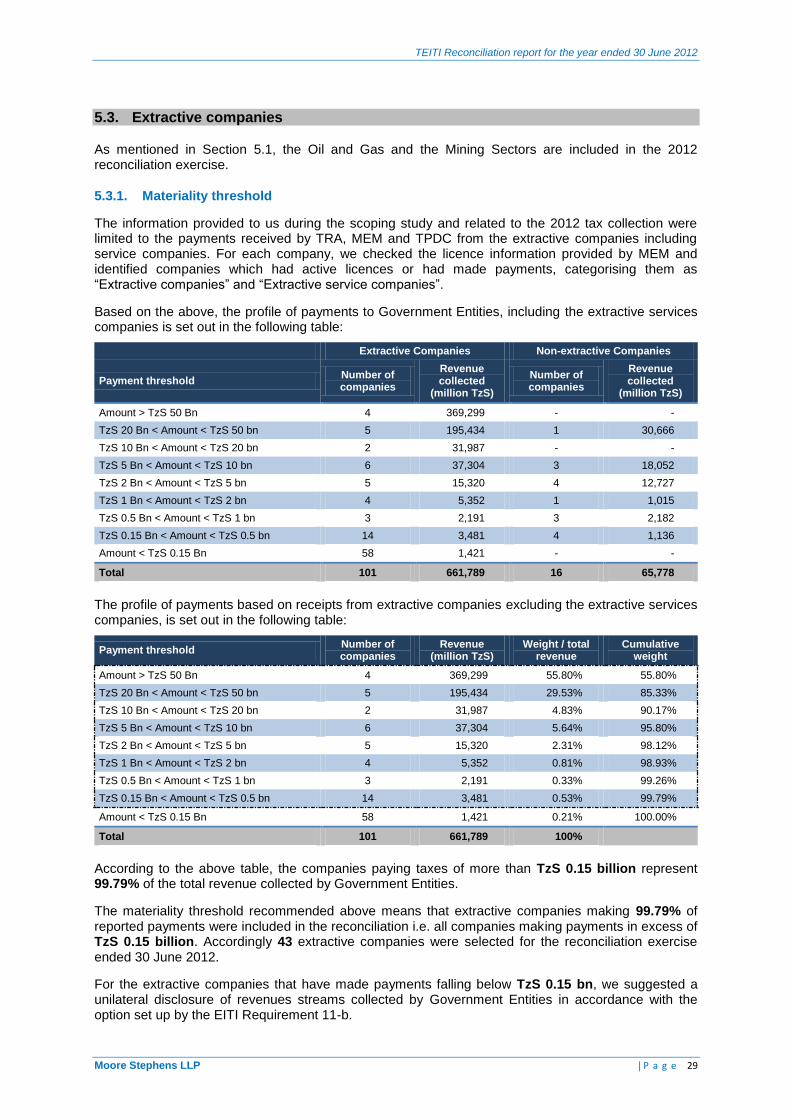
TEITI Reconciliation report for the year ended 30 June 2012
Moore Stephens LLP | P a g e 29
5.3. Extractive companies
As mentioned in Section 5.1, the Oil and Gas and the Mining Sectors are included in the 2012 reconciliation exercise.
5.3.1. Materiality threshold
The information provided to us during the scoping study and related to the 2012 tax collection were limited to the payments received by TRA, MEM and TPDC from the extractive companies including service companies. For each company, we checked the licence information provided by MEM and identified companies which had active licences or had made payments, categorising them as “Extractive companies” and “Extractive service companies”.
Based on the above, the profile of payments to Government Entities, including the extractive services companies is set out in the following table:
Extractive Companies Non-extractive Companies
Payment threshold Number of companies
Revenue collected
(million TzS)
Number of companies
Revenue collected
(million TzS)
Amount > TzS 50 Bn 4 369,299 - -
TzS 20 Bn < Amount < TzS 50 bn 5 195,434 1 30,666
TzS 10 Bn < Amount < TzS 20 bn 2 31,987 - -
TzS 5 Bn < Amount < TzS 10 bn 6 37,304 3 18,052
TzS 2 Bn < Amount < TzS 5 bn 5 15,320 4 12,727
TzS 1 Bn < Amount < TzS 2 bn 4 5,352 1 1,015
TzS 0.5 Bn < Amount < TzS 1 bn 3 2,191 3 2,182
TzS 0.15 Bn < Amount < TzS 0.5 bn 14 3,481 4 1,136
Amount < TzS 0.15 Bn 58 1,421 - -
Total 101 661,789 16 65,778
The profile of payments based on receipts from extractive companies excluding the extractive services companies, is set out in the following table:
Payment threshold Number of companies
Revenue (million TzS)
Weight / total revenue
Cumulative weight
Amount > TzS 50 Bn 4 369,299 55.80% 55.80%
TzS 20 Bn < Amount < TzS 50 bn 5 195,434 29.53% 85.33%
TzS 10 Bn < Amount < TzS 20 bn 2 31,987 4.83% 90.17%
TzS 5 Bn < Amount < TzS 10 bn 6 37,304 5.64% 95.80%
TzS 2 Bn < Amount < TzS 5 bn 5 15,320 2.31% 98.12%
TzS 1 Bn < Amount < TzS 2 bn 4 5,352 0.81% 98.93%
TzS 0.5 Bn < Amount < TzS 1 bn 3 2,191 0.33% 99.26%
TzS 0.15 Bn < Amount < TzS 0.5 bn 14 3,481 0.53% 99.79%
Amount < TzS 0.15 Bn 58 1,421 0.21% 100.00%
Total 101 661,789 100%
According to the above table, the companies paying taxes of more than TzS 0.15 billion represent 99.79% of the total revenue collected by Government Entities.
The materiality threshold recommended above means that extractive companies making 99.79% of reported payments were included in the reconciliation i.e. all companies making payments in excess of TzS 0.15 billion. Accordingly 43 extractive companies were selected for the reconciliation exercise ended 30 June 2012.
For the extractive companies that have made payments falling below TzS 0.15 bn, we suggested a unilateral disclosure of revenues streams collected by Government Entities in accordance with the option set up by the EITI Requirement 11-b.
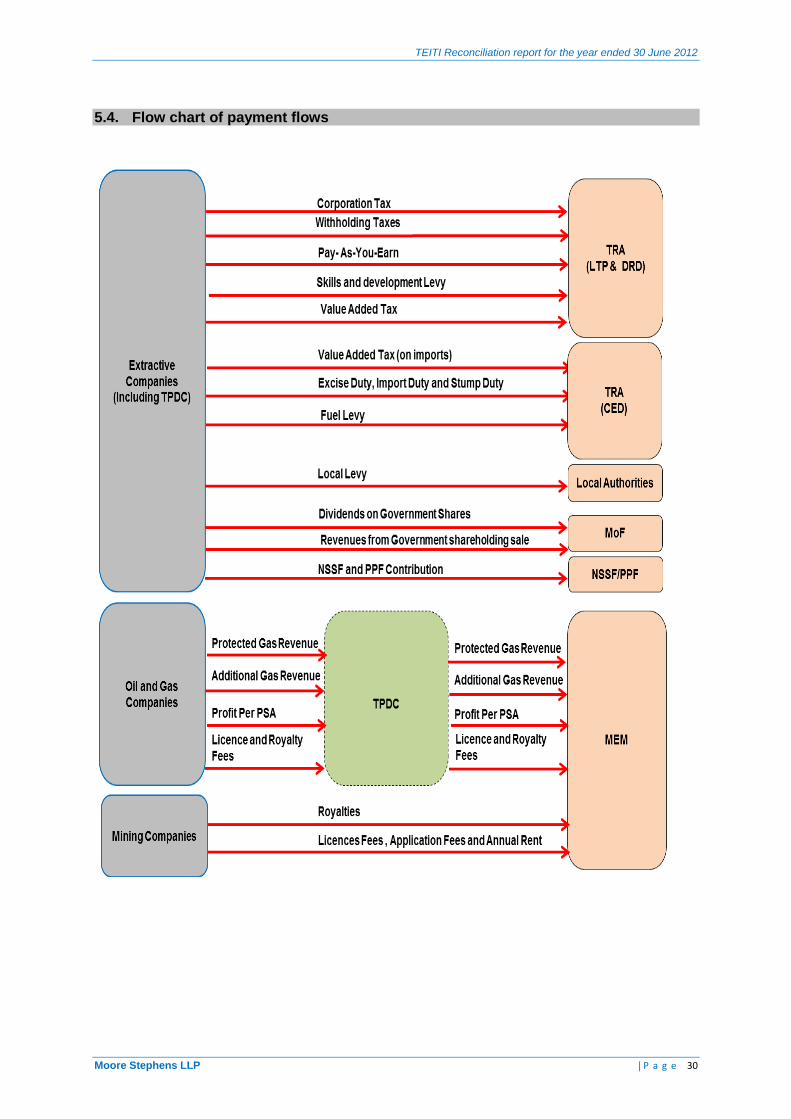
TEITI Reconciliation report for the year ended 30 June 2012
Moore Stephens LLP | P a g e 30
5.4. Flow chart of payment flows
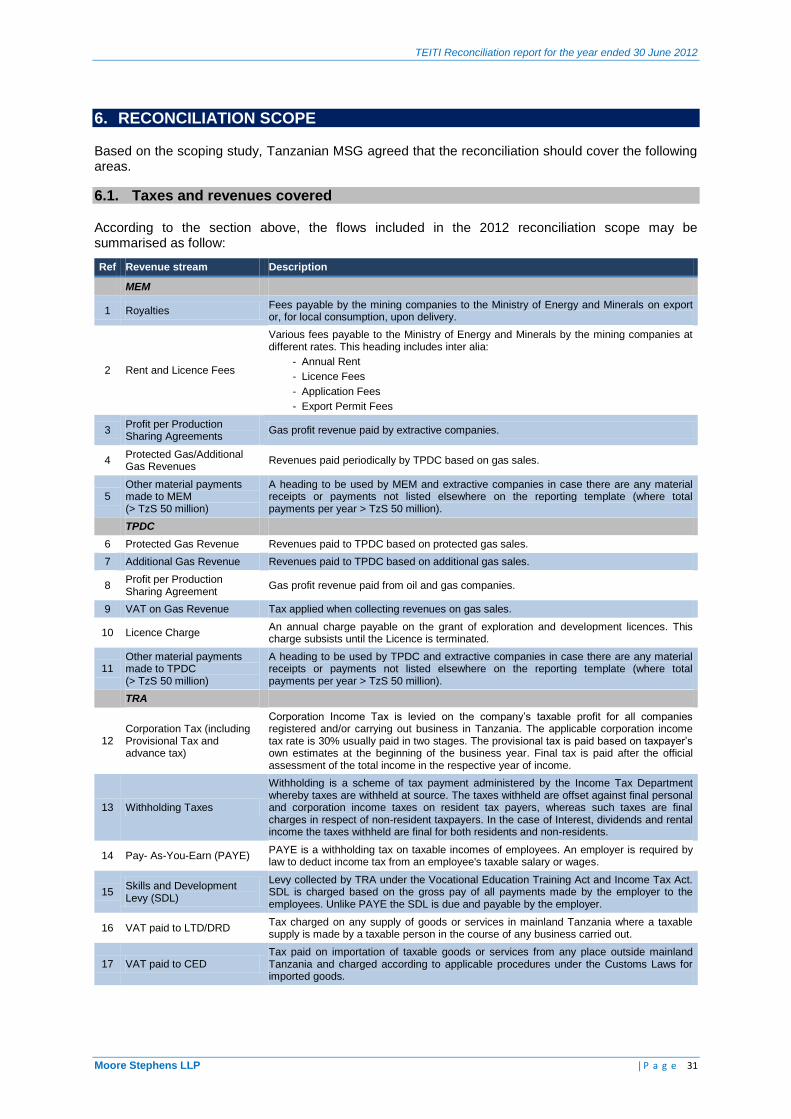
TEITI Reconciliation report for the year ended 30 June 2012
Moore Stephens LLP | P a g e 31
6. RECONCILIATION SCOPE
Based on the scoping study, Tanzanian MSG agreed that the reconciliation should cover the following areas.
6.1. Taxes and revenues covered
According to the section above, the flows included in the 2012 reconciliation scope may be summarised as follow:
Ref Revenue stream Description
MEM
1 Royalties Fees payable by the mining companies to the Ministry of Energy and Minerals on export or, for local consumption, upon delivery.
2 Rent and Licence Fees
Various fees payable to the Ministry of Energy and Minerals by the mining companies at different rates. This heading includes inter alia:
- Annual Rent
- Licence Fees
- Application Fees
- Export Permit Fees
3 Profit per Production Sharing Agreements
Gas profit revenue paid by extractive companies.
4 Protected Gas/Additional Gas Revenues
Revenues paid periodically by TPDC based on gas sales.
5 Other material payments made to MEM (> TzS 50 million)
A heading to be used by MEM and extractive companies in case there are any material receipts or payments not listed elsewhere on the reporting template (where total payments per year > TzS 50 million).
TPDC
6 Protected Gas Revenue Revenues paid to TPDC based on protected gas sales.
7 Additional Gas Revenue Revenues paid to TPDC based on additional gas sales.
8 Profit per Production Sharing Agreement
Gas profit revenue paid from oil and gas companies.
9 VAT on Gas Revenue Tax applied when collecting revenues on gas sales.
10 Licence Charge An annual charge payable on the grant of exploration and development licences. This charge subsists until the Licence is terminated.
11 Other material payments made to TPDC (> TzS 50 million)
A heading to be used by TPDC and extractive companies in case there are any material receipts or payments not listed elsewhere on the reporting template (where total payments per year > TzS 50 million).
TRA
12 Corporation Tax (including Provisional Tax and advance tax)
Corporation Income Tax is levied on the company’s taxable profit for all companies registered and/or carrying out business in Tanzania. The applicable corporation income tax rate is 30% usually paid in two stages. The provisional tax is paid based on taxpayer’s own estimates at the beginning of the business year. Final tax is paid after the official assessment of the total income in the respective year of income.
13 Withholding Taxes
Withholding is a scheme of tax payment administered by the Income Tax Department whereby taxes are withheld at source. The taxes withheld are offset against final personal and corporation income taxes on resident tax payers, whereas such taxes are final charges in respect of non-resident taxpayers. In the case of Interest, dividends and rental income the taxes withheld are final for both residents and non-residents.
14 Pay- As-You-Earn (PAYE) PAYE is a withholding tax on taxable incomes of employees. An employer is required by law to deduct income tax from an employee's taxable salary or wages.
15 Skills and Development Levy (SDL)
Levy collected by TRA under the Vocational Education Training Act and Income Tax Act. SDL is charged based on the gross pay of all payments made by the employer to the employees. Unlike PAYE the SDL is due and payable by the employer.
16 VAT paid to LTD/DRD Tax charged on any supply of goods or services in mainland Tanzania where a taxable supply is made by a taxable person in the course of any business carried out.
17 VAT paid to CED Tax paid on importation of taxable goods or services from any place outside mainland Tanzania and charged according to applicable procedures under the Customs Laws for imported goods.
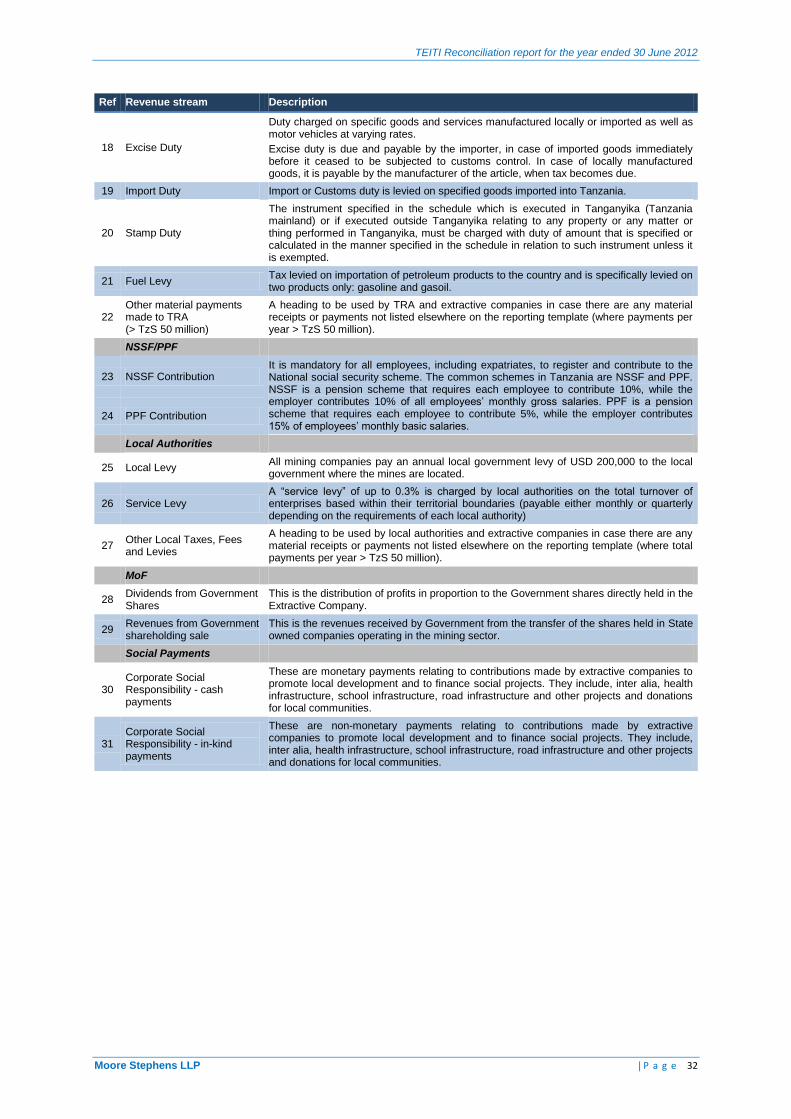
TEITI Reconciliation report for the year ended 30 June 2012
Moore Stephens LLP | P a g e 32
Ref Revenue stream Description
18 Excise Duty
Duty charged on specific goods and services manufactured locally or imported as well as motor vehicles at varying rates.
Excise duty is due and payable by the importer, in case of imported goods immediately before it ceased to be subjected to customs control. In case of locally manufactured goods, it is payable by the manufacturer of the article, when tax becomes due.
19 Import Duty Import or Customs duty is levied on specified goods imported into Tanzania.
20 Stamp Duty
The instrument specified in the schedule which is executed in Tanganyika (Tanzania mainland) or if executed outside Tanganyika relating to any property or any matter or thing performed in Tanganyika, must be charged with duty of amount that is specified or calculated in the manner specified in the schedule in relation to such instrument unless it is exempted.
21 Fuel Levy Tax levied on importation of petroleum products to the country and is specifically levied on two products only: gasoline and gasoil.
22 Other material payments made to TRA (> TzS 50 million)
A heading to be used by TRA and extractive companies in case there are any material receipts or payments not listed elsewhere on the reporting template (where payments per year > TzS 50 million).
NSSF/PPF
23 NSSF Contribution It is mandatory for all employees, including expatriates, to register and contribute to the National social security scheme. The common schemes in Tanzania are NSSF and PPF. NSSF is a pension scheme that requires each employee to contribute 10%, while the employer contributes 10% of all employees’ monthly gross salaries. PPF is a pension scheme that requires each employee to contribute 5%, while the employer contributes 15% of employees’ monthly basic salaries.
24 PPF Contribution
Local Authorities
25 Local Levy All mining companies pay an annual local government levy of USD 200,000 to the local government where the mines are located.
26 Service Levy A “service levy” of up to 0.3% is charged by local authorities on the total turnover of enterprises based within their territorial boundaries (payable either monthly or quarterly depending on the requirements of each local authority)
27 Other Local Taxes, Fees and Levies
A heading to be used by local authorities and extractive companies in case there are any material receipts or payments not listed elsewhere on the reporting template (where total payments per year > TzS 50 million).
MoF
28 Dividends from Government Shares
This is the distribution of profits in proportion to the Government shares directly held in the Extractive Company.
29 Revenues from Government shareholding sale
This is the revenues received by Government from the transfer of the shares held in State owned companies operating in the mining sector.
Social Payments
30 Corporate Social Responsibility - cash payments
These are monetary payments relating to contributions made by extractive companies to promote local development and to finance social projects. They include, inter alia, health infrastructure, school infrastructure, road infrastructure and other projects and donations for local communities.
31 Corporate Social Responsibility - in-kind payments
These are non-monetary payments relating to contributions made by extractive companies to promote local development and to finance social projects. They include, inter alia, health infrastructure, school infrastructure, road infrastructure and other projects and donations for local communities.
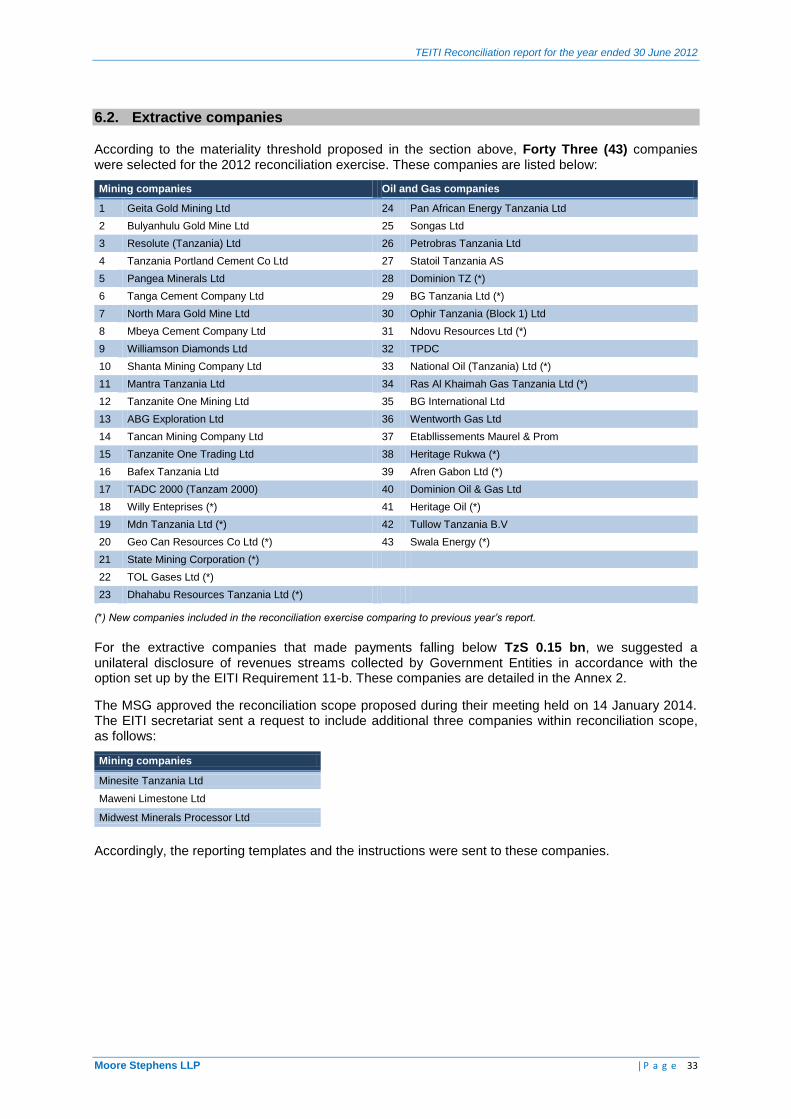
TEITI Reconciliation report for the year ended 30 June 2012
Moore Stephens LLP | P a g e 33
6.2. Extractive companies
According to the materiality threshold proposed in the section above, Forty Three (43) companies were selected for the 2012 reconciliation exercise. These companies are listed below:
Mining companies Oil and Gas companies
1 Geita Gold Mining Ltd 24 Pan African Energy Tanzania Ltd
2 Bulyanhulu Gold Mine Ltd 25 Songas Ltd
3 Resolute (Tanzania) Ltd 26 Petrobras Tanzania Ltd
4 Tanzania Portland Cement Co Ltd 27 Statoil Tanzania AS
5 Pangea Minerals Ltd 28 Dominion TZ (*)
6 Tanga Cement Company Ltd 29 BG Tanzania Ltd (*)
7 North Mara Gold Mine Ltd 30 Ophir Tanzania (Block 1) Ltd
8 Mbeya Cement Company Ltd 31 Ndovu Resources Ltd (*)
9 Williamson Diamonds Ltd 32 TPDC
10 Shanta Mining Company Ltd 33 National Oil (Tanzania) Ltd (*)
11 Mantra Tanzania Ltd 34 Ras Al Khaimah Gas Tanzania Ltd (*)
12 Tanzanite One Mining Ltd 35 BG International Ltd
13 ABG Exploration Ltd 36 Wentworth Gas Ltd
14 Tancan Mining Company Ltd 37 Etabllissements Maurel & Prom
15 Tanzanite One Trading Ltd 38 Heritage Rukwa (*)
16 Bafex Tanzania Ltd 39 Afren Gabon Ltd (*)
17 TADC 2000 (Tanzam 2000) 40 Dominion Oil & Gas Ltd
18 Willy Enteprises (*) 41 Heritage Oil (*)
19 Mdn Tanzania Ltd (*) 42 Tullow Tanzania B.V
20 Geo Can Resources Co Ltd (*) 43 Swala Energy (*)
21 State Mining Corporation (*)
22 TOL Gases Ltd (*)
23 Dhahabu Resources Tanzania Ltd (*)
(*) New companies included in the reconciliation exercise comparing to previous year’s report.
For the extractive companies that made payments falling below TzS 0.15 bn, we suggested a unilateral disclosure of revenues streams collected by Government Entities in accordance with the option set up by the EITI Requirement 11-b. These companies are detailed in the Annex 2.
The MSG approved the reconciliation scope proposed during their meeting held on 14 January 2014. The EITI secretariat sent a request to include additional three companies within reconciliation scope, as follows:
Mining companies
Minesite Tanzania Ltd
Maweni Limestone Ltd
Midwest Minerals Processor Ltd
Accordingly, the reporting templates and the instructions were sent to these companies.
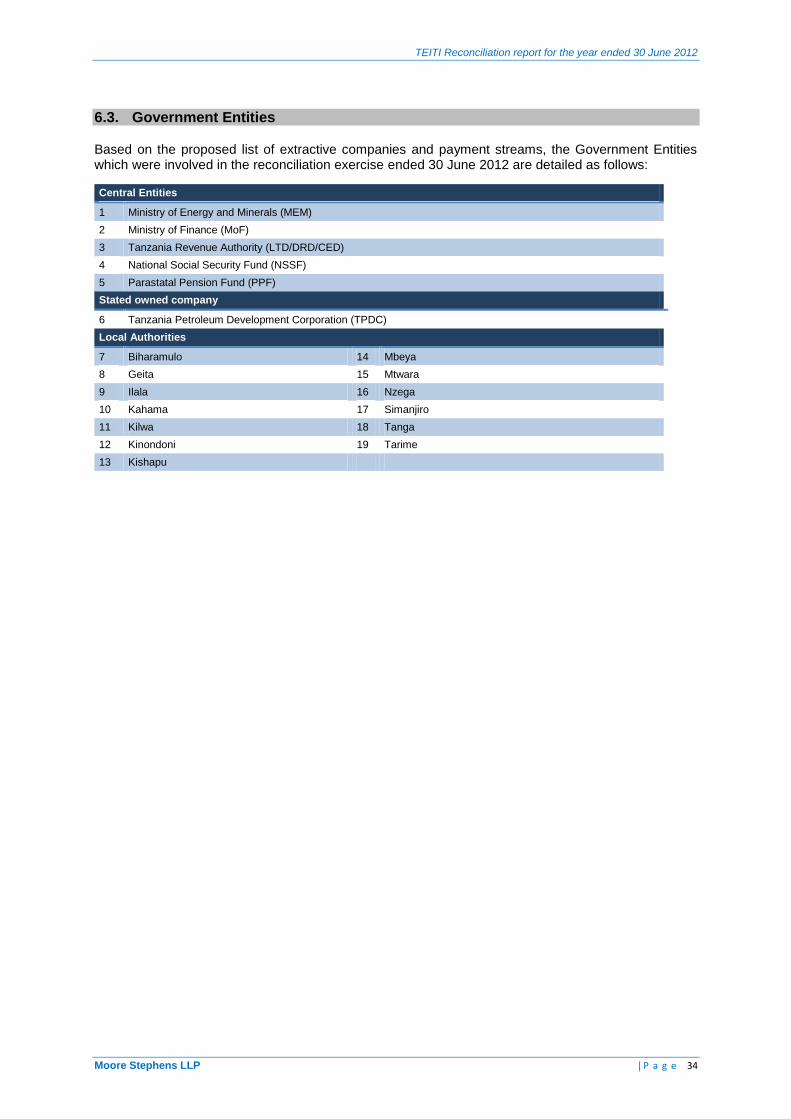
TEITI Reconciliation report for the year ended 30 June 2012
Moore Stephens LLP | P a g e 34
6.3. Government Entities
Based on the proposed list of extractive companies and payment streams, the Government Entities which were involved in the reconciliation exercise ended 30 June 2012 are detailed as follows:
Central Entities
1 Ministry of Energy and Minerals (MEM)
2 Ministry of Finance (MoF)
3 Tanzania Revenue Authority (LTD/DRD/CED)
4 National Social Security Fund (NSSF)
5 Parastatal Pension Fund (PPF)
Stated owned company
6 Tanzania Petroleum Development Corporation (TPDC)
Local Authorities
7 Biharamulo 14 Mbeya
8 Geita 15 Mtwara
9 Ilala 16 Nzega
10 Kahama 17 Simanjiro
11 Kilwa 18 Tanga
12 Kinondoni 19 Tarime
13 Kishapu
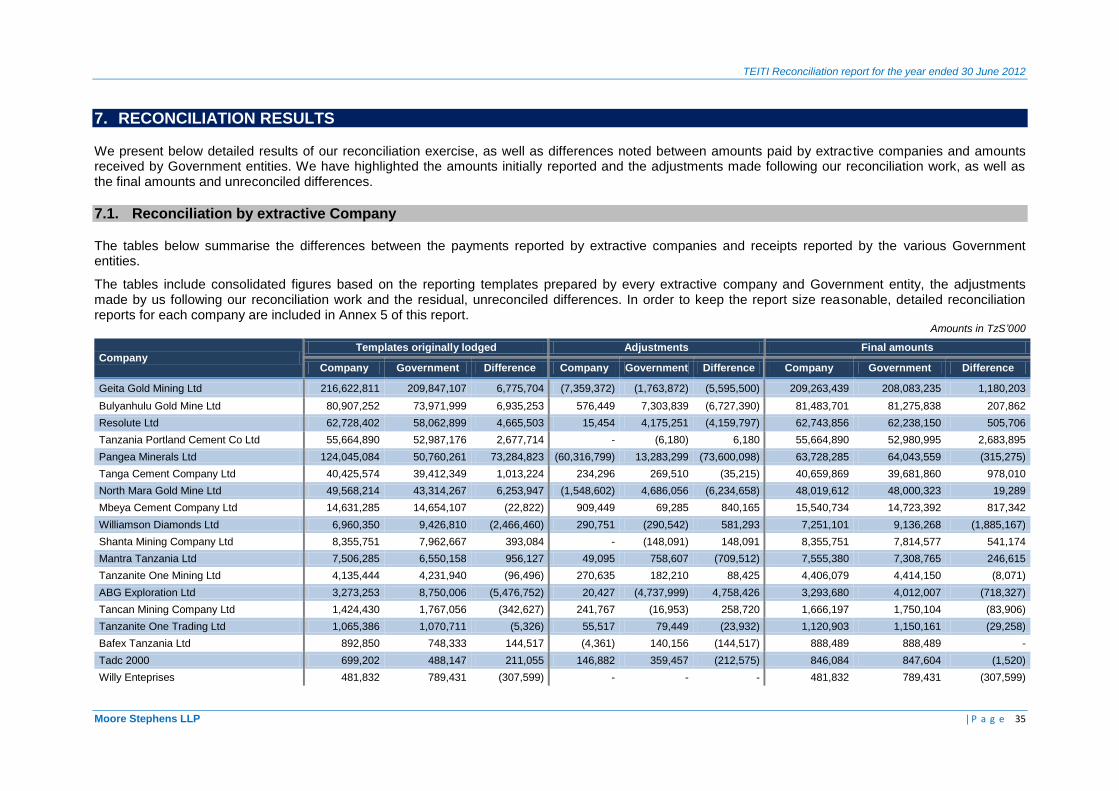
TEITI Reconciliation report for the year ended 30 June 2012
Moore Stephens LLP | P a g e 35
7. RECONCILIATION RESULTS
We present below detailed results of our reconciliation exercise, as well as differences noted between amounts paid by extractive companies and amounts received by Government entities. We have highlighted the amounts initially reported and the adjustments made following our reconciliation work, as well as the final amounts and unreconciled differences.
7.1. Reconciliation by extractive Company
The tables below summarise the differences between the payments reported by extractive companies and receipts reported by the various Government entities.
The tables include consolidated figures based on the reporting templates prepared by every extractive company and Government entity, the adjustments made by us following our reconciliation work and the residual, unreconciled differences. In order to keep the report size reasonable, detailed reconciliation reports for each company are included in Annex 5 of this report.
Amounts in TzS’000
Company Templates originally lodged Adjustments Final amounts
Company Government Difference Company Government Difference Company Government Difference
Geita Gold Mining Ltd 216,622,811 209,847,107 6,775,704 (7,359,372) (1,763,872) (5,595,500) 209,263,439 208,083,235 1,180,203
Bulyanhulu Gold Mine Ltd 80,907,252 73,971,999 6,935,253 576,449 7,303,839 (6,727,390) 81,483,701 81,275,838 207,862
Resolute Ltd 62,728,402 58,062,899 4,665,503 15,454 4,175,251 (4,159,797) 62,743,856 62,238,150 505,706
Tanzania Portland Cement Co Ltd 55,664,890 52,987,176 2,677,714 - (6,180) 6,180 55,664,890 52,980,995 2,683,895
Pangea Minerals Ltd 124,045,084 50,760,261 73,284,823 (60,316,799) 13,283,299 (73,600,098) 63,728,285 64,043,559 (315,275)
Tanga Cement Company Ltd 40,425,574 39,412,349 1,013,224 234,296 269,510 (35,215) 40,659,869 39,681,860 978,010
North Mara Gold Mine Ltd 49,568,214 43,314,267 6,253,947 (1,548,602) 4,686,056 (6,234,658) 48,019,612 48,000,323 19,289
Mbeya Cement Company Ltd 14,631,285 14,654,107 (22,822) 909,449 69,285 840,165 15,540,734 14,723,392 817,342
Williamson Diamonds Ltd 6,960,350 9,426,810 (2,466,460) 290,751 (290,542) 581,293 7,251,101 9,136,268 (1,885,167)
Shanta Mining Company Ltd 8,355,751 7,962,667 393,084 - (148,091) 148,091 8,355,751 7,814,577 541,174
Mantra Tanzania Ltd 7,506,285 6,550,158 956,127 49,095 758,607 (709,512) 7,555,380 7,308,765 246,615
Tanzanite One Mining Ltd 4,135,444 4,231,940 (96,496) 270,635 182,210 88,425 4,406,079 4,414,150 (8,071)
ABG Exploration Ltd 3,273,253 8,750,006 (5,476,752) 20,427 (4,737,999) 4,758,426 3,293,680 4,012,007 (718,327)
Tancan Mining Company Ltd 1,424,430 1,767,056 (342,627) 241,767 (16,953) 258,720 1,666,197 1,750,104 (83,906)
Tanzanite One Trading Ltd 1,065,386 1,070,711 (5,326) 55,517 79,449 (23,932) 1,120,903 1,150,161 (29,258)
Bafex Tanzania Ltd 892,850 748,333 144,517 (4,361) 140,156 (144,517) 888,489 888,489 -
Tadc 2000 699,202 488,147 211,055 146,882 359,457 (212,575) 846,084 847,604 (1,520)
Willy Enteprises 481,832 789,431 (307,599) - - - 481,832 789,431 (307,599)
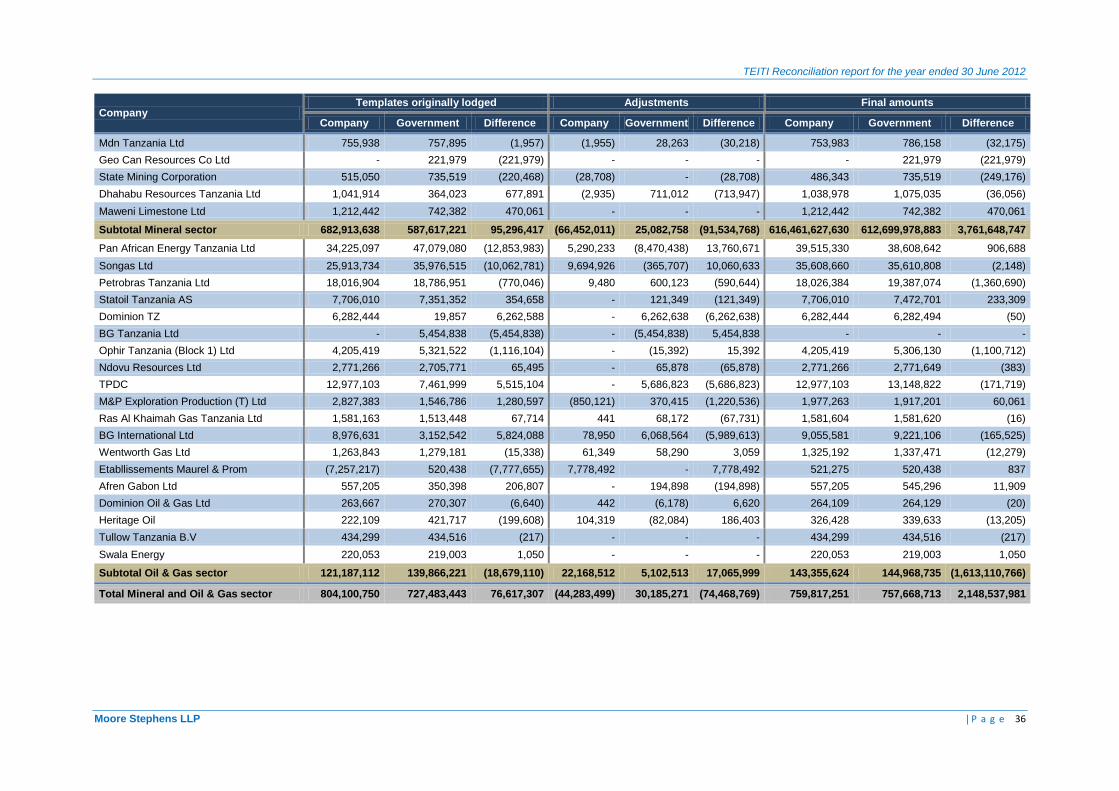
TEITI Reconciliation report for the year ended 30 June 2012
Moore Stephens LLP | P a g e 36
Company Templates originally lodged Adjustments Final amounts
Company Government Difference Company Government Difference Company Government Difference
Mdn Tanzania Ltd 755,938 757,895 (1,957) (1,955) 28,263 (30,218) 753,983 786,158 (32,175)
Geo Can Resources Co Ltd - 221,979 (221,979) - - - - 221,979 (221,979)
State Mining Corporation 515,050 735,519 (220,468) (28,708) - (28,708) 486,343 735,519 (249,176)
Dhahabu Resources Tanzania Ltd 1,041,914 364,023 677,891 (2,935) 711,012 (713,947) 1,038,978 1,075,035 (36,056)
Maweni Limestone Ltd 1,212,442 742,382 470,061 - - - 1,212,442 742,382 470,061
Subtotal Mineral sector 682,913,638 587,617,221 95,296,417 (66,452,011) 25,082,758 (91,534,768) 616,461,627,630 612,699,978,883 3,761,648,747
Pan African Energy Tanzania Ltd 34,225,097 47,079,080 (12,853,983) 5,290,233 (8,470,438) 13,760,671 39,515,330 38,608,642 906,688
Songas Ltd 25,913,734 35,976,515 (10,062,781) 9,694,926 (365,707) 10,060,633 35,608,660 35,610,808 (2,148)
Petrobras Tanzania Ltd 18,016,904 18,786,951 (770,046) 9,480 600,123 (590,644) 18,026,384 19,387,074 (1,360,690)
Statoil Tanzania AS 7,706,010 7,351,352 354,658 - 121,349 (121,349) 7,706,010 7,472,701 233,309
Dominion TZ 6,282,444 19,857 6,262,588 - 6,262,638 (6,262,638) 6,282,444 6,282,494 (50)
BG Tanzania Ltd - 5,454,838 (5,454,838) - (5,454,838) 5,454,838 - - -
Ophir Tanzania (Block 1) Ltd 4,205,419 5,321,522 (1,116,104) - (15,392) 15,392 4,205,419 5,306,130 (1,100,712)
Ndovu Resources Ltd 2,771,266 2,705,771 65,495 - 65,878 (65,878) 2,771,266 2,771,649 (383)
TPDC 12,977,103 7,461,999 5,515,104 - 5,686,823 (5,686,823) 12,977,103 13,148,822 (171,719)
M&P Exploration Production (T) Ltd 2,827,383 1,546,786 1,280,597 (850,121) 370,415 (1,220,536) 1,977,263 1,917,201 60,061
Ras Al Khaimah Gas Tanzania Ltd 1,581,163 1,513,448 67,714 441 68,172 (67,731) 1,581,604 1,581,620 (16)
BG International Ltd 8,976,631 3,152,542 5,824,088 78,950 6,068,564 (5,989,613) 9,055,581 9,221,106 (165,525)
Wentworth Gas Ltd 1,263,843 1,279,181 (15,338) 61,349 58,290 3,059 1,325,192 1,337,471 (12,279)
Etabllissements Maurel & Prom (7,257,217) 520,438 (7,777,655) 7,778,492 - 7,778,492 521,275 520,438 837
Afren Gabon Ltd 557,205 350,398 206,807 - 194,898 (194,898) 557,205 545,296 11,909
Dominion Oil & Gas Ltd 263,667 270,307 (6,640) 442 (6,178) 6,620 264,109 264,129 (20)
Heritage Oil 222,109 421,717 (199,608) 104,319 (82,084) 186,403 326,428 339,633 (13,205)
Tullow Tanzania B.V 434,299 434,516 (217) - - - 434,299 434,516 (217)
Swala Energy 220,053 219,003 1,050 - - - 220,053 219,003 1,050
Subtotal Oil & Gas sector 121,187,112 139,866,221 (18,679,110) 22,168,512 5,102,513 17,065,999 143,355,624 144,968,735 (1,613,110,766)
Total Mineral and Oil & Gas sector 804,100,750 727,483,443 76,617,307 (44,283,499) 30,185,271 (74,468,769) 759,817,251 757,668,713 2,148,537,981
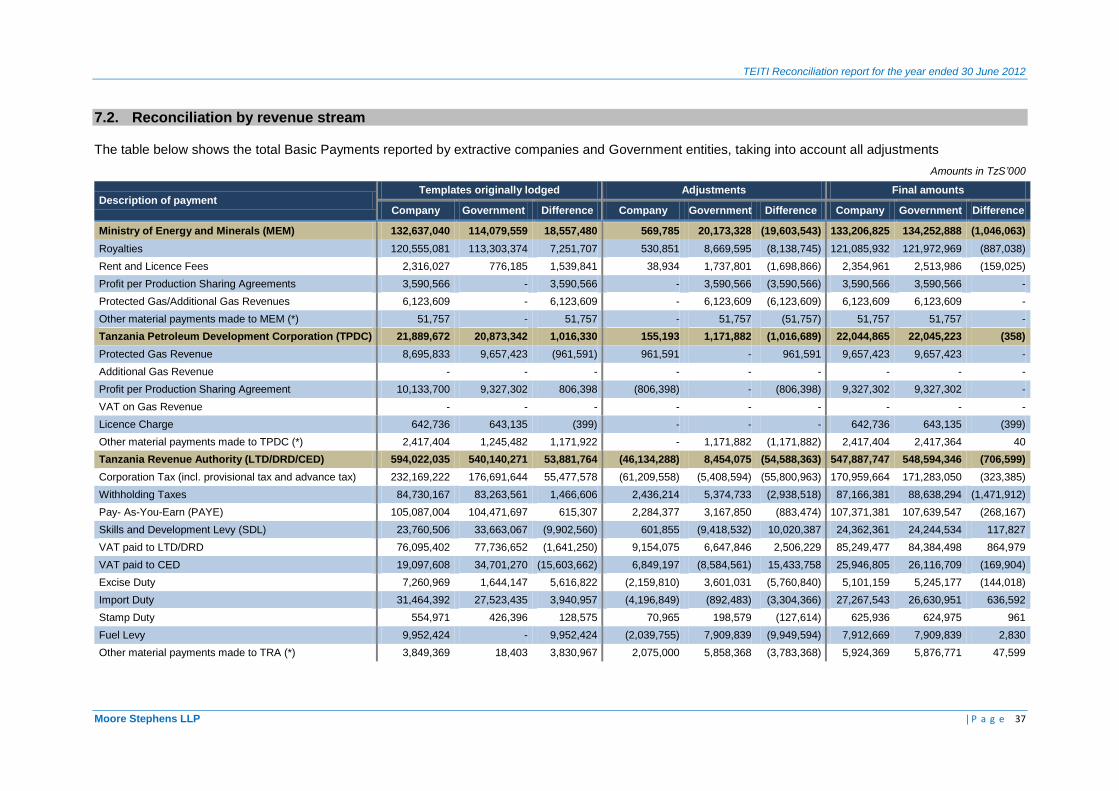
TEITI Reconciliation report for the year ended 30 June 2012
Moore Stephens LLP | P a g e 37
7.2. Reconciliation by revenue stream
The table below shows the total Basic Payments reported by extractive companies and Government entities, taking into account all adjustments
Amounts in TzS’000
Description of payment Templates originally lodged Adjustments Final amounts
Company Government Difference Company Government Difference Company Government Difference
Ministry of Energy and Minerals (MEM) 132,637,040 114,079,559 18,557,480 569,785 20,173,328 (19,603,543) 133,206,825 134,252,888 (1,046,063)
Royalties 120,555,081 113,303,374 7,251,707 530,851 8,669,595 (8,138,745) 121,085,932 121,972,969 (887,038)
Rent and Licence Fees 2,316,027 776,185 1,539,841 38,934 1,737,801 (1,698,866) 2,354,961 2,513,986 (159,025)
Profit per Production Sharing Agreements 3,590,566 - 3,590,566 - 3,590,566 (3,590,566) 3,590,566 3,590,566 -
Protected Gas/Additional Gas Revenues 6,123,609 - 6,123,609 - 6,123,609 (6,123,609) 6,123,609 6,123,609 -
Other material payments made to MEM (*) 51,757 - 51,757 - 51,757 (51,757) 51,757 51,757 -
Tanzania Petroleum Development Corporation (TPDC) 21,889,672 20,873,342 1,016,330 155,193 1,171,882 (1,016,689) 22,044,865 22,045,223 (358)
Protected Gas Revenue 8,695,833 9,657,423 (961,591) 961,591 - 961,591 9,657,423 9,657,423 -
Additional Gas Revenue - - - - - - - - -
Profit per Production Sharing Agreement 10,133,700 9,327,302 806,398 (806,398) - (806,398) 9,327,302 9,327,302 -
VAT on Gas Revenue - - - - - - - - -
Licence Charge 642,736 643,135 (399) - - - 642,736 643,135 (399)
Other material payments made to TPDC (*) 2,417,404 1,245,482 1,171,922 - 1,171,882 (1,171,882) 2,417,404 2,417,364 40
Tanzania Revenue Authority (LTD/DRD/CED) 594,022,035 540,140,271 53,881,764 (46,134,288) 8,454,075 (54,588,363) 547,887,747 548,594,346 (706,599)
Corporation Tax (incl. provisional tax and advance tax) 232,169,222 176,691,644 55,477,578 (61,209,558) (5,408,594) (55,800,963) 170,959,664 171,283,050 (323,385)
Withholding Taxes 84,730,167 83,263,561 1,466,606 2,436,214 5,374,733 (2,938,518) 87,166,381 88,638,294 (1,471,912)
Pay- As-You-Earn (PAYE) 105,087,004 104,471,697 615,307 2,284,377 3,167,850 (883,474) 107,371,381 107,639,547 (268,167)
Skills and Development Levy (SDL) 23,760,506 33,663,067 (9,902,560) 601,855 (9,418,532) 10,020,387 24,362,361 24,244,534 117,827
VAT paid to LTD/DRD 76,095,402 77,736,652 (1,641,250) 9,154,075 6,647,846 2,506,229 85,249,477 84,384,498 864,979
VAT paid to CED 19,097,608 34,701,270 (15,603,662) 6,849,197 (8,584,561) 15,433,758 25,946,805 26,116,709 (169,904)
Excise Duty 7,260,969 1,644,147 5,616,822 (2,159,810) 3,601,031 (5,760,840) 5,101,159 5,245,177 (144,018)
Import Duty 31,464,392 27,523,435 3,940,957 (4,196,849) (892,483) (3,304,366) 27,267,543 26,630,951 636,592
Stamp Duty 554,971 426,396 128,575 70,965 198,579 (127,614) 625,936 624,975 961
Fuel Levy 9,952,424 - 9,952,424 (2,039,755) 7,909,839 (9,949,594) 7,912,669 7,909,839 2,830
Other material payments made to TRA (*) 3,849,369 18,403 3,830,967 2,075,000 5,858,368 (3,783,368) 5,924,369 5,876,771 47,599
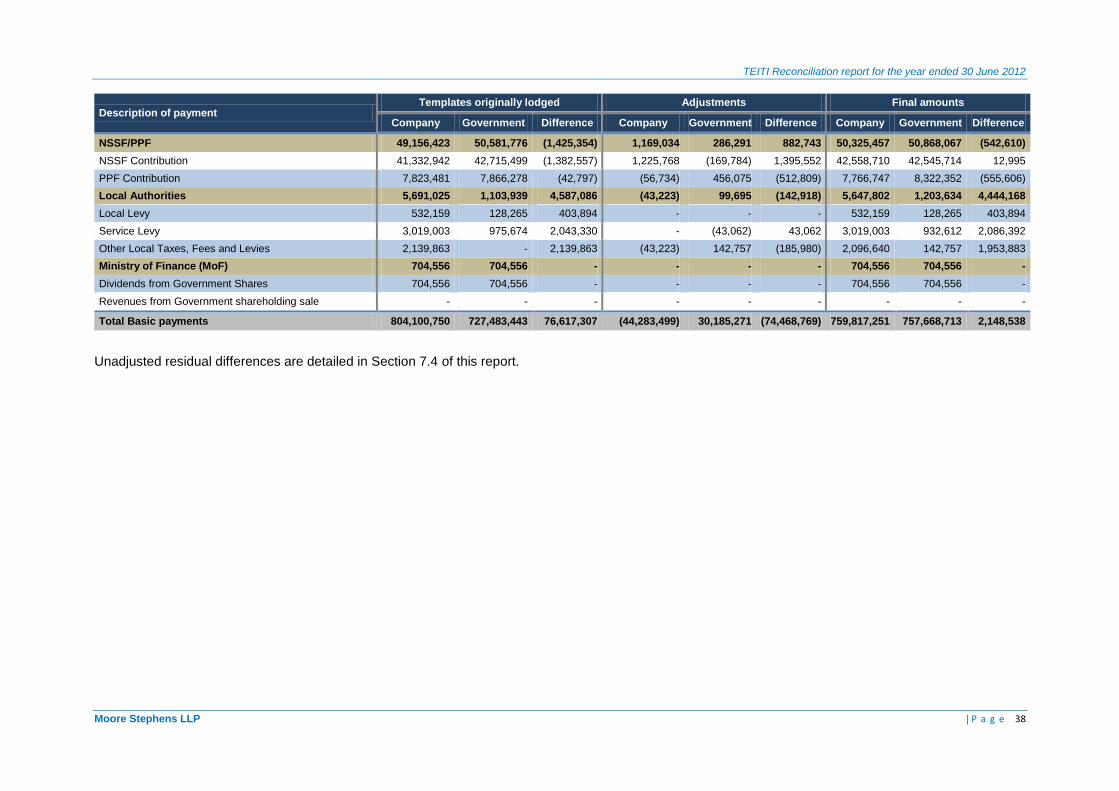
TEITI Reconciliation report for the year ended 30 June 2012
Moore Stephens LLP | P a g e 38
Description of payment Templates originally lodged Adjustments Final amounts
Company Government Difference Company Government Difference Company Government Difference
NSSF/PPF 49,156,423 50,581,776 (1,425,354) 1,169,034 286,291 882,743 50,325,457 50,868,067 (542,610)
NSSF Contribution 41,332,942 42,715,499 (1,382,557) 1,225,768 (169,784) 1,395,552 42,558,710 42,545,714 12,995
PPF Contribution 7,823,481 7,866,278 (42,797) (56,734) 456,075 (512,809) 7,766,747 8,322,352 (555,606)
Local Authorities 5,691,025 1,103,939 4,587,086 (43,223) 99,695 (142,918) 5,647,802 1,203,634 4,444,168
Local Levy 532,159 128,265 403,894 - - - 532,159 128,265 403,894
Service Levy 3,019,003 975,674 2,043,330 - (43,062) 43,062 3,019,003 932,612 2,086,392
Other Local Taxes, Fees and Levies 2,139,863 - 2,139,863 (43,223) 142,757 (185,980) 2,096,640 142,757 1,953,883
Ministry of Finance (MoF) 704,556 704,556 - - - - 704,556 704,556 -
Dividends from Government Shares 704,556 704,556 - - - - 704,556 704,556 -
Revenues from Government shareholding sale - - - - - - - - -
Total Basic payments 804,100,750 727,483,443 76,617,307 (44,283,499) 30,185,271 (74,468,769) 759,817,251 757,668,713 2,148,538
Unadjusted residual differences are detailed in Section 7.4 of this report.
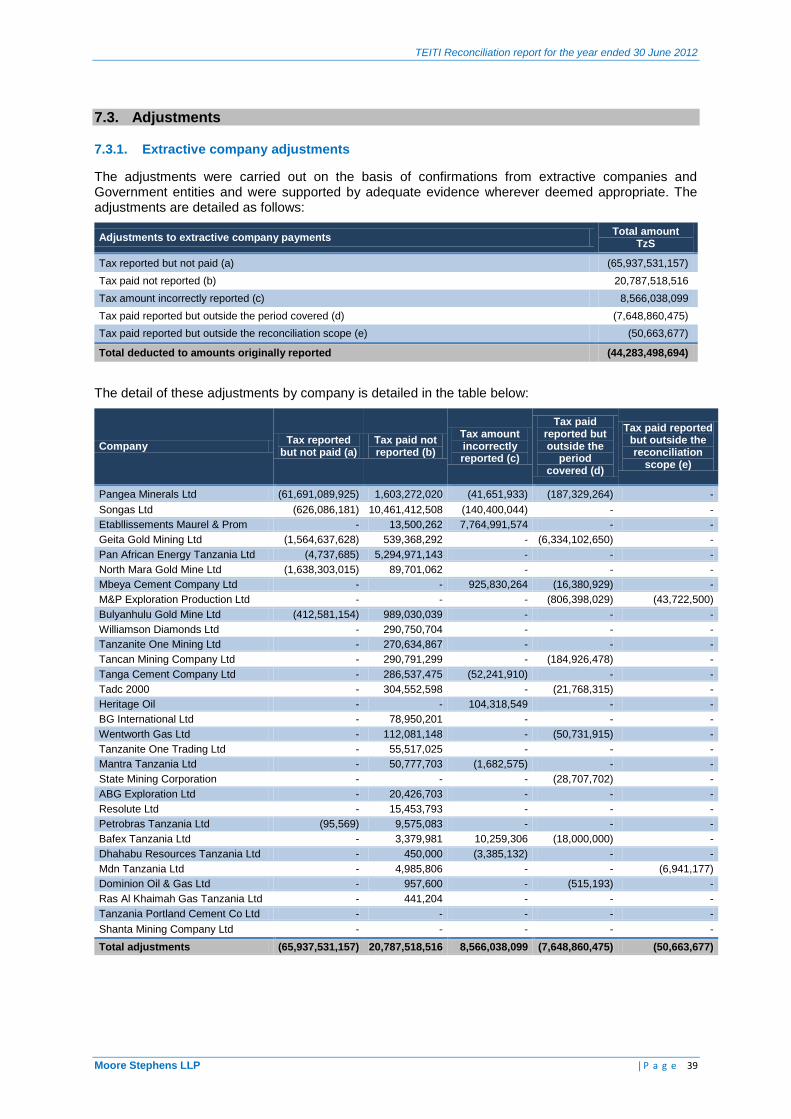
TEITI Reconciliation report for the year ended 30 June 2012
Moore Stephens LLP | P a g e 39
7.3. Adjustments
7.3.1. Extractive company adjustments
The adjustments were carried out on the basis of confirmations from extractive companies and Government entities and were supported by adequate evidence wherever deemed appropriate. The adjustments are detailed as follows:
Adjustments to extractive company payments Total amount
TzS
Tax reported but not paid (a) (65,937,531,157)
Tax paid not reported (b) 20,787,518,516
Tax amount incorrectly reported (c) 8,566,038,099
Tax paid reported but outside the period covered (d) (7,648,860,475)
Tax paid reported but outside the reconciliation scope (e) (50,663,677)
Total deducted to amounts originally reported (44,283,498,694)
The detail of these adjustments by company is detailed in the table below:
Company Tax reported
but not paid (a) Tax paid not reported (b)
Tax amount incorrectly reported (c)
Tax paid reported but outside the
period covered (d)
Tax paid reported but outside the reconciliation
scope (e)
Pangea Minerals Ltd (61,691,089,925) 1,603,272,020 (41,651,933) (187,329,264) -
Songas Ltd (626,086,181) 10,461,412,508 (140,400,044) - -
Etabllissements Maurel & Prom - 13,500,262 7,764,991,574 - -
Geita Gold Mining Ltd (1,564,637,628) 539,368,292 - (6,334,102,650) -
Pan African Energy Tanzania Ltd (4,737,685) 5,294,971,143 - - -
North Mara Gold Mine Ltd (1,638,303,015) 89,701,062 - - -
Mbeya Cement Company Ltd - - 925,830,264 (16,380,929) -
M&P Exploration Production Ltd - - - (806,398,029) (43,722,500)
Bulyanhulu Gold Mine Ltd (412,581,154) 989,030,039 - - -
Williamson Diamonds Ltd - 290,750,704 - - -
Tanzanite One Mining Ltd - 270,634,867 - - -
Tancan Mining Company Ltd - 290,791,299 - (184,926,478) -
Tanga Cement Company Ltd - 286,537,475 (52,241,910) - -
Tadc 2000 - 304,552,598 - (21,768,315) -
Heritage Oil - - 104,318,549 - -
BG International Ltd - 78,950,201 - - -
Wentworth Gas Ltd - 112,081,148 - (50,731,915) -
Tanzanite One Trading Ltd - 55,517,025 - - -
Mantra Tanzania Ltd - 50,777,703 (1,682,575) - -
State Mining Corporation - - - (28,707,702) -
ABG Exploration Ltd - 20,426,703 - - -
Resolute Ltd - 15,453,793 - - -
Petrobras Tanzania Ltd (95,569) 9,575,083 - - -
Bafex Tanzania Ltd - 3,379,981 10,259,306 (18,000,000) -
Dhahabu Resources Tanzania Ltd - 450,000 (3,385,132) - -
Mdn Tanzania Ltd - 4,985,806 - - (6,941,177)
Dominion Oil & Gas Ltd - 957,600 - (515,193) -
Ras Al Khaimah Gas Tanzania Ltd - 441,204 - - -
Tanzania Portland Cement Co Ltd - - - - -
Shanta Mining Company Ltd - - - - -
Total adjustments (65,937,531,157) 20,787,518,516 8,566,038,099 (7,648,860,475) (50,663,677)
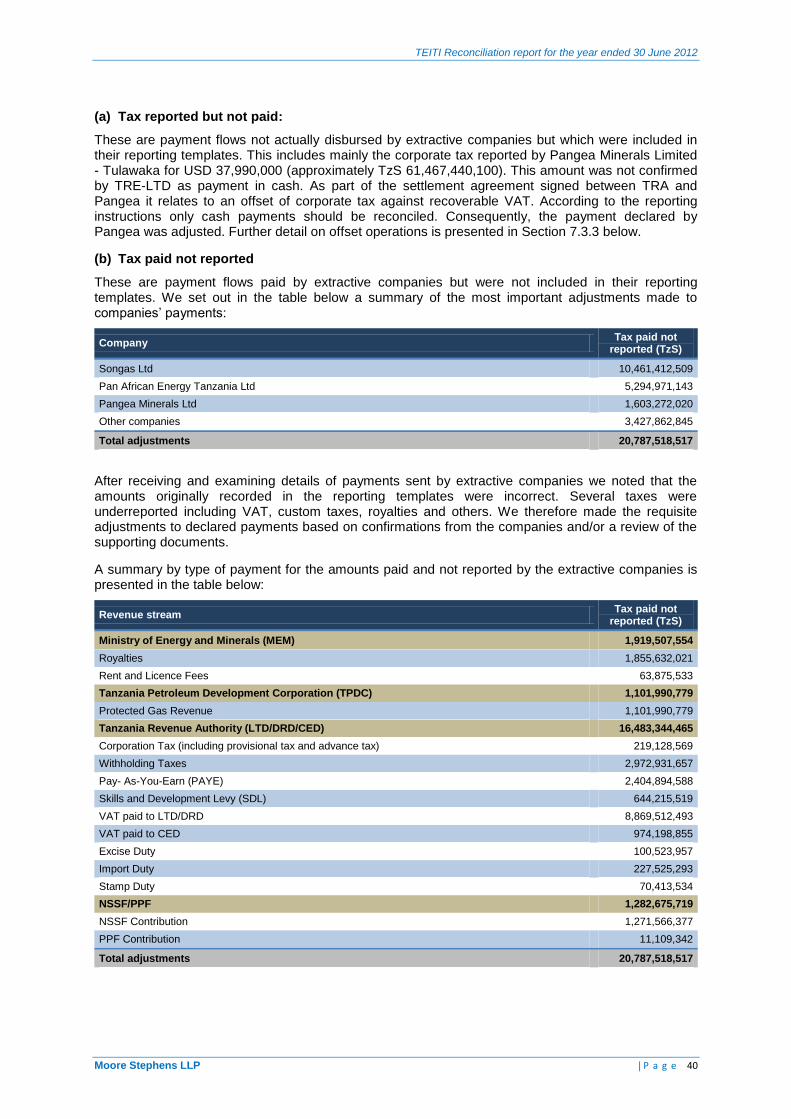
TEITI Reconciliation report for the year ended 30 June 2012
Moore Stephens LLP | P a g e 40
(a) Tax reported but not paid:
These are payment flows not actually disbursed by extractive companies but which were included in their reporting templates. This includes mainly the corporate tax reported by Pangea Minerals Limited - Tulawaka for USD 37,990,000 (approximately TzS 61,467,440,100). This amount was not confirmed by TRE-LTD as payment in cash. As part of the settlement agreement signed between TRA and Pangea it relates to an offset of corporate tax against recoverable VAT. According to the reporting instructions only cash payments should be reconciled. Consequently, the payment declared by Pangea was adjusted. Further detail on offset operations is presented in Section 7.3.3 below.
(b) Tax paid not reported
These are payment flows paid by extractive companies but were not included in their reporting templates. We set out in the table below a summary of the most important adjustments made to companies’ payments:
Company Tax paid not
reported (TzS)
Songas Ltd 10,461,412,509
Pan African Energy Tanzania Ltd 5,294,971,143
Pangea Minerals Ltd 1,603,272,020
Other companies 3,427,862,845
Total adjustments 20,787,518,517
After receiving and examining details of payments sent by extractive companies we noted that the amounts originally recorded in the reporting templates were incorrect. Several taxes were underreported including VAT, custom taxes, royalties and others. We therefore made the requisite adjustments to declared payments based on confirmations from the companies and/or a review of the supporting documents.
A summary by type of payment for the amounts paid and not reported by the extractive companies is presented in the table below:
Revenue stream Tax paid not
reported (TzS)
Ministry of Energy and Minerals (MEM) 1,919,507,554
Royalties 1,855,632,021
Rent and Licence Fees 63,875,533
Tanzania Petroleum Development Corporation (TPDC) 1,101,990,779
Protected Gas Revenue 1,101,990,779
Tanzania Revenue Authority (LTD/DRD/CED) 16,483,344,465
Corporation Tax (including provisional tax and advance tax) 219,128,569
Withholding Taxes 2,972,931,657
Pay- As-You-Earn (PAYE) 2,404,894,588
Skills and Development Levy (SDL) 644,215,519
VAT paid to LTD/DRD 8,869,512,493
VAT paid to CED 974,198,855
Excise Duty 100,523,957
Import Duty 227,525,293
Stamp Duty 70,413,534
NSSF/PPF 1,282,675,719
NSSF Contribution 1,271,566,377
PPF Contribution 11,109,342
Total adjustments 20,787,518,517
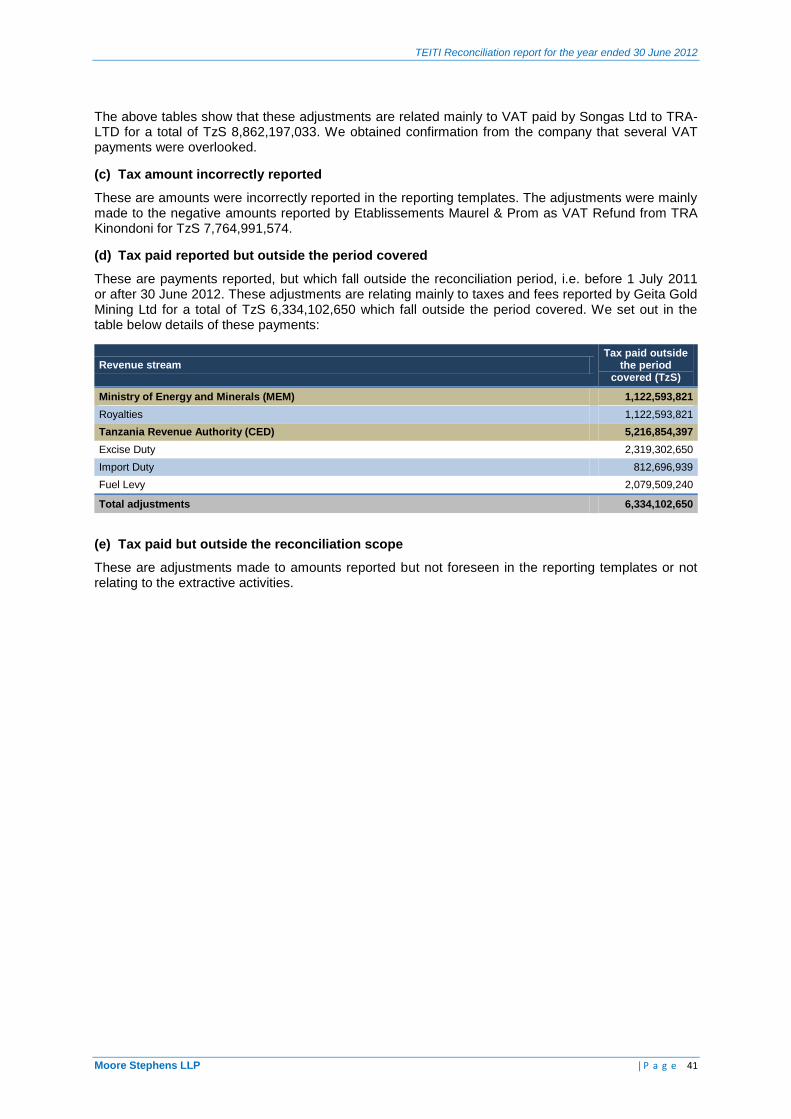
TEITI Reconciliation report for the year ended 30 June 2012
Moore Stephens LLP | P a g e 41
The above tables show that these adjustments are related mainly to VAT paid by Songas Ltd to TRA-LTD for a total of TzS 8,862,197,033. We obtained confirmation from the company that several VAT payments were overlooked.
(c) Tax amount incorrectly reported
These are amounts were incorrectly reported in the reporting templates. The adjustments were mainly made to the negative amounts reported by Etablissements Maurel & Prom as VAT Refund from TRA Kinondoni for TzS 7,764,991,574.
(d) Tax paid reported but outside the period covered
These are payments reported, but which fall outside the reconciliation period, i.e. before 1 July 2011 or after 30 June 2012. These adjustments are relating mainly to taxes and fees reported by Geita Gold Mining Ltd for a total of TzS 6,334,102,650 which fall outside the period covered. We set out in the table below details of these payments:
Revenue stream Tax paid outside
the period covered (TzS)
Ministry of Energy and Minerals (MEM) 1,122,593,821
Royalties 1,122,593,821
Tanzania Revenue Authority (CED) 5,216,854,397
Excise Duty 2,319,302,650
Import Duty 812,696,939
Fuel Levy 2,079,509,240
Total adjustments 6,334,102,650
(e) Tax paid but outside the reconciliation scope
These are adjustments made to amounts reported but not foreseen in the reporting templates or not relating to the extractive activities.
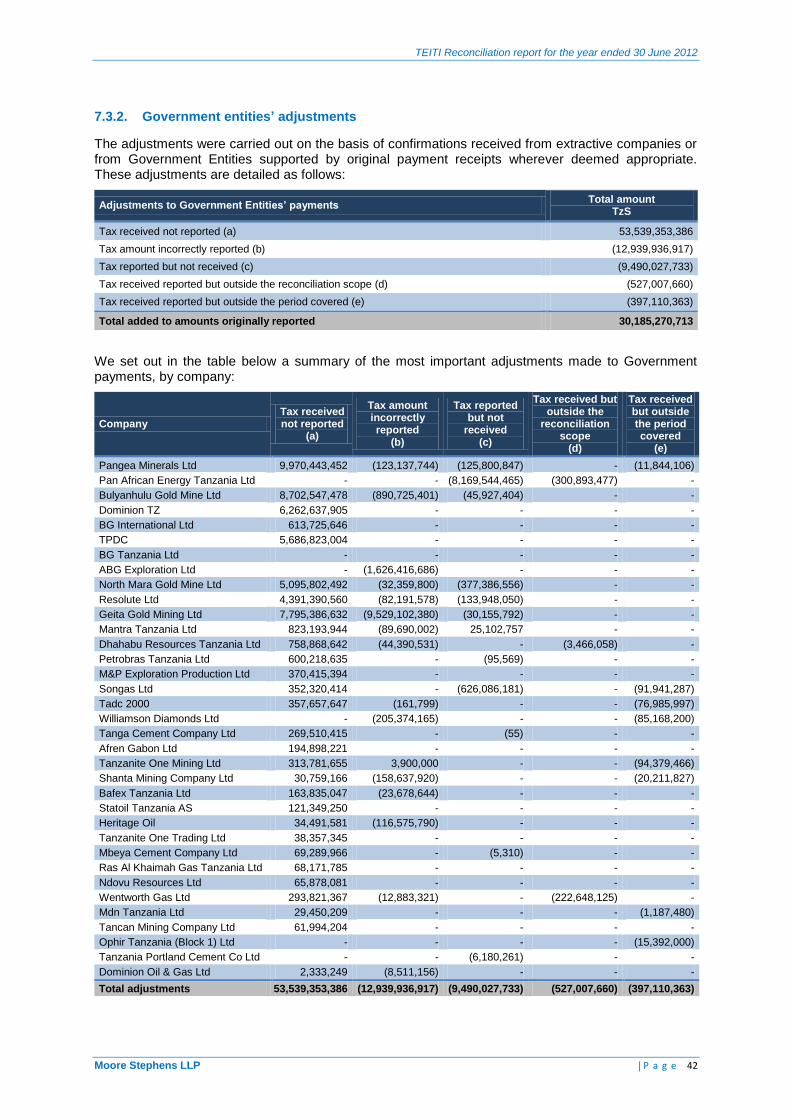
TEITI Reconciliation report for the year ended 30 June 2012
Moore Stephens LLP | P a g e 42
7.3.2. Government entities’ adjustments
The adjustments were carried out on the basis of confirmations received from extractive companies or from Government Entities supported by original payment receipts wherever deemed appropriate. These adjustments are detailed as follows:
Adjustments to Government Entities’ payments Total amount
TzS
Tax received not reported (a) 53,539,353,386
Tax amount incorrectly reported (b) (12,939,936,917)
Tax reported but not received (c) (9,490,027,733)
Tax received reported but outside the reconciliation scope (d) (527,007,660)
Tax received reported but outside the period covered (e) (397,110,363)
Total added to amounts originally reported 30,185,270,713
We set out in the table below a summary of the most important adjustments made to Government payments, by company:
Company Tax received not reported
(a)
Tax amount incorrectly reported
(b)
Tax reported but not
received (c)
Tax received but outside the
reconciliation scope
(d)
Tax received but outside the period covered
(e)
Pangea Minerals Ltd 9,970,443,452 (123,137,744) (125,800,847) - (11,844,106)
Pan African Energy Tanzania Ltd - - (8,169,544,465) (300,893,477) -
Bulyanhulu Gold Mine Ltd 8,702,547,478 (890,725,401) (45,927,404) - -
Dominion TZ 6,262,637,905 - - - -
BG International Ltd 613,725,646 - - - -
TPDC 5,686,823,004 - - - -
BG Tanzania Ltd - - - - -
ABG Exploration Ltd - (1,626,416,686) - - -
North Mara Gold Mine Ltd 5,095,802,492 (32,359,800) (377,386,556) - -
Resolute Ltd 4,391,390,560 (82,191,578) (133,948,050) - -
Geita Gold Mining Ltd 7,795,386,632 (9,529,102,380) (30,155,792) - -
Mantra Tanzania Ltd 823,193,944 (89,690,002) 25,102,757 - -
Dhahabu Resources Tanzania Ltd 758,868,642 (44,390,531) - (3,466,058) -
Petrobras Tanzania Ltd 600,218,635 - (95,569) - -
M&P Exploration Production Ltd 370,415,394 - - - -
Songas Ltd 352,320,414 - (626,086,181) - (91,941,287)
Tadc 2000 357,657,647 (161,799) - - (76,985,997)
Williamson Diamonds Ltd - (205,374,165) - - (85,168,200)
Tanga Cement Company Ltd 269,510,415 - (55) - -
Afren Gabon Ltd 194,898,221 - - - -
Tanzanite One Mining Ltd 313,781,655 3,900,000 - - (94,379,466)
Shanta Mining Company Ltd 30,759,166 (158,637,920) - - (20,211,827)
Bafex Tanzania Ltd 163,835,047 (23,678,644) - - -
Statoil Tanzania AS 121,349,250 - - - -
Heritage Oil 34,491,581 (116,575,790) - - -
Tanzanite One Trading Ltd 38,357,345 - - - -
Mbeya Cement Company Ltd 69,289,966 - (5,310) - -
Ras Al Khaimah Gas Tanzania Ltd 68,171,785 - - - -
Ndovu Resources Ltd 65,878,081 - - - -
Wentworth Gas Ltd 293,821,367 (12,883,321) - (222,648,125) -
Mdn Tanzania Ltd 29,450,209 - - - (1,187,480)
Tancan Mining Company Ltd 61,994,204 - - - -
Ophir Tanzania (Block 1) Ltd - - - - (15,392,000)
Tanzania Portland Cement Co Ltd - - (6,180,261) - -
Dominion Oil & Gas Ltd 2,333,249 (8,511,156) - - -
Total adjustments 53,539,353,386 (12,939,936,917) (9,490,027,733) (527,007,660) (397,110,363)
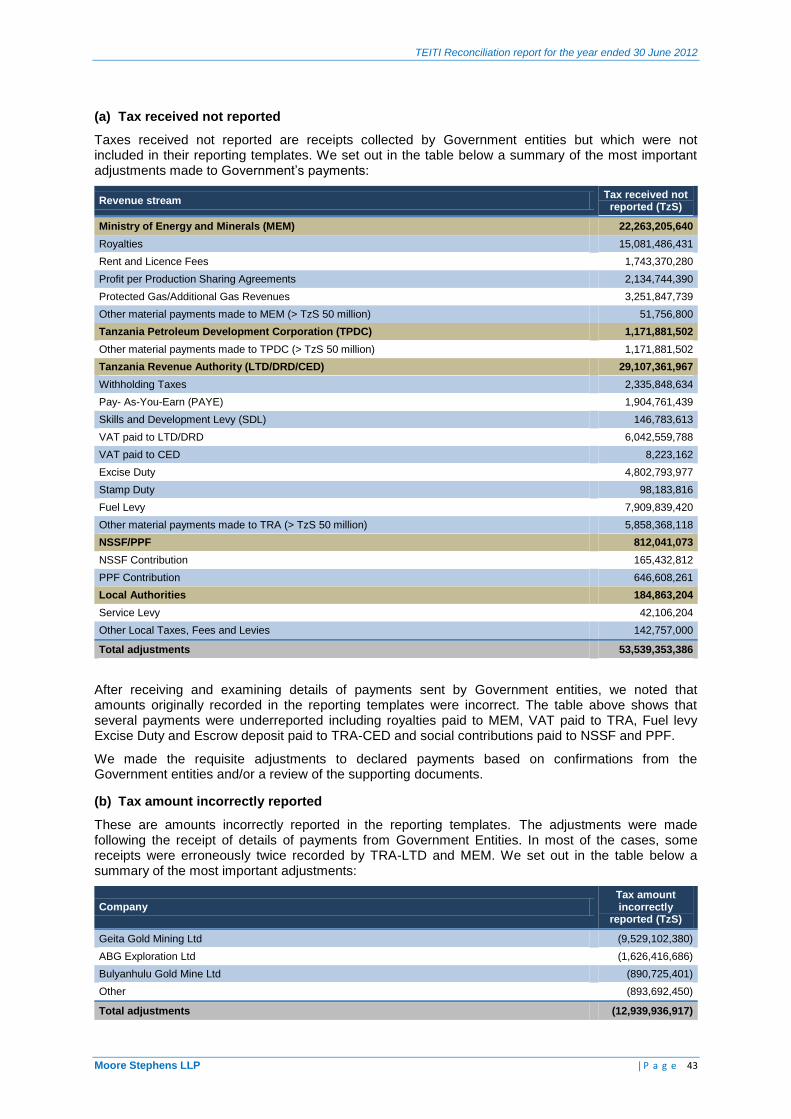
TEITI Reconciliation report for the year ended 30 June 2012
Moore Stephens LLP | P a g e 43
(a) Tax received not reported
Taxes received not reported are receipts collected by Government entities but which were not included in their reporting templates. We set out in the table below a summary of the most important adjustments made to Government’s payments:
Revenue stream Tax received not
reported (TzS)
Ministry of Energy and Minerals (MEM) 22,263,205,640
Royalties 15,081,486,431
Rent and Licence Fees 1,743,370,280
Profit per Production Sharing Agreements 2,134,744,390
Protected Gas/Additional Gas Revenues 3,251,847,739
Other material payments made to MEM (> TzS 50 million) 51,756,800
Tanzania Petroleum Development Corporation (TPDC) 1,171,881,502
Other material payments made to TPDC (> TzS 50 million) 1,171,881,502
Tanzania Revenue Authority (LTD/DRD/CED) 29,107,361,967
Withholding Taxes 2,335,848,634
Pay- As-You-Earn (PAYE) 1,904,761,439
Skills and Development Levy (SDL) 146,783,613
VAT paid to LTD/DRD 6,042,559,788
VAT paid to CED 8,223,162
Excise Duty 4,802,793,977
Stamp Duty 98,183,816
Fuel Levy 7,909,839,420
Other material payments made to TRA (> TzS 50 million) 5,858,368,118
NSSF/PPF 812,041,073
NSSF Contribution 165,432,812
PPF Contribution 646,608,261
Local Authorities 184,863,204
Service Levy 42,106,204
Other Local Taxes, Fees and Levies 142,757,000
Total adjustments 53,539,353,386
After receiving and examining details of payments sent by Government entities, we noted that amounts originally recorded in the reporting templates were incorrect. The table above shows that several payments were underreported including royalties paid to MEM, VAT paid to TRA, Fuel levy Excise Duty and Escrow deposit paid to TRA-CED and social contributions paid to NSSF and PPF.
We made the requisite adjustments to declared payments based on confirmations from the Government entities and/or a review of the supporting documents.
(b) Tax amount incorrectly reported
These are amounts incorrectly reported in the reporting templates. The adjustments were made following the receipt of details of payments from Government Entities. In most of the cases, some receipts were erroneously twice recorded by TRA-LTD and MEM. We set out in the table below a summary of the most important adjustments:
Company Tax amount incorrectly
reported (TzS)
Geita Gold Mining Ltd (9,529,102,380)
ABG Exploration Ltd (1,626,416,686)
Bulyanhulu Gold Mine Ltd (890,725,401)
Other (893,692,450)
Total adjustments (12,939,936,917)
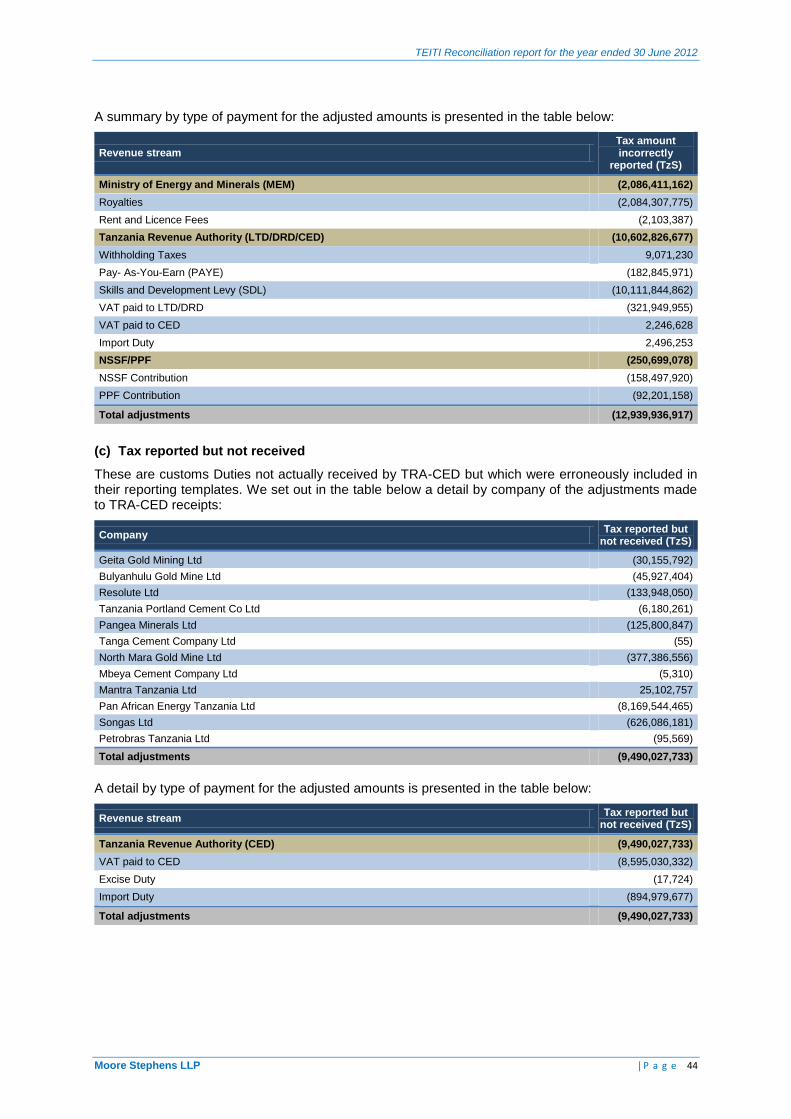
TEITI Reconciliation report for the year ended 30 June 2012
Moore Stephens LLP | P a g e 44
A summary by type of payment for the adjusted amounts is presented in the table below:
Revenue stream Tax amount incorrectly
reported (TzS)
Ministry of Energy and Minerals (MEM) (2,086,411,162)
Royalties (2,084,307,775)
Rent and Licence Fees (2,103,387)
Tanzania Revenue Authority (LTD/DRD/CED) (10,602,826,677)
Withholding Taxes 9,071,230
Pay- As-You-Earn (PAYE) (182,845,971)
Skills and Development Levy (SDL) (10,111,844,862)
VAT paid to LTD/DRD (321,949,955)
VAT paid to CED 2,246,628
Import Duty 2,496,253
NSSF/PPF (250,699,078)
NSSF Contribution (158,497,920)
PPF Contribution (92,201,158)
Total adjustments (12,939,936,917)
(c) Tax reported but not received
These are customs Duties not actually received by TRA-CED but which were erroneously included in their reporting templates. We set out in the table below a detail by company of the adjustments made to TRA-CED receipts:
Company Tax reported but
not received (TzS)
Geita Gold Mining Ltd (30,155,792)
Bulyanhulu Gold Mine Ltd (45,927,404)
Resolute Ltd (133,948,050)
Tanzania Portland Cement Co Ltd (6,180,261)
Pangea Minerals Ltd (125,800,847)
Tanga Cement Company Ltd (55)
North Mara Gold Mine Ltd (377,386,556)
Mbeya Cement Company Ltd (5,310)
Mantra Tanzania Ltd 25,102,757
Pan African Energy Tanzania Ltd (8,169,544,465)
Songas Ltd (626,086,181)
Petrobras Tanzania Ltd (95,569)
Total adjustments (9,490,027,733)
A detail by type of payment for the adjusted amounts is presented in the table below:
Revenue stream Tax reported but
not received (TzS)
Tanzania Revenue Authority (CED) (9,490,027,733)
VAT paid to CED (8,595,030,332)
Excise Duty (17,724)
Import Duty (894,979,677)
Total adjustments (9,490,027,733)
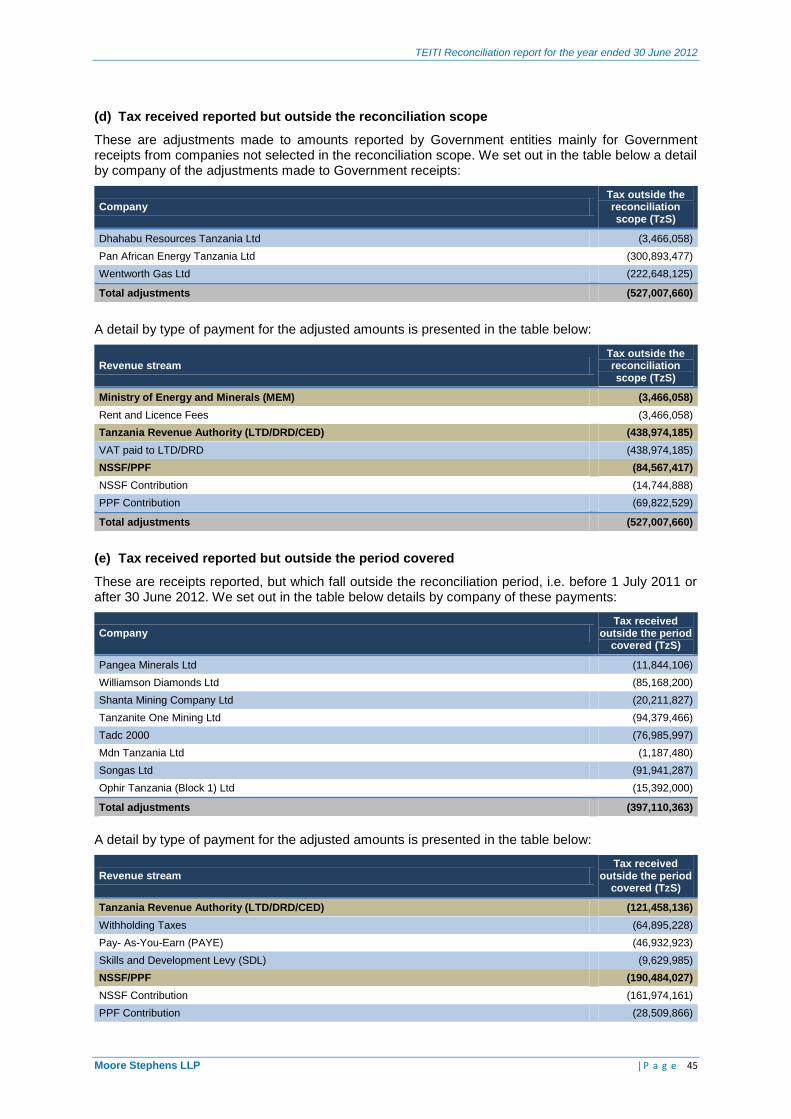
TEITI Reconciliation report for the year ended 30 June 2012
Moore Stephens LLP | P a g e 45
(d) Tax received reported but outside the reconciliation scope
These are adjustments made to amounts reported by Government entities mainly for Government receipts from companies not selected in the reconciliation scope. We set out in the table below a detail by company of the adjustments made to Government receipts:
Company Tax outside the reconciliation scope (TzS)
Dhahabu Resources Tanzania Ltd (3,466,058)
Pan African Energy Tanzania Ltd (300,893,477)
Wentworth Gas Ltd (222,648,125)
Total adjustments (527,007,660)
A detail by type of payment for the adjusted amounts is presented in the table below:
Revenue stream Tax outside the reconciliation scope (TzS)
Ministry of Energy and Minerals (MEM) (3,466,058)
Rent and Licence Fees (3,466,058)
Tanzania Revenue Authority (LTD/DRD/CED) (438,974,185)
VAT paid to LTD/DRD (438,974,185)
NSSF/PPF (84,567,417)
NSSF Contribution (14,744,888)
PPF Contribution (69,822,529)
Total adjustments (527,007,660)
(e) Tax received reported but outside the period covered
These are receipts reported, but which fall outside the reconciliation period, i.e. before 1 July 2011 or after 30 June 2012. We set out in the table below details by company of these payments:
Company Tax received
outside the period covered (TzS)
Pangea Minerals Ltd (11,844,106)
Williamson Diamonds Ltd (85,168,200)
Shanta Mining Company Ltd (20,211,827)
Tanzanite One Mining Ltd (94,379,466)
Tadc 2000 (76,985,997)
Mdn Tanzania Ltd (1,187,480)
Songas Ltd (91,941,287)
Ophir Tanzania (Block 1) Ltd (15,392,000)
Total adjustments (397,110,363)
A detail by type of payment for the adjusted amounts is presented in the table below:
Revenue stream Tax received
outside the period covered (TzS)
Tanzania Revenue Authority (LTD/DRD/CED) (121,458,136)
Withholding Taxes (64,895,228)
Pay- As-You-Earn (PAYE) (46,932,923)
Skills and Development Levy (SDL) (9,629,985)
NSSF/PPF (190,484,027)
NSSF Contribution (161,974,161)
PPF Contribution (28,509,866)
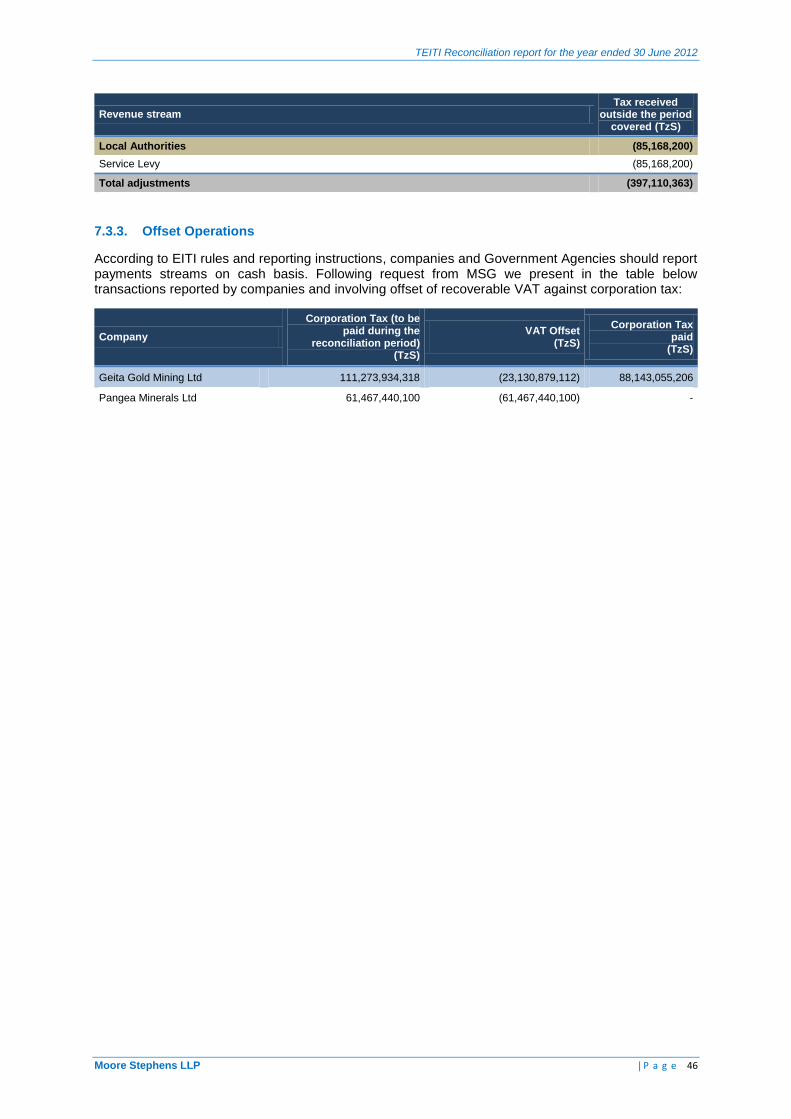
TEITI Reconciliation report for the year ended 30 June 2012
Moore Stephens LLP | P a g e 46
Revenue stream Tax received
outside the period covered (TzS)
Local Authorities (85,168,200)
Service Levy (85,168,200)
Total adjustments (397,110,363)
7.3.3. Offset Operations
According to EITI rules and reporting instructions, companies and Government Agencies should report payments streams on cash basis. Following request from MSG we present in the table below transactions reported by companies and involving offset of recoverable VAT against corporation tax:
Company
Corporation Tax (to be paid during the
reconciliation period) (TzS)
VAT Offset (TzS)
Corporation Tax paid
(TzS)
Geita Gold Mining Ltd 111,273,934,318 (23,130,879,112) 88,143,055,206
Pangea Minerals Ltd 61,467,440,100 (61,467,440,100) -
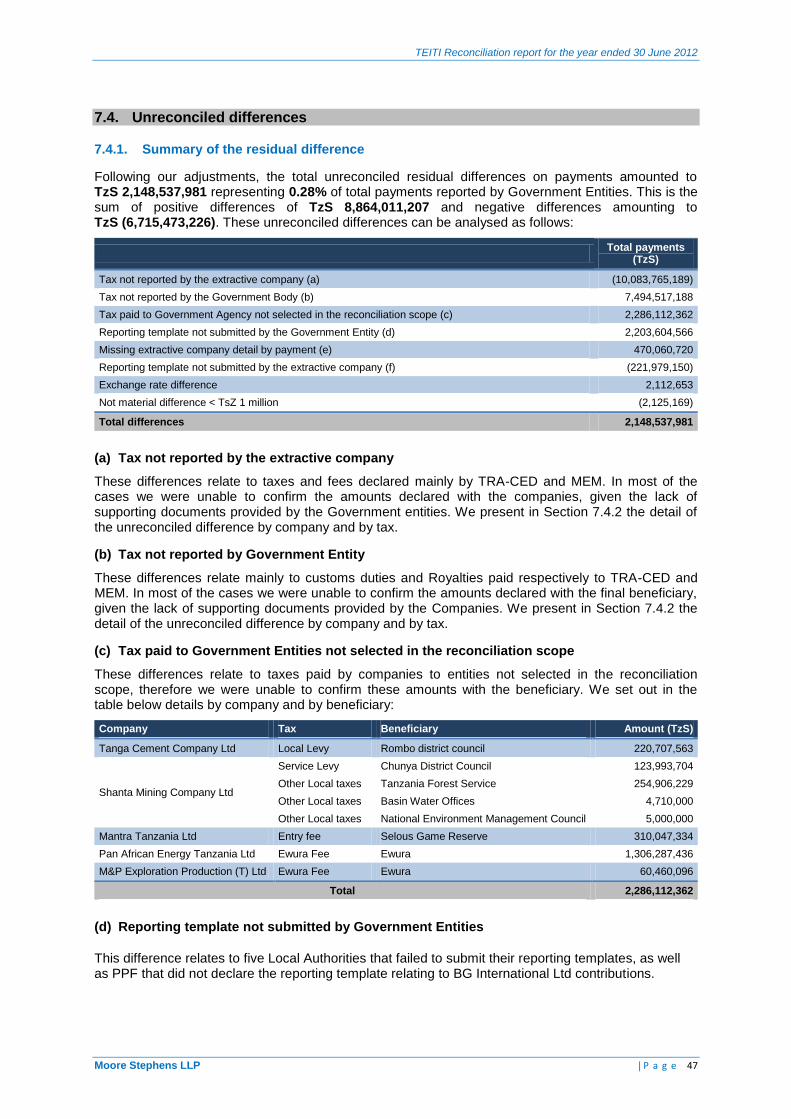
TEITI Reconciliation report for the year ended 30 June 2012
Moore Stephens LLP | P a g e 47
7.4. Unreconciled differences
7.4.1. Summary of the residual difference
Following our adjustments, the total unreconciled residual differences on payments amounted to TzS 2,148,537,981 representing 0.28% of total payments reported by Government Entities. This is the sum of positive differences of TzS 8,864,011,207 and negative differences amounting to TzS (6,715,473,226). These unreconciled differences can be analysed as follows:
Total payments
(TzS)
Tax not reported by the extractive company (a) (10,083,765,189)
Tax not reported by the Government Body (b) 7,494,517,188
Tax paid to Government Agency not selected in the reconciliation scope (c) 2,286,112,362
Reporting template not submitted by the Government Entity (d) 2,203,604,566
Missing extractive company detail by payment (e) 470,060,720
Reporting template not submitted by the extractive company (f) (221,979,150)
Exchange rate difference 2,112,653
Not material difference < TsZ 1 million (2,125,169)
Total differences 2,148,537,981
(a) Tax not reported by the extractive company
These differences relate to taxes and fees declared mainly by TRA-CED and MEM. In most of the cases we were unable to confirm the amounts declared with the companies, given the lack of supporting documents provided by the Government entities. We present in Section 7.4.2 the detail of the unreconciled difference by company and by tax.
(b) Tax not reported by Government Entity
These differences relate mainly to customs duties and Royalties paid respectively to TRA-CED and MEM. In most of the cases we were unable to confirm the amounts declared with the final beneficiary, given the lack of supporting documents provided by the Companies. We present in Section 7.4.2 the detail of the unreconciled difference by company and by tax.
(c) Tax paid to Government Entities not selected in the reconciliation scope
These differences relate to taxes paid by companies to entities not selected in the reconciliation scope, therefore we were unable to confirm these amounts with the beneficiary. We set out in the table below details by company and by beneficiary:
Company Tax Beneficiary Amount (TzS)
Tanga Cement Company Ltd Local Levy Rombo district council 220,707,563
Shanta Mining Company Ltd
Service Levy Chunya District Council 123,993,704
Other Local taxes Tanzania Forest Service 254,906,229
Other Local taxes Basin Water Offices 4,710,000
Other Local taxes National Environment Management Council 5,000,000
Mantra Tanzania Ltd Entry fee Selous Game Reserve 310,047,334
Pan African Energy Tanzania Ltd Ewura Fee Ewura 1,306,287,436
M&P Exploration Production (T) Ltd Ewura Fee Ewura 60,460,096
Total 2,286,112,362
(d) Reporting template not submitted by Government Entities
This difference relates to five Local Authorities that failed to submit their reporting templates, as well as PPF that did not declare the reporting template relating to BG International Ltd contributions.
TEITI Reconciliation report for the year ended 30 June 2012
Moore Stephens LLP | P a g e 48
(e) Missing extractive company detail by payment
This difference is related to Maweni Limestone Ltd that has submitted its reporting template using
rounded numbers and payment flow details were not provided. Consequently, the data submitted were not reconciled.
(f) Reporting template not submitted by extractive companies
This final unreconciled difference relates to Geo Can Resources Co Ltd that failed to submit a reporting template. We were contacted by the Lake Victoria Resources (T) Ltd company, which has been the owner of Geo Can Resources Co Ltd since 2009, which informed us that they cannot fill in the reporting template as there have been no transactions made by Geo Can Resources Co Ltd during the reconciliation period.
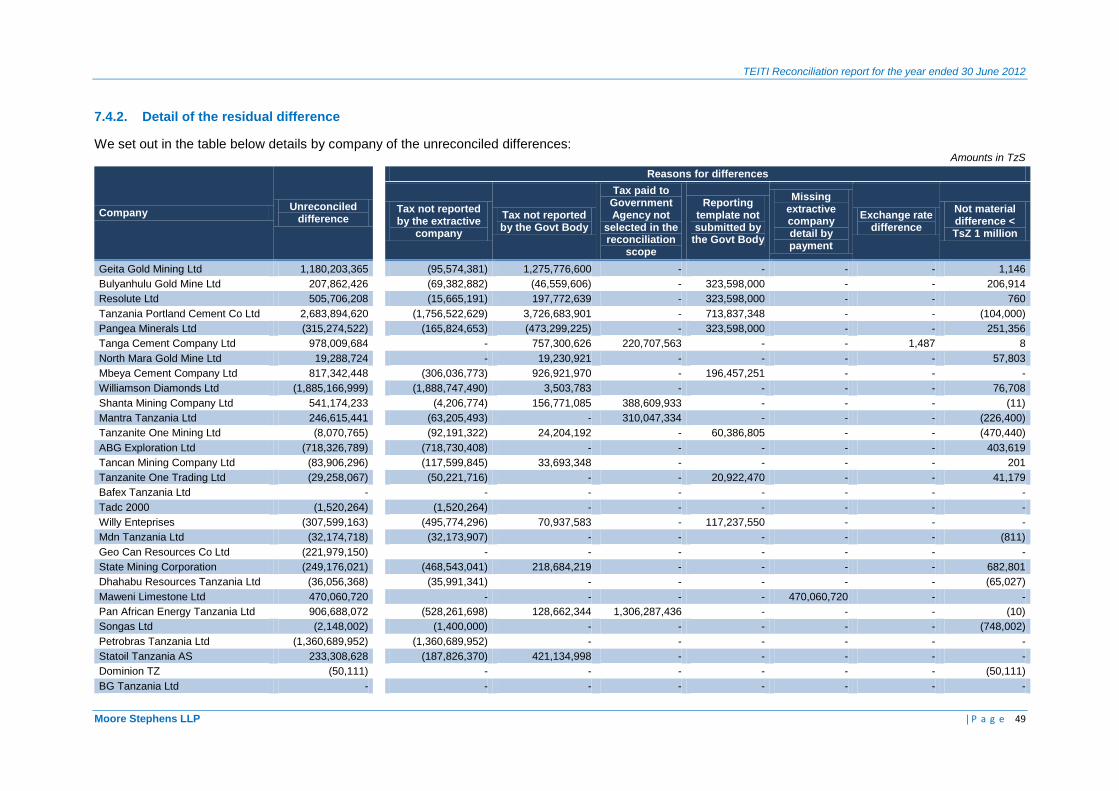
TEITI Reconciliation report for the year ended 30 June 2012
Moore Stephens LLP | P a g e 49
7.4.2. Detail of the residual difference
We set out in the table below details by company of the unreconciled differences: Amounts in TzS
Company Unreconciled
difference
Reasons for differences
Tax not reported by the extractive
company
Tax not reported by the Govt Body
Tax paid to Government Agency not
selected in the reconciliation
scope
Reporting template not submitted by
the Govt Body
Missing extractive company detail by payment
Exchange rate difference
Not material difference < TsZ 1 million
Geita Gold Mining Ltd 1,180,203,365
(95,574,381) 1,275,776,600 - - - - 1,146
Bulyanhulu Gold Mine Ltd 207,862,426
(69,382,882) (46,559,606) - 323,598,000 - - 206,914
Resolute Ltd 505,706,208
(15,665,191) 197,772,639 - 323,598,000 - - 760
Tanzania Portland Cement Co Ltd 2,683,894,620
(1,756,522,629) 3,726,683,901 - 713,837,348 - - (104,000)
Pangea Minerals Ltd (315,274,522)
(165,824,653) (473,299,225) - 323,598,000 - - 251,356
Tanga Cement Company Ltd 978,009,684
- 757,300,626 220,707,563 - - 1,487 8
North Mara Gold Mine Ltd 19,288,724
- 19,230,921 - - - - 57,803
Mbeya Cement Company Ltd 817,342,448
(306,036,773) 926,921,970 - 196,457,251 - - -
Williamson Diamonds Ltd (1,885,166,999)
(1,888,747,490) 3,503,783 - - - - 76,708
Shanta Mining Company Ltd 541,174,233
(4,206,774) 156,771,085 388,609,933 - - - (11)
Mantra Tanzania Ltd 246,615,441
(63,205,493) - 310,047,334 - - - (226,400)
Tanzanite One Mining Ltd (8,070,765)
(92,191,322) 24,204,192 - 60,386,805 - - (470,440)
ABG Exploration Ltd (718,326,789)
(718,730,408) - - - - - 403,619
Tancan Mining Company Ltd (83,906,296)
(117,599,845) 33,693,348 - - - - 201
Tanzanite One Trading Ltd (29,258,067)
(50,221,716) - - 20,922,470 - - 41,179
Bafex Tanzania Ltd -
- - - - - - -
Tadc 2000 (1,520,264)
(1,520,264) - - - - - -
Willy Enteprises (307,599,163)
(495,774,296) 70,937,583 - 117,237,550 - - -
Mdn Tanzania Ltd (32,174,718)
(32,173,907) - - - - - (811)
Geo Can Resources Co Ltd (221,979,150)
- - - - - - -
State Mining Corporation (249,176,021)
(468,543,041) 218,684,219 - - - - 682,801
Dhahabu Resources Tanzania Ltd (36,056,368)
(35,991,341) - - - - - (65,027)
Maweni Limestone Ltd 470,060,720
- - - - 470,060,720 - -
Pan African Energy Tanzania Ltd 906,688,072
(528,261,698) 128,662,344 1,306,287,436 - - - (10)
Songas Ltd (2,148,002)
(1,400,000) - - - - - (748,002)
Petrobras Tanzania Ltd (1,360,689,952)
(1,360,689,952) - - - - - -
Statoil Tanzania AS 233,308,628
(187,826,370) 421,134,998 - - - - -
Dominion TZ (50,111)
- - - - - - (50,111)
BG Tanzania Ltd -
- - - - - - -
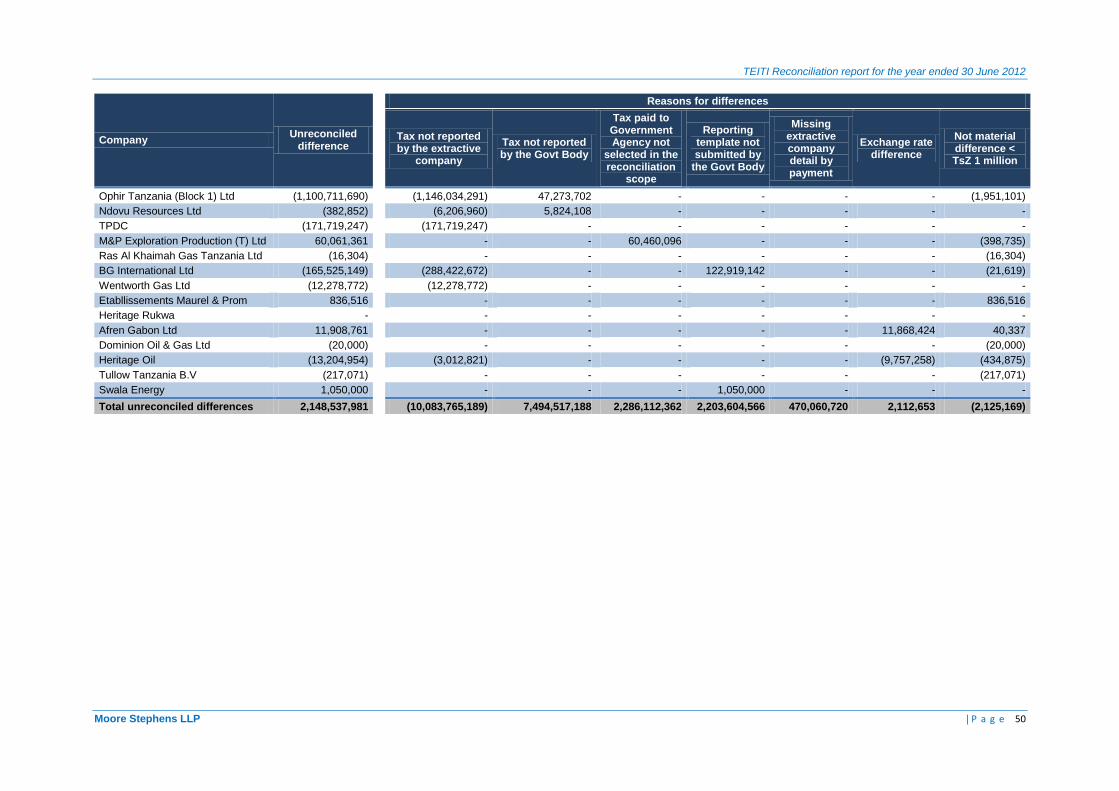
TEITI Reconciliation report for the year ended 30 June 2012
Moore Stephens LLP | P a g e 50
Company Unreconciled
difference
Reasons for differences
Tax not reported by the extractive
company
Tax not reported by the Govt Body
Tax paid to Government Agency not
selected in the reconciliation
scope
Reporting template not submitted by
the Govt Body
Missing extractive company detail by payment
Exchange rate difference
Not material difference < TsZ 1 million
Ophir Tanzania (Block 1) Ltd (1,100,711,690)
(1,146,034,291) 47,273,702 - - - - (1,951,101)
Ndovu Resources Ltd (382,852)
(6,206,960) 5,824,108 - - - - -
TPDC (171,719,247)
(171,719,247) - - - - - -
M&P Exploration Production (T) Ltd 60,061,361
- - 60,460,096 - - - (398,735)
Ras Al Khaimah Gas Tanzania Ltd (16,304)
- - - - - - (16,304)
BG International Ltd (165,525,149)
(288,422,672) - - 122,919,142 - - (21,619)
Wentworth Gas Ltd (12,278,772)
(12,278,772) - - - - - -
Etabllissements Maurel & Prom 836,516
- - - - - - 836,516
Heritage Rukwa -
- - - - - - -
Afren Gabon Ltd 11,908,761
- - - - - 11,868,424 40,337
Dominion Oil & Gas Ltd (20,000)
- - - - - - (20,000)
Heritage Oil (13,204,954)
(3,012,821) - - - - (9,757,258) (434,875)
Tullow Tanzania B.V (217,071)
- - - - - - (217,071)
Swala Energy 1,050,000
- - - 1,050,000 - - -
Total unreconciled differences 2,148,537,981
(10,083,765,189) 7,494,517,188 2,286,112,362 2,203,604,566 470,060,720 2,112,653 (2,125,169)
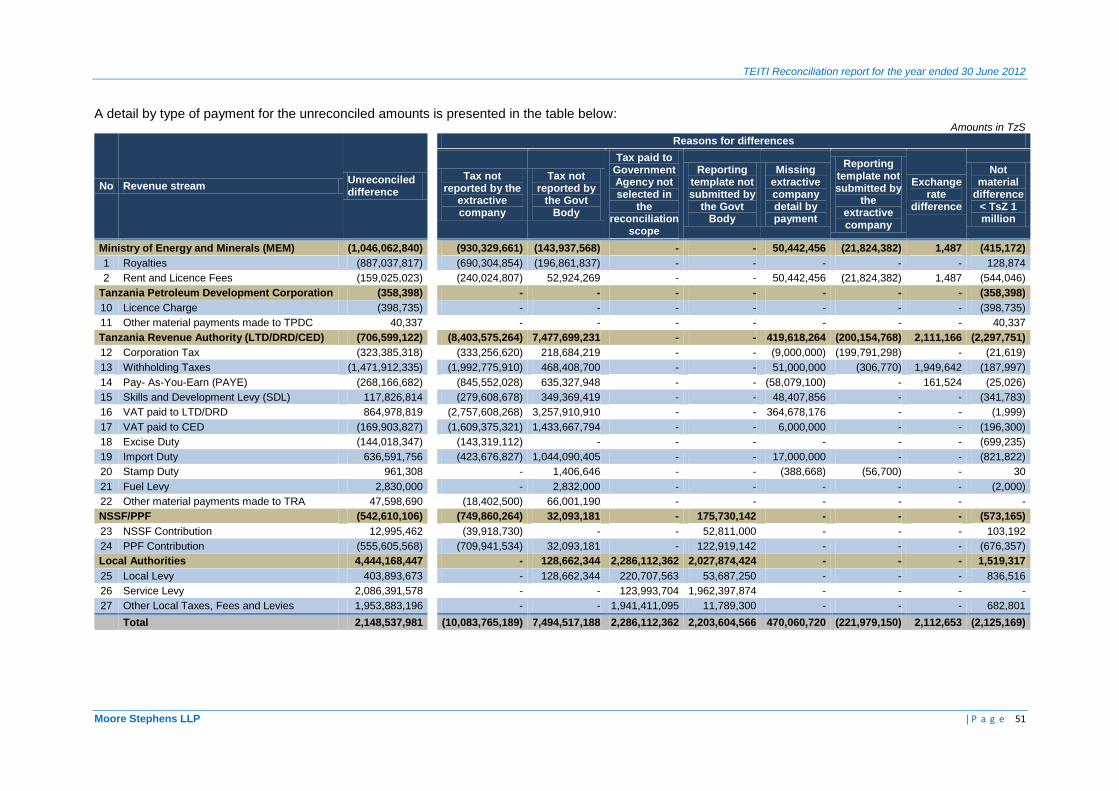
TEITI Reconciliation report for the year ended 30 June 2012
Moore Stephens LLP | P a g e 51
A detail by type of payment for the unreconciled amounts is presented in the table below: Amounts in TzS
No Revenue stream Unreconciled difference
Reasons for differences
Tax not reported by the
extractive company
Tax not reported by
the Govt Body
Tax paid to Government Agency not selected in
the reconciliation
scope
Reporting template not submitted by
the Govt Body
Missing extractive company detail by payment
Reporting template not submitted by
the extractive company
Exchange rate
difference
Not material
difference < TsZ 1 million
Ministry of Energy and Minerals (MEM) (1,046,062,840)
(930,329,661) (143,937,568) - - 50,442,456 (21,824,382) 1,487 (415,172)
1 Royalties (887,037,817)
(690,304,854) (196,861,837) - - - - - 128,874
2 Rent and Licence Fees (159,025,023)
(240,024,807) 52,924,269 - - 50,442,456 (21,824,382) 1,487 (544,046)
Tanzania Petroleum Development Corporation (358,398)
- - - - - - - (358,398)
10 Licence Charge (398,735)
- - - - - - - (398,735)
11 Other material payments made to TPDC 40,337
- - - - - - - 40,337
Tanzania Revenue Authority (LTD/DRD/CED) (706,599,122)
(8,403,575,264) 7,477,699,231 - - 419,618,264 (200,154,768) 2,111,166 (2,297,751)
12 Corporation Tax (323,385,318)
(333,256,620) 218,684,219 - - (9,000,000) (199,791,298) - (21,619)
13 Withholding Taxes (1,471,912,335)
(1,992,775,910) 468,408,700 - - 51,000,000 (306,770) 1,949,642 (187,997)
14 Pay- As-You-Earn (PAYE) (268,166,682)
(845,552,028) 635,327,948 - - (58,079,100) - 161,524 (25,026)
15 Skills and Development Levy (SDL) 117,826,814
(279,608,678) 349,369,419 - - 48,407,856 - - (341,783)
16 VAT paid to LTD/DRD 864,978,819
(2,757,608,268) 3,257,910,910 - - 364,678,176 - - (1,999)
17 VAT paid to CED (169,903,827)
(1,609,375,321) 1,433,667,794 - - 6,000,000 - - (196,300)
18 Excise Duty (144,018,347)
(143,319,112) - - - - - - (699,235)
19 Import Duty 636,591,756
(423,676,827) 1,044,090,405 - - 17,000,000 - - (821,822)
20 Stamp Duty 961,308
- 1,406,646 - - (388,668) (56,700) - 30
21 Fuel Levy 2,830,000
- 2,832,000 - - - - - (2,000)
22 Other material payments made to TRA 47,598,690
(18,402,500) 66,001,190 - - - - - -
NSSF/PPF (542,610,106)
(749,860,264) 32,093,181 - 175,730,142 - - - (573,165)
23 NSSF Contribution 12,995,462
(39,918,730) - - 52,811,000 - - - 103,192
24 PPF Contribution (555,605,568)
(709,941,534) 32,093,181 - 122,919,142 - - - (676,357)
Local Authorities 4,444,168,447
- 128,662,344 2,286,112,362 2,027,874,424 - - - 1,519,317
25 Local Levy 403,893,673
- 128,662,344 220,707,563 53,687,250 - - - 836,516
26 Service Levy 2,086,391,578
- - 123,993,704 1,962,397,874 - - - -
27 Other Local Taxes, Fees and Levies 1,953,883,196
- - 1,941,411,095 11,789,300 - - - 682,801
Total 2,148,537,981
(10,083,765,189) 7,494,517,188 2,286,112,362 2,203,604,566 470,060,720 (221,979,150) 2,112,653 (2,125,169)
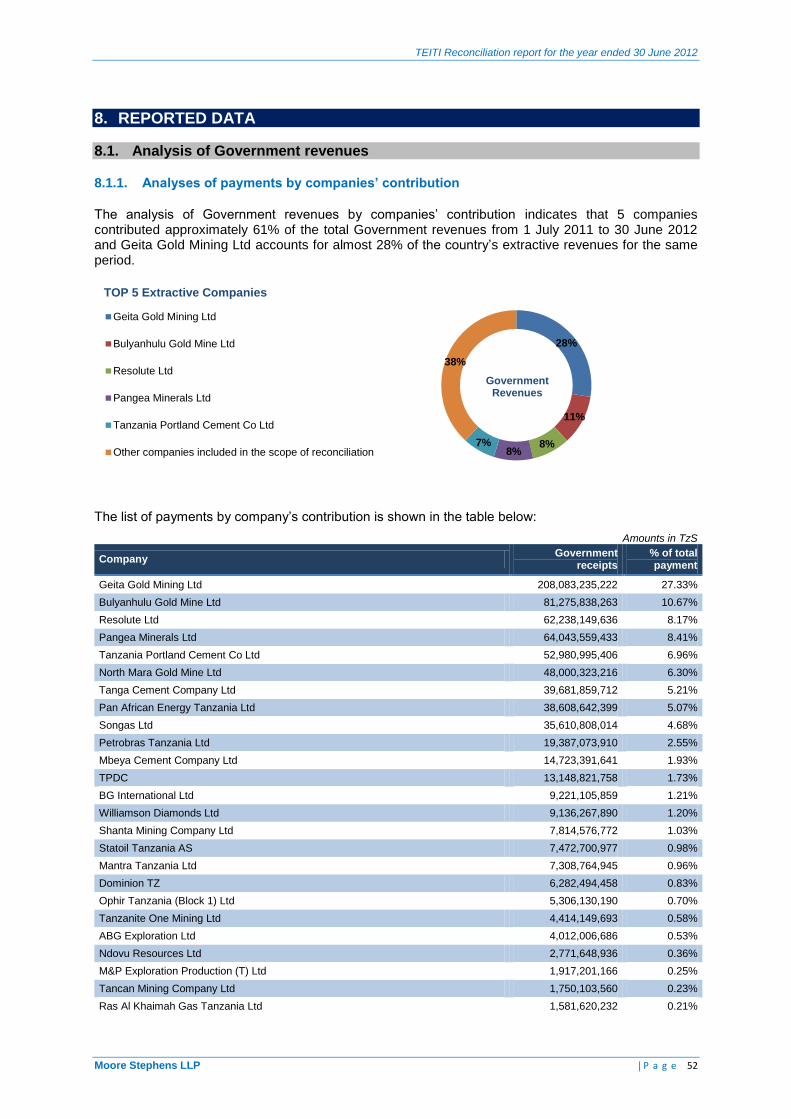
TEITI Reconciliation report for the year ended 30 June 2012
Moore Stephens LLP | P a g e 52
8. REPORTED DATA
8.1. Analysis of Government revenues
8.1.1. Analyses of payments by companies’ contribution
The analysis of Government revenues by companies’ contribution indicates that 5 companies contributed approximately 61% of the total Government revenues from 1 July 2011 to 30 June 2012 and Geita Gold Mining Ltd accounts for almost 28% of the country’s extractive revenues for the same period.
The list of payments by company’s contribution is shown in the table below:
Amounts in TzS
Company Government
receipts % of total payment
Geita Gold Mining Ltd 208,083,235,222 27.33%
Bulyanhulu Gold Mine Ltd 81,275,838,263 10.67%
Resolute Ltd 62,238,149,636 8.17%
Pangea Minerals Ltd 64,043,559,433 8.41%
Tanzania Portland Cement Co Ltd 52,980,995,406 6.96%
North Mara Gold Mine Ltd 48,000,323,216 6.30%
Tanga Cement Company Ltd 39,681,859,712 5.21%
Pan African Energy Tanzania Ltd 38,608,642,399 5.07%
Songas Ltd 35,610,808,014 4.68%
Petrobras Tanzania Ltd 19,387,073,910 2.55%
Mbeya Cement Company Ltd 14,723,391,641 1.93%
TPDC 13,148,821,758 1.73%
BG International Ltd 9,221,105,859 1.21%
Williamson Diamonds Ltd 9,136,267,890 1.20%
Shanta Mining Company Ltd 7,814,576,772 1.03%
Statoil Tanzania AS 7,472,700,977 0.98%
Mantra Tanzania Ltd 7,308,764,945 0.96%
Dominion TZ 6,282,494,458 0.83%
Ophir Tanzania (Block 1) Ltd 5,306,130,190 0.70%
Tanzanite One Mining Ltd 4,414,149,693 0.58%
ABG Exploration Ltd 4,012,006,686 0.53%
Ndovu Resources Ltd 2,771,648,936 0.36%
M&P Exploration Production (T) Ltd 1,917,201,166 0.25%
Tancan Mining Company Ltd 1,750,103,560 0.23%
Ras Al Khaimah Gas Tanzania Ltd 1,581,620,232 0.21%
28%
11%
8% 8%
7%
38%
Geita Gold Mining Ltd
Bulyanhulu Gold Mine Ltd
Resolute Ltd
Pangea Minerals Ltd
Tanzania Portland Cement Co Ltd
Other companies included in the scope of reconciliation
Government Revenues
TOP 5 Extractive Companies
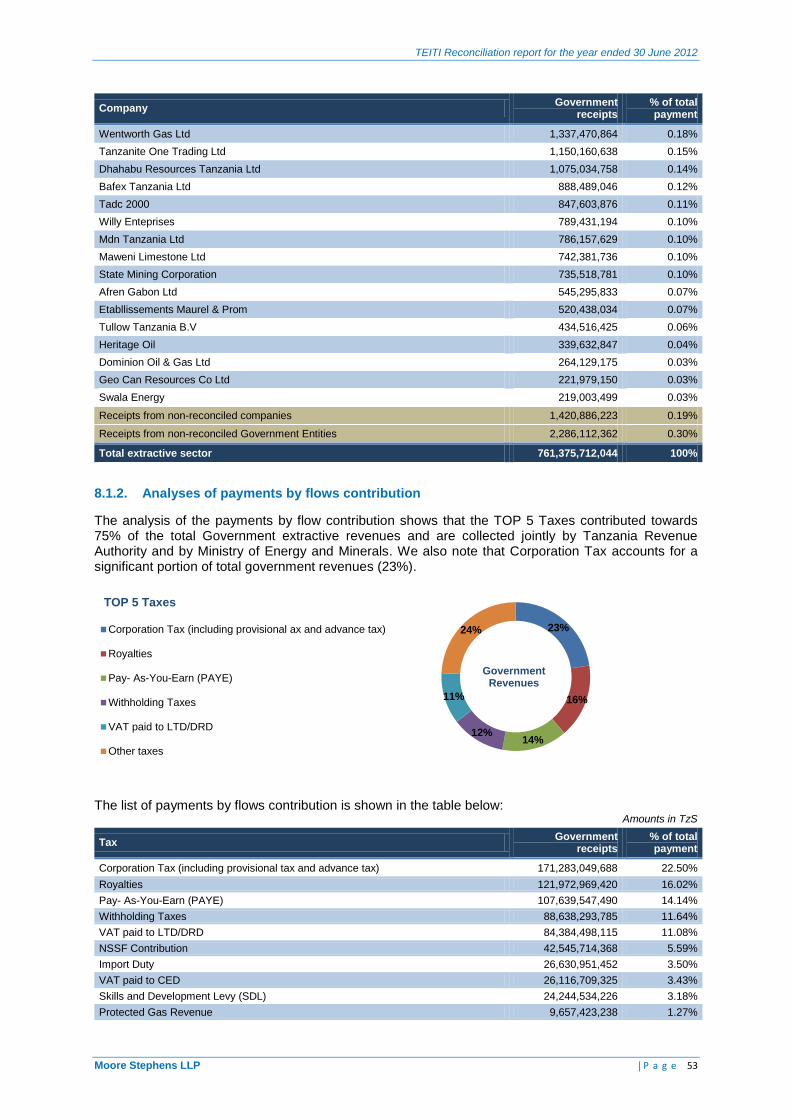
TEITI Reconciliation report for the year ended 30 June 2012
Moore Stephens LLP | P a g e 53
Company Government
receipts % of total payment
Wentworth Gas Ltd 1,337,470,864 0.18%
Tanzanite One Trading Ltd 1,150,160,638 0.15%
Dhahabu Resources Tanzania Ltd 1,075,034,758 0.14%
Bafex Tanzania Ltd 888,489,046 0.12%
Tadc 2000 847,603,876 0.11%
Willy Enteprises 789,431,194 0.10%
Mdn Tanzania Ltd 786,157,629 0.10%
Maweni Limestone Ltd 742,381,736 0.10%
State Mining Corporation 735,518,781 0.10%
Afren Gabon Ltd 545,295,833 0.07%
Etabllissements Maurel & Prom 520,438,034 0.07%
Tullow Tanzania B.V 434,516,425 0.06%
Heritage Oil 339,632,847 0.04%
Dominion Oil & Gas Ltd 264,129,175 0.03%
Geo Can Resources Co Ltd 221,979,150 0.03%
Swala Energy 219,003,499 0.03%
Receipts from non-reconciled companies 1,420,886,223 0.19%
Receipts from non-reconciled Government Entities 2,286,112,362 0.30%
Total extractive sector 761,375,712,044 100%
8.1.2. Analyses of payments by flows contribution
The analysis of the payments by flow contribution shows that the TOP 5 Taxes contributed towards 75% of the total Government extractive revenues and are collected jointly by Tanzania Revenue Authority and by Ministry of Energy and Minerals. We also note that Corporation Tax accounts for a significant portion of total government revenues (23%).
The list of payments by flows contribution is shown in the table below:
Amounts in TzS
Tax Government
receipts % of total payment
Corporation Tax (including provisional tax and advance tax) 171,283,049,688 22.50%
Royalties 121,972,969,420 16.02%
Pay- As-You-Earn (PAYE) 107,639,547,490 14.14%
Withholding Taxes 88,638,293,785 11.64%
VAT paid to LTD/DRD 84,384,498,115 11.08%
NSSF Contribution 42,545,714,368 5.59%
Import Duty 26,630,951,452 3.50%
VAT paid to CED 26,116,709,325 3.43%
Skills and Development Levy (SDL) 24,244,534,226 3.18%
Protected Gas Revenue 9,657,423,238 1.27%
23%
16%
14% 12%
11%
24% Corporation Tax (including provisional ax and advance tax)
Royalties
Pay- As-You-Earn (PAYE)
Withholding Taxes
VAT paid to LTD/DRD
Other taxes
Government Revenues
TOP 5 Taxes
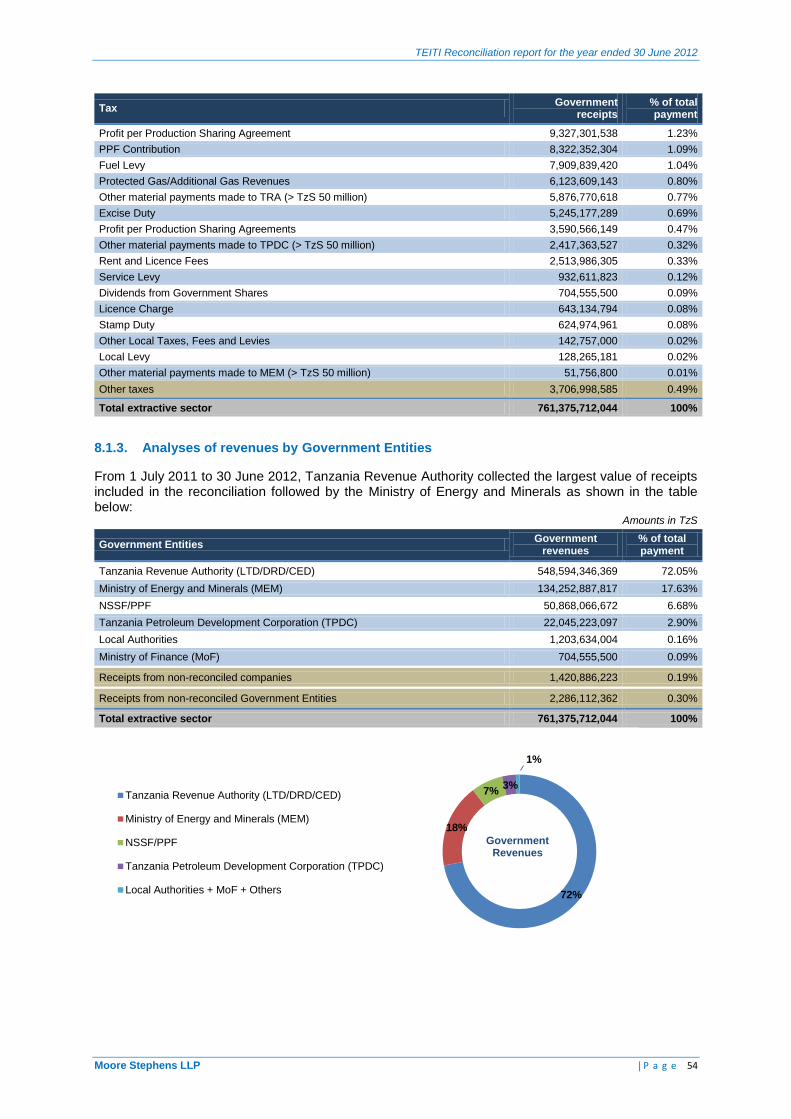
TEITI Reconciliation report for the year ended 30 June 2012
Moore Stephens LLP | P a g e 54
Tax Government
receipts % of total payment
Profit per Production Sharing Agreement 9,327,301,538 1.23%
PPF Contribution 8,322,352,304 1.09%
Fuel Levy 7,909,839,420 1.04%
Protected Gas/Additional Gas Revenues 6,123,609,143 0.80%
Other material payments made to TRA (> TzS 50 million) 5,876,770,618 0.77%
Excise Duty 5,245,177,289 0.69%
Profit per Production Sharing Agreements 3,590,566,149 0.47%
Other material payments made to TPDC (> TzS 50 million) 2,417,363,527 0.32%
Rent and Licence Fees 2,513,986,305 0.33%
Service Levy 932,611,823 0.12%
Dividends from Government Shares 704,555,500 0.09%
Licence Charge 643,134,794 0.08%
Stamp Duty 624,974,961 0.08%
Other Local Taxes, Fees and Levies 142,757,000 0.02%
Local Levy 128,265,181 0.02%
Other material payments made to MEM (> TzS 50 million) 51,756,800 0.01%
Other taxes 3,706,998,585 0.49%
Total extractive sector 761,375,712,044 100%
8.1.3. Analyses of revenues by Government Entities
From 1 July 2011 to 30 June 2012, Tanzania Revenue Authority collected the largest value of receipts included in the reconciliation followed by the Ministry of Energy and Minerals as shown in the table below:
Amounts in TzS
Government Entities Government
revenues % of total payment
Tanzania Revenue Authority (LTD/DRD/CED) 548,594,346,369 72.05%
Ministry of Energy and Minerals (MEM) 134,252,887,817 17.63%
NSSF/PPF 50,868,066,672 6.68%
Tanzania Petroleum Development Corporation (TPDC) 22,045,223,097 2.90%
Local Authorities 1,203,634,004 0.16%
Ministry of Finance (MoF) 704,555,500 0.09%
Receipts from non-reconciled companies 1,420,886,223 0.19%
Receipts from non-reconciled Government Entities 2,286,112,362 0.30%
Total extractive sector 761,375,712,044 100%
72%
18%
7% 3%
1%
Tanzania Revenue Authority (LTD/DRD/CED)
Ministry of Energy and Minerals (MEM)
NSSF/PPF
Tanzania Petroleum Development Corporation (TPDC)
Local Authorities + MoF + Others
Government Revenues
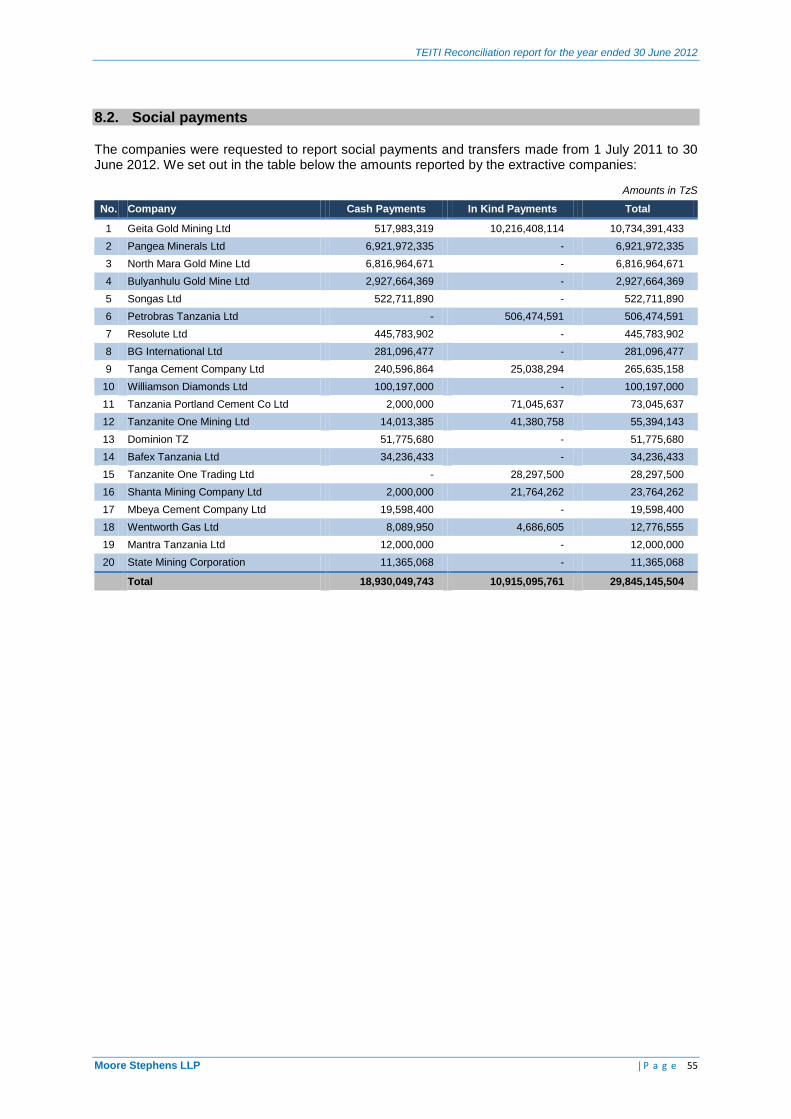
TEITI Reconciliation report for the year ended 30 June 2012
Moore Stephens LLP | P a g e 55
8.2. Social payments
The companies were requested to report social payments and transfers made from 1 July 2011 to 30 June 2012. We set out in the table below the amounts reported by the extractive companies:
Amounts in TzS
No. Company Cash Payments In Kind Payments Total
1 Geita Gold Mining Ltd 517,983,319 10,216,408,114 10,734,391,433
2 Pangea Minerals Ltd 6,921,972,335 - 6,921,972,335
3 North Mara Gold Mine Ltd 6,816,964,671 - 6,816,964,671
4 Bulyanhulu Gold Mine Ltd 2,927,664,369 - 2,927,664,369
5 Songas Ltd 522,711,890 - 522,711,890
6 Petrobras Tanzania Ltd - 506,474,591 506,474,591
7 Resolute Ltd 445,783,902 - 445,783,902
8 BG International Ltd 281,096,477 - 281,096,477
9 Tanga Cement Company Ltd 240,596,864 25,038,294 265,635,158
10 Williamson Diamonds Ltd 100,197,000 - 100,197,000
11 Tanzania Portland Cement Co Ltd 2,000,000 71,045,637 73,045,637
12 Tanzanite One Mining Ltd 14,013,385 41,380,758 55,394,143
13 Dominion TZ 51,775,680 - 51,775,680
14 Bafex Tanzania Ltd 34,236,433 - 34,236,433
15 Tanzanite One Trading Ltd - 28,297,500 28,297,500
16 Shanta Mining Company Ltd 2,000,000 21,764,262 23,764,262
17 Mbeya Cement Company Ltd 19,598,400 - 19,598,400
18 Wentworth Gas Ltd 8,089,950 4,686,605 12,776,555
19 Mantra Tanzania Ltd 12,000,000 - 12,000,000
20 State Mining Corporation 11,365,068 - 11,365,068
Total 18,930,049,743 10,915,095,761 29,845,145,504
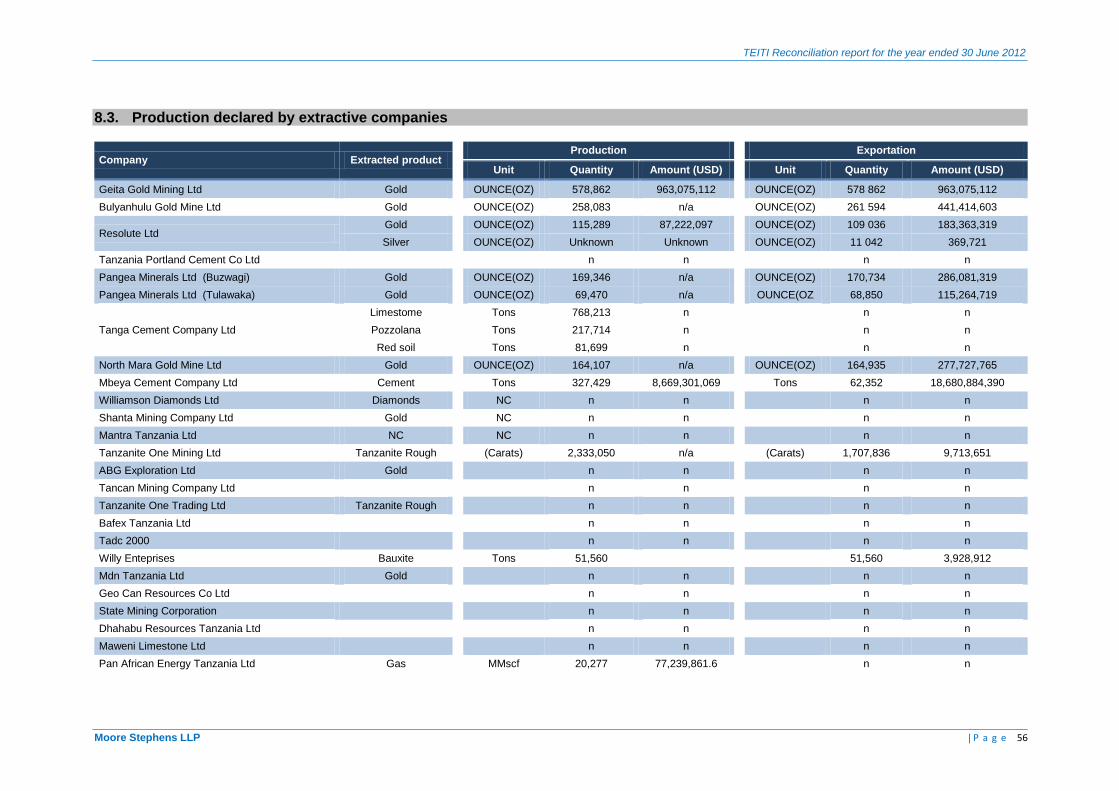
TEITI Reconciliation report for the year ended 30 June 2012
Moore Stephens LLP | P a g e 56
8.3. Production declared by extractive companies
Company Extracted product Production
Exportation
Unit Quantity Amount (USD)
Unit Quantity Amount (USD)
Geita Gold Mining Ltd Gold
OUNCE(OZ) 578,862 963,075,112
OUNCE(OZ) 578 862 963,075,112
Bulyanhulu Gold Mine Ltd Gold
OUNCE(OZ) 258,083 n/a
OUNCE(OZ) 261 594 441,414,603
Resolute Ltd Gold
OUNCE(OZ) 115,289 87,222,097
OUNCE(OZ) 109 036 183,363,319
Silver
OUNCE(OZ) Unknown Unknown
OUNCE(OZ) 11 042 369,721
Tanzania Portland Cement Co Ltd
n n
n n
Pangea Minerals Ltd (Buzwagi) Gold
OUNCE(OZ) 169,346 n/a
OUNCE(OZ) 170,734 286,081,319
Pangea Minerals Ltd (Tulawaka) Gold OUNCE(OZ) 69,470 n/a OUNCE(OZ 68,850 115,264,719
Tanga Cement Company Ltd
Limestome
Tons 768,213 n
n n
Pozzolana
Tons 217,714 n
n n
Red soil
Tons 81,699 n
n n
North Mara Gold Mine Ltd Gold
OUNCE(OZ) 164,107 n/a
OUNCE(OZ) 164,935 277,727,765
Mbeya Cement Company Ltd Cement
Tons 327,429 8,669,301,069
Tons 62,352 18,680,884,390
Williamson Diamonds Ltd Diamonds
NC n n
n n
Shanta Mining Company Ltd Gold
NC n n
n n
Mantra Tanzania Ltd NC
NC n n
n n
Tanzanite One Mining Ltd Tanzanite Rough
(Carats) 2,333,050 n/a
(Carats) 1,707,836 9,713,651
ABG Exploration Ltd Gold
n n
n n
Tancan Mining Company Ltd
n n
n n
Tanzanite One Trading Ltd Tanzanite Rough
n n
n n
Bafex Tanzania Ltd
n n
n n
Tadc 2000
n n
n n
Willy Enteprises Bauxite
Tons 51,560
51,560 3,928,912
Mdn Tanzania Ltd Gold
n n
n n
Geo Can Resources Co Ltd
n n
n n
State Mining Corporation
n n
n n
Dhahabu Resources Tanzania Ltd
n n
n n
Maweni Limestone Ltd
n n
n n
Pan African Energy Tanzania Ltd Gas
MMscf 20,277 77,239,861.6
n n
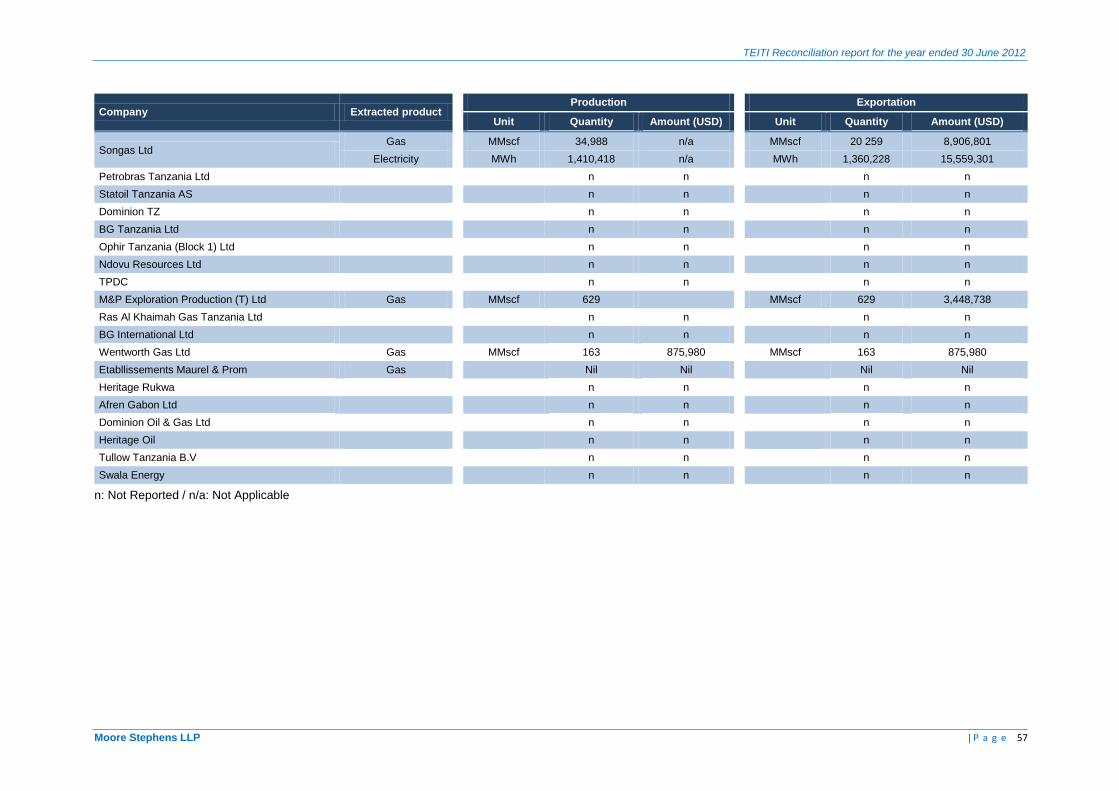
TEITI Reconciliation report for the year ended 30 June 2012
Moore Stephens LLP | P a g e 57
Company Extracted product Production
Exportation
Unit Quantity Amount (USD)
Unit Quantity Amount (USD)
Songas Ltd Gas
MMscf 34,988 n/a
MMscf 20 259 8,906,801
Electricity
MWh 1,410,418 n/a
MWh 1,360,228 15,559,301
Petrobras Tanzania Ltd
n n
n n
Statoil Tanzania AS
n n
n n
Dominion TZ
n n
n n
BG Tanzania Ltd
n n
n n
Ophir Tanzania (Block 1) Ltd
n n
n n
Ndovu Resources Ltd
n n
n n
TPDC
n n
n n
M&P Exploration Production (T) Ltd Gas
MMscf 629
MMscf 629 3,448,738
Ras Al Khaimah Gas Tanzania Ltd
n n
n n
BG International Ltd
n n
n n
Wentworth Gas Ltd Gas
MMscf 163 875,980
MMscf 163 875,980
Etabllissements Maurel & Prom Gas
Nil Nil
Nil Nil
Heritage Rukwa
n n
n n
Afren Gabon Ltd
n n
n n
Dominion Oil & Gas Ltd
n n
n n
Heritage Oil
n n
n n
Tullow Tanzania B.V
n n
n n
Swala Energy
n n
n n
n: Not Reported / n/a: Not Applicable
TEITI Reconciliation report for the year ended 30 June 2012
Moore Stephens LLP | P a g e 58
9. RECOMMENDATIONS
9.1. Lessons learned from the 2012 reconciliation
9.1.1. Lack of EITI Database
It appears that, to date, the TEITI Secretariat does not have a comprehensive database of all extractive companies operating in the extractive sector. This is a result of no formal communication between Government Entities with regard to the extractive companies operating in the sector.
In some cases making contact with extractive companies can be difficult as no contact details are available and it is difficult to locate them.
We recommend that, in the first instance, the Secretariat should create its database following this reconciliation exercise. The Secretariat should then liaise with the Governmental entities to ensure it obtains adequate information regularly and updates its database accordingly. To this end, we believe it is vital that any new entrants to the extractive sector are registered with the EITI Secretariat as part of the process of obtaining their operating licence. A quarterly review of the list of extractive companies licenced to operate in the sector should be performed with the Governmental entities.
Each extractive company and Government entity previously included in the reconciliation work must appoint a single point of contact to take responsibility for comprehensive EITI reporting and the company should notify the Secretariat of the name and contact details of that focal person.
9.1.2. Supporting data
The instructions sent out with the reporting templates to extractive companies indicated that when compiling their templates, extractive companies and local authorities should provide us with schedules showing a breakdown of all amounts included.
Although many extractive companies provided us with these schedules, we note that some of the Companies and all of the local authorities were not diligent in complying with this requirement. We followed up most of the non-compliant extractive companies during subsequent reminders.
We recommend a review of the procedures for communication, in particular with those who use a clearing agent for their tax payments. The clearing agents must provide regular details of payments made on behalf of the relevant mining company (excluding their fees). A regular compulsory briefing or training seminar for new comers might be an option.
9.1.3. Lack of audit certificates
Although it was clearly stated during the workshop that extractive companies should submit their tax templates accompanied by an audit certificate, only twenty five of the extractive companies that submitted a template also provided the audit certificate.
Similarly, the Government Entities’ tax templates should have been certified by the Auditor General but we note that this was not done for the main Government Entities.
We recommend for the forthcoming exercises that the extractive companies comply with this requirement, failing which sanctions should be applied against them. With regard to the Governmental Agencies, it is recommended that reliable and auditable data is presented to the Office of Auditor General before the Reconcilers start the 5
th verification exercise.
TEITI Reconciliation report for the year ended 30 June 2012
Moore Stephens LLP | P a g e 59
9.1.4. Mining Cadastre
The licensing information provided during the scoping phase by the Mining Cadastre generated some queries which, whilst being resolved, suggest that the licensing database and the process of extracting information from the database, require further examination. In seeking to assess whether companies listed by MEM held mining licences, we were unable to locate information for certain companies on the reports provided by the Cadastre. We noted inaccuracies in the preparation of information relating to mining companies, due to:
• the manual effort required to produce the list of these licences;
• out of date entries on the licence database;
• confusing changes in the system of numbering licences; with reliance upon supplementary data;
• manual records for interpretation; and
• inaccuracy in data regarding locations, as identified during the reconciliation phase.
We recommend that the Mining Cadastre should ensure that all records are computerised and adequately maintained and should ensure that reports of all licensed operators, with appropriate details, can be readily produced for the EITI and for other purposes.
The Mining Cadastre has a computerised system and the continuous process of updating records is ongoing. A manual filing system is also used for information that is not computerised, such as application forms.
9.1.5. Lack of understanding and commitment on EITI principles by some stakeholders
We note that some stakeholders involved in the reconciliation process (extractive companies and Government Entities) do not have a good understanding and knowledge of EITI, its international significance and Tanzania's membership. Certain stakeholders do not understand the management structure of EITI in Tanzania, what the regulations governing the process are, what their own role and involvement is in the reconciliation exercise, and, most of all, the importance of the data they are providing. Considerable time was taken to explain the EITI process and reconciliation to management, accountants from extractive companies and some officials within Government entities.
At the beginning of the reconciliation work, PPF refused to provide data to the Reconcilers, citing confidentiality reasons. Requirement No. 8 of 2011 EITI Rules stipulates that Government should “remove obstacles to the implementation of the EITI” by issuing a waiver of confidentiality clauses in contracts with the companies to permit the disclosure of revenues
Although, Tanzania EITI reports have been reconciled for 3 years, the legal environment defining the roles and responsibilities of stakeholders has yet to be created. Overall reporting and reconciliation is governed by a regulation from the MEM and MSG on reporting operations on mineral exploration, mining and oil and gas company activities. As the roles and responsibilities of parties (Government and extractive companies) are unclear, reconciliation of reports encounter certain difficulties.
The success of a reconciliation exercise relies on the engagement of all stakeholders. Requirement No. 2 of 2011 EITI Rules stipulates that the Government is required to commit to work on the implementation of the EITI. As a result, all Government Entities should be aware of the commitment of Tanzania with EITI. Requirement No. 7 of 2011 EITI Rules stipulates that the Government is required to engage companies in the implementation of the EITI. This means that all extractive companies should adhere to the EITI process and provide necessary assistance and cooperation when required.
We recommend that MSG improves the communication strategy and creates an awareness campaign in relation to EITI, its role and benefits in order to sensitise all stakeholders of the importance of the EITI process and more specifically the reporting entities (extractive companies and Government entities).
TEITI Reconciliation report for the year ended 30 June 2012
Moore Stephens LLP | P a g e 60
9.1.6. Reporting templates not adequately prepared by several stakeholders
We note that reporting from extractive companies and Government Entities was not adequately prepared. We set out below several weaknesses noted during our mission:
TRA has reported the excess of input VAT declared by the company as received. Nevertheless, these amounts were not paid by the companies;
there is some confusion between tax paid and reported by the TRA. Especially between PAYE, SDL and Withholding Taxes;
PPF has not submitted a reporting template according to the reporting instructions. We received only an excel sheet with the detail of payments by company; and
several reports from companies do not include production data, information on licences and location.
This situation led to considerable delays because the figures declared by the reporting entities were not understandable. This has also resulted in significant resources being involved to make sense of the figures and to adjust the payments.
We recommend that the Tanzanian EITI Secretariat should ensure that reporting entities are made aware of the importance of the data they are providing and that due care and attention is paid during the preparation of these reports.
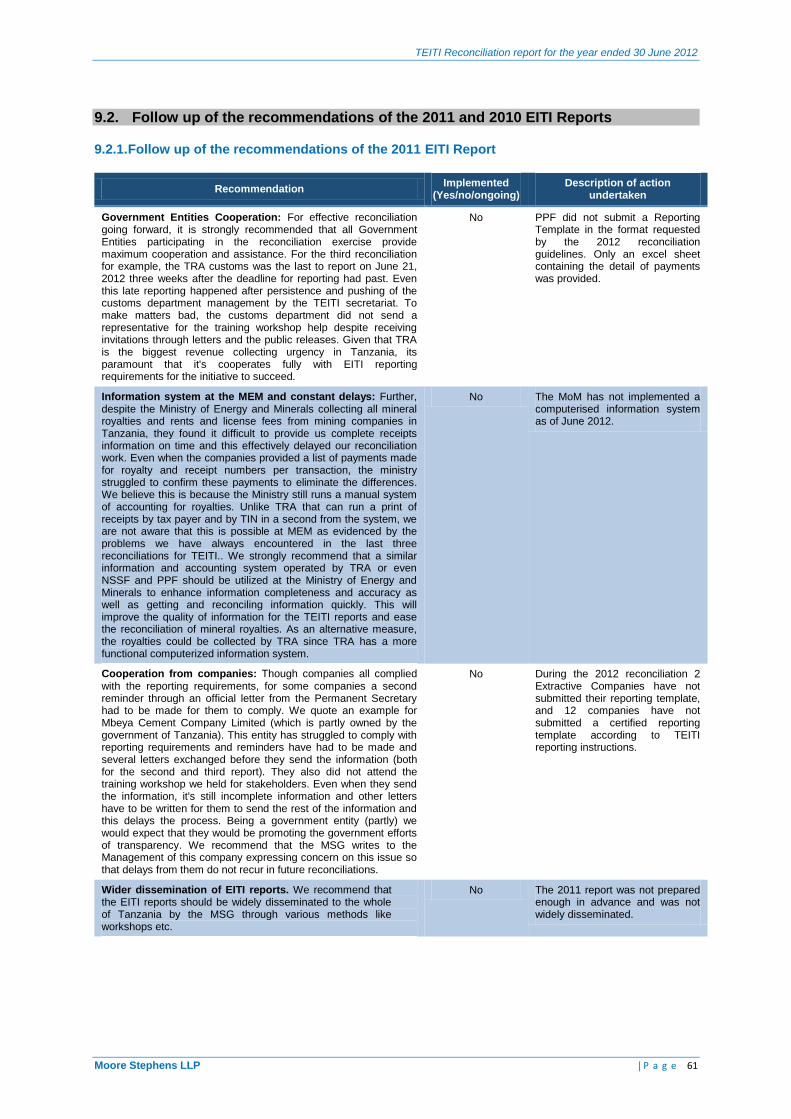
TEITI Reconciliation report for the year ended 30 June 2012
Moore Stephens LLP | P a g e 61
9.2. Follow up of the recommendations of the 2011 and 2010 EITI Reports
9.2.1. Follow up of the recommendations of the 2011 EITI Report
Recommendation Implemented
(Yes/no/ongoing) Description of action
undertaken
Government Entities Cooperation: For effective reconciliation going forward, it is strongly recommended that all Government Entities participating in the reconciliation exercise provide maximum cooperation and assistance. For the third reconciliation for example, the TRA customs was the last to report on June 21, 2012 three weeks after the deadline for reporting had past. Even this late reporting happened after persistence and pushing of the customs department management by the TEITI secretariat. To make matters bad, the customs department did not send a representative for the training workshop help despite receiving invitations through letters and the public releases. Given that TRA is the biggest revenue collecting urgency in Tanzania, its paramount that it's cooperates fully with EITI reporting requirements for the initiative to succeed.
No PPF did not submit a Reporting Template in the format requested by the 2012 reconciliation guidelines. Only an excel sheet containing the detail of payments was provided.
Information system at the MEM and constant delays: Further, despite the Ministry of Energy and Minerals collecting all mineral royalties and rents and license fees from mining companies in Tanzania, they found it difficult to provide us complete receipts information on time and this effectively delayed our reconciliation work. Even when the companies provided a list of payments made for royalty and receipt numbers per transaction, the ministry struggled to confirm these payments to eliminate the differences. We believe this is because the Ministry still runs a manual system of accounting for royalties. Unlike TRA that can run a print of receipts by tax payer and by TIN in a second from the system, we are not aware that this is possible at MEM as evidenced by the problems we have always encountered in the last three reconciliations for TEITI.. We strongly recommend that a similar information and accounting system operated by TRA or even NSSF and PPF should be utilized at the Ministry of Energy and Minerals to enhance information completeness and accuracy as well as getting and reconciling information quickly. This will improve the quality of information for the TEITI reports and ease the reconciliation of mineral royalties. As an alternative measure, the royalties could be collected by TRA since TRA has a more functional computerized information system.
No The MoM has not implemented a computerised information system as of June 2012.
Cooperation from companies: Though companies all complied with the reporting requirements, for some companies a second reminder through an official letter from the Permanent Secretary had to be made for them to comply. We quote an example for Mbeya Cement Company Limited (which is partly owned by the government of Tanzania). This entity has struggled to comply with reporting requirements and reminders have had to be made and several letters exchanged before they send the information (both for the second and third report). They also did not attend the training workshop we held for stakeholders. Even when they send the information, it's still incomplete information and other letters have to be written for them to send the rest of the information and this delays the process. Being a government entity (partly) we would expect that they would be promoting the government efforts of transparency. We recommend that the MSG writes to the Management of this company expressing concern on this issue so that delays from them do not recur in future reconciliations.
No During the 2012 reconciliation 2 Extractive Companies have not submitted their reporting template, and 12 companies have not submitted a certified reporting template according to TEITI reporting instructions.
Wider dissemination of EITI reports. We recommend that the EITI reports should be widely disseminated to the whole of Tanzania by the MSG through various methods like workshops etc.
No The 2011 report was not prepared enough in advance and was not widely disseminated.
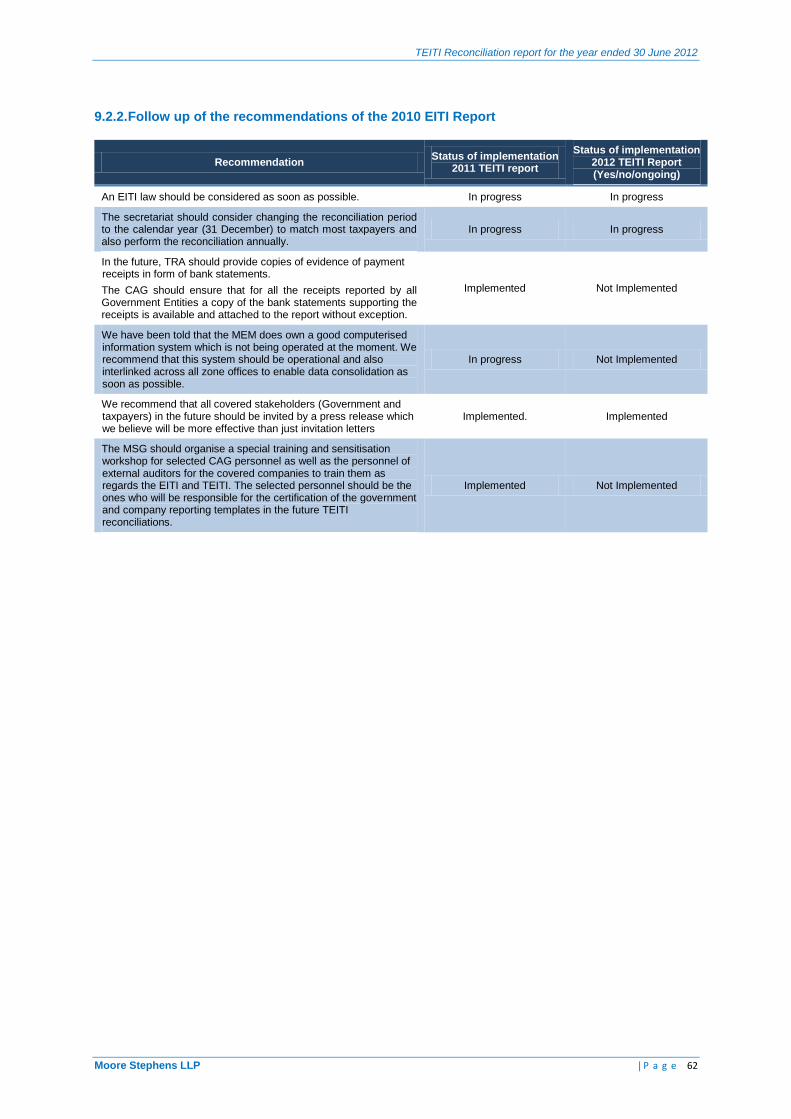
TEITI Reconciliation report for the year ended 30 June 2012
Moore Stephens LLP | P a g e 62
9.2.2. Follow up of the recommendations of the 2010 EITI Report
Recommendation Status of implementation
2011 TEITI report
Status of implementation 2012 TEITI Report (Yes/no/ongoing)
An EITI law should be considered as soon as possible. In progress In progress
The secretariat should consider changing the reconciliation period to the calendar year (31 December) to match most taxpayers and also perform the reconciliation annually.
In progress In progress
In the future, TRA should provide copies of evidence of payment receipts in form of bank statements.
The CAG should ensure that for all the receipts reported by all Government Entities a copy of the bank statements supporting the receipts is available and attached to the report without exception.
Implemented Not Implemented
We have been told that the MEM does own a good computerised information system which is not being operated at the moment. We recommend that this system should be operational and also interlinked across all zone offices to enable data consolidation as soon as possible.
In progress Not Implemented
We recommend that all covered stakeholders (Government and taxpayers) in the future should be invited by a press release which we believe will be more effective than just invitation letters
Implemented. Implemented
The MSG should organise a special training and sensitisation workshop for selected CAG personnel as well as the personnel of external auditors for the covered companies to train them as regards the EITI and TEITI. The selected personnel should be the ones who will be responsible for the certification of the government and company reporting templates in the future TEITI reconciliations.
Implemented Not Implemented
TEITI Reconciliation report for the year ended 30 June 2012
Moore Stephens LLP | P a g e 63
ANNEXES
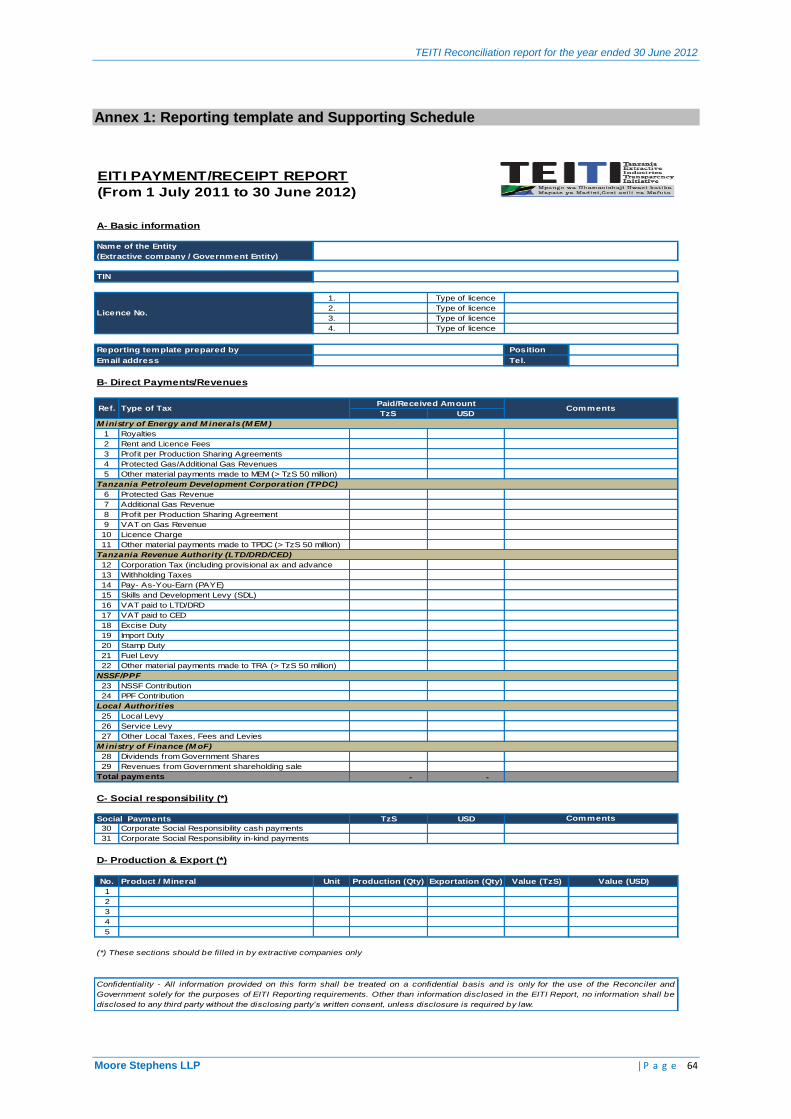
TEITI Reconciliation report for the year ended 30 June 2012
Moore Stephens LLP | P a g e 64
Annex 1: Reporting template and Supporting Schedule
EITI PAYMENT/RECEIPT REPORT
(From 1 July 2011 to 30 June 2012)
A- Basic information
1. Type of licence
2. Type of licence
3. Type of licence
4. Type of licence
Position
Tel.
B- Direct Payments/Revenues
TzS USD
1
2
3
4
5
6
7
8
9
10
11
12
13
14
15
16
17
18
19
20
21
22
23
24
25
26
27
28
29
- -
C- Social responsibility (*)
TzS USD
30
31
D- Production & Export (*)
No. Product / Mineral Unit Production (Qty) Exportation (Qty) Value (TzS) Value (USD)
1
2
3
4
5
(*) These sections should be filled in by extractive companies only
Total payments
Confidentiality - All information provided on this form shall be treated on a confidential basis and is only for the use of the Reconciler and
Government solely for the purposes of EITI Reporting requirements. Other than information disclosed in the EITI Report, no information shall be
disclosed to any third party without the disclosing party’s written consent, unless disclosure is required by law.
Other Local Taxes, Fees and Levies
Service Levy
Comments
Reporting template prepared by
Email address
Rent and Licence Fees
Ref.
Tanzania Revenue Authority (LTD/DRD/CED)
Corporation Tax (including provisional ax and advance
Withholding Taxes
Pay- As-You-Earn (PAYE)
Skills and Development Levy (SDL)
Import Duty
Stamp Duty
Revenues from Government shareholding sale
Royalties
Name of the Entity
(Extractive company / Government Entity)
TIN
Licence No.
Fuel Levy
Other material payments made to TRA (> TzS 50 million)
Local Authorities
Local Levy
Paid/Received Amount
VAT paid to LTD/DRD
VAT paid to CED
Protected Gas/Additional Gas Revenues
Excise Duty
Tanzania Petroleum Development Corporation (TPDC)
Type of Tax
Protected Gas Revenue
Additional Gas Revenue
VAT on Gas Revenue
Other material payments made to MEM (> TzS 50 million)
Profit per Production Sharing Agreements
M inistry of Energy and M inerals (M EM )
M inistry of Finance (M oF)
Dividends from Government Shares
Corporate Social Responsibility cash payments
Profit per Production Sharing Agreement
NSSF Contribution
Other material payments made to TPDC (> TzS 50 million)
PPF Contribution
NSSF/PPF
Social Payments
Corporate Social Responsibility in-kind payments
Comments
Licence Charge
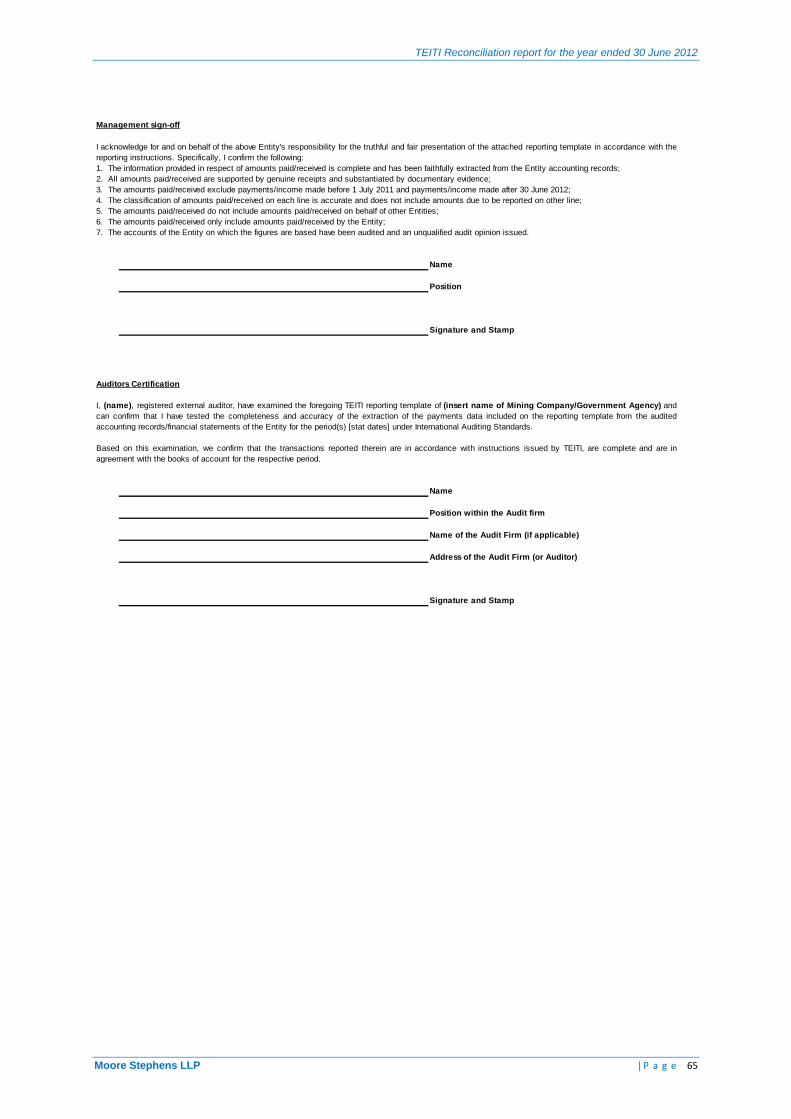
TEITI Reconciliation report for the year ended 30 June 2012
Moore Stephens LLP | P a g e 65
Name
Position
Signature and Stamp
Auditors Certification
Name
Position within the Audit firm
Name of the Audit Firm (if applicable)
Address of the Audit Firm (or Auditor)
Signature and Stamp
I, (name), registered external auditor, have examined the foregoing TEITI reporting template of (insert name of Mining Company/Government Agency) and
can confirm that I have tested the completeness and accuracy of the extraction of the payments data included on the reporting template from the audited
accounting records/financial statements of the Entity for the period(s) [stat dates] under International Auditing Standards.
Based on this examination, we confirm that the transactions reported therein are in accordance with instructions issued by TEITI, are complete and are in
agreement with the books of account for the respective period.
6. The amounts paid/received only include amounts paid/received by the Entity;
5. The amounts paid/received do not include amounts paid/received on behalf of other Entities;
I acknowledge for and on behalf of the above Entity's responsibility for the truthful and fair presentation of the attached reporting template in accordance with the
reporting instructions. Specifically, I confirm the following:
3. The amounts paid/received exclude payments/income made before 1 July 2011 and payments/income made after 30 June 2012;
4. The classification of amounts paid/received on each line is accurate and does not include amounts due to be reported on other line;
7. The accounts of the Entity on which the figures are based have been audited and an unqualified audit opinion issued.
2. All amounts paid/received are supported by genuine receipts and substantiated by documentary evidence;
Management sign-off
1. The information provided in respect of amounts paid/received is complete and has been faithfully extracted from the Entity accounting records;
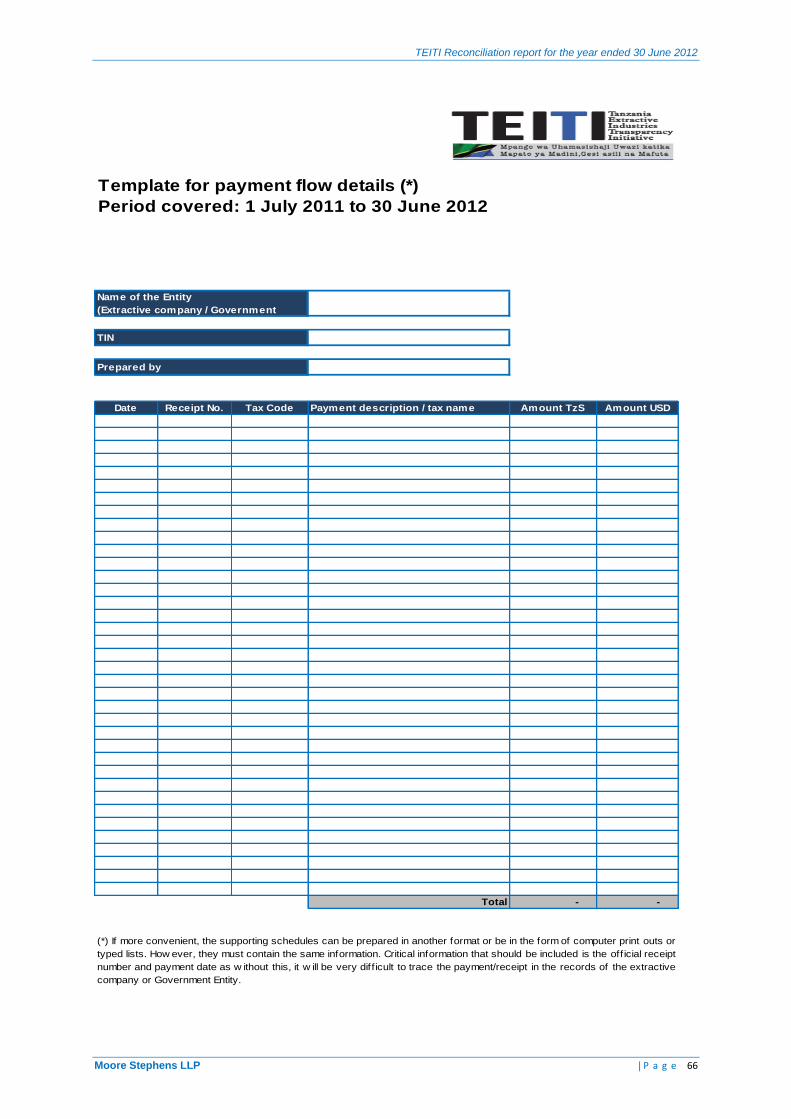
TEITI Reconciliation report for the year ended 30 June 2012
Moore Stephens LLP | P a g e 66
Template for payment flow details (*)
Period covered: 1 July 2011 to 30 June 2012
Date Receipt No. Tax Code Payment description / tax name Amount TzS Amount USD
Total - -
(*) If more convenient, the supporting schedules can be prepared in another format or be in the form of computer print outs or
typed lists. How ever, they must contain the same information. Critical information that should be included is the off icial receipt
number and payment date as w ithout this, it w ill be very diff icult to trace the payment/receipt in the records of the extractive
company or Government Entity.
Name of the Entity
(Extractive company / Government
TIN
Prepared by
TEITI Reconciliation report for the year ended 30 June 2012
Moore Stephens LLP | P a g e 67
Template for social payments details (*)
Period covered: 1 July 2011 to 30 June 2012
Date Type/kind of contributionLocation of
expenditurePaid to Amount TZS Amount USD
Total - -
(*) This template must be filled in by extractive companies only
Prepared by
TIN
Name of the Entity
TEITI Reconciliation report for the year ended 30 June 2012
Moore Stephens LLP | P a g e 68
Template for production details (*)
Period covered: 1 July 2011 to 30 June 2012
Date/month of
productionType/Quality of Mineral/Product Field/Licence Unit Quantity
Total - -
(*) This template must be filled in by extractive companies only
Prepared by
Name of the Entity
TIN
TEITI Reconciliation report for the year ended 30 June 2012
Moore Stephens LLP | P a g e 69
Template for exportation details (*)
Period covered: 1 July 2011 to 30 June 2012
Date/month of
exportationType/Quality of Minerlas Field/licence Unit Quantity
Value
(TzS)
Value
(USD)
Total - - -
(*) This template must be filled in by extractive companies only
Prepared by
Name of the Entity
TIN
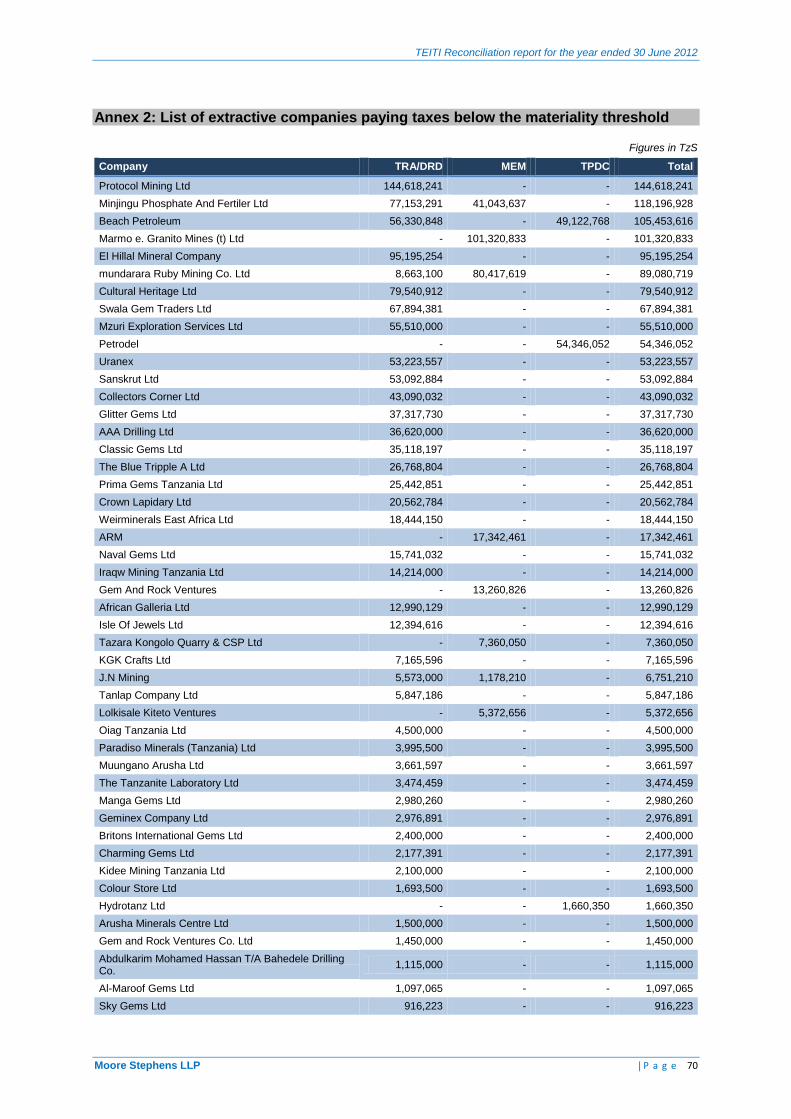
TEITI Reconciliation report for the year ended 30 June 2012
Moore Stephens LLP | P a g e 70
Annex 2: List of extractive companies paying taxes below the materiality threshold
Figures in TzS
Company TRA/DRD MEM TPDC Total
Protocol Mining Ltd 144,618,241 - - 144,618,241
Minjingu Phosphate And Fertiler Ltd 77,153,291 41,043,637 - 118,196,928
Beach Petroleum 56,330,848 - 49,122,768 105,453,616
Marmo e. Granito Mines (t) Ltd - 101,320,833 - 101,320,833
El Hillal Mineral Company 95,195,254 - - 95,195,254
mundarara Ruby Mining Co. Ltd 8,663,100 80,417,619 - 89,080,719
Cultural Heritage Ltd 79,540,912 - - 79,540,912
Swala Gem Traders Ltd 67,894,381 - - 67,894,381
Mzuri Exploration Services Ltd 55,510,000 - - 55,510,000
Petrodel - - 54,346,052 54,346,052
Uranex 53,223,557 - - 53,223,557
Sanskrut Ltd 53,092,884 - - 53,092,884
Collectors Corner Ltd 43,090,032 - - 43,090,032
Glitter Gems Ltd 37,317,730 - - 37,317,730
AAA Drilling Ltd 36,620,000 - - 36,620,000
Classic Gems Ltd 35,118,197 - - 35,118,197
The Blue Tripple A Ltd 26,768,804 - - 26,768,804
Prima Gems Tanzania Ltd 25,442,851 - - 25,442,851
Crown Lapidary Ltd 20,562,784 - - 20,562,784
Weirminerals East Africa Ltd 18,444,150 - - 18,444,150
ARM - 17,342,461 - 17,342,461
Naval Gems Ltd 15,741,032 - - 15,741,032
Iraqw Mining Tanzania Ltd 14,214,000 - - 14,214,000
Gem And Rock Ventures - 13,260,826 - 13,260,826
African Galleria Ltd 12,990,129 - - 12,990,129
Isle Of Jewels Ltd 12,394,616 - - 12,394,616
Tazara Kongolo Quarry & CSP Ltd - 7,360,050 - 7,360,050
KGK Crafts Ltd 7,165,596 - - 7,165,596
J.N Mining 5,573,000 1,178,210 - 6,751,210
Tanlap Company Ltd 5,847,186 - - 5,847,186
Lolkisale Kiteto Ventures - 5,372,656 - 5,372,656
Oiag Tanzania Ltd 4,500,000 - - 4,500,000
Paradiso Minerals (Tanzania) Ltd 3,995,500 - - 3,995,500
Muungano Arusha Ltd 3,661,597 - - 3,661,597
The Tanzanite Laboratory Ltd 3,474,459 - - 3,474,459
Manga Gems Ltd 2,980,260 - - 2,980,260
Geminex Company Ltd 2,976,891 - - 2,976,891
Britons International Gems Ltd 2,400,000 - - 2,400,000
Charming Gems Ltd 2,177,391 - - 2,177,391
Kidee Mining Tanzania Ltd 2,100,000 - - 2,100,000
Colour Store Ltd 1,693,500 - - 1,693,500
Hydrotanz Ltd - - 1,660,350 1,660,350
Arusha Minerals Centre Ltd 1,500,000 - - 1,500,000
Gem and Rock Ventures Co. Ltd 1,450,000 - - 1,450,000
Abdulkarim Mohamed Hassan T/A Bahedele Drilling Co.
1,115,000 - - 1,115,000
Al-Maroof Gems Ltd 1,097,065 - - 1,097,065
Sky Gems Ltd 916,223 - - 916,223
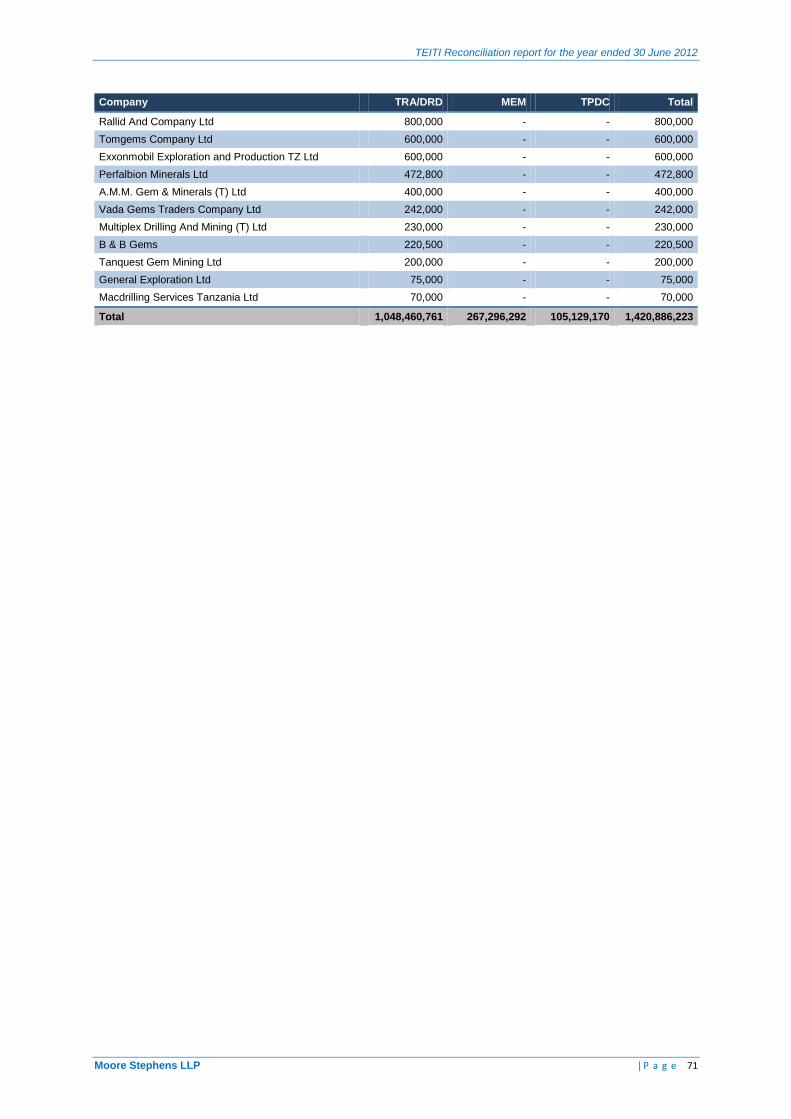
TEITI Reconciliation report for the year ended 30 June 2012
Moore Stephens LLP | P a g e 71
Company TRA/DRD MEM TPDC Total
Rallid And Company Ltd 800,000 - - 800,000
Tomgems Company Ltd 600,000 - - 600,000
Exxonmobil Exploration and Production TZ Ltd 600,000 - - 600,000
Perfalbion Minerals Ltd 472,800 - - 472,800
A.M.M. Gem & Minerals (T) Ltd 400,000 - - 400,000
Vada Gems Traders Company Ltd 242,000 - - 242,000
Multiplex Drilling And Mining (T) Ltd 230,000 - - 230,000
B & B Gems 220,500 - - 220,500
Tanquest Gem Mining Ltd 200,000 - - 200,000
General Exploration Ltd 75,000 - - 75,000
Macdrilling Services Tanzania Ltd 70,000 - - 70,000
Total 1,048,460,761 267,296,292 105,129,170 1,420,886,223
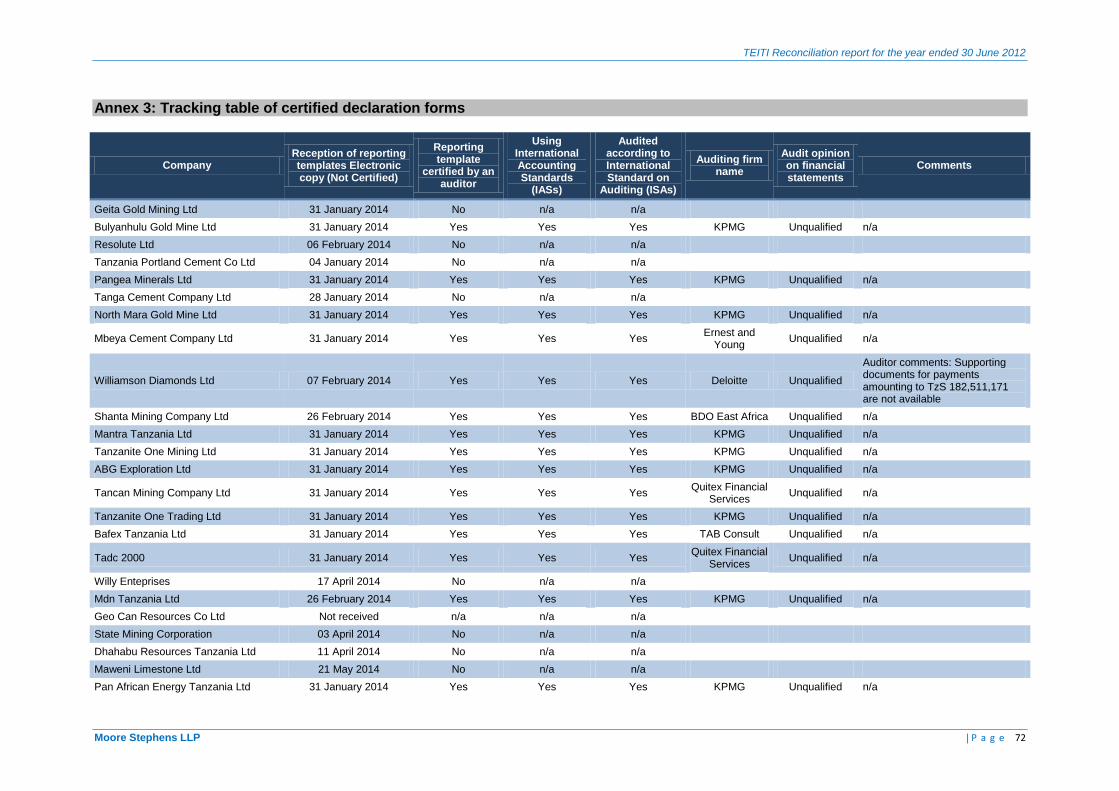
TEITI Reconciliation report for the year ended 30 June 2012
Moore Stephens LLP | P a g e 72
Annex 3: Tracking table of certified declaration forms
Company Reception of reporting templates Electronic copy (Not Certified)
Reporting template
certified by an auditor
Using International Accounting Standards
(IASs)
Audited according to International Standard on
Auditing (ISAs)
Auditing firm name
Audit opinion on financial statements
Comments
Geita Gold Mining Ltd 31 January 2014 No n/a n/a
Bulyanhulu Gold Mine Ltd 31 January 2014 Yes Yes Yes KPMG Unqualified n/a
Resolute Ltd 06 February 2014 No n/a n/a
Tanzania Portland Cement Co Ltd 04 January 2014 No n/a n/a
Pangea Minerals Ltd 31 January 2014 Yes Yes Yes KPMG Unqualified n/a
Tanga Cement Company Ltd 28 January 2014 No n/a n/a
North Mara Gold Mine Ltd 31 January 2014 Yes Yes Yes KPMG Unqualified n/a
Mbeya Cement Company Ltd 31 January 2014 Yes Yes Yes Ernest and
Young Unqualified n/a
Williamson Diamonds Ltd 07 February 2014 Yes Yes Yes Deloitte Unqualified
Auditor comments: Supporting documents for payments amounting to TzS 182,511,171 are not available
Shanta Mining Company Ltd 26 February 2014 Yes Yes Yes BDO East Africa Unqualified n/a
Mantra Tanzania Ltd 31 January 2014 Yes Yes Yes KPMG Unqualified n/a
Tanzanite One Mining Ltd 31 January 2014 Yes Yes Yes KPMG Unqualified n/a
ABG Exploration Ltd 31 January 2014 Yes Yes Yes KPMG Unqualified n/a
Tancan Mining Company Ltd 31 January 2014 Yes Yes Yes Quitex Financial
Services Unqualified n/a
Tanzanite One Trading Ltd 31 January 2014 Yes Yes Yes KPMG Unqualified n/a
Bafex Tanzania Ltd 31 January 2014 Yes Yes Yes TAB Consult Unqualified n/a
Tadc 2000 31 January 2014 Yes Yes Yes Quitex Financial
Services Unqualified n/a
Willy Enteprises 17 April 2014 No n/a n/a
Mdn Tanzania Ltd 26 February 2014 Yes Yes Yes KPMG Unqualified n/a
Geo Can Resources Co Ltd Not received n/a n/a n/a
State Mining Corporation 03 April 2014 No n/a n/a
Dhahabu Resources Tanzania Ltd 11 April 2014 No n/a n/a
Maweni Limestone Ltd 21 May 2014 No n/a n/a
Pan African Energy Tanzania Ltd 31 January 2014 Yes Yes Yes KPMG Unqualified n/a
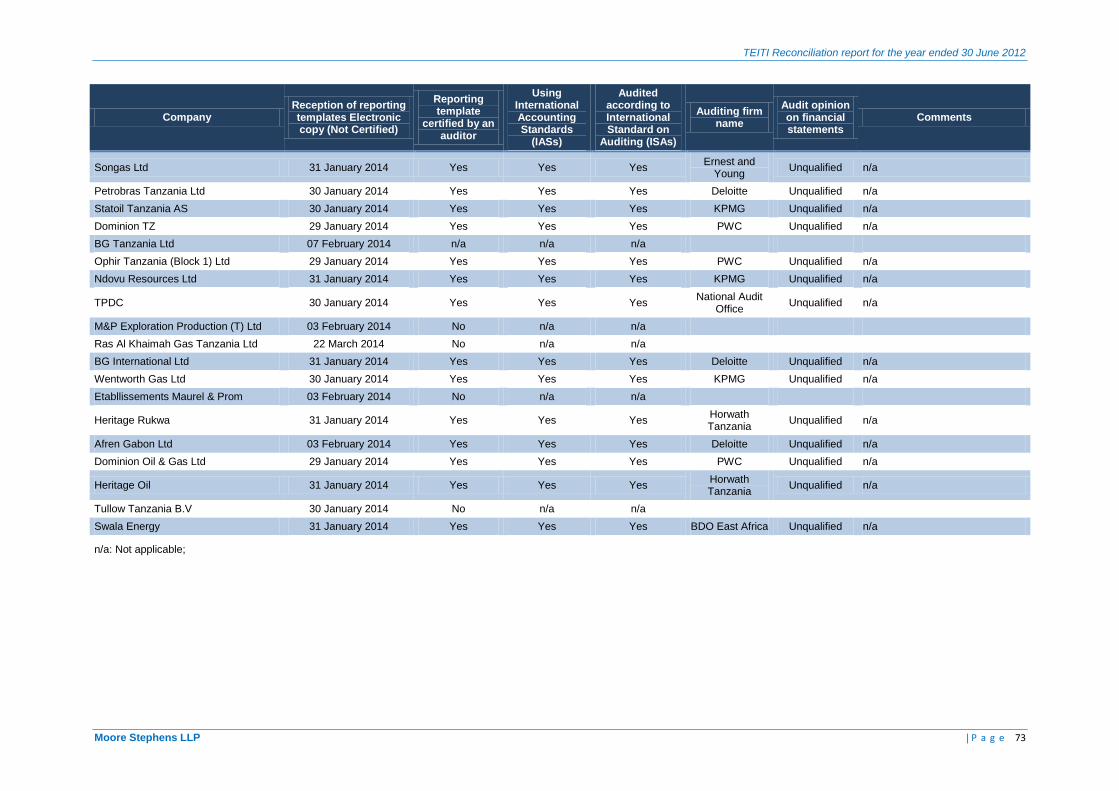
TEITI Reconciliation report for the year ended 30 June 2012
Moore Stephens LLP | P a g e 73
Company Reception of reporting templates Electronic copy (Not Certified)
Reporting template
certified by an auditor
Using International Accounting Standards
(IASs)
Audited according to International Standard on
Auditing (ISAs)
Auditing firm name
Audit opinion on financial statements
Comments
Songas Ltd 31 January 2014 Yes Yes Yes Ernest and
Young Unqualified n/a
Petrobras Tanzania Ltd 30 January 2014 Yes Yes Yes Deloitte Unqualified n/a
Statoil Tanzania AS 30 January 2014 Yes Yes Yes KPMG Unqualified n/a
Dominion TZ 29 January 2014 Yes Yes Yes PWC Unqualified n/a
BG Tanzania Ltd 07 February 2014 n/a n/a n/a
Ophir Tanzania (Block 1) Ltd 29 January 2014 Yes Yes Yes PWC Unqualified n/a
Ndovu Resources Ltd 31 January 2014 Yes Yes Yes KPMG Unqualified n/a
TPDC 30 January 2014 Yes Yes Yes National Audit
Office Unqualified n/a
M&P Exploration Production (T) Ltd 03 February 2014 No n/a n/a
Ras Al Khaimah Gas Tanzania Ltd 22 March 2014 No n/a n/a
BG International Ltd 31 January 2014 Yes Yes Yes Deloitte Unqualified n/a
Wentworth Gas Ltd 30 January 2014 Yes Yes Yes KPMG Unqualified n/a
Etabllissements Maurel & Prom 03 February 2014 No n/a n/a
Heritage Rukwa 31 January 2014 Yes Yes Yes Horwath Tanzania
Unqualified n/a
Afren Gabon Ltd 03 February 2014 Yes Yes Yes Deloitte Unqualified n/a
Dominion Oil & Gas Ltd 29 January 2014 Yes Yes Yes PWC Unqualified n/a
Heritage Oil 31 January 2014 Yes Yes Yes Horwath Tanzania
Unqualified n/a
Tullow Tanzania B.V 30 January 2014 No n/a n/a
Swala Energy 31 January 2014 Yes Yes Yes BDO East Africa Unqualified n/a
n/a: Not applicable;
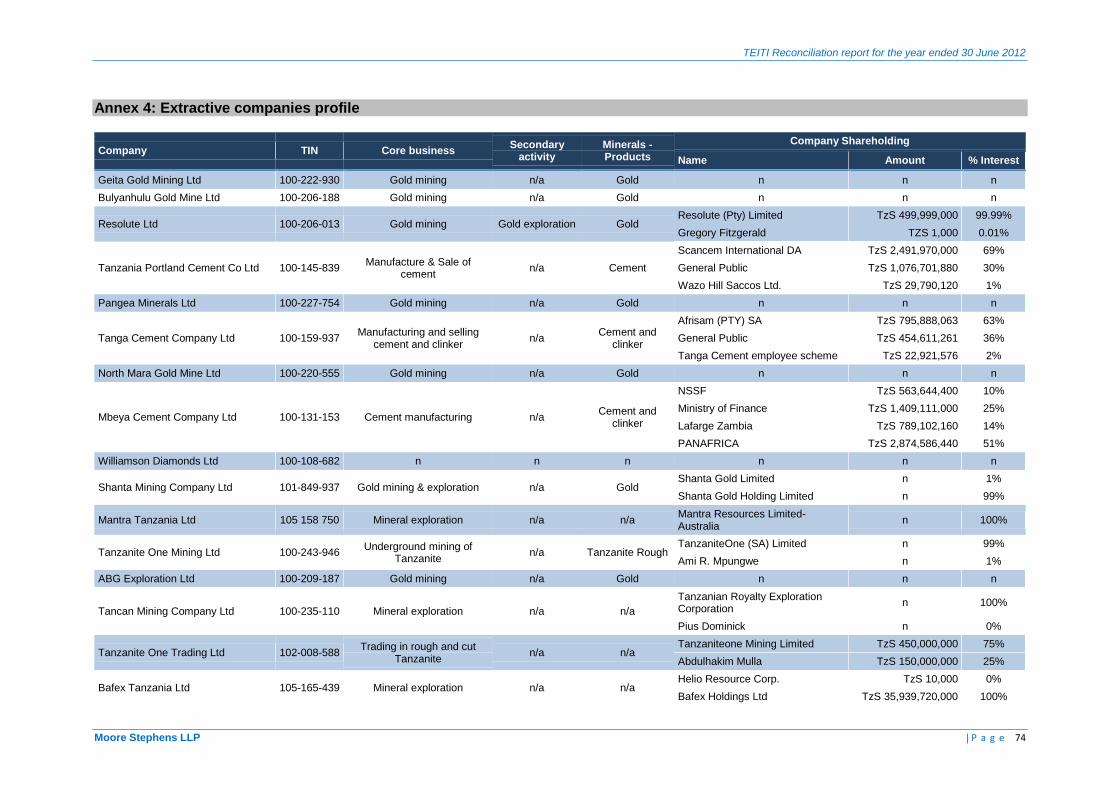
TEITI Reconciliation report for the year ended 30 June 2012
Moore Stephens LLP | P a g e 74
Annex 4: Extractive companies profile
Company TIN Core business Secondary
activity Minerals - Products
Company Shareholding
Name Amount % Interest
Geita Gold Mining Ltd 100-222-930 Gold mining n/a Gold n n n
Bulyanhulu Gold Mine Ltd 100-206-188 Gold mining n/a Gold n n n
Resolute Ltd 100-206-013 Gold mining Gold exploration Gold Resolute (Pty) Limited TzS 499,999,000 99.99%
Gregory Fitzgerald TZS 1,000 0.01%
Tanzania Portland Cement Co Ltd 100-145-839 Manufacture & Sale of
cement n/a Cement
Scancem International DA TzS 2,491,970,000 69%
General Public TzS 1,076,701,880 30%
Wazo Hill Saccos Ltd. TzS 29,790,120 1%
Pangea Minerals Ltd 100-227-754 Gold mining n/a Gold n n n
Tanga Cement Company Ltd 100-159-937 Manufacturing and selling
cement and clinker n/a
Cement and clinker
Afrisam (PTY) SA TzS 795,888,063 63%
General Public TzS 454,611,261 36%
Tanga Cement employee scheme TzS 22,921,576 2%
North Mara Gold Mine Ltd 100-220-555 Gold mining n/a Gold n n n
Mbeya Cement Company Ltd 100-131-153 Cement manufacturing n/a Cement and
clinker
NSSF TzS 563,644,400 10%
Ministry of Finance TzS 1,409,111,000 25%
Lafarge Zambia TzS 789,102,160 14%
PANAFRICA TzS 2,874,586,440 51%
Williamson Diamonds Ltd 100-108-682 n n n n n n
Shanta Mining Company Ltd 101-849-937 Gold mining & exploration n/a Gold Shanta Gold Limited n 1%
Shanta Gold Holding Limited n 99%
Mantra Tanzania Ltd 105 158 750 Mineral exploration n/a n/a Mantra Resources Limited-Australia
n 100%
Tanzanite One Mining Ltd 100-243-946 Underground mining of
Tanzanite n/a Tanzanite Rough
TanzaniteOne (SA) Limited n 99%
Ami R. Mpungwe n 1%
ABG Exploration Ltd 100-209-187 Gold mining n/a Gold n n n
Tancan Mining Company Ltd 100-235-110 Mineral exploration n/a n/a
Tanzanian Royalty Exploration Corporation
n 100%
Pius Dominick n 0%
Tanzanite One Trading Ltd 102-008-588 Trading in rough and cut
Tanzanite n/a n/a
Tanzaniteone Mining Limited TzS 450,000,000 75%
Abdulhakim Mulla TzS 150,000,000 25%
Bafex Tanzania Ltd 105-165-439 Mineral exploration n/a n/a Helio Resource Corp. TzS 10,000 0%
Bafex Holdings Ltd TzS 35,939,720,000 100%
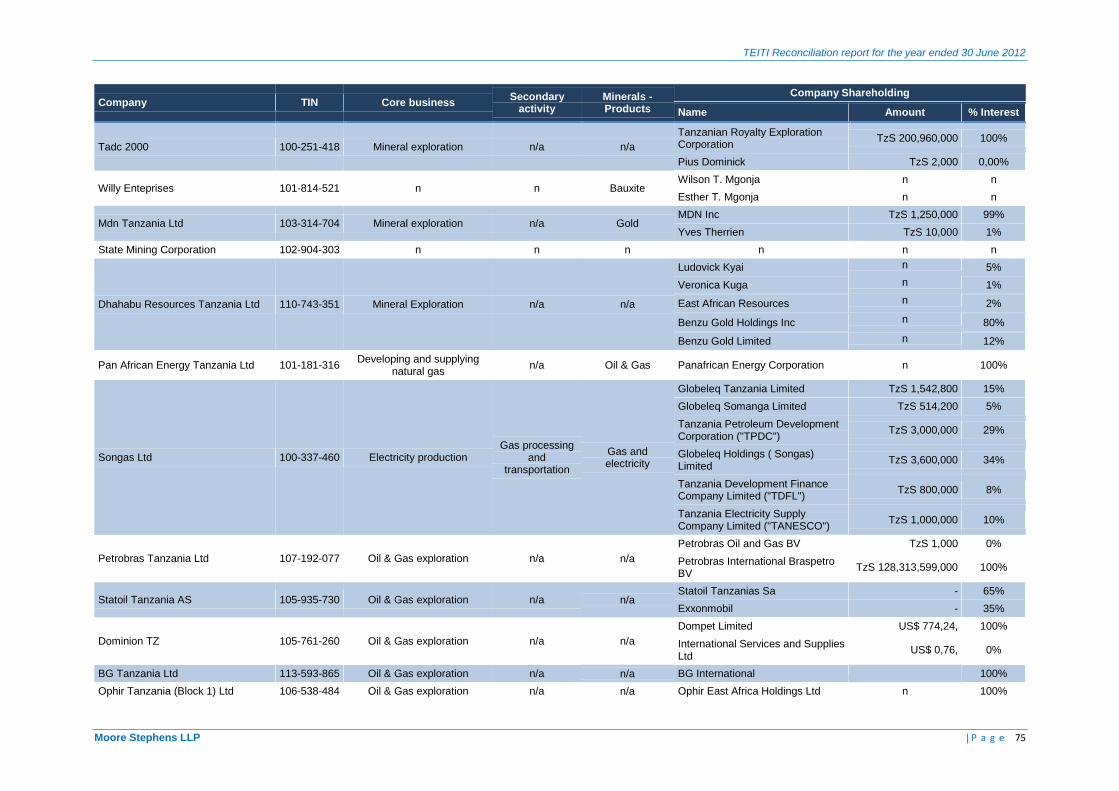
TEITI Reconciliation report for the year ended 30 June 2012
Moore Stephens LLP | P a g e 75
Company TIN Core business Secondary
activity Minerals - Products
Company Shareholding
Name Amount % Interest
Tadc 2000 100-251-418 Mineral exploration n/a n/a
Tanzanian Royalty Exploration Corporation
TzS 200,960,000 100%
Pius Dominick TzS 2,000 0,00%
Willy Enteprises 101-814-521 n n Bauxite Wilson T. Mgonja n n
Esther T. Mgonja n n
Mdn Tanzania Ltd 103-314-704 Mineral exploration n/a Gold MDN Inc TzS 1,250,000 99%
Yves Therrien TzS 10,000 1%
State Mining Corporation 102-904-303 n n n n n n
Dhahabu Resources Tanzania Ltd 110-743-351 Mineral Exploration n/a n/a
Ludovick Kyai n 5%
Veronica Kuga n 1%
East African Resources n 2%
Benzu Gold Holdings Inc n 80%
Benzu Gold Limited n 12%
Pan African Energy Tanzania Ltd 101-181-316 Developing and supplying
natural gas n/a Oil & Gas Panafrican Energy Corporation n 100%
Songas Ltd 100-337-460 Electricity production Gas processing
and transportation
Gas and electricity
Globeleq Tanzania Limited TzS 1,542,800 15%
Globeleq Somanga Limited TzS 514,200 5%
Tanzania Petroleum Development Corporation ("TPDC")
TzS 3,000,000 29%
Globeleq Holdings ( Songas) Limited
TzS 3,600,000 34%
Tanzania Development Finance Company Limited ("TDFL")
TzS 800,000 8%
Tanzania Electricity Supply Company Limited ("TANESCO")
TzS 1,000,000 10%
Petrobras Tanzania Ltd 107-192-077 Oil & Gas exploration n/a n/a Petrobras Oil and Gas BV TzS 1,000 0%
Petrobras International Braspetro BV
TzS 128,313,599,000 100%
Statoil Tanzania AS 105-935-730 Oil & Gas exploration n/a n/a Statoil Tanzanias Sa - 65%
Exxonmobil - 35%
Dominion TZ 105-761-260 Oil & Gas exploration n/a n/a Dompet Limited US$ 774,24, 100%
International Services and Supplies Ltd
US$ 0,76, 0%
BG Tanzania Ltd 113-593-865 Oil & Gas exploration n/a n/a BG International
100%
Ophir Tanzania (Block 1) Ltd 106-538-484 Oil & Gas exploration n/a n/a Ophir East Africa Holdings Ltd n 100%
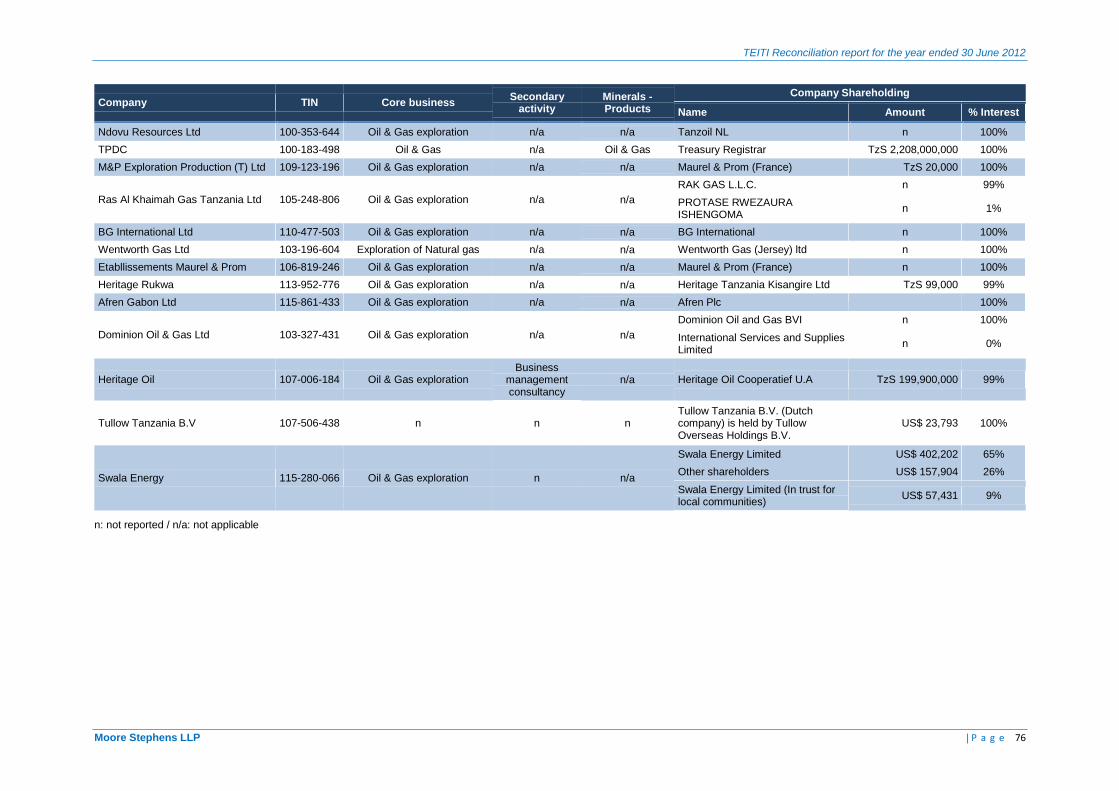
TEITI Reconciliation report for the year ended 30 June 2012
Moore Stephens LLP | P a g e 76
Company TIN Core business Secondary
activity Minerals - Products
Company Shareholding
Name Amount % Interest
Ndovu Resources Ltd 100-353-644 Oil & Gas exploration n/a n/a Tanzoil NL n 100%
TPDC 100-183-498 Oil & Gas n/a Oil & Gas Treasury Registrar TzS 2,208,000,000 100%
M&P Exploration Production (T) Ltd 109-123-196 Oil & Gas exploration n/a n/a Maurel & Prom (France) TzS 20,000 100%
Ras Al Khaimah Gas Tanzania Ltd 105-248-806 Oil & Gas exploration n/a n/a RAK GAS L.L.C. n 99%
PROTASE RWEZAURA ISHENGOMA
n 1%
BG International Ltd 110-477-503 Oil & Gas exploration n/a n/a BG International n 100%
Wentworth Gas Ltd 103-196-604 Exploration of Natural gas n/a n/a Wentworth Gas (Jersey) ltd n 100%
Etabllissements Maurel & Prom 106-819-246 Oil & Gas exploration n/a n/a Maurel & Prom (France) n 100%
Heritage Rukwa 113-952-776 Oil & Gas exploration n/a n/a Heritage Tanzania Kisangire Ltd TzS 99,000 99%
Afren Gabon Ltd 115-861-433 Oil & Gas exploration n/a n/a Afren Plc
100%
Dominion Oil & Gas Ltd 103-327-431 Oil & Gas exploration n/a n/a Dominion Oil and Gas BVI n 100%
International Services and Supplies Limited
n 0%
Heritage Oil 107-006-184 Oil & Gas exploration Business
management consultancy
n/a Heritage Oil Cooperatief U.A TzS 199,900,000 99%
Tullow Tanzania B.V 107-506-438 n n n Tullow Tanzania B.V. (Dutch company) is held by Tullow Overseas Holdings B.V.
US$ 23,793 100%
Swala Energy 115-280-066 Oil & Gas exploration n n/a
Swala Energy Limited US$ 402,202 65%
Other shareholders US$ 157,904 26%
Swala Energy Limited (In trust for local communities)
US$ 57,431 9%
n: not reported / n/a: not applicable
TEITI Reconciliation report for the year ended 30 June 2012
Moore Stephens LLP | P a g e 77
Annex 5: Reconciliation sheets by company
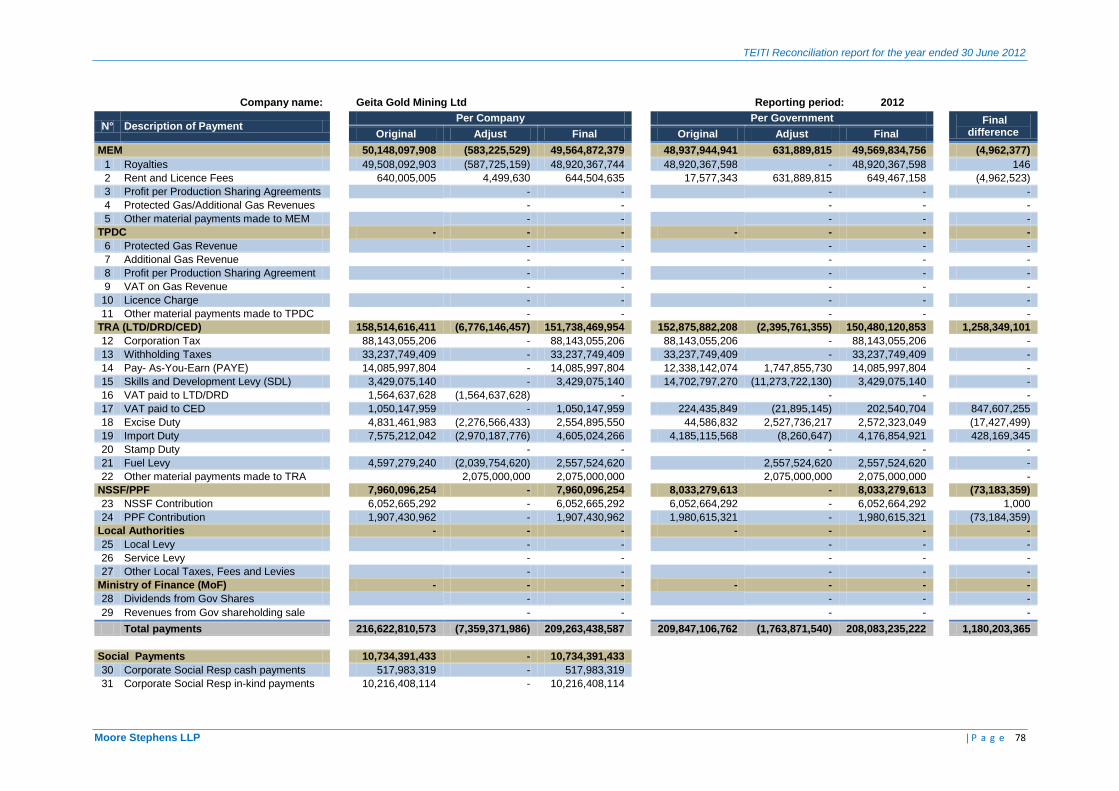
TEITI Reconciliation report for the year ended 30 June 2012
Moore Stephens LLP | P a g e 78
Company name:
Geita Gold Mining Ltd
Reporting period: 2012
N° Description of Payment Per Company
Per Government
Final difference
Original Adjust Final
Original Adjust Final
MEM
50,148,097,908 (583,225,529) 49,564,872,379
48,937,944,941 631,889,815 49,569,834,756
(4,962,377)
1 Royalties
49,508,092,903 (587,725,159) 48,920,367,744
48,920,367,598 - 48,920,367,598
146
2 Rent and Licence Fees
640,005,005 4,499,630 644,504,635
17,577,343 631,889,815 649,467,158
(4,962,523)
3 Profit per Production Sharing Agreements
- -
- -
-
4 Protected Gas/Additional Gas Revenues
- -
- -
-
5 Other material payments made to MEM
- -
- -
-
TPDC
- - -
- - -
-
6 Protected Gas Revenue
- -
- -
-
7 Additional Gas Revenue
- -
- -
-
8 Profit per Production Sharing Agreement
- -
- -
-
9 VAT on Gas Revenue
- -
- -
-
10 Licence Charge
- -
- -
-
11 Other material payments made to TPDC
- -
- -
-
TRA (LTD/DRD/CED)
158,514,616,411 (6,776,146,457) 151,738,469,954
152,875,882,208 (2,395,761,355) 150,480,120,853
1,258,349,101
12 Corporation Tax
88,143,055,206 - 88,143,055,206
88,143,055,206 - 88,143,055,206
-
13 Withholding Taxes
33,237,749,409 - 33,237,749,409
33,237,749,409 - 33,237,749,409
-
14 Pay- As-You-Earn (PAYE)
14,085,997,804 - 14,085,997,804
12,338,142,074 1,747,855,730 14,085,997,804
-
15 Skills and Development Levy (SDL)
3,429,075,140 - 3,429,075,140
14,702,797,270 (11,273,722,130) 3,429,075,140
-
16 VAT paid to LTD/DRD
1,564,637,628 (1,564,637,628) -
- -
-
17 VAT paid to CED
1,050,147,959 - 1,050,147,959
224,435,849 (21,895,145) 202,540,704
847,607,255
18 Excise Duty
4,831,461,983 (2,276,566,433) 2,554,895,550
44,586,832 2,527,736,217 2,572,323,049
(17,427,499)
19 Import Duty
7,575,212,042 (2,970,187,776) 4,605,024,266
4,185,115,568 (8,260,647) 4,176,854,921
428,169,345
20 Stamp Duty
- -
- -
-
21 Fuel Levy
4,597,279,240 (2,039,754,620) 2,557,524,620
2,557,524,620 2,557,524,620
-
22 Other material payments made to TRA
2,075,000,000 2,075,000,000
2,075,000,000 2,075,000,000
-
NSSF/PPF
7,960,096,254 - 7,960,096,254
8,033,279,613 - 8,033,279,613
(73,183,359)
23 NSSF Contribution
6,052,665,292 - 6,052,665,292
6,052,664,292 - 6,052,664,292
1,000
24 PPF Contribution
1,907,430,962 - 1,907,430,962
1,980,615,321 - 1,980,615,321
(73,184,359)
Local Authorities
- - -
- - -
-
25 Local Levy
- -
- -
-
26 Service Levy
- -
- -
-
27 Other Local Taxes, Fees and Levies
- -
- -
-
Ministry of Finance (MoF)
- - -
- - -
-
28 Dividends from Gov Shares
- -
- -
-
29 Revenues from Gov shareholding sale
- -
- -
-
Total payments
216,622,810,573 (7,359,371,986) 209,263,438,587
209,847,106,762 (1,763,871,540) 208,083,235,222
1,180,203,365
Social Payments
10,734,391,433 - 10,734,391,433
30 Corporate Social Resp cash payments
517,983,319 - 517,983,319
31 Corporate Social Resp in-kind payments
10,216,408,114 - 10,216,408,114
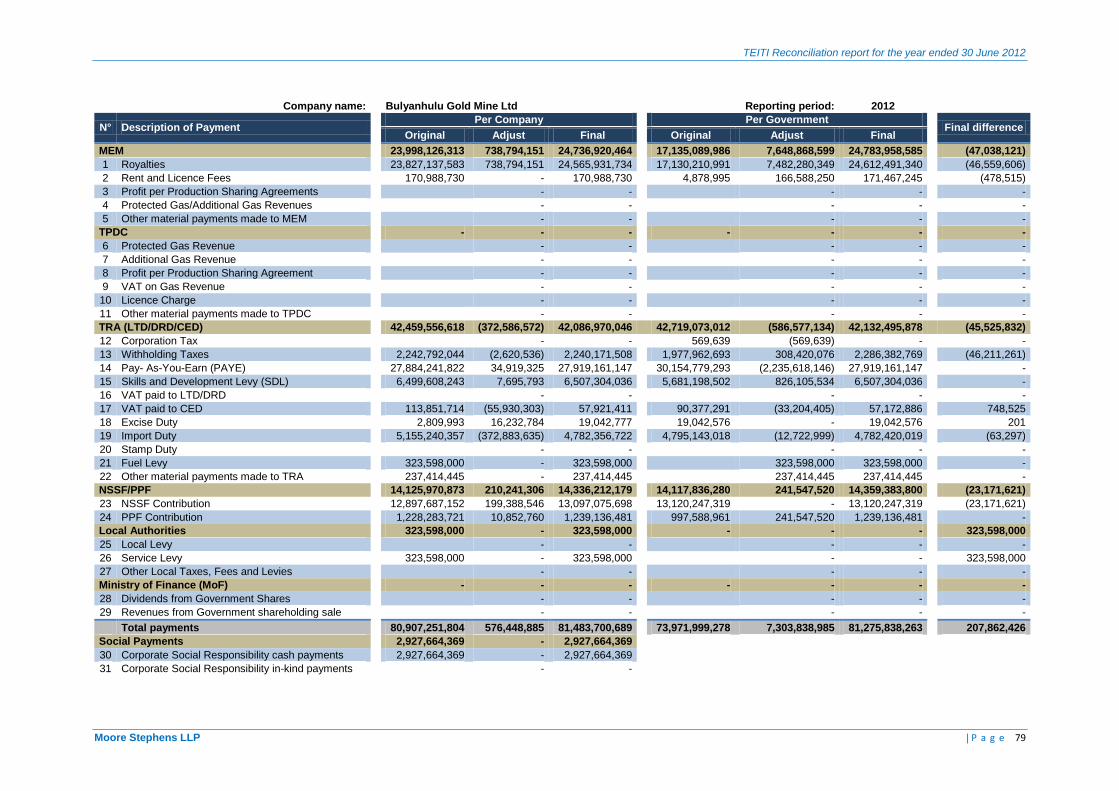
TEITI Reconciliation report for the year ended 30 June 2012
Moore Stephens LLP | P a g e 79
Company name:
Bulyanhulu Gold Mine Ltd
Reporting period: 2012
N° Description of Payment Per Company
Per Government
Final difference
Original Adjust Final
Original Adjust Final
MEM
23,998,126,313 738,794,151 24,736,920,464
17,135,089,986 7,648,868,599 24,783,958,585
(47,038,121)
1 Royalties
23,827,137,583 738,794,151 24,565,931,734
17,130,210,991 7,482,280,349 24,612,491,340
(46,559,606)
2 Rent and Licence Fees
170,988,730 - 170,988,730
4,878,995 166,588,250 171,467,245
(478,515)
3 Profit per Production Sharing Agreements
- -
- -
-
4 Protected Gas/Additional Gas Revenues
- -
- -
-
5 Other material payments made to MEM
- -
- -
-
TPDC
- - -
- - -
-
6 Protected Gas Revenue
- -
- -
-
7 Additional Gas Revenue
- -
- -
-
8 Profit per Production Sharing Agreement
- -
- -
-
9 VAT on Gas Revenue
- -
- -
-
10 Licence Charge
- -
- -
-
11 Other material payments made to TPDC
- -
- -
-
TRA (LTD/DRD/CED)
42,459,556,618 (372,586,572) 42,086,970,046
42,719,073,012 (586,577,134) 42,132,495,878
(45,525,832)
12 Corporation Tax
- -
569,639 (569,639) -
-
13 Withholding Taxes
2,242,792,044 (2,620,536) 2,240,171,508
1,977,962,693 308,420,076 2,286,382,769
(46,211,261)
14 Pay- As-You-Earn (PAYE)
27,884,241,822 34,919,325 27,919,161,147
30,154,779,293 (2,235,618,146) 27,919,161,147
-
15 Skills and Development Levy (SDL)
6,499,608,243 7,695,793 6,507,304,036
5,681,198,502 826,105,534 6,507,304,036
-
16 VAT paid to LTD/DRD
- -
- -
-
17 VAT paid to CED
113,851,714 (55,930,303) 57,921,411
90,377,291 (33,204,405) 57,172,886
748,525
18 Excise Duty
2,809,993 16,232,784 19,042,777
19,042,576 - 19,042,576
201
19 Import Duty
5,155,240,357 (372,883,635) 4,782,356,722
4,795,143,018 (12,722,999) 4,782,420,019
(63,297)
20 Stamp Duty
- -
- -
-
21 Fuel Levy
323,598,000 - 323,598,000
323,598,000 323,598,000
-
22 Other material payments made to TRA
237,414,445 - 237,414,445
237,414,445 237,414,445
-
NSSF/PPF
14,125,970,873 210,241,306 14,336,212,179
14,117,836,280 241,547,520 14,359,383,800
(23,171,621)
23 NSSF Contribution
12,897,687,152 199,388,546 13,097,075,698
13,120,247,319 - 13,120,247,319
(23,171,621)
24 PPF Contribution
1,228,283,721 10,852,760 1,239,136,481
997,588,961 241,547,520 1,239,136,481
-
Local Authorities
323,598,000 - 323,598,000
- - -
323,598,000
25 Local Levy
- -
- -
-
26 Service Levy
323,598,000 - 323,598,000
- -
323,598,000
27 Other Local Taxes, Fees and Levies
- -
- -
-
Ministry of Finance (MoF)
- - -
- - -
-
28 Dividends from Government Shares
- -
- -
-
29 Revenues from Government shareholding sale
- -
- -
-
Total payments
80,907,251,804 576,448,885 81,483,700,689
73,971,999,278 7,303,838,985 81,275,838,263
207,862,426
Social Payments
2,927,664,369 - 2,927,664,369
30 Corporate Social Responsibility cash payments
2,927,664,369 - 2,927,664,369
31 Corporate Social Responsibility in-kind payments
- -
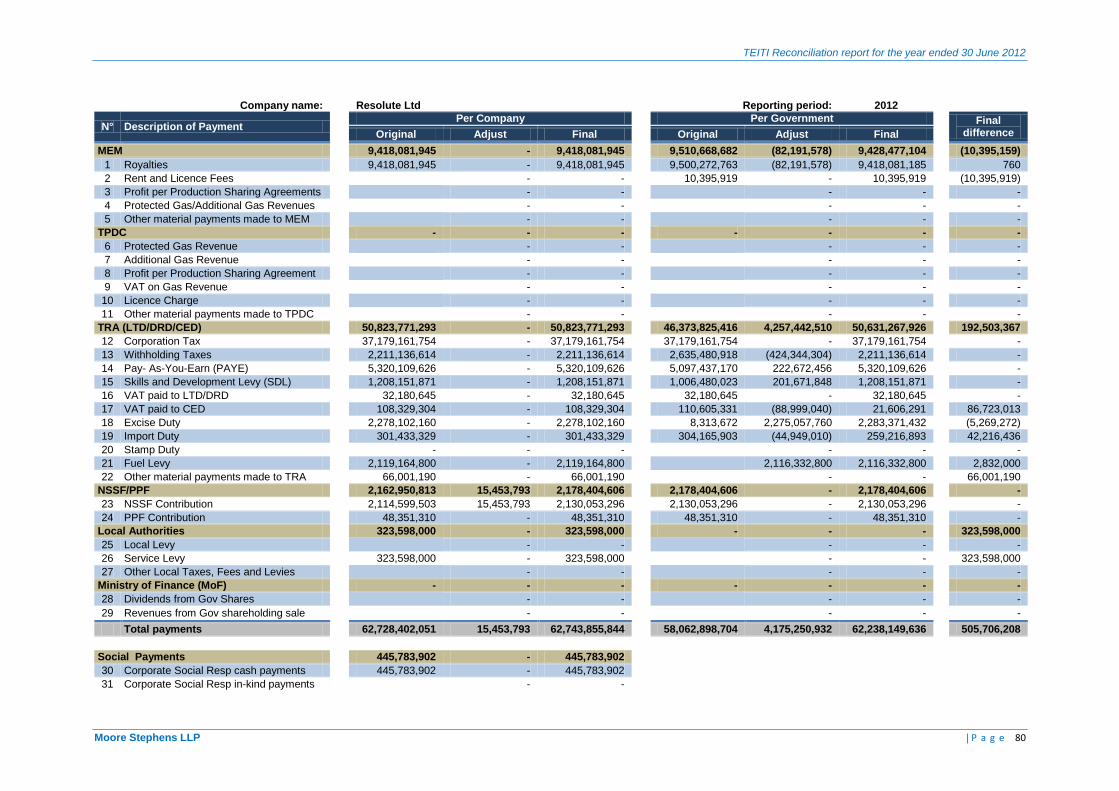
TEITI Reconciliation report for the year ended 30 June 2012
Moore Stephens LLP | P a g e 80
Company name:
Resolute Ltd
Reporting period: 2012
N° Description of Payment Per Company
Per Government
Final difference
Original Adjust Final
Original Adjust Final
MEM
9,418,081,945 - 9,418,081,945
9,510,668,682 (82,191,578) 9,428,477,104
(10,395,159)
1 Royalties
9,418,081,945 - 9,418,081,945
9,500,272,763 (82,191,578) 9,418,081,185
760
2 Rent and Licence Fees
- -
10,395,919 - 10,395,919
(10,395,919)
3 Profit per Production Sharing Agreements
- -
- -
-
4 Protected Gas/Additional Gas Revenues
- -
- -
-
5 Other material payments made to MEM
- -
- -
-
TPDC
- - -
- - -
-
6 Protected Gas Revenue
- -
- -
-
7 Additional Gas Revenue
- -
- -
-
8 Profit per Production Sharing Agreement
- -
- -
-
9 VAT on Gas Revenue
- -
- -
-
10 Licence Charge
- -
- -
-
11 Other material payments made to TPDC
- -
- -
-
TRA (LTD/DRD/CED)
50,823,771,293 - 50,823,771,293
46,373,825,416 4,257,442,510 50,631,267,926
192,503,367
12 Corporation Tax
37,179,161,754 - 37,179,161,754
37,179,161,754 - 37,179,161,754
-
13 Withholding Taxes
2,211,136,614 - 2,211,136,614
2,635,480,918 (424,344,304) 2,211,136,614
-
14 Pay- As-You-Earn (PAYE)
5,320,109,626 - 5,320,109,626
5,097,437,170 222,672,456 5,320,109,626
-
15 Skills and Development Levy (SDL)
1,208,151,871 - 1,208,151,871
1,006,480,023 201,671,848 1,208,151,871
-
16 VAT paid to LTD/DRD
32,180,645 - 32,180,645
32,180,645 - 32,180,645
-
17 VAT paid to CED
108,329,304 - 108,329,304
110,605,331 (88,999,040) 21,606,291
86,723,013
18 Excise Duty
2,278,102,160 - 2,278,102,160
8,313,672 2,275,057,760 2,283,371,432
(5,269,272)
19 Import Duty
301,433,329 - 301,433,329
304,165,903 (44,949,010) 259,216,893
42,216,436
20 Stamp Duty
- - -
- -
-
21 Fuel Levy
2,119,164,800 - 2,119,164,800
2,116,332,800 2,116,332,800
2,832,000
22 Other material payments made to TRA
66,001,190 - 66,001,190
- -
66,001,190
NSSF/PPF
2,162,950,813 15,453,793 2,178,404,606
2,178,404,606 - 2,178,404,606
-
23 NSSF Contribution
2,114,599,503 15,453,793 2,130,053,296
2,130,053,296 - 2,130,053,296
-
24 PPF Contribution
48,351,310 - 48,351,310
48,351,310 - 48,351,310
-
Local Authorities
323,598,000 - 323,598,000
- - -
323,598,000
25 Local Levy
- -
- -
-
26 Service Levy
323,598,000 - 323,598,000
- -
323,598,000
27 Other Local Taxes, Fees and Levies
- -
- -
-
Ministry of Finance (MoF)
- - -
- - -
-
28 Dividends from Gov Shares
- -
- -
-
29 Revenues from Gov shareholding sale
- -
- -
-
Total payments
62,728,402,051 15,453,793 62,743,855,844
58,062,898,704 4,175,250,932 62,238,149,636
505,706,208
Social Payments
445,783,902 - 445,783,902
30 Corporate Social Resp cash payments
445,783,902 - 445,783,902
31 Corporate Social Resp in-kind payments
- -
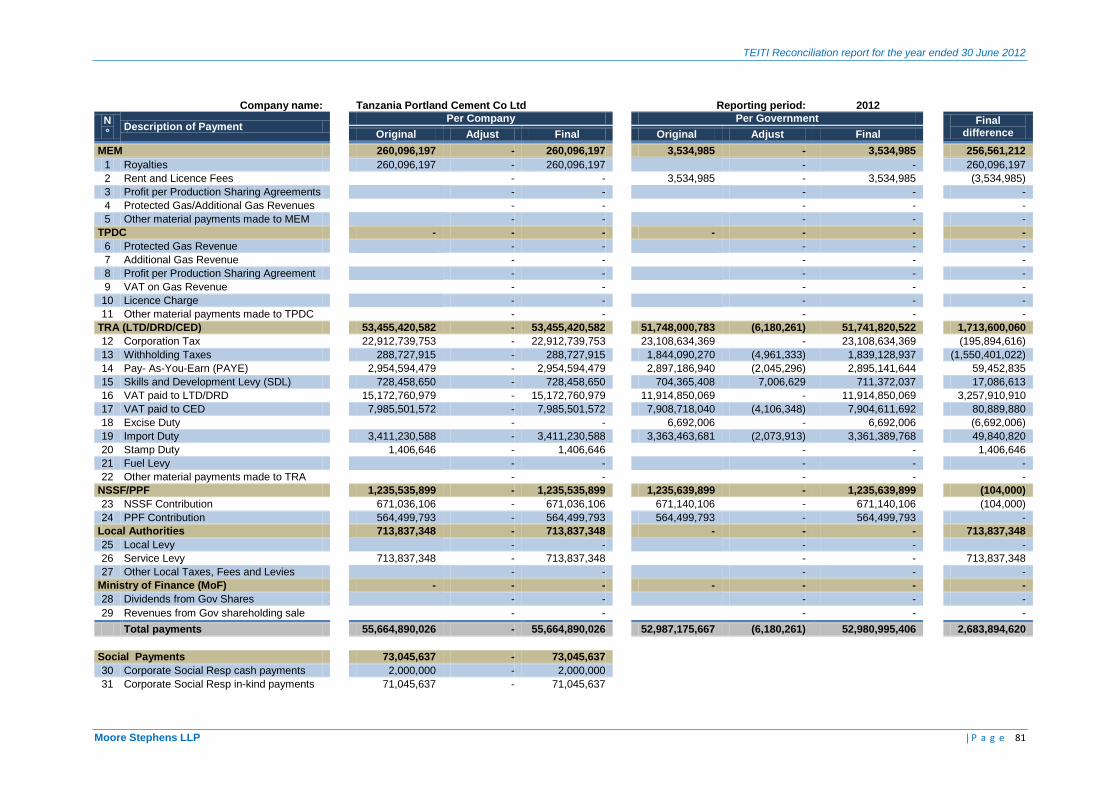
TEITI Reconciliation report for the year ended 30 June 2012
Moore Stephens LLP | P a g e 81
Company name:
Tanzania Portland Cement Co Ltd
Reporting period: 2012
N°
Description of Payment Per Company
Per Government
Final difference
Original Adjust Final
Original Adjust Final
MEM
260,096,197 - 260,096,197
3,534,985 - 3,534,985
256,561,212
1 Royalties
260,096,197 - 260,096,197
- -
260,096,197
2 Rent and Licence Fees
- -
3,534,985 - 3,534,985
(3,534,985)
3 Profit per Production Sharing Agreements
- -
- -
-
4 Protected Gas/Additional Gas Revenues
- -
- -
-
5 Other material payments made to MEM
- -
- -
-
TPDC
- - -
- - -
-
6 Protected Gas Revenue
- -
- -
-
7 Additional Gas Revenue
- -
- -
-
8 Profit per Production Sharing Agreement
- -
- -
-
9 VAT on Gas Revenue
- -
- -
-
10 Licence Charge
- -
- -
-
11 Other material payments made to TPDC
- -
- -
-
TRA (LTD/DRD/CED)
53,455,420,582 - 53,455,420,582
51,748,000,783 (6,180,261) 51,741,820,522
1,713,600,060
12 Corporation Tax
22,912,739,753 - 22,912,739,753
23,108,634,369 - 23,108,634,369
(195,894,616)
13 Withholding Taxes
288,727,915 - 288,727,915
1,844,090,270 (4,961,333) 1,839,128,937
(1,550,401,022)
14 Pay- As-You-Earn (PAYE)
2,954,594,479 - 2,954,594,479
2,897,186,940 (2,045,296) 2,895,141,644
59,452,835
15 Skills and Development Levy (SDL)
728,458,650 - 728,458,650
704,365,408 7,006,629 711,372,037
17,086,613
16 VAT paid to LTD/DRD
15,172,760,979 - 15,172,760,979
11,914,850,069 - 11,914,850,069
3,257,910,910
17 VAT paid to CED
7,985,501,572 - 7,985,501,572
7,908,718,040 (4,106,348) 7,904,611,692
80,889,880
18 Excise Duty
- -
6,692,006 - 6,692,006
(6,692,006)
19 Import Duty
3,411,230,588 - 3,411,230,588
3,363,463,681 (2,073,913) 3,361,389,768
49,840,820
20 Stamp Duty
1,406,646 - 1,406,646
- -
1,406,646
21 Fuel Levy
- -
- -
-
22 Other material payments made to TRA
- -
- -
-
NSSF/PPF
1,235,535,899 - 1,235,535,899
1,235,639,899 - 1,235,639,899
(104,000)
23 NSSF Contribution
671,036,106 - 671,036,106
671,140,106 - 671,140,106
(104,000)
24 PPF Contribution
564,499,793 - 564,499,793
564,499,793 - 564,499,793
-
Local Authorities
713,837,348 - 713,837,348
- - -
713,837,348
25 Local Levy
- -
- -
-
26 Service Levy
713,837,348 - 713,837,348
- -
713,837,348
27 Other Local Taxes, Fees and Levies
- -
- -
-
Ministry of Finance (MoF)
- - -
- - -
-
28 Dividends from Gov Shares
- -
- -
-
29 Revenues from Gov shareholding sale
- -
- -
-
Total payments
55,664,890,026 - 55,664,890,026
52,987,175,667 (6,180,261) 52,980,995,406
2,683,894,620
Social Payments
73,045,637 - 73,045,637
30 Corporate Social Resp cash payments
2,000,000 - 2,000,000
31 Corporate Social Resp in-kind payments
71,045,637 - 71,045,637
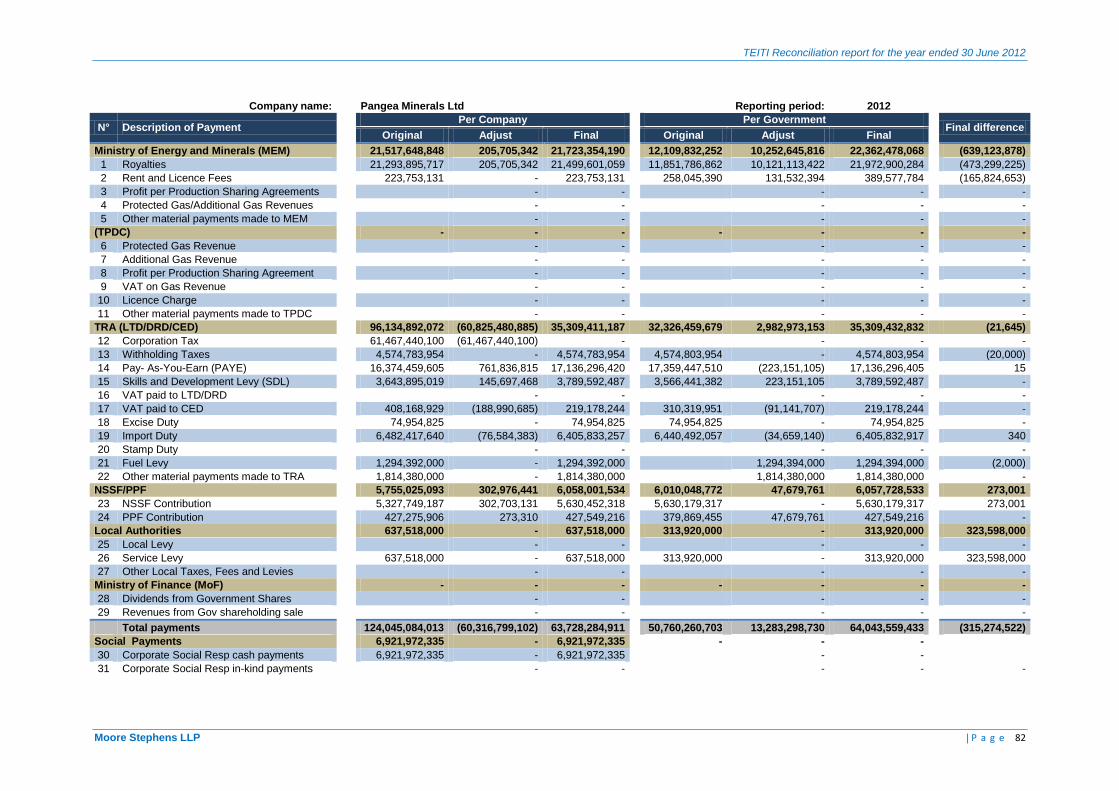
TEITI Reconciliation report for the year ended 30 June 2012
Moore Stephens LLP | P a g e 82
Company name:
Pangea Minerals Ltd
Reporting period: 2012
N° Description of Payment Per Company
Per Government
Final difference
Original Adjust Final
Original Adjust Final
Ministry of Energy and Minerals (MEM)
21,517,648,848 205,705,342 21,723,354,190
12,109,832,252 10,252,645,816 22,362,478,068
(639,123,878)
1 Royalties
21,293,895,717 205,705,342 21,499,601,059
11,851,786,862 10,121,113,422 21,972,900,284
(473,299,225)
2 Rent and Licence Fees
223,753,131 - 223,753,131
258,045,390 131,532,394 389,577,784
(165,824,653)
3 Profit per Production Sharing Agreements
- -
- -
-
4 Protected Gas/Additional Gas Revenues
- -
- -
-
5 Other material payments made to MEM
- -
- -
-
(TPDC)
- - -
- - -
-
6 Protected Gas Revenue
- -
- -
-
7 Additional Gas Revenue
- -
- -
-
8 Profit per Production Sharing Agreement
- -
- -
-
9 VAT on Gas Revenue
- -
- -
-
10 Licence Charge
- -
- -
-
11 Other material payments made to TPDC
- -
- -
-
TRA (LTD/DRD/CED)
96,134,892,072 (60,825,480,885) 35,309,411,187
32,326,459,679 2,982,973,153 35,309,432,832
(21,645)
12 Corporation Tax
61,467,440,100 (61,467,440,100) -
- -
-
13 Withholding Taxes
4,574,783,954 - 4,574,783,954
4,574,803,954 - 4,574,803,954
(20,000)
14 Pay- As-You-Earn (PAYE)
16,374,459,605 761,836,815 17,136,296,420
17,359,447,510 (223,151,105) 17,136,296,405
15
15 Skills and Development Levy (SDL)
3,643,895,019 145,697,468 3,789,592,487
3,566,441,382 223,151,105 3,789,592,487
-
16 VAT paid to LTD/DRD
- -
- -
-
17 VAT paid to CED
408,168,929 (188,990,685) 219,178,244
310,319,951 (91,141,707) 219,178,244
-
18 Excise Duty
74,954,825 - 74,954,825
74,954,825 - 74,954,825
-
19 Import Duty
6,482,417,640 (76,584,383) 6,405,833,257
6,440,492,057 (34,659,140) 6,405,832,917
340
20 Stamp Duty
- -
- -
-
21 Fuel Levy
1,294,392,000 - 1,294,392,000
1,294,394,000 1,294,394,000
(2,000)
22 Other material payments made to TRA
1,814,380,000 - 1,814,380,000
1,814,380,000 1,814,380,000
-
NSSF/PPF
5,755,025,093 302,976,441 6,058,001,534
6,010,048,772 47,679,761 6,057,728,533
273,001
23 NSSF Contribution
5,327,749,187 302,703,131 5,630,452,318
5,630,179,317 - 5,630,179,317
273,001
24 PPF Contribution
427,275,906 273,310 427,549,216
379,869,455 47,679,761 427,549,216
-
Local Authorities
637,518,000 - 637,518,000
313,920,000 - 313,920,000
323,598,000
25 Local Levy
- -
- -
-
26 Service Levy
637,518,000 - 637,518,000
313,920,000 - 313,920,000
323,598,000
27 Other Local Taxes, Fees and Levies
- -
- -
-
Ministry of Finance (MoF)
- - -
- - -
-
28 Dividends from Government Shares
- -
- -
-
29 Revenues from Gov shareholding sale
- -
- -
-
Total payments
124,045,084,013 (60,316,799,102) 63,728,284,911
50,760,260,703 13,283,298,730 64,043,559,433
(315,274,522)
Social Payments
6,921,972,335 - 6,921,972,335
- - -
30 Corporate Social Resp cash payments
6,921,972,335 - 6,921,972,335
- -
31 Corporate Social Resp in-kind payments
- -
- -
-
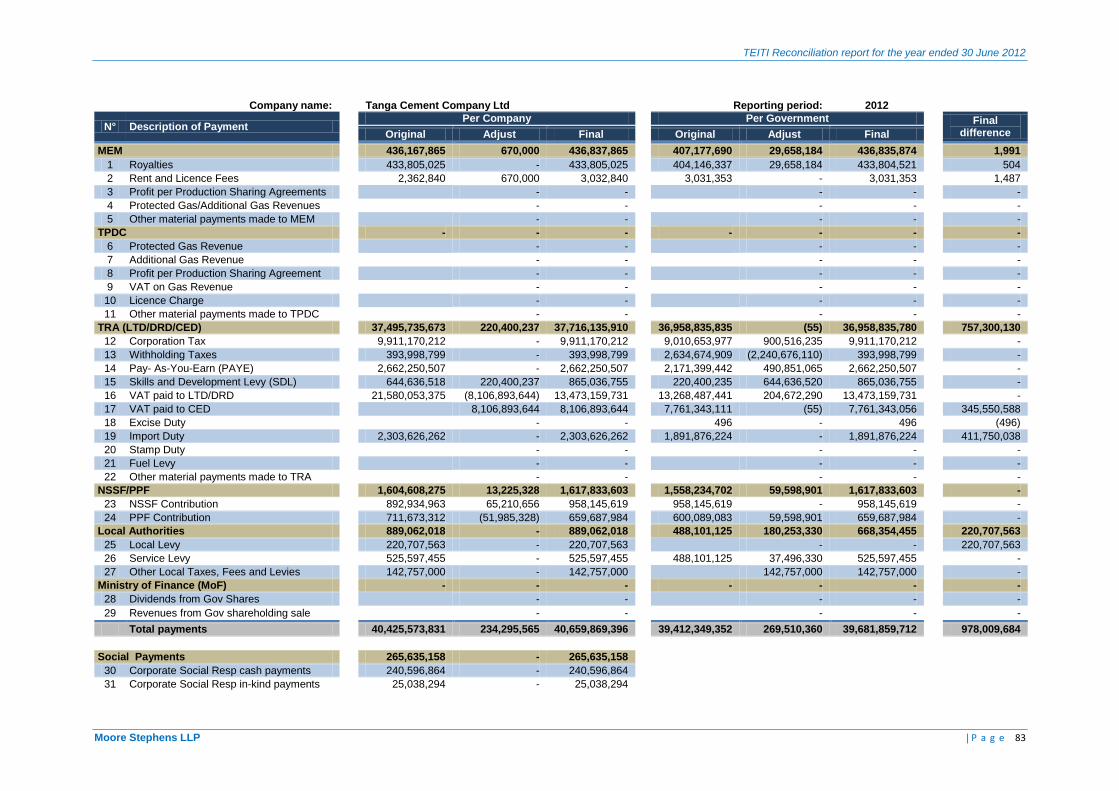
TEITI Reconciliation report for the year ended 30 June 2012
Moore Stephens LLP | P a g e 83
Company name:
Tanga Cement Company Ltd
Reporting period: 2012
N° Description of Payment Per Company
Per Government
Final difference
Original Adjust Final
Original Adjust Final
MEM
436,167,865 670,000 436,837,865
407,177,690 29,658,184 436,835,874
1,991
1 Royalties
433,805,025 - 433,805,025
404,146,337 29,658,184 433,804,521
504
2 Rent and Licence Fees
2,362,840 670,000 3,032,840
3,031,353 - 3,031,353
1,487
3 Profit per Production Sharing Agreements
- -
- -
-
4 Protected Gas/Additional Gas Revenues
- -
- -
-
5 Other material payments made to MEM
- -
- -
-
TPDC
- - -
- - -
-
6 Protected Gas Revenue
- -
- -
-
7 Additional Gas Revenue
- -
- -
-
8 Profit per Production Sharing Agreement
- -
- -
-
9 VAT on Gas Revenue
- -
- -
-
10 Licence Charge
- -
- -
-
11 Other material payments made to TPDC
- -
- -
-
TRA (LTD/DRD/CED)
37,495,735,673 220,400,237 37,716,135,910
36,958,835,835 (55) 36,958,835,780
757,300,130
12 Corporation Tax
9,911,170,212 - 9,911,170,212
9,010,653,977 900,516,235 9,911,170,212
-
13 Withholding Taxes
393,998,799 - 393,998,799
2,634,674,909 (2,240,676,110) 393,998,799
-
14 Pay- As-You-Earn (PAYE)
2,662,250,507 - 2,662,250,507
2,171,399,442 490,851,065 2,662,250,507
-
15 Skills and Development Levy (SDL)
644,636,518 220,400,237 865,036,755
220,400,235 644,636,520 865,036,755
-
16 VAT paid to LTD/DRD
21,580,053,375 (8,106,893,644) 13,473,159,731
13,268,487,441 204,672,290 13,473,159,731
-
17 VAT paid to CED
8,106,893,644 8,106,893,644
7,761,343,111 (55) 7,761,343,056
345,550,588
18 Excise Duty
- -
496 - 496
(496)
19 Import Duty
2,303,626,262 - 2,303,626,262
1,891,876,224 - 1,891,876,224
411,750,038
20 Stamp Duty
- -
- -
-
21 Fuel Levy
- -
- -
-
22 Other material payments made to TRA
- -
- -
-
NSSF/PPF
1,604,608,275 13,225,328 1,617,833,603
1,558,234,702 59,598,901 1,617,833,603
-
23 NSSF Contribution
892,934,963 65,210,656 958,145,619
958,145,619 - 958,145,619
-
24 PPF Contribution
711,673,312 (51,985,328) 659,687,984
600,089,083 59,598,901 659,687,984
-
Local Authorities
889,062,018 - 889,062,018
488,101,125 180,253,330 668,354,455
220,707,563
25 Local Levy
220,707,563 - 220,707,563
- -
220,707,563
26 Service Levy
525,597,455 - 525,597,455
488,101,125 37,496,330 525,597,455
-
27 Other Local Taxes, Fees and Levies
142,757,000 - 142,757,000
142,757,000 142,757,000
-
Ministry of Finance (MoF)
- - -
- - -
-
28 Dividends from Gov Shares
- -
- -
-
29 Revenues from Gov shareholding sale
- -
- -
-
Total payments
40,425,573,831 234,295,565 40,659,869,396
39,412,349,352 269,510,360 39,681,859,712
978,009,684
Social Payments
265,635,158 - 265,635,158
30 Corporate Social Resp cash payments
240,596,864 - 240,596,864
31 Corporate Social Resp in-kind payments
25,038,294 - 25,038,294
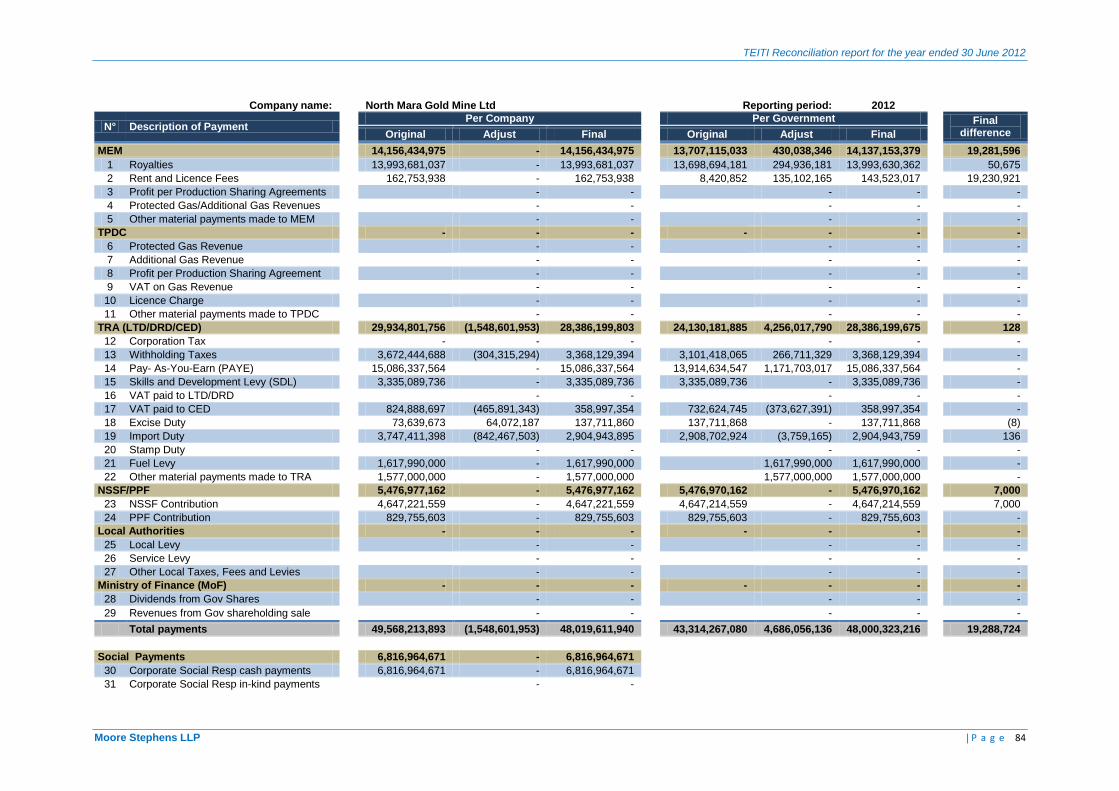
TEITI Reconciliation report for the year ended 30 June 2012
Moore Stephens LLP | P a g e 84
Company name:
North Mara Gold Mine Ltd
Reporting period: 2012
N° Description of Payment Per Company
Per Government
Final difference
Original Adjust Final
Original Adjust Final
MEM
14,156,434,975 - 14,156,434,975
13,707,115,033 430,038,346 14,137,153,379
19,281,596
1 Royalties
13,993,681,037 - 13,993,681,037
13,698,694,181 294,936,181 13,993,630,362
50,675
2 Rent and Licence Fees
162,753,938 - 162,753,938
8,420,852 135,102,165 143,523,017
19,230,921
3 Profit per Production Sharing Agreements
- -
- -
-
4 Protected Gas/Additional Gas Revenues
- -
- -
-
5 Other material payments made to MEM
- -
- -
-
TPDC
- - -
- - -
-
6 Protected Gas Revenue
- -
- -
-
7 Additional Gas Revenue
- -
- -
-
8 Profit per Production Sharing Agreement
- -
- -
-
9 VAT on Gas Revenue
- -
- -
-
10 Licence Charge
- -
- -
-
11 Other material payments made to TPDC
- -
- -
-
TRA (LTD/DRD/CED)
29,934,801,756 (1,548,601,953) 28,386,199,803
24,130,181,885 4,256,017,790 28,386,199,675
128
12 Corporation Tax
- - -
- -
-
13 Withholding Taxes
3,672,444,688 (304,315,294) 3,368,129,394
3,101,418,065 266,711,329 3,368,129,394
-
14 Pay- As-You-Earn (PAYE)
15,086,337,564 - 15,086,337,564
13,914,634,547 1,171,703,017 15,086,337,564
-
15 Skills and Development Levy (SDL)
3,335,089,736 - 3,335,089,736
3,335,089,736 - 3,335,089,736
-
16 VAT paid to LTD/DRD
- -
- -
-
17 VAT paid to CED
824,888,697 (465,891,343) 358,997,354
732,624,745 (373,627,391) 358,997,354
-
18 Excise Duty
73,639,673 64,072,187 137,711,860
137,711,868 - 137,711,868
(8)
19 Import Duty
3,747,411,398 (842,467,503) 2,904,943,895
2,908,702,924 (3,759,165) 2,904,943,759
136
20 Stamp Duty
- -
- -
-
21 Fuel Levy
1,617,990,000 - 1,617,990,000
1,617,990,000 1,617,990,000
-
22 Other material payments made to TRA
1,577,000,000 - 1,577,000,000
1,577,000,000 1,577,000,000
-
NSSF/PPF
5,476,977,162 - 5,476,977,162
5,476,970,162 - 5,476,970,162
7,000
23 NSSF Contribution
4,647,221,559 - 4,647,221,559
4,647,214,559 - 4,647,214,559
7,000
24 PPF Contribution
829,755,603 - 829,755,603
829,755,603 - 829,755,603
-
Local Authorities
- - -
- - -
-
25 Local Levy
- -
- -
-
26 Service Levy
- -
- -
-
27 Other Local Taxes, Fees and Levies
- -
- -
-
Ministry of Finance (MoF)
- - -
- - -
-
28 Dividends from Gov Shares
- -
- -
-
29 Revenues from Gov shareholding sale
- -
- -
-
Total payments
49,568,213,893 (1,548,601,953) 48,019,611,940
43,314,267,080 4,686,056,136 48,000,323,216
19,288,724
Social Payments
6,816,964,671 - 6,816,964,671
30 Corporate Social Resp cash payments
6,816,964,671 - 6,816,964,671
31 Corporate Social Resp in-kind payments
- -
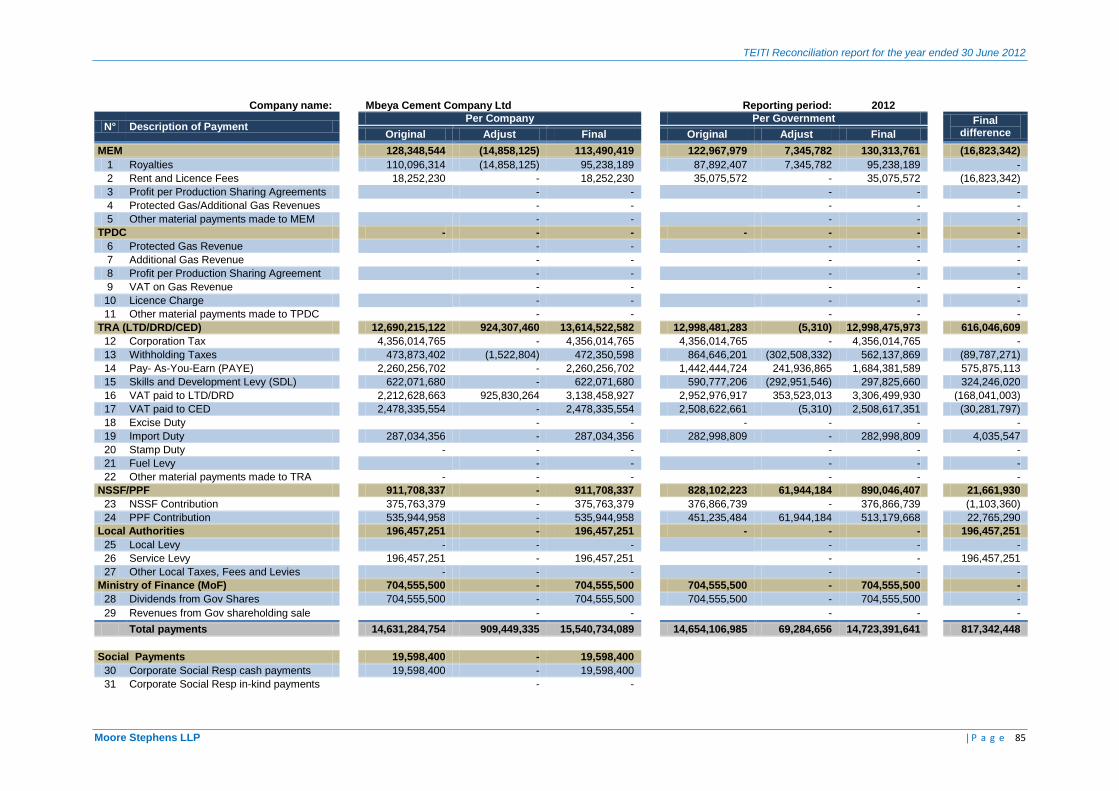
TEITI Reconciliation report for the year ended 30 June 2012
Moore Stephens LLP | P a g e 85
Company name:
Mbeya Cement Company Ltd
Reporting period: 2012
N° Description of Payment Per Company
Per Government
Final difference
Original Adjust Final
Original Adjust Final
MEM
128,348,544 (14,858,125) 113,490,419
122,967,979 7,345,782 130,313,761
(16,823,342)
1 Royalties
110,096,314 (14,858,125) 95,238,189
87,892,407 7,345,782 95,238,189
-
2 Rent and Licence Fees
18,252,230 - 18,252,230
35,075,572 - 35,075,572
(16,823,342)
3 Profit per Production Sharing Agreements
- -
- -
-
4 Protected Gas/Additional Gas Revenues
- -
- -
-
5 Other material payments made to MEM
- -
- -
-
TPDC
- - -
- - -
-
6 Protected Gas Revenue
- -
- -
-
7 Additional Gas Revenue
- -
- -
-
8 Profit per Production Sharing Agreement
- -
- -
-
9 VAT on Gas Revenue
- -
- -
-
10 Licence Charge
- -
- -
-
11 Other material payments made to TPDC
- -
- -
-
TRA (LTD/DRD/CED)
12,690,215,122 924,307,460 13,614,522,582
12,998,481,283 (5,310) 12,998,475,973
616,046,609
12 Corporation Tax
4,356,014,765 - 4,356,014,765
4,356,014,765 - 4,356,014,765
-
13 Withholding Taxes
473,873,402 (1,522,804) 472,350,598
864,646,201 (302,508,332) 562,137,869
(89,787,271)
14 Pay- As-You-Earn (PAYE)
2,260,256,702 - 2,260,256,702
1,442,444,724 241,936,865 1,684,381,589
575,875,113
15 Skills and Development Levy (SDL)
622,071,680 - 622,071,680
590,777,206 (292,951,546) 297,825,660
324,246,020
16 VAT paid to LTD/DRD
2,212,628,663 925,830,264 3,138,458,927
2,952,976,917 353,523,013 3,306,499,930
(168,041,003)
17 VAT paid to CED
2,478,335,554 - 2,478,335,554
2,508,622,661 (5,310) 2,508,617,351
(30,281,797)
18 Excise Duty
- -
- - -
-
19 Import Duty
287,034,356 - 287,034,356
282,998,809 - 282,998,809
4,035,547
20 Stamp Duty
- - -
- -
-
21 Fuel Levy
- -
- -
-
22 Other material payments made to TRA
- - -
- -
-
NSSF/PPF
911,708,337 - 911,708,337
828,102,223 61,944,184 890,046,407
21,661,930
23 NSSF Contribution
375,763,379 - 375,763,379
376,866,739 - 376,866,739
(1,103,360)
24 PPF Contribution
535,944,958 - 535,944,958
451,235,484 61,944,184 513,179,668
22,765,290
Local Authorities
196,457,251 - 196,457,251
- - -
196,457,251
25 Local Levy
- - -
- -
-
26 Service Levy
196,457,251 - 196,457,251
- -
196,457,251
27 Other Local Taxes, Fees and Levies
- - -
- -
-
Ministry of Finance (MoF)
704,555,500 - 704,555,500
704,555,500 - 704,555,500
-
28 Dividends from Gov Shares
704,555,500 - 704,555,500
704,555,500 - 704,555,500
-
29 Revenues from Gov shareholding sale
- -
- -
-
Total payments
14,631,284,754 909,449,335 15,540,734,089
14,654,106,985 69,284,656 14,723,391,641
817,342,448
Social Payments
19,598,400 - 19,598,400
30 Corporate Social Resp cash payments
19,598,400 - 19,598,400
31 Corporate Social Resp in-kind payments
- -
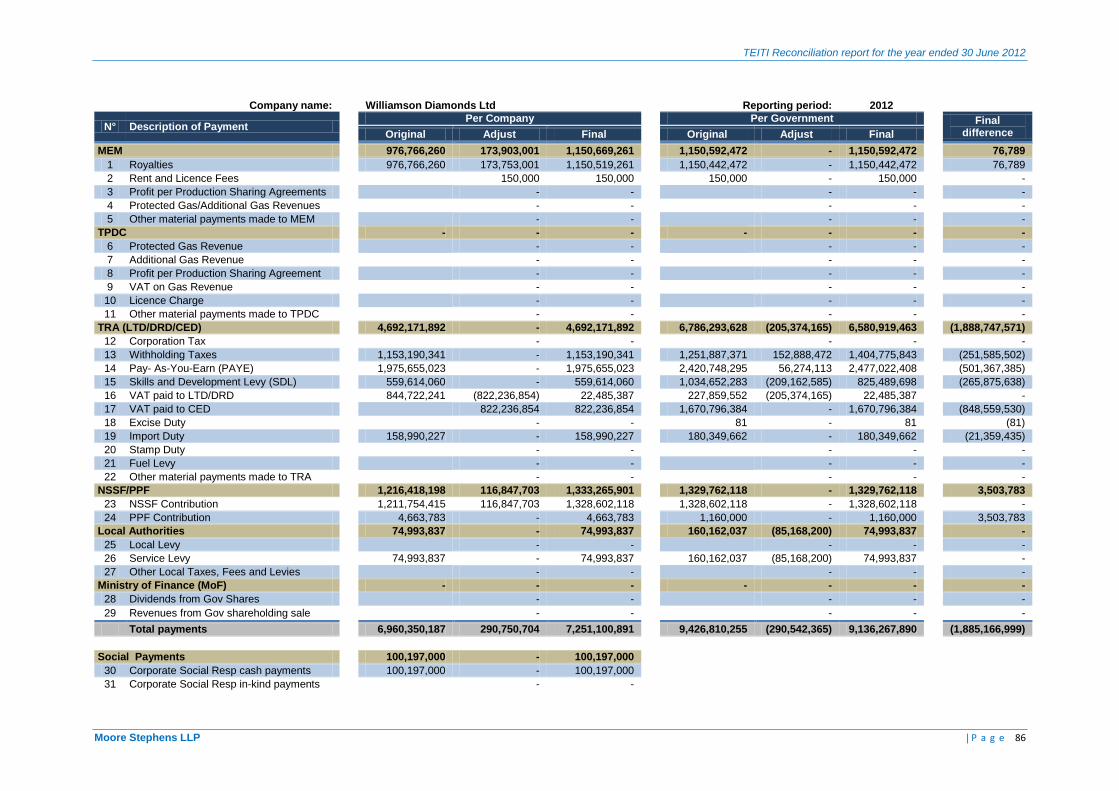
TEITI Reconciliation report for the year ended 30 June 2012
Moore Stephens LLP | P a g e 86
Company name:
Williamson Diamonds Ltd
Reporting period: 2012
N° Description of Payment Per Company
Per Government
Final difference
Original Adjust Final
Original Adjust Final
MEM
976,766,260 173,903,001 1,150,669,261
1,150,592,472 - 1,150,592,472
76,789
1 Royalties
976,766,260 173,753,001 1,150,519,261
1,150,442,472 - 1,150,442,472
76,789
2 Rent and Licence Fees
150,000 150,000
150,000 - 150,000
-
3 Profit per Production Sharing Agreements
- -
- -
-
4 Protected Gas/Additional Gas Revenues
- -
- -
-
5 Other material payments made to MEM
- -
- -
-
TPDC
- - -
- - -
-
6 Protected Gas Revenue
- -
- -
-
7 Additional Gas Revenue
- -
- -
-
8 Profit per Production Sharing Agreement
- -
- -
-
9 VAT on Gas Revenue
- -
- -
-
10 Licence Charge
- -
- -
-
11 Other material payments made to TPDC
- -
- -
-
TRA (LTD/DRD/CED)
4,692,171,892 - 4,692,171,892
6,786,293,628 (205,374,165) 6,580,919,463
(1,888,747,571)
12 Corporation Tax
- -
- -
-
13 Withholding Taxes
1,153,190,341 - 1,153,190,341
1,251,887,371 152,888,472 1,404,775,843
(251,585,502)
14 Pay- As-You-Earn (PAYE)
1,975,655,023 - 1,975,655,023
2,420,748,295 56,274,113 2,477,022,408
(501,367,385)
15 Skills and Development Levy (SDL)
559,614,060 - 559,614,060
1,034,652,283 (209,162,585) 825,489,698
(265,875,638)
16 VAT paid to LTD/DRD
844,722,241 (822,236,854) 22,485,387
227,859,552 (205,374,165) 22,485,387
-
17 VAT paid to CED
822,236,854 822,236,854
1,670,796,384 - 1,670,796,384
(848,559,530)
18 Excise Duty
- -
81 - 81
(81)
19 Import Duty
158,990,227 - 158,990,227
180,349,662 - 180,349,662
(21,359,435)
20 Stamp Duty
- -
- -
-
21 Fuel Levy
- -
- -
-
22 Other material payments made to TRA
- -
- -
-
NSSF/PPF
1,216,418,198 116,847,703 1,333,265,901
1,329,762,118 - 1,329,762,118
3,503,783
23 NSSF Contribution
1,211,754,415 116,847,703 1,328,602,118
1,328,602,118 - 1,328,602,118
-
24 PPF Contribution
4,663,783 - 4,663,783
1,160,000 - 1,160,000
3,503,783
Local Authorities
74,993,837 - 74,993,837
160,162,037 (85,168,200) 74,993,837
-
25 Local Levy
- -
- -
-
26 Service Levy
74,993,837 - 74,993,837
160,162,037 (85,168,200) 74,993,837
-
27 Other Local Taxes, Fees and Levies
- -
- -
-
Ministry of Finance (MoF)
- - -
- - -
-
28 Dividends from Gov Shares
- -
- -
-
29 Revenues from Gov shareholding sale
- -
- -
-
Total payments
6,960,350,187 290,750,704 7,251,100,891
9,426,810,255 (290,542,365) 9,136,267,890
(1,885,166,999)
Social Payments
100,197,000 - 100,197,000
30 Corporate Social Resp cash payments
100,197,000 - 100,197,000
31 Corporate Social Resp in-kind payments
- -

TEITI Reconciliation report for the year ended 30 June 2012
Moore Stephens LLP | P a g e 87
Company name:
Shanta Mining Company Ltd
Reporting period: 2012
N° Description of Payment Per Company
Per Government
Final difference
Original Adjust Final
Original Adjust Final
MEM
92,430,753 - 92,430,753
67,038,503 29,599,024 96,637,527
(4,206,774)
1 Royalties
- -
- -
-
2 Rent and Licence Fees
92,430,753 - 92,430,753
67,038,503 29,599,024 96,637,527
(4,206,774)
3 Profit per Production Sharing Agreements
- -
- -
-
4 Protected Gas/Additional Gas Revenues
- -
- -
-
5 Other material payments made to MEM
- -
- -
-
TPDC
- - -
- - -
-
6 Protected Gas Revenue
- -
- -
-
7 Additional Gas Revenue
- -
- -
-
8 Profit per Production Sharing Agreement
- -
- -
-
9 VAT on Gas Revenue
- -
- -
-
10 Licence Charge
- -
- -
-
11 Other material payments made to TPDC
- -
- -
-
TRA (LTD/DRD/CED)
7,601,120,357 - 7,601,120,357
7,443,329,141 1,020,142 7,444,349,283
156,771,074
12 Corporation Tax
- -
695,602,891 (695,602,891) -
-
13 Withholding Taxes
3,008,583,155 - 3,008,583,155
2,057,422,536 951,160,619 3,008,583,155
-
14 Pay- As-You-Earn (PAYE)
542,828,029 - 542,828,029
810,422,271 (267,594,242) 542,828,029
-
15 Skills and Development Levy (SDL)
141,218,144 - 141,218,144
60,521,575 80,696,569 141,218,144
-
16 VAT paid to LTD/DRD
- -
67,639,913 (67,639,913) -
-
17 VAT paid to CED
2,553,589,778 - 2,553,589,778
2,480,692,720 - 2,480,692,720
72,897,058
18 Excise Duty
- -
11 - 11
(11)
19 Import Duty
1,354,901,251 - 1,354,901,251
1,271,027,224 - 1,271,027,224
83,874,027
20 Stamp Duty
- -
- -
-
21 Fuel Levy
- -
- -
-
22 Other material payments made to TRA
- -
- -
-
NSSF/PPF
273,589,962 - 273,589,962
452,299,709 (178,709,747) 273,589,962
-
23 NSSF Contribution
231,441,294 - 231,441,294
408,877,281 (177,435,987) 231,441,294
-
24 PPF Contribution
42,148,668 - 42,148,668
43,422,428 (1,273,760) 42,148,668
-
Local Authorities
388,609,933 - 388,609,933
- - -
388,609,933
25 Local Levy
- -
- -
-
26 Service Levy
123,993,704 - 123,993,704
- -
123,993,704
27 Other Local Taxes, Fees and Levies
264,616,229 - 264,616,229
- -
264,616,229
Ministry of Finance (MoF)
- - -
- - -
-
28 Dividends from Gov Shares
- -
- -
-
29 Revenues from Gov shareholding sale
- -
- -
-
Total payments
8,355,751,005 - 8,355,751,005
7,962,667,353 (148,090,581) 7,814,576,772
541,174,233
Social Payments
23,764,262 - 23,764,262
30 Corporate Social Resp cash payments
2,000,000 - 2,000,000
31 Corporate Social Resp in-kind payments
21,764,262 - 21,764,262
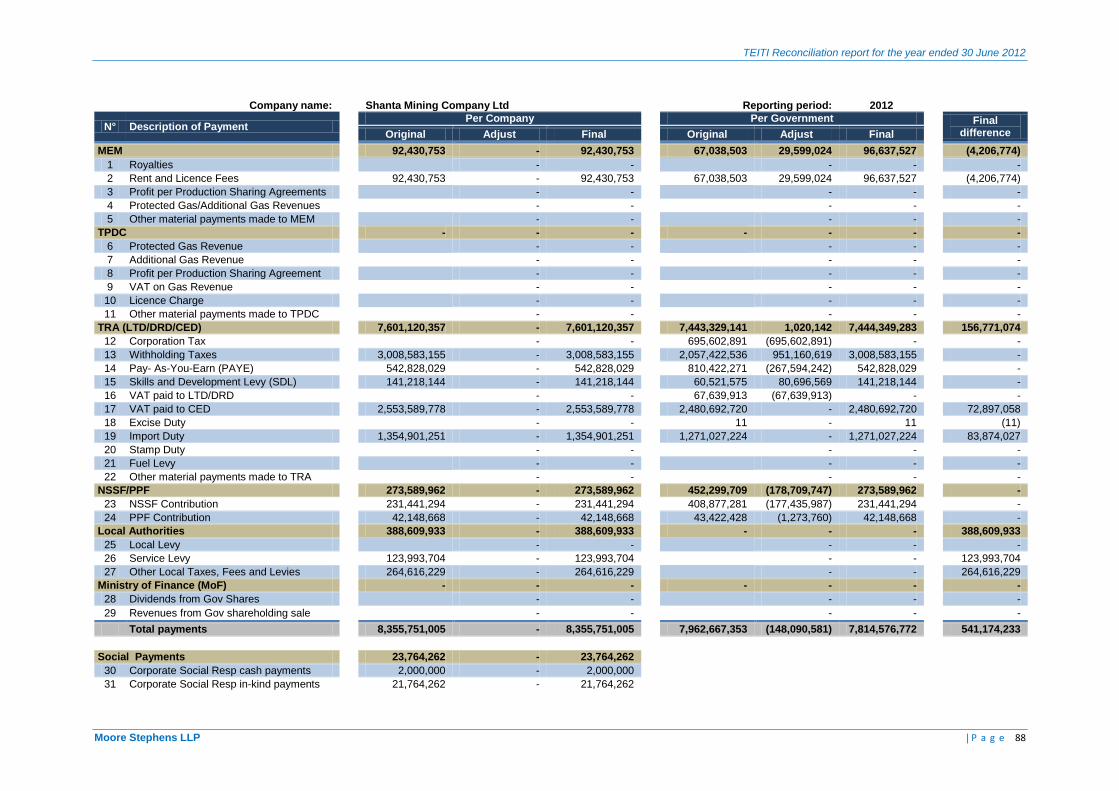
TEITI Reconciliation report for the year ended 30 June 2012
Moore Stephens LLP | P a g e 88
Company name:
Shanta Mining Company Ltd
Reporting period: 2012
N° Description of Payment Per Company
Per Government
Final difference
Original Adjust Final
Original Adjust Final
MEM
92,430,753 - 92,430,753
67,038,503 29,599,024 96,637,527
(4,206,774)
1 Royalties
- -
- -
-
2 Rent and Licence Fees
92,430,753 - 92,430,753
67,038,503 29,599,024 96,637,527
(4,206,774)
3 Profit per Production Sharing Agreements
- -
- -
-
4 Protected Gas/Additional Gas Revenues
- -
- -
-
5 Other material payments made to MEM
- -
- -
-
TPDC
- - -
- - -
-
6 Protected Gas Revenue
- -
- -
-
7 Additional Gas Revenue
- -
- -
-
8 Profit per Production Sharing Agreement
- -
- -
-
9 VAT on Gas Revenue
- -
- -
-
10 Licence Charge
- -
- -
-
11 Other material payments made to TPDC
- -
- -
-
TRA (LTD/DRD/CED)
7,601,120,357 - 7,601,120,357
7,443,329,141 1,020,142 7,444,349,283
156,771,074
12 Corporation Tax
- -
695,602,891 (695,602,891) -
-
13 Withholding Taxes
3,008,583,155 - 3,008,583,155
2,057,422,536 951,160,619 3,008,583,155
-
14 Pay- As-You-Earn (PAYE)
542,828,029 - 542,828,029
810,422,271 (267,594,242) 542,828,029
-
15 Skills and Development Levy (SDL)
141,218,144 - 141,218,144
60,521,575 80,696,569 141,218,144
-
16 VAT paid to LTD/DRD
- -
67,639,913 (67,639,913) -
-
17 VAT paid to CED
2,553,589,778 - 2,553,589,778
2,480,692,720 - 2,480,692,720
72,897,058
18 Excise Duty
- -
11 - 11
(11)
19 Import Duty
1,354,901,251 - 1,354,901,251
1,271,027,224 - 1,271,027,224
83,874,027
20 Stamp Duty
- -
- -
-
21 Fuel Levy
- -
- -
-
22 Other material payments made to TRA
- -
- -
-
NSSF/PPF
273,589,962 - 273,589,962
452,299,709 (178,709,747) 273,589,962
-
23 NSSF Contribution
231,441,294 - 231,441,294
408,877,281 (177,435,987) 231,441,294
-
24 PPF Contribution
42,148,668 - 42,148,668
43,422,428 (1,273,760) 42,148,668
-
Local Authorities
388,609,933 - 388,609,933
- - -
388,609,933
25 Local Levy
- -
- -
-
26 Service Levy
123,993,704 - 123,993,704
- -
123,993,704
27 Other Local Taxes, Fees and Levies
264,616,229 - 264,616,229
- -
264,616,229
Ministry of Finance (MoF)
- - -
- - -
-
28 Dividends from Gov Shares
- -
- -
-
29 Revenues from Gov shareholding sale
- -
- -
-
Total payments
8,355,751,005 - 8,355,751,005
7,962,667,353 (148,090,581) 7,814,576,772
541,174,233
Social Payments
23,764,262 - 23,764,262
30 Corporate Social Resp cash payments
2,000,000 - 2,000,000
31 Corporate Social Resp in-kind payments
21,764,262 - 21,764,262
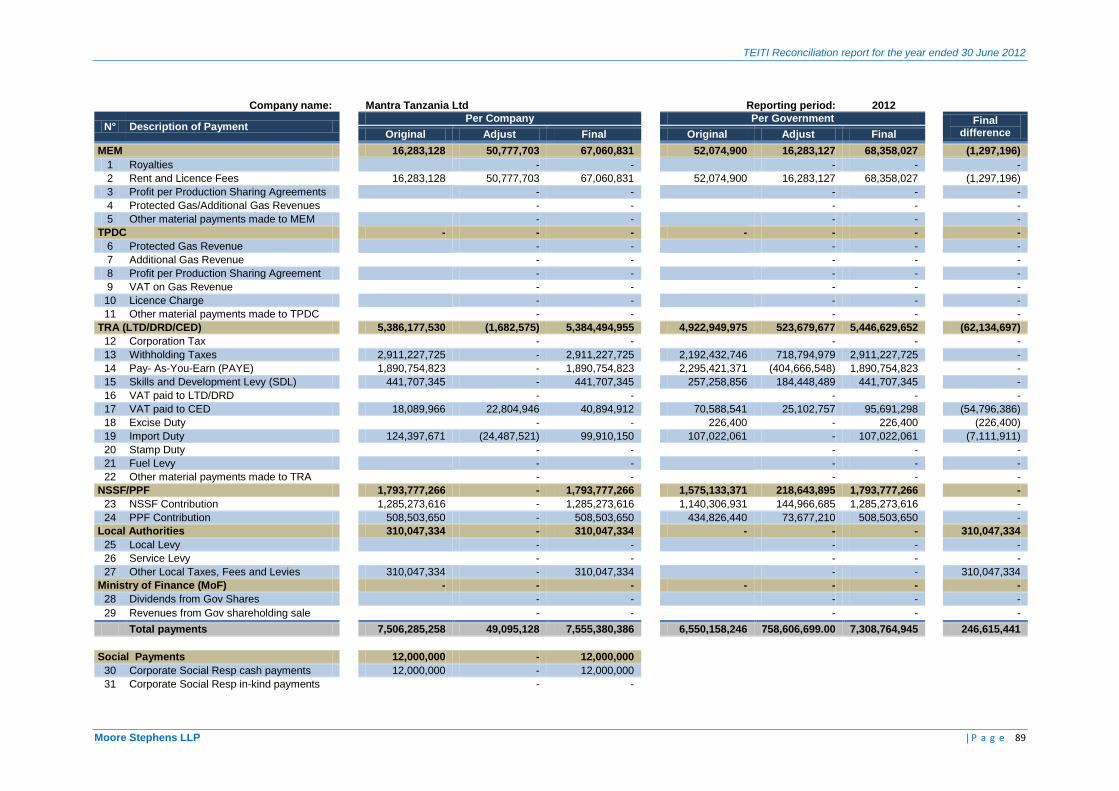
TEITI Reconciliation report for the year ended 30 June 2012
Moore Stephens LLP | P a g e 89
Company name:
Mantra Tanzania Ltd
Reporting period: 2012
N° Description of Payment Per Company
Per Government
Final difference
Original Adjust Final
Original Adjust Final
MEM
16,283,128 50,777,703 67,060,831
52,074,900 16,283,127 68,358,027
(1,297,196)
1 Royalties
- -
- -
-
2 Rent and Licence Fees
16,283,128 50,777,703 67,060,831
52,074,900 16,283,127 68,358,027
(1,297,196)
3 Profit per Production Sharing Agreements
- -
- -
-
4 Protected Gas/Additional Gas Revenues
- -
- -
-
5 Other material payments made to MEM
- -
- -
-
TPDC
- - -
- - -
-
6 Protected Gas Revenue
- -
- -
-
7 Additional Gas Revenue
- -
- -
-
8 Profit per Production Sharing Agreement
- -
- -
-
9 VAT on Gas Revenue
- -
- -
-
10 Licence Charge
- -
- -
-
11 Other material payments made to TPDC
- -
- -
-
TRA (LTD/DRD/CED)
5,386,177,530 (1,682,575) 5,384,494,955
4,922,949,975 523,679,677 5,446,629,652
(62,134,697)
12 Corporation Tax
- -
- -
-
13 Withholding Taxes
2,911,227,725 - 2,911,227,725
2,192,432,746 718,794,979 2,911,227,725
-
14 Pay- As-You-Earn (PAYE)
1,890,754,823 - 1,890,754,823
2,295,421,371 (404,666,548) 1,890,754,823
-
15 Skills and Development Levy (SDL)
441,707,345 - 441,707,345
257,258,856 184,448,489 441,707,345
-
16 VAT paid to LTD/DRD
- -
- -
-
17 VAT paid to CED
18,089,966 22,804,946 40,894,912
70,588,541 25,102,757 95,691,298
(54,796,386)
18 Excise Duty
- -
226,400 - 226,400
(226,400)
19 Import Duty
124,397,671 (24,487,521) 99,910,150
107,022,061 - 107,022,061
(7,111,911)
20 Stamp Duty
- -
- -
-
21 Fuel Levy
- -
- -
-
22 Other material payments made to TRA
- -
- -
-
NSSF/PPF
1,793,777,266 - 1,793,777,266
1,575,133,371 218,643,895 1,793,777,266
-
23 NSSF Contribution
1,285,273,616 - 1,285,273,616
1,140,306,931 144,966,685 1,285,273,616
-
24 PPF Contribution
508,503,650 - 508,503,650
434,826,440 73,677,210 508,503,650
-
Local Authorities
310,047,334 - 310,047,334
- - -
310,047,334
25 Local Levy
- -
- -
-
26 Service Levy
- -
- -
-
27 Other Local Taxes, Fees and Levies
310,047,334 - 310,047,334
- -
310,047,334
Ministry of Finance (MoF)
- - -
- - -
-
28 Dividends from Gov Shares
- -
- -
-
29 Revenues from Gov shareholding sale
- -
- -
-
Total payments
7,506,285,258 49,095,128 7,555,380,386
6,550,158,246 758,606,699.00 7,308,764,945
246,615,441
Social Payments
12,000,000 - 12,000,000
30 Corporate Social Resp cash payments
12,000,000 - 12,000,000
31 Corporate Social Resp in-kind payments
- -

TEITI Reconciliation report for the year ended 30 June 2012
Moore Stephens LLP | P a g e 90
Company name:
Tanzanite One Mining Ltd
Reporting period: 2012
N° Description of Payment Per Company
Per Government
Final difference
Original Adjust Final
Original Adjust Final
MEM
557,426,679 9,405,377 566,832,056
292,212,209 272,689,564 564,901,773
1,930,283
1 Royalties
551,375,396 9,405,377 560,780,773
288,091,209 272,689,564 560,780,773
-
2 Rent and Licence Fees
6,051,283 - 6,051,283
4,121,000 - 4,121,000
1,930,283
3 Profit per Production Sharing Agreements
- -
- -
-
4 Protected Gas/Additional Gas Revenues
- -
- -
-
5 Other material payments made to MEM
- -
- -
-
TPDC
- - -
- - -
-
6 Protected Gas Revenue
- -
- -
-
7 Additional Gas Revenue
- -
- -
-
8 Profit per Production Sharing Agreement
- -
- -
-
9 VAT on Gas Revenue
- -
- -
-
10 Licence Charge
- -
- -
-
11 Other material payments made to TPDC
- -
- -
-
TRA (LTD/DRD/CED)
2,293,329,110 261,229,490 2,554,558,600
2,621,048,453 3,900,000 2,624,948,453
(70,389,853)
12 Corporation Tax
- - -
- -
-
13 Withholding Taxes
35,985,226 4,336,373 40,321,599
31,110,369 9,211,230 40,321,599
-
14 Pay- As-You-Earn (PAYE)
1,661,800,669 166,938,029 1,828,738,698
1,828,738,698 - 1,828,738,698
-
15 Skills and Development Levy (SDL)
456,177,802 45,788,529 501,966,331
507,277,561 (5,311,230) 501,966,331
-
16 VAT paid to LTD/DRD
51,414,550 (51,414,550) -
- -
-
17 VAT paid to CED
- 68,974,748 68,974,748
163,096,353 - 163,096,353
(94,121,605)
18 Excise Duty
- 8,868,787 8,868,787
9,341,227 - 9,341,227
(472,440)
19 Import Duty
87,950,863 17,737,574 105,688,437
81,484,245 - 81,484,245
24,204,192
20 Stamp Duty
- - -
- -
-
21 Fuel Levy
- - -
- -
-
22 Other material payments made to TRA
- - -
- -
-
NSSF/PPF
1,224,301,467 - 1,224,301,467
1,318,678,933 (94,379,466) 1,224,299,467
2,000
23 NSSF Contribution
1,224,301,467 - 1,224,301,467
1,318,678,933 (94,379,466) 1,224,299,467
2,000
24 PPF Contribution
- -
- -
-
Local Authorities
60,386,805 - 60,386,805
- - -
60,386,805
25 Local Levy
- -
- -
-
26 Service Levy
60,386,805 - 60,386,805
- -
60,386,805
27 Other Local Taxes, Fees and Levies
- -
- -
-
Ministry of Finance (MoF)
- - -
- - -
-
28 Dividends from Gov Shares
- -
- -
-
29 Revenues from Gov shareholding sale
- -
- -
-
Total payments
4,135,444,061 270,634,867 4,406,078,928
4,231,939,595 182,210,098 4,414,149,693
(8,070,765)
Social Payments
55,394,143 - 55,394,143
30 Corporate Social Resp cash payments
14,013,385 - 14,013,385
31 Corporate Social Resp in-kind payments
41,380,758 - 41,380,758

TEITI Reconciliation report for the year ended 30 June 2012
Moore Stephens LLP | P a g e 91
Company name:
ABG Exploration Ltd
Reporting period: 2012
N° Description of Payment Per Company
Per Government
Final difference
Original Adjust Final
Original Adjust Final
MEM
97,293,945 - 97,293,945
6,016,079,014 (5,200,054,661) 816,024,353
(718,730,408)
1 Royalties
- -
5,873,121,935 (5,182,817,081) 690,304,854
(690,304,854)
2 Rent and Licence Fees
97,293,945 - 97,293,945
142,957,079 (17,237,580) 125,719,499
(28,425,554)
3 Profit per Production Sharing Agreements
- -
- -
-
4 Protected Gas/Additional Gas Revenues
- -
- -
-
5 Other material payments made to MEM
- -
- -
-
TPDC
- - -
- - -
-
6 Protected Gas Revenue
- -
- -
-
7 Additional Gas Revenue
- -
- -
-
8 Profit per Production Sharing Agreement
- -
- -
-
9 VAT on Gas Revenue
- -
- -
-
10 Licence Charge
- -
- -
-
11 Other material payments made to TPDC
- -
- -
-
TRA (LTD/DRD/CED)
2,698,246,827 - 2,698,246,827
2,244,560,535 453,555,983 2,698,116,518
130,309
12 Corporation Tax
- - -
- -
-
13 Withholding Taxes
1,148,780,904 - 1,148,780,904
1,148,650,595 - 1,148,650,595
130,309
14 Pay- As-You-Earn (PAYE)
1,229,900,797 - 1,229,900,797
916,246,160 313,654,637 1,229,900,797
-
15 Skills and Development Levy (SDL)
270,398,938 - 270,398,938
130,497,592 139,901,346 270,398,938
-
16 VAT paid to LTD/DRD
- -
- -
-
17 VAT paid to CED
23,911,469 - 23,911,469
23,911,469 - 23,911,469
-
18 Excise Duty
- - -
- - -
-
19 Import Duty
25,254,719 - 25,254,719
25,254,719 - 25,254,719
-
20 Stamp Duty
- -
- -
-
21 Fuel Levy
- - -
- -
-
22 Other material payments made to TRA
- -
- -
-
NSSF/PPF
477,712,422 20,426,703 498,139,125
489,366,110 8,499,705 497,865,815
273,310
23 NSSF Contribution
468,939,407 20,426,703 489,366,110
489,366,110 - 489,366,110
-
24 PPF Contribution
8,773,015 - 8,773,015
8,499,705 8,499,705
273,310
Local Authorities
- - -
- - -
-
25 Local Levy
- -
- -
-
26 Service Levy
- -
- -
-
27 Other Local Taxes, Fees and Levies
- -
- -
-
Ministry of Finance (MoF)
- - -
- - -
-
28 Dividends from Gov Shares
- -
- -
-
29 Revenues from Gov shareholding sale
- -
- -
-
Total payments
3,273,253,194 20,426,703 3,293,679,897
8,750,005,659 (4,737,998,973) 4,012,006,686
(718,326,789)
Social Payments
- - -
30 Corporate Social Resp cash payments
- -
31 Corporate Social Resp in-kind payments
- -
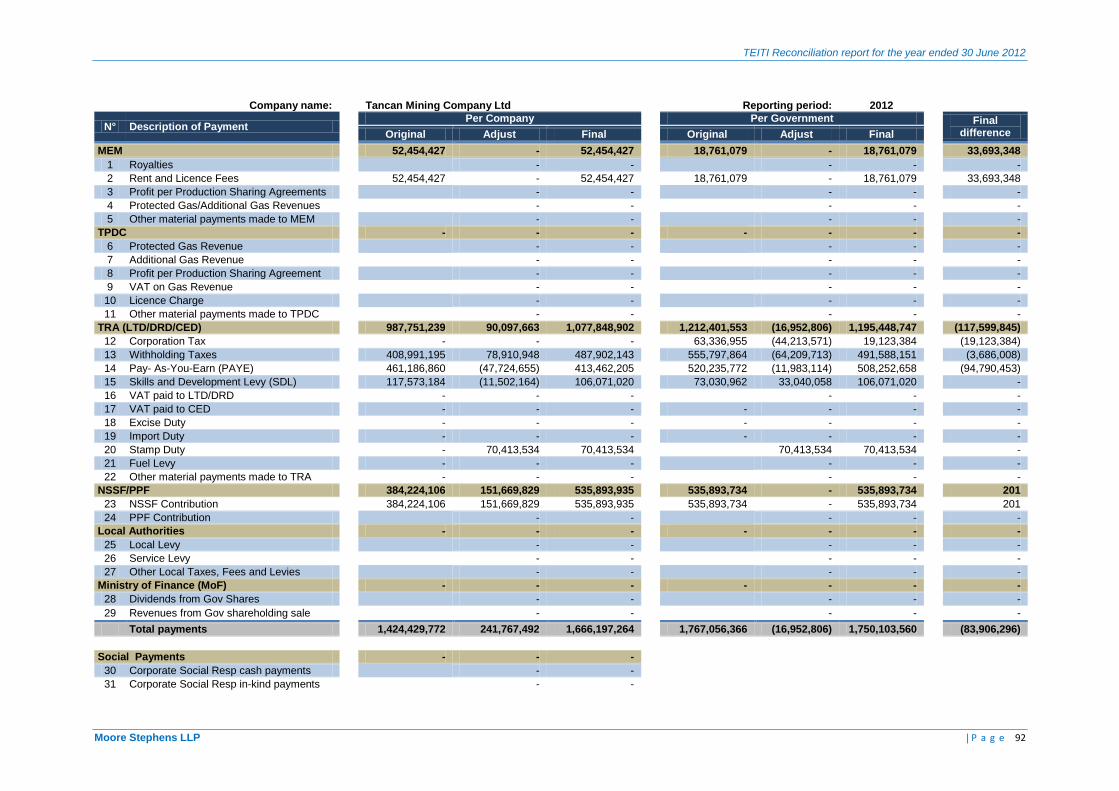
TEITI Reconciliation report for the year ended 30 June 2012
Moore Stephens LLP | P a g e 92
Company name:
Tancan Mining Company Ltd
Reporting period: 2012
N° Description of Payment Per Company
Per Government
Final difference
Original Adjust Final
Original Adjust Final
MEM
52,454,427 - 52,454,427
18,761,079 - 18,761,079
33,693,348
1 Royalties
- -
- -
-
2 Rent and Licence Fees
52,454,427 - 52,454,427
18,761,079 - 18,761,079
33,693,348
3 Profit per Production Sharing Agreements
- -
- -
-
4 Protected Gas/Additional Gas Revenues
- -
- -
-
5 Other material payments made to MEM
- -
- -
-
TPDC
- - -
- - -
-
6 Protected Gas Revenue
- -
- -
-
7 Additional Gas Revenue
- -
- -
-
8 Profit per Production Sharing Agreement
- -
- -
-
9 VAT on Gas Revenue
- -
- -
-
10 Licence Charge
- -
- -
-
11 Other material payments made to TPDC
- -
- -
-
TRA (LTD/DRD/CED)
987,751,239 90,097,663 1,077,848,902
1,212,401,553 (16,952,806) 1,195,448,747
(117,599,845)
12 Corporation Tax
- - -
63,336,955 (44,213,571) 19,123,384
(19,123,384)
13 Withholding Taxes
408,991,195 78,910,948 487,902,143
555,797,864 (64,209,713) 491,588,151
(3,686,008)
14 Pay- As-You-Earn (PAYE)
461,186,860 (47,724,655) 413,462,205
520,235,772 (11,983,114) 508,252,658
(94,790,453)
15 Skills and Development Levy (SDL)
117,573,184 (11,502,164) 106,071,020
73,030,962 33,040,058 106,071,020
-
16 VAT paid to LTD/DRD
- - -
- -
-
17 VAT paid to CED
- - -
- - -
-
18 Excise Duty
- - -
- - -
-
19 Import Duty
- - -
- - -
-
20 Stamp Duty
- 70,413,534 70,413,534
70,413,534 70,413,534
-
21 Fuel Levy
- - -
- -
-
22 Other material payments made to TRA
- - -
- -
-
NSSF/PPF
384,224,106 151,669,829 535,893,935
535,893,734 - 535,893,734
201
23 NSSF Contribution
384,224,106 151,669,829 535,893,935
535,893,734 - 535,893,734
201
24 PPF Contribution
- -
- -
-
Local Authorities
- - -
- - -
-
25 Local Levy
- -
- -
-
26 Service Levy
- -
- -
-
27 Other Local Taxes, Fees and Levies
- -
- -
-
Ministry of Finance (MoF)
- - -
- - -
-
28 Dividends from Gov Shares
- -
- -
-
29 Revenues from Gov shareholding sale
- -
- -
-
Total payments
1,424,429,772 241,767,492 1,666,197,264
1,767,056,366 (16,952,806) 1,750,103,560
(83,906,296)
Social Payments
- - -
30 Corporate Social Resp cash payments
- -
31 Corporate Social Resp in-kind payments
- -
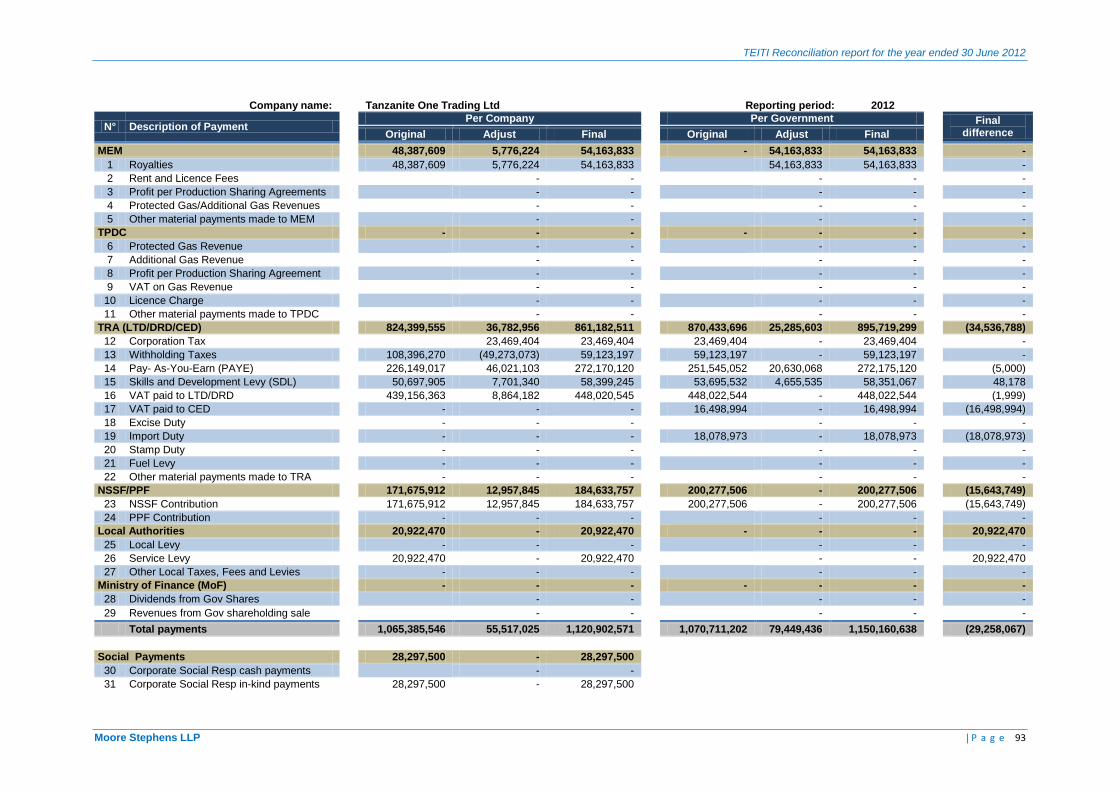
TEITI Reconciliation report for the year ended 30 June 2012
Moore Stephens LLP | P a g e 93
Company name:
Tanzanite One Trading Ltd
Reporting period: 2012
N° Description of Payment Per Company
Per Government
Final difference
Original Adjust Final
Original Adjust Final
MEM
48,387,609 5,776,224 54,163,833
- 54,163,833 54,163,833
-
1 Royalties
48,387,609 5,776,224 54,163,833
54,163,833 54,163,833
-
2 Rent and Licence Fees
- -
- -
-
3 Profit per Production Sharing Agreements
- -
- -
-
4 Protected Gas/Additional Gas Revenues
- -
- -
-
5 Other material payments made to MEM
- -
- -
-
TPDC
- - -
- - -
-
6 Protected Gas Revenue
- -
- -
-
7 Additional Gas Revenue
- -
- -
-
8 Profit per Production Sharing Agreement
- -
- -
-
9 VAT on Gas Revenue
- -
- -
-
10 Licence Charge
- -
- -
-
11 Other material payments made to TPDC
- -
- -
-
TRA (LTD/DRD/CED)
824,399,555 36,782,956 861,182,511
870,433,696 25,285,603 895,719,299
(34,536,788)
12 Corporation Tax
23,469,404 23,469,404
23,469,404 - 23,469,404
-
13 Withholding Taxes
108,396,270 (49,273,073) 59,123,197
59,123,197 - 59,123,197
-
14 Pay- As-You-Earn (PAYE)
226,149,017 46,021,103 272,170,120
251,545,052 20,630,068 272,175,120
(5,000)
15 Skills and Development Levy (SDL)
50,697,905 7,701,340 58,399,245
53,695,532 4,655,535 58,351,067
48,178
16 VAT paid to LTD/DRD
439,156,363 8,864,182 448,020,545
448,022,544 - 448,022,544
(1,999)
17 VAT paid to CED
- - -
16,498,994 - 16,498,994
(16,498,994)
18 Excise Duty
- - -
- -
-
19 Import Duty
- - -
18,078,973 - 18,078,973
(18,078,973)
20 Stamp Duty
- - -
- -
-
21 Fuel Levy
- - -
- -
-
22 Other material payments made to TRA
- - -
- -
-
NSSF/PPF
171,675,912 12,957,845 184,633,757
200,277,506 - 200,277,506
(15,643,749)
23 NSSF Contribution
171,675,912 12,957,845 184,633,757
200,277,506 - 200,277,506
(15,643,749)
24 PPF Contribution
- - -
- -
-
Local Authorities
20,922,470 - 20,922,470
- - -
20,922,470
25 Local Levy
- - -
- -
-
26 Service Levy
20,922,470 - 20,922,470
- -
20,922,470
27 Other Local Taxes, Fees and Levies
- - -
- -
-
Ministry of Finance (MoF)
- - -
- - -
-
28 Dividends from Gov Shares
- -
- -
-
29 Revenues from Gov shareholding sale
- -
- -
-
Total payments
1,065,385,546 55,517,025 1,120,902,571
1,070,711,202 79,449,436 1,150,160,638
(29,258,067)
Social Payments
28,297,500 - 28,297,500
30 Corporate Social Resp cash payments
- -
31 Corporate Social Resp in-kind payments
28,297,500 - 28,297,500
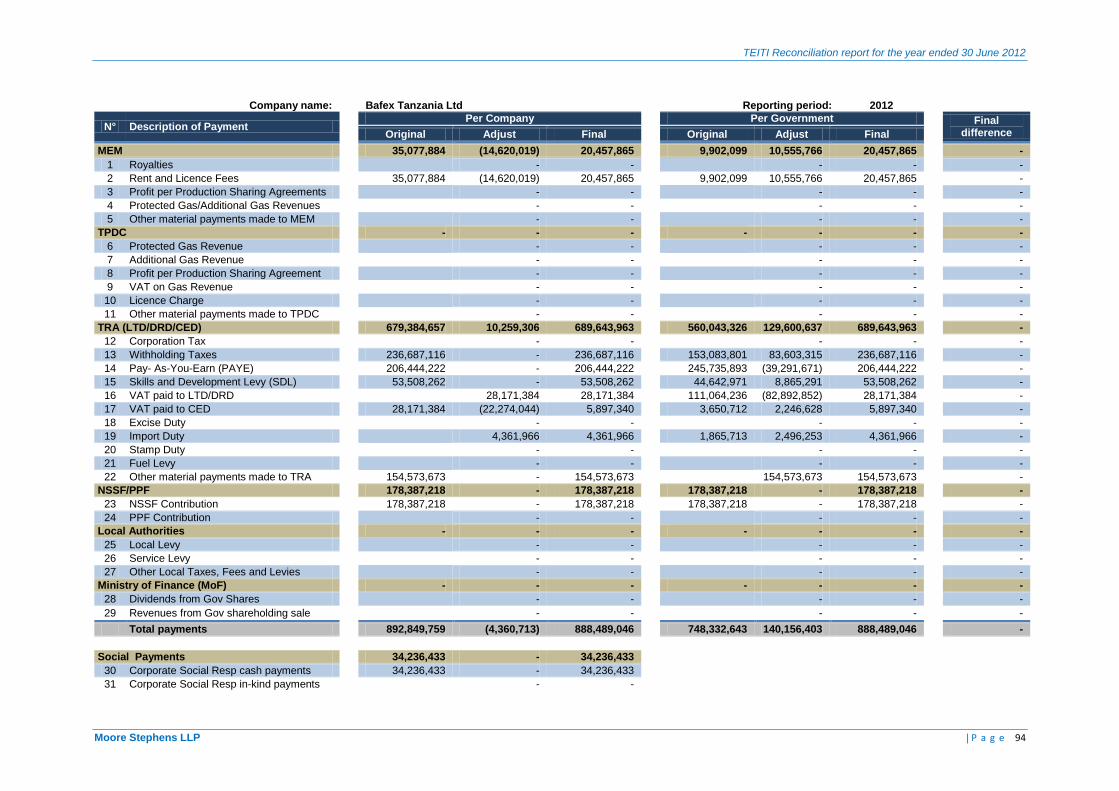
TEITI Reconciliation report for the year ended 30 June 2012
Moore Stephens LLP | P a g e 94
Company name:
Bafex Tanzania Ltd
Reporting period: 2012
N° Description of Payment Per Company
Per Government
Final difference
Original Adjust Final
Original Adjust Final
MEM
35,077,884 (14,620,019) 20,457,865
9,902,099 10,555,766 20,457,865
-
1 Royalties
- -
- -
-
2 Rent and Licence Fees
35,077,884 (14,620,019) 20,457,865
9,902,099 10,555,766 20,457,865
-
3 Profit per Production Sharing Agreements
- -
- -
-
4 Protected Gas/Additional Gas Revenues
- -
- -
-
5 Other material payments made to MEM
- -
- -
-
TPDC
- - -
- - -
-
6 Protected Gas Revenue
- -
- -
-
7 Additional Gas Revenue
- -
- -
-
8 Profit per Production Sharing Agreement
- -
- -
-
9 VAT on Gas Revenue
- -
- -
-
10 Licence Charge
- -
- -
-
11 Other material payments made to TPDC
- -
- -
-
TRA (LTD/DRD/CED)
679,384,657 10,259,306 689,643,963
560,043,326 129,600,637 689,643,963
-
12 Corporation Tax
- -
- -
-
13 Withholding Taxes
236,687,116 - 236,687,116
153,083,801 83,603,315 236,687,116
-
14 Pay- As-You-Earn (PAYE)
206,444,222 - 206,444,222
245,735,893 (39,291,671) 206,444,222
-
15 Skills and Development Levy (SDL)
53,508,262 - 53,508,262
44,642,971 8,865,291 53,508,262
-
16 VAT paid to LTD/DRD
28,171,384 28,171,384
111,064,236 (82,892,852) 28,171,384
-
17 VAT paid to CED
28,171,384 (22,274,044) 5,897,340
3,650,712 2,246,628 5,897,340
-
18 Excise Duty
- -
- -
-
19 Import Duty
4,361,966 4,361,966
1,865,713 2,496,253 4,361,966
-
20 Stamp Duty
- -
- -
-
21 Fuel Levy
- -
- -
-
22 Other material payments made to TRA
154,573,673 - 154,573,673
154,573,673 154,573,673
-
NSSF/PPF
178,387,218 - 178,387,218
178,387,218 - 178,387,218
-
23 NSSF Contribution
178,387,218 - 178,387,218
178,387,218 - 178,387,218
-
24 PPF Contribution
- -
- -
-
Local Authorities
- - -
- - -
-
25 Local Levy
- -
- -
-
26 Service Levy
- -
- -
-
27 Other Local Taxes, Fees and Levies
- -
- -
-
Ministry of Finance (MoF)
- - -
- - -
-
28 Dividends from Gov Shares
- -
- -
-
29 Revenues from Gov shareholding sale
- -
- -
-
Total payments
892,849,759 (4,360,713) 888,489,046
748,332,643 140,156,403 888,489,046
-
Social Payments
34,236,433 - 34,236,433
30 Corporate Social Resp cash payments
34,236,433 - 34,236,433
31 Corporate Social Resp in-kind payments
- -
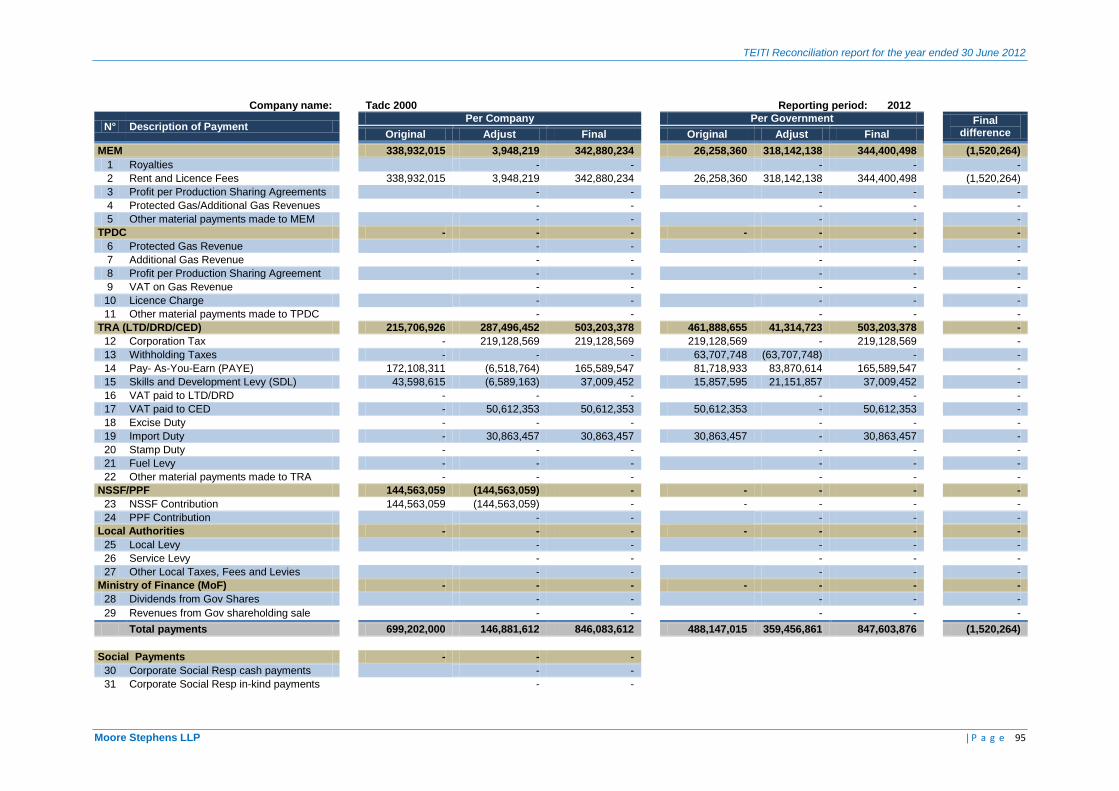
TEITI Reconciliation report for the year ended 30 June 2012
Moore Stephens LLP | P a g e 95
Company name:
Tadc 2000
Reporting period: 2012
N° Description of Payment Per Company
Per Government
Final difference
Original Adjust Final
Original Adjust Final
MEM
338,932,015 3,948,219 342,880,234
26,258,360 318,142,138 344,400,498
(1,520,264)
1 Royalties
- -
- -
-
2 Rent and Licence Fees
338,932,015 3,948,219 342,880,234
26,258,360 318,142,138 344,400,498
(1,520,264)
3 Profit per Production Sharing Agreements
- -
- -
-
4 Protected Gas/Additional Gas Revenues
- -
- -
-
5 Other material payments made to MEM
- -
- -
-
TPDC
- - -
- - -
-
6 Protected Gas Revenue
- -
- -
-
7 Additional Gas Revenue
- -
- -
-
8 Profit per Production Sharing Agreement
- -
- -
-
9 VAT on Gas Revenue
- -
- -
-
10 Licence Charge
- -
- -
-
11 Other material payments made to TPDC
- -
- -
-
TRA (LTD/DRD/CED)
215,706,926 287,496,452 503,203,378
461,888,655 41,314,723 503,203,378
-
12 Corporation Tax
- 219,128,569 219,128,569
219,128,569 - 219,128,569
-
13 Withholding Taxes
- - -
63,707,748 (63,707,748) -
-
14 Pay- As-You-Earn (PAYE)
172,108,311 (6,518,764) 165,589,547
81,718,933 83,870,614 165,589,547
-
15 Skills and Development Levy (SDL)
43,598,615 (6,589,163) 37,009,452
15,857,595 21,151,857 37,009,452
-
16 VAT paid to LTD/DRD
- - -
- -
-
17 VAT paid to CED
- 50,612,353 50,612,353
50,612,353 - 50,612,353
-
18 Excise Duty
- - -
- -
-
19 Import Duty
- 30,863,457 30,863,457
30,863,457 - 30,863,457
-
20 Stamp Duty
- - -
- -
-
21 Fuel Levy
- - -
- -
-
22 Other material payments made to TRA
- - -
- -
-
NSSF/PPF
144,563,059 (144,563,059) -
- - -
-
23 NSSF Contribution
144,563,059 (144,563,059) -
- - -
-
24 PPF Contribution
- -
- -
-
Local Authorities
- - -
- - -
-
25 Local Levy
- -
- -
-
26 Service Levy
- -
- -
-
27 Other Local Taxes, Fees and Levies
- -
- -
-
Ministry of Finance (MoF)
- - -
- - -
-
28 Dividends from Gov Shares
- -
- -
-
29 Revenues from Gov shareholding sale
- -
- -
-
Total payments
699,202,000 146,881,612 846,083,612
488,147,015 359,456,861 847,603,876
(1,520,264)
Social Payments
- - -
30 Corporate Social Resp cash payments
- -
31 Corporate Social Resp in-kind payments
- -
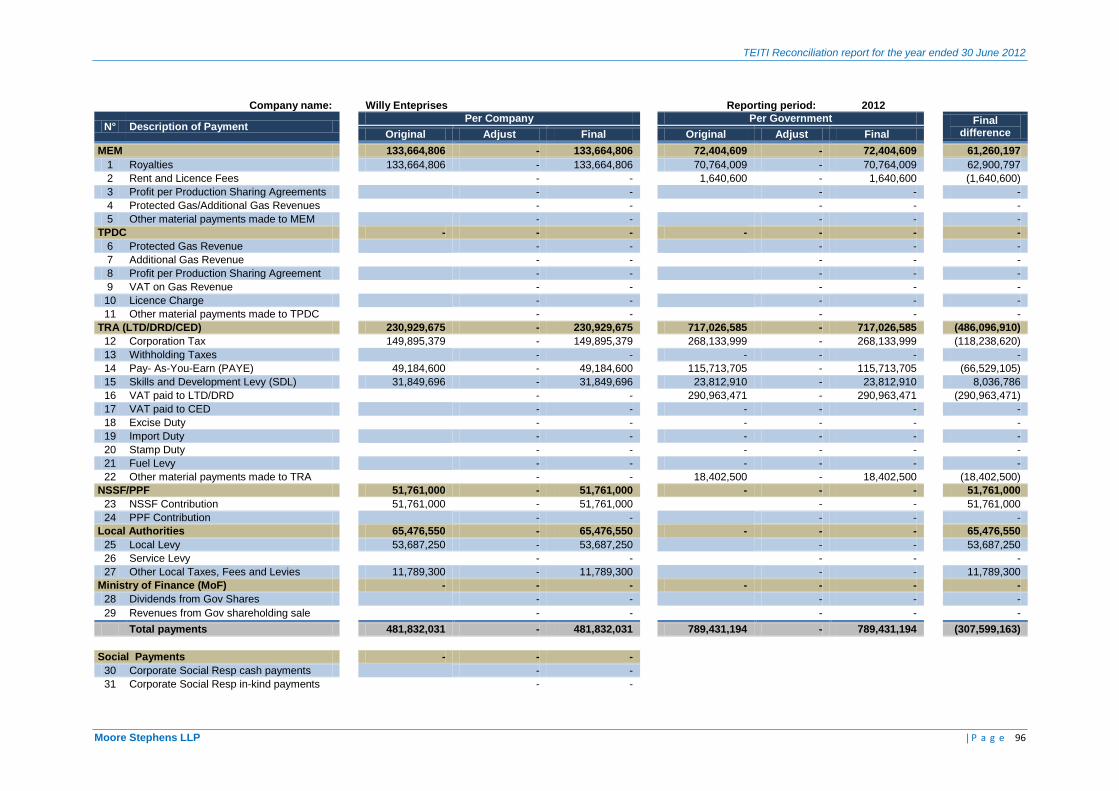
TEITI Reconciliation report for the year ended 30 June 2012
Moore Stephens LLP | P a g e 96
Company name:
Willy Enteprises
Reporting period: 2012
N° Description of Payment Per Company
Per Government
Final difference
Original Adjust Final
Original Adjust Final
MEM
133,664,806 - 133,664,806
72,404,609 - 72,404,609
61,260,197
1 Royalties
133,664,806 - 133,664,806
70,764,009 - 70,764,009
62,900,797
2 Rent and Licence Fees
- -
1,640,600 - 1,640,600
(1,640,600)
3 Profit per Production Sharing Agreements
- -
- -
-
4 Protected Gas/Additional Gas Revenues
- -
- -
-
5 Other material payments made to MEM
- -
- -
-
TPDC
- - -
- - -
-
6 Protected Gas Revenue
- -
- -
-
7 Additional Gas Revenue
- -
- -
-
8 Profit per Production Sharing Agreement
- -
- -
-
9 VAT on Gas Revenue
- -
- -
-
10 Licence Charge
- -
- -
-
11 Other material payments made to TPDC
- -
- -
-
TRA (LTD/DRD/CED)
230,929,675 - 230,929,675
717,026,585 - 717,026,585
(486,096,910)
12 Corporation Tax
149,895,379 - 149,895,379
268,133,999 - 268,133,999
(118,238,620)
13 Withholding Taxes
- -
- - -
-
14 Pay- As-You-Earn (PAYE)
49,184,600 - 49,184,600
115,713,705 - 115,713,705
(66,529,105)
15 Skills and Development Levy (SDL)
31,849,696 - 31,849,696
23,812,910 - 23,812,910
8,036,786
16 VAT paid to LTD/DRD
- -
290,963,471 - 290,963,471
(290,963,471)
17 VAT paid to CED
- -
- - -
-
18 Excise Duty
- -
- - -
-
19 Import Duty
- -
- - -
-
20 Stamp Duty
- -
- - -
-
21 Fuel Levy
- -
- - -
-
22 Other material payments made to TRA
- -
18,402,500 - 18,402,500
(18,402,500)
NSSF/PPF
51,761,000 - 51,761,000
- - -
51,761,000
23 NSSF Contribution
51,761,000 - 51,761,000
- -
51,761,000
24 PPF Contribution
- -
- -
-
Local Authorities
65,476,550 - 65,476,550
- - -
65,476,550
25 Local Levy
53,687,250 - 53,687,250
- -
53,687,250
26 Service Levy
- -
- -
-
27 Other Local Taxes, Fees and Levies
11,789,300 - 11,789,300
- -
11,789,300
Ministry of Finance (MoF)
- - -
- - -
-
28 Dividends from Gov Shares
- -
- -
-
29 Revenues from Gov shareholding sale
- -
- -
-
Total payments
481,832,031 - 481,832,031
789,431,194 - 789,431,194
(307,599,163)
Social Payments
- - -
30 Corporate Social Resp cash payments
- -
31 Corporate Social Resp in-kind payments
- -
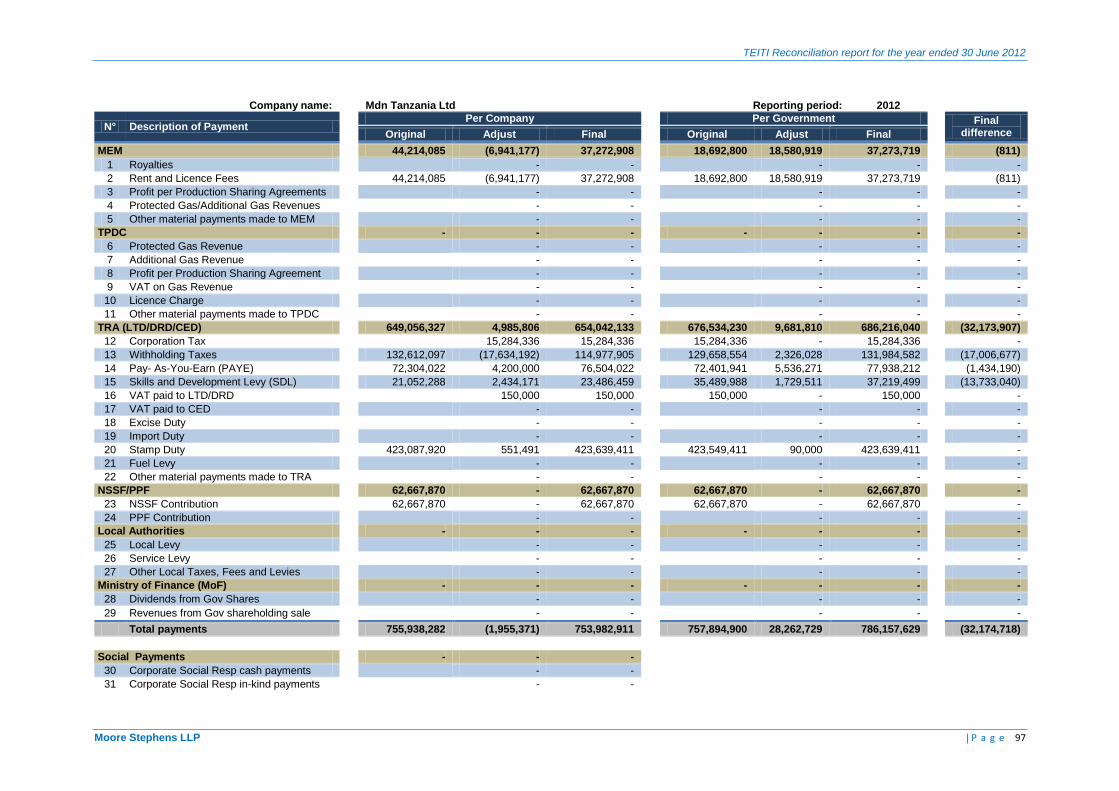
TEITI Reconciliation report for the year ended 30 June 2012
Moore Stephens LLP | P a g e 97
Company name:
Mdn Tanzania Ltd
Reporting period: 2012
N° Description of Payment Per Company
Per Government
Final difference
Original Adjust Final
Original Adjust Final
MEM
44,214,085 (6,941,177) 37,272,908
18,692,800 18,580,919 37,273,719
(811)
1 Royalties
- -
- -
-
2 Rent and Licence Fees
44,214,085 (6,941,177) 37,272,908
18,692,800 18,580,919 37,273,719
(811)
3 Profit per Production Sharing Agreements
- -
- -
-
4 Protected Gas/Additional Gas Revenues
- -
- -
-
5 Other material payments made to MEM
- -
- -
-
TPDC
- - -
- - -
-
6 Protected Gas Revenue
- -
- -
-
7 Additional Gas Revenue
- -
- -
-
8 Profit per Production Sharing Agreement
- -
- -
-
9 VAT on Gas Revenue
- -
- -
-
10 Licence Charge
- -
- -
-
11 Other material payments made to TPDC
- -
- -
-
TRA (LTD/DRD/CED)
649,056,327 4,985,806 654,042,133
676,534,230 9,681,810 686,216,040
(32,173,907)
12 Corporation Tax
15,284,336 15,284,336
15,284,336 - 15,284,336
-
13 Withholding Taxes
132,612,097 (17,634,192) 114,977,905
129,658,554 2,326,028 131,984,582
(17,006,677)
14 Pay- As-You-Earn (PAYE)
72,304,022 4,200,000 76,504,022
72,401,941 5,536,271 77,938,212
(1,434,190)
15 Skills and Development Levy (SDL)
21,052,288 2,434,171 23,486,459
35,489,988 1,729,511 37,219,499
(13,733,040)
16 VAT paid to LTD/DRD
150,000 150,000
150,000 - 150,000
-
17 VAT paid to CED
- -
- -
-
18 Excise Duty
- -
- -
-
19 Import Duty
- -
- -
-
20 Stamp Duty
423,087,920 551,491 423,639,411
423,549,411 90,000 423,639,411
-
21 Fuel Levy
- -
- -
-
22 Other material payments made to TRA
- -
- -
-
NSSF/PPF
62,667,870 - 62,667,870
62,667,870 - 62,667,870
-
23 NSSF Contribution
62,667,870 - 62,667,870
62,667,870 - 62,667,870
-
24 PPF Contribution
- -
- -
-
Local Authorities
- - -
- - -
-
25 Local Levy
- -
- -
-
26 Service Levy
- -
- -
-
27 Other Local Taxes, Fees and Levies
- -
- -
-
Ministry of Finance (MoF)
- - -
- - -
-
28 Dividends from Gov Shares
- -
- -
-
29 Revenues from Gov shareholding sale
- -
- -
-
Total payments
755,938,282 (1,955,371) 753,982,911
757,894,900 28,262,729 786,157,629
(32,174,718)
Social Payments
- - -
30 Corporate Social Resp cash payments
- -
31 Corporate Social Resp in-kind payments
- -
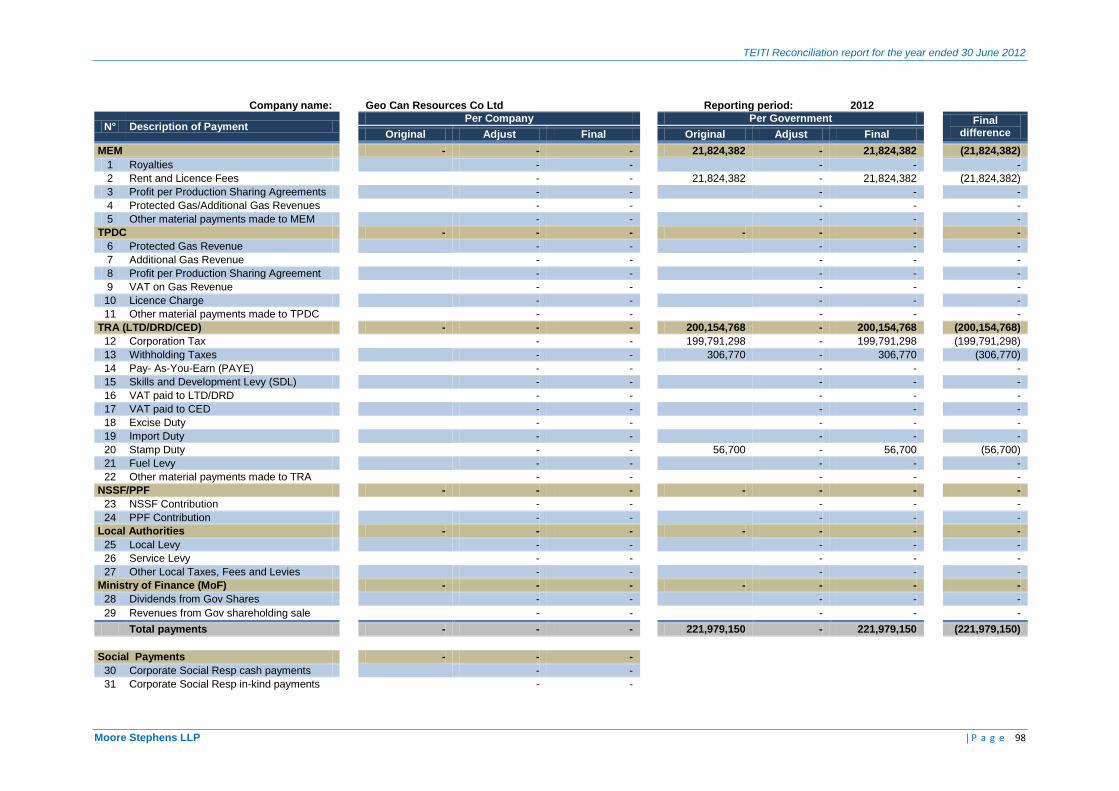
TEITI Reconciliation report for the year ended 30 June 2012
Moore Stephens LLP | P a g e 98
Company name:
Geo Can Resources Co Ltd
Reporting period: 2012
N° Description of Payment Per Company
Per Government
Final difference
Original Adjust Final
Original Adjust Final
MEM
- - -
21,824,382 - 21,824,382
(21,824,382)
1 Royalties
- -
- -
-
2 Rent and Licence Fees
- -
21,824,382 - 21,824,382
(21,824,382)
3 Profit per Production Sharing Agreements
- -
- -
-
4 Protected Gas/Additional Gas Revenues
- -
- -
-
5 Other material payments made to MEM
- -
- -
-
TPDC
- - -
- - -
-
6 Protected Gas Revenue
- -
- -
-
7 Additional Gas Revenue
- -
- -
-
8 Profit per Production Sharing Agreement
- -
- -
-
9 VAT on Gas Revenue
- -
- -
-
10 Licence Charge
- -
- -
-
11 Other material payments made to TPDC
- -
- -
-
TRA (LTD/DRD/CED)
- - -
200,154,768 - 200,154,768
(200,154,768)
12 Corporation Tax
- -
199,791,298 - 199,791,298
(199,791,298)
13 Withholding Taxes
- -
306,770 - 306,770
(306,770)
14 Pay- As-You-Earn (PAYE)
- -
- -
-
15 Skills and Development Levy (SDL)
- -
- -
-
16 VAT paid to LTD/DRD
- -
- -
-
17 VAT paid to CED
- -
- -
-
18 Excise Duty
- -
- -
-
19 Import Duty
- -
- -
-
20 Stamp Duty
- -
56,700 - 56,700
(56,700)
21 Fuel Levy
- -
- -
-
22 Other material payments made to TRA
- -
- -
-
NSSF/PPF
- - -
- - -
-
23 NSSF Contribution
- -
- -
-
24 PPF Contribution
- -
- -
-
Local Authorities
- - -
- - -
-
25 Local Levy
- -
- -
-
26 Service Levy
- -
- -
-
27 Other Local Taxes, Fees and Levies
- -
- -
-
Ministry of Finance (MoF)
- - -
- - -
-
28 Dividends from Gov Shares
- -
- -
-
29 Revenues from Gov shareholding sale
- -
- -
-
Total payments
- - -
221,979,150 - 221,979,150
(221,979,150)
Social Payments
- - -
30 Corporate Social Resp cash payments
- -
31 Corporate Social Resp in-kind payments
- -
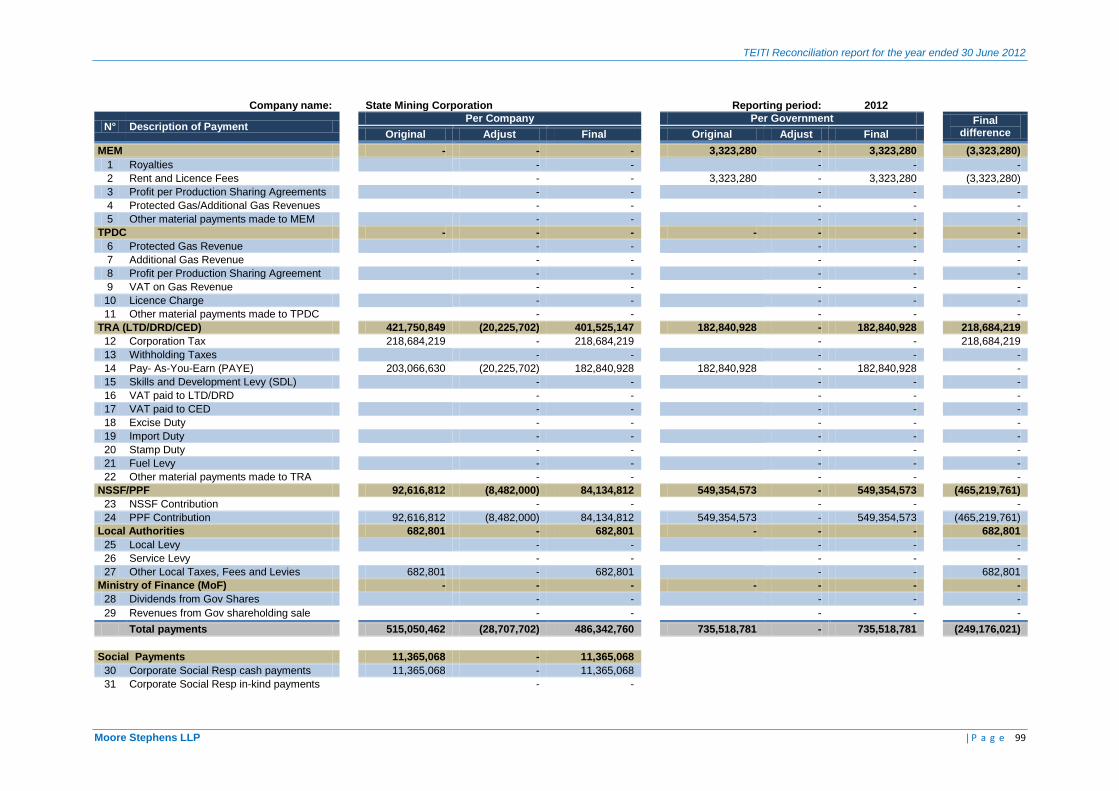
TEITI Reconciliation report for the year ended 30 June 2012
Moore Stephens LLP | P a g e 99
Company name:
State Mining Corporation
Reporting period: 2012
N° Description of Payment Per Company
Per Government
Final difference
Original Adjust Final
Original Adjust Final
MEM
- - -
3,323,280 - 3,323,280
(3,323,280)
1 Royalties
- -
- -
-
2 Rent and Licence Fees
- -
3,323,280 - 3,323,280
(3,323,280)
3 Profit per Production Sharing Agreements
- -
- -
-
4 Protected Gas/Additional Gas Revenues
- -
- -
-
5 Other material payments made to MEM
- -
- -
-
TPDC
- - -
- - -
-
6 Protected Gas Revenue
- -
- -
-
7 Additional Gas Revenue
- -
- -
-
8 Profit per Production Sharing Agreement
- -
- -
-
9 VAT on Gas Revenue
- -
- -
-
10 Licence Charge
- -
- -
-
11 Other material payments made to TPDC
- -
- -
-
TRA (LTD/DRD/CED)
421,750,849 (20,225,702) 401,525,147
182,840,928 - 182,840,928
218,684,219
12 Corporation Tax
218,684,219 - 218,684,219
- -
218,684,219
13 Withholding Taxes
- -
- -
-
14 Pay- As-You-Earn (PAYE)
203,066,630 (20,225,702) 182,840,928
182,840,928 - 182,840,928
-
15 Skills and Development Levy (SDL)
- -
- -
-
16 VAT paid to LTD/DRD
- -
- -
-
17 VAT paid to CED
- -
- -
-
18 Excise Duty
- -
- -
-
19 Import Duty
- -
- -
-
20 Stamp Duty
- -
- -
-
21 Fuel Levy
- -
- -
-
22 Other material payments made to TRA
- -
- -
-
NSSF/PPF
92,616,812 (8,482,000) 84,134,812
549,354,573 - 549,354,573
(465,219,761)
23 NSSF Contribution
- -
- -
-
24 PPF Contribution
92,616,812 (8,482,000) 84,134,812
549,354,573 - 549,354,573
(465,219,761)
Local Authorities
682,801 - 682,801
- - -
682,801
25 Local Levy
- -
- -
-
26 Service Levy
- -
- -
-
27 Other Local Taxes, Fees and Levies
682,801 - 682,801
- -
682,801
Ministry of Finance (MoF)
- - -
- - -
-
28 Dividends from Gov Shares
- -
- -
-
29 Revenues from Gov shareholding sale
- -
- -
-
Total payments
515,050,462 (28,707,702) 486,342,760
735,518,781 - 735,518,781
(249,176,021)
Social Payments
11,365,068 - 11,365,068
30 Corporate Social Resp cash payments
11,365,068 - 11,365,068
31 Corporate Social Resp in-kind payments
- -
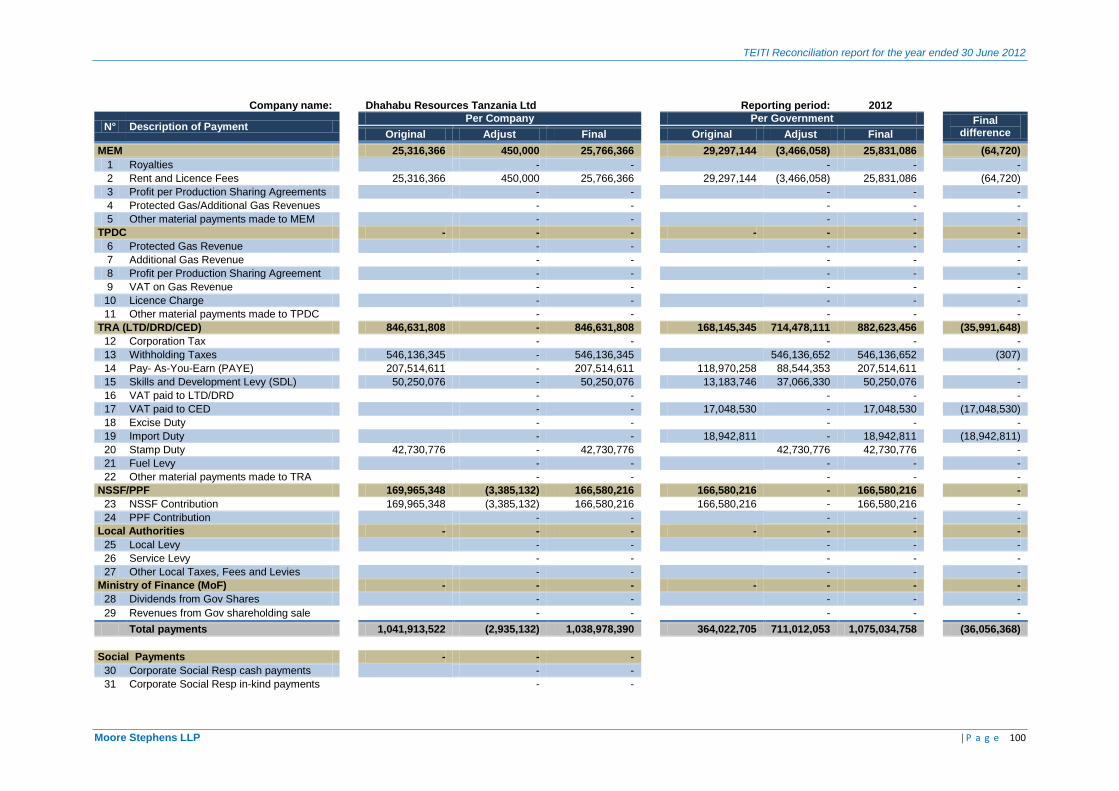
TEITI Reconciliation report for the year ended 30 June 2012
Moore Stephens LLP | P a g e 100
Company name:
Dhahabu Resources Tanzania Ltd
Reporting period: 2012
N° Description of Payment Per Company
Per Government
Final difference
Original Adjust Final
Original Adjust Final
MEM
25,316,366 450,000 25,766,366
29,297,144 (3,466,058) 25,831,086
(64,720)
1 Royalties
- -
- -
-
2 Rent and Licence Fees
25,316,366 450,000 25,766,366
29,297,144 (3,466,058) 25,831,086
(64,720)
3 Profit per Production Sharing Agreements
- -
- -
-
4 Protected Gas/Additional Gas Revenues
- -
- -
-
5 Other material payments made to MEM
- -
- -
-
TPDC
- - -
- - -
-
6 Protected Gas Revenue
- -
- -
-
7 Additional Gas Revenue
- -
- -
-
8 Profit per Production Sharing Agreement
- -
- -
-
9 VAT on Gas Revenue
- -
- -
-
10 Licence Charge
- -
- -
-
11 Other material payments made to TPDC
- -
- -
-
TRA (LTD/DRD/CED)
846,631,808 - 846,631,808
168,145,345 714,478,111 882,623,456
(35,991,648)
12 Corporation Tax
- -
- -
-
13 Withholding Taxes
546,136,345 - 546,136,345
546,136,652 546,136,652
(307)
14 Pay- As-You-Earn (PAYE)
207,514,611 - 207,514,611
118,970,258 88,544,353 207,514,611
-
15 Skills and Development Levy (SDL)
50,250,076 - 50,250,076
13,183,746 37,066,330 50,250,076
-
16 VAT paid to LTD/DRD
- -
- -
-
17 VAT paid to CED
- -
17,048,530 - 17,048,530
(17,048,530)
18 Excise Duty
- -
- -
-
19 Import Duty
- -
18,942,811 - 18,942,811
(18,942,811)
20 Stamp Duty
42,730,776 - 42,730,776
42,730,776 42,730,776
-
21 Fuel Levy
- -
- -
-
22 Other material payments made to TRA
- -
- -
-
NSSF/PPF
169,965,348 (3,385,132) 166,580,216
166,580,216 - 166,580,216
-
23 NSSF Contribution
169,965,348 (3,385,132) 166,580,216
166,580,216 - 166,580,216
-
24 PPF Contribution
- -
- -
-
Local Authorities
- - -
- - -
-
25 Local Levy
- -
- -
-
26 Service Levy
- -
- -
-
27 Other Local Taxes, Fees and Levies
- -
- -
-
Ministry of Finance (MoF)
- - -
- - -
-
28 Dividends from Gov Shares
- -
- -
-
29 Revenues from Gov shareholding sale
- -
- -
-
Total payments
1,041,913,522 (2,935,132) 1,038,978,390
364,022,705 711,012,053 1,075,034,758
(36,056,368)
Social Payments
- - -
30 Corporate Social Resp cash payments
- -
31 Corporate Social Resp in-kind payments
- -
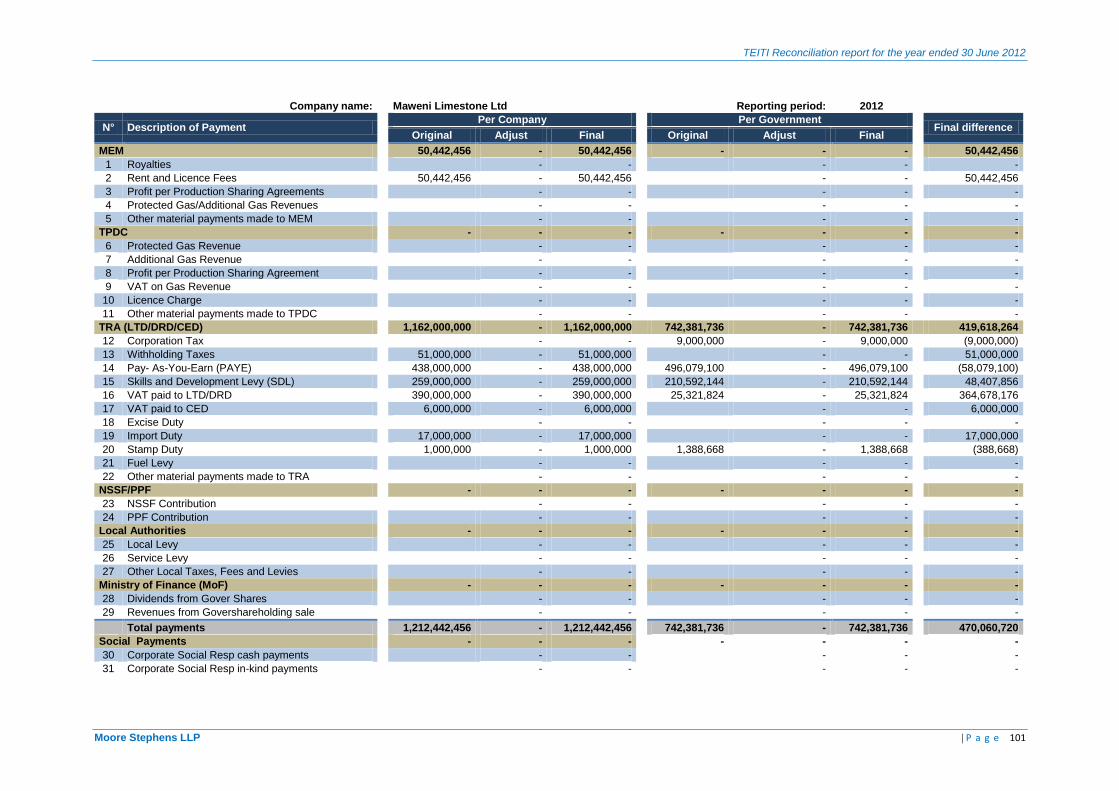
TEITI Reconciliation report for the year ended 30 June 2012
Moore Stephens LLP | P a g e 101
Company name:
Maweni Limestone Ltd
Reporting period: 2012
N° Description of Payment Per Company
Per Government
Final difference
Original Adjust Final
Original Adjust Final
MEM
50,442,456 - 50,442,456
- - -
50,442,456
1 Royalties
- -
- -
-
2 Rent and Licence Fees
50,442,456 - 50,442,456
- -
50,442,456
3 Profit per Production Sharing Agreements
- -
- -
-
4 Protected Gas/Additional Gas Revenues
- -
- -
-
5 Other material payments made to MEM
- -
- -
-
TPDC
- - -
- - -
-
6 Protected Gas Revenue
- -
- -
-
7 Additional Gas Revenue
- -
- -
-
8 Profit per Production Sharing Agreement
- -
- -
-
9 VAT on Gas Revenue
- -
- -
-
10 Licence Charge
- -
- -
-
11 Other material payments made to TPDC
- -
- -
-
TRA (LTD/DRD/CED)
1,162,000,000 - 1,162,000,000
742,381,736 - 742,381,736
419,618,264
12 Corporation Tax
- -
9,000,000 - 9,000,000
(9,000,000)
13 Withholding Taxes
51,000,000 - 51,000,000
- -
51,000,000
14 Pay- As-You-Earn (PAYE)
438,000,000 - 438,000,000
496,079,100 - 496,079,100
(58,079,100)
15 Skills and Development Levy (SDL)
259,000,000 - 259,000,000
210,592,144 - 210,592,144
48,407,856
16 VAT paid to LTD/DRD
390,000,000 - 390,000,000
25,321,824 - 25,321,824
364,678,176
17 VAT paid to CED
6,000,000 - 6,000,000
- -
6,000,000
18 Excise Duty
- -
- -
-
19 Import Duty
17,000,000 - 17,000,000
- -
17,000,000
20 Stamp Duty
1,000,000 - 1,000,000
1,388,668 - 1,388,668
(388,668)
21 Fuel Levy
- -
- -
-
22 Other material payments made to TRA
- -
- -
-
NSSF/PPF
- - -
- - -
-
23 NSSF Contribution
- -
- -
-
24 PPF Contribution
- -
- -
-
Local Authorities
- - -
- - -
-
25 Local Levy
- -
- -
-
26 Service Levy
- -
- -
-
27 Other Local Taxes, Fees and Levies
- -
- -
-
Ministry of Finance (MoF)
- - -
- - -
-
28 Dividends from Gover Shares
- -
- -
-
29 Revenues from Govershareholding sale
- -
- -
-
Total payments
1,212,442,456 - 1,212,442,456
742,381,736 - 742,381,736
470,060,720
Social Payments
- - -
- - -
-
30 Corporate Social Resp cash payments
- -
- -
-
31 Corporate Social Resp in-kind payments
- -
- -
-
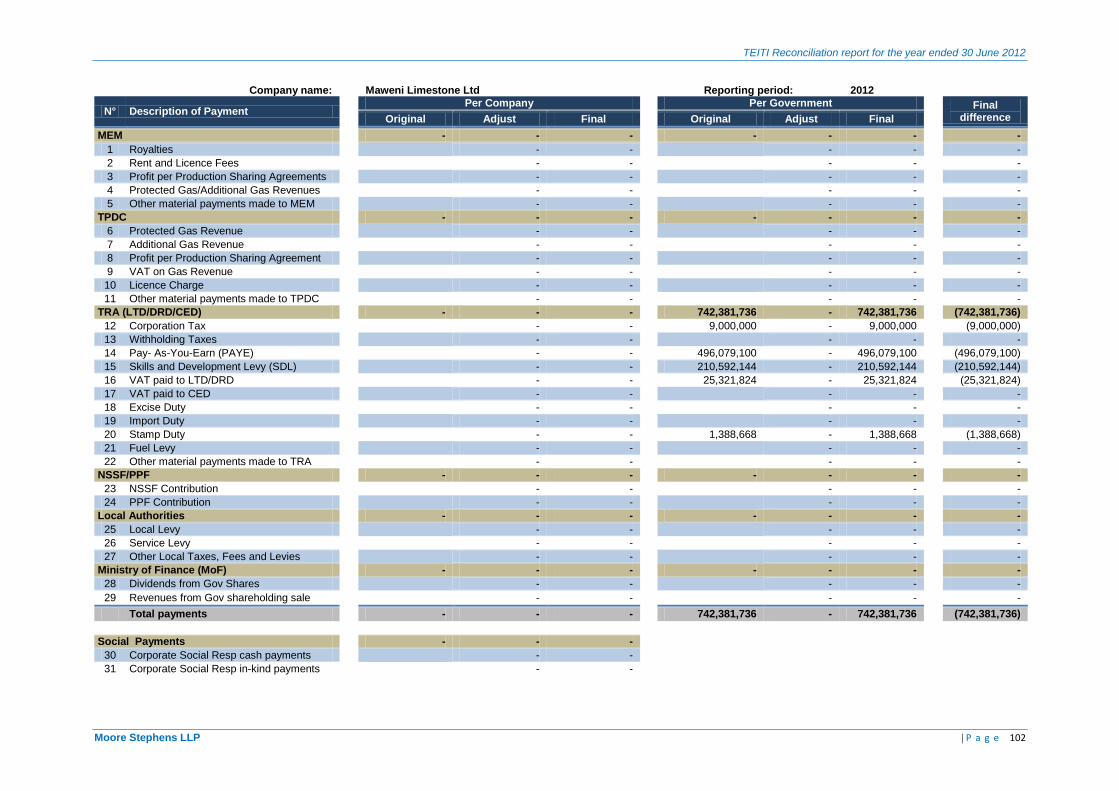
TEITI Reconciliation report for the year ended 30 June 2012
Moore Stephens LLP | P a g e 102
Company name:
Maweni Limestone Ltd
Reporting period: 2012
N° Description of Payment Per Company
Per Government
Final difference
Original Adjust Final
Original Adjust Final
MEM
- - -
- - -
-
1 Royalties
- -
- -
-
2 Rent and Licence Fees
- -
- -
-
3 Profit per Production Sharing Agreements
- -
- -
-
4 Protected Gas/Additional Gas Revenues
- -
- -
-
5 Other material payments made to MEM
- -
- -
-
TPDC
- - -
- - -
-
6 Protected Gas Revenue
- -
- -
-
7 Additional Gas Revenue
- -
- -
-
8 Profit per Production Sharing Agreement
- -
- -
-
9 VAT on Gas Revenue
- -
- -
-
10 Licence Charge
- -
- -
-
11 Other material payments made to TPDC
- -
- -
-
TRA (LTD/DRD/CED)
- - -
742,381,736 - 742,381,736
(742,381,736)
12 Corporation Tax
- -
9,000,000 - 9,000,000
(9,000,000)
13 Withholding Taxes
- -
- -
-
14 Pay- As-You-Earn (PAYE)
- -
496,079,100 - 496,079,100
(496,079,100)
15 Skills and Development Levy (SDL)
- -
210,592,144 - 210,592,144
(210,592,144)
16 VAT paid to LTD/DRD
- -
25,321,824 - 25,321,824
(25,321,824)
17 VAT paid to CED
- -
- -
-
18 Excise Duty
- -
- -
-
19 Import Duty
- -
- -
-
20 Stamp Duty
- -
1,388,668 - 1,388,668
(1,388,668)
21 Fuel Levy
- -
- -
-
22 Other material payments made to TRA
- -
- -
-
NSSF/PPF
- - -
- - -
-
23 NSSF Contribution
- -
- -
-
24 PPF Contribution
- -
- -
-
Local Authorities
- - -
- - -
-
25 Local Levy
- -
- -
-
26 Service Levy
- -
- -
-
27 Other Local Taxes, Fees and Levies
- -
- -
-
Ministry of Finance (MoF)
- - -
- - -
-
28 Dividends from Gov Shares
- -
- -
-
29 Revenues from Gov shareholding sale
- -
- -
-
Total payments
- - -
742,381,736 - 742,381,736
(742,381,736)
Social Payments
- - -
30 Corporate Social Resp cash payments
- -
31 Corporate Social Resp in-kind payments
- -
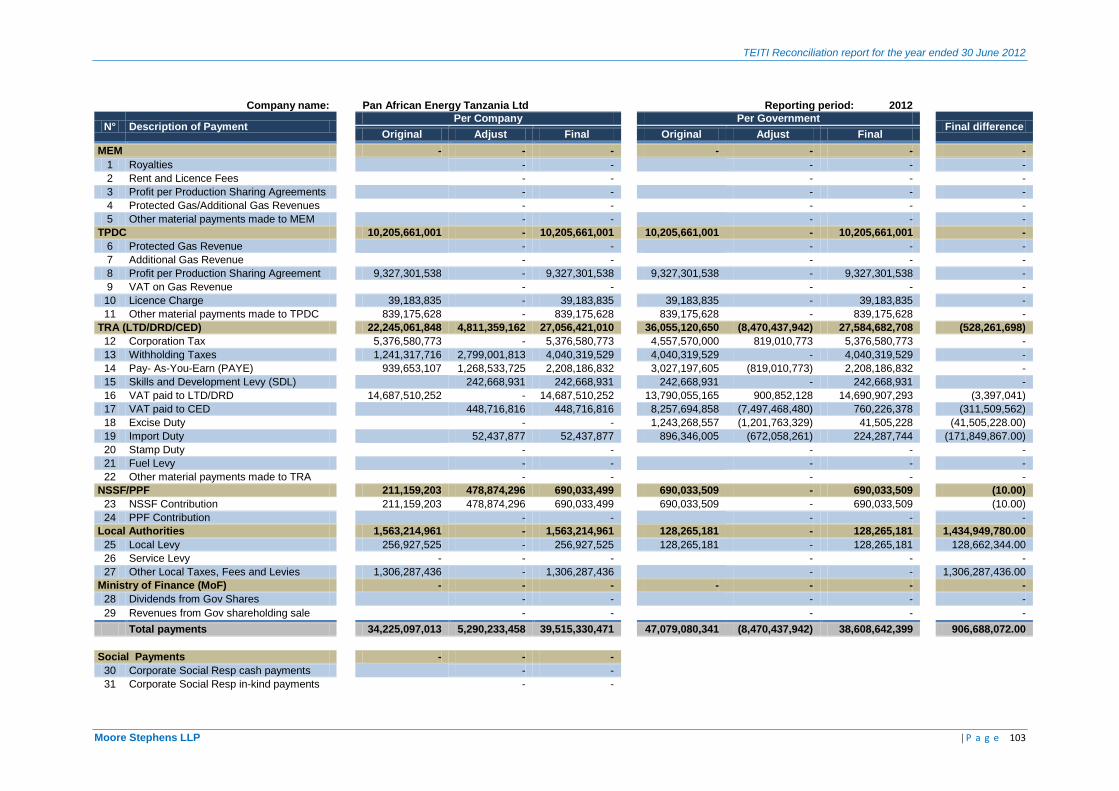
TEITI Reconciliation report for the year ended 30 June 2012
Moore Stephens LLP | P a g e 103
Company name:
Pan African Energy Tanzania Ltd
Reporting period: 2012
N° Description of Payment Per Company
Per Government
Final difference
Original Adjust Final
Original Adjust Final
MEM
- - -
- - -
-
1 Royalties
- -
- -
-
2 Rent and Licence Fees
- -
- -
-
3 Profit per Production Sharing Agreements
- -
- -
-
4 Protected Gas/Additional Gas Revenues
- -
- -
-
5 Other material payments made to MEM
- -
- -
-
TPDC
10,205,661,001 - 10,205,661,001
10,205,661,001 - 10,205,661,001
-
6 Protected Gas Revenue
- -
- -
-
7 Additional Gas Revenue
- -
- -
-
8 Profit per Production Sharing Agreement
9,327,301,538 - 9,327,301,538
9,327,301,538 - 9,327,301,538
-
9 VAT on Gas Revenue
- -
- -
-
10 Licence Charge
39,183,835 - 39,183,835
39,183,835 - 39,183,835
-
11 Other material payments made to TPDC
839,175,628 - 839,175,628
839,175,628 - 839,175,628
-
TRA (LTD/DRD/CED)
22,245,061,848 4,811,359,162 27,056,421,010
36,055,120,650 (8,470,437,942) 27,584,682,708
(528,261,698)
12 Corporation Tax
5,376,580,773 - 5,376,580,773
4,557,570,000 819,010,773 5,376,580,773
-
13 Withholding Taxes
1,241,317,716 2,799,001,813 4,040,319,529
4,040,319,529 - 4,040,319,529
-
14 Pay- As-You-Earn (PAYE)
939,653,107 1,268,533,725 2,208,186,832
3,027,197,605 (819,010,773) 2,208,186,832
-
15 Skills and Development Levy (SDL)
242,668,931 242,668,931
242,668,931 - 242,668,931
-
16 VAT paid to LTD/DRD
14,687,510,252 - 14,687,510,252
13,790,055,165 900,852,128 14,690,907,293
(3,397,041)
17 VAT paid to CED
448,716,816 448,716,816
8,257,694,858 (7,497,468,480) 760,226,378
(311,509,562)
18 Excise Duty
- -
1,243,268,557 (1,201,763,329) 41,505,228
(41,505,228.00)
19 Import Duty
52,437,877 52,437,877
896,346,005 (672,058,261) 224,287,744
(171,849,867.00)
20 Stamp Duty
- -
- -
-
21 Fuel Levy
- -
- -
-
22 Other material payments made to TRA
- -
- -
-
NSSF/PPF
211,159,203 478,874,296 690,033,499
690,033,509 - 690,033,509
(10.00)
23 NSSF Contribution
211,159,203 478,874,296 690,033,499
690,033,509 - 690,033,509
(10.00)
24 PPF Contribution
- -
- -
-
Local Authorities
1,563,214,961 - 1,563,214,961
128,265,181 - 128,265,181
1,434,949,780.00
25 Local Levy
256,927,525 - 256,927,525
128,265,181 - 128,265,181
128,662,344.00
26 Service Levy
- - -
- -
-
27 Other Local Taxes, Fees and Levies
1,306,287,436 - 1,306,287,436
- -
1,306,287,436.00
Ministry of Finance (MoF)
- - -
- - -
-
28 Dividends from Gov Shares
- -
- -
-
29 Revenues from Gov shareholding sale
- -
- -
-
Total payments
34,225,097,013 5,290,233,458 39,515,330,471
47,079,080,341 (8,470,437,942) 38,608,642,399
906,688,072.00
Social Payments
- - -
30 Corporate Social Resp cash payments
- -
31 Corporate Social Resp in-kind payments
- -
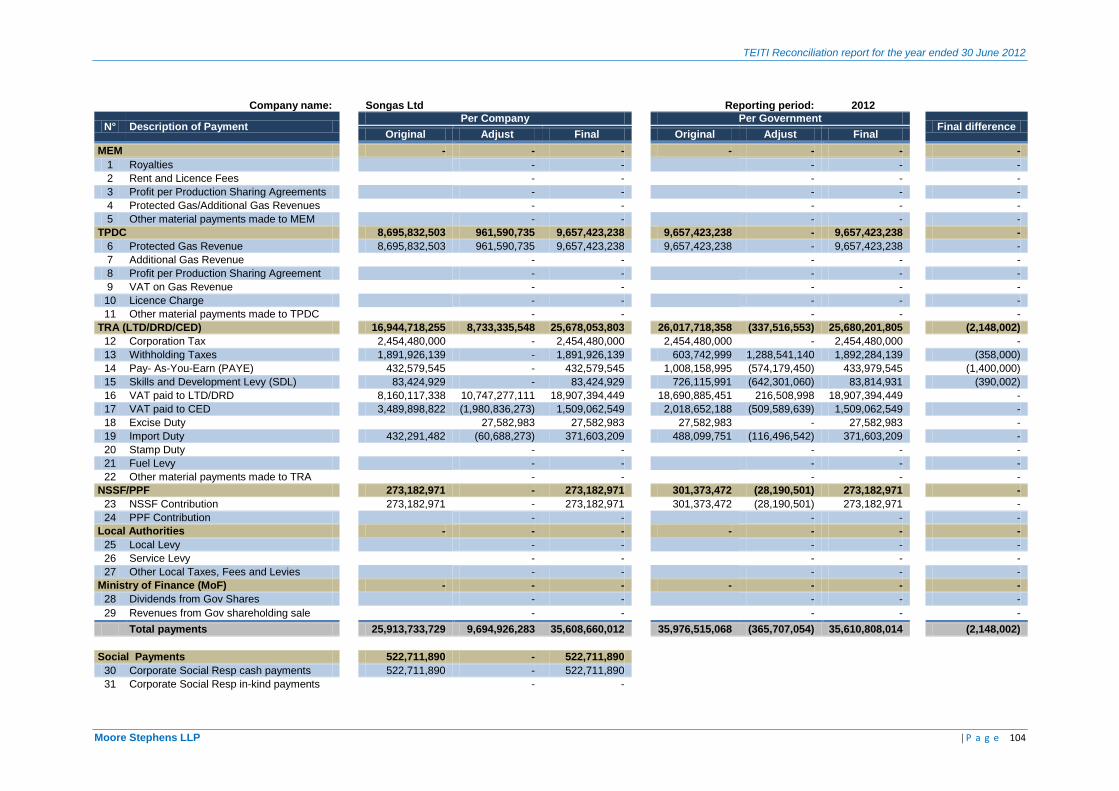
TEITI Reconciliation report for the year ended 30 June 2012
Moore Stephens LLP | P a g e 104
Company name:
Songas Ltd
Reporting period: 2012
N° Description of Payment Per Company
Per Government
Final difference
Original Adjust Final
Original Adjust Final
MEM
- - -
- - -
-
1 Royalties
- -
- -
-
2 Rent and Licence Fees
- -
- -
-
3 Profit per Production Sharing Agreements
- -
- -
-
4 Protected Gas/Additional Gas Revenues
- -
- -
-
5 Other material payments made to MEM
- -
- -
-
TPDC
8,695,832,503 961,590,735 9,657,423,238
9,657,423,238 - 9,657,423,238
-
6 Protected Gas Revenue
8,695,832,503 961,590,735 9,657,423,238
9,657,423,238 - 9,657,423,238
-
7 Additional Gas Revenue
- -
- -
-
8 Profit per Production Sharing Agreement
- -
- -
-
9 VAT on Gas Revenue
- -
- -
-
10 Licence Charge
- -
- -
-
11 Other material payments made to TPDC
- -
- -
-
TRA (LTD/DRD/CED)
16,944,718,255 8,733,335,548 25,678,053,803
26,017,718,358 (337,516,553) 25,680,201,805
(2,148,002)
12 Corporation Tax
2,454,480,000 - 2,454,480,000
2,454,480,000 - 2,454,480,000
-
13 Withholding Taxes
1,891,926,139 - 1,891,926,139
603,742,999 1,288,541,140 1,892,284,139
(358,000)
14 Pay- As-You-Earn (PAYE)
432,579,545 - 432,579,545
1,008,158,995 (574,179,450) 433,979,545
(1,400,000)
15 Skills and Development Levy (SDL)
83,424,929 - 83,424,929
726,115,991 (642,301,060) 83,814,931
(390,002)
16 VAT paid to LTD/DRD
8,160,117,338 10,747,277,111 18,907,394,449
18,690,885,451 216,508,998 18,907,394,449
-
17 VAT paid to CED
3,489,898,822 (1,980,836,273) 1,509,062,549
2,018,652,188 (509,589,639) 1,509,062,549
-
18 Excise Duty
27,582,983 27,582,983
27,582,983 - 27,582,983
-
19 Import Duty
432,291,482 (60,688,273) 371,603,209
488,099,751 (116,496,542) 371,603,209
-
20 Stamp Duty
- -
- -
-
21 Fuel Levy
- -
- -
-
22 Other material payments made to TRA
- -
- -
-
NSSF/PPF
273,182,971 - 273,182,971
301,373,472 (28,190,501) 273,182,971
-
23 NSSF Contribution
273,182,971 - 273,182,971
301,373,472 (28,190,501) 273,182,971
-
24 PPF Contribution
- -
- -
-
Local Authorities
- - -
- - -
-
25 Local Levy
- -
- -
-
26 Service Levy
- -
- -
-
27 Other Local Taxes, Fees and Levies
- -
- -
-
Ministry of Finance (MoF)
- - -
- - -
-
28 Dividends from Gov Shares
- -
- -
-
29 Revenues from Gov shareholding sale
- -
- -
-
Total payments
25,913,733,729 9,694,926,283 35,608,660,012
35,976,515,068 (365,707,054) 35,610,808,014
(2,148,002)
Social Payments
522,711,890 - 522,711,890
30 Corporate Social Resp cash payments
522,711,890 - 522,711,890
31 Corporate Social Resp in-kind payments
- -
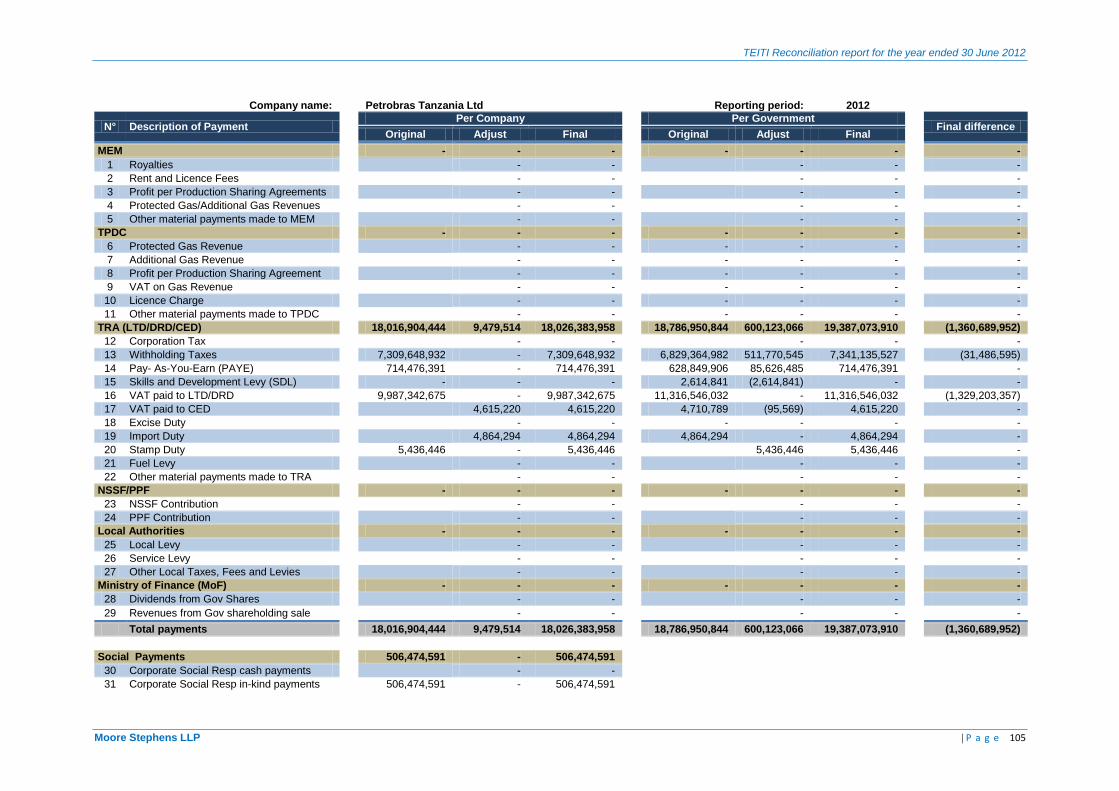
TEITI Reconciliation report for the year ended 30 June 2012
Moore Stephens LLP | P a g e 105
Company name:
Petrobras Tanzania Ltd
Reporting period: 2012
N° Description of Payment Per Company
Per Government
Final difference
Original Adjust Final
Original Adjust Final
MEM
- - -
- - -
-
1 Royalties
- -
- -
-
2 Rent and Licence Fees
- -
- -
-
3 Profit per Production Sharing Agreements
- -
- -
-
4 Protected Gas/Additional Gas Revenues
- -
- -
-
5 Other material payments made to MEM
- -
- -
-
TPDC
- - -
- - -
-
6 Protected Gas Revenue
- -
- - -
-
7 Additional Gas Revenue
- -
- - -
-
8 Profit per Production Sharing Agreement
- -
- - -
-
9 VAT on Gas Revenue
- -
- - -
-
10 Licence Charge
- -
- - -
-
11 Other material payments made to TPDC
- -
- - -
-
TRA (LTD/DRD/CED)
18,016,904,444 9,479,514 18,026,383,958
18,786,950,844 600,123,066 19,387,073,910
(1,360,689,952)
12 Corporation Tax
- -
- -
-
13 Withholding Taxes
7,309,648,932 - 7,309,648,932
6,829,364,982 511,770,545 7,341,135,527
(31,486,595)
14 Pay- As-You-Earn (PAYE)
714,476,391 - 714,476,391
628,849,906 85,626,485 714,476,391
-
15 Skills and Development Levy (SDL)
- - -
2,614,841 (2,614,841) -
-
16 VAT paid to LTD/DRD
9,987,342,675 - 9,987,342,675
11,316,546,032 - 11,316,546,032
(1,329,203,357)
17 VAT paid to CED
4,615,220 4,615,220
4,710,789 (95,569) 4,615,220
-
18 Excise Duty
- -
- - -
-
19 Import Duty
4,864,294 4,864,294
4,864,294 - 4,864,294
-
20 Stamp Duty
5,436,446 - 5,436,446
5,436,446 5,436,446
-
21 Fuel Levy
- -
- -
-
22 Other material payments made to TRA
- -
- -
-
NSSF/PPF
- - -
- - -
-
23 NSSF Contribution
- -
- -
-
24 PPF Contribution
- -
- -
-
Local Authorities
- - -
- - -
-
25 Local Levy
- -
- -
-
26 Service Levy
- -
- -
-
27 Other Local Taxes, Fees and Levies
- -
- -
-
Ministry of Finance (MoF)
- - -
- - -
-
28 Dividends from Gov Shares
- -
- -
-
29 Revenues from Gov shareholding sale
- -
- -
-
Total payments
18,016,904,444 9,479,514 18,026,383,958
18,786,950,844 600,123,066 19,387,073,910
(1,360,689,952)
Social Payments
506,474,591 - 506,474,591
30 Corporate Social Resp cash payments
- -
31 Corporate Social Resp in-kind payments
506,474,591 - 506,474,591
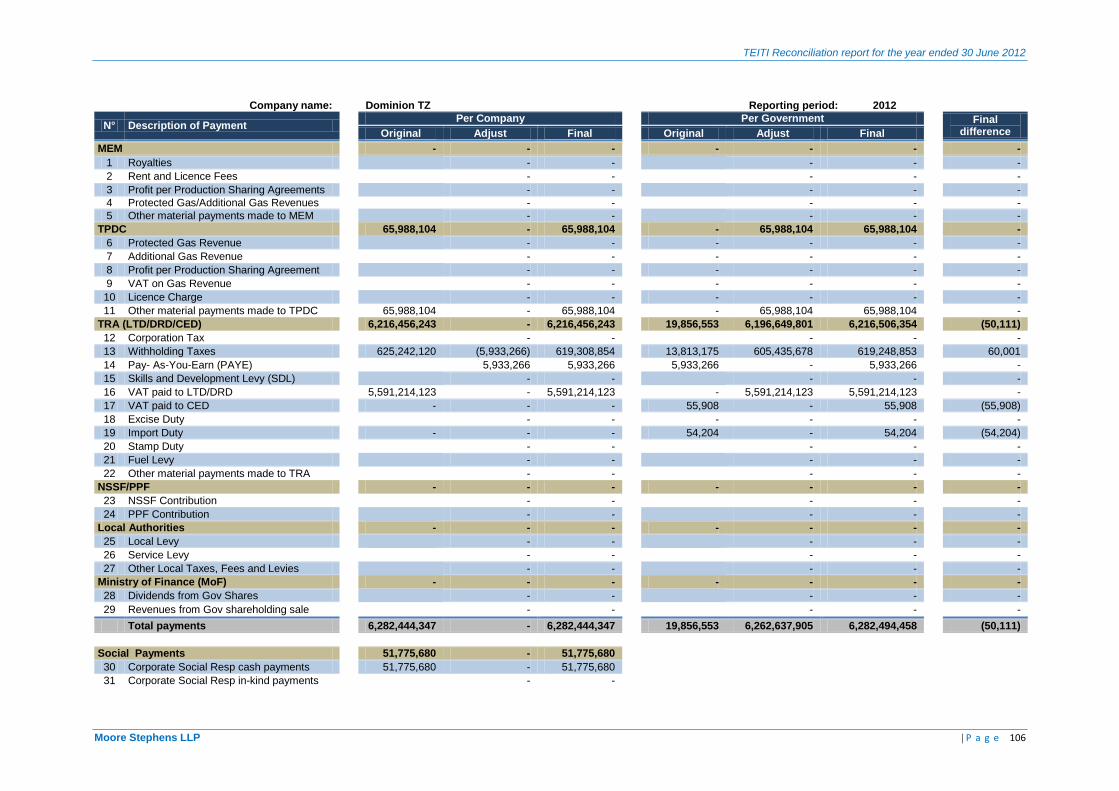
TEITI Reconciliation report for the year ended 30 June 2012
Moore Stephens LLP | P a g e 106
Company name:
Dominion TZ
Reporting period: 2012
N° Description of Payment Per Company
Per Government
Final
difference
Original Adjust Final
Original Adjust Final
MEM
- - -
- - -
-
1 Royalties
- -
- -
-
2 Rent and Licence Fees
- -
- -
-
3 Profit per Production Sharing Agreements
- -
- -
-
4 Protected Gas/Additional Gas Revenues
- -
- -
-
5 Other material payments made to MEM
- -
- -
-
TPDC
65,988,104 - 65,988,104
- 65,988,104 65,988,104
-
6 Protected Gas Revenue
- -
- - -
-
7 Additional Gas Revenue
- -
- - -
-
8 Profit per Production Sharing Agreement
- -
- - -
-
9 VAT on Gas Revenue
- -
- - -
-
10 Licence Charge
- -
- - -
-
11 Other material payments made to TPDC
65,988,104 - 65,988,104
- 65,988,104 65,988,104
-
TRA (LTD/DRD/CED)
6,216,456,243 - 6,216,456,243
19,856,553 6,196,649,801 6,216,506,354
(50,111)
12 Corporation Tax
- -
- -
-
13 Withholding Taxes
625,242,120 (5,933,266) 619,308,854
13,813,175 605,435,678 619,248,853
60,001
14 Pay- As-You-Earn (PAYE)
5,933,266 5,933,266
5,933,266 - 5,933,266
-
15 Skills and Development Levy (SDL)
- -
- -
-
16 VAT paid to LTD/DRD
5,591,214,123 - 5,591,214,123
- 5,591,214,123 5,591,214,123
-
17 VAT paid to CED
- - -
55,908 - 55,908
(55,908)
18 Excise Duty
- -
- - -
-
19 Import Duty
- - -
54,204 - 54,204
(54,204)
20 Stamp Duty
- -
- -
-
21 Fuel Levy
- -
- -
-
22 Other material payments made to TRA
- -
- -
-
NSSF/PPF
- - -
- - -
-
23 NSSF Contribution
- -
- -
-
24 PPF Contribution
- -
- -
-
Local Authorities
- - -
- - -
-
25 Local Levy
- -
- -
-
26 Service Levy
- -
- -
-
27 Other Local Taxes, Fees and Levies
- -
- -
-
Ministry of Finance (MoF)
- - -
- - -
-
28 Dividends from Gov Shares
- -
- -
-
29 Revenues from Gov shareholding sale
- -
- -
-
Total payments
6,282,444,347 - 6,282,444,347
19,856,553 6,262,637,905 6,282,494,458
(50,111)
Social Payments
51,775,680 - 51,775,680
30 Corporate Social Resp cash payments
51,775,680 - 51,775,680
31 Corporate Social Resp in-kind payments
- -
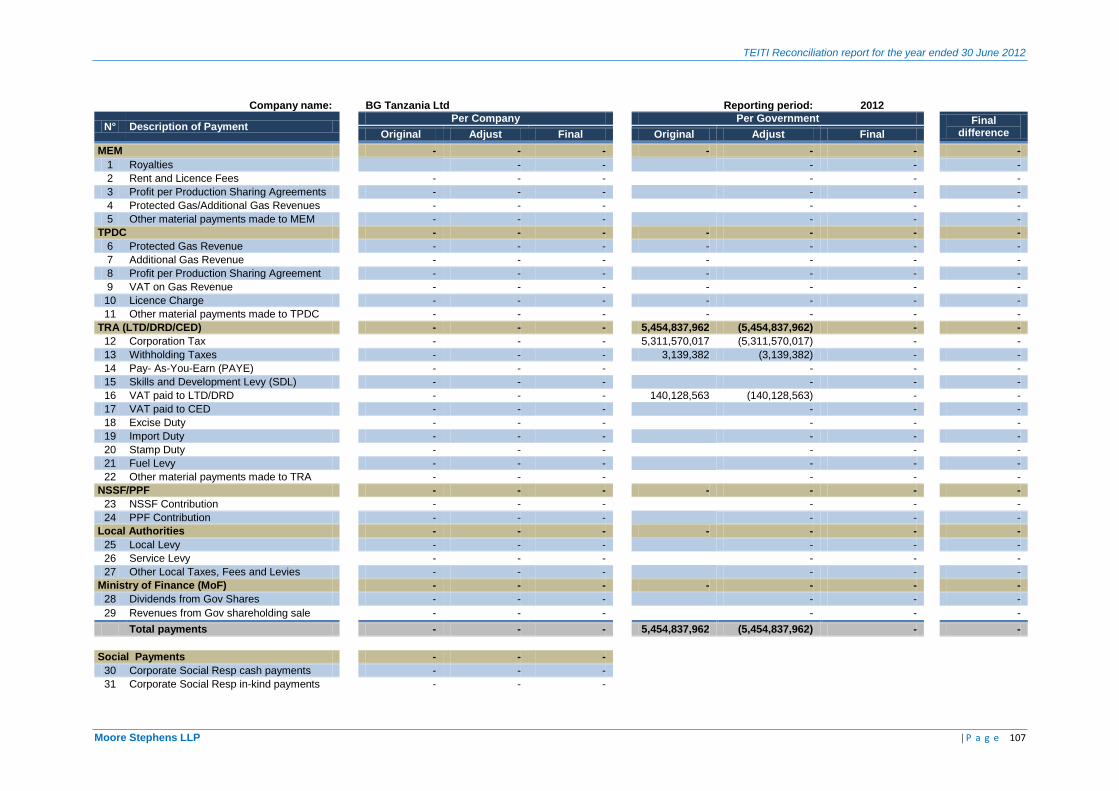
TEITI Reconciliation report for the year ended 30 June 2012
Moore Stephens LLP | P a g e 107
Company name:
BG Tanzania Ltd
Reporting period: 2012
N° Description of Payment Per Company
Per Government
Final difference
Original Adjust Final
Original Adjust Final
MEM
- - -
- - -
-
1 Royalties
- -
- -
-
2 Rent and Licence Fees
- - -
- -
-
3 Profit per Production Sharing Agreements
- - -
- -
-
4 Protected Gas/Additional Gas Revenues
- - -
- -
-
5 Other material payments made to MEM
- - -
- -
-
TPDC
- - -
- - -
-
6 Protected Gas Revenue
- - -
- - -
-
7 Additional Gas Revenue
- - -
- - -
-
8 Profit per Production Sharing Agreement
- - -
- - -
-
9 VAT on Gas Revenue
- - -
- - -
-
10 Licence Charge
- - -
- - -
-
11 Other material payments made to TPDC
- - -
- - -
-
TRA (LTD/DRD/CED)
- - -
5,454,837,962 (5,454,837,962) -
-
12 Corporation Tax
- - -
5,311,570,017 (5,311,570,017) -
-
13 Withholding Taxes
- - -
3,139,382 (3,139,382) -
-
14 Pay- As-You-Earn (PAYE)
- - -
- -
-
15 Skills and Development Levy (SDL)
- - -
- -
-
16 VAT paid to LTD/DRD
- - -
140,128,563 (140,128,563) -
-
17 VAT paid to CED
- - -
- -
-
18 Excise Duty
- - -
- -
-
19 Import Duty
- - -
- -
-
20 Stamp Duty
- - -
- -
-
21 Fuel Levy
- - -
- -
-
22 Other material payments made to TRA
- - -
- -
-
NSSF/PPF
- - -
- - -
-
23 NSSF Contribution
- - -
- -
-
24 PPF Contribution
- - -
- -
-
Local Authorities
- - -
- - -
-
25 Local Levy
- - -
- -
-
26 Service Levy
- - -
- -
-
27 Other Local Taxes, Fees and Levies
- - -
- -
-
Ministry of Finance (MoF)
- - -
- - -
-
28 Dividends from Gov Shares
- - -
- -
-
29 Revenues from Gov shareholding sale
- - -
- -
-
Total payments
- - -
5,454,837,962 (5,454,837,962) -
-
Social Payments
- - -
30 Corporate Social Resp cash payments
- - -
31 Corporate Social Resp in-kind payments
- - -
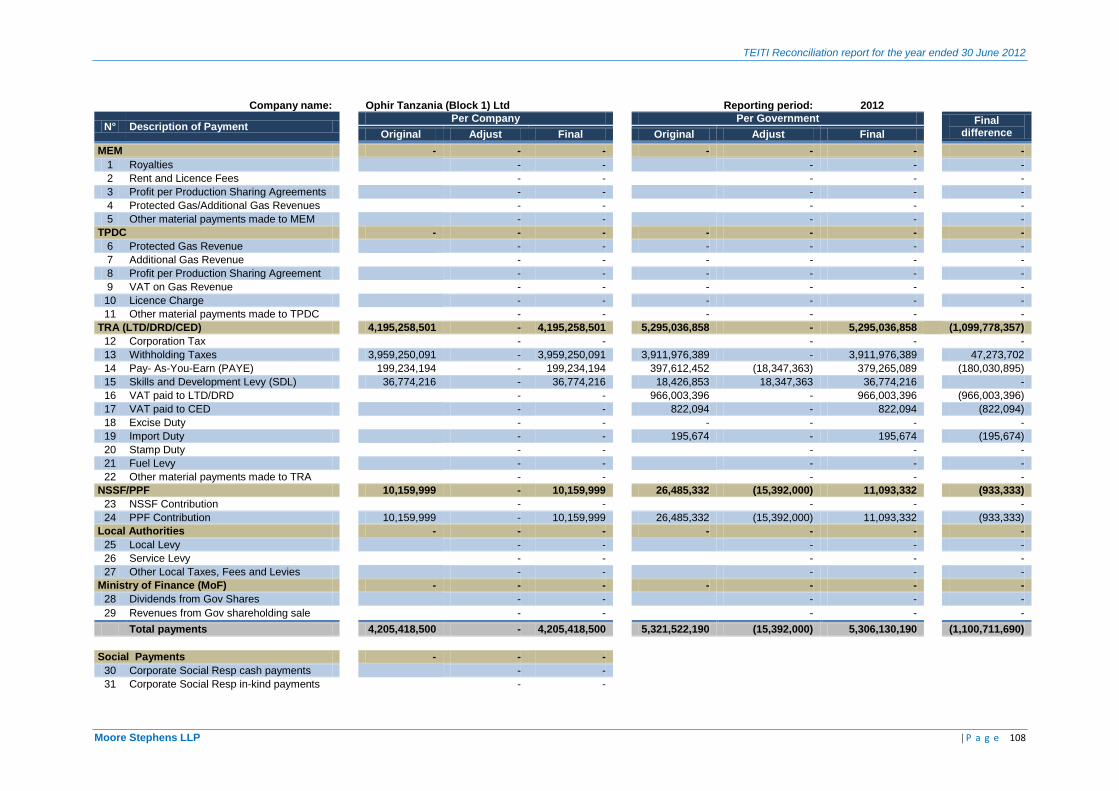
TEITI Reconciliation report for the year ended 30 June 2012
Moore Stephens LLP | P a g e 108
Company name:
Ophir Tanzania (Block 1) Ltd
Reporting period: 2012
N° Description of Payment Per Company
Per Government
Final difference
Original Adjust Final
Original Adjust Final
MEM
- - -
- - -
-
1 Royalties
- -
- -
-
2 Rent and Licence Fees
- -
- -
-
3 Profit per Production Sharing Agreements
- -
- -
-
4 Protected Gas/Additional Gas Revenues
- -
- -
-
5 Other material payments made to MEM
- -
- -
-
TPDC
- - -
- - -
-
6 Protected Gas Revenue
- -
- - -
-
7 Additional Gas Revenue
- -
- - -
-
8 Profit per Production Sharing Agreement
- -
- - -
-
9 VAT on Gas Revenue
- -
- - -
-
10 Licence Charge
- -
- - -
-
11 Other material payments made to TPDC
- -
- - -
-
TRA (LTD/DRD/CED)
4,195,258,501 - 4,195,258,501
5,295,036,858 - 5,295,036,858
(1,099,778,357)
12 Corporation Tax
- -
- -
-
13 Withholding Taxes
3,959,250,091 - 3,959,250,091
3,911,976,389 - 3,911,976,389
47,273,702
14 Pay- As-You-Earn (PAYE)
199,234,194 - 199,234,194
397,612,452 (18,347,363) 379,265,089
(180,030,895)
15 Skills and Development Levy (SDL)
36,774,216 - 36,774,216
18,426,853 18,347,363 36,774,216
-
16 VAT paid to LTD/DRD
- -
966,003,396 - 966,003,396
(966,003,396)
17 VAT paid to CED
- -
822,094 - 822,094
(822,094)
18 Excise Duty
- -
- - -
-
19 Import Duty
- -
195,674 - 195,674
(195,674)
20 Stamp Duty
- -
- -
-
21 Fuel Levy
- -
- -
-
22 Other material payments made to TRA
- -
- -
-
NSSF/PPF
10,159,999 - 10,159,999
26,485,332 (15,392,000) 11,093,332
(933,333)
23 NSSF Contribution
- -
- -
-
24 PPF Contribution
10,159,999 - 10,159,999
26,485,332 (15,392,000) 11,093,332
(933,333)
Local Authorities
- - -
- - -
-
25 Local Levy
- -
- -
-
26 Service Levy
- -
- -
-
27 Other Local Taxes, Fees and Levies
- -
- -
-
Ministry of Finance (MoF)
- - -
- - -
-
28 Dividends from Gov Shares
- -
- -
-
29 Revenues from Gov shareholding sale
- -
- -
-
Total payments
4,205,418,500 - 4,205,418,500
5,321,522,190 (15,392,000) 5,306,130,190
(1,100,711,690)
Social Payments
- - -
30 Corporate Social Resp cash payments
- -
31 Corporate Social Resp in-kind payments
- -
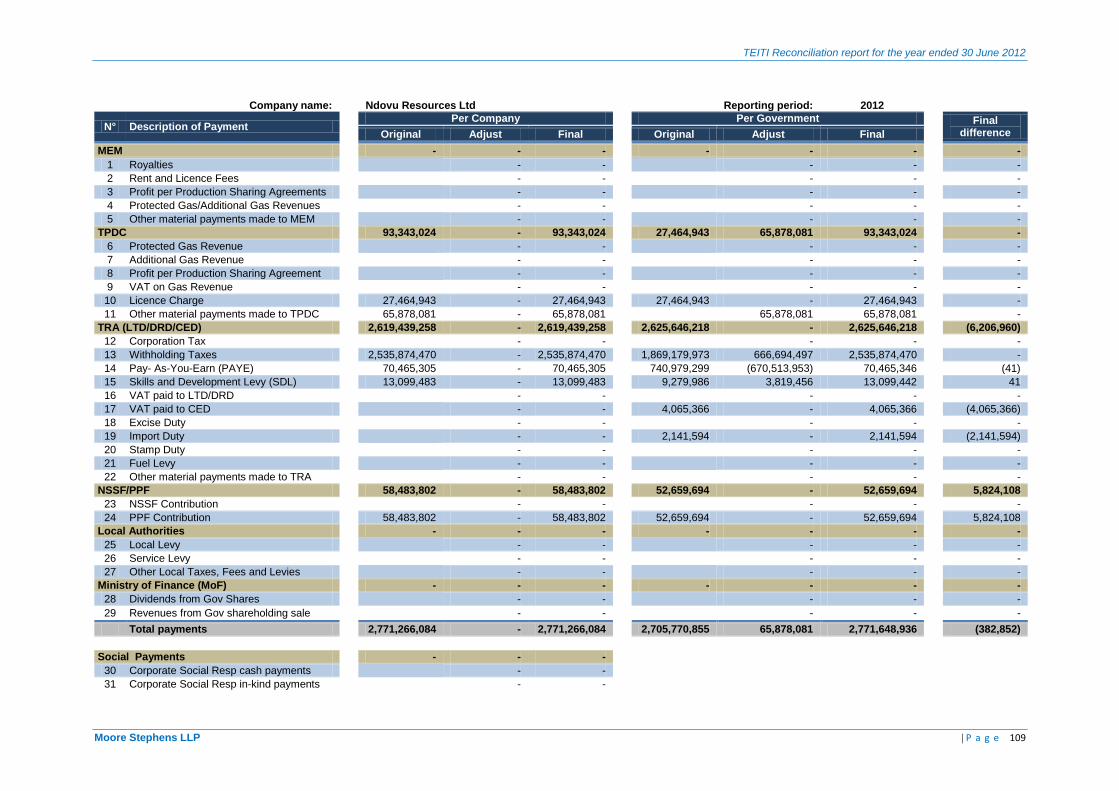
TEITI Reconciliation report for the year ended 30 June 2012
Moore Stephens LLP | P a g e 109
Company name:
Ndovu Resources Ltd
Reporting period: 2012
N° Description of Payment Per Company
Per Government
Final difference
Original Adjust Final
Original Adjust Final
MEM
- - -
- - -
-
1 Royalties
- -
- -
-
2 Rent and Licence Fees
- -
- -
-
3 Profit per Production Sharing Agreements
- -
- -
-
4 Protected Gas/Additional Gas Revenues
- -
- -
-
5 Other material payments made to MEM
- -
- -
-
TPDC
93,343,024 - 93,343,024
27,464,943 65,878,081 93,343,024
-
6 Protected Gas Revenue
- -
- -
-
7 Additional Gas Revenue
- -
- -
-
8 Profit per Production Sharing Agreement
- -
- -
-
9 VAT on Gas Revenue
- -
- -
-
10 Licence Charge
27,464,943 - 27,464,943
27,464,943 - 27,464,943
-
11 Other material payments made to TPDC
65,878,081 - 65,878,081
65,878,081 65,878,081
-
TRA (LTD/DRD/CED)
2,619,439,258 - 2,619,439,258
2,625,646,218 - 2,625,646,218
(6,206,960)
12 Corporation Tax
- -
- -
-
13 Withholding Taxes
2,535,874,470 - 2,535,874,470
1,869,179,973 666,694,497 2,535,874,470
-
14 Pay- As-You-Earn (PAYE)
70,465,305 - 70,465,305
740,979,299 (670,513,953) 70,465,346
(41)
15 Skills and Development Levy (SDL)
13,099,483 - 13,099,483
9,279,986 3,819,456 13,099,442
41
16 VAT paid to LTD/DRD
- -
- -
-
17 VAT paid to CED
- -
4,065,366 - 4,065,366
(4,065,366)
18 Excise Duty
- -
- -
-
19 Import Duty
- -
2,141,594 - 2,141,594
(2,141,594)
20 Stamp Duty
- -
- -
-
21 Fuel Levy
- -
- -
-
22 Other material payments made to TRA
- -
- -
-
NSSF/PPF
58,483,802 - 58,483,802
52,659,694 - 52,659,694
5,824,108
23 NSSF Contribution
- -
- -
-
24 PPF Contribution
58,483,802 - 58,483,802
52,659,694 - 52,659,694
5,824,108
Local Authorities
- - -
- - -
-
25 Local Levy
- -
- -
-
26 Service Levy
- -
- -
-
27 Other Local Taxes, Fees and Levies
- -
- -
-
Ministry of Finance (MoF)
- - -
- - -
-
28 Dividends from Gov Shares
- -
- -
-
29 Revenues from Gov shareholding sale
- -
- -
-
Total payments
2,771,266,084 - 2,771,266,084
2,705,770,855 65,878,081 2,771,648,936
(382,852)
Social Payments
- - -
30 Corporate Social Resp cash payments
- -
31 Corporate Social Resp in-kind payments
- -
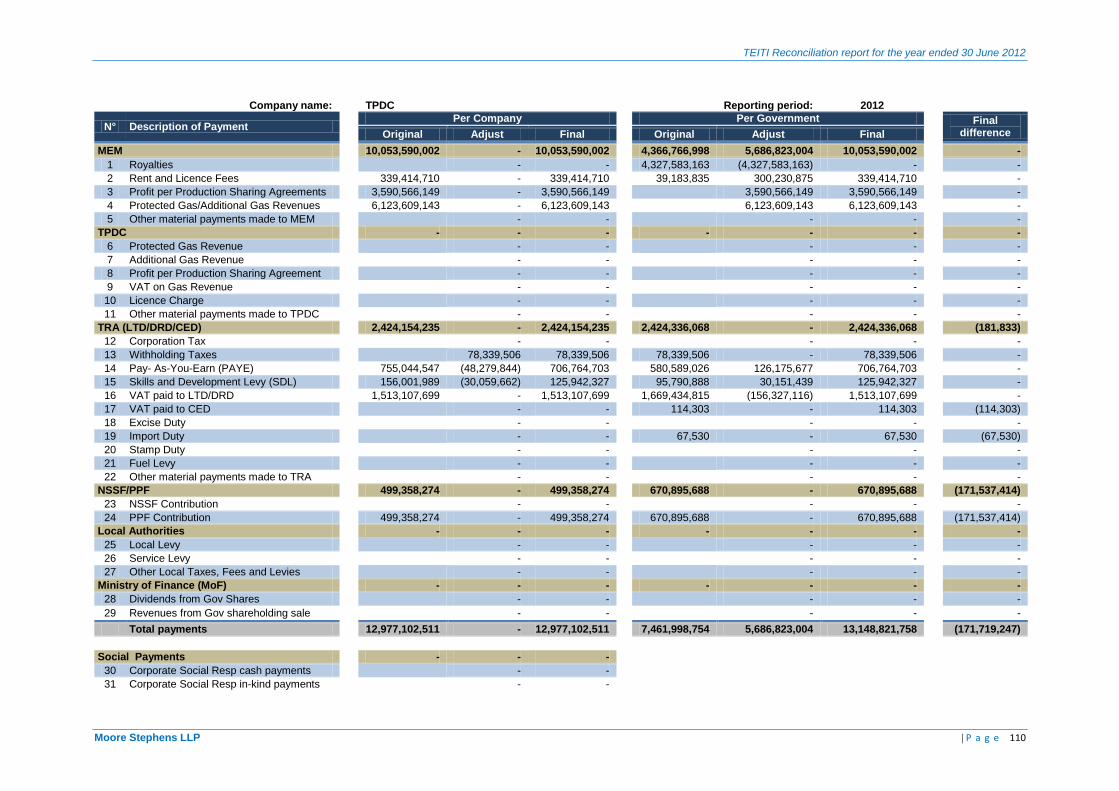
TEITI Reconciliation report for the year ended 30 June 2012
Moore Stephens LLP | P a g e 110
Company name:
TPDC
Reporting period: 2012
N° Description of Payment Per Company
Per Government
Final difference
Original Adjust Final
Original Adjust Final
MEM
10,053,590,002 - 10,053,590,002
4,366,766,998 5,686,823,004 10,053,590,002
-
1 Royalties
- -
4,327,583,163 (4,327,583,163) -
-
2 Rent and Licence Fees
339,414,710 - 339,414,710
39,183,835 300,230,875 339,414,710
-
3 Profit per Production Sharing Agreements
3,590,566,149 - 3,590,566,149
3,590,566,149 3,590,566,149
-
4 Protected Gas/Additional Gas Revenues
6,123,609,143 - 6,123,609,143
6,123,609,143 6,123,609,143
-
5 Other material payments made to MEM
- -
- -
-
TPDC
- - -
- - -
-
6 Protected Gas Revenue
- -
- -
-
7 Additional Gas Revenue
- -
- -
-
8 Profit per Production Sharing Agreement
- -
- -
-
9 VAT on Gas Revenue
- -
- -
-
10 Licence Charge
- -
- -
-
11 Other material payments made to TPDC
- -
- -
-
TRA (LTD/DRD/CED)
2,424,154,235 - 2,424,154,235
2,424,336,068 - 2,424,336,068
(181,833)
12 Corporation Tax
- -
- -
-
13 Withholding Taxes
78,339,506 78,339,506
78,339,506 - 78,339,506
-
14 Pay- As-You-Earn (PAYE)
755,044,547 (48,279,844) 706,764,703
580,589,026 126,175,677 706,764,703
-
15 Skills and Development Levy (SDL)
156,001,989 (30,059,662) 125,942,327
95,790,888 30,151,439 125,942,327
-
16 VAT paid to LTD/DRD
1,513,107,699 - 1,513,107,699
1,669,434,815 (156,327,116) 1,513,107,699
-
17 VAT paid to CED
- -
114,303 - 114,303
(114,303)
18 Excise Duty
- -
- -
-
19 Import Duty
- -
67,530 - 67,530
(67,530)
20 Stamp Duty
- -
- -
-
21 Fuel Levy
- -
- -
-
22 Other material payments made to TRA
- -
- -
-
NSSF/PPF
499,358,274 - 499,358,274
670,895,688 - 670,895,688
(171,537,414)
23 NSSF Contribution
- -
- -
-
24 PPF Contribution
499,358,274 - 499,358,274
670,895,688 - 670,895,688
(171,537,414)
Local Authorities
- - -
- - -
-
25 Local Levy
- -
- -
-
26 Service Levy
- -
- -
-
27 Other Local Taxes, Fees and Levies
- -
- -
-
Ministry of Finance (MoF)
- - -
- - -
-
28 Dividends from Gov Shares
- -
- -
-
29 Revenues from Gov shareholding sale
- -
- -
-
Total payments
12,977,102,511 - 12,977,102,511
7,461,998,754 5,686,823,004 13,148,821,758
(171,719,247)
Social Payments
- - -
30 Corporate Social Resp cash payments
- -
31 Corporate Social Resp in-kind payments
- -
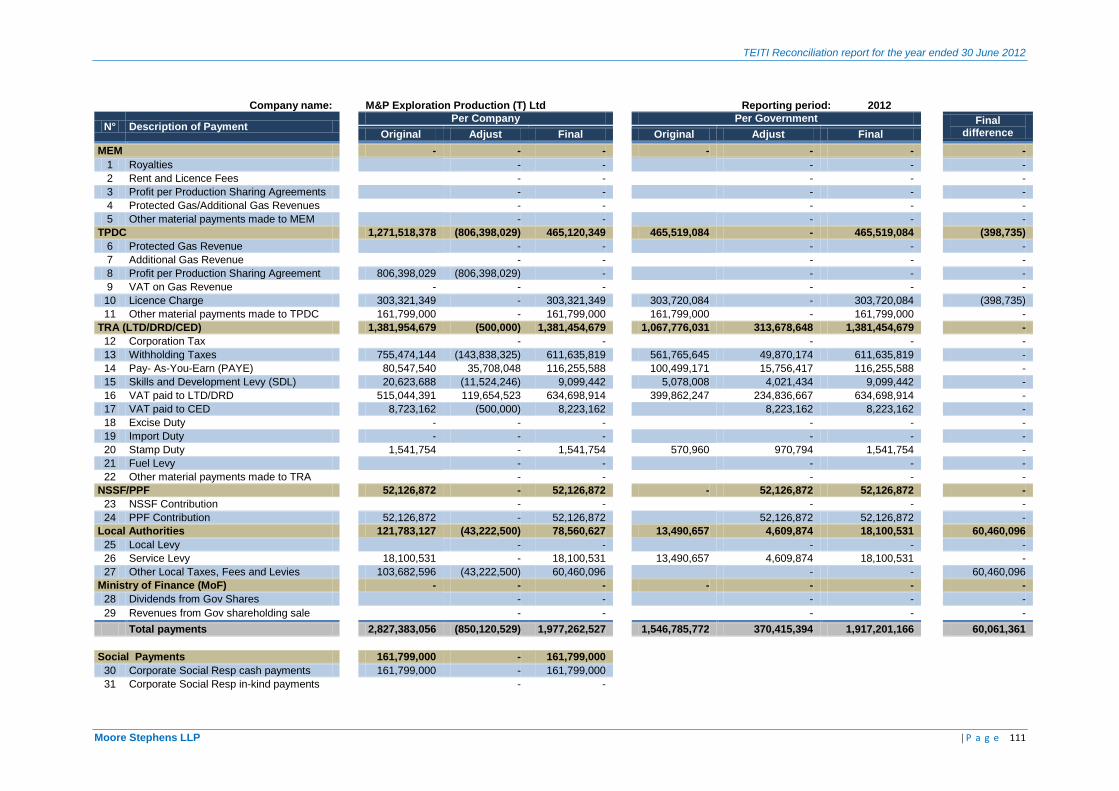
TEITI Reconciliation report for the year ended 30 June 2012
Moore Stephens LLP | P a g e 111
Company name:
M&P Exploration Production (T) Ltd
Reporting period: 2012
N° Description of Payment Per Company
Per Government
Final difference
Original Adjust Final
Original Adjust Final
MEM
- - -
- - -
-
1 Royalties
- -
- -
-
2 Rent and Licence Fees
- -
- -
-
3 Profit per Production Sharing Agreements
- -
- -
-
4 Protected Gas/Additional Gas Revenues
- -
- -
-
5 Other material payments made to MEM
- -
- -
-
TPDC
1,271,518,378 (806,398,029) 465,120,349
465,519,084 - 465,519,084
(398,735)
6 Protected Gas Revenue
- -
- -
-
7 Additional Gas Revenue
- -
- -
-
8 Profit per Production Sharing Agreement
806,398,029 (806,398,029) -
- -
-
9 VAT on Gas Revenue
- - -
- -
-
10 Licence Charge
303,321,349 - 303,321,349
303,720,084 - 303,720,084
(398,735)
11 Other material payments made to TPDC
161,799,000 - 161,799,000
161,799,000 - 161,799,000
-
TRA (LTD/DRD/CED)
1,381,954,679 (500,000) 1,381,454,679
1,067,776,031 313,678,648 1,381,454,679
-
12 Corporation Tax
- -
- -
-
13 Withholding Taxes
755,474,144 (143,838,325) 611,635,819
561,765,645 49,870,174 611,635,819
-
14 Pay- As-You-Earn (PAYE)
80,547,540 35,708,048 116,255,588
100,499,171 15,756,417 116,255,588
-
15 Skills and Development Levy (SDL)
20,623,688 (11,524,246) 9,099,442
5,078,008 4,021,434 9,099,442
-
16 VAT paid to LTD/DRD
515,044,391 119,654,523 634,698,914
399,862,247 234,836,667 634,698,914
-
17 VAT paid to CED
8,723,162 (500,000) 8,223,162
8,223,162 8,223,162
-
18 Excise Duty
- - -
- -
-
19 Import Duty
- - -
- -
-
20 Stamp Duty
1,541,754 - 1,541,754
570,960 970,794 1,541,754
-
21 Fuel Levy
- -
- -
-
22 Other material payments made to TRA
- -
- -
-
NSSF/PPF
52,126,872 - 52,126,872
- 52,126,872 52,126,872
-
23 NSSF Contribution
- -
- -
-
24 PPF Contribution
52,126,872 - 52,126,872
52,126,872 52,126,872
-
Local Authorities
121,783,127 (43,222,500) 78,560,627
13,490,657 4,609,874 18,100,531
60,460,096
25 Local Levy
- -
- -
-
26 Service Levy
18,100,531 - 18,100,531
13,490,657 4,609,874 18,100,531
-
27 Other Local Taxes, Fees and Levies
103,682,596 (43,222,500) 60,460,096
- -
60,460,096
Ministry of Finance (MoF)
- - -
- - -
-
28 Dividends from Gov Shares
- -
- -
-
29 Revenues from Gov shareholding sale
- -
- -
-
Total payments
2,827,383,056 (850,120,529) 1,977,262,527
1,546,785,772 370,415,394 1,917,201,166
60,061,361
Social Payments
161,799,000 - 161,799,000
30 Corporate Social Resp cash payments
161,799,000 - 161,799,000
31 Corporate Social Resp in-kind payments
- -
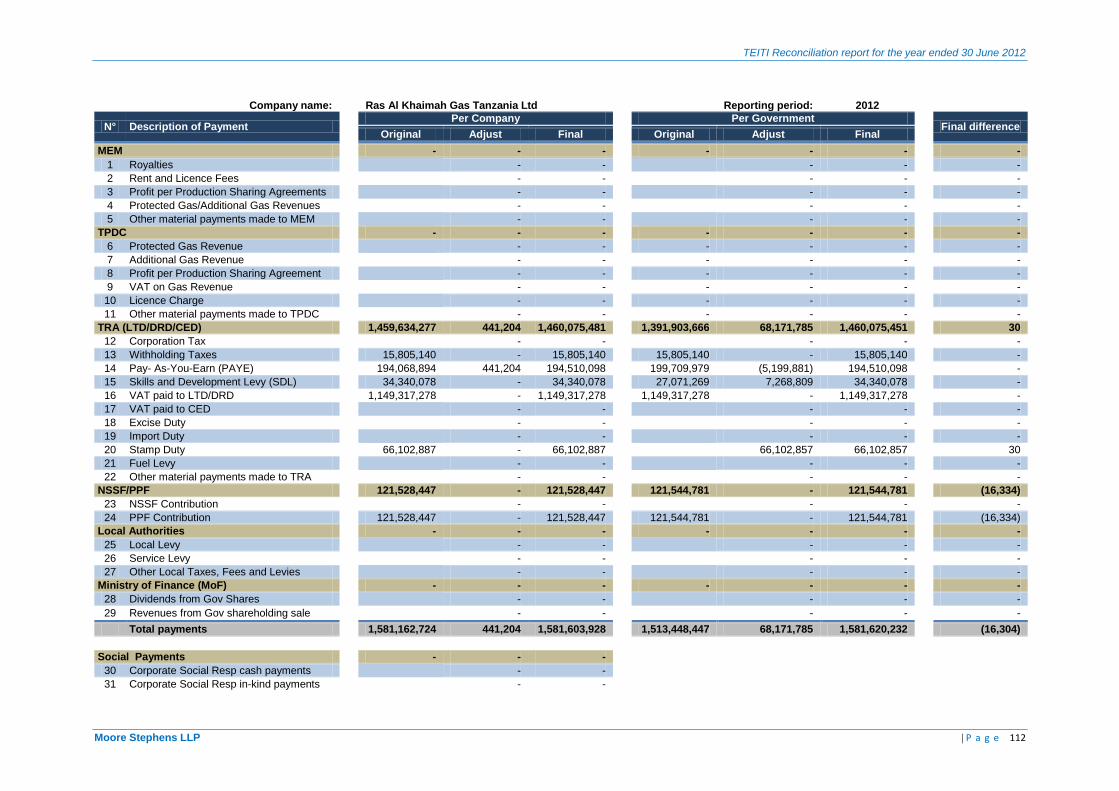
TEITI Reconciliation report for the year ended 30 June 2012
Moore Stephens LLP | P a g e 112
Company name:
Ras Al Khaimah Gas Tanzania Ltd
Reporting period: 2012
N° Description of Payment Per Company
Per Government
Final difference
Original Adjust Final
Original Adjust Final
MEM
- - -
- - -
-
1 Royalties
- -
- -
-
2 Rent and Licence Fees
- -
- -
-
3 Profit per Production Sharing Agreements
- -
- -
-
4 Protected Gas/Additional Gas Revenues
- -
- -
-
5 Other material payments made to MEM
- -
- -
-
TPDC
- - -
- - -
-
6 Protected Gas Revenue
- -
- - -
-
7 Additional Gas Revenue
- -
- - -
-
8 Profit per Production Sharing Agreement
- -
- - -
-
9 VAT on Gas Revenue
- -
- - -
-
10 Licence Charge
- -
- - -
-
11 Other material payments made to TPDC
- -
- - -
-
TRA (LTD/DRD/CED)
1,459,634,277 441,204 1,460,075,481
1,391,903,666 68,171,785 1,460,075,451
30
12 Corporation Tax
- -
- -
-
13 Withholding Taxes
15,805,140 - 15,805,140
15,805,140 - 15,805,140
-
14 Pay- As-You-Earn (PAYE)
194,068,894 441,204 194,510,098
199,709,979 (5,199,881) 194,510,098
-
15 Skills and Development Levy (SDL)
34,340,078 - 34,340,078
27,071,269 7,268,809 34,340,078
-
16 VAT paid to LTD/DRD
1,149,317,278 - 1,149,317,278
1,149,317,278 - 1,149,317,278
-
17 VAT paid to CED
- -
- -
-
18 Excise Duty
- -
- -
-
19 Import Duty
- -
- -
-
20 Stamp Duty
66,102,887 - 66,102,887
66,102,857 66,102,857
30
21 Fuel Levy
- -
- -
-
22 Other material payments made to TRA
- -
- -
-
NSSF/PPF
121,528,447 - 121,528,447
121,544,781 - 121,544,781
(16,334)
23 NSSF Contribution
- -
- -
-
24 PPF Contribution
121,528,447 - 121,528,447
121,544,781 - 121,544,781
(16,334)
Local Authorities
- - -
- - -
-
25 Local Levy
- -
- -
-
26 Service Levy
- -
- -
-
27 Other Local Taxes, Fees and Levies
- -
- -
-
Ministry of Finance (MoF)
- - -
- - -
-
28 Dividends from Gov Shares
- -
- -
-
29 Revenues from Gov shareholding sale
- -
- -
-
Total payments
1,581,162,724 441,204 1,581,603,928
1,513,448,447 68,171,785 1,581,620,232
(16,304)
Social Payments
- - -
30 Corporate Social Resp cash payments
- -
31 Corporate Social Resp in-kind payments
- -
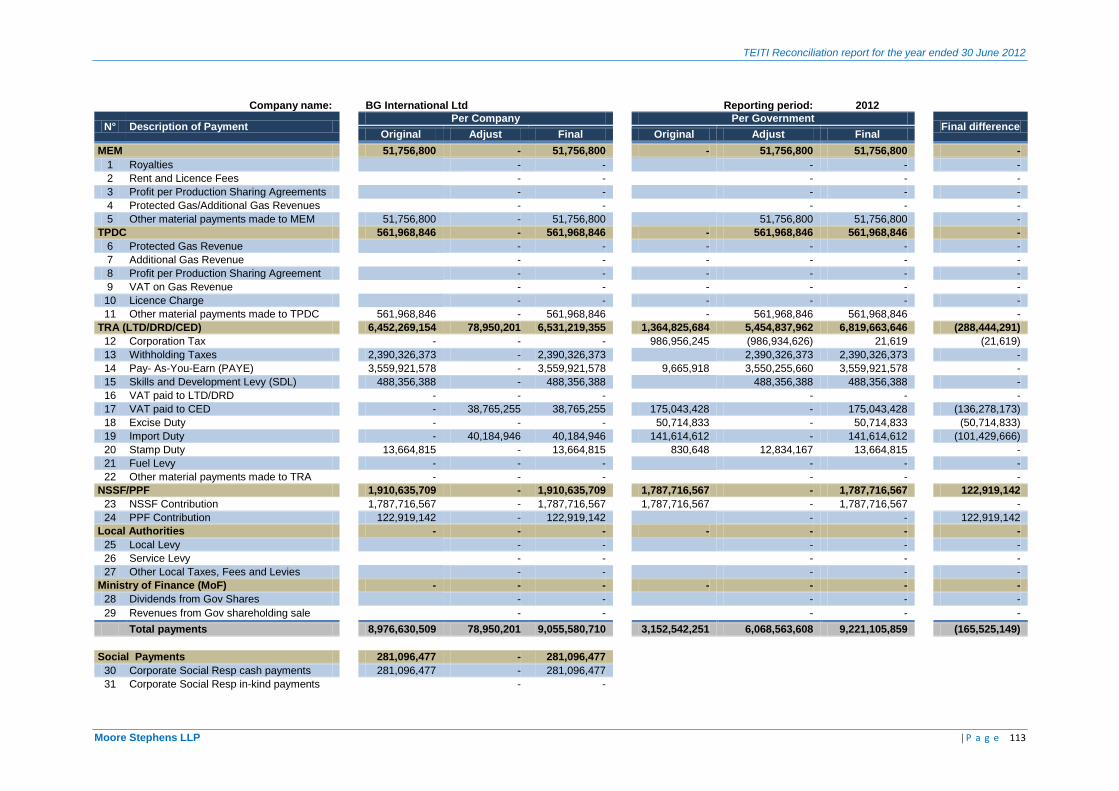
TEITI Reconciliation report for the year ended 30 June 2012
Moore Stephens LLP | P a g e 113
Company name:
BG International Ltd
Reporting period: 2012
N° Description of Payment Per Company
Per Government
Final difference
Original Adjust Final
Original Adjust Final
MEM
51,756,800 - 51,756,800
- 51,756,800 51,756,800
-
1 Royalties
- -
- -
-
2 Rent and Licence Fees
- -
- -
-
3 Profit per Production Sharing Agreements
- -
- -
-
4 Protected Gas/Additional Gas Revenues
- -
- -
-
5 Other material payments made to MEM
51,756,800 - 51,756,800
51,756,800 51,756,800
-
TPDC
561,968,846 - 561,968,846
- 561,968,846 561,968,846
-
6 Protected Gas Revenue
- -
- - -
-
7 Additional Gas Revenue
- -
- - -
-
8 Profit per Production Sharing Agreement
- -
- - -
-
9 VAT on Gas Revenue
- -
- - -
-
10 Licence Charge
- -
- - -
-
11 Other material payments made to TPDC
561,968,846 - 561,968,846
- 561,968,846 561,968,846
-
TRA (LTD/DRD/CED)
6,452,269,154 78,950,201 6,531,219,355
1,364,825,684 5,454,837,962 6,819,663,646
(288,444,291)
12 Corporation Tax
- - -
986,956,245 (986,934,626) 21,619
(21,619)
13 Withholding Taxes
2,390,326,373 - 2,390,326,373
2,390,326,373 2,390,326,373
-
14 Pay- As-You-Earn (PAYE)
3,559,921,578 - 3,559,921,578
9,665,918 3,550,255,660 3,559,921,578
-
15 Skills and Development Levy (SDL)
488,356,388 - 488,356,388
488,356,388 488,356,388
-
16 VAT paid to LTD/DRD
- - -
- -
-
17 VAT paid to CED
- 38,765,255 38,765,255
175,043,428 - 175,043,428
(136,278,173)
18 Excise Duty
- - -
50,714,833 - 50,714,833
(50,714,833)
19 Import Duty
- 40,184,946 40,184,946
141,614,612 - 141,614,612
(101,429,666)
20 Stamp Duty
13,664,815 - 13,664,815
830,648 12,834,167 13,664,815
-
21 Fuel Levy
- - -
- -
-
22 Other material payments made to TRA
- - -
- -
-
NSSF/PPF
1,910,635,709 - 1,910,635,709
1,787,716,567 - 1,787,716,567
122,919,142
23 NSSF Contribution
1,787,716,567 - 1,787,716,567
1,787,716,567 - 1,787,716,567
-
24 PPF Contribution
122,919,142 - 122,919,142
- -
122,919,142
Local Authorities
- - -
- - -
-
25 Local Levy
- -
- -
-
26 Service Levy
- -
- -
-
27 Other Local Taxes, Fees and Levies
- -
- -
-
Ministry of Finance (MoF)
- - -
- - -
-
28 Dividends from Gov Shares
- -
- -
-
29 Revenues from Gov shareholding sale
- -
- -
-
Total payments
8,976,630,509 78,950,201 9,055,580,710
3,152,542,251 6,068,563,608 9,221,105,859
(165,525,149)
Social Payments
281,096,477 - 281,096,477
30 Corporate Social Resp cash payments
281,096,477 - 281,096,477
31 Corporate Social Resp in-kind payments
- -
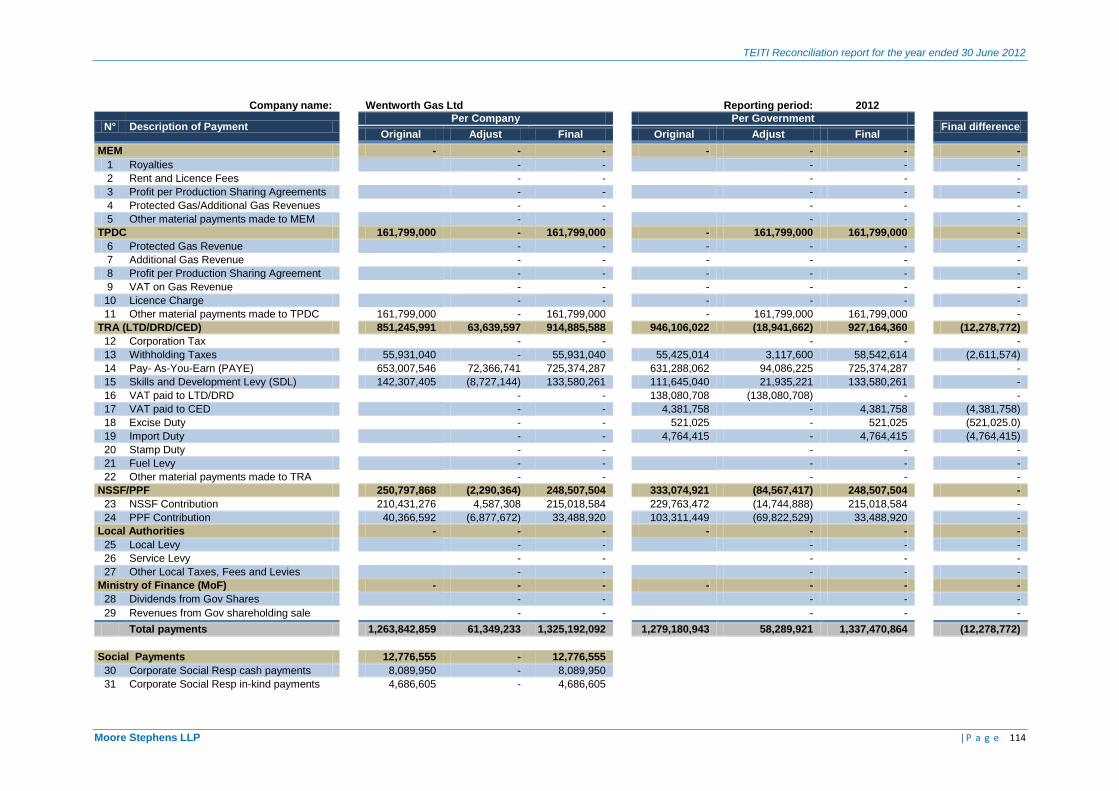
TEITI Reconciliation report for the year ended 30 June 2012
Moore Stephens LLP | P a g e 114
Company name:
Wentworth Gas Ltd
Reporting period: 2012
N° Description of Payment Per Company
Per Government
Final difference
Original Adjust Final
Original Adjust Final
MEM
- - -
- - -
-
1 Royalties
- -
- -
-
2 Rent and Licence Fees
- -
- -
-
3 Profit per Production Sharing Agreements
- -
- -
-
4 Protected Gas/Additional Gas Revenues
- -
- -
-
5 Other material payments made to MEM
- -
- -
-
TPDC
161,799,000 - 161,799,000
- 161,799,000 161,799,000
-
6 Protected Gas Revenue
- -
- - -
-
7 Additional Gas Revenue
- -
- - -
-
8 Profit per Production Sharing Agreement
- -
- - -
-
9 VAT on Gas Revenue
- -
- - -
-
10 Licence Charge
- -
- - -
-
11 Other material payments made to TPDC
161,799,000 - 161,799,000
- 161,799,000 161,799,000
-
TRA (LTD/DRD/CED)
851,245,991 63,639,597 914,885,588
946,106,022 (18,941,662) 927,164,360
(12,278,772)
12 Corporation Tax
- -
- -
-
13 Withholding Taxes
55,931,040 - 55,931,040
55,425,014 3,117,600 58,542,614
(2,611,574)
14 Pay- As-You-Earn (PAYE)
653,007,546 72,366,741 725,374,287
631,288,062 94,086,225 725,374,287
-
15 Skills and Development Levy (SDL)
142,307,405 (8,727,144) 133,580,261
111,645,040 21,935,221 133,580,261
-
16 VAT paid to LTD/DRD
- -
138,080,708 (138,080,708) -
-
17 VAT paid to CED
- -
4,381,758 - 4,381,758
(4,381,758)
18 Excise Duty
- -
521,025 - 521,025
(521,025.0)
19 Import Duty
- -
4,764,415 - 4,764,415
(4,764,415)
20 Stamp Duty
- -
- -
-
21 Fuel Levy
- -
- -
-
22 Other material payments made to TRA
- -
- -
-
NSSF/PPF
250,797,868 (2,290,364) 248,507,504
333,074,921 (84,567,417) 248,507,504
-
23 NSSF Contribution
210,431,276 4,587,308 215,018,584
229,763,472 (14,744,888) 215,018,584
-
24 PPF Contribution
40,366,592 (6,877,672) 33,488,920
103,311,449 (69,822,529) 33,488,920
-
Local Authorities
- - -
- - -
-
25 Local Levy
- -
- -
-
26 Service Levy
- -
- -
-
27 Other Local Taxes, Fees and Levies
- -
- -
-
Ministry of Finance (MoF)
- - -
- - -
-
28 Dividends from Gov Shares
- -
- -
-
29 Revenues from Gov shareholding sale
- -
- -
-
Total payments
1,263,842,859 61,349,233 1,325,192,092
1,279,180,943 58,289,921 1,337,470,864
(12,278,772)
Social Payments
12,776,555 - 12,776,555
30 Corporate Social Resp cash payments
8,089,950 - 8,089,950
31 Corporate Social Resp in-kind payments
4,686,605 - 4,686,605

TEITI Reconciliation report for the year ended 30 June 2012
Moore Stephens LLP | P a g e 115
Company name:
Etabllissements Maurel & Prom
Reporting period: 2012
N° Description of Payment Per Company
Per Government
Final difference
Original Adjust Final
Original Adjust Final
MEM
- - -
- - -
-
1 Royalties
- -
- -
-
2 Rent and Licence Fees
- -
- -
-
3 Profit per Production Sharing Agreements
- -
- -
-
4 Protected Gas/Additional Gas Revenues
- -
- -
-
5 Other material payments made to MEM
- -
- -
-
TPDC
244,507,397 - 244,507,397
244,507,397 - 244,507,397
-
6 Protected Gas Revenue
- -
- -
-
7 Additional Gas Revenue
- -
- -
-
8 Profit per Production Sharing Agreement
- -
- -
-
9 VAT on Gas Revenue
- -
- -
-
10 Licence Charge
- -
- -
-
11 Other material payments made to TPDC
244,507,397 - 244,507,397
244,507,397 - 244,507,397
-
TRA (LTD/DRD/CED)
(7,562,805,782) 7,772,895,296 210,089,514
210,089,514 - 210,089,514
-
12 Corporation Tax
- - -
- -
-
13 Withholding Taxes
50,318,502 - 50,318,502
124,803,133 (74,484,631) 50,318,502
-
14 Pay- As-You-Earn (PAYE)
61,530,599 6,224,760 67,755,359
56,192,457 11,562,902 67,755,359
-
15 Skills and Development Levy (SDL)
16,832,745 1,678,962 18,511,707
8,847,868 9,663,839 18,511,707
-
16 VAT paid to LTD/DRD
(7,691,487,628) 7,764,991,574 73,503,946
20,246,056 53,257,890 73,503,946
-
17 VAT paid to CED
- - -
- -
-
18 Excise Duty
- - -
- -
-
19 Import Duty
- - -
- -
-
20 Stamp Duty
- - -
- -
-
21 Fuel Levy
- - -
- -
-
22 Other material payments made to TRA
- - -
- -
-
NSSF/PPF
60,244,583 5,596,540 65,841,123
65,841,123 - 65,841,123
-
23 NSSF Contribution
60,244,583 5,596,540 65,841,123
65,841,123 - 65,841,123
-
24 PPF Contribution
- - -
- -
-
Local Authorities
836,516 - 836,516
- - -
836,516
25 Local Levy
836,516 - 836,516
- -
836,516
26 Service Levy
- -
- -
-
27 Other Local Taxes, Fees and Levies
- -
- -
-
Ministry of Finance (MoF)
- - -
- - -
-
28 Dividends from Gov Shares
- -
- -
-
29 Revenues from Gov shareholding sale
- -
- -
-
Total payments
(7,257,217,286) 7,778,491,836 521,274,550
520,438,034 - 520,438,034
836,516
Social Payments
- - -
30 Corporate Social Resp cash payments
- -
31 Corporate Social Resp in-kind payments
- -
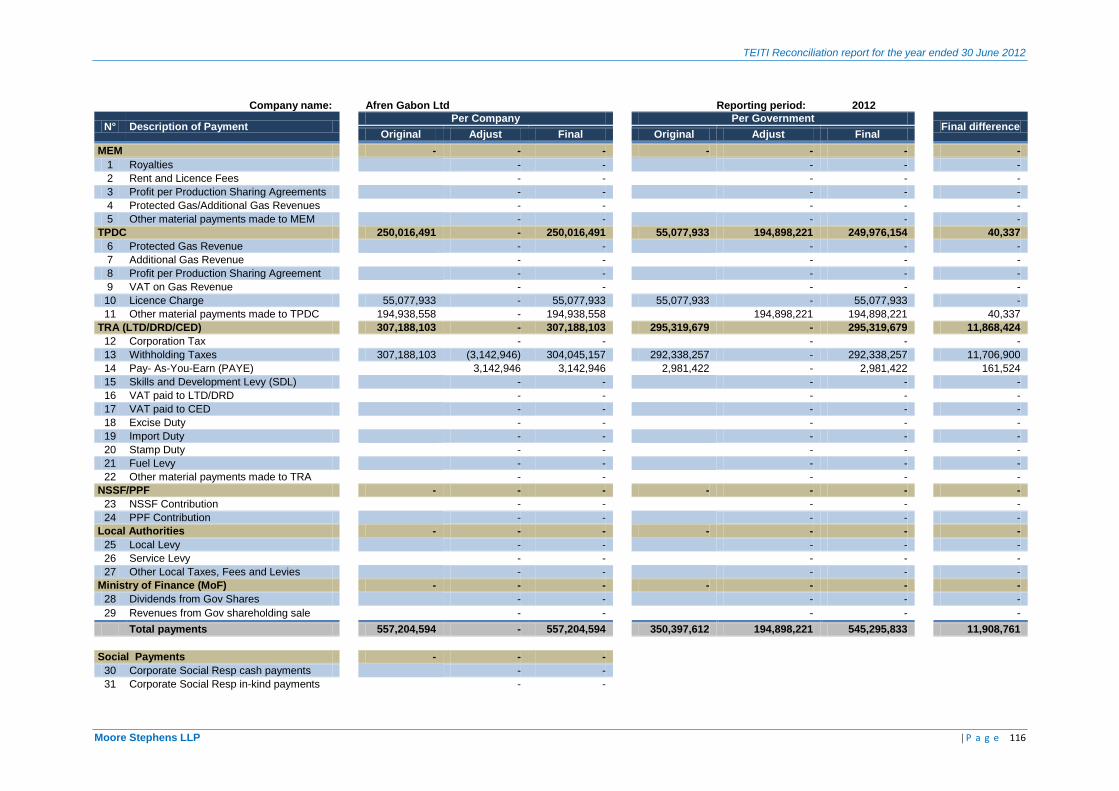
TEITI Reconciliation report for the year ended 30 June 2012
Moore Stephens LLP | P a g e 116
Company name:
Afren Gabon Ltd
Reporting period: 2012
N° Description of Payment Per Company
Per Government
Final difference
Original Adjust Final
Original Adjust Final
MEM
- - -
- - -
-
1 Royalties
- -
- -
-
2 Rent and Licence Fees
- -
- -
-
3 Profit per Production Sharing Agreements
- -
- -
-
4 Protected Gas/Additional Gas Revenues
- -
- -
-
5 Other material payments made to MEM
- -
- -
-
TPDC
250,016,491 - 250,016,491
55,077,933 194,898,221 249,976,154
40,337
6 Protected Gas Revenue
- -
- -
-
7 Additional Gas Revenue
- -
- -
-
8 Profit per Production Sharing Agreement
- -
- -
-
9 VAT on Gas Revenue
- -
- -
-
10 Licence Charge
55,077,933 - 55,077,933
55,077,933 - 55,077,933
-
11 Other material payments made to TPDC
194,938,558 - 194,938,558
194,898,221 194,898,221
40,337
TRA (LTD/DRD/CED)
307,188,103 - 307,188,103
295,319,679 - 295,319,679
11,868,424
12 Corporation Tax
- -
- -
-
13 Withholding Taxes
307,188,103 (3,142,946) 304,045,157
292,338,257 - 292,338,257
11,706,900
14 Pay- As-You-Earn (PAYE)
3,142,946 3,142,946
2,981,422 - 2,981,422
161,524
15 Skills and Development Levy (SDL)
- -
- -
-
16 VAT paid to LTD/DRD
- -
- -
-
17 VAT paid to CED
- -
- -
-
18 Excise Duty
- -
- -
-
19 Import Duty
- -
- -
-
20 Stamp Duty
- -
- -
-
21 Fuel Levy
- -
- -
-
22 Other material payments made to TRA
- -
- -
-
NSSF/PPF
- - -
- - -
-
23 NSSF Contribution
- -
- -
-
24 PPF Contribution
- -
- -
-
Local Authorities
- - -
- - -
-
25 Local Levy
- -
- -
-
26 Service Levy
- -
- -
-
27 Other Local Taxes, Fees and Levies
- -
- -
-
Ministry of Finance (MoF)
- - -
- - -
-
28 Dividends from Gov Shares
- -
- -
-
29 Revenues from Gov shareholding sale
- -
- -
-
Total payments
557,204,594 - 557,204,594
350,397,612 194,898,221 545,295,833
11,908,761
Social Payments
- - -
30 Corporate Social Resp cash payments
- -
31 Corporate Social Resp in-kind payments
- -
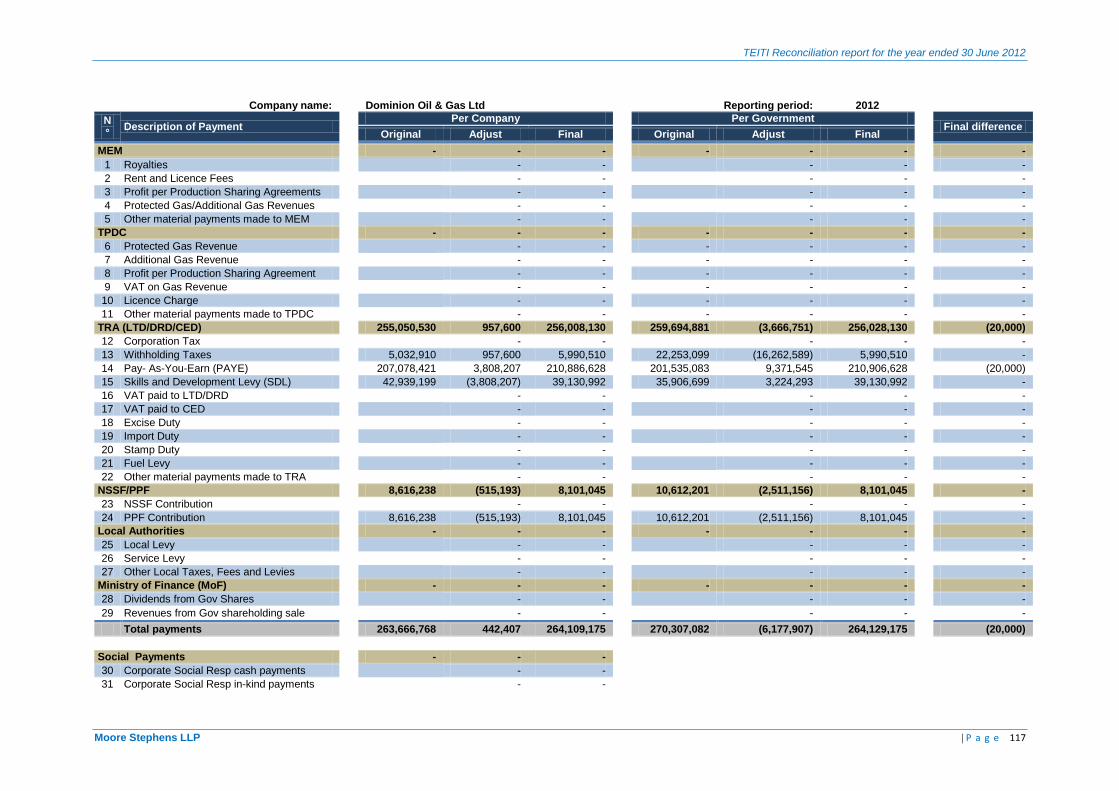
TEITI Reconciliation report for the year ended 30 June 2012
Moore Stephens LLP | P a g e 117
Company name:
Dominion Oil & Gas Ltd
Reporting period: 2012
N°
Description of Payment Per Company
Per Government
Final difference
Original Adjust Final
Original Adjust Final
MEM
- - -
- - -
-
1 Royalties
- -
- -
-
2 Rent and Licence Fees
- -
- -
-
3 Profit per Production Sharing Agreements
- -
- -
-
4 Protected Gas/Additional Gas Revenues
- -
- -
-
5 Other material payments made to MEM
- -
- -
-
TPDC
- - -
- - -
-
6 Protected Gas Revenue
- -
- - -
-
7 Additional Gas Revenue
- -
- - -
-
8 Profit per Production Sharing Agreement
- -
- - -
-
9 VAT on Gas Revenue
- -
- - -
-
10 Licence Charge
- -
- - -
-
11 Other material payments made to TPDC
- -
- - -
-
TRA (LTD/DRD/CED)
255,050,530 957,600 256,008,130
259,694,881 (3,666,751) 256,028,130
(20,000)
12 Corporation Tax
- -
- -
-
13 Withholding Taxes
5,032,910 957,600 5,990,510
22,253,099 (16,262,589) 5,990,510
-
14 Pay- As-You-Earn (PAYE)
207,078,421 3,808,207 210,886,628
201,535,083 9,371,545 210,906,628
(20,000)
15 Skills and Development Levy (SDL)
42,939,199 (3,808,207) 39,130,992
35,906,699 3,224,293 39,130,992
-
16 VAT paid to LTD/DRD
- -
- -
-
17 VAT paid to CED
- -
- -
-
18 Excise Duty
- -
- -
-
19 Import Duty
- -
- -
-
20 Stamp Duty
- -
- -
-
21 Fuel Levy
- -
- -
-
22 Other material payments made to TRA
- -
- -
-
NSSF/PPF
8,616,238 (515,193) 8,101,045
10,612,201 (2,511,156) 8,101,045
-
23 NSSF Contribution
- -
- -
-
24 PPF Contribution
8,616,238 (515,193) 8,101,045
10,612,201 (2,511,156) 8,101,045
-
Local Authorities
- - -
- - -
-
25 Local Levy
- -
- -
-
26 Service Levy
- -
- -
-
27 Other Local Taxes, Fees and Levies
- -
- -
-
Ministry of Finance (MoF)
- - -
- - -
-
28 Dividends from Gov Shares
- -
- -
-
29 Revenues from Gov shareholding sale
- -
- -
-
Total payments
263,666,768 442,407 264,109,175
270,307,082 (6,177,907) 264,129,175
(20,000)
Social Payments
- - -
30 Corporate Social Resp cash payments
- -
31 Corporate Social Resp in-kind payments
- -
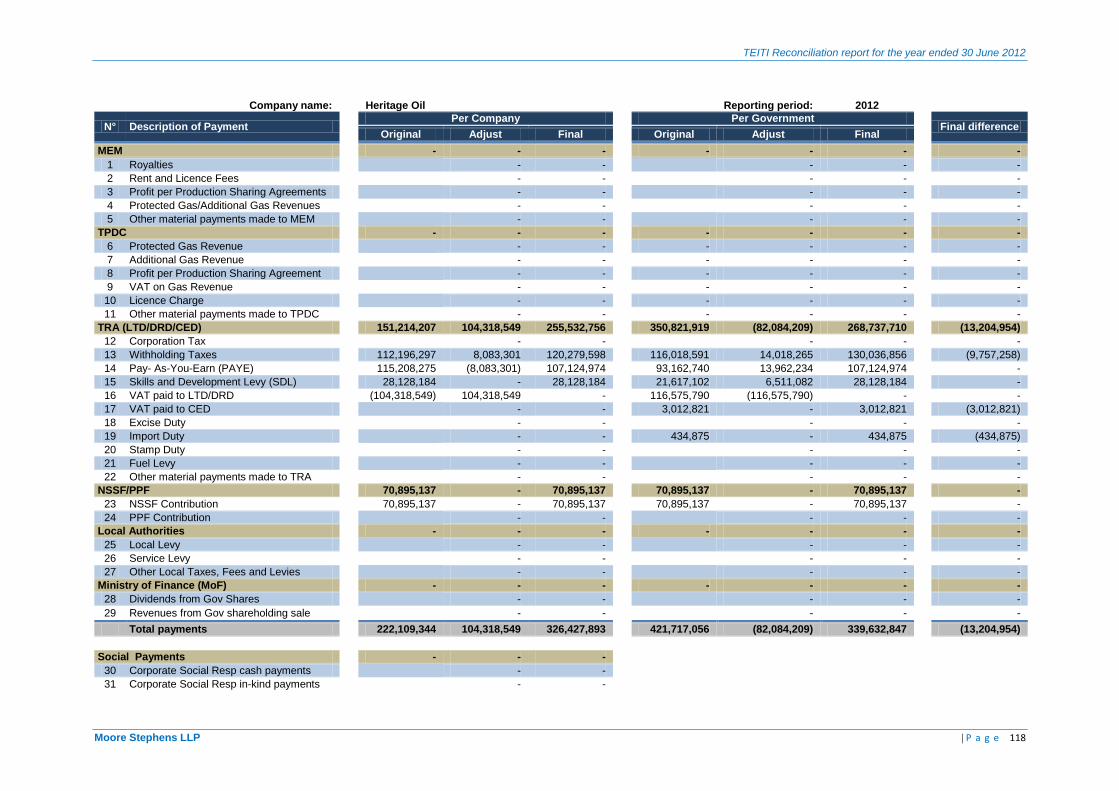
TEITI Reconciliation report for the year ended 30 June 2012
Moore Stephens LLP | P a g e 118
Company name:
Heritage Oil
Reporting period: 2012
N° Description of Payment Per Company
Per Government
Final difference
Original Adjust Final
Original Adjust Final
MEM
- - -
- - -
-
1 Royalties
- -
- -
-
2 Rent and Licence Fees
- -
- -
-
3 Profit per Production Sharing Agreements
- -
- -
-
4 Protected Gas/Additional Gas Revenues
- -
- -
-
5 Other material payments made to MEM
- -
- -
-
TPDC
- - -
- - -
-
6 Protected Gas Revenue
- -
- - -
-
7 Additional Gas Revenue
- -
- - -
-
8 Profit per Production Sharing Agreement
- -
- - -
-
9 VAT on Gas Revenue
- -
- - -
-
10 Licence Charge
- -
- - -
-
11 Other material payments made to TPDC
- -
- - -
-
TRA (LTD/DRD/CED)
151,214,207 104,318,549 255,532,756
350,821,919 (82,084,209) 268,737,710
(13,204,954)
12 Corporation Tax
- -
- -
-
13 Withholding Taxes
112,196,297 8,083,301 120,279,598
116,018,591 14,018,265 130,036,856
(9,757,258)
14 Pay- As-You-Earn (PAYE)
115,208,275 (8,083,301) 107,124,974
93,162,740 13,962,234 107,124,974
-
15 Skills and Development Levy (SDL)
28,128,184 - 28,128,184
21,617,102 6,511,082 28,128,184
-
16 VAT paid to LTD/DRD
(104,318,549) 104,318,549 -
116,575,790 (116,575,790) -
-
17 VAT paid to CED
- -
3,012,821 - 3,012,821
(3,012,821)
18 Excise Duty
- -
- -
-
19 Import Duty
- -
434,875 - 434,875
(434,875)
20 Stamp Duty
- -
- -
-
21 Fuel Levy
- -
- -
-
22 Other material payments made to TRA
- -
- -
-
NSSF/PPF
70,895,137 - 70,895,137
70,895,137 - 70,895,137
-
23 NSSF Contribution
70,895,137 - 70,895,137
70,895,137 - 70,895,137
-
24 PPF Contribution
- -
- -
-
Local Authorities
- - -
- - -
-
25 Local Levy
- -
- -
-
26 Service Levy
- -
- -
-
27 Other Local Taxes, Fees and Levies
- -
- -
-
Ministry of Finance (MoF)
- - -
- - -
-
28 Dividends from Gov Shares
- -
- -
-
29 Revenues from Gov shareholding sale
- -
- -
-
Total payments
222,109,344 104,318,549 326,427,893
421,717,056 (82,084,209) 339,632,847
(13,204,954)
Social Payments
- - -
30 Corporate Social Resp cash payments
- -
31 Corporate Social Resp in-kind payments
- -

TEITI Reconciliation report for the year ended 30 June 2012
Moore Stephens LLP | P a g e 119
Company name:
Tullow Tanzania B.V
Reporting period: 2012
N° Description of Payment Per Company
Per Government
Final difference
Original Adjust Final
Original Adjust Final
MEM
- - -
- - -
-
1 Royalties
- -
- -
-
2 Rent and Licence Fees
- -
- -
-
3 Profit per Production Sharing Agreements
- -
- -
-
4 Protected Gas/Additional Gas Revenues
- -
- -
-
5 Other material payments made to MEM
- -
- -
-
TPDC
- - -
- - -
-
6 Protected Gas Revenue
- - -
- - -
-
7 Additional Gas Revenue
- - -
- - -
-
8 Profit per Production Sharing Agreement
- - -
- - -
-
9 VAT on Gas Revenue
- - -
- - -
-
10 Licence Charge
- - -
- - -
-
11 Other material payments made to TPDC
- - -
- - -
-
TRA (LTD/DRD/CED)
280,649,273 - 280,649,273
280,790,344 - 280,790,344
(141,071)
12 Corporation Tax
- -
- -
-
13 Withholding Taxes
19,928,198 (5,134,741) 14,793,457
14,793,457 - 14,793,457
-
14 Pay- As-You-Earn (PAYE)
260,721,075 5,134,741 265,855,816
265,855,816 - 265,855,816
-
15 Skills and Development Levy (SDL)
- -
- -
-
16 VAT paid to LTD/DRD
- -
- -
-
17 VAT paid to CED
- -
66,823 - 66,823
(66,823)
18 Excise Duty
- -
- - -
-
19 Import Duty
- -
74,248 - 74,248
(74,248)
20 Stamp Duty
- -
- -
-
21 Fuel Levy
- -
- -
-
22 Other material payments made to TRA
- -
- -
-
NSSF/PPF
153,650,081 - 153,650,081
153,726,081 - 153,726,081
(76,000)
23 NSSF Contribution
153,650,081 - 153,650,081
153,726,081 - 153,726,081
(76,000)
24 PPF Contribution
- -
- -
-
Local Authorities
- - -
- - -
-
25 Local Levy
- -
- -
-
26 Service Levy
- -
- -
-
27 Other Local Taxes, Fees and Levies
- -
- -
-
Ministry of Finance (MoF)
- - -
- - -
-
28 Dividends from Gov Shares
- -
- -
-
29 Revenues from Gov shareholding sale
- -
- -
-
Total payments
434,299,354 - 434,299,354
434,516,425 - 434,516,425
(217,071)
Social Payments
- - -
30 Corporate Social Resp cash payments
- -
31 Corporate Social Resp in-kind payments
- -
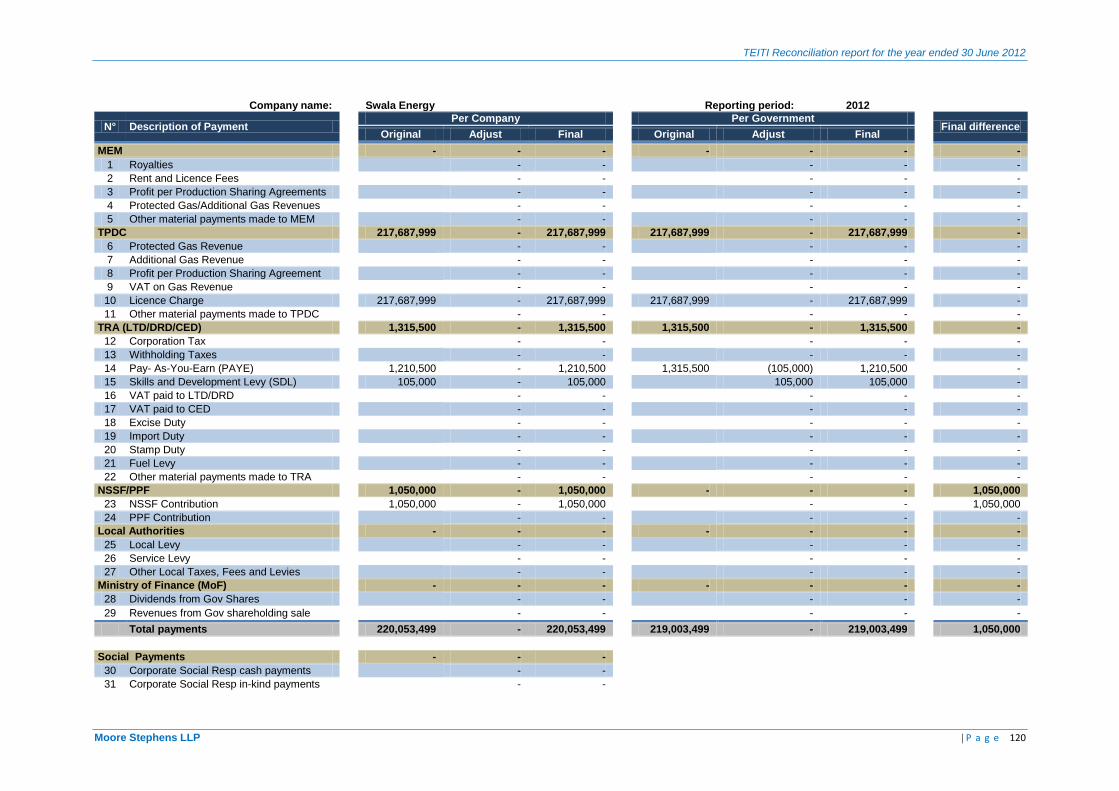
TEITI Reconciliation report for the year ended 30 June 2012
Moore Stephens LLP | P a g e 120
Company name:
Swala Energy
Reporting period: 2012
N° Description of Payment Per Company
Per Government
Final difference
Original Adjust Final
Original Adjust Final
MEM
- - -
- - -
-
1 Royalties
- -
- -
-
2 Rent and Licence Fees
- -
- -
-
3 Profit per Production Sharing Agreements
- -
- -
-
4 Protected Gas/Additional Gas Revenues
- -
- -
-
5 Other material payments made to MEM
- -
- -
-
TPDC
217,687,999 - 217,687,999
217,687,999 - 217,687,999
-
6 Protected Gas Revenue
- -
- -
-
7 Additional Gas Revenue
- -
- -
-
8 Profit per Production Sharing Agreement
- -
- -
-
9 VAT on Gas Revenue
- -
- -
-
10 Licence Charge
217,687,999 - 217,687,999
217,687,999 - 217,687,999
-
11 Other material payments made to TPDC
- -
- -
-
TRA (LTD/DRD/CED)
1,315,500 - 1,315,500
1,315,500 - 1,315,500
-
12 Corporation Tax
- -
- -
-
13 Withholding Taxes
- -
- -
-
14 Pay- As-You-Earn (PAYE)
1,210,500 - 1,210,500
1,315,500 (105,000) 1,210,500
-
15 Skills and Development Levy (SDL)
105,000 - 105,000
105,000 105,000
-
16 VAT paid to LTD/DRD
- -
- -
-
17 VAT paid to CED
- -
- -
-
18 Excise Duty
- -
- -
-
19 Import Duty
- -
- -
-
20 Stamp Duty
- -
- -
-
21 Fuel Levy
- -
- -
-
22 Other material payments made to TRA
- -
- -
-
NSSF/PPF
1,050,000 - 1,050,000
- - -
1,050,000
23 NSSF Contribution
1,050,000 - 1,050,000
- -
1,050,000
24 PPF Contribution
- -
- -
-
Local Authorities
- - -
- - -
-
25 Local Levy
- -
- -
-
26 Service Levy
- -
- -
-
27 Other Local Taxes, Fees and Levies
- -
- -
-
Ministry of Finance (MoF)
- - -
- - -
-
28 Dividends from Gov Shares
- -
- -
-
29 Revenues from Gov shareholding sale
- -
- -
-
Total payments
220,053,499 - 220,053,499
219,003,499 - 219,003,499
1,050,000
Social Payments
- - -
30 Corporate Social Resp cash payments
- -
31 Corporate Social Resp in-kind payments
- -
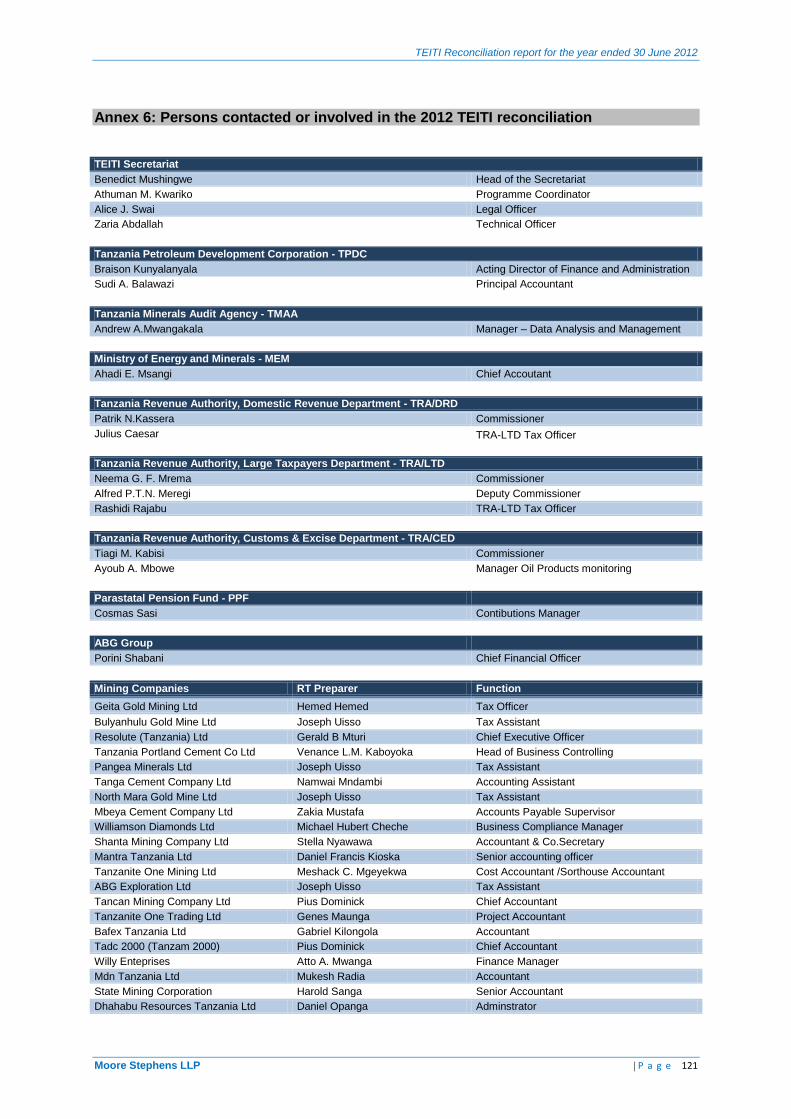
TEITI Reconciliation report for the year ended 30 June 2012
Moore Stephens LLP | P a g e 121
Annex 6: Persons contacted or involved in the 2012 TEITI reconciliation
TEITI Secretariat
Benedict Mushingwe Head of the Secretariat
Athuman M. Kwariko Programme Coordinator
Alice J. Swai Legal Officer
Zaria Abdallah Technical Officer
Tanzania Petroleum Development Corporation - TPDC
Braison Kunyalanyala Acting Director of Finance and Administration
Sudi A. Balawazi Principal Accountant
Tanzania Minerals Audit Agency - TMAA
Andrew A.Mwangakala Manager – Data Analysis and Management
Ministry of Energy and Minerals - MEM
Ahadi E. Msangi Chief Accoutant
Tanzania Revenue Authority, Domestic Revenue Department - TRA/DRD
Patrik N.Kassera Commissioner
Julius Caesar TRA-LTD Tax Officer
Tanzania Revenue Authority, Large Taxpayers Department - TRA/LTD
Neema G. F. Mrema Commissioner
Alfred P.T.N. Meregi Deputy Commissioner
Rashidi Rajabu TRA-LTD Tax Officer
Tanzania Revenue Authority, Customs & Excise Department - TRA/CED
Tiagi M. Kabisi Commissioner
Ayoub A. Mbowe Manager Oil Products monitoring
Parastatal Pension Fund - PPF
Cosmas Sasi Contibutions Manager
ABG Group
Porini Shabani Chief Financial Officer
Mining Companies RT Preparer Function
Geita Gold Mining Ltd Hemed Hemed Tax Officer
Bulyanhulu Gold Mine Ltd Joseph Uisso Tax Assistant
Resolute (Tanzania) Ltd Gerald B Mturi Chief Executive Officer
Tanzania Portland Cement Co Ltd Venance L.M. Kaboyoka Head of Business Controlling
Pangea Minerals Ltd Joseph Uisso Tax Assistant
Tanga Cement Company Ltd Namwai Mndambi Accounting Assistant
North Mara Gold Mine Ltd Joseph Uisso Tax Assistant
Mbeya Cement Company Ltd Zakia Mustafa Accounts Payable Supervisor
Williamson Diamonds Ltd Michael Hubert Cheche Business Compliance Manager
Shanta Mining Company Ltd Stella Nyawawa Accountant & Co.Secretary
Mantra Tanzania Ltd Daniel Francis Kioska Senior accounting officer
Tanzanite One Mining Ltd Meshack C. Mgeyekwa Cost Accountant /Sorthouse Accountant
ABG Exploration Ltd Joseph Uisso Tax Assistant
Tancan Mining Company Ltd Pius Dominick Chief Accountant
Tanzanite One Trading Ltd Genes Maunga Project Accountant
Bafex Tanzania Ltd Gabriel Kilongola Accountant
Tadc 2000 (Tanzam 2000) Pius Dominick Chief Accountant
Willy Enteprises Atto A. Mwanga Finance Manager
Mdn Tanzania Ltd Mukesh Radia Accountant
State Mining Corporation Harold Sanga Senior Accountant
Dhahabu Resources Tanzania Ltd Daniel Opanga Adminstrator
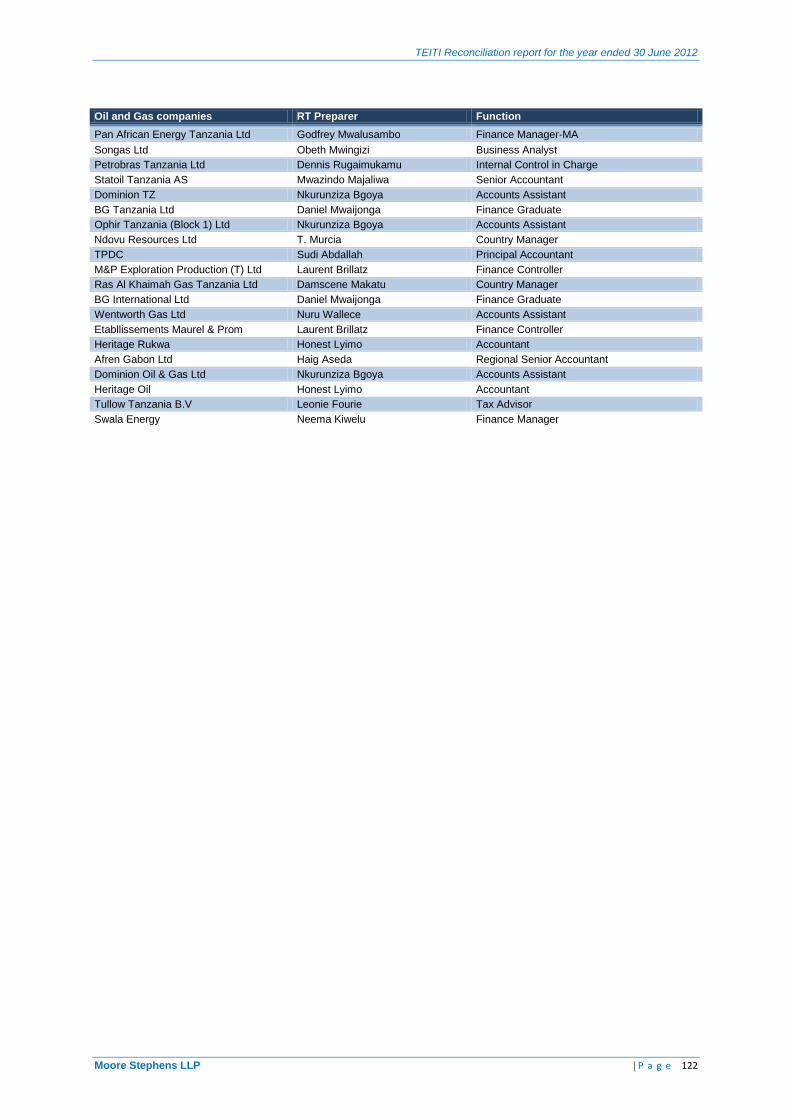
TEITI Reconciliation report for the year ended 30 June 2012
Moore Stephens LLP | P a g e 122
Oil and Gas companies RT Preparer Function
Pan African Energy Tanzania Ltd Godfrey Mwalusambo Finance Manager-MA
Songas Ltd Obeth Mwingizi Business Analyst
Petrobras Tanzania Ltd Dennis Rugaimukamu Internal Control in Charge
Statoil Tanzania AS Mwazindo Majaliwa Senior Accountant
Dominion TZ Nkurunziza Bgoya Accounts Assistant
BG Tanzania Ltd Daniel Mwaijonga Finance Graduate
Ophir Tanzania (Block 1) Ltd Nkurunziza Bgoya Accounts Assistant
Ndovu Resources Ltd T. Murcia Country Manager
TPDC Sudi Abdallah Principal Accountant
M&P Exploration Production (T) Ltd Laurent Brillatz Finance Controller
Ras Al Khaimah Gas Tanzania Ltd Damscene Makatu Country Manager
BG International Ltd Daniel Mwaijonga Finance Graduate
Wentworth Gas Ltd Nuru Wallece Accounts Assistant
Etabllissements Maurel & Prom Laurent Brillatz Finance Controller
Heritage Rukwa Honest Lyimo Accountant
Afren Gabon Ltd Haig Aseda Regional Senior Accountant
Dominion Oil & Gas Ltd Nkurunziza Bgoya Accounts Assistant
Heritage Oil Honest Lyimo Accountant
Tullow Tanzania B.V Leonie Fourie Tax Advisor
Swala Energy Neema Kiwelu Finance Manager