Embed Size (px)
DESCRIPTION
Enhancing Numerically-Predicted ground movements patterns due to shield tunnelling in clays
Citation preview
1
Abstract
A numerical technique capable of adequately representing the states of stress release associated with shield tunnelling in clay is presented. Tunnel excavation is simulated using a deconfinement method characterised by differential unloading scheme in terms of tangential and radial components. The former is intended to simulate the effect of the machine driving through clays, whereas the later is intended to simulate the gap closure behind the shield tail. A test problem previously solved by Burghignoli et al. [1] is resolved here. The results obtained from the proposed procedure using the finite-element method were found in very good agreement with their measured counterparts, and superior to those obtained previously for the subsurface movements. Keywords: shield tunnelling , deconfinement method, tunnel excavation, gap closure, ground movement, finite-element analysis. 1 Problem Statement Predictions from the conventional numerical techniques for simulating shallow-tunnel excavation are normally found in poor agreement with the measured ground response . These techniques (e.g., the deconfinement method) usually predict ground settlement troughs that are relatively wider and flatter than those of the normal Gaussian distribution, proved to be in good agreement with the observed response. In the commonly-used deconfinement method (e.g., Panet and Guenot [2]; Bernat and Cambou [3]; Bernat et al. [4]; Abdel-Fattah [5]), the initial geostatic loads acting on the tunnel perimeter prior to excavation are progressively reduced till a predefined ground loss (a predefined settlement trough volume) takes place.
Paper 276 Enhancing Numerically-Predicted Ground Movement Patterns due to Shield Tunnelling in Clays T.T. Abdel-Fattah†, A.Y. Akl‡, H.A. Hodhod‡ and A.M. Abdel-Rahman† † Department of Soil Mechanics and Foundation Engineering Housing and Building Research Centre, Giza, Egypt ‡ Department of Civil Engineering Faculty of Engineering, Cairo University, Giza, Egypt
Civil-Comp Press, 2005. Proceedings of the Tenth International Conference on Civil, Structural and Environmental Engineering Computing, B.H.V. Topping (Editor), Civil-Comp Press, Stirling, Scotland.
2
2 Numerical simulation of the excavation process
Simulation of the excavation process using the finite-element method may be carried out through removal of the soil elements that represent the soil mass excavated during a certain excavation stage. The equivalent nodal forces caused by the removal of these elements may be expressed as:
{ } [ ] [ ] [ ] { } [ ] { } [ ] { } { }Ewv
Tw
v
T
v
T
v
T fdvNdvPBdvNdvBf ++−−′= ∫∫∫∫ γγσ (1)
where { }f = equivalent nodal forces vector, [ ]B = strain-displacement transformation matrix,
[ ]σ ′ = effective stress matrix before excavation, { }γ = vector of effective body forces,
{ }wP = vector of pore pressure before excavation,
{ }wγ = vector of fluid weight forces, and
{ }Ef = vector of nodal forces equivalent to external loading (e.g., pressure).
The third and fourth terms in Equation (1) account for the effect of the presence of a ground water table during excavation. For excavation through water-bearing layers, the effect of the hydrostatic water pressure has to be incorporated in the calculations of the loads acting on the excavation perimeter. This is true regardless of the type of analysis (i.e., effective stress or total stress) performed. In some earlier research works (e.g., Esmail [6]; Mansur [7]; Bernt and Cambou [3]), the effect of the water pressure was neglected simply because the excavation loads were calculated from an effective stress analysis.
In the general-purpose finite-element codes with techniques for performing phased analyses (e.g., DIANA[8]), the excavation process can directly be simulated by specifying the elements that are active at the beginning of each analysis phase, and adopting a deconfinement ratio equivalent to the volume loss desired. But, the use of this procedure does not usually result in predictions for the ground movements that agree well with the field observations. Better predictions for the ground movements can be obtained if the excavation equivalent nodal forces are known in terms of either vertical and horizontal components, or radial and tangential ones. This allows for applying these force components with their desired ratios either simultaneously or independently on the excavation perimeter or even part of it. These force components have to be calculated using a special-purpose F.E. code since this is not featured in most general-purpose F.E. codes such as DIANA which
3
is used here to conduct the F.E. analyses. Accordingly, a self-developed F.E. code namely DIATUN is used here as will be presented in the following section. It is proposed to incorporate the effect of excavation in the F.E. analysis using the radial and tangential components of the excavation equivalent nodal forces since this is more representative to the construction stages.
3 Proposed excavation technique (DIATUN)
In order to determine the equivalent nodal forces that develop around the excavation boundary due to a specific deconfinement scheme, a F.E. code namely, DIATUN [5] has been developed. This code is used concurrently with the programme DIANA as follows. First, the nodal numbering, joint coordinates and element topologies are inputted into DIATUN, such that the nodal connectivity and Gauss point numbering in both DIATUN and DIANA are consistent. Second, the DIANA outputs for the gauss point stresses, and pore pressures calculated during the phase that precedes the excavation one, are inputted into DIATUN. Integration of Equation (1) is performed using the Gauss-Legendre numerical integration scheme. Two sets of the equivalent nodal force components are then outputted by DIATUN. The first is due to effective stresses, whereas the second is due to pore water pressures. In this way, different deconfinement percentages can be assigned to these two sets if desired by the user. The outputs can optionally be obtained due to either the global coordinate system or the tunnel local cylindrical coordinate system. The use of the later coordinate system allows for applying different deconfinement percentages for both the radial and tangential directions, if required. The equivalent nodal forces determined by DIATUN are then inputted into the subsequent DIANA's excavation phase.
4 Available techniques for enhancing numerically-predicted settlement trough shape
A number of simplified procedures were introduced to obtain better numerical predictions for the ground response. Burghignoli et al. [1] suggested the use of two different reduction factors for both the vertical and horizontal components of the initial geostatic loads acting on the tunnel perimeter prior to excavation. Further, two sets of factors may independently be applied to both lower and upper tunnel halves. The results obtained using the finite-difference method using this procedure were found in very good agreement with their measured counterparts.
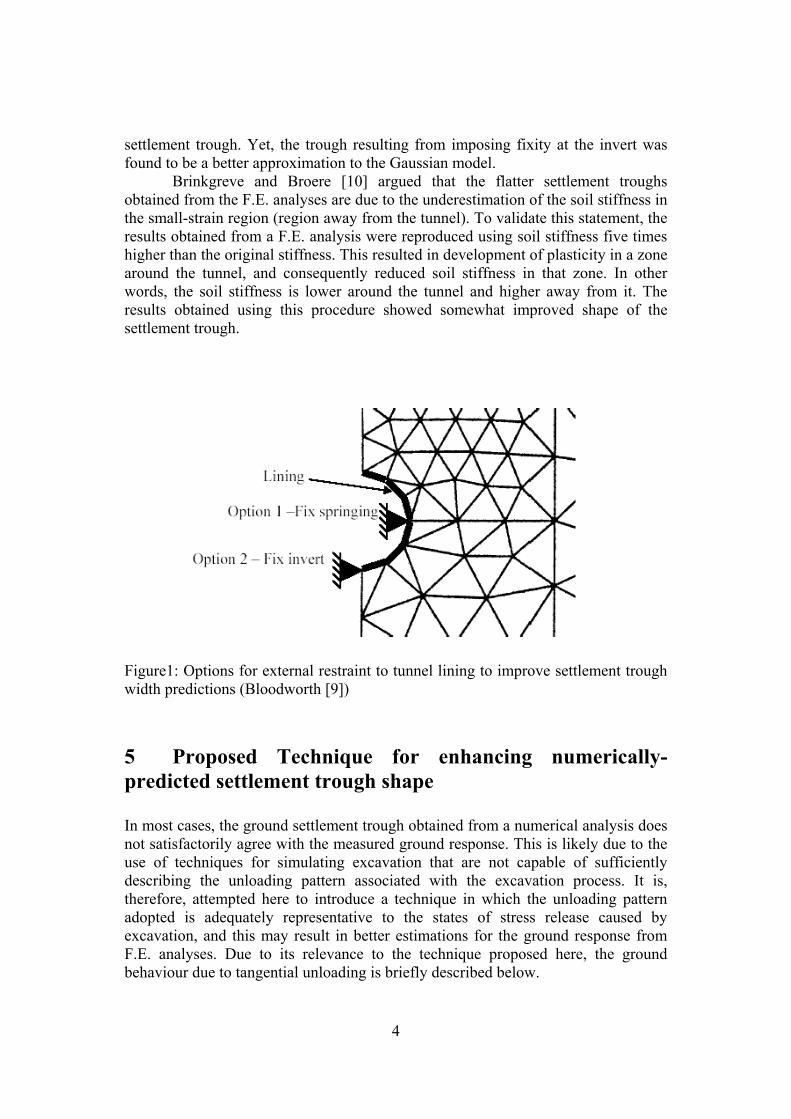
Bloodworth [9] proposed the introduction of an additional external restraint to the tunnel lining at either the spring line or invert, (Figure 1). This procedure, that involves volume loss modelling via shrinkage of the tunnel lining, aimed at improving the agreement between the finite-element results and the centrifuge observations, since the former predicted yielding and large displacements of a significant region of the soil beneath the tunnel. The results obtained from the F.E. analyses showed that both options of fixity may result in better estimations for the
4
settlement trough. Yet, the trough resulting from imposing fixity at the invert was found to be a better approximation to the Gaussian model.
Brinkgreve and Broere [10] argued that the flatter settlement troughs obtained from the F.E. analyses are due to the underestimation of the soil stiffness in the small-strain region (region away from the tunnel). To validate this statement, the results obtained from a F.E. analysis were reproduced using soil stiffness five times higher than the original stiffness. This resulted in development of plasticity in a zone around the tunnel, and consequently reduced soil stiffness in that zone. In other words, the soil stiffness is lower around the tunnel and higher away from it. The results obtained using this procedure showed somewhat improved shape of the settlement trough.
Figure1: Options for external restraint to tunnel lining to improve settlement trough width predictions (Bloodworth [9])
5 Proposed Technique for enhancing numerically-predicted settlement trough shape
In most cases, the ground settlement trough obtained from a numerical analysis does not satisfactorily agree with the measured ground response. This is likely due to the use of techniques for simulating excavation that are not capable of sufficiently describing the unloading pattern associated with the excavation process. It is, therefore, attempted here to introduce a technique in which the unloading pattern adopted is adequately representative to the states of stress release caused by excavation, and this may result in better estimations for the ground response from F.E. analyses. Due to its relevance to the technique proposed here, the ground behaviour due to tangential unloading is briefly described below.
5
5.1 Patterns of ground movements due to tangential unloading Bernat et al. [4] presented the results of pure shear unloading as part of the 2-D numerical analyses carried out for Lyons metro tunnel in France. They mentioned that the fluid behaviour of the grouting material implies that this material cannot sustain any shear stresses, and thus the actual shear deconfinement at the excavation periphery is certainly higher than the radial one. Bernat et al. [4] concluded that the whole tunnelling process cannot be modelled by a shear-only deconfinement, but it can be modeled by increasing the shear release factor relative to the radial one, provided that the lateral outward movement that relate to the shear-only deconfinement calculation is correctly predicted.
It is proposed here to simulate the excavation process by independently
deconfining both the radial and tangential components of the nodal forces acting on the excavation boundary.
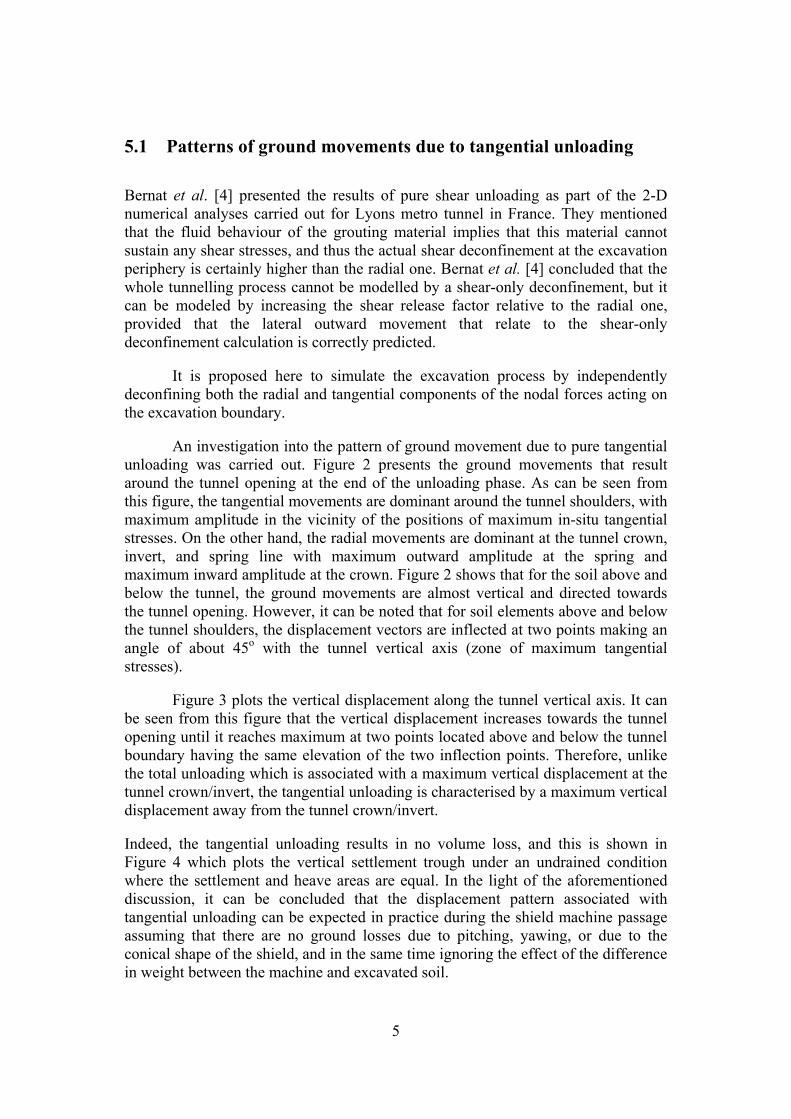
An investigation into the pattern of ground movement due to pure tangential
unloading was carried out. Figure 2 presents the ground movements that result around the tunnel opening at the end of the unloading phase. As can be seen from this figure, the tangential movements are dominant around the tunnel shoulders, with maximum amplitude in the vicinity of the positions of maximum in-situ tangential stresses. On the other hand, the radial movements are dominant at the tunnel crown, invert, and spring line with maximum outward amplitude at the spring and maximum inward amplitude at the crown. Figure 2 shows that for the soil above and below the tunnel, the ground movements are almost vertical and directed towards the tunnel opening. However, it can be noted that for soil elements above and below the tunnel shoulders, the displacement vectors are inflected at two points making an angle of about 45o with the tunnel vertical axis (zone of maximum tangential stresses).
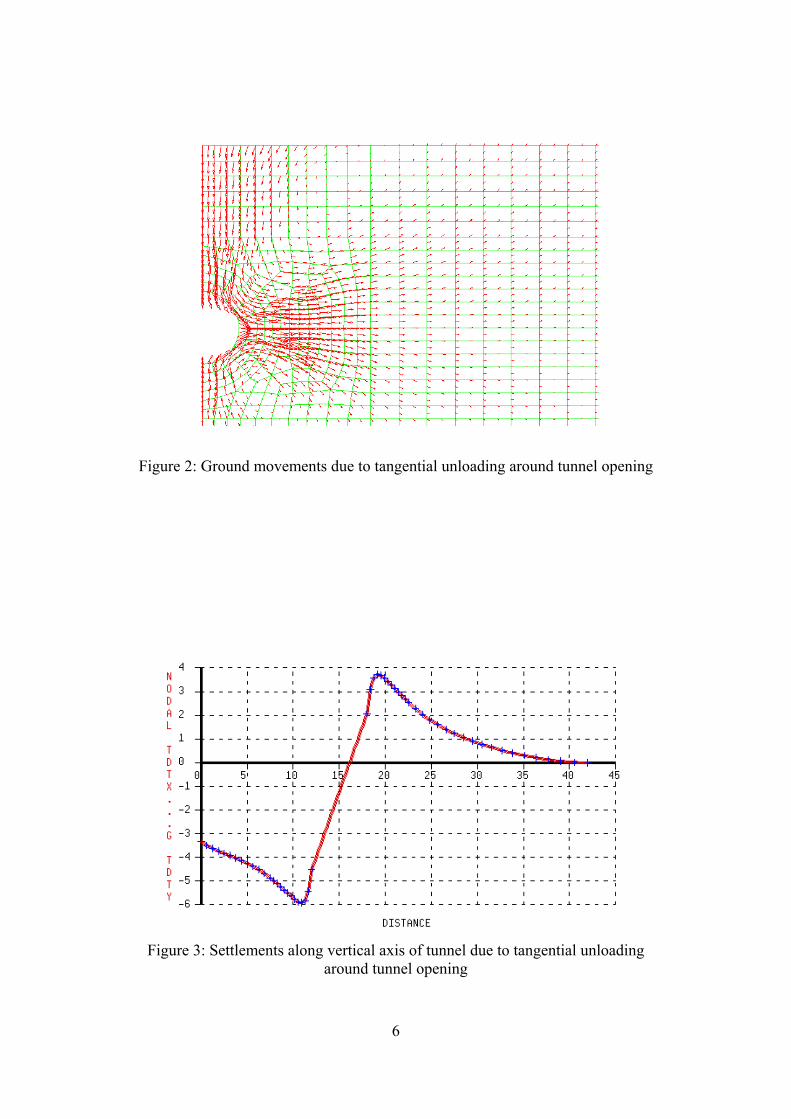
Figure 3 plots the vertical displacement along the tunnel vertical axis. It can
be seen from this figure that the vertical displacement increases towards the tunnel opening until it reaches maximum at two points located above and below the tunnel boundary having the same elevation of the two inflection points. Therefore, unlike the total unloading which is associated with a maximum vertical displacement at the tunnel crown/invert, the tangential unloading is characterised by a maximum vertical displacement away from the tunnel crown/invert.
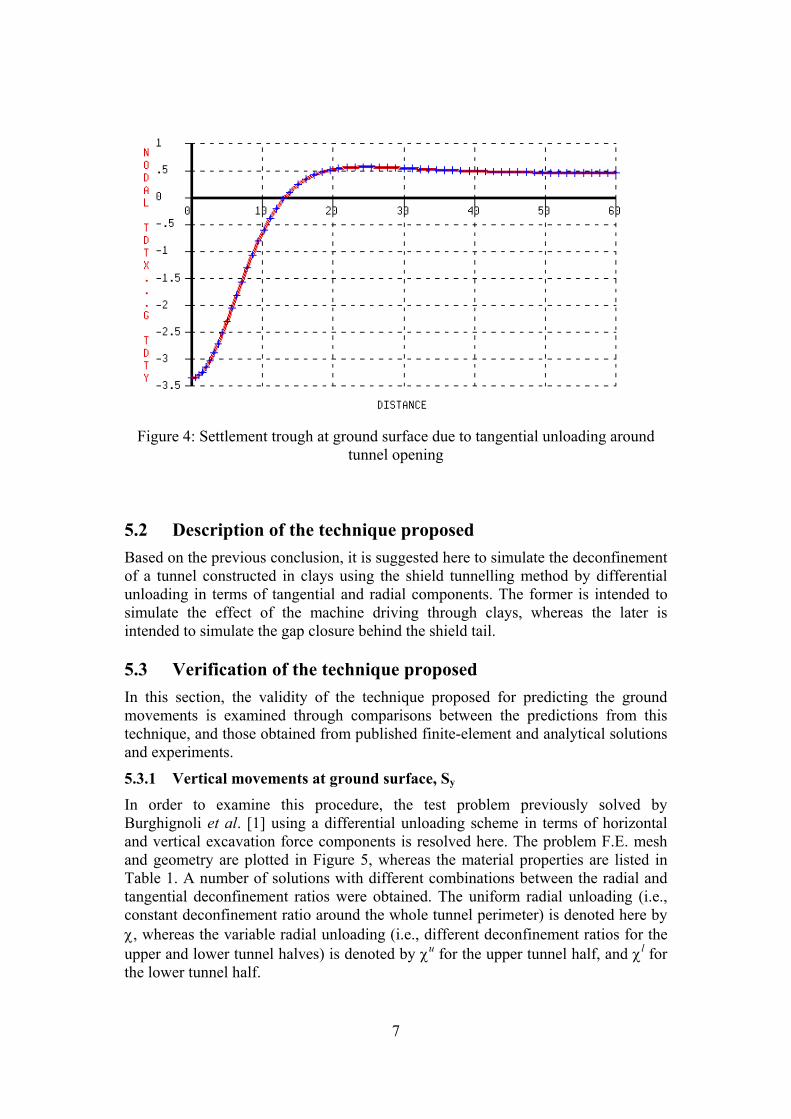
Indeed, the tangential unloading results in no volume loss, and this is shown in Figure 4 which plots the vertical settlement trough under an undrained condition where the settlement and heave areas are equal. In the light of the aforementioned discussion, it can be concluded that the displacement pattern associated with tangential unloading can be expected in practice during the shield machine passage assuming that there are no ground losses due to pitching, yawing, or due to the conical shape of the shield, and in the same time ignoring the effect of the difference in weight between the machine and excavated soil.
6
Figure 2: Ground movements due to tangential unloading around tunnel opening
Figure 3: Settlements along vertical axis of tunnel due to tangential unloading
around tunnel opening
7
Figure 4: Settlement trough at ground surface due to tangential unloading around
tunnel opening 5.2 Description of the technique proposed Based on the previous conclusion, it is suggested here to simulate the deconfinement of a tunnel constructed in clays using the shield tunnelling method by differential unloading in terms of tangential and radial components. The former is intended to simulate the effect of the machine driving through clays, whereas the later is intended to simulate the gap closure behind the shield tail. 5.3 Verification of the technique proposed In this section, the validity of the technique proposed for predicting the ground movements is examined through comparisons between the predictions from this technique, and those obtained from published finite-element and analytical solutions and experiments.
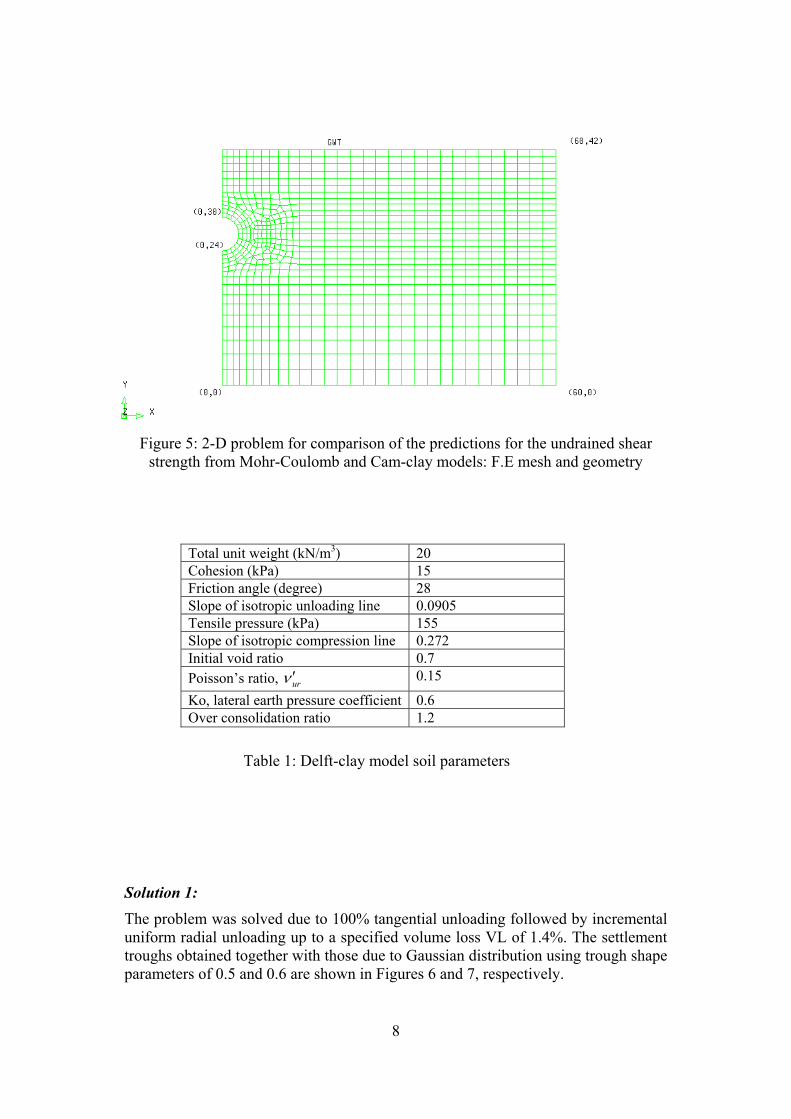
5.3.1 Vertical movements at ground surface, Sy In order to examine this procedure, the test problem previously solved by Burghignoli et al. [1] using a differential unloading scheme in terms of horizontal and vertical excavation force components is resolved here. The problem F.E. mesh and geometry are plotted in Figure 5, whereas the material properties are listed in Table 1. A number of solutions with different combinations between the radial and tangential deconfinement ratios were obtained. The uniform radial unloading (i.e., constant deconfinement ratio around the whole tunnel perimeter) is denoted here by χ, whereas the variable radial unloading (i.e., different deconfinement ratios for the upper and lower tunnel halves) is denoted by χu for the upper tunnel half, and χl for the lower tunnel half.
8
Figure 5: 2-D problem for comparison of the predictions for the undrained shear strength from Mohr-Coulomb and Cam-clay models: F.E mesh and geometry
Total unit weight (kN/m3) 20 Cohesion (kPa) 15 Friction angle (degree) 28 Slope of isotropic unloading line 0.0905 Tensile pressure (kPa) 155 Slope of isotropic compression line 0.272 Initial void ratio 0.7 Poisson’s ratio, urν ′ 0.15
Ko, lateral earth pressure coefficient 0.6 Over consolidation ratio 1.2
Table 1: Delft-clay model soil parameters
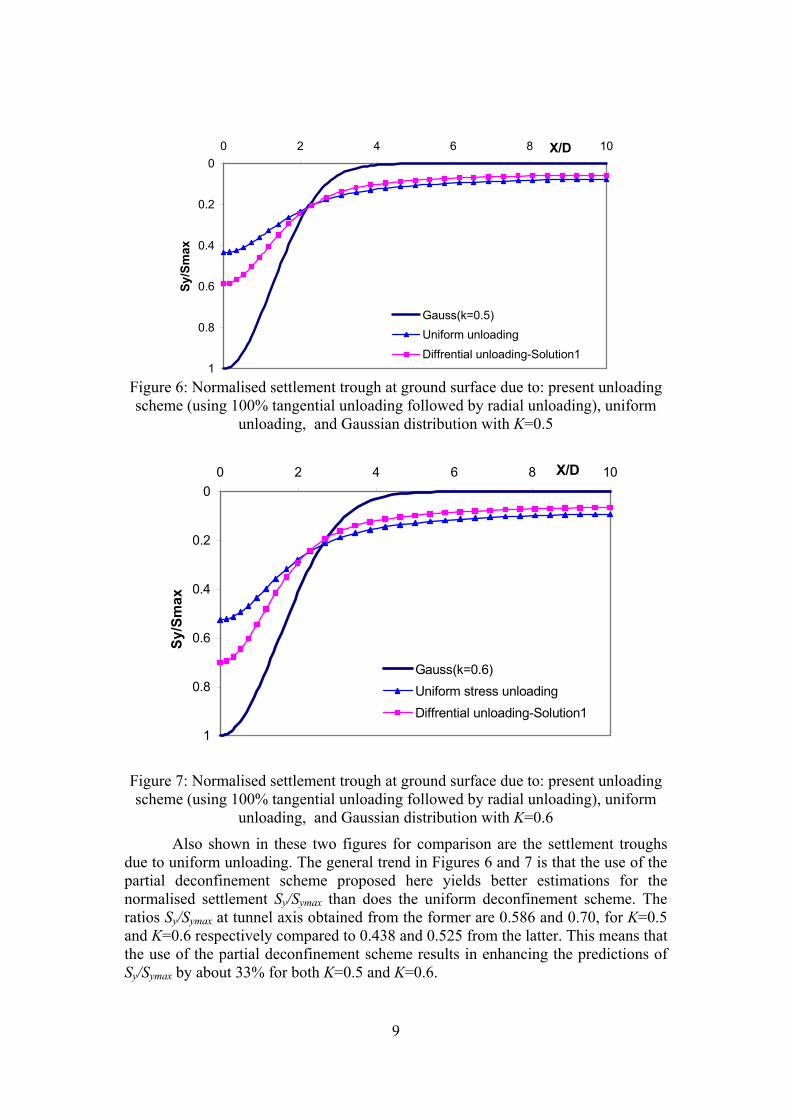
Solution 1: The problem was solved due to 100% tangential unloading followed by incremental uniform radial unloading up to a specified volume loss VL of 1.4%. The settlement troughs obtained together with those due to Gaussian distribution using trough shape parameters of 0.5 and 0.6 are shown in Figures 6 and 7, respectively.
9
0
0.2
0.4
0.6
0.8
1
0 2 4 6 8 10X/D
Sy/Smax
Gauss(k=0.5)Uniform unloadingDiffrential unloading-Solution1
Figure 6: Normalised settlement trough at ground surface due to: present unloading scheme (using 100% tangential unloading followed by radial unloading), uniform
unloading, and Gaussian distribution with K=0.5
0
0.2
0.4
0.6
0.8
1
0 2 4 6 8 10X/D
Sy/Smax
Gauss(k=0.6)Uniform stress unloadingDiffrential unloading-Solution1
Figure 7: Normalised settlement trough at ground surface due to: present unloading scheme (using 100% tangential unloading followed by radial unloading), uniform
unloading, and Gaussian distribution with K=0.6
Also shown in these two figures for comparison are the settlement troughs due to uniform unloading. The general trend in Figures 6 and 7 is that the use of the partial deconfinement scheme proposed here yields better estimations for the normalised settlement Sy/Symax than does the uniform deconfinement scheme. The ratios Sy/Symax at tunnel axis obtained from the former are 0.586 and 0.70, for K=0.5 and K=0.6 respectively compared to 0.438 and 0.525 from the latter. This means that the use of the partial deconfinement scheme results in enhancing the predictions of Sy/Symax by about 33% for both K=0.5 and K=0.6.
10
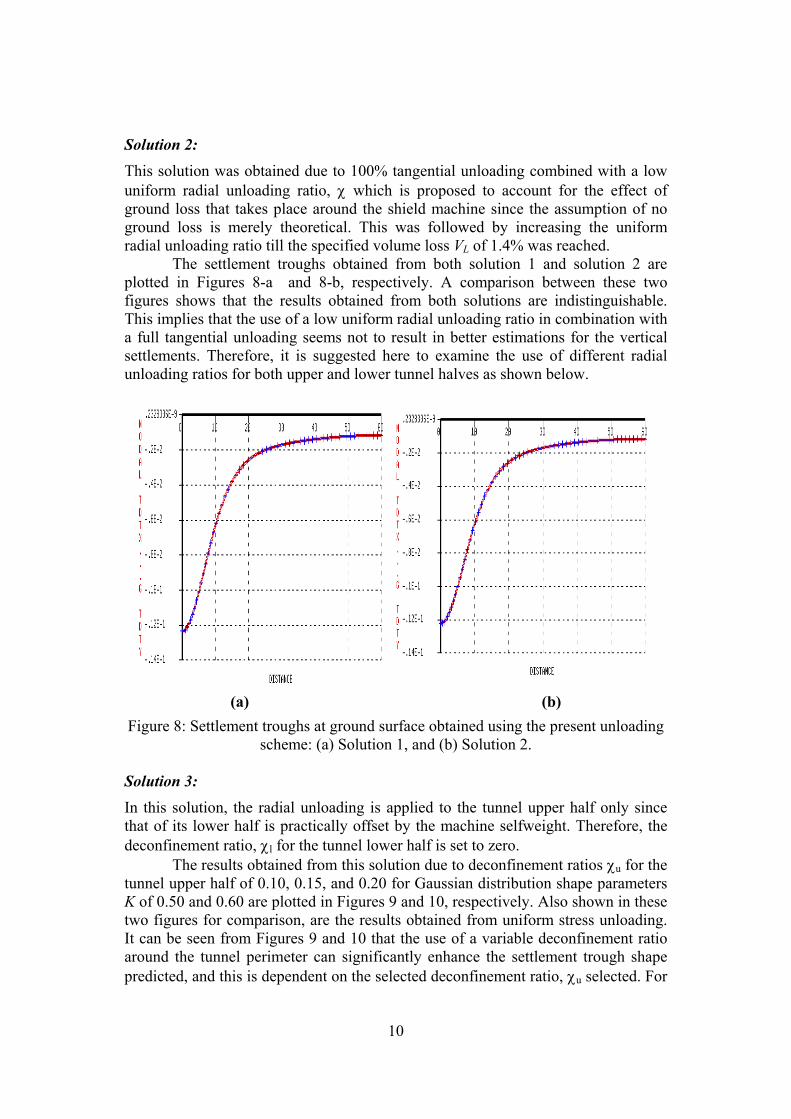
Solution 2: This solution was obtained due to 100% tangential unloading combined with a low uniform radial unloading ratio, χ which is proposed to account for the effect of ground loss that takes place around the shield machine since the assumption of no ground loss is merely theoretical. This was followed by increasing the uniform radial unloading ratio till the specified volume loss VL of 1.4% was reached.
The settlement troughs obtained from both solution 1 and solution 2 are plotted in Figures 8-a and 8-b, respectively. A comparison between these two figures shows that the results obtained from both solutions are indistinguishable. This implies that the use of a low uniform radial unloading ratio in combination with a full tangential unloading seems not to result in better estimations for the vertical settlements. Therefore, it is suggested here to examine the use of different radial unloading ratios for both upper and lower tunnel halves as shown below.
(a) (b)
Figure 8: Settlement troughs at ground surface obtained using the present unloading scheme: (a) Solution 1, and (b) Solution 2.
Solution 3: In this solution, the radial unloading is applied to the tunnel upper half only since that of its lower half is practically offset by the machine selfweight. Therefore, the deconfinement ratio, χl for the tunnel lower half is set to zero.
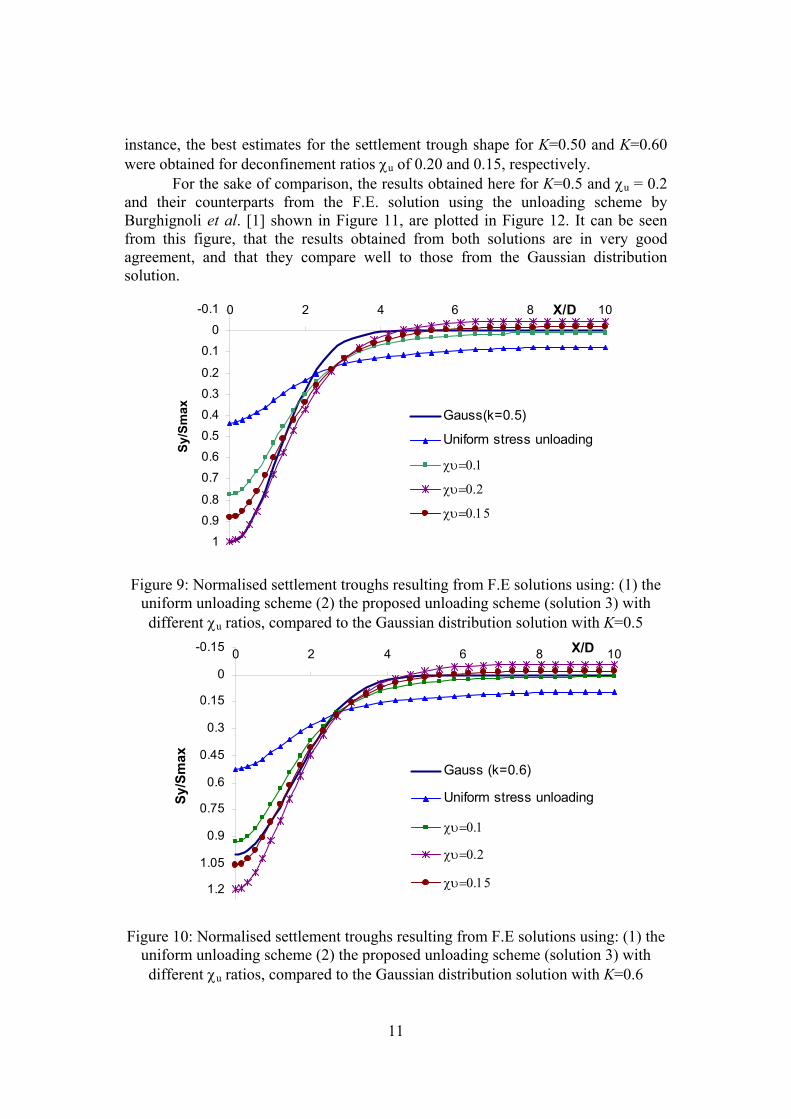
The results obtained from this solution due to deconfinement ratios χu for the tunnel upper half of 0.10, 0.15, and 0.20 for Gaussian distribution shape parameters K of 0.50 and 0.60 are plotted in Figures 9 and 10, respectively. Also shown in these two figures for comparison, are the results obtained from uniform stress unloading. It can be seen from Figures 9 and 10 that the use of a variable deconfinement ratio around the tunnel perimeter can significantly enhance the settlement trough shape predicted, and this is dependent on the selected deconfinement ratio, χu selected. For
11
instance, the best estimates for the settlement trough shape for K=0.50 and K=0.60 were obtained for deconfinement ratios χu of 0.20 and 0.15, respectively.
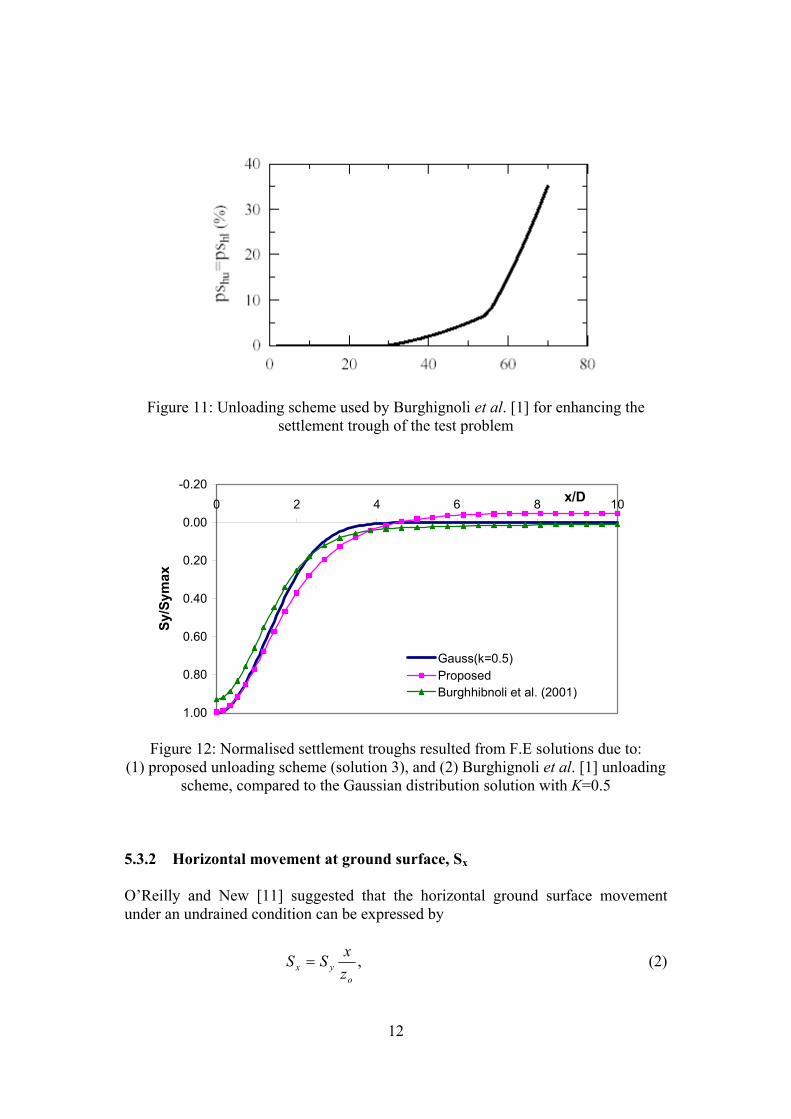
For the sake of comparison, the results obtained here for K=0.5 and χu = 0.2 and their counterparts from the F.E. solution using the unloading scheme by Burghignoli et al. [1] shown in Figure 11, are plotted in Figure 12. It can be seen from this figure, that the results obtained from both solutions are in very good agreement, and that they compare well to those from the Gaussian distribution solution.
-0.1
00.1
0.20.3
0.4
0.50.6
0.7
0.80.9
1
0 2 4 6 8 10X/D
Sy/Smax Gauss(k=0.5)
Uniform stress unloading
χυ=0.1
χυ=0.2
χυ=0.15
Figure 9: Normalised settlement troughs resulting from F.E solutions using: (1) the
uniform unloading scheme (2) the proposed unloading scheme (solution 3) with different χu ratios, compared to the Gaussian distribution solution with K=0.5
-0.15
0
0.15
0.3
0.45
0.6
0.75
0.9
1.05
1.2
0 2 4 6 8 10X/D
Sy/Smax
Gauss (k=0.6)
Uniform stress unloading
χυ=0.1
χυ=0.2
χυ=0.15
Figure 10: Normalised settlement troughs resulting from F.E solutions using: (1) the
uniform unloading scheme (2) the proposed unloading scheme (solution 3) with different χu ratios, compared to the Gaussian distribution solution with K=0.6
12
Figure 11: Unloading scheme used by Burghignoli et al. [1] for enhancing the settlement trough of the test problem
-0.20
0.00
0.20
0.40
0.60
0.80
1.00
0 2 4 6 8 10x/D
Sy/Symax
Gauss(k=0.5)ProposedBurghhibnoli et al. (2001)
Figure 12: Normalised settlement troughs resulted from F.E solutions due to:
(1) proposed unloading scheme (solution 3), and (2) Burghignoli et al. [1] unloading scheme, compared to the Gaussian distribution solution with K=0.5
5.3.2 Horizontal movement at ground surface, Sx O’Reilly and New [11] suggested that the horizontal ground surface movement under an undrained condition can be expressed by
,o
yx zxSS = (2)
13
provided that the Gaussian distribution shape parameter, K is constant with depth. Taylor [12] introduced the following enhanced relation for predicting the horizontal ground movement in clays taking into account the variation of K with depth:
( )zZ
ySSo
vh
−
+
=
325.0175.01
, (3)
which reduces to
oyx z
xSS 65.0= (4)
at the ground surface
Equation (3) implies that the displacement vectors focus on a point located
on the tunnel vertical centerline having a Z-coordinate of oz325.0175.0 below the
springline. Contrary to the assumption that the horizontal movements can be described
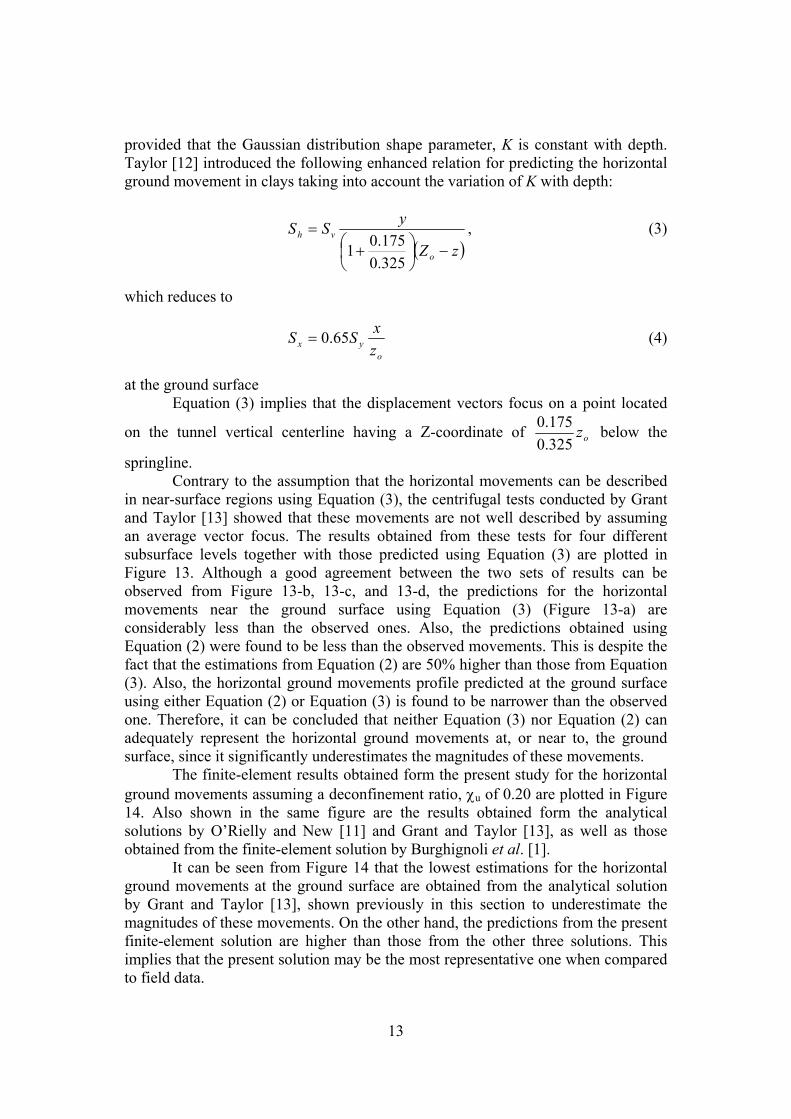
in near-surface regions using Equation (3), the centrifugal tests conducted by Grant and Taylor [13] showed that these movements are not well described by assuming an average vector focus. The results obtained from these tests for four different subsurface levels together with those predicted using Equation (3) are plotted in Figure 13. Although a good agreement between the two sets of results can be observed from Figure 13-b, 13-c, and 13-d, the predictions for the horizontal movements near the ground surface using Equation (3) (Figure 13-a) are considerably less than the observed ones. Also, the predictions obtained using Equation (2) were found to be less than the observed movements. This is despite the fact that the estimations from Equation (2) are 50% higher than those from Equation (3). Also, the horizontal ground movements profile predicted at the ground surface using either Equation (2) or Equation (3) is found to be narrower than the observed one. Therefore, it can be concluded that neither Equation (3) nor Equation (2) can adequately represent the horizontal ground movements at, or near to, the ground surface, since it significantly underestimates the magnitudes of these movements.
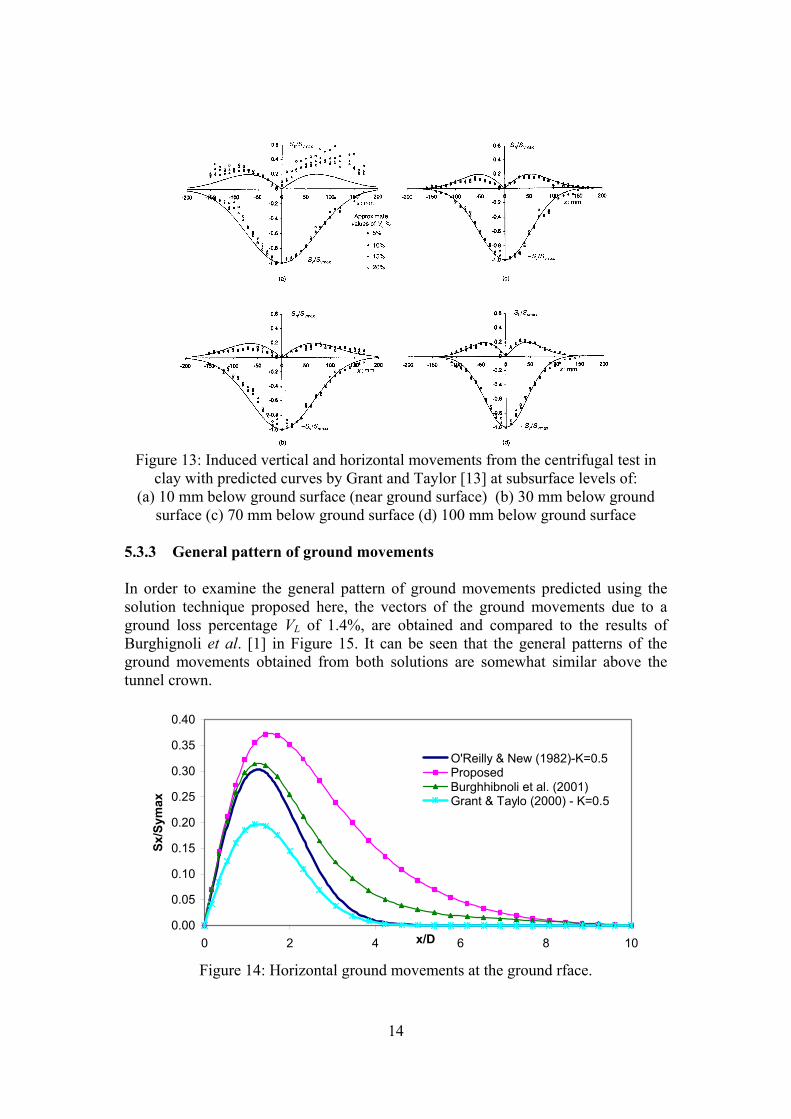
The finite-element results obtained form the present study for the horizontal ground movements assuming a deconfinement ratio, χu of 0.20 are plotted in Figure 14. Also shown in the same figure are the results obtained form the analytical solutions by O’Rielly and New [11] and Grant and Taylor [13], as well as those obtained from the finite-element solution by Burghignoli et al. [1].
It can be seen from Figure 14 that the lowest estimations for the horizontal ground movements at the ground surface are obtained from the analytical solution by Grant and Taylor [13], shown previously in this section to underestimate the magnitudes of these movements. On the other hand, the predictions from the present finite-element solution are higher than those from the other three solutions. This implies that the present solution may be the most representative one when compared to field data.
14
Figure 13: Induced vertical and horizontal movements from the centrifugal test in
clay with predicted curves by Grant and Taylor [13] at subsurface levels of: (a) 10 mm below ground surface (near ground surface) (b) 30 mm below ground
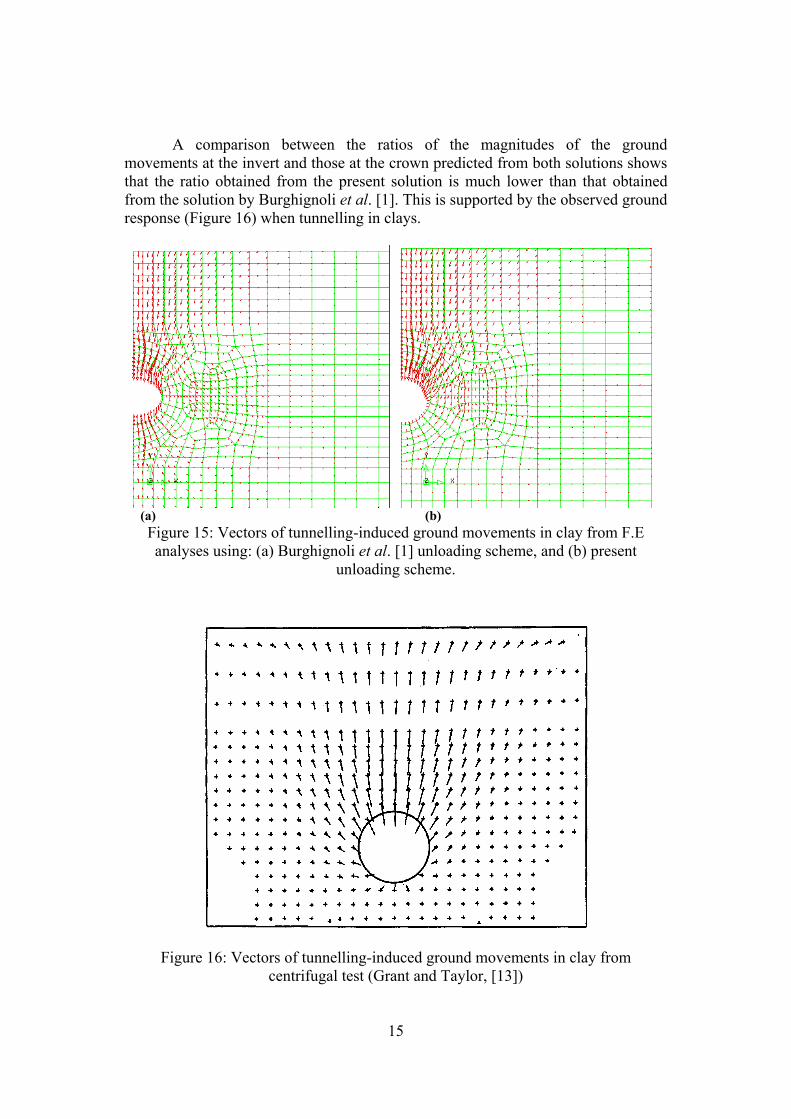
surface (c) 70 mm below ground surface (d) 100 mm below ground surface 5.3.3 General pattern of ground movements In order to examine the general pattern of ground movements predicted using the solution technique proposed here, the vectors of the ground movements due to a ground loss percentage VL of 1.4%, are obtained and compared to the results of Burghignoli et al. [1] in Figure 15. It can be seen that the general patterns of the ground movements obtained from both solutions are somewhat similar above the tunnel crown.
0.00
0.05
0.10
0.15
0.20
0.25
0.30
0.35
0.40
0 2 4 6 8 10x/D
Sx/Symax
O'Reilly & New (1982)-K=0.5ProposedBurghhibnoli et al. (2001)Grant & Taylo (2000) - K=0.5
Figure 14: Horizontal ground movements at the ground rface.
15
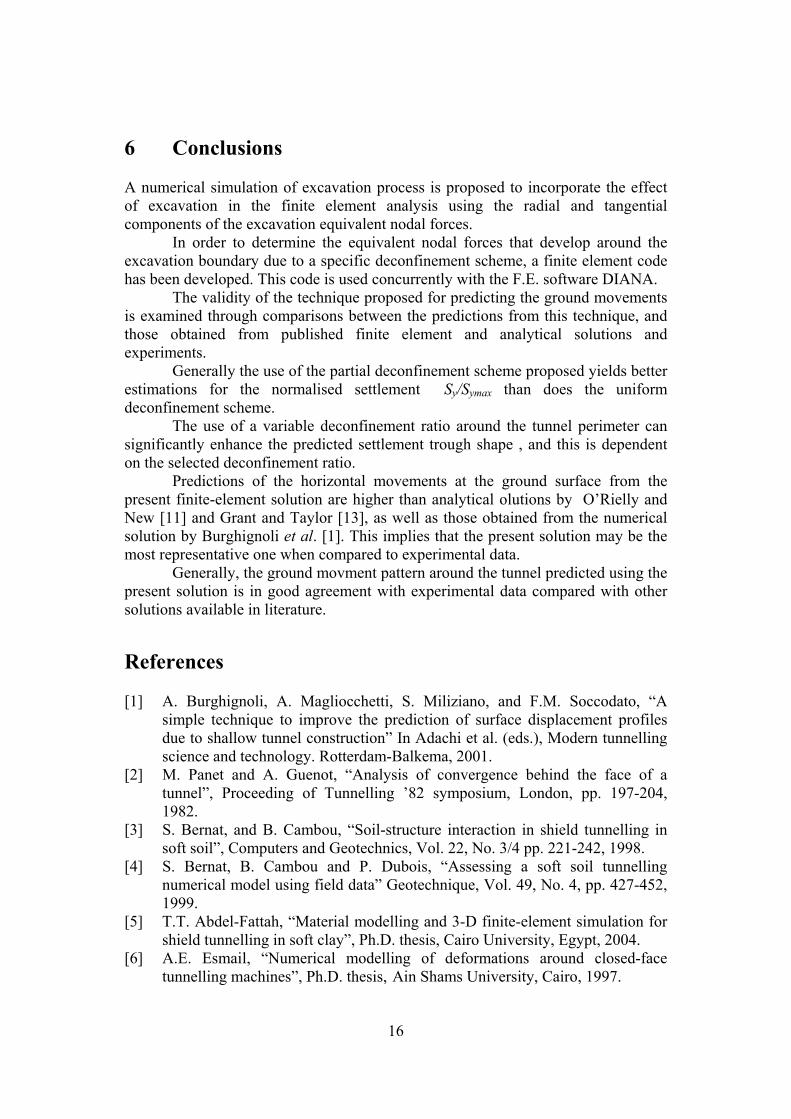
A comparison between the ratios of the magnitudes of the ground movements at the invert and those at the crown predicted from both solutions shows that the ratio obtained from the present solution is much lower than that obtained from the solution by Burghignoli et al. [1]. This is supported by the observed ground response (Figure 16) when tunnelling in clays.
(a) (b) Figure 15: Vectors of tunnelling-induced ground movements in clay from F.E analyses using: (a) Burghignoli et al. [1] unloading scheme, and (b) present
unloading scheme.
Figure 16: Vectors of tunnelling-induced ground movements in clay from centrifugal test (Grant and Taylor, [13])
16
6 Conclusions A numerical simulation of excavation process is proposed to incorporate the effect of excavation in the finite element analysis using the radial and tangential components of the excavation equivalent nodal forces.
In order to determine the equivalent nodal forces that develop around the excavation boundary due to a specific deconfinement scheme, a finite element code has been developed. This code is used concurrently with the F.E. software DIANA.
The validity of the technique proposed for predicting the ground movements is examined through comparisons between the predictions from this technique, and those obtained from published finite element and analytical solutions and experiments.
Generally the use of the partial deconfinement scheme proposed yields better estimations for the normalised settlement Sy/Symax than does the uniform deconfinement scheme.
The use of a variable deconfinement ratio around the tunnel perimeter can significantly enhance the predicted settlement trough shape , and this is dependent on the selected deconfinement ratio.
Predictions of the horizontal movements at the ground surface from the present finite-element solution are higher than analytical olutions by O’Rielly and New [11] and Grant and Taylor [13], as well as those obtained from the numerical solution by Burghignoli et al. [1]. This implies that the present solution may be the most representative one when compared to experimental data.
Generally, the ground movment pattern around the tunnel predicted using the present solution is in good agreement with experimental data compared with other solutions available in literature.
References [1] A. Burghignoli, A. Magliocchetti, S. Miliziano, and F.M. Soccodato, “A
simple technique to improve the prediction of surface displacement profiles due to shallow tunnel construction” In Adachi et al. (eds.), Modern tunnelling science and technology. Rotterdam-Balkema, 2001.
[2] M. Panet and A. Guenot, “Analysis of convergence behind the face of a tunnel”, Proceeding of Tunnelling ’82 symposium, London, pp. 197-204, 1982.
[3] S. Bernat, and B. Cambou, “Soil-structure interaction in shield tunnelling in soft soil”, Computers and Geotechnics, Vol. 22, No. 3/4 pp. 221-242, 1998.
[4] S. Bernat, B. Cambou and P. Dubois, “Assessing a soft soil tunnelling numerical model using field data” Geotechnique, Vol. 49, No. 4, pp. 427-452, 1999.
[5] T.T. Abdel-Fattah, “Material modelling and 3-D finite-element simulation for shield tunnelling in soft clay”, Ph.D. thesis, Cairo University, Egypt, 2004.
[6] A.E. Esmail, “Numerical modelling of deformations around closed-face tunnelling machines”, Ph.D. thesis, Ain Shams University, Cairo, 1997.
17
[7] M.A.M. Mansour, “Three-dimensional numerical modelling of hydroshield tunnelling”, Thesis presented to university of Innsbruck, in partial fulfilment of the requirements for the degree of Doctor of engineering science, 1996.
[8] DIANA, A Finite-Element Analysis Programme, User’s Manual-Release 8.1 (2nd ed.), TNO DIANA BV., Delft, The Netherlands, 2003.
[9] A.G. Bloodworth, “Three-dimensional analysis of tunnelling effects on structures to develop design method”, Ph.D. thesis, University of Oxford, 2002.
[10] R.B.J. Brinkgreve and W. Broere, “The influence of tunnel boring on foundations and buildings in urban areas – A numerical study”, Int. workshop on geotechnics of soft soils - Theory and practice. Vermeer, Schweiger, Karstunen & Cundy (eds.), pp. 257-263, 2003.
[11] M.P. O’Reilly, and B.M New, “Settlements above tunnels in the United Kingdom-their magnitude and prediction”, Proceeding of Tunnelling ’82 symposium, London, pp. 173-181, 1982.
[12] R.N. Taylor, “Tunnelling in soft ground in the UK.” Under ground conastruction in soft ground, Fujita & kusakabe (eds.) Balkema, Rotterdam, pp. 123-126, 1995.
[13] R.J. Grant and R.N. Taylor, “Tunnelling-induced ground movements in clay.” Proc. Inst. Civ. Engng., Vol. 143, pp. 43-55, 2000.