Embed Size (px)
Citation preview
Targeted therapies for targeted populations: Anti-EGFR treatment for EGFR amplified gastroesophageal adenocarcinoma
Authors: Steven B. Maron1, Lindsay Alpert
2, Heewon A. Kwak
2, Samantha Lomnicki
1, Leah
Chase1, David Xu
1, Emily O’Day
1, Rebecca J. Nagy
3 Richard B. Lanman
3, Fabiola Cecchi
4,
Todd Hembrough4, Alexa Schrock
5, John Hart
2, Shu-Yuan Xiao
2, Namrata Setia
2, Daniel V.T.
Catenacci*1
1Department of Medicine, University of Chicago, Chicago, IL.
2Department of Pathology, University of Chicago, Chicago, IL.
3Guardant Health, Inc., Redwood City, CA
4NantOmics, LLC, Rockville, MD
5Foundation Medicine, Inc., Cambridge, MA
Running Title: Anti-EGFR treatment for EGFR amplified gastroesophageal carcinoma
Keywords: EGFR amplification, gastroesophageal adenocarcinoma, cetuximab, ABT-806,
heterogeneity
*Corresponding Author
Daniel V.T. Catenacci, MD
University of Chicago Comprehensive Cancer Center, Section of Hematology/Oncology
5841 S. Maryland Avenue
Chicago, IL 60637
E-mail: [email protected]
Financial support: This work was supported by the NIH K23 award (CA178203-01A1),
UCCCC (University of Chicago Comprehensive Cancer Center) Award in
Precision Oncology—CCSG (Cancer Center Support Grant) (P30CA014599), Castle Foundation
Award, LLK (Live Like Katie) Foundation Award, and the Sal Ferrara II Fund for PANGEA.
Competing interests: DVTC has received research funding from Genentech/Roche, Amgen,
Nantomics and honoraria from Genentech/Roche, Amgen, Eli Lilly, Five Prime, Merck, BMS,
Nantomics, Guardant Health, Foundation Medicine.
Figures: 4
Tables: 3
Supplementary Files: 1
Supplementary Figures: 3
Supplementary Tables: 4
Research. on July 1, 2019. © 2018 American Association for Cancercancerdiscovery.aacrjournals.org Downloaded from
Author manuscripts have been peer reviewed and accepted for publication but have not yet been edited. Author Manuscript Published OnlineFirst on February 15, 2018; DOI: 10.1158/2159-8290.CD-17-1260
2
Abstract: Previous anti-EGFR trials in unselected gastroesophageal adenocarcinoma (GEA)
patients were resoundingly negative. We identified EGFR amplification in 5% (19/363) of
patients at the University of Chicago, including 6% (8/140) who were prospectively screened
with intention-to-treat using anti-EGFR therapy. Seven pts received >1 dose of treatment: three
first line FOLFOX plus ABT-806, one second line FOLFIRI plus cetuximab, and three
third/fourth line cetuximab alone. Treatment achieved objective response in 58% (4/7) and
disease control in 100% (7/7) with a median progression-free survival of 10 months. Pre and
post-treatment tumor NGS, serial plasma ctDNA NGS, and tumor IHC/FISH for EGFR revealed
pre-existing and/or acquired genomic events including EGFR negative clones, PTEN deletion,
KRAS amplification/mutation, NRAS, MYC and HER2 amplification, and GNAS mutations
serving as mechanisms of resistance. Two evaluable patients demonstrated interval increase of
CD3+ infiltrate, including one who demonstrated increased NKp46+, and PD-L1 IHC expression
from baseline, suggesting an immune therapeutic mechanism of action. EGFR amplification
predicted benefit from anti-EGFR therapy, albeit until various resistance mechanisms emerged.
Statement of Significance: This paper highlights the role of EGFR inhibitors
in EGFR amplified GEA – despite negative results in prior unselected phase III trials. Using
serial ctDNA and tissue NGS, we identified mechanisms of primary and acquired resistance in
all patients, as well as potential contribution of antibody-dependent cell-mediated cytotoxicity
(ADCC) to their clinical benefit.
Research. on July 1, 2019. © 2018 American Association for Cancercancerdiscovery.aacrjournals.org Downloaded from
Author manuscripts have been peer reviewed and accepted for publication but have not yet been edited. Author Manuscript Published OnlineFirst on February 15, 2018; DOI: 10.1158/2159-8290.CD-17-1260
3
Introduction
Gastric (GC) and esophagogastric junction (EGJ) adenocarcinoma, together gastroesophageal
adenocarcinoma (GEA), has the third highest incidence and second highest for cancer-related
mortality, and it remains a significant global health problem (1). When routine screening is not
conducted, most patients present with de novo metastatic disease or locally advanced disease
with high risk of recurrence. Approximately 55-60% of patients recur within 5 years after
curative intent resection despite perioperative therapy (2). Median overall survival of stage IV
GEA is 11-12 months with optimal palliative chemotherapy, and increases to 16 months for
patients with HER2 amplified tumors with the addition of trastuzumab to first line chemotherapy
(3). To date, ramucirumab, an anti-VEGFR2 monoclonal antibody, is the only other approved
second line biologic therapy for GEA as monotherapy or in combination with paclitaxel, with
modest clinical benefit (4,5).
Numerous other targeted therapies have been evaluated in metastatic GEA in various
lines and settings, but all of these have been uniformly negative. Recent examples include
EGFR, MET, mTOR, and hedgehog pathway inhibitors – generally in genomically unselected
patients (6-13).
Epithelial growth factor receptor (EGFR) is a well-recognized mediator of oncogenic
phenotype. EGFR inhibitors including monoclonal antibodies (cetuximab, panitumumab,
necitumumab) and tyrosine kinase inhibitors (erlotinib, gefitinib, afatinib, lapatinib, osimertinib)
have been approved for various cancers including lung, head and neck, and colon. Early phase
clinical trials had suggested potential benefit in unselected patients with GEA (14-26). These
results supported further evaluation in larger phase III trials - EXPAND (cetuximab plus
chemotherapy, first line), REAL-3 (panitumumab plus chemotherapy, first line), and COG
Research. on July 1, 2019. © 2018 American Association for Cancercancerdiscovery.aacrjournals.org Downloaded from
Author manuscripts have been peer reviewed and accepted for publication but have not yet been edited. Author Manuscript Published OnlineFirst on February 15, 2018; DOI: 10.1158/2159-8290.CD-17-1260
4
(gefitinib monotherapy, second-fourth line)(6-8). Disappointingly, each of these phase III trials
was negative, and panitumumab actually resulted in worse survival compared to the control;
evaluation of EGFR inhibition was abruptly abandoned for GEA.
If HER2-targeted therapeutic development was devised in the same biologically
unselected manner, it likely would have suffered the same fate as anti-EGFR therapy– to the
detriment of that subset of patients with HER2 amplified tumors who we now understand to
derive significant benefit from this targeted approach. In the registration TOGA trial, nearly
4000 patients were screened in order to identify the necessary number of HER2 amplified
patients (n= 584) to adequately power the study. Despite this patient selection hurdle
representing only ~15% of GEA, screening for HER2 amplification by FISH enriched for those
most likely to benefit based on strong pre-clinical rationale (3). Analogously, EGFR
amplification reportedly occurs in ~4% of GEA in TCGA (CbioPortal) (27,28), yet prospective
EGFR amplification screening in stage IV patients and targeting therapy in this biologically
relevant population is currently lacking.
TCGA as well as other sequencing efforts identified a high degree of chromosomal
instability in GEA (27-37). This instability generates additional oncogenic drivers, including
gene amplifications of well-known receptor tyrosine kinases including HER2, MET, FGFR2 and
EGFR. Pre-clinical and clinical evidence suggest benefit of EGFR inhibitors for EGFR
genomically-driven tumors. In lung cancer, patients with EGFR-mutated tumors derive a greater
response and survival than EGFR wild type patients (38,39). More relevantly, analyses were
reported from two large phase III trials for squamous cell lung cancer evaluating the subset of
patients with EGFR amplification or increased gene copy number. In this ‘EGFR positive’
subgroup of patients, the addition of cetuximab to chemotherapy in the SWOG S0819 trial
Research. on July 1, 2019. © 2018 American Association for Cancercancerdiscovery.aacrjournals.org Downloaded from
Author manuscripts have been peer reviewed and accepted for publication but have not yet been edited. Author Manuscript Published OnlineFirst on February 15, 2018; DOI: 10.1158/2159-8290.CD-17-1260
5
increased median overall survival from 6.4 to 11.8 months (p=0.007) (40), and in the SQUIRE
trial (41), this same molecular subgroup, trended towards a significant benefit with necitumumab
(PFS/OS: HR 0.71/0.70)(41,42). Similarly, phase II evaluation of second-line or greater icotinib
in advanced squamous esophageal cancer patients with either high expression by IHC or
amplification by FISH demonstrated a 16.7% objective response rate and 46.3% disease control
rate (43). Most relevant, however, are studies focusing on EGFR gene copy and benefit from
anti-EGFR therapy in GEA samples and patients. Pre-clinical xenograft models of GEA
demonstrated that all responders possessed ≥4 EGFR copies and suggested an even smaller
population of those with ‘high’ gene copy number having the highest probability of benefit (44).
A post-hoc subset analysis of a phase II trial of FOLFOX with cetuximab in GEA confirmed an
association between EGFR amplification and overall survival (p=0.011) (45). In the TRANS-
COG correlative study of the prospective phase III COG trial of gefitinib monotherapy, 16.3% of
patients possessed ‘EGFR positive’ tumors, and the smaller subset of these patients with true
gene amplification (6.1%, 18/294) derived a statistically significant survival benefit with the
addition of gefitinib in a post-hoc analysis (HR 0.19, p=0.007) (46). The EXPAND trial
demonstrated survival benefit in the small subset with extremely high EGFR H-Score expression
(6,47), which was possibly attributable to an underlying subset of EGFR amplified tumors, but
this has yet to be confirmed.
EGFR monoclonal antibodies reportedly act by preventing activating ligands from
binding the extracellular domain and/or receptor internalization/degradation of the receptor, but
induction of antibody-dependent cell-mediated cytotoxicity (ADCC) via the Fc portion of the
antibody may serve as an additional mechanism of action (48,49). This has been reported with
multiple IgG1 monoclonal antibodies including rituximab, trastuzumab, and cetuximab and is
Research. on July 1, 2019. © 2018 American Association for Cancercancerdiscovery.aacrjournals.org Downloaded from
Author manuscripts have been peer reviewed and accepted for publication but have not yet been edited. Author Manuscript Published OnlineFirst on February 15, 2018; DOI: 10.1158/2159-8290.CD-17-1260
6
believed to be mediated by NK cells with resultant dendritic cell and CD8+ T-cell priming (48-
51).
Due to these pre-clinical and clinical subset analyses suggesting potential benefit of
EGFR inhibitors for EGFR-amplified GEA patients, we sought to first describe the incidence of
EGFR amplification in a large cohort of GEA patients across stages, and to evaluate for a direct
correlation of gene copy number with protein expression levels. We then prospectively screened
140 stage IV GEA clinic patients (in any line of therapy) over 27 months at our center for EGFR
amplification and, when present and otherwise eligible, treated with EGFR monoclonal antibody
therapy under IRB approved protocols, when appropriate. We report their clinical responses and
disease control to EGFR blockade as well as characterization of pre- and post-treatment tumor
biopsies and serial circulating tumor DNA (ctDNA) next generation sequencing (NGS) in
attempt to explain clinical outcomes, mechanisms of resistance, and to evaluate the contribution
of NK-cell dependent ADCC to anti-tumoral effect.
Results
EGFR Gene Amplification and Protein Overexpression in GEA Cell Lines
EGFR/CEP7 FISH ratio and EGFR-SRM (selected reaction monitoring) mass
spectrometry expression were assessed, as previously described (52), in 24 GEA cancer lines,
lymphoblast and breast cancer negative controls, as well as two positive control head and neck
cancer cells lines (HN5, SQ20B) both known to harbor EGFR amplification. (Figure 1,
Supplemental Table S1). EGFR was only amplified (FISH ratio EGFR/CEP7 >2) in the two
head and neck cell lines (Figure 1A). EGFR-SRM ranged from <100 to 41383 amol/μg (median
575 amol/μg) (Figure 1C). EGFR/CEP7 ratio >2 and SRM values > 4000 amol/μg were
Research. on July 1, 2019. © 2018 American Association for Cancercancerdiscovery.aacrjournals.org Downloaded from
Author manuscripts have been peer reviewed and accepted for publication but have not yet been edited. Author Manuscript Published OnlineFirst on February 15, 2018; DOI: 10.1158/2159-8290.CD-17-1260
7
strongly correlated (Fisher exact test p=0.002) in the cell lines. No EGFR expression >4000
amol/μg was observed in cell lines in the absence of EGFR amplification by FISH
(Supplemental Table S1).
EGFR Amplification and Overexpression in GEA FFPE Tissues
Five hundred and two samples from 363 patients in the University of Chicago GEA
tumor bank underwent NGS by Foundation One (Cambridge, MA) and/or selected reaction
monitoring mass spectrometry (SRM) by Nantomics (Rockville, MD) and were included in the
overall cohort (Table 1A, Supplemental Table S2A). Among these cases, 18, 183, and 292
patients underwent EGFR FISH (Figure 1B), EGFR-SRM (Figure 1D), and NGS, respectively.
One hundred twelve patients had both SRM and NGS, and 11 patients underwent testing by all
three modalities. There was a statistically significant linear correlation between EGFR copy
number and EGFR expression by SRM (Pearson correlation = 0.87, p<2.2x10⁻¹⁶
), with a trend to
significance when evaluating binary ‘presence’ or ‘absence’ of amplification versus expression
(p=0.08). EGFR amplification was identified in 19/363 (5%) of overall patients across all disease
stages in both the retrospective and prospective cohorts (Table 1A), 10/144 (7%) of
retrospectively evaluated stage IV patients only (Table 1B), and 8/140 (6%) of prospectively
screened stage IV patients only (Table 1C). Only one EGFR amplified case was identified in the
absence of EGFR expression >1200amol/ug in FFPE samples (Supplemental Tables S2A-C).
All cases with EGFR expression >1200amol/ug were EGFR amplified.
Research. on July 1, 2019. © 2018 American Association for Cancercancerdiscovery.aacrjournals.org Downloaded from
Author manuscripts have been peer reviewed and accepted for publication but have not yet been edited. Author Manuscript Published OnlineFirst on February 15, 2018; DOI: 10.1158/2159-8290.CD-17-1260
8
Incidence of EGFR Amplification and Concurrent Genomic Aberrations in Metastatic GEA
To further define the 6-7% EGFR amplification incidence observed in our stage IV
cohorts as compared to the incidence noted from the TCGA (4%) comprising earlier stage
tumors, we queried the Foundation Medicine database for the incidence of EGFR amplification
amongst all unique GEA patients (N=4645) sequenced with the Foundation One test between
2012-2017. These samples were considered, for the most part, to be from advanced metastatic
GEA patients, however detailed staging information was unavailable. EGFR amplification was
identified in 5.6% of GEA patients, with a higher rate of 7.1% in proximal EGJ tumors as
compared to 3.7% in distal gastric tumors (Table 2A). The median EGFR gene copy number
was 40 copies with a range of 8-375 copies (Table 2A, Figure 1E). Forty-six percent of EGFR
amplified GEA samples (2.6% of all GEA samples) had >50 EGFR gene copies. Concurrent
genomic aberrations occurring in >5% of EGFR amplified samples in this dataset were mostly
short variant events in tumor suppressors including TP53, CDKN2A, ARID1A, SMAD4, and
CDH1, and amplifications of various oncogenes including MYC, ERBB2, KRAS, CCND1 and
others (Figure 1F).
EGFR Amplification is Associated with Lower PD-L1 Expression by
Immunohistochemistry
Given the growing interest and importance of programmed-death-1 (PD-1) and
programmed-death-1-ligand (PD-L1) checkpoint inhibition in GEA, we also assessed the
incidence of PD-L1 positivity by tumor positivity score (TPS), tumor infiltrating lymphocytes
(TILs) and combined positivity score (CPS) by EGFR amplification status (Table 2B, Figure
1G). Of the 632 GEA patients in the Foundation Medicine database for whom PD-L1 IHC was
Research. on July 1, 2019. © 2018 American Association for Cancercancerdiscovery.aacrjournals.org Downloaded from
Author manuscripts have been peer reviewed and accepted for publication but have not yet been edited. Author Manuscript Published OnlineFirst on February 15, 2018; DOI: 10.1158/2159-8290.CD-17-1260
9
performed (N=632), 26% of samples were CPS score positive (>1%) (see Materials and
Methods). EGFR amplified tumors had lower incidence of CPS positivity (17%) compared to
non-amplified tumors (27%), that was not statistically significant.
Clinicopathologic Characteristics of EGFR amplification
In the overall University of Chicago cohort (N=363), which comprised of 223
retrospectively accrued and 140 prospectively accrued patients, there was no statistically
significant difference in gender, race, age, stage, tumor grade, primary tumor location, or HER2
positivity between patients with EGFR amplification versus those without amplification (Table
1A). However, amongst the EGFR amplified patients, 63% had esophageal or junctional tumors
while 37% had distal gastric tumors, as compared to 53% and 47% in the non-amplified patients,
respectively. When evaluating only patients having stage IV and recurrent disease, no statistical
differences between gender, race, age, tumor grade, tumor location, or HER2 status were
identified in the retrospective (Table 1B) nor the prospective cohorts (Table 1C).
Anti-EGFR antibody therapy for EGFR amplified patients
Eight of the 140 screened patients (6%) during the prospective screening period (9/2014-
12/2016) demonstrated baseline tumor tissue EGFR amplification (defined as ≥8 copies by NGS)
ranging from 54 to 167 EGFR gene copies by NGS (Figure 2A). Evaluation of each patients’
samples for plasma EGFR ctDNA (Figure 2B), EGFR/CEP7 FISH (Figure 2C), along with
EGFR IHC and PD-L1 IHC (Figure 2D) was performed. Seven of these eight patients
ultimately underwent at least one dose of EGFR-directed therapy (Supplemental Table S3) –
three patients received first line FOLFOX plus ABT-806 (investigational EGFR monoclonal
Research. on July 1, 2019. © 2018 American Association for Cancercancerdiscovery.aacrjournals.org Downloaded from
Author manuscripts have been peer reviewed and accepted for publication but have not yet been edited. Author Manuscript Published OnlineFirst on February 15, 2018; DOI: 10.1158/2159-8290.CD-17-1260
10
antibody inhibitor as part of the PANGEA trial) (53), one received second line with FOLFIRI
plus cetuximab, two received third line cetuximab monotherapy, and one received fourth line
cetuximab monotherapy (for patient details, see Supplemental Data File S1). The eighth
patient, who had concurrent MET and HER2 amplification, was not eligible for EGFR-directed
therapy due to poor clinical condition after failure of first line FOLFOX therapy and enrollment
in hospice.
Objective best response, the primary endpoint, was observed in 57% (4/7) of patients,
including complete responses in 43% (3/7), partial response in 14% (1/7), and disease control in
the remaining 43% (3/7) (Figure 3A,B). Complete responses included one patient (pt 3)
receiving third line cetuximab monotherapy who had a durable response of 14 months with
resolution of his symptomatic (cough) pulmonary metastases (Figure 3C). Median progression-
free survival was 10 months (range 0.5+ to 14) (Figure 3B). Among the 7 patients treated, all
four radiographic responses were seen in patients with baseline plasma-detected EGFR
amplification over the 50th
percentile (2.4 copies in plasma), and the degree of plasma copy
number amplification correlated with objective RECIST response, with the mean ctDNA copy
number being 2.5 in non-responders and 33.9 in responders, and mean difference 31.4 copies
between responders and non-responders (p=0.049, 95% CI 0.25-62.5) (Figure 3A). Notably
however, patients 5 and 7, both having EGFR amplification observed only in their primary
tumors and not metastases, had clinically significant improvements in their dysphagia/dyspepsia
only once ABT-806 was added to their chemotherapy (Supplemental Data File 1,
Supplemental Figure S1).
All 4 patients receiving cetuximab developed a stereotypical acneiform rash (which
interestingly continued during treatment benefit, yet resolved by the time of disease progression),
Research. on July 1, 2019. © 2018 American Association for Cancercancerdiscovery.aacrjournals.org Downloaded from
Author manuscripts have been peer reviewed and accepted for publication but have not yet been edited. Author Manuscript Published OnlineFirst on February 15, 2018; DOI: 10.1158/2159-8290.CD-17-1260
11
whereas the 3 patients receiving ABT-806 did not; this was consistent with low rash frequency in
phase I evaluation of ABT-806 (54). There were no new safety signals with the addition of
EGFR monoclonal antibody therapy as monotherapy or in combination with chemotherapy.
Mechanisms of resistance to EGFR blockade
Underlying baseline and acquired mechanisms of resistance to therapy were evaluated
using baseline and serial tumor tissue NGS in parallel with baseline and serial plasma ctDNA
NGS in all treated patients, with confirmation by IHC/FISH, when applicable (Table 3, Figure
4A). Likely mechanisms of resistance existing prior to treatment initiation were identified in 7/8
patients, and included intra- and/or inter-tumoral EGFR amplification heterogeneity in 5/7
patients (n= 5, pts 1, 2, 5, 7 and 8), as observed by areas with and without EGFR amplification
within the primary tumor itself, and/or across different tumor sites anatomically. Additional
baseline mechanisms of resistance included co-amplification of HER2 (n=3, pts 2,4,8), NRAS
(n=1, pt 4), KRAS (n=1, pt 6), MYC (n=4, pts 1,2,4,6) or CCNE1 (n=2, pts 4,6), as well as
mutation in KRAS (n=1, pt 5) or mutation of another stimulatory G-protein alpha subunit, GNAS
(n=1, pt 6) (Table 3, Figure 4A).
There were two observed groups of patients upon disease progression - those with
retained and those without retained tissue EGFR amplification/overexpression (Figure 4B-E).
Serial ctDNA demonstrated a steep decline in EGFR copy number with EGFR-directed therapy
in all evaluable patients including monotherapy anti-EGFR antibody, but eventual recovery and
increase was seen in some patients (pts 1 and 3) upon disease progression and development of
resistance mechanisms, which correlated with rise in serum CA19-9 (Figure 4B, Supplemental
Figure S2 A,C). In a patient with retained EGFR amplification in tissue, acquired PTEN deletion
Research. on July 1, 2019. © 2018 American Association for Cancercancerdiscovery.aacrjournals.org Downloaded from
Author manuscripts have been peer reviewed and accepted for publication but have not yet been edited. Author Manuscript Published OnlineFirst on February 15, 2018; DOI: 10.1158/2159-8290.CD-17-1260
12
contributed to resistance, along with de novo PIK3CA mutation identified in ctDNA (pt 1). In
contrast, loss of EGFR amplification/expression (likely a selection of pre-existing but not
previously identified EGFR non-amplified clones) was seen in 3 cases (pts 2,3,5), as well as pt 1
in a separate large region of the primary tumor, while pt 7 never harbored systemic EGFR
amplification in his metastatic biopsy nor ctDNA. Patient 3 demonstrated persistent EGFR
amplification by ctDNA, but his post-treatment biopsies (new lung, residual primary tumor) were
not EGFR amplified and he developed BRAF, MET, and MYC co-amplification in ctDNA
(Figure 4C). He also developed new brain metastases after disease progression that were not
biopsied.
Immune IHC evaluation pre- and post-anti-EGFR therapy
Pre-treatment tissue IHC revealed weak tumoral and stromal CD3 staining in all patients
with available tissue (Figure 4F, Supplemental Table S4). Both tumoral and/or stromal CD3
baseline staining persisted in all five available pre/post therapy biopsy pairs (pts 1-5). Four of
the five post-treatment biopsies were performed on treatment while clinically stable, and one at
the time of clinical progression.
At baseline, six of seven patients also had NK cells present in the stroma, but only one
had baseline tumoral NKp46 cell staining (patient 2). CD3 stromal staining in patient 1 increased
from 2+ to 4+ with concomitant increased NKp46 and PD-L1 staining in a biopsy taken during
therapeutic response (obtained prior to receiving anti-PD-L1 and anti-CTLA4 combination
therapy previously, because a post-IO and pre-anti-EGFR biopsy could not be obtained).
(Supplementary Table S4). Increased intra-tumoral CD3 staining was also observed in patient
2. Conversely, patient 2 demonstrated decreased NKp46 stromal cell staining and no tumoral
Research. on July 1, 2019. © 2018 American Association for Cancercancerdiscovery.aacrjournals.org Downloaded from
Author manuscripts have been peer reviewed and accepted for publication but have not yet been edited. Author Manuscript Published OnlineFirst on February 15, 2018; DOI: 10.1158/2159-8290.CD-17-1260
13
staining in a biopsy obtained after disease progression on anti-EGFR ABT-806 plus FOLFOX
therapy.
Of the 4 biopsies performed on treatment during disease stability, only 2 had persistent
EGFR expression and EGFR amplification. Both of these persistent EGFR amplified tumors (pts
1,4) also expressed PD-L1, whereas patients now lacking EGFR amplification (pt 3) or post-
progression and no longer EGFR amplified (pt 5), did not demonstrate PD-L1 expression. Patient
2 also exhibited PD-L1 expression, but only in the moderately differentiated HER2+ region of
his primary tumor both pre- and post-treatment, yet again not in the poorly differentiated residual
HER2-/EGFR- non-amplified component post-treatment, where EGFR amplified clones were no
longer detected. A biopsy of progressing peritoneal carcinomatosis, which was EGFR non-
amplified, harbored stromal CD3+ staining, but absent PD-L1 and NKp46 expression
(Supplementary Table S4).
These observations suggest that while deriving clinical benefit from therapy, anti-EGFR ADCC
may have elicited a reflexive upregulation of PD-L1 expression in tumor cells, a so-called
interferon alpha/gamma T cell-induced immune response (55), yet over time as tumor response
occurred (ie EGFR amplified clones eradicated in patients 2, 3, 5 at post-treatment biopsies) the
immune response appeared to have dissipated, and therefore PD-L1 expression subsequently
downregulated.
Discussion
Herein we quantified the incidence of EGFR amplification and consequent significant
EGFR overexpression in 24 GEA cell lines and 502 samples from 363 GEA patients within the
University of Chicago Gastrointestinal Tumor Bank, as well as from a large commercial NGS
Research. on July 1, 2019. © 2018 American Association for Cancercancerdiscovery.aacrjournals.org Downloaded from
Author manuscripts have been peer reviewed and accepted for publication but have not yet been edited. Author Manuscript Published OnlineFirst on February 15, 2018; DOI: 10.1158/2159-8290.CD-17-1260
14
database of 4645 GEA patients. We observed no statistically significant differences in
clinicopathologic characteristics in patients with EGFR amplification versus those without
amplification, other than a higher proportion in proximal EGJ tumors compared to distal gastric
tumors, consistent with the known higher incidence of chromosomal instable (CIN) tumors
proximally in the TCGA cohort. We then prospectively screened patients for EGFR
amplification and treated them with EGFR-targeting agents when possible. As expected, in this
relatively large cohort of 140 stage IV patients screened, only 6% of patients were found to be
EGFR amplified, slightly higher than the TCGA 4% incidence. Notwithstanding, a demonstrable
and robust treatment response and disease control to EGFR antagonists was observed in this
select population. Notably, with monotherapy in heavily pretreated patients, two significant
responses (one of which was a complete response) were observed, and a third patient had disease
control. Moreover, using tumor NGS in parallel with ctDNA NGS allowed identification and
understanding of multiple likely baseline and acquired resistance mechanisms, often
concurrently within the same patient across and within tumor sites.
None of the 24 available GEA cell lines demonstrated EGFR amplification or extremely
high expression by mass spectrometry, as compared to the EGFR amplified head and neck cell
line controls. An effort to establish more EGFR amplified cell lines and xenografts is needed in
order to enhance understanding of this molecular subset of the disease. Notably, none of the
patients identified for treatment in this report had peritoneal ascites or pleural effusions – both
recognized metastatic sites that are easily accessible and conducive for establishing tumor cell
lines (56). Finally, we demonstrated that tissue EGFR amplification correlated well with protein
expression by immunohistochemistry and mass spectrometry in cell lines and tissues analyzed
from the same time point and anatomical location, with the caveat of stromal cellular and
Research. on July 1, 2019. © 2018 American Association for Cancercancerdiscovery.aacrjournals.org Downloaded from
Author manuscripts have been peer reviewed and accepted for publication but have not yet been edited. Author Manuscript Published OnlineFirst on February 15, 2018; DOI: 10.1158/2159-8290.CD-17-1260
15
tumoral molecular heterogeneity affecting this relationship, as previously described with MET
and HER2 (57-59).
Amongst University of Chicago tissue samples analyzed, EGFR amplification incidence
ranged from 5-7% across all stages and cohorts, which is consistent with previous reports
(28,46,60). Regarding incidence of EGFR amplification specifically in metastatic patients, this
was similar in the retrospective and prospective stage IV patients (6%) suggesting a reflective
prospective cohort. In the overall population, EGFR amplification trended to be more commonly
observed in stage IV patients compared to non-amplified patients (79% vs 50% p=0.11, Table
1A). As such, EGFR amplification incidence was slightly higher in our study than the 4% seen in
the TCGA GEA cohort, which was based entirely upon early stage resected specimens. This
disparity may also reflect the difference in incidence between esophageal/esophagogastric
junction and gastric primary tumor location, as 14% of TCGA esophageal adenocarcinoma cases
were EGFR amplified (28). Accordingly, our study was comprised with a majority of proximal
tumors (54%) and EGFR amplification incidence was consistent with the TRANS-COG analysis
comprised exclusively of esophageal cancers (46). Our findings are also consistent with previous
work demonstrating that CIN GEAs, which are more likely to harbor amplifications, tend to have
proximal locations (27,28). The higher incidence in EGJ versus distal gastric adenocarcinoma
and the generally higher incidence compared to TCGA was corroborated in the larger
Foundation Medicine database of 4645 GEA samples undergoing Foundation One testing (Table
2A). All other pertinent positive/negative clinicopathological findings (age, grade, HER2 status,
gender, site, and race) were similar regardless of EGFR status.
Despite amplification of EGFR being found in only ~5-7% of GEAs, with the high global
incidence of distal gastric cancer alone, this may represent nearly fifty thousand patients
Research. on July 1, 2019. © 2018 American Association for Cancercancerdiscovery.aacrjournals.org Downloaded from
Author manuscripts have been peer reviewed and accepted for publication but have not yet been edited. Author Manuscript Published OnlineFirst on February 15, 2018; DOI: 10.1158/2159-8290.CD-17-1260
16
diagnosed each year with EGFR amplified GEA. ALK-positive non-small cell lung cancer
represents a similar paradigm with a 3-5% ALK-translocation frequency that has led to the
approval of crizotinib, ceritinib, alectinib, and brigatinib (61-64). In this report, from 140 patients
prospectively screened at one treatment center, we identified and treated seven patients with
GEA with extreme amplification of EGFR (54-167 gene copies) in tissue biopsies. By chance,
we did not encounter any patients with EGFR amplification with tissue gene copies between 8-
53, but these patients are not uncommon as demonstrated in the Foundation Medicine GEA
cohort (Figure 1E). As such, clinical benefit, or differential clinical benefit, in this “lower level
tissue copy number subset” cannot be determined from our study. However we did observe that
higher plasma ctDNA copy number did correlate with response within our treated cohort.
We demonstrated clinical benefit with anti-EGFR targeted therapy in clinical scenarios
that historically have poor response rates to conventional therapies. In particular, three patients
were treated with third/fourth line monotherapy after exhausting all standard therapies. The
observed best objective response rate by RECIST was 4 of 7 (57%) patients across multiple lines
of therapy, including a complete and durable response lasting 14 months with monotherapy in
the third line setting (pt 3). We noted a median progression-free survival of 10 months overall
(nearly double the mPFS of standard first line chemotherapy). In comparison, the first line ToGA
trial combined trastuzumab with chemotherapy in treatment naïve HER2 positive patients and
achieved a 6.7 month mPFS, and the second line RAINBOW study of ramicirumab plus
paclitaxel achieved a 4.4 month mPFS (3). In our treated cohort, tumor reduction with clinical
benefit was observed in all cases, and the best disease control rate was 100%. Furthermore, as
highlighted in the patient therapy summaries (Supplemental Data File 1), subjective quality of
Research. on July 1, 2019. © 2018 American Association for Cancercancerdiscovery.aacrjournals.org Downloaded from
Author manuscripts have been peer reviewed and accepted for publication but have not yet been edited. Author Manuscript Published OnlineFirst on February 15, 2018; DOI: 10.1158/2159-8290.CD-17-1260
17
life improvements were seen – even in those with the shortest duration of benefit and those with
‘primary-tumor-only’ EGFR amplification.
Baseline and serial ctDNA along with DNA from primary, metastatic, and serial tumor
biopsies highlighted significant tumor heterogeneity and widespread potential of therapeutic
resistance mechanisms in these patients. Resistance mechanisms included regions of tumors at
baseline not harboring EGFR amplification, and regions without EGFR amplification at the time
of clinical progression. Resistance mechanisms also included concomitant amplifications and
mutations in genes putatively involved in circumventing EGFR signaling in the setting of anti-
EGFR therapy (65-70), which we also observed in the larger Foundation Medicine GEA cohort
(Figure 1F). Patient 2 was observed to harbor both EGFR and ERBB2 amplification with high
expression of both, each within two independent regions (50:50 ratio) of his primary tumor,
whereas the retroperitoneal lymph node and bone marrow biopsies, as well as ctDNA, at initial
diagnosis harbored EGFR amplification and lacked ERBB2 amplification. For this patient, from a
standard-of-care perspective, chemotherapy combined with trastuzumab would be indicated (3),
but this would not likely have addressed his primarily HER2-negative metastatic burden. In this
patient 2, clinical resistance and progression of peritoneal carcinomatosis after 10 months of anti-
EGFR based therapy corresponded with the rise of a ctDNA KRAS amplified clone and KRAS
amplification confirmed in the progressing peritoneal biopsy; the primary tumor at this time
point was no longer EGFR amplified, nor KRAS amplified, but remained HER2 amplified in
~75% of the biopsy (Figure 4D, Supplemental Figure S2B). Pt 1, who had both baseline EGFR
amplified and non-amplified regions of tumor, derived benefit from treatment with FOLFIRI and
cetuximab, which together effectively controlled all disease including the EGFR amplified clone
for a period of time. However, as demonstrated on repeat biopsy, this therapy eventually selected
Research. on July 1, 2019. © 2018 American Association for Cancercancerdiscovery.aacrjournals.org Downloaded from
Author manuscripts have been peer reviewed and accepted for publication but have not yet been edited. Author Manuscript Published OnlineFirst on February 15, 2018; DOI: 10.1158/2159-8290.CD-17-1260
18
for an EGFR amplified clone with concurrent downstream PTEN exon 6 deletion, along with
persistence of the previously identified EGFR non-amplified region (Supplemental Figure
S2A), as well as a de novo PIK3CA mutation in the ctDNA. Cetuximab-resistance via loss of
PTEN has been previously demonstrated in colorectal cancer (71). Of note, this deletion was not
detected by ctDNA, but rather by endoscopic biopsy and tumor NGS, and this highlights a
potential challenge of detecting larger segment deletions in ctDNA. Pt 3 initially had
homogenously EGFR amplified disease, but after 14 months developed a combination of EGFR
non-amplified regions along with presumably EGFR amplified and concurrent BRAF, MET and
MYC amplified clones that circumvented EGFR inhibition (Figure 4C, Supplemental Figure
S2C). His persistent EGFR amplification by ctDNA despite absence of amplification identified
within post-progression biopsies (of both the residual primary tumor and new lung metastasis)
suggests additional non-biopsied sites harboring EGFR amplification, potentially within new
brain metastases which were not biopsied. Similarly, selective pressure with cetuximab led to
expansion of pre-existing HER2, NRAS, and MYC amplified subclones and emergence of de
novo GNAS mutation in pt 4, which all likely conferred therapeutic resistance in various sites
within the patient (Figure 4E, Supplemental Figure S2D). Pt 5 had baseline MET co-
amplification as well as KRAS mutation in different anatomical locations. In this patient,
significant clinical benefit of anti-EGFR therapy was reported despite lack of RECIST response,
with improved local esophagogastric symptoms of pain/dyspepsia, which was potentially
explained by the EGFR amplification identified only in the primary tumor. Notably this patient’s
post-treatment residual primary tumor biopsy no longer identified an EGFR amplified region.
Again, as in pt 1 above, this heterogeneity highlights the benefit of concurrent combination
chemotherapy in suppressing other pre-existing or acquired resistant clones that would otherwise
Research. on July 1, 2019. © 2018 American Association for Cancercancerdiscovery.aacrjournals.org Downloaded from
Author manuscripts have been peer reviewed and accepted for publication but have not yet been edited. Author Manuscript Published OnlineFirst on February 15, 2018; DOI: 10.1158/2159-8290.CD-17-1260
19
progress at an accelerated rate if treated with anti-EGFR monotherapy. Pt 6 was unable to obtain
drug after cycle 1 due to insurance denial, but presumably would have a more limited benefit in
the face of pre-existing KRAS/MYC/CCNE1 amplifications and GNAS mutation in the ctDNA at
baseline. Her best response was short-lived stable disease after one dose of cetuximab, yet
somewhat impressively after disease progression on first line FOLFOX and second line
paclitaxel/ramucirumab. Finally, pt 7 further highlights the intratumoral and intertumoral
heterogeneity of EGFR amplification as only a fraction of his primary tumor exhibited EGFR
amplification, but not in the liver metastasis nor ctDNA. The patient did however derive
significant benefit, similar to pt 5 above, as demonstrated with improved dysphagia only after
anti-EGFR therapy was added after 4 cycles of ineffective standard FOLFOX chemotherapy (see
Supplementary File S1). These seven cases highlight the utility of a composite of tumor and
ctDNA sequencing in tailoring therapy for patients with GEA and using anti-EGFR, cytotoxic
therapy, and other targeted and immuno-oncologic agents combined for optimal tumor control.
A limitation of this study in terms of defining benefit from anti-EGFR therapy is the
combination of anti-EGFR therapy with chemotherapy in 4 of the 7 patients. The individual
contribution of cetuximab/ABT-806 in combination with chemotherapy is therefore difficult to
discern in this small cohort. However, the median progression-free survival with FOLFIRI in
second line is only 4-5 months (72). Also, clinical benefit in patient 7 was not experienced with
four cycles of FOLFOX, and only after addition of anti-EGFR ABT806 antibody at cycle 5
(when biologic grouping was determined on PANGEA study – see Supplemental Figure S1)
was dysphagia dramatically improved, which avoided further intervention including stent and or
palliative radiation. Data regarding the prognostic significance and natural progression of EGFR
amplification remain unknown, but EGFR amplification and EGFR over-expression has been
Research. on July 1, 2019. © 2018 American Association for Cancercancerdiscovery.aacrjournals.org Downloaded from
Author manuscripts have been peer reviewed and accepted for publication but have not yet been edited. Author Manuscript Published OnlineFirst on February 15, 2018; DOI: 10.1158/2159-8290.CD-17-1260
20
associated with shortened survival in some reports (73,74). Strikingly however, all three patients
who received late-line cetuximab monotherapy began their therapy approximately two years
after initial stage IV diagnosis – double the median overall survival in this cancer
(Supplementary Table S3). This may suggest that EGFR amplification portends a relatively
favorable prognosis, but further larger studies will need to sort this out. It should be noted that
patient 3 refused surgery while locally advanced, and therefore the duration of ‘first line’ therapy
in this case is distorted (he was stage IV to the lung by the time of initiating ‘third line’
monotherapy cetuximab). Despite this, these late-line patients 3, 4, and 6 all demonstrated
clinical benefit from cetuximab monotherapy, suggesting that this is indeed an actionable
alteration. Notably, each of these three patients had identified EGFR amplification in their
original stage IV diagnostic samples as well as their profiling just prior to anti-EGFR therapy in
later lines, suggesting stability (and dependence) over time of this aberration with standard
therapies. In contrast and interestingly, most patients treated in early lines in combination with
chemotherapy in our cohort had evidence of loss of the aberration in all or at least some of their
tissue/plasma samples and/or acquisition of likely concurrent resistance mechanisms (e.g. PTEN
deletion) after experiencing disease progression on anti-EGFR therapy. This again confirms the
specific targeting of anti-EGFR therapy towards EGFR amplified clones, with consequent EGFR
amplified clonal eradication and/or pressure to select for concurrent circumventing alterations.
Previous phase II and III trials (including COG with gefitinib and EXPAND using
cetuximab) demonstrated an overall survival benefit in the small subset of patients with EGFR
amplified (TRANS-COG) or over-expressed (EXPAND) GEA. This was despite an
unimpressive response rate (15,46), particularly in the TRANS-COG analysis. Of 13 patients in
TRANS-COG with EGFR amplification who received gefitinib, none had objective response.
Research. on July 1, 2019. © 2018 American Association for Cancercancerdiscovery.aacrjournals.org Downloaded from
Author manuscripts have been peer reviewed and accepted for publication but have not yet been edited. Author Manuscript Published OnlineFirst on February 15, 2018; DOI: 10.1158/2159-8290.CD-17-1260
21
Our results from 7 EGFR amplified patients treated with anti-EGFR monoclonal antibodies
suggest a similar benefit with four patients having durable progression-free survival of over 6
months, but also a high response rate, even in those treated with monotherapy (2/3, 66%), with
minimal adverse drug reactions. The difference in response rates between TKI and antibodies is
intriguing, and could be explained by ADCC and/or receptor internalization/downregulation,
which is not seen with TKIs. Antibody therapy was intentionally chosen for treatment in our
study due to potential for ADCC via NK cells seen with cetuximab and other IgG1 monoclonal
antibodies, such as ABT-806, as well as less toxicity in combination with chemotherapy relative
to TKIs. On the other hand, panitumumab, an IgG2 antibody, may act via myeloid cell lineage
ADCC (75,76), and differences/similarities between these two IgG classes with respect to ADCC
is not well delineated, certainly so for EGFR amplified GEA.
Regardless, in head and neck cancer, cetuximab stimulates NK cell recruitment and
interferon γ (IFNγ) secretion, which mediates dendritic cell maturation and cross presentation to
cytotoxic T lymphocytes against EGFR (77). IFNγ and its associated genes are currently under
evaluation as a predictive biomarker of response to PD-1 and PD-L1 antagonists due to their
association with a T cell-inflamed tumor environment (78-82). Interestingly, from a large
Foundation Medicine cohort of GEA samples undergoing PD-L1 IHC testing, we observed a
slightly lower rate of positivity by TPS, TILs, and CPS scoring in EGFR amplified tumors as
compared to non-amplified tumors (Table 2B, Figure 1G). A limitation of this analysis is the
use of the Ventana SP142 PD-L1 antibody as opposed to the 22C3 pharmDx companion
antibody, which was recently approved for pembrolizumab in PD-L1 expressing patients. SP142
has lower sensitivity and therefore possibly underestimates PD-L1 expression (83-85).
Regardless, relatively lower frequency of PD-L1 expression by EGFR amplified tumors
Research. on July 1, 2019. © 2018 American Association for Cancercancerdiscovery.aacrjournals.org Downloaded from
Author manuscripts have been peer reviewed and accepted for publication but have not yet been edited. Author Manuscript Published OnlineFirst on February 15, 2018; DOI: 10.1158/2159-8290.CD-17-1260
22
compared to non-amplified tumors as we observed in the large Foundation Medicine cohort, if
confirmed, may correspond to lower responses to anti-PD-1/anti-PD-L1 checkpoint inhibitor
monotherapy in EGFR-amplified patients. This requires further investigation.
To evaluate the effect of anti-EGFR antibodies on the tumor immune environment,
including evidence of ADCC, we evaluated pre- and post-treatment tumor biopsies for EGFR,
NKp46, CD8 and PD-L1 expression when possible. In this study, results from “during therapy”
biopsies imply that treatment with EGFR-directed monoclonal antibodies led to increased
tumoral infiltration by CD3+ T cells and NKp46+ NK cells as well as increased PD-L1
expression, which suggested that consequent ADCC may create, or ‘trigger’, a reflexive
immunosuppressed tumor environment. On-treatment PD-L1 expression appeared more common
in cases with persistent EGFR amplification, which also supports this proposed mechanism.
Furthermore, pt 1 had previously received, though not responded to, CTLA-4 and PD-L1
combination inhibition, and so we cannot detail if his increased post-therapy CD3/PD-L1
staining represents a delayed effect from prior immunotherapy alone, anti-EGFR ADCC alone,
sequential immunotherapy and targeted monoclonal antibodies, or spatial heterogeneity.
Therefore, although suggestive, these results are limited due to the low sample size and
temporospatial biopsy variability. These hypothesis-generating findings merit further prospective
investigation to tease out the individual contributions of canonical EGFR ligand binding
inhibition and receptor internalization/degradation versus ADCC/immune phenomena. Should
further studies confirm an upregulation of PD-L1 in anti-EGFR antibody treated EGFR amplified
tumors, combination with PD-1 checkpoint blockade would be an appealing combination
strategy.
Research. on July 1, 2019. © 2018 American Association for Cancercancerdiscovery.aacrjournals.org Downloaded from
Author manuscripts have been peer reviewed and accepted for publication but have not yet been edited. Author Manuscript Published OnlineFirst on February 15, 2018; DOI: 10.1158/2159-8290.CD-17-1260
23
In summary, we report EGFR amplification with overexpression in 5% (19/363) of a
large GEA patient cohort. Prospectively, 6% (8/140) of stage IV advanced patients
demonstrated EGFR amplification, of which seven patients were successfully treated with at
least one dose of anti-EGFR monoclonal antibody therapy. A 57% objective response rate and
100% disease control rate was observed. Within our cohort, elevated plasma-based ctDNA NGS
copy number estimation correlated with objective response by RECIST criteria. This is
consistent with a similar-sized prospective study of HER2 amplification in plasma associated
with an 80% response rate to targeted therapy in GEA (86,87). It is likely that response to anti-
EGFR therapy will be optimized for depth and duration with the following contributing factors
(quite analogous to anti-HER2 for HER2 amplification and likely also to anti-MET for MET
amplification and anti-FGFR2 for FGFR2 amplification): i) homogeneity of EGFR gene
amplification within and across all sites of a patient’s tumor burden versus heterogeneous
‘EGFR-negative’ sites, ii) higher EGFR gene copy number versus lower, iii) concurrent
chemotherapy for synergy on EGFR amplified clones as well as simultaneous suppression of
EGFR-negative clones versus anti-EGFR monotherapy, iv) lack of baseline genomic resistance
mechanisms versus ‘molecular chaos’, v) ADCC mechanism of monoclonal antibodies as
compared to TKI lacking this mechanism of action, with the patient's general immune status
playing an important role, and vi) addition of concurrent PD-1/PD-L1 checkpoint blockade to
increase immune response. This has been conceptualized in a ‘genogram’, or ‘EGFR
ampligram’, akin to the recently suggested ‘immunogram’ (55) to serve as a framework to
predict clinical benefit from anti-EGFR therapy in EGFR amplified tumors (Figure 4G,
Supplementary Figure S3). The degree to which each of these variables contributes to predicted
response and response duration will require further investigation. Further assessment of anti-
Research. on July 1, 2019. © 2018 American Association for Cancercancerdiscovery.aacrjournals.org Downloaded from
Author manuscripts have been peer reviewed and accepted for publication but have not yet been edited. Author Manuscript Published OnlineFirst on February 15, 2018; DOI: 10.1158/2159-8290.CD-17-1260
24
EGFR treatment for EGFR amplification is warranted. Given the relatively low frequency of
EGFR amplification, not to mention the issues with intra-patient heterogeneity, evaluation in a
traditional phase III study has been elusive and remains difficult, as demonstrated in all phase III
EGFR-directed GEA trials to date having only small subsets to evaluate this event, without
definitive practice changing results. Novel trial designs, such as PANGEA, a type II expansion
platform design trial in GEA, tests a treatment strategy of cytotoxic therapy plus matched
targeted therapies across a number of biologic subgroups, including EGFR amplification. This
design may optimally identify and treat these low incidence aberrations as well as addressing the
various mechanisms of resistance at baseline and progression over time (53,59,88,89).
Materials and Methods
GEA Clinical Samples and Cell Lines
Retrospective and prospective GEA patient samples, with linked clinical and pathological
correlates, were obtained from the University of Chicago (Chicago, IL) under institutional
review board approved tissue banking protocols. This work was conducted in full concordance
with the principles of the Declaration of Helsinki. All patients provided written informed
consent, where applicable. The human GEA lines and lymphoblast/breast cancer negative
controls were obtained and cultured as previously described (57,90). The genetic identity of
parental cell lines was authenticated by short tandem repeat profiling (Cell ID System; Promega)
at 10 different loci not fewer than 2 months before profiling and experiments. Cell lines tested
negative for Mycoplasma contamination with the VenorGeM Classic Kit (Minerva Biolabs).
These included AGS, CAT-2, CAT-3, CAT-4, CAT11B, CAT12, CAT13, CAT14A, CAT15pl,
CP-A, CP-B, CP-C, CP-D, GM14667, HGC-27, Hs746T, KATO III, MKN-1, MKN-45, NCI-
N87, OE19, OE33, SNU-1, SNU-16, SNU-5, ZR-75-30 obtained between 2008-2012. The head
Research. on July 1, 2019. © 2018 American Association for Cancercancerdiscovery.aacrjournals.org Downloaded from
Author manuscripts have been peer reviewed and accepted for publication but have not yet been edited. Author Manuscript Published OnlineFirst on February 15, 2018; DOI: 10.1158/2159-8290.CD-17-1260
25
and neck cancer lines (HN5, SQ20B) were graciously provided by Dr. Ezra Cohen (UCSD) in
2012. CAT lines were established between 2009-2016 from malignant ascites or pleural effusion
aspirates from patients at the University of Chicago under pre-approved guidelines and IRB
protocols.
EGFR Fluorescence in situ hybridization (FISH)
FISH results for cell lines and retrospective samples included mean EGFR and CEP7
copies/nucleus and EGFR/CEP7 ratio as previously described (90-92), and prospectively
screened patients using Clarient Diagnostics Services Inc (Aliso Veijo, CA). FISH amplification
was defined as EGFR/CEP7 ratio >2 in all settings.
Sample Preparation and EGFR-SRM Assay
Laser microdissection isolated tumor cells were obtained from FFPE tumor sections as
previously described (52,57,58,92,93). Total protein content for lysates was measured using
Micro-BCA assay (Thermo Fisher Scientific Inc, Rockford, IL). EGFR-SRM assay followed
previously described methods and quantified expression in attomols/microgram (amol/ug) (93).
EGFR copy number by Tissue Next-Generation Sequencing (NGS)
All NGS results were obtained through routine clinical testing using Foundation One
(Cambridge, MA) (94); EGFR amplification was defined as EGFR copy >8. Equivocal
amplification as noted in the clinical report (copy number 6-7) was considered EGFR non-
amplified in this study.
Research. on July 1, 2019. © 2018 American Association for Cancercancerdiscovery.aacrjournals.org Downloaded from
Author manuscripts have been peer reviewed and accepted for publication but have not yet been edited. Author Manuscript Published OnlineFirst on February 15, 2018; DOI: 10.1158/2159-8290.CD-17-1260
26
PD-L1 Immunohistochemistry (IHC) from Foundation Medicine Cohort
GEA samples having PD-L1 testing through Foundation Medicine were identified for analysis
(N=632). PD-L1 testing was performed using the Ventana antibody (SP142) as previously
described (95), and was scored three ways: % tumor positivity score (TPS), % tumor infiltrating
lymphocytes (TILs), and combination of these two for a combined positivity score (CPS) given
recent approval for third line therapy with pembrolizumab for PD-L1 positive GEA tumors as
defined by CPS score >1% (83-85).
Quantitative Analysis and Validation of EGFR in Clinical GEA Tissues and Cell lines
EGFR-SRM for 225 retrospective GEA FFPE samples and 28 cell lines was performed by
Nantomics (Rockville, MD) and expression was calculated from the ratio of area under the curve
(AUC) for the endogenous and isotopically-labeled standard peptide multiplied by the known
amount of isotopically-labeled standard peptide spiked into the sample before analysis, as
previously described (93).
Identification and treatment of EGFR amplified GEA patients with anti-EGFR therapy
Patients at the University of Chicago with metastatic GEA (any line of therapy) were
prospectively screened for EGFR amplification between September 2014 to December 2016 with
NGS using the Foundation One test (Foundation Medicine, Cambridge, MA). When remaining
tissue was available, EGFR amplification identified by NGS was confirmed by FISH (Clarient
Diagnostics Services Inc, Aliso Veijo, CA), and EGFR overexpression was confirmed with
Research. on July 1, 2019. © 2018 American Association for Cancercancerdiscovery.aacrjournals.org Downloaded from
Author manuscripts have been peer reviewed and accepted for publication but have not yet been edited. Author Manuscript Published OnlineFirst on February 15, 2018; DOI: 10.1158/2159-8290.CD-17-1260
27
immunohistochemistry (IHC; Invitrogen, Clone 31G7, Ventana Ultra View Detection Kit,
Ventana XT), and EGFR-SRM through Nantomics (Rockville, MD) (93). All assays used were
CLIA certified.
Treatment Assignment:
Newly diagnosed metastatic, or recurrent after previous curative intent surgery, first line patients
were treated on the PANGEA protocol, (NCT02213289) (53) with anti-EGFR antibody ABT-
806, in combination with FOLFOX per protocol (Supplementary Figure S1). Otherwise,
patients were treated with off-label cetuximab 500mg q2 weeks IV (96), in combination with
FOLFIRI in the second line, or as monotherapy in the 3rd
and 4th
line settings.
Clinical Outcome Assessment:
The primary objective of this study was clinical response as assessed by CT using RECIST 1.1
(97). Measurements were performed independently by clinical interpreting radiologists.
Secondary endpoints included progression-free survival (PFS), and toxicity.
Circulating cell-free DNA NGS:
Circulating free DNA (cfDNA) sequencing was obtained at baseline prior to anti-EGFR therapy
and serially monitored by Guardant 360 (Redwood City, CA) in order to correlate cfDNA levels
and genomic findings with initial response outcomes and for potential mechanisms of resistance
over time (98-100). Absolute plasma copy number was determined utilizing the mode of the
normalized number of cell-free DNA fragments covering each gene to estimate the fragment
Research. on July 1, 2019. © 2018 American Association for Cancercancerdiscovery.aacrjournals.org Downloaded from
Author manuscripts have been peer reviewed and accepted for publication but have not yet been edited. Author Manuscript Published OnlineFirst on February 15, 2018; DOI: 10.1158/2159-8290.CD-17-1260
28
number corresponding to two copies to derive a baseline diploid value. All values of unique
fragments for each gene were then normalized by this baseline value. The baseline derivation
was informed by molecule counts data from a large set of normal samples from healthy
donors’ plasma. Note that the plasma copy number was related to two variables - the copy
number in the tissue, and the amount of shedding of tumor DNA into the blood where the tumor
DNA - and thus the copy number, was expected to be diluted by abundant leukocyte-derived
EGFR fragments, the latter having a copy number of 2.0. Centiles of EGFR copy number
reported in the clinical G360 results were denoted by a ‘+’ for absolute plasma copy number
greater than 2.14 (<50th
percentile), ‘++’ for copy number greater than 2.4 but less than 4 (<90th
percentile), or ‘+++’ for copy number greater than 4 (≥90th
percentile). In this study we reported
absolute plasma copy number, not these percentiles.
Antibody Dependent Cell-Mediated Cytotoxicity (ADCC):
The contribution of ADCC was assessed in the prospectively identified anti-EGFR treated EGFR
amplified cohort by IHC using pre- and post-treatment immunohistochemistry for CD3 (Agilent
A0452, Santa Clara, CA), NKp46 (R&D Systems, Clone 195314, Minneapolis, MN) and PD-L1
(Abcam ab205921, Cambridge, MA) in order to evaluate for treatment-related tumor-stroma
modulation.
Statistical Analysis
Comparisons between EGFR amplified and non-amplified cases were performed using chi-
square testing or a two-sided Fisher’s exact test. The relationship between EGFR amplification
Research. on July 1, 2019. © 2018 American Association for Cancercancerdiscovery.aacrjournals.org Downloaded from
Author manuscripts have been peer reviewed and accepted for publication but have not yet been edited. Author Manuscript Published OnlineFirst on February 15, 2018; DOI: 10.1158/2159-8290.CD-17-1260
29
and expression by SRM or RECIST response was evaluated using the Student’s t-test and by
linear regression. Progression-free survival was estimated by the Kaplan-Meier method.
Acknowledgements:
The authors would like to acknowledge Kyle Holen, Brian Panzl, James Ward, Vincent Blot,
Earl Bain from Abbvie Pharmaceuticals. This work was supported by the NIH (K23 CA178203
and P30 CA014599), UCCCC (University of Chicago Comprehensive Cancer Center) Award in
Precision Oncology, LLK (Live Like Katie) Foundation Award, Castle Foundation Award, and
the Sal Ferrara II Fund for PANGEA (to D.V.T.C).
References and Notes:
1. Sehdev A, Catenacci DV. Gastroesophageal cancer: focus on epidemiology, classification, and staging.
Discov Med 2013;16:103-11.
2. Al-Batran S-E, Homann N, Schmalenberg H, Kopp H-G, Haag GM, Luley KB, et al. Perioperative
chemotherapy with docetaxel, oxaliplatin, and fluorouracil/leucovorin (FLOT) versus epirubicin, cisplatin,
and fluorouracil or capecitabine (ECF/ECX) for resectable gastric or gastroesophageal junction (GEJ)
adenocarcinoma (FLOT4-AIO): A multicenter, randomized phase 3 trial. J Clin Oncol. American Society
of Clinical Oncology; 2017; 35: 4004.
3. Bang YJ, Van Cutsem E, Feyereislova A, Chung HC, Shen L, Sawaki A, et al. Trastuzumab in
combination with chemotherapy versus chemotherapy alone for treatment of HER2-positive advanced
gastric or gastro-oesophageal junction cancer (ToGA): a phase 3, open-label, randomised controlled trial.
Lancet 2010;376:687-97.
4. Fuchs CS, Tomasek J, Yong CJ, Dumitru F, Passalacqua R, Goswami C, et al. Ramucirumab monotherapy
for previously treated advanced gastric or gastro-oesophageal junction adenocarcinoma (REGARD): an
international, randomised, multicentre, placebo-controlled, phase 3 trial. Lancet 2014;383:31-9.
5. Wilke H, Muro K, Van Cutsem E, Oh SC, Bodoky G, Shimada Y, et al. Ramucirumab plus paclitaxel
versus placebo plus paclitaxel in patients with previously treated advanced gastric or gastro-oesophageal
junction adenocarcinoma (RAINBOW): a double-blind, randomised phase 3 trial. Lancet Oncol
2014;15:1224-35.
6. Lordick F, Kang YK, Chung HC, Salman P, Oh SC, Bodoky G, et al. Capecitabine and cisplatin with or
without cetuximab for patients with previously untreated advanced gastric cancer (EXPAND): a
randomised, open-label phase 3 trial. Lancet Oncol 2013;14:490-9.
7. Waddell T, Chau I, Cunningham D, Gonzalez D, Okines AF, Okines C, et al. Epirubicin, oxaliplatin, and
capecitabine with or without panitumumab for patients with previously untreated advanced
oesophagogastric cancer (REAL3): a randomised, open-label phase 3 trial. Lancet Oncol 2013;14:481-9.
8. Dutton SJ, Ferry DR, Blazeby JM, Abbas H, Dahle-Smith A, Mansoor W, et al. Gefitinib for oesophageal
cancer progressing after chemotherapy (COG): a phase 3, multicentre, double-blind, placebo-controlled
randomised trial. Lancet Oncol 2014;15:894-904.
9. Catenacci DVT, Tebbutt NC, Davidenko I, Murad AM, Al-Batran SE, Ilson DH, et al. Rilotumumab plus
epirubicin, cisplatin, and capecitabine as first-line therapy in advanced MET-positive gastric or gastro-
oesophageal junction cancer (RILOMET-1): a randomised, double-blind, placebo-controlled, phase 3 trial.
Lancet Oncol 2017
Research. on July 1, 2019. © 2018 American Association for Cancercancerdiscovery.aacrjournals.org Downloaded from
Author manuscripts have been peer reviewed and accepted for publication but have not yet been edited. Author Manuscript Published OnlineFirst on February 15, 2018; DOI: 10.1158/2159-8290.CD-17-1260
30
10. Shah MA, Bang YJ, Lordick F, Alsina M, Chen M, Hack SP, et al. Effect of Fluorouracil, Leucovorin, and
Oxaliplatin With or Without Onartuzumab in HER2-Negative, MET-Positive Gastroesophageal
Adenocarcinoma: The METGastric Randomized Clinical Trial. JAMA Oncol 2016
11. Ohtsu A, Ajani JA, Bai YX, Bang YJ, Chung HC, Pan HM, et al. Everolimus for previously treated
advanced gastric cancer: results of the randomized, double-blind, phase III GRANITE-1 study. J Clin
Oncol 2013;31:3935-43.
12. Cohen DJ, Christos PJ, Kindler HL, Catenacci DVT, Bekaii-Saab TB, Tahiri S, et al. Vismodegib (V), a
hedgehog (HH) pathway inhibitor, combined with FOLFOX for first-line therapy of patients (pts) with
advanced gastric and gastroesophageal junction (GEJ) carcinoma: A New York Cancer Consortium led
phase II randomized study. J Clin Oncol. American Society of Clinical Oncology; 2013; 31: 4011.
13. Maron SB, Catenacci DV. Novel Targeted Therapies for Esophagogastric Cancer. Surg Oncol Clin N Am
2017;26:293-312.
14. Kim C, Lee JL, Ryu MH, Chang HM, Kim TW, Lim HY, et al. A prospective phase II study of cetuximab
in combination with XELOX (capecitabine and oxaliplatin) in patients with metastatic and/or recurrent
advanced gastric cancer. Invest New Drugs 2011;29:366-73.
15. Lordick F, Luber B, Lorenzen S, Hegewisch-Becker S, Folprecht G, Woll E, et al. Cetuximab plus
oxaliplatin/leucovorin/5-fluorouracil in first-line metastatic gastric cancer: a phase II study of the
Arbeitsgemeinschaft Internistische Onkologie (AIO). Br J Cancer 2010;102:500-5.
16. Pinto C, Di Fabio F, Barone C, Siena S, Falcone A, Cascinu S, et al. Phase II study of cetuximab in
combination with cisplatin and docetaxel in patients with untreated advanced gastric or gastro-oesophageal
junction adenocarcinoma (DOCETUX study). Br J Cancer 2009;101:1261-8.
17. Pinto C, Di Fabio F, Siena S, Cascinu S, Rojas Llimpe FL, Ceccarelli C, et al. Phase II study of cetuximab
in combination with FOLFIRI in patients with untreated advanced gastric or gastroesophageal junction
adenocarcinoma (FOLCETUX study). Ann Oncol 2007;18:510-7.
18. Woell E, Greil R, Eisterer W, Fridrik M, Grunberger B, Gattringer K, et al. Oxaliplatin, irinotecan and
cetuximab in advanced gastric cancer: First results of a multicenter phase II trial (AGMT Gastric-2). J Clin
Oncol. American Society of Clinical Oncology; 2008; 26: 15587.
19. Yeh K, Hsu C, Hsu C, Lin C, Shen Y, Wu S, et al. Phase II study of cetuximab plus weekly cisplatin and
24-hour infusion of high-dose 5-fluorouracil and leucovorin for the first-line treatment of advanced gastric
cancer. J Clin Oncol. American Society of Clinical Oncology; 2009; 27: 4567.
20. Enzinger PC, Burtness BA, Niedzwiecki D, Ye X, Douglas K, Ilson DH, et al. CALGB 80403
(Alliance)/E1206: A Randomized Phase II Study of Three Chemotherapy Regimens Plus Cetuximab in
Metastatic Esophageal and Gastroesophageal Junction Cancers. J Clin Oncol 2016;34:2736-42.
21. Dragovich T, McCoy S, Fenoglio-Preiser CM, Wang J, Benedetti JK, Baker AF, et al. Phase II trial of
erlotinib in gastroesophageal junction and gastric adenocarcinomas: SWOG 0127. J Clin Oncol
2006;24:4922-7.
22. Wainberg ZA, Lin LS, DiCarlo B, Dao KM, Patel R, Park DJ, et al. Phase II trial of modified FOLFOX6
and erlotinib in patients with metastatic or advanced adenocarcinoma of the oesophagus and gastro-
oesophageal junction. Br J Cancer 2011;105:760-5.
23. Tomblyn MB, Goldman BH, Thomas CR, Jr., Benedetti JK, Lenz HJ, Mehta V, et al. Cetuximab plus
cisplatin, irinotecan, and thoracic radiotherapy as definitive treatment for locally advanced, unresectable
esophageal cancer: a phase-II study of the SWOG (S0414). J Thorac Oncol 2012;7:906-12.
24. Chan JA, Blaszkowsky LS, Enzinger PC, Ryan DP, Abrams TA, Zhu AX, et al. A multicenter phase II trial
of single-agent cetuximab in advanced esophageal and gastric adenocarcinoma. Ann Oncol 2011;22:1367-
73.
25. Adelstein DJ, Rodriguez CP, Rybicki LA, Ives DI, Rice TW. A phase II trial of gefitinib for recurrent or
metastatic cancer of the esophagus or gastroesophageal junction. Invest New Drugs 2012;30:1684-9.
26. Gold PJ, Goldman B, Iqbal S, Leichman LP, Zhang W, Lenz HJ, et al. Cetuximab as second-line therapy in
patients with metastatic esophageal adenocarcinoma: a phase II Southwest Oncology Group Study (S0415).
J Thorac Oncol 2010;5:1472-6.
27. Cancer Genome Atlas Research N. Comprehensive molecular characterization of gastric adenocarcinoma.
Nature 2014;513:202-9.
28. Cancer Genome Atlas Research N, Analysis Working Group: Asan U, Agency BCC, Brigham, Women's H,
Broad I, et al. Integrated genomic characterization of oesophageal carcinoma. Nature 2017;541:169-75.
29. Beroukhim R, Mermel CH, Porter D, Wei G, Raychaudhuri S, Donovan J, et al. The landscape of somatic
copy-number alteration across human cancers. Nature 2010;463:899-905.
Research. on July 1, 2019. © 2018 American Association for Cancercancerdiscovery.aacrjournals.org Downloaded from
Author manuscripts have been peer reviewed and accepted for publication but have not yet been edited. Author Manuscript Published OnlineFirst on February 15, 2018; DOI: 10.1158/2159-8290.CD-17-1260
31
30. Murugaesu N, Wilson GA, Birkbak NJ, Watkins TB, McGranahan N, Kumar S, et al. Tracking the
genomic evolution of esophageal adenocarcinoma through neoadjuvant chemotherapy. Cancer Discov
2015;5:821-31.
31. Dulak AM, Stojanov P, Peng S, Lawrence MS, Fox C, Stewart C, et al. Exome and whole-genome
sequencing of esophageal adenocarcinoma identifies recurrent driver events and mutational complexity.
Nat Genet 2013;45:478-86.
32. Nones K, Waddell N, Wayte N, Patch AM, Bailey P, Newell F, et al. Genomic catastrophes frequently
arise in esophageal adenocarcinoma and drive tumorigenesis. Nat Commun 2014;5:5224.
33. Ross-Innes CS, Becq J, Warren A, Cheetham RK, Northen H, O'Donovan M, et al. Whole-genome
sequencing provides new insights into the clonal architecture of Barrett's esophagus and esophageal
adenocarcinoma. Nat Genet 2015;47:1038-46.
34. Stachler MD, Taylor-Weiner A, Peng S, McKenna A, Agoston AT, Odze RD, et al. Paired exome analysis
of Barrett's esophagus and adenocarcinoma. Nat Genet 2015;47:1047-55.
35. Dahle-Smith A, Stevenson D, Massie D, Murray GI, Dutton SJ, Roberts C, et al. Epidermal Growth Factor
(EGFR) copy number aberrations in esophageal and gastro-esophageal junctional carcinoma. Mol
Cytogenet 2015;8:78.
36. Ali SM, Sanford EM, Klempner SJ, Rubinson DA, Wang K, Palma NA, et al. Prospective comprehensive
genomic profiling of advanced gastric carcinoma cases reveals frequent clinically relevant genomic
alterations and new routes for targeted therapies. Oncologist 2015;20:499-507.
37. Zhou J, Wu Z, Wong G, Pectasides E, Nagaraja A, Stachler M, et al. CDK4/6 or MAPK blockade enhances
efficacy of EGFR inhibition in oesophageal squamous cell carcinoma. Nat Commun 2017;8:13897.
38. Lynch TJ, Bell DW, Sordella R, Gurubhagavatula S, Okimoto RA, Brannigan BW, et al. Activating
mutations in the epidermal growth factor receptor underlying responsiveness of non-small-cell lung cancer
to gefitinib. N Engl J Med 2004;350:2129-39.
39. Paez JG, Janne PA, Lee JC, Tracy S, Greulich H, Gabriel S, et al. EGFR mutations in lung cancer:
correlation with clinical response to gefitinib therapy. Science 2004;304:1497-500.
40. Herbst RS, Redman MW, Kim ES, Semrad TJ, Bazhenova L, Masters G, et al. Cetuximab plus carboplatin
and paclitaxel with or without bevacizumab versus carboplatin and paclitaxel with or without bevacizumab
in advanced NSCLC (SWOG S0819): a randomised, phase 3 study. Lancet Oncol 2017
41. Thatcher N, Hirsch FR, Luft AV, Szczesna A, Ciuleanu TE, Dediu M, et al. Necitumumab plus
gemcitabine and cisplatin versus gemcitabine and cisplatin alone as first-line therapy in patients with stage
IV squamous non-small-cell lung cancer (SQUIRE): an open-label, randomised, controlled phase 3 trial.
Lancet Oncol 2015;16:763-74.
42. Hirsch F, Boyle T, Thatcher N, Paz-Ares L, Varella-Garcia M, Kowalewski A, et al. EGFR IHC and FISH
Correlative Analyses (SQUIRE Trial): necitumumab plus gemcitabine-cisplatin vs gemcitabine-cisplatin in
1st-line squamous NSCLC. Journal of Thoracic Oncology 2015
43. Huang J, Fan Q, Lu P, Ying J, Ma C, Liu W, et al. Icotinib in Patients with Pretreated Advanced
Esophageal Squamous Cell Carcinoma with EGFR Overexpression or EGFR Gene Amplification: A
Single-Arm, Multicenter Phase 2 Study. J Thorac Oncol 2016;11:910-7.
44. Zhang L, Yang J, Cai J, Song X, Deng J, Huang X, et al. A subset of gastric cancers with EGFR
amplification and overexpression respond to cetuximab therapy. Sci Rep 2013;3:2992.
45. Luber B, Deplazes J, Keller G, Walch A, Rauser S, Eichmann M, et al. Biomarker analysis of cetuximab
plus oxaliplatin/leucovorin/5-fluorouracil in first-line metastatic gastric and oesophago-gastric junction
cancer: results from a phase II trial of the Arbeitsgemeinschaft Internistische Onkologie (AIO). BMC
Cancer 2011;11:509.
46. Petty RD, Dahle-Smith A, Stevenson DAJ, Osborne A, Massie D, Clark C, et al. Gefitinib and EGFR Gene
Copy Number Aberrations in Esophageal Cancer. J Clin Oncol 2017;35:2279-87.
47. Lordick F, Kang Y-K, Salman P, Oh SC, Bodoky G, Kurteva GP, et al. Clinical outcome according to
tumor HER2 status and EGFR expression in advanced gastric cancer patients from the EXPAND study. J
Clin Oncol. American Society of Clinical Oncology; 2013; 31: 4021.
48. Kurai J, Chikumi H, Hashimoto K, Yamaguchi K, Yamasaki A, Sako T, et al. Antibody-dependent cellular
cytotoxicity mediated by cetuximab against lung cancer cell lines. Clin Cancer Res 2007;13:1552-61.
49. Kimura H, Sakai K, Arao T, Shimoyama T, Tamura T, Nishio K. Antibody-dependent cellular cytotoxicity
of cetuximab against tumor cells with wild-type or mutant epidermal growth factor receptor. Cancer Sci
2007;98:1275-80.
Research. on July 1, 2019. © 2018 American Association for Cancercancerdiscovery.aacrjournals.org Downloaded from
Author manuscripts have been peer reviewed and accepted for publication but have not yet been edited. Author Manuscript Published OnlineFirst on February 15, 2018; DOI: 10.1158/2159-8290.CD-17-1260
32
50. Hatjiharissi E, Xu L, Santos DD, Hunter ZR, Ciccarelli BT, Verselis S, et al. Increased natural killer cell
expression of CD16, augmented binding and ADCC activity to rituximab among individuals expressing the
Fc{gamma}RIIIa-158 V/V and V/F polymorphism. Blood 2007;110:2561-4.
51. Arnould L, Gelly M, Penault-Llorca F, Benoit L, Bonnetain F, Migeon C, et al. Trastuzumab-based
treatment of HER2-positive breast cancer: an antibody-dependent cellular cytotoxicity mechanism? Br J
Cancer 2006;94:259-67.
52. Hembrough T, Thyparambil S, Liao WL, Darfler MM, Abdo J, Bengali KM, et al. Application of selected
reaction monitoring for multiplex quantification of clinically validated biomarkers in formalin-fixed,
paraffin-embedded tumor tissue. J Mol Diagn 2013;15:454-65.
53. Catenacci DV. Next-generation clinical trials: Novel strategies to address the challenge of tumor molecular
heterogeneity. Mol Oncol 2015;9:967-96.
54. Cleary JM, Reardon DA, Azad N, Gandhi L, Shapiro GI, Chaves J, et al. A phase 1 study of ABT-806 in
subjects with advanced solid tumors. Invest New Drugs 2015;33:671-8.
55. Blank CU, Haanen JB, Ribas A, Schumacher TN. CANCER IMMUNOLOGY. The "cancer immunogram".
Science 2016;352:658-60.
56. Shepherd TG, Theriault BL, Campbell EJ, Nachtigal MW. Primary culture of ovarian surface epithelial
cells and ascites-derived ovarian cancer cells from patients. Nat Protoc 2006;1:2643-9.
57. Catenacci DV, Liao WL, Thyparambil S, Henderson L, Xu P, Zhao L, et al. Absolute quantitation of Met
using mass spectrometry for clinical application: assay precision, stability, and correlation with MET gene
amplification in FFPE tumor tissue. PLoS One 2014;9:e100586.
58. Catenacci DV, Liao WL, Zhao L, Whitcomb E, Henderson L, O'Day E, et al. Mass-spectrometry-based
quantitation of Her2 in gastroesophageal tumor tissue: comparison to IHC and FISH. Gastric Cancer 2015
59. Pectasides E, Stachler MD, Derks S, Liu Y, Maron S, Islam M, et al. Genomic Heterogeneity as a Barrier
to Precision Medicine in Gastroesophageal Adenocarcinoma. Cancer Discov 2018;8:37-48.
60. Lennerz JK, Kwak EL, Ackerman A, Michael M, Fox SB, Bergethon K, et al. MET amplification identifies
a small and aggressive subgroup of esophagogastric adenocarcinoma with evidence of responsiveness to
crizotinib. J Clin Oncol 2011;29:4803-10.
61. Shaw AT, Ou SH, Bang YJ, Camidge DR, Solomon BJ, Salgia R, et al. Crizotinib in ROS1-rearranged
non-small-cell lung cancer. N Engl J Med 2014;371:1963-71.
62. Shaw AT, Engelman JA. Ceritinib in ALK-rearranged non-small-cell lung cancer. N Engl J Med
2014;370:2537-9.
63. Ou SH, Ahn JS, De Petris L, Govindan R, Yang JC, Hughes B, et al. Alectinib in Crizotinib-Refractory
ALK-Rearranged Non-Small-Cell Lung Cancer: A Phase II Global Study. J Clin Oncol 2016;34:661-8.
64. Kim DW, Tiseo M, Ahn MJ, Reckamp KL, Hansen KH, Kim SW, et al. Brigatinib in Patients With
Crizotinib-Refractory Anaplastic Lymphoma Kinase-Positive Non-Small-Cell Lung Cancer: A
Randomized, Multicenter Phase II Trial. J Clin Oncol 2017;35:2490-8.
65. Misale S, Yaeger R, Hobor S, Scala E, Janakiraman M, Liska D, et al. Emergence of KRAS mutations and
acquired resistance to anti-EGFR therapy in colorectal cancer. Nature 2012;486:532-6.
66. De Roock W, Claes B, Bernasconi D, De Schutter J, Biesmans B, Fountzilas G, et al. Effects of KRAS,
BRAF, NRAS, and PIK3CA mutations on the efficacy of cetuximab plus chemotherapy in chemotherapy-
refractory metastatic colorectal cancer: a retrospective consortium analysis. Lancet Oncol 2010;11:753-62.
67. Douillard JY, Oliner KS, Siena S, Tabernero J, Burkes R, Barugel M, et al. Panitumumab-FOLFOX4
treatment and RAS mutations in colorectal cancer. N Engl J Med 2013;369:1023-34.
68. Frattini M, Saletti P, Romagnani E, Martin V, Molinari F, Ghisletta M, et al. PTEN loss of expression
predicts cetuximab efficacy in metastatic colorectal cancer patients. Br J Cancer 2007;97:1139-45.
69. Sartore-Bianchi A, Martini M, Molinari F, Veronese S, Nichelatti M, Artale S, et al. PIK3CA mutations in
colorectal cancer are associated with clinical resistance to EGFR-targeted monoclonal antibodies. Cancer
Res 2009;69:1851-7.
70. Bardelli A, Corso S, Bertotti A, Hobor S, Valtorta E, Siravegna G, et al. Amplification of the MET receptor
drives resistance to anti-EGFR therapies in colorectal cancer. Cancer Discov 2013;3:658-73.
71. Loupakis F, Pollina L, Stasi I, Ruzzo A, Scartozzi M, Santini D, et al. PTEN expression and KRAS
mutations on primary tumors and metastases in the prediction of benefit from cetuximab plus irinotecan for
patients with metastatic colorectal cancer. J Clin Oncol 2009;27:2622-9.
72. Assersohn L, Brown G, Cunningham D, Ward C, Oates J, Waters JS, et al. Phase II study of irinotecan and
5-fluorouracil/leucovorin in patients with primary refractory or relapsed advanced oesophageal and gastric
carcinoma. Ann Oncol 2004;15:64-9.
Research. on July 1, 2019. © 2018 American Association for Cancercancerdiscovery.aacrjournals.org Downloaded from
Author manuscripts have been peer reviewed and accepted for publication but have not yet been edited. Author Manuscript Published OnlineFirst on February 15, 2018; DOI: 10.1158/2159-8290.CD-17-1260
33
73. Nagatsuma AK, Aizawa M, Kuwata T, Doi T, Ohtsu A, Fujii H, et al. Expression profiles of HER2, EGFR,
MET and FGFR2 in a large cohort of patients with gastric adenocarcinoma. Gastric Cancer 2015;18:227-
38.
74. Terashima M, Kitada K, Ochiai A, Ichikawa W, Kurahashi I, Sakuramoto S, et al. Impact of expression of
human epidermal growth factor receptors EGFR and ERBB2 on survival in stage II/III gastric cancer. Clin
Cancer Res 2012;18:5992-6000.
75. Mellor JD, Brown MP, Irving HR, Zalcberg JR, Dobrovic A. A critical review of the role of Fc gamma
receptor polymorphisms in the response to monoclonal antibodies in cancer. J Hematol Oncol 2013;6:1.
76. Schneider-Merck T, Lammerts van Bueren JJ, Berger S, Rossen K, van Berkel PH, Derer S, et al. Human
IgG2 antibodies against epidermal growth factor receptor effectively trigger antibody-dependent cellular
cytotoxicity but, in contrast to IgG1, only by cells of myeloid lineage. J Immunol 2010;184:512-20.
77. Srivastava RM, Lee SC, Andrade Filho PA, Lord CA, Jie HB, Davidson HC, et al. Cetuximab-activated
natural killer and dendritic cells collaborate to trigger tumor antigen-specific T-cell immunity in head and
neck cancer patients. Clin Cancer Res 2013;19:1858-72.
78. Muro K, Chung HC, Shankaran V, Geva R, Catenacci D, Gupta S, et al. Pembrolizumab for patients with
PD-L1-positive advanced gastric cancer (KEYNOTE-012): a multicentre, open-label, phase 1b trial. Lancet
Oncol 2016
79. Gajewski TF, Louahed J, Brichard VG. Gene signature in melanoma associated with clinical activity: a
potential clue to unlock cancer immunotherapy. Cancer J 2010;16:399-403.
80. Spranger S, Spaapen RM, Zha Y, Williams J, Meng Y, Ha TT, et al. Up-regulation of PD-L1, IDO, and
T(regs) in the melanoma tumor microenvironment is driven by CD8(+) T cells. Sci Transl Med
2013;5:200ra116.
81. Doi T, Piha-Paul SA, Jalal SI, Mai-Dang H, Saraf S, Koshiji M. Updated results for the advanced
esophageal carcinoma cohort of the phase Ib KEYNOTE-028 study of pembrolizumab (MK-3475). J Clin
Oncol 2016;34
82. Seiwert TY, Burtness B, Mehra R, Weiss J, Berger R, Eder JP, et al. Safety and clinical activity of
pembrolizumab for treatment of recurrent or metastatic squamous cell carcinoma of the head and neck
(KEYNOTE-012): an open-label, multicentre, phase 1b trial. Lancet Oncol 2016;17:956-65.
83. Fuchs CS D, T., Jang, R.W.J., Muro, K., Satoh, T., Machado, M., Sun, W., Jalal, S.I., Shah, M.A., Metges,
J.P. and Garrido, M. Pembrolizumab Monotherapy in Patients With Previously Treated Advanced Gastric
and Gastroesophageal Junction Cancer: Phase 2 KEYNOTE-059 Study JAMA Oncol 2018;in press
84. Joshi SS, Maron SB, Catenacci DV. Pembrolizumab for treatment of advanced gastric and
gastroesophageal junction adenocarcinoma. Future Oncol 2018;14:417-30.
85. Kang YK, Boku N, Satoh T, Ryu MH, Chao Y, Kato K, et al. Nivolumab in patients with advanced gastric
or gastro-oesophageal junction cancer refractory to, or intolerant of, at least two previous chemotherapy
regimens (ONO-4538-12, ATTRACTION-2): a randomised, double-blind, placebo-controlled, phase 3
trial. Lancet 2017;390:2461-71.
86. Kim ST, Banks KC, Lee S-H, Kim K, Park JO, Park SH, et al. Prospective Feasibility Study for Using
Cell-Free Circulating Tumor DNA–Guided Therapy in Refractory Metastatic Solid Cancers: An Interim
Analysis. JCO Precision Oncology 2017;1:1-15.
87. Liang DH, Ensor JE, Liu ZB, Patel A, Patel TA, Chang JC, et al. Cell-free DNA as a molecular tool for
monitoring disease progression and response to therapy in breast cancer patients. Breast Cancer Res Treat
2016;155:139-49.
88. Catenacci DV. Expansion platform type II: testing a treatment strategy. Lancet Oncol 2015;16:1276-8.
89. Joshi SS MS, Lomnicki S, Polite BN, Sharma M, Ibe J, Allen K, Racette C, Rampurwala MM, Amico AL,
Shergill A, Kozloff M., Phillips BE, Suh GK, Narula S, Rayani S, Kipping-Johnson K, Wojak E, Kindler
HL, Catenacci DVT. Personalized antibodies for gastroesophageal adenocarcinoma (PANGEA): A phase II
precision medicine trial (NCT02213289). J Clin. Oncol. American Society of Clinical Oncology; 2017; 36:
abstr TPS198.
90. Catenacci DV, Cervantes G, Yala S, Nelson EA, El-Hashani E, Kanteti R, et al. RON (MST1R) is a novel
prognostic marker and therapeutic target for gastroesophageal adenocarcinoma. Cancer Biol Ther
2011;12:9-46.
91. Catenacci DV, Henderson L, Xiao SY, Patel P, Yauch RL, Hegde P, et al. Durable complete response of
metastatic gastric cancer with anti-Met therapy followed by resistance at recurrence. Cancer Discov
2011;1:573-9.
Research. on July 1, 2019. © 2018 American Association for Cancercancerdiscovery.aacrjournals.org Downloaded from
Author manuscripts have been peer reviewed and accepted for publication but have not yet been edited. Author Manuscript Published OnlineFirst on February 15, 2018; DOI: 10.1158/2159-8290.CD-17-1260
34
92. Sellappan S, Blackler A, Liao WL, O'Day E, Xu P, Thyparambil S, et al. Therapeutically Induced Changes
in HER2, HER3, and EGFR Protein Expression for Treatment Guidance. J Natl Compr Canc Netw
2016;14:503-7.
93. Hembrough T, Thyparambil S, Liao WL, Darfler MM, Abdo J, Bengali KM, et al. Selected Reaction
Monitoring (SRM) Analysis of Epidermal Growth Factor Receptor (EGFR) in Formalin Fixed Tumor
Tissue. Clin Proteomics 2012;9:5.
94. Frampton GM, Fichtenholtz A, Otto GA, Wang K, Downing SR, He J, et al. Development and validation
of a clinical cancer genomic profiling test based on massively parallel DNA sequencing. Nat Biotechnol
2013;31:1023-31.
95. Rimm DL, Han G, Taube JM, Yi ES, Bridge JA, Flieder DB, et al. A Prospective, Multi-institutional,
Pathologist-Based Assessment of 4 Immunohistochemistry Assays for PD-L1 Expression in Non-Small
Cell Lung Cancer. JAMA Oncol 2017;3:1051-8.
96. Tabernero J, Pfeiffer P, Cervantes A. Administration of cetuximab every 2 weeks in the treatment of
metastatic colorectal cancer: an effective, more convenient alternative to weekly administration?
Oncologist 2008;13:113-9.
97. Eisenhauer EA, Therasse P, Bogaerts J, Schwartz LH, Sargent D, Ford R, et al. New response evaluation
criteria in solid tumours: revised RECIST guideline (version 1.1). Eur J Cancer 2009;45:228-47.
98. Zill O BK, Fairclough S, Mortimer S, Vowles J, Mokhtari R, Gandara DR, Mack PC, Odegaard J, Nagy R,
Baca A. The landscape of actionable genomic alterations in cell-free circulating tumor DNA from 21,807
advanced cancer patients. bioRxiv 2017:233205.
99. Maron SB JS, Lomnicki S, Oliwa T, Landron S, Johnson J, Kiedrowski LA, Nagy RJ, Lanman RB,
Janjigian YY, Kelly KJ, Kim ST, Lee J, Catenacci DVT. Circulating tumor DNA (ctDNA) landscape and
prognostic implications in gastroesophageal adenocarcinoma (GEA). J Clin. Oncol. American Society of
Clinical Oncology; 2018; 36: Abstract 45.
100. Catenacci DVT NR, Braiteh FS, Kim S, Kwak EL, Maron SB, Banks KC, Lanman RB, Talasaz A, Lee J.
Cell free circulating tumor DNA (ctDNA) landscape in patients with advanced gastroesophageal
adenocarcinoma (GEC). J Clin. Oncol. American Society of Clinical Oncology; 2017; 35: Abstract 47.
Research. on July 1, 2019. © 2018 American Association for Cancercancerdiscovery.aacrjournals.org Downloaded from
Author manuscripts have been peer reviewed and accepted for publication but have not yet been edited. Author Manuscript Published OnlineFirst on February 15, 2018; DOI: 10.1158/2159-8290.CD-17-1260
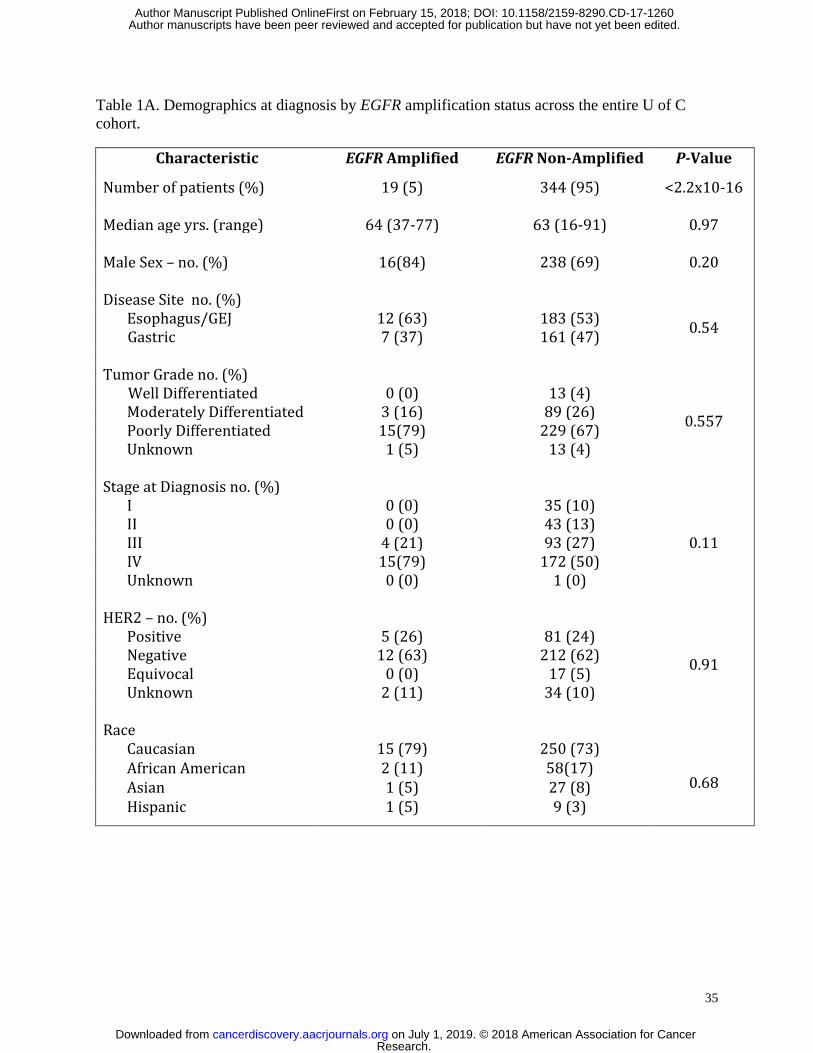
35
Table 1A. Demographics at diagnosis by EGFR amplification status across the entire U of C
cohort.
Characteristic EGFR Amplified EGFR Non-Amplified P-Value
Number of patients (%) 19 (5) 344 (95) <2.2x10⁻¹⁶ Median age yrs. (range) 64 (37-77) 63 (16-91) 0.97
Male Sex – no. (%) 16(84) 238 (69) 0.20
Disease Site no. (%)
Esophagus/GEJ 12 (63) 183 (53) 0.54
Gastric 7 (37) 161 (47) Tumor Grade no. (%)
Well Differentiated 0 (0) 13 (4)
0.557 Moderately Differentiated 3 (16) 89 (26) Poorly Differentiated 15(79) 229 (67) Unknown 1 (5) 13 (4)
Stage at Diagnosis no. (%) I 0 (0) 35 (10)
0.11 II 0 (0) 43 (13) III 4 (21) 93 (27) IV 15(79) 172 (50) Unknown 0 (0) 1 (0)
HER2 – no. (%) Positive 5 (26) 81 (24)
0.91 Negative 12 (63) 212 (62) Equivocal 0 (0) 17 (5) Unknown 2 (11) 34 (10)
Race
Caucasian 15 (79) 250 (73)
0.68 African American 2 (11) 58(17) Asian 1 (5) 27 (8) Hispanic 1 (5) 9 (3)
Research. on July 1, 2019. © 2018 American Association for Cancercancerdiscovery.aacrjournals.org Downloaded from
Author manuscripts have been peer reviewed and accepted for publication but have not yet been edited. Author Manuscript Published OnlineFirst on February 15, 2018; DOI: 10.1158/2159-8290.CD-17-1260
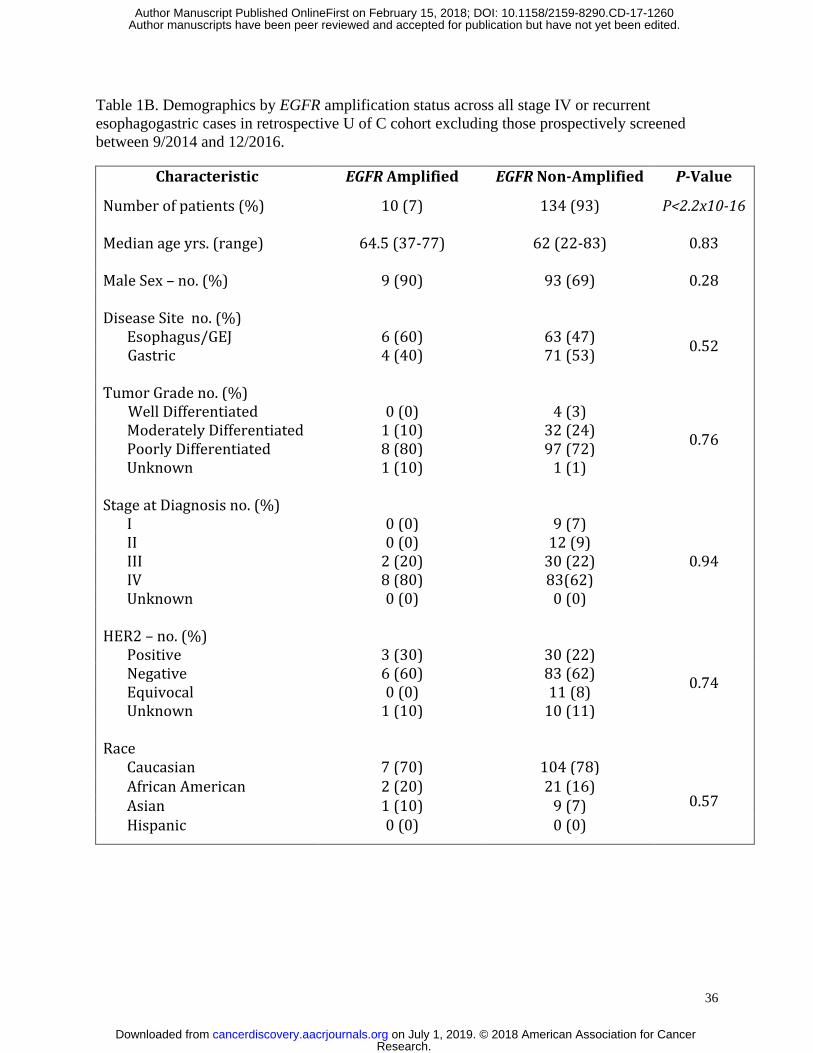
36
Table 1B. Demographics by EGFR amplification status across all stage IV or recurrent
esophagogastric cases in retrospective U of C cohort excluding those prospectively screened
between 9/2014 and 12/2016.
Characteristic EGFR Amplified EGFR Non-Amplified P-Value
Number of patients (%) 10 (7) 134 (93) P<2.2x10⁻¹⁶ Median age yrs. (range) 64.5 (37-77) 62 (22-83) 0.83
Male Sex – no. (%) 9 (90) 93 (69) 0.28
Disease Site no. (%)
Esophagus/GEJ 6 (60) 63 (47) 0.52
Gastric 4 (40) 71 (53) Tumor Grade no. (%)
Well Differentiated 0 (0) 4 (3)
0.76 Moderately Differentiated 1 (10) 32 (24) Poorly Differentiated 8 (80) 97 (72) Unknown 1 (10) 1 (1)
Stage at Diagnosis no. (%) I 0 (0) 9 (7)
0.94 II 0 (0) 12 (9) III 2 (20) 30 (22) IV 8 (80) 83(62) Unknown 0 (0) 0 (0)
HER2 – no. (%) Positive 3 (30) 30 (22)
0.74 Negative 6 (60) 83 (62) Equivocal 0 (0) 11 (8) Unknown 1 (10) 10 (11)
Race
Caucasian 7 (70) 104 (78)
0.57 African American 2 (20) 21 (16) Asian 1 (10) 9 (7) Hispanic 0 (0) 0 (0)
Research. on July 1, 2019. © 2018 American Association for Cancercancerdiscovery.aacrjournals.org Downloaded from
Author manuscripts have been peer reviewed and accepted for publication but have not yet been edited. Author Manuscript Published OnlineFirst on February 15, 2018; DOI: 10.1158/2159-8290.CD-17-1260
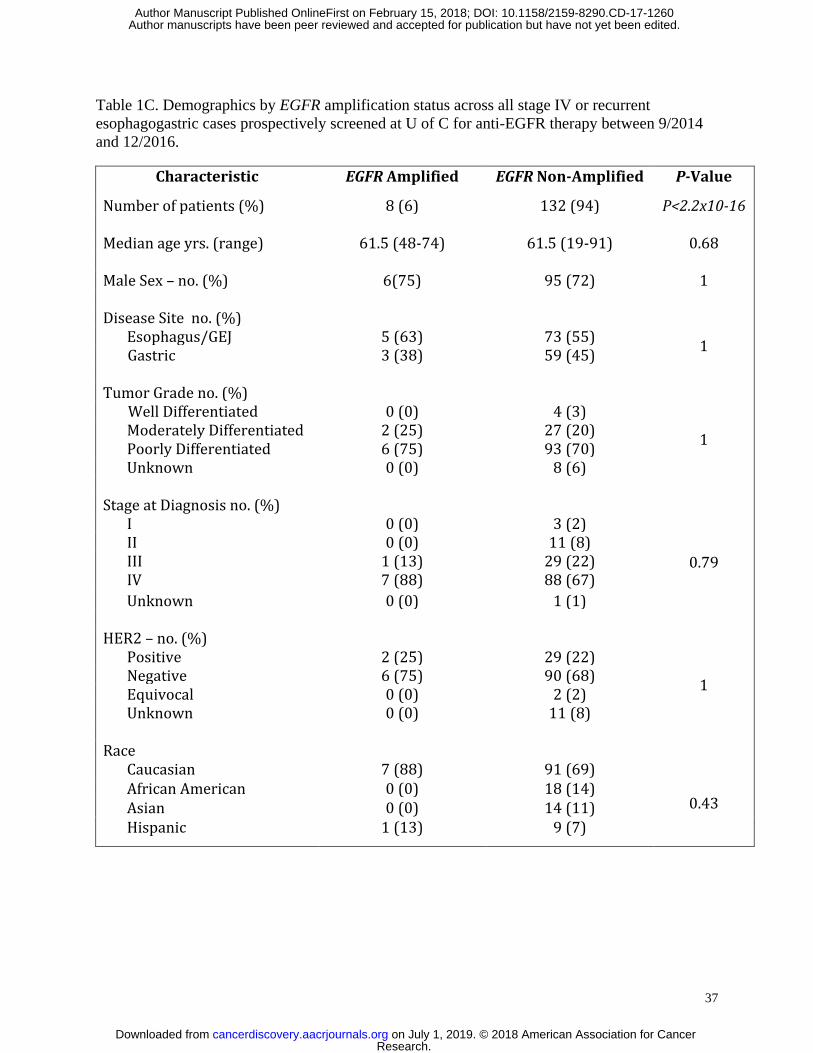
37
Table 1C. Demographics by EGFR amplification status across all stage IV or recurrent
esophagogastric cases prospectively screened at U of C for anti-EGFR therapy between 9/2014
and 12/2016.
Characteristic EGFR Amplified EGFR Non-Amplified P-Value
Number of patients (%) 8 (6) 132 (94) P<2.2x10⁻¹⁶ Median age yrs. (range) 61.5 (48-74) 61.5 (19-91) 0.68
Male Sex – no. (%) 6(75) 95 (72) 1
Disease Site no. (%)
Esophagus/GEJ 5 (63) 73 (55) 1
Gastric 3 (38) 59 (45) Tumor Grade no. (%)
Well Differentiated 0 (0) 4 (3)
1 Moderately Differentiated 2 (25) 27 (20) Poorly Differentiated 6 (75) 93 (70) Unknown 0 (0) 8 (6)
Stage at Diagnosis no. (%) I 0 (0) 3 (2)
0.79 II 0 (0) 11 (8) III 1 (13) 29 (22) IV 7 (88) 88 (67)
Unknown 0 (0) 1 (1)
HER2 – no. (%) Positive 2 (25) 29 (22)
1 Negative 6 (75) 90 (68) Equivocal 0 (0) 2 (2) Unknown 0 (0) 11 (8)
Race
Caucasian 7 (88) 91 (69)
0.43 African American 0 (0) 18 (14) Asian 0 (0) 14 (11) Hispanic 1 (13) 9 (7)
Research. on July 1, 2019. © 2018 American Association for Cancercancerdiscovery.aacrjournals.org Downloaded from
Author manuscripts have been peer reviewed and accepted for publication but have not yet been edited. Author Manuscript Published OnlineFirst on February 15, 2018; DOI: 10.1158/2159-8290.CD-17-1260
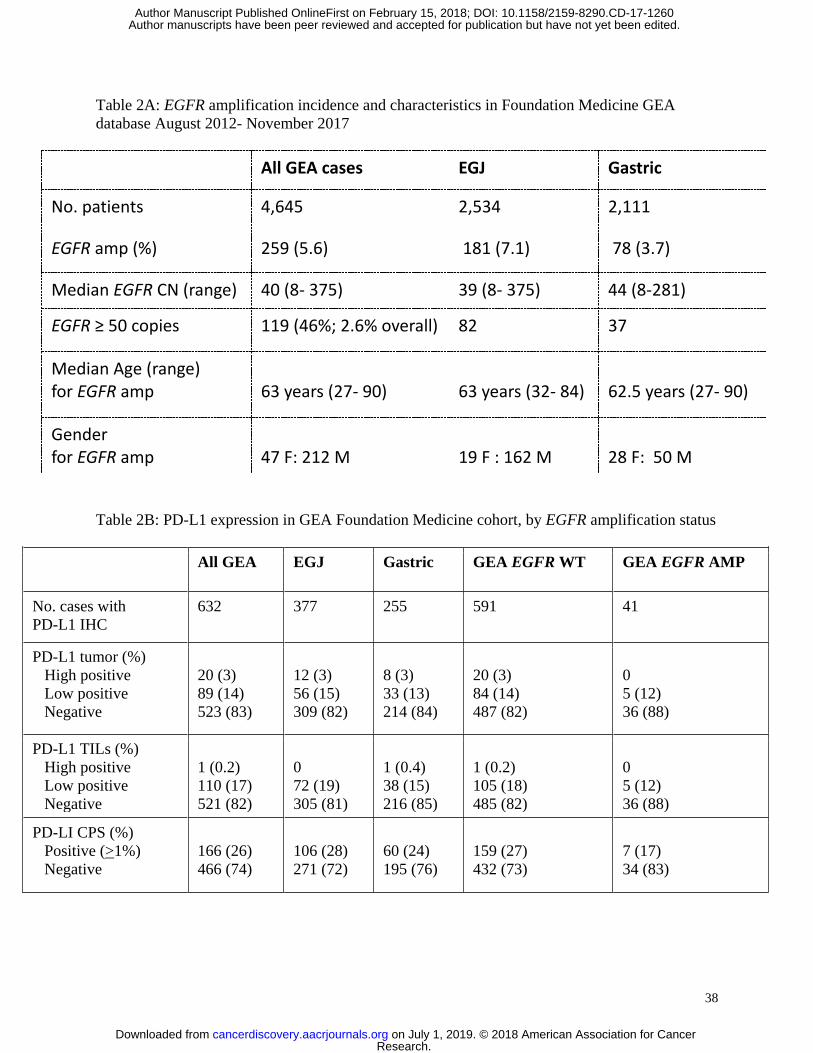
38
Table 2A: EGFR amplification incidence and characteristics in Foundation Medicine GEA
database August 2012- November 2017
All GEA cases EGJ Gastric
No. patients 4,645 2,534 2,111
EGFR amp (%) 259 (5.6) 181 (7.1) 78 (3.7)
Median EGFR CN (range) 40 (8- 375) 39 (8- 375) 44 (8-281)
EGFR ≥ 50 copies 119 (46%; 2.6% overall) 82 37
Median Age (range) for EGFR amp
63 years (27- 90)
63 years (32- 84)
62.5 years (27- 90)
Gender for EGFR amp
47 F: 212 M
19 F : 162 M
28 F: 50 M
Table 2B: PD-L1 expression in GEA Foundation Medicine cohort, by EGFR amplification status
All GEA EGJ Gastric GEA EGFR WT GEA EGFR AMP
No. cases with
PD-L1 IHC
632 377 255 591 41
PD-L1 tumor (%)
High positive
Low positive
Negative
20 (3)
89 (14)
523 (83)
12 (3)
56 (15)
309 (82)
8 (3)
33 (13)
214 (84)
20 (3)
84 (14)
487 (82)
0
5 (12)
36 (88)
PD-L1 TILs (%)
High positive
Low positive
Negative
1 (0.2)
110 (17)
521 (82)
0
72 (19)
305 (81)
1 (0.4)
38 (15)
216 (85)
1 (0.2)
105 (18)
485 (82)
0
5 (12)
36 (88)
PD-LI CPS (%)
Positive (>1%)
Negative
166 (26)
466 (74)
106 (28)
271 (72)
60 (24)
195 (76)
159 (27)
432 (73)
7 (17)
34 (83)
Research. on July 1, 2019. © 2018 American Association for Cancercancerdiscovery.aacrjournals.org Downloaded from
Author manuscripts have been peer reviewed and accepted for publication but have not yet been edited. Author Manuscript Published OnlineFirst on February 15, 2018; DOI: 10.1158/2159-8290.CD-17-1260
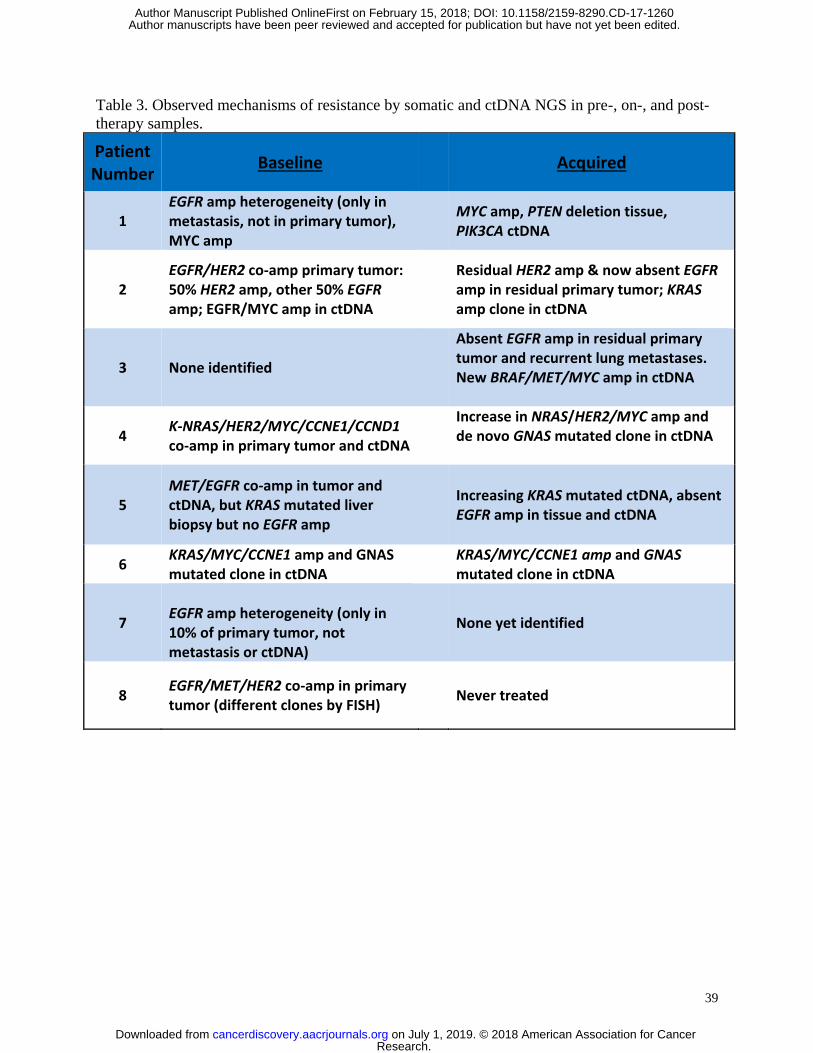
39
Table 3. Observed mechanisms of resistance by somatic and ctDNA NGS in pre-, on-, and post-
therapy samples.
Patient Number
Baseline Acquired
1 EGFR amp heterogeneity (only in metastasis, not in primary tumor), MYC amp
MYC amp, PTEN deletion tissue, PIK3CA ctDNA
2 EGFR/HER2 co-amp primary tumor: 50% HER2 amp, other 50% EGFR amp; EGFR/MYC amp in ctDNA
Residual HER2 amp & now absent EGFR amp in residual primary tumor; KRAS amp clone in ctDNA
3 None identified
Absent EGFR amp in residual primary tumor and recurrent lung metastases. New BRAF/MET/MYC amp in ctDNA
4 K-NRAS/HER2/MYC/CCNE1/CCND1 co-amp in primary tumor and ctDNA
Increase in NRAS/HER2/MYC amp and de novo GNAS mutated clone in ctDNA
5 MET/EGFR co-amp in tumor and ctDNA, but KRAS mutated liver biopsy but no EGFR amp
Increasing KRAS mutated ctDNA, absent EGFR amp in tissue and ctDNA
6 KRAS/MYC/CCNE1 amp and GNAS mutated clone in ctDNA
KRAS/MYC/CCNE1 amp and GNAS mutated clone in ctDNA
7
EGFR amp heterogeneity (only in 10% of primary tumor, not metastasis or ctDNA)
None yet identified
8 EGFR/MET/HER2 co-amp in primary tumor (different clones by FISH)
Never treated
Research. on July 1, 2019. © 2018 American Association for Cancercancerdiscovery.aacrjournals.org Downloaded from
Author manuscripts have been peer reviewed and accepted for publication but have not yet been edited. Author Manuscript Published OnlineFirst on February 15, 2018; DOI: 10.1158/2159-8290.CD-17-1260
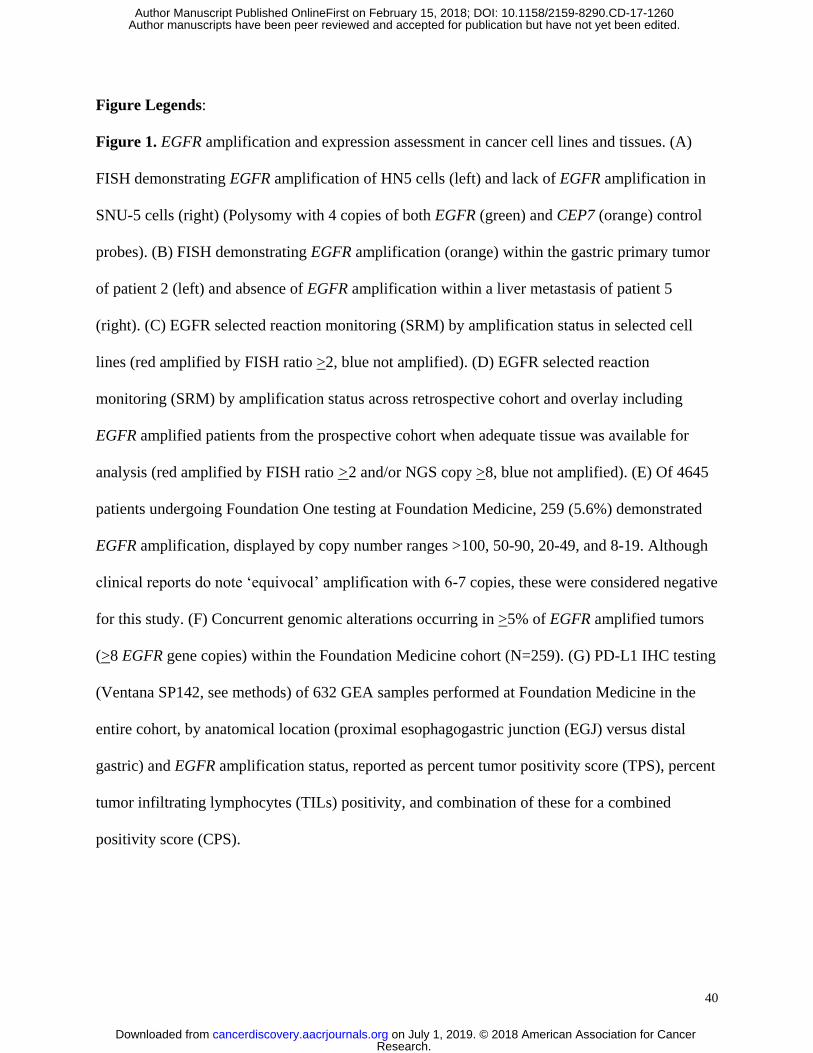
40
Figure Legends:
Figure 1. EGFR amplification and expression assessment in cancer cell lines and tissues. (A)
FISH demonstrating EGFR amplification of HN5 cells (left) and lack of EGFR amplification in
SNU-5 cells (right) (Polysomy with 4 copies of both EGFR (green) and CEP7 (orange) control
probes). (B) FISH demonstrating EGFR amplification (orange) within the gastric primary tumor
of patient 2 (left) and absence of EGFR amplification within a liver metastasis of patient 5
(right). (C) EGFR selected reaction monitoring (SRM) by amplification status in selected cell
lines (red amplified by FISH ratio >2, blue not amplified). (D) EGFR selected reaction
monitoring (SRM) by amplification status across retrospective cohort and overlay including
EGFR amplified patients from the prospective cohort when adequate tissue was available for
analysis (red amplified by FISH ratio >2 and/or NGS copy >8, blue not amplified). (E) Of 4645
patients undergoing Foundation One testing at Foundation Medicine, 259 (5.6%) demonstrated
EGFR amplification, displayed by copy number ranges >100, 50-90, 20-49, and 8-19. Although
clinical reports do note ‘equivocal’ amplification with 6-7 copies, these were considered negative
for this study. (F) Concurrent genomic alterations occurring in >5% of EGFR amplified tumors
(>8 EGFR gene copies) within the Foundation Medicine cohort (N=259). (G) PD-L1 IHC testing
(Ventana SP142, see methods) of 632 GEA samples performed at Foundation Medicine in the
entire cohort, by anatomical location (proximal esophagogastric junction (EGJ) versus distal
gastric) and EGFR amplification status, reported as percent tumor positivity score (TPS), percent
tumor infiltrating lymphocytes (TILs) positivity, and combination of these for a combined
positivity score (CPS).
Research. on July 1, 2019. © 2018 American Association for Cancercancerdiscovery.aacrjournals.org Downloaded from
Author manuscripts have been peer reviewed and accepted for publication but have not yet been edited. Author Manuscript Published OnlineFirst on February 15, 2018; DOI: 10.1158/2159-8290.CD-17-1260
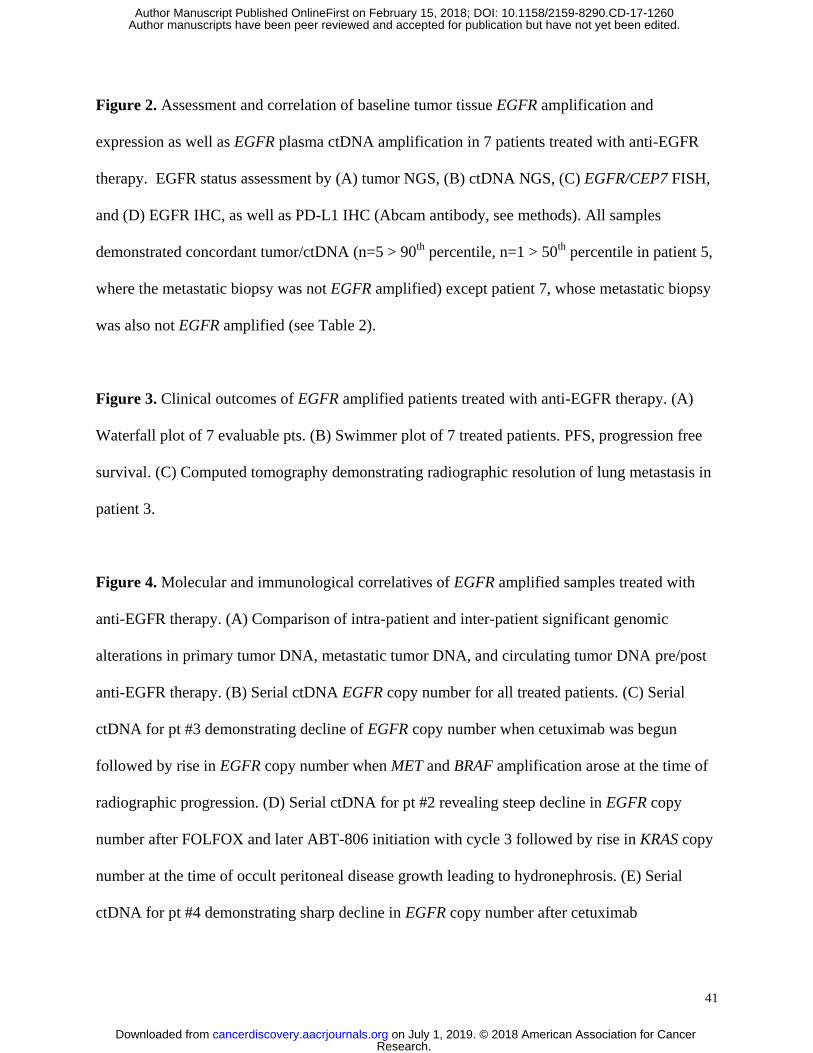
41
Figure 2. Assessment and correlation of baseline tumor tissue EGFR amplification and
expression as well as EGFR plasma ctDNA amplification in 7 patients treated with anti-EGFR
therapy. EGFR status assessment by (A) tumor NGS, (B) ctDNA NGS, (C) EGFR/CEP7 FISH,
and (D) EGFR IHC, as well as PD-L1 IHC (Abcam antibody, see methods). All samples
demonstrated concordant tumor/ctDNA (n=5 > 90th
percentile, n=1 > 50th
percentile in patient 5,
where the metastatic biopsy was not EGFR amplified) except patient 7, whose metastatic biopsy
was also not EGFR amplified (see Table 2).
Figure 3. Clinical outcomes of EGFR amplified patients treated with anti-EGFR therapy. (A)
Waterfall plot of 7 evaluable pts. (B) Swimmer plot of 7 treated patients. PFS, progression free
survival. (C) Computed tomography demonstrating radiographic resolution of lung metastasis in
patient 3.
Figure 4. Molecular and immunological correlatives of EGFR amplified samples treated with
anti-EGFR therapy. (A) Comparison of intra-patient and inter-patient significant genomic
alterations in primary tumor DNA, metastatic tumor DNA, and circulating tumor DNA pre/post
anti-EGFR therapy. (B) Serial ctDNA EGFR copy number for all treated patients. (C) Serial
ctDNA for pt #3 demonstrating decline of EGFR copy number when cetuximab was begun
followed by rise in EGFR copy number when MET and BRAF amplification arose at the time of
radiographic progression. (D) Serial ctDNA for pt #2 revealing steep decline in EGFR copy
number after FOLFOX and later ABT-806 initiation with cycle 3 followed by rise in KRAS copy
number at the time of occult peritoneal disease growth leading to hydronephrosis. (E) Serial
ctDNA for pt #4 demonstrating sharp decline in EGFR copy number after cetuximab
Research. on July 1, 2019. © 2018 American Association for Cancercancerdiscovery.aacrjournals.org Downloaded from
Author manuscripts have been peer reviewed and accepted for publication but have not yet been edited. Author Manuscript Published OnlineFirst on February 15, 2018; DOI: 10.1158/2159-8290.CD-17-1260
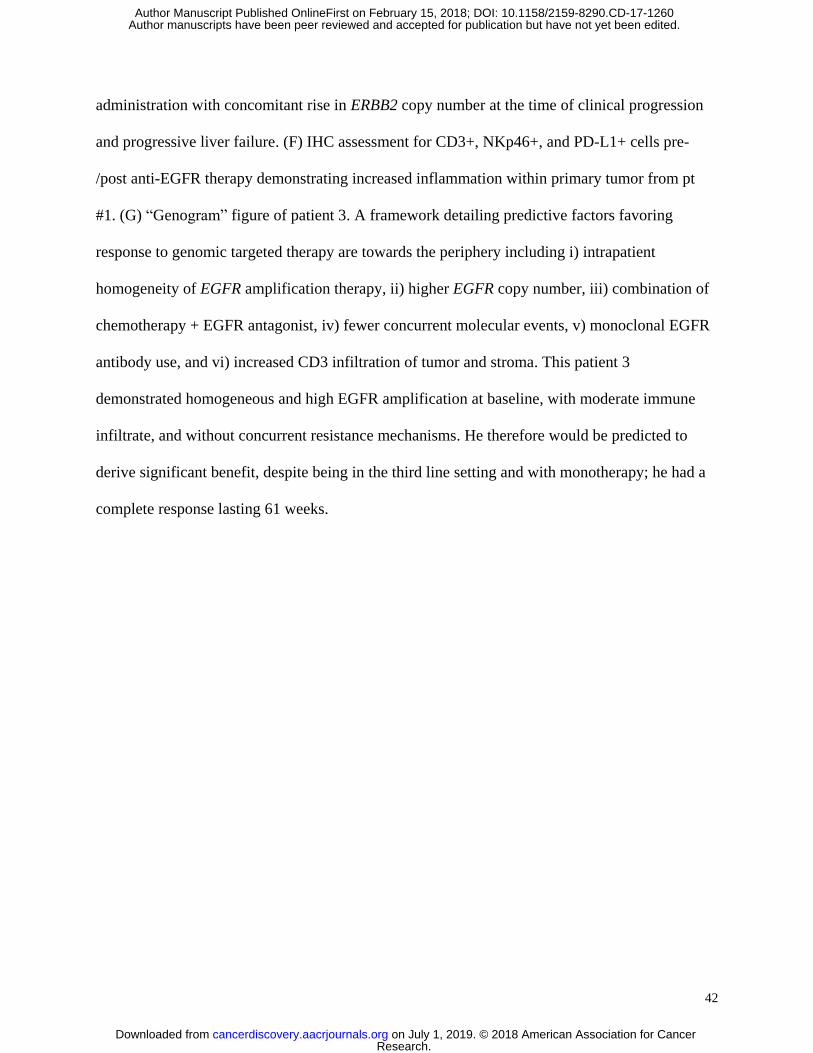
42
administration with concomitant rise in ERBB2 copy number at the time of clinical progression
and progressive liver failure. (F) IHC assessment for CD3+, NKp46+, and PD-L1+ cells pre-
/post anti-EGFR therapy demonstrating increased inflammation within primary tumor from pt
#1. (G) “Genogram” figure of patient 3. A framework detailing predictive factors favoring
response to genomic targeted therapy are towards the periphery including i) intrapatient
homogeneity of EGFR amplification therapy, ii) higher EGFR copy number, iii) combination of
chemotherapy + EGFR antagonist, iv) fewer concurrent molecular events, v) monoclonal EGFR
antibody use, and vi) increased CD3 infiltration of tumor and stroma. This patient 3
demonstrated homogeneous and high EGFR amplification at baseline, with moderate immune
infiltrate, and without concurrent resistance mechanisms. He therefore would be predicted to
derive significant benefit, despite being in the third line setting and with monotherapy; he had a
complete response lasting 61 weeks.
Research. on July 1, 2019. © 2018 American Association for Cancercancerdiscovery.aacrjournals.org Downloaded from
Author manuscripts have been peer reviewed and accepted for publication but have not yet been edited. Author Manuscript Published OnlineFirst on February 15, 2018; DOI: 10.1158/2159-8290.CD-17-1260
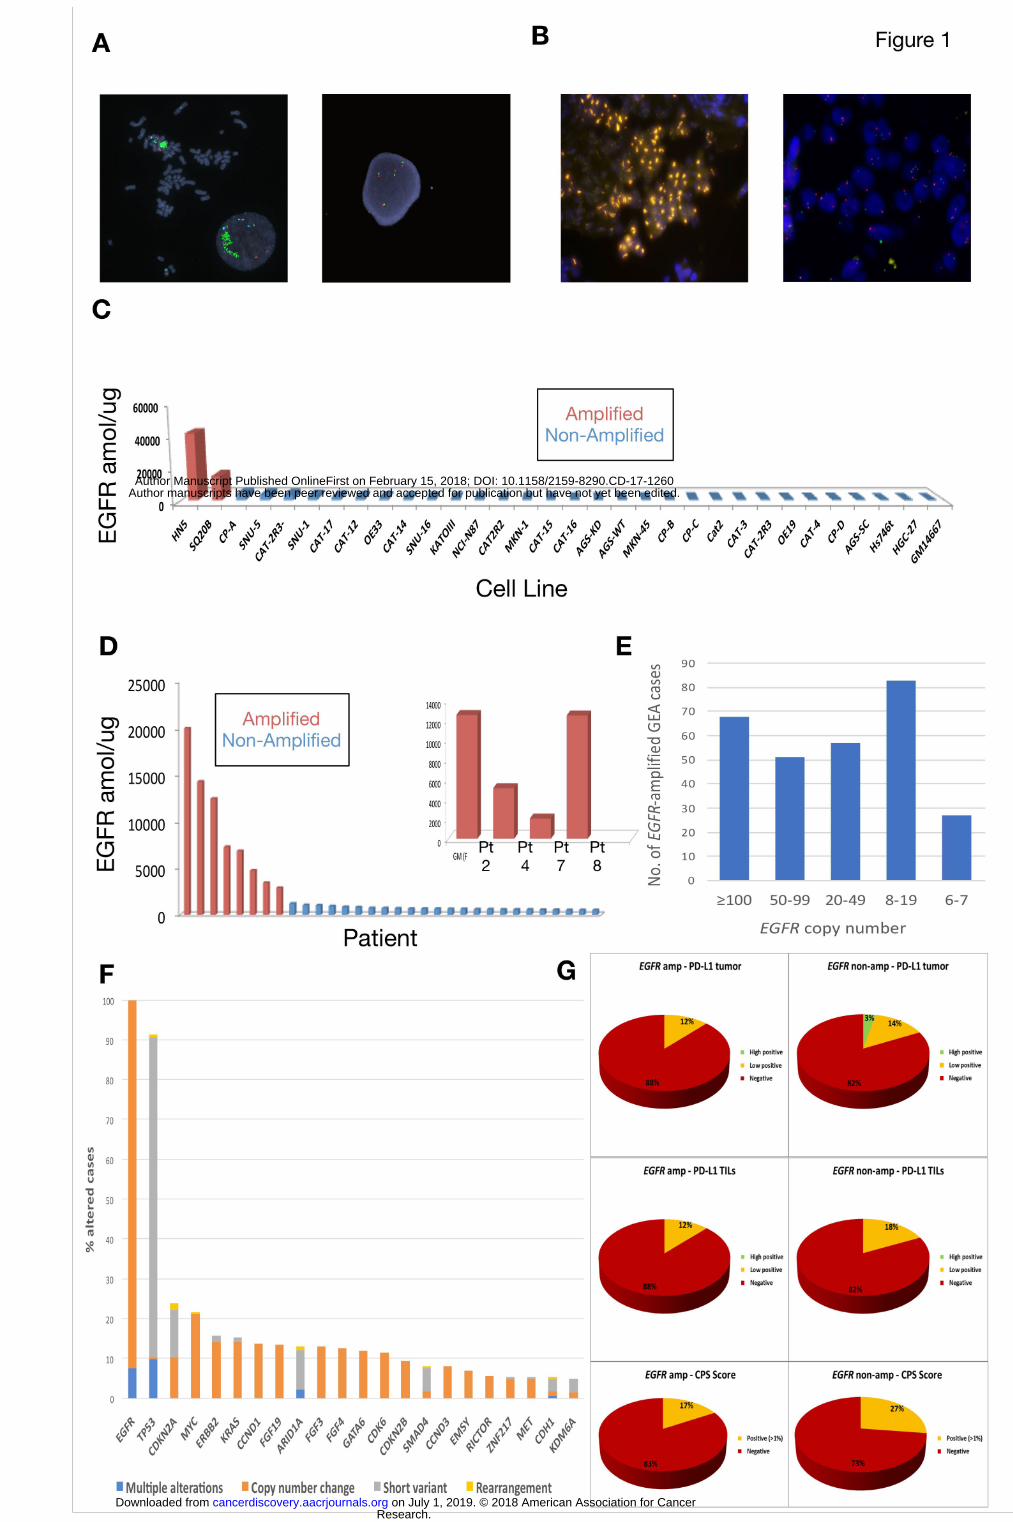
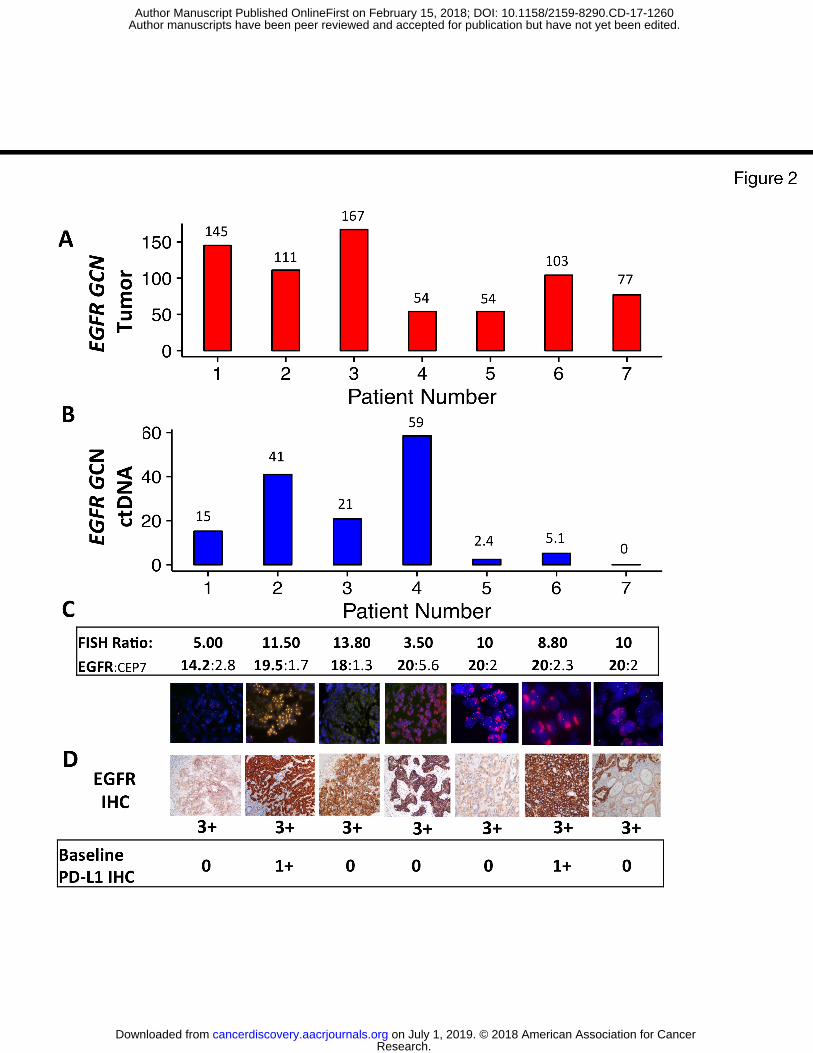
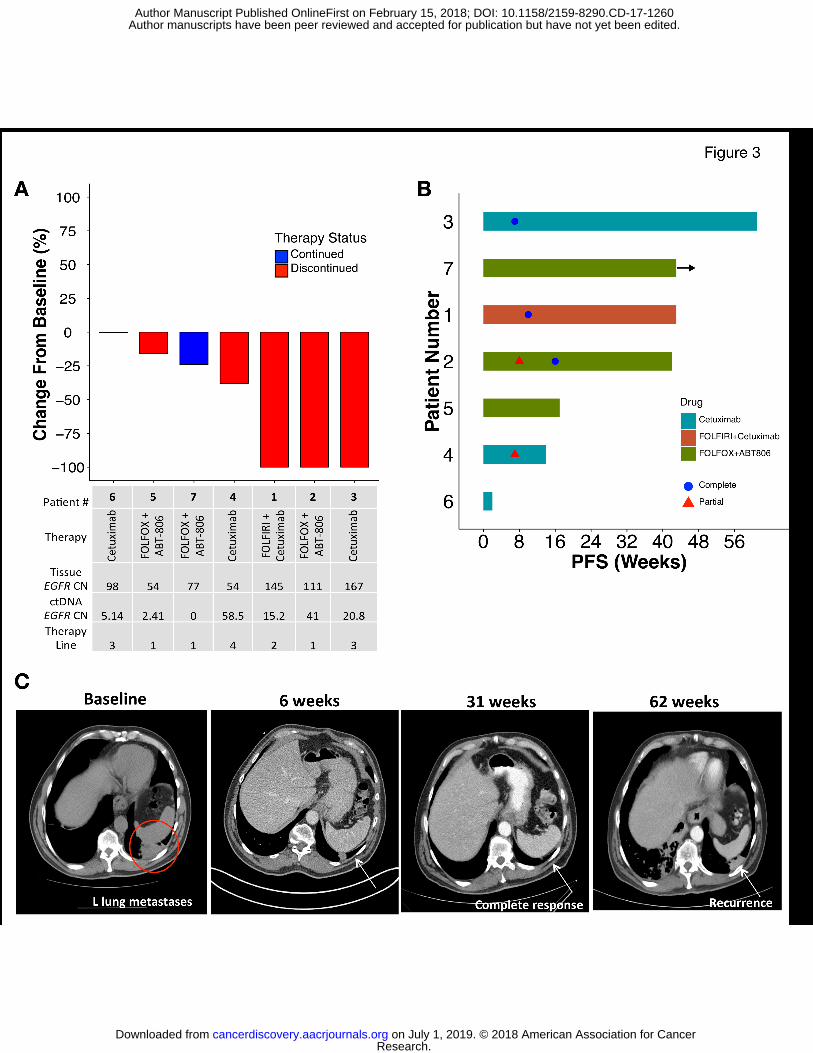
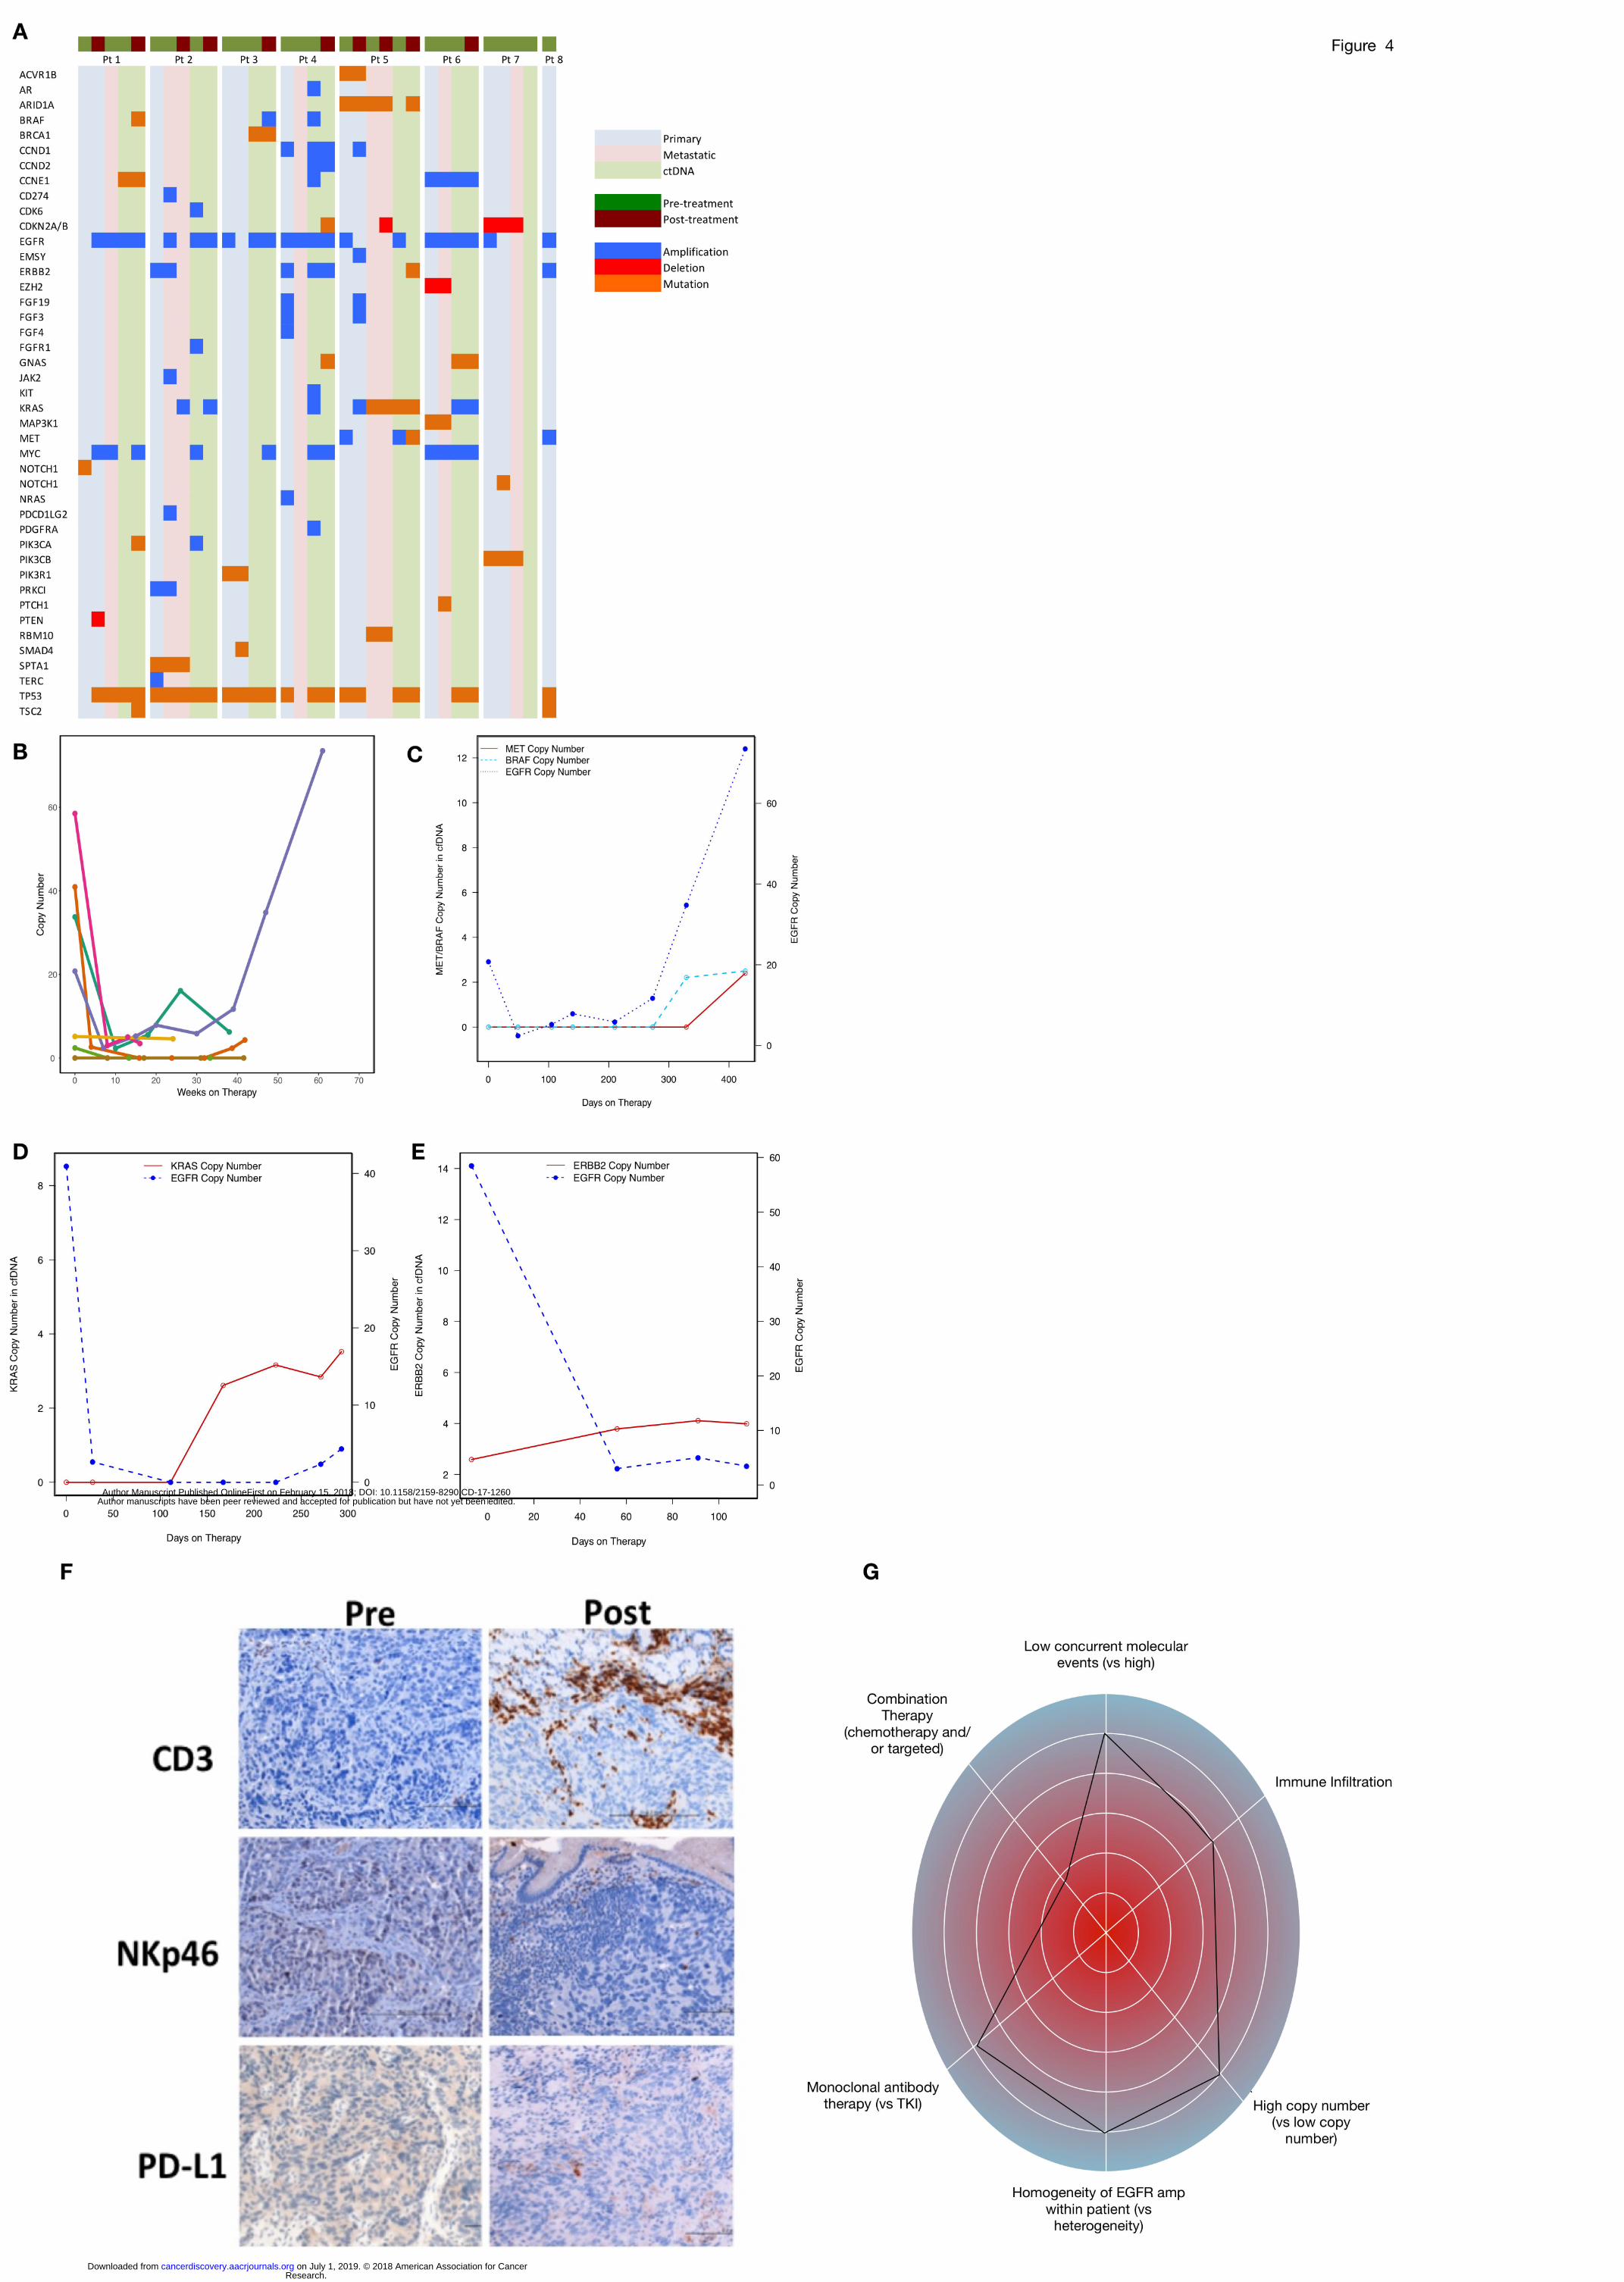
Published OnlineFirst February 15, 2018.Cancer Discov Steven B. Maron, Lindsay Alpert, Heewon A. Kwak, et al. adenocarcinomatreatment for EGFR amplified gastroesophageal Targeted therapies for targeted populations: Anti-EGFR
Updated version
10.1158/2159-8290.CD-17-1260doi:
Access the most recent version of this article at:
Material
Supplementary
http://cancerdiscovery.aacrjournals.org/content/suppl/2018/02/15/2159-8290.CD-17-1260.DC1
Access the most recent supplemental material at:
Manuscript
Authoredited. Author manuscripts have been peer reviewed and accepted for publication but have not yet been
E-mail alerts related to this article or journal.Sign up to receive free email-alerts
Subscriptions
Reprints and
To order reprints of this article or to subscribe to the journal, contact the AACR Publications
Permissions
Rightslink site. Click on "Request Permissions" which will take you to the Copyright Clearance Center's (CCC)
.http://cancerdiscovery.aacrjournals.org/content/early/2018/02/15/2159-8290.CD-17-1260To request permission to re-use all or part of this article, use this link
Research. on July 1, 2019. © 2018 American Association for Cancercancerdiscovery.aacrjournals.org Downloaded from
Author manuscripts have been peer reviewed and accepted for publication but have not yet been edited. Author Manuscript Published OnlineFirst on February 15, 2018; DOI: 10.1158/2159-8290.CD-17-1260