Embed Size (px)
Citation preview
Integrating Cultural Responsiveness
and School-wide Positive
Behavior SupportTary J. Tobin ([email protected])
Claudia G. Vincent ([email protected])University of Oregon
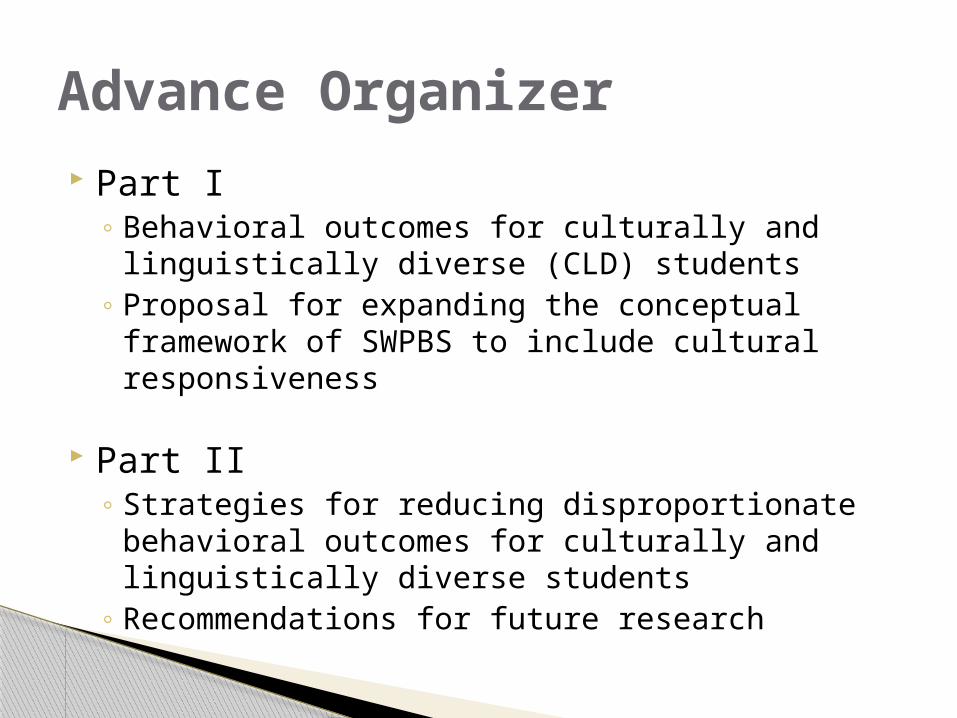
Part I◦ Behavioral outcomes for culturally and
linguistically diverse (CLD) students◦ Proposal for expanding the conceptual framework
of SWPBS to include cultural responsiveness
Part II◦ Strategies for reducing disproportionate
behavioral outcomes for culturally and linguistically diverse students
◦ Recommendations for future research
Advance Organizer
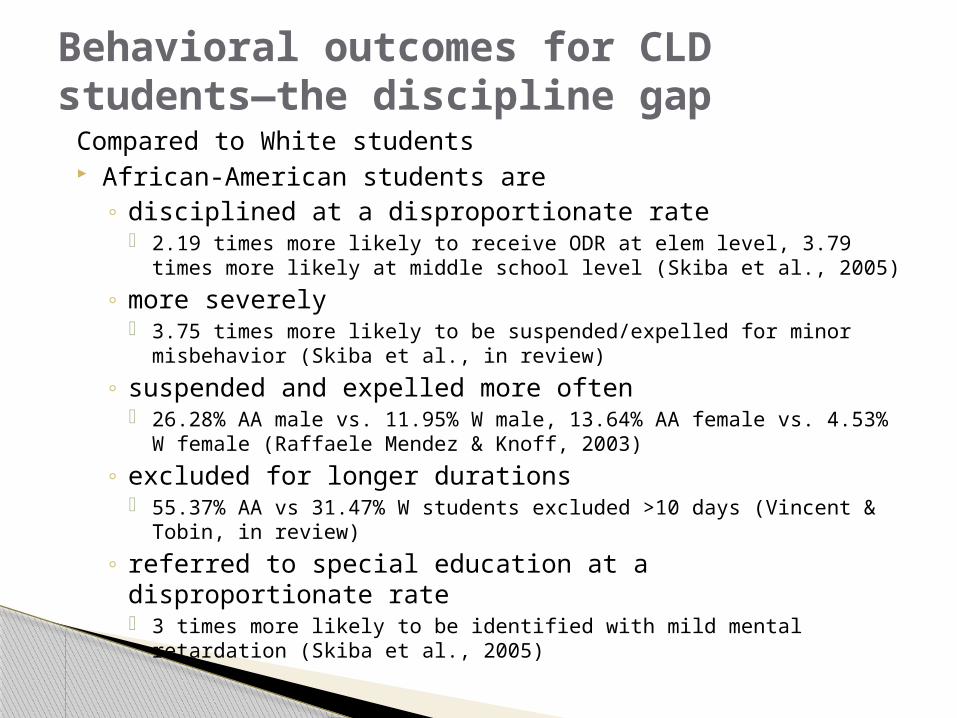
Compared to White students African-American students are
◦ disciplined at a disproportionate rate 2.19 times more likely to receive ODR at elem level, 3.79 times more
likely at middle school level (Skiba et al., 2005)
◦ more severely 3.75 times more likely to be suspended/expelled for minor
misbehavior (Skiba et al., in review)
◦ suspended and expelled more often 26.28% AA male vs. 11.95% W male, 13.64% AA female vs. 4.53% W
female (Raffaele Mendez & Knoff, 2003)
◦ excluded for longer durations 55.37% AA vs 31.47% W students excluded >10 days (Vincent &
Tobin, in review)
◦ referred to special education at a disproportionate rate 3 times more likely to be identified with mild mental retardation
(Skiba et al., 2005)
Behavioral outcomes for CLD students—the discipline gap
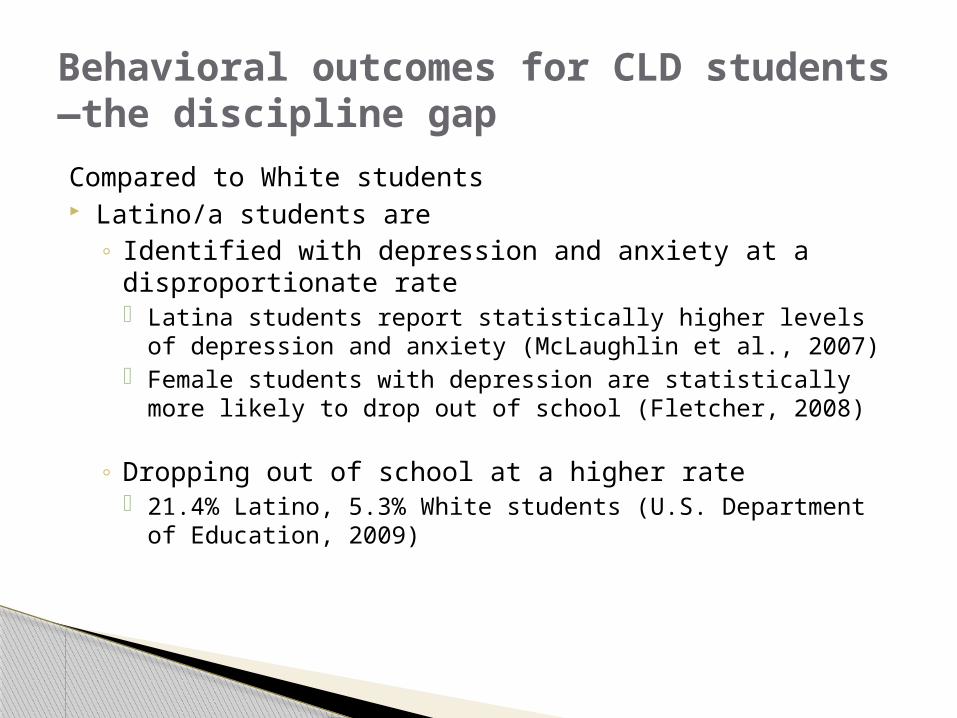
Compared to White students Latino/a students are
◦ Identified with depression and anxiety at a disproportionate rate Latina students report statistically higher levels of depression
and anxiety (McLaughlin et al., 2007) Female students with depression are statistically more likely
to drop out of school (Fletcher, 2008)
◦ Dropping out of school at a higher rate 21.4% Latino, 5.3% White students (U.S. Department of
Education, 2009)
Behavioral outcomes for CLD students—the discipline gap
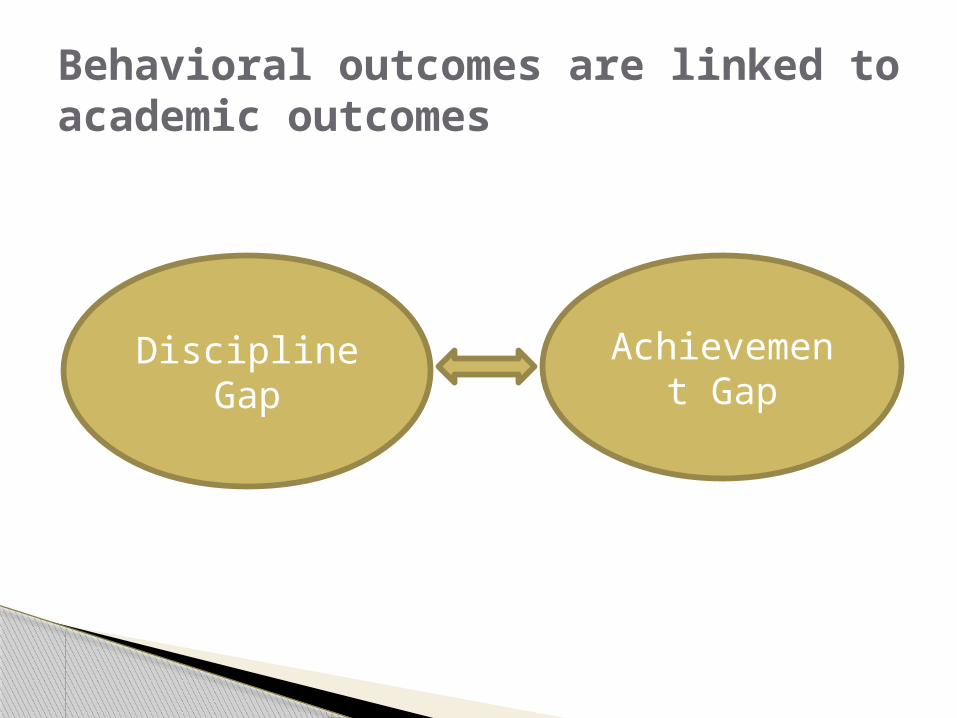
Behavioral outcomes are linked to academic outcomes
Achievement Gap
Discipline Gap
Insufficient student support? Ineffective school systems? Inadequate decision-making? All of the above? None of the above?
No simple solution…..
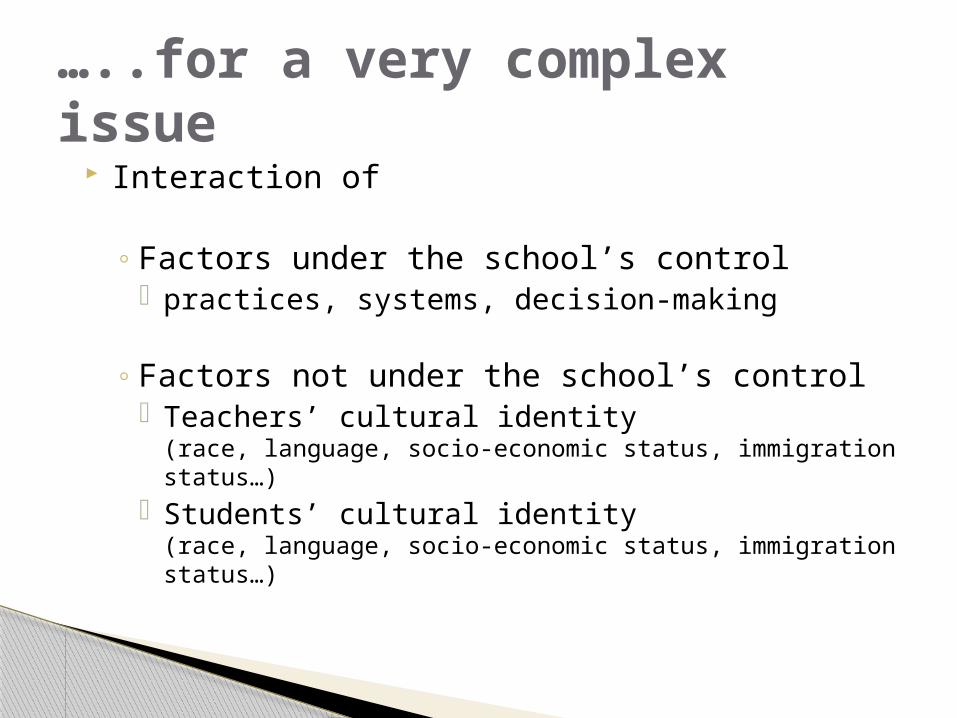
Interaction of
◦ Factors under the school’s control practices, systems, decision-making
◦ Factors not under the school’s control Teachers’ cultural identity
(race, language, socio-economic status, immigration status…) Students’ cultural identity
(race, language, socio-economic status, immigration status…)
…..for a very complex issue
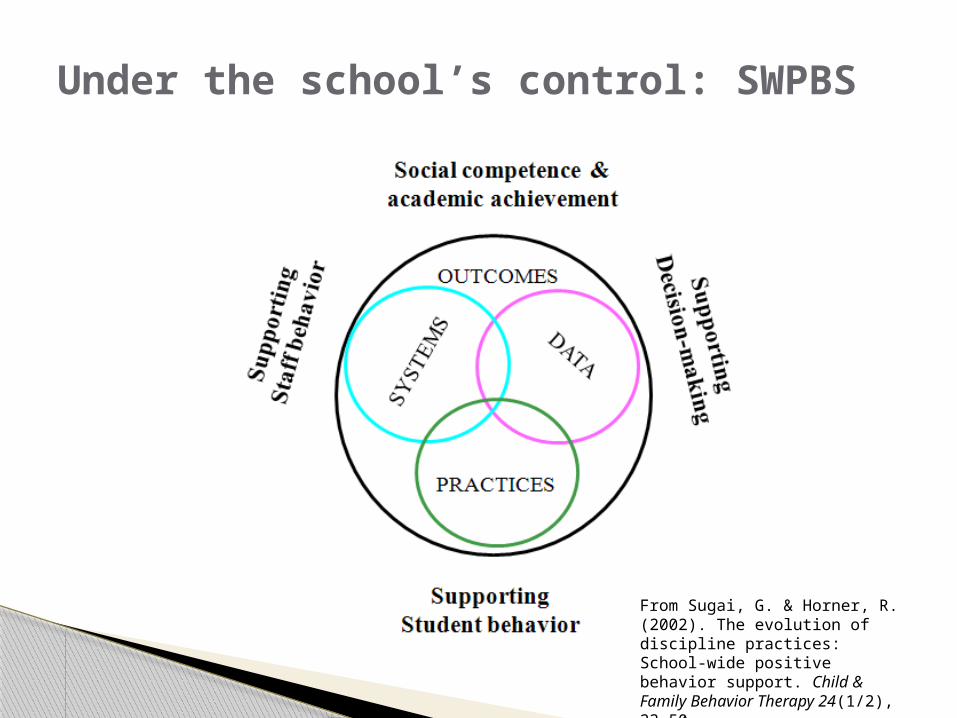
Under the school’s control: SWPBS
From Sugai, G. & Horner, R. (2002). The evolution of discipline practices: School-wide positive behavior support. Child & Family Behavior Therapy 24(1/2), 23-50.
STUDENT BEHAVIOR
Rules & Expectations
AchievementGoals
Administrative Structures
Ethnicity
Immigration Status
Tradition
Institutional Language
Individual Language
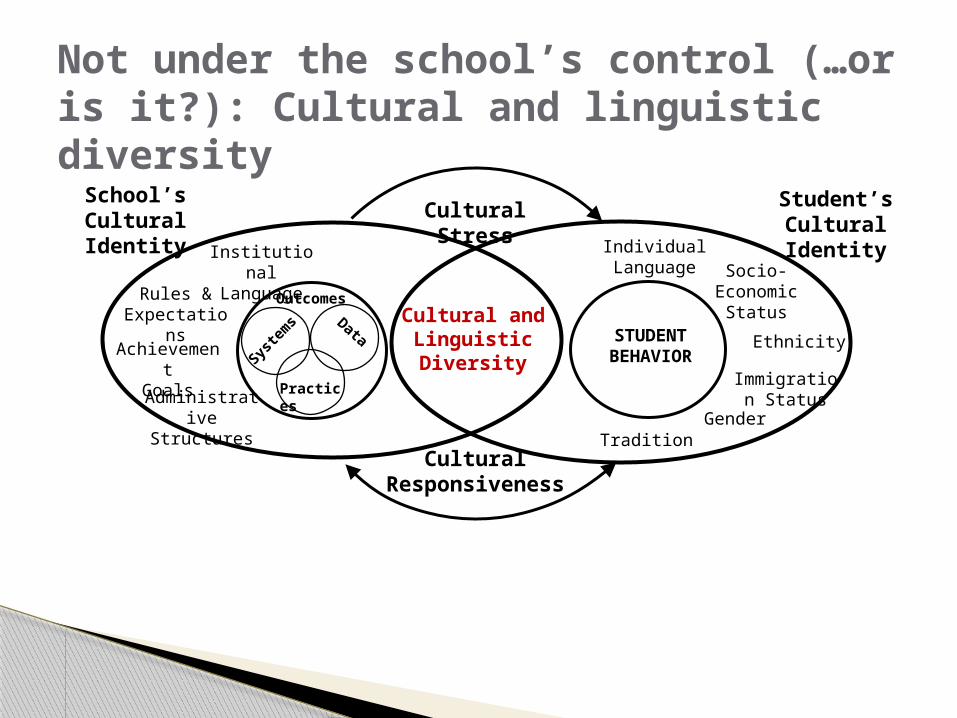
Cultural Stress
Socio-Economic
Status
Gender
Syste
ms Data
Practices
OutcomesCultural and
Linguistic Diversity
Cultural Responsiveness
School’s Cultural Identity
Student’s Cultural Identity
Not under the school’s control (…or is it?): Cultural and linguistic diversity
What does the discipline gap look like in schools implementing SWPBS compared to schools not implementing SWPBS?
SWPBS and behavioral outcomes for CLD students
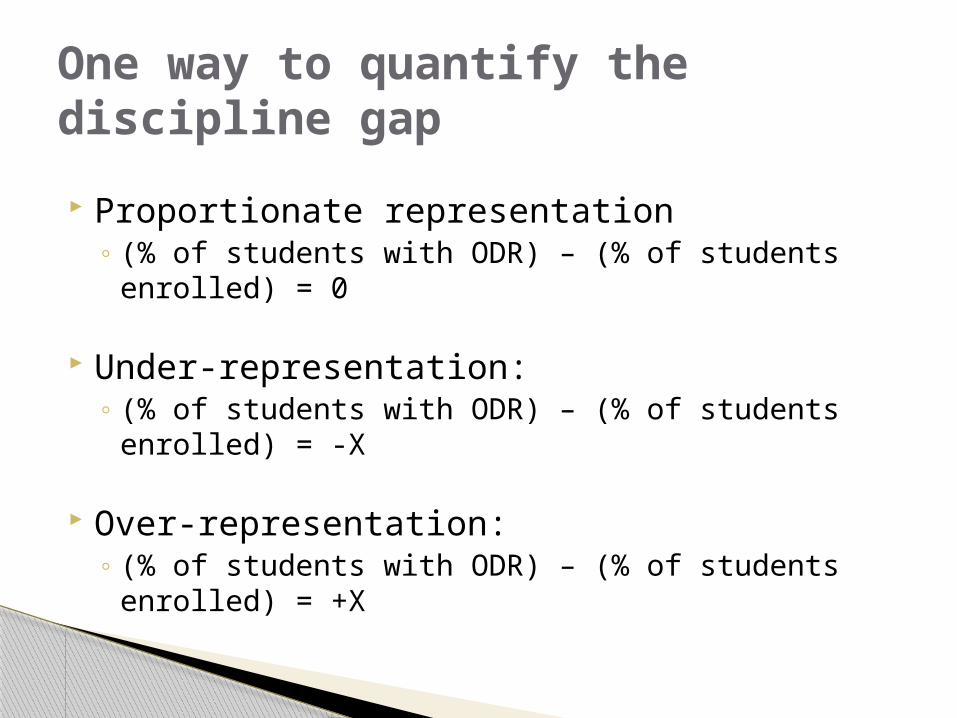
One way to quantify the discipline gap
Proportionate representation◦ (% of students with ODR) – (% of students enrolled)
= 0
Under-representation:◦ (% of students with ODR) – (% of students enrolled)
= -X
Over-representation:◦ (% of students with ODR) – (% of students enrolled)
= +X
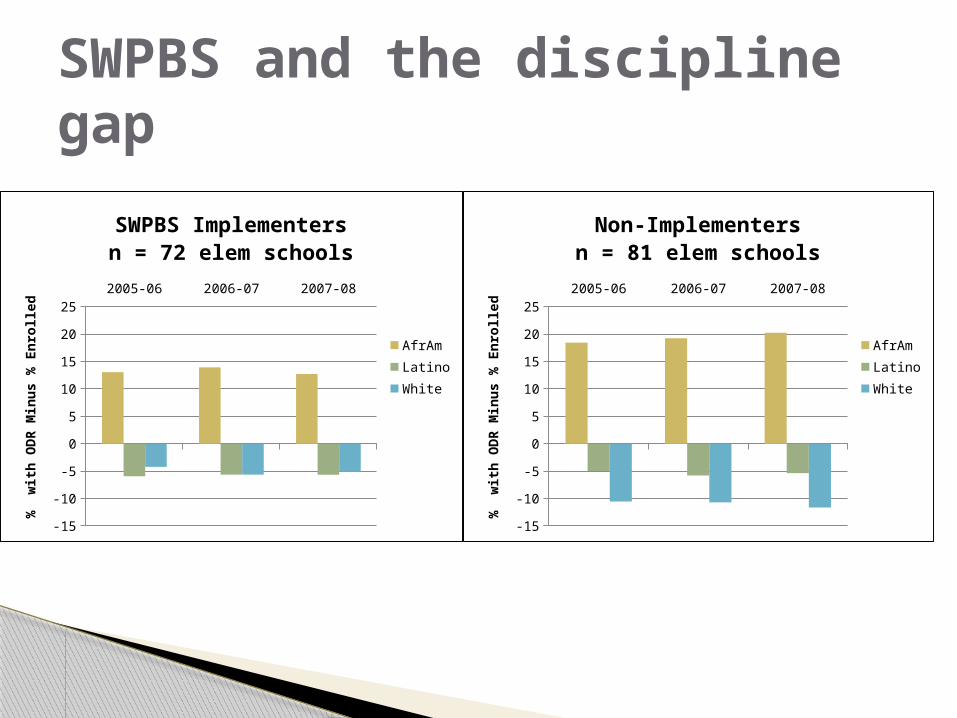
SWPBS and the discipline gap
2005-06 2006-07 2007-08
-15
-10
-5
0
5
10
15
20
25
SWPBS Implementersn = 72 elem schools
AfrAmLatinoWhite
%
wit
h O
DR
Min
us %
Enro
lled
2005-06 2006-07 2007-08
-15
-10
-5
0
5
10
15
20
25
Non-Implementersn = 81 elem schools
AfrAmLatinoWhite
%
wit
h O
DR
Min
us %
Enro
lled
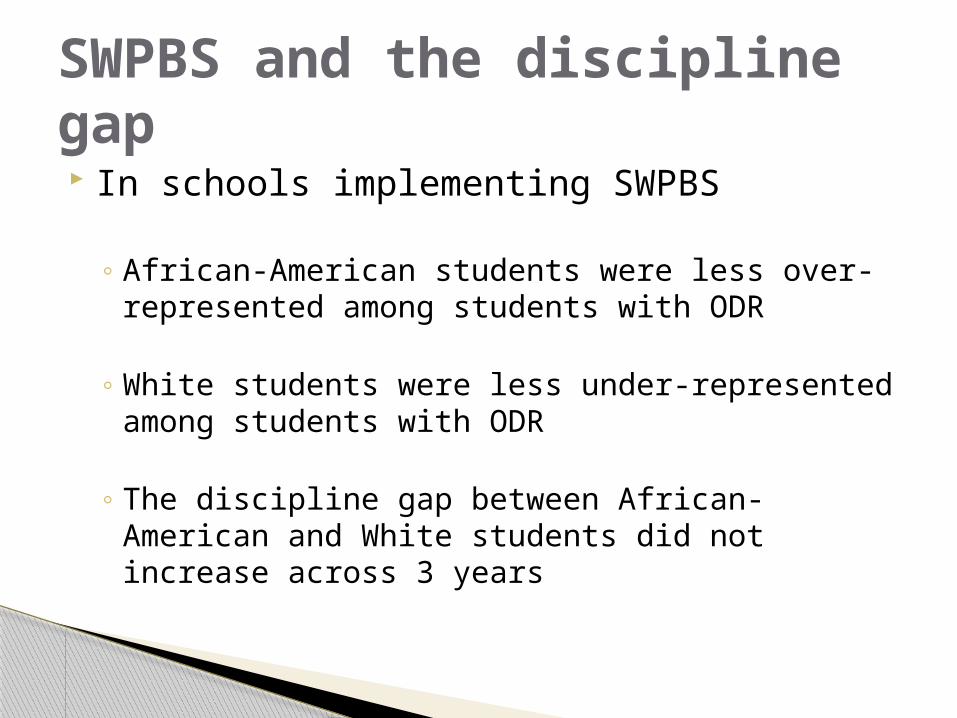
In schools implementing SWPBS
◦ African-American students were less over-represented among students with ODR
◦ White students were less under-represented among students with ODR
◦ The discipline gap between African-American and White students did not increase across 3 years
SWPBS and the discipline gap
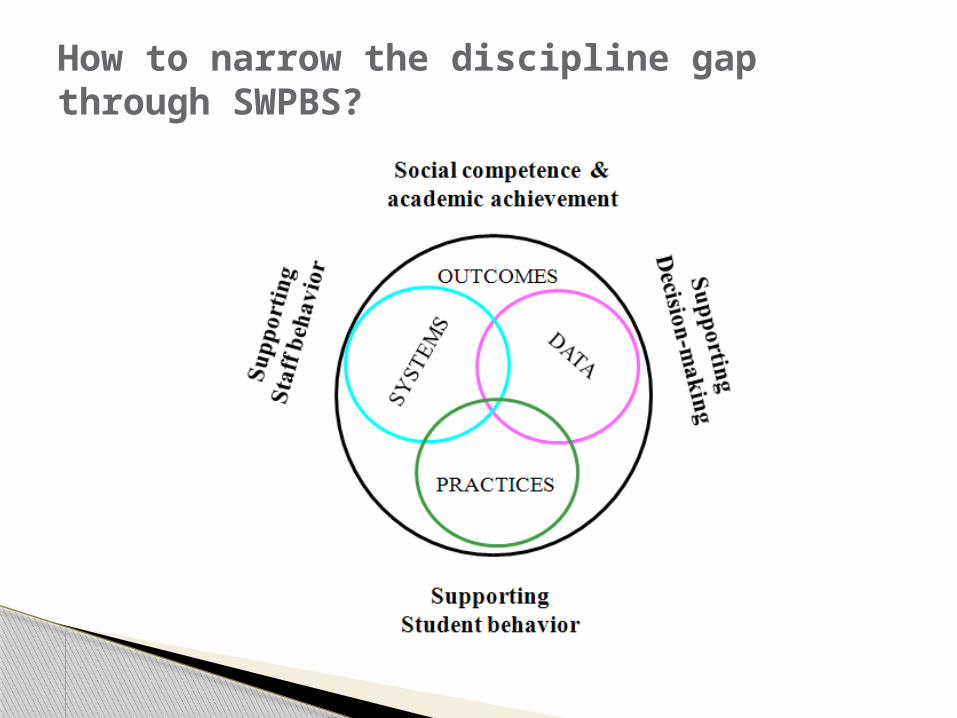
How to narrow the discipline gap through SWPBS?
Systemic support of cultural knowledge Encourage staff to increase their familiarity with
cultural differences in expressiveness, communication styles, role of authority, use of language
Systemic support of cultural self-awareness Encourage staff to increase their familiarity with
cultural specificity of their own behavior
see Gwendolyn Cartledge’s work
Culturally responsive systems to support staff behavior
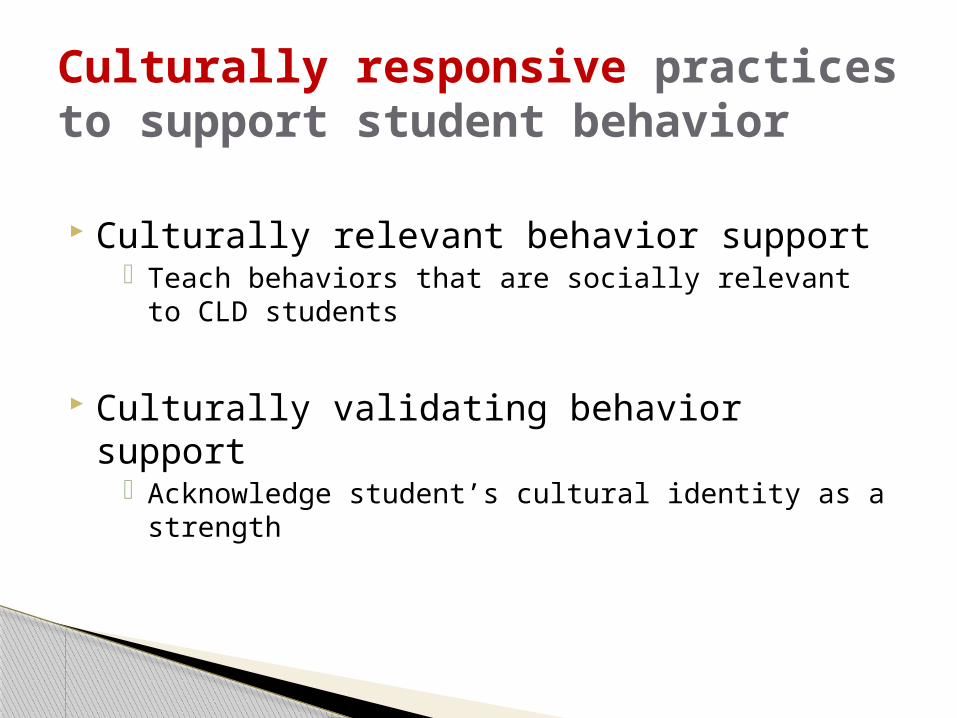
Culturally relevant behavior support Teach behaviors that are socially relevant to CLD
students
Culturally validating behavior support Acknowledge student’s cultural identity as a strength
Culturally responsive practices to support student behavior
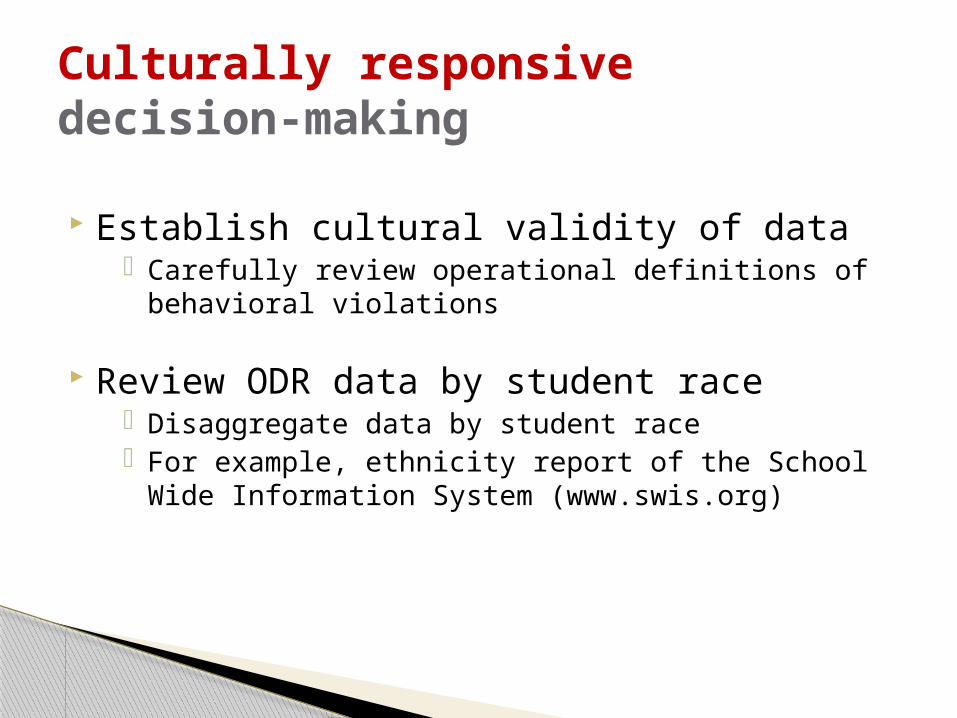
Establish cultural validity of data Carefully review operational definitions of behavioral
violations
Review ODR data by student race Disaggregate data by student race For example, ethnicity report of the School Wide
Information System (www.swis.org)
Culturally responsive decision-making
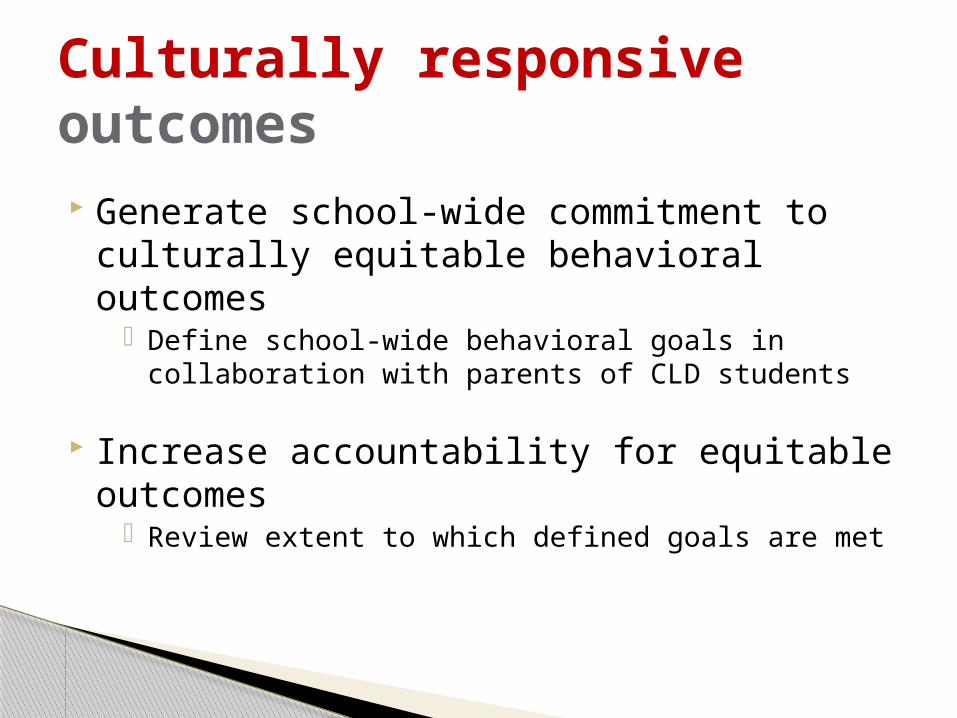
Generate school-wide commitment to culturally equitable behavioral outcomes
Define school-wide behavioral goals in collaboration with parents of CLD students
Increase accountability for equitable outcomes
Review extent to which defined goals are met
Culturally responsive outcomes
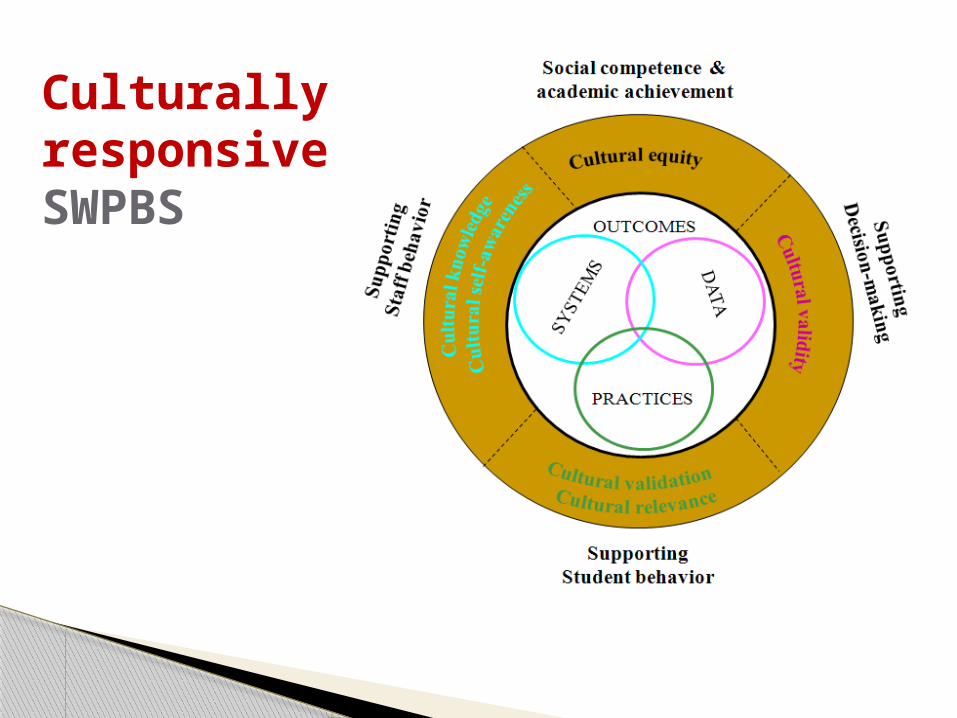
Culturally responsive SWPBS
SWPBS strategies for reducing disproportionate disciplinary exclusions of African American students
Recommendations for future research
Part II
Real harm done by exclusion from school (American Academy of Pediatrics Committee on School Health, 2003)
Real benefits from SWPBS (Sugai et al., in press)
Not enough known – or being done – about racially disproportionate disciplinary exclusions
Why I wanted to study this and to talk with you about it:
All had 2 years of School Wide Information System (SWIS, May et al., 2006, see http://swis.org ) discipline data
Looked for changes in disproportionate exclusion of African American Students
Studied 46 schools for 2 years
All had 2 years of online data about which specific SWPBS strategies they were using.
Looked to see if any specific strategies improved –
And if changes in disproportionate exclusions also occurred.
EBS Survey (also known as “PBS Staff Self-Assessment Survey) The original version was published as the
“EBS Survey” (Lewis & Sugai, 1999).
Current versions are available for downloading from http://pbis.org and for online data entry at http://www.pbssurveys.org/pages/SelfAssessmentSurvey.aspx. In this study, all respondents were using Version 2 (Sugai, Horner, & Todd, 2000) .
Measures 46 specific elements of positive behavior support in 4 domains of SWPBS School-wide System: 18 Features Non-Classroom (also known as “Specific Setting”) System: 9 Features
Classroom System: 11 Features Individual Student System: 8 Features
Scale for “In Place” Status
0 = Not in place 1 = Partially in place 2 = In place
“Diverse” Schools
We used data only from schools with some diversity, operationally defined as at least
> .05% and < .95% African American Students
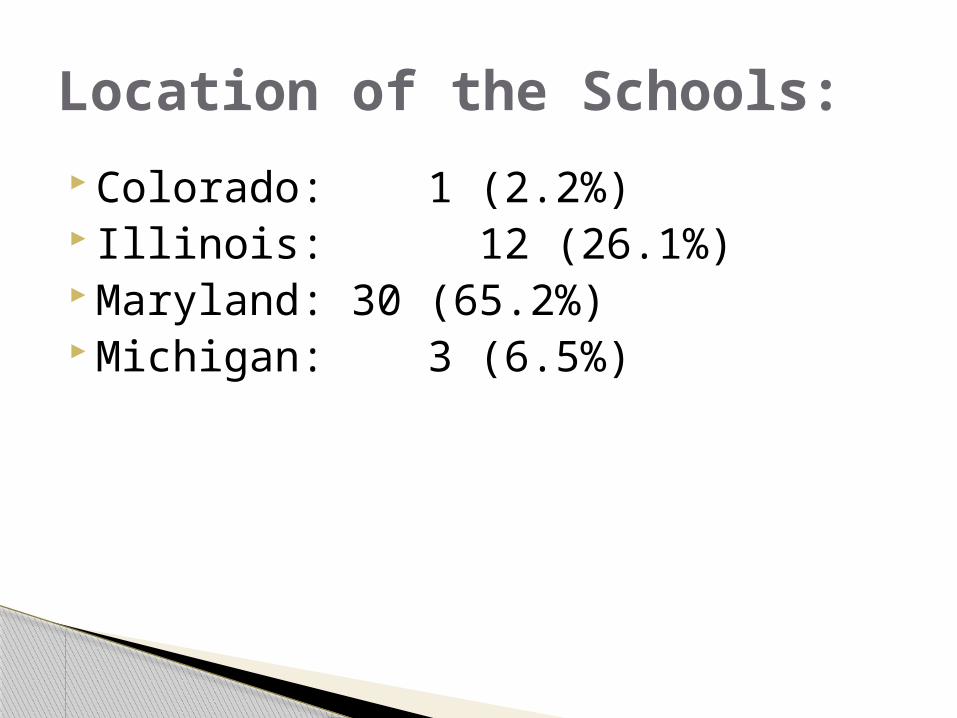
Colorado: 1 (2.2%) Illinois: 12 (26.1%) Maryland: 30 (65.2%) Michigan: 3 (6.5%)
Location of the Schools:
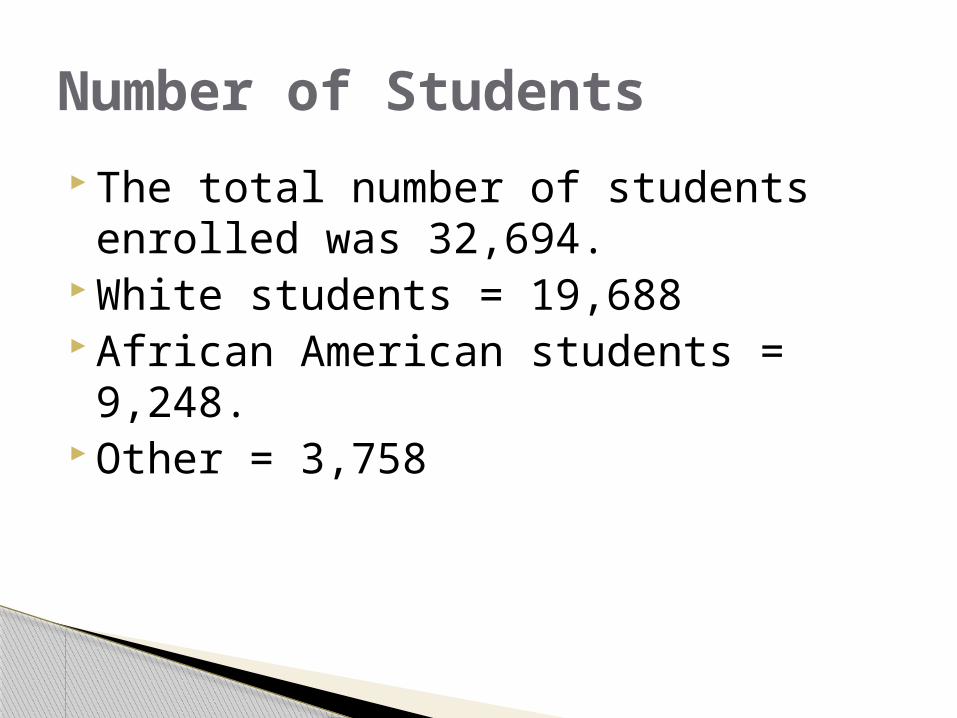
Number of Students
The total number of students enrolled was 32,694.
White students = 19,688 African American students = 9,248. Other = 3,758
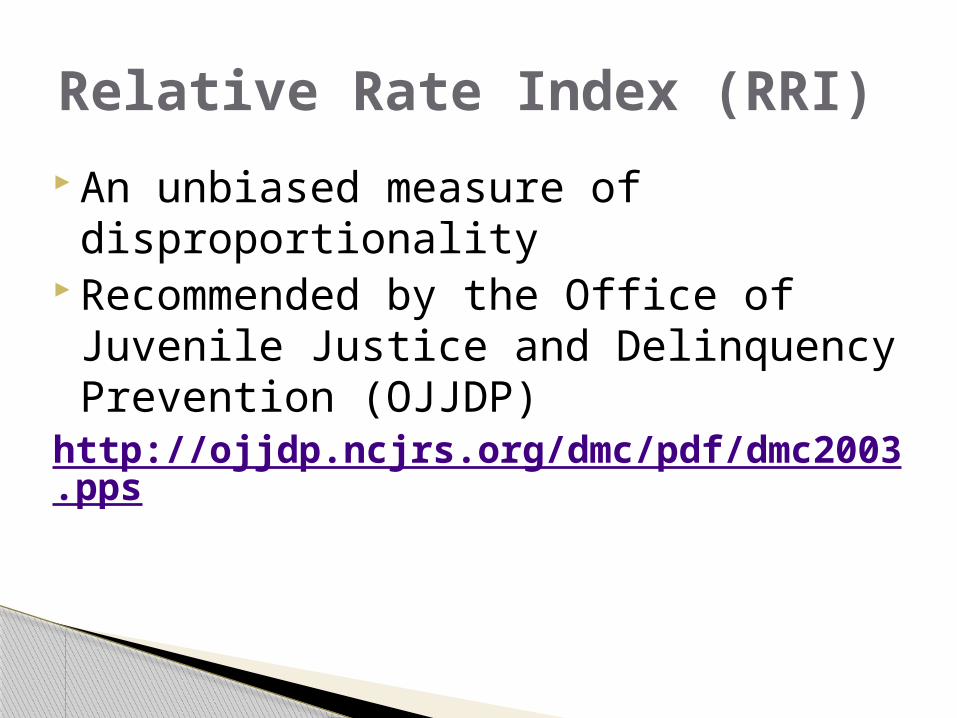
Relative Rate Index (RRI)
An unbiased measure of disproportionality
Recommended by the Office of Juvenile Justice and Delinquency Prevention (OJJDP)
http://ojjdp.ncjrs.org/dmc/pdf/dmc2003.pps
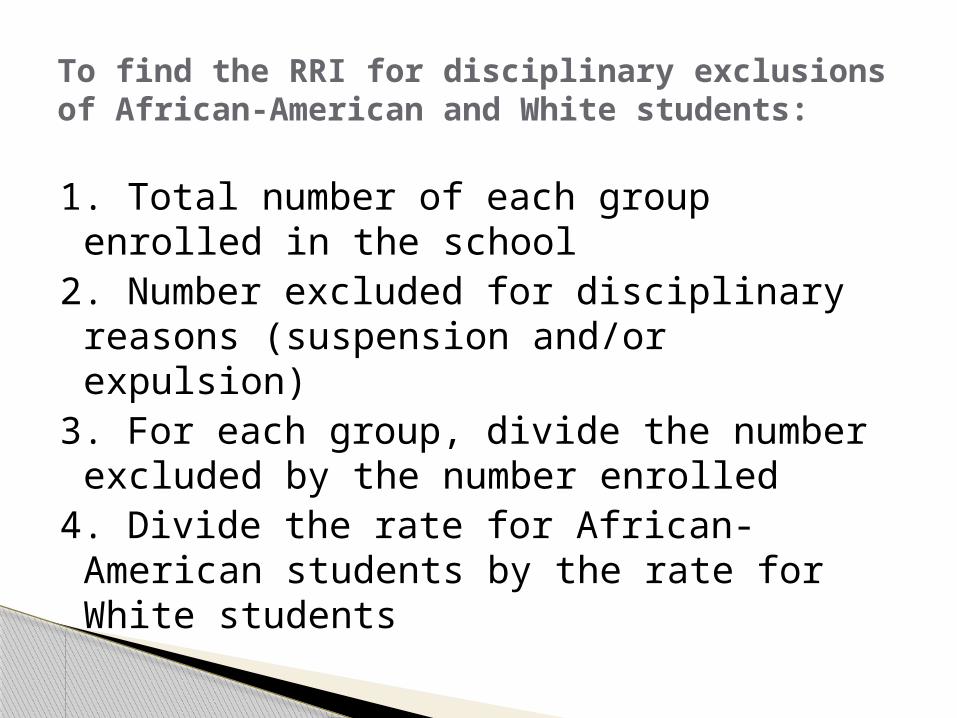
1. Total number of each group enrolled in the school
2. Number excluded for disciplinary reasons (suspension and/or expulsion)
3. For each group, divide the number excluded by the number enrolled
4. Divide the rate for African-American students by the rate for White students
To find the RRI for disciplinary exclusions of African-American and White students:
Additional information on calculating the Relative Rate Index (RRI) can be found at
http://www.dcjs.virginia.gov/juvenile/dmc
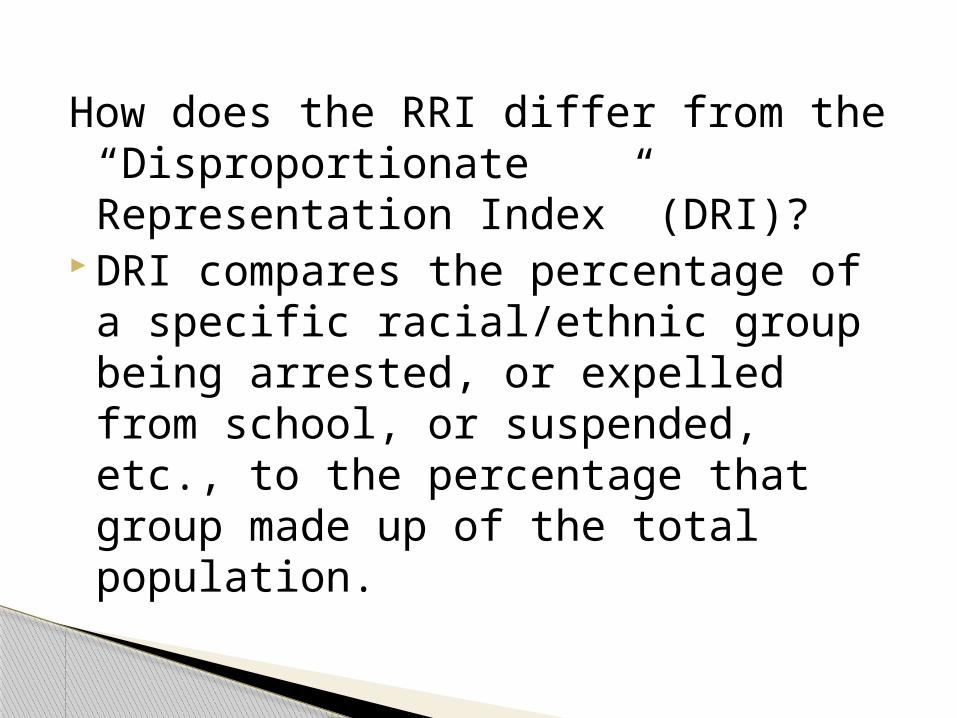
How does the RRI differ from the “Disproportionate Representation Index” (DRI)?
DRI compares the percentage of a specific racial/ethnic group being arrested, or expelled from school, or suspended, etc., to the percentage that group made up of the total population.
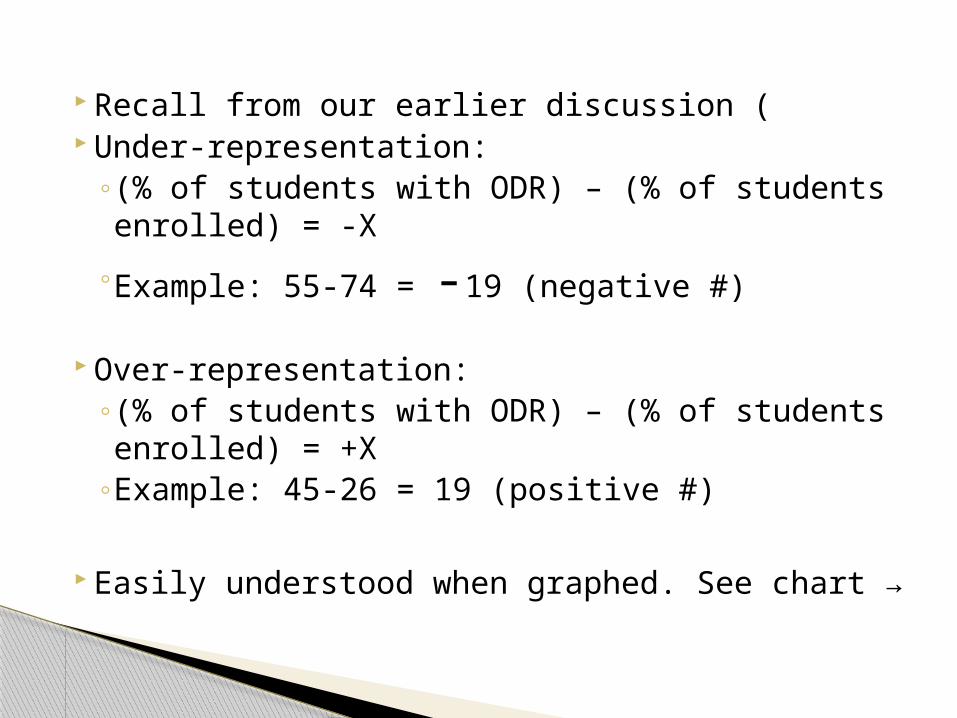
Recall from our earlier discussion ( Under-representation:
◦(% of students with ODR) – (% of students enrolled) = -X
◦Example: 55-74 = -19 (negative #)
Over-representation:◦(% of students with ODR) – (% of students
enrolled) = +X ◦Example: 45-26 = 19 (positive #)
Easily understood when graphed. See chart →
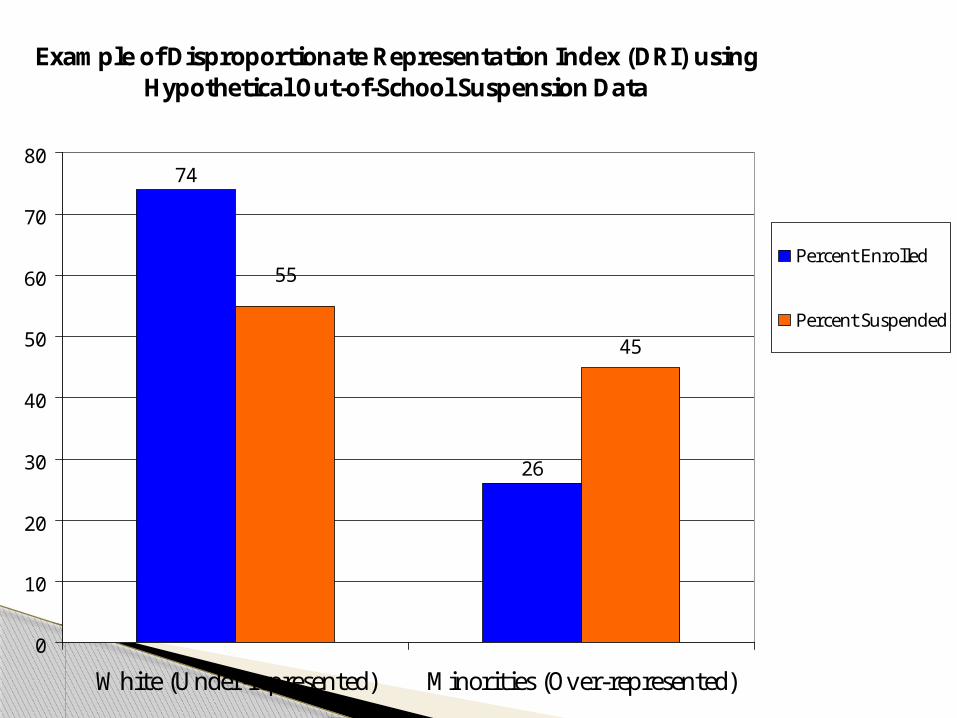
Example of Disproportionate Representation Index (DRI) using Hypothetical Out-of-School Suspension Data
74
26
55
45
0
10
20
30
40
50
60
70
80
White (Under-represented) Minorities (Over-represented)
Percent Enrolled
Percent Suspended
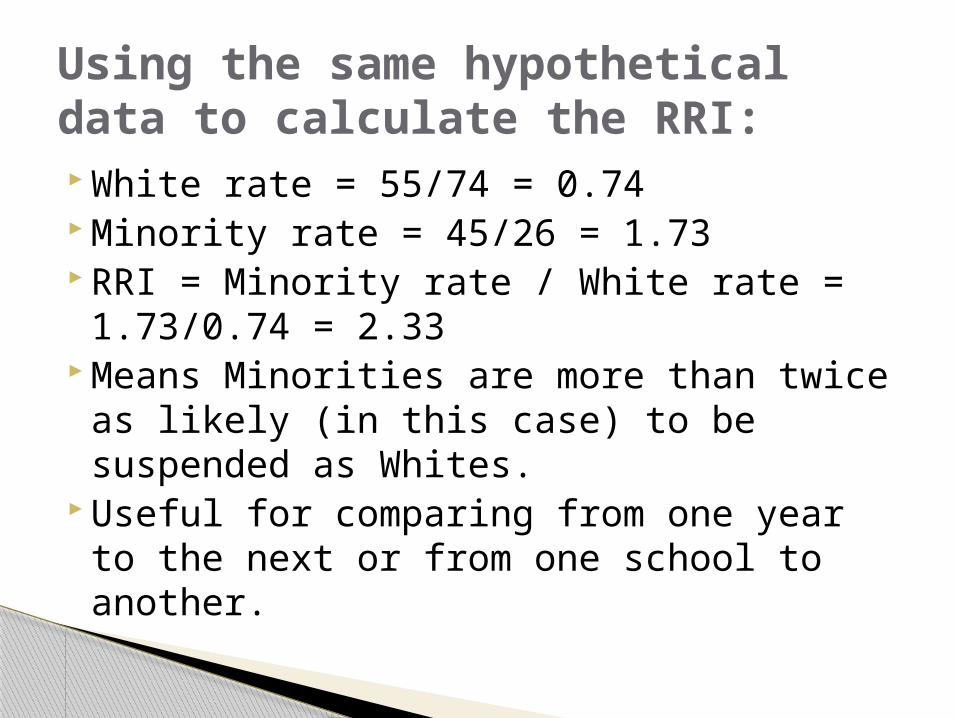
White rate = 55/74 = 0.74 Minority rate = 45/26 = 1.73 RRI = Minority rate / White rate =
1.73/0.74 = 2.33 Means Minorities are more than twice
as likely (in this case) to be suspended as Whites.
Useful for comparing from one year to the next or from one school to another.
Using the same hypothetical data to calculate the RRI:
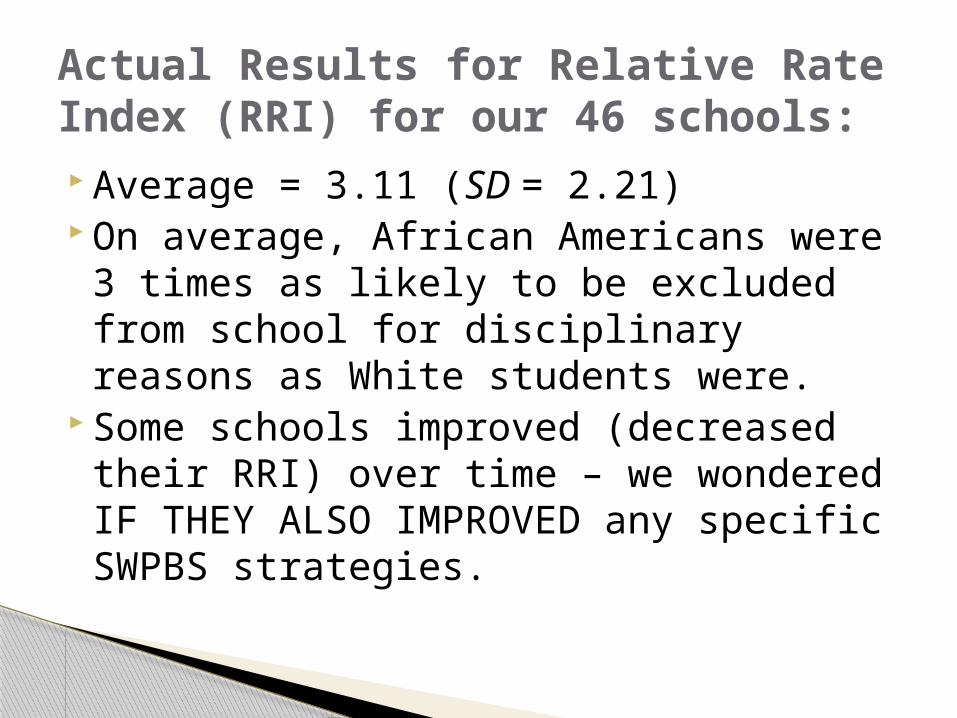
Actual Results for Relative Rate Index (RRI) for our 46 schools: Average = 3.11 (SD = 2.21) On average, African Americans were 3 times as likely to be excluded from school for disciplinary reasons as White students were.
Some schools improved (decreased their RRI) over time – we wondered IF THEY ALSO IMPROVED any specific SWPBS strategies.
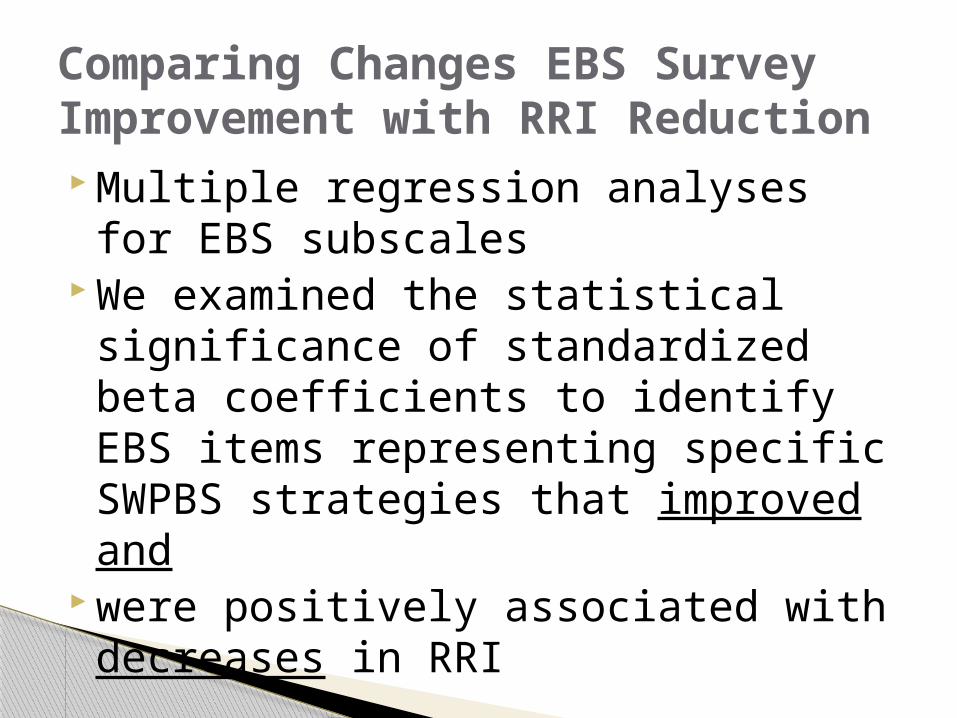
Comparing Changes EBS Survey Improvement with RRI Reduction Multiple regression analyses for EBS subscales
We examined the statistical significance of standardized beta coefficients to identify EBS items representing specific SWPBS strategies that improved and
were positively associated with decreases in RRI
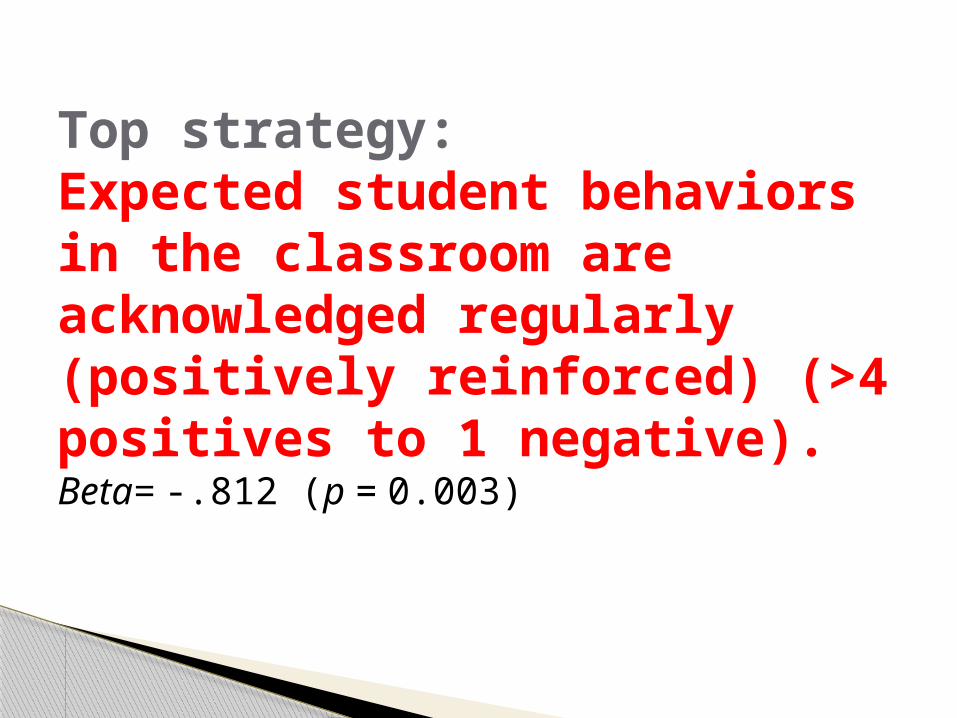
Top strategy:Expected student behaviors in the classroom are acknowledged regularly (positively reinforced) (>4 positives to 1 negative).Beta= -.812 (p = 0.003)
Why might positive attention be particularly helpful for CLD youth?
Positive teacher-student interactions in the classroom are an essential aspect of cultural responsiveness (Cartledge et al., 2001; Cartledge et al., 2008; Hershfeldt et al., 2009).
4 Positives for every 1 Negative?
Also important: Transitions between instructional & non-instructional activities in the classroom are efficient & orderly. Beta= -.606 (p = 0.014)
Why might transitions be especially important?
“If you seat students in small groups or teams in your classroom, you can speed up transitions between activities by awarding points to the group that 1) does the best job of cleaning up, 2) makes the quietest transition, 3) makes the quickest transition… At the end of the week, tally each group’s points. Provide rewards for members of the winning group. (Oriental Trading Company is a good source of inexpensive “trinket” awards that kids seem to love, but homework passes and free computer time coupons are popular too.)”
Written by Linda Starr, retrieved from http://www.educationworld.com/a_curr/management_tips/management_tips049.shtml
How can you improve transitions?
Next: Closer up look at 8 schools that improved their overall total EBS Survey scores (all items combined) and reduced high African American-to-White Relative Rate Indexes
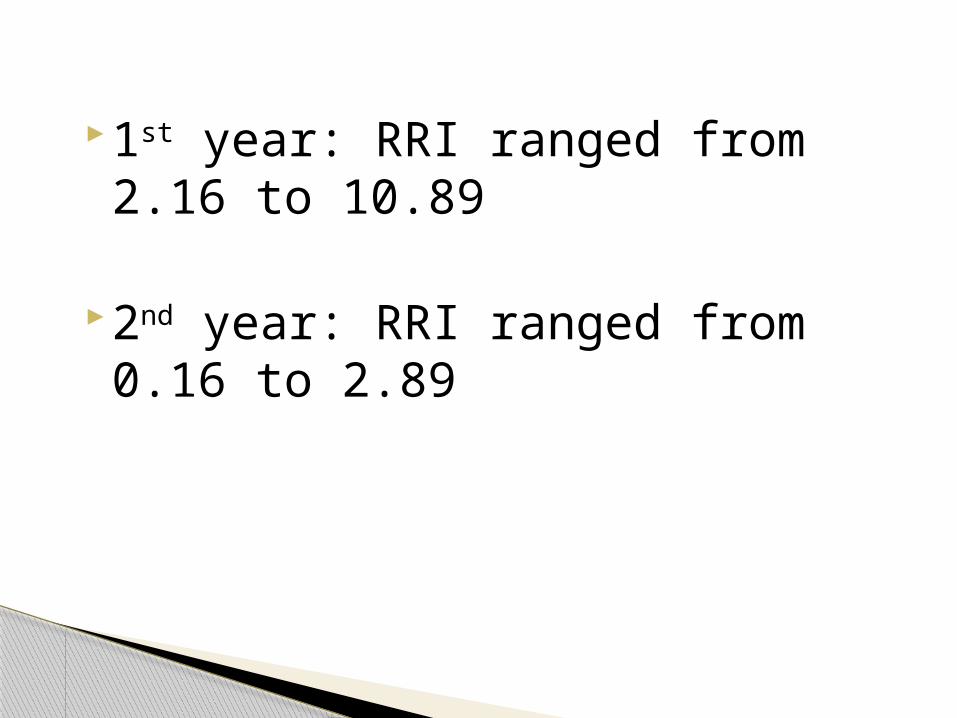
1st year: RRI ranged from 2.16 to 10.89
2nd year: RRI ranged from 0.16 to 2.89
Looked closely at the10 most improved items for each of these schools.
For each school, rank ordered all the items on the EBS Survey by how much the school’s rating improved.
Found that schools’ “most improved” items varied considerably from one school to another.
Despite this variability, the following three items were listed most often as “most improved” items:
Patterns of student problem behaviors are reported to teams and faculty for active decision-making on a regular basis (e.g., monthly).
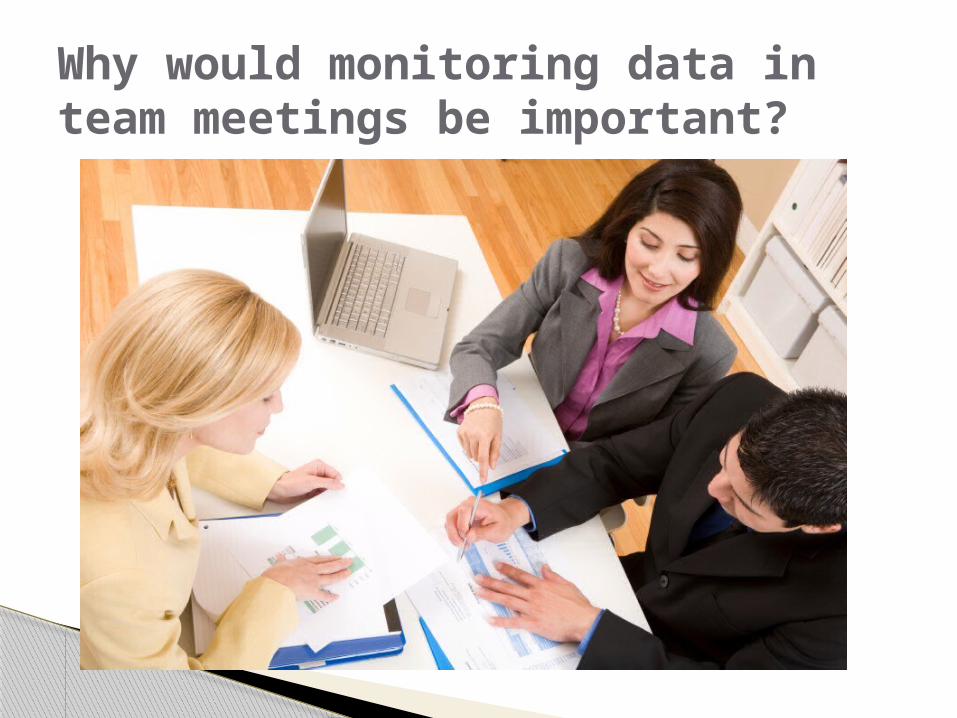
Why would monitoring data in team meetings be important?
Disaggregated by race and ethnicity! Use the SWIS Ethnicity Report (Vincent, 2008)! Get others involved!
Data-based decision-making!
The school team has access to on-going training and support from district personnel.
Some school districts have Positive Behavior Intervention and Support leadership teams that provide training, coaching, evaluation, and coordination to schools (see http://www.pbis.org/school/district_level.aspx ).
Why would ongoing training & district support be important?
Local resources are used to conduct functional assessment-based behavior support planning (~10 hrs/week/student).

Why would local resources for be support planning be important?
Referrals for fighting at recess went down dramatically when a school improved its procedures for individualized behavior support (Tobin, 2008)
We know that helping parents understand what a functional behavioral assessment is – and involving the parents in planning for behavior support across home and school – helps improve behavior (Tobin, 2005).
SWPBS is a 3-tiered model! (Tobin, Lewis-Palmer, & Sugai, 2002; Tobin, Rossetto Dickey, Horner, & Sugai, 2008).
Local resources can make a big difference in teachers’ use of function-based, positive behavior support instead of discipline referrals (Crone, Hawken, & Bergstrom, 2007; Crone, Horner, & Hawken, 2004; Crone, Horner, & Hawken, in press; Tobin & Martin, 2001).
I’m convinced of the value of behavior support plans based on functional assessments!
Expected student behaviors should be acknowledged regularly (positively reinforced) (>4 positives to 1 negative) in the classroom.
Transitions between instructional and non-instructional activities in the classroom should be efficient and orderly.
Patterns of student problem behaviors should be reported to teams and faculty for active decision-making on a regular basis (e.g., monthly), disaggregated by ethnicity and race --could use the SWIS Ethnicity Report and look at the RRI too!
The school team has access to on-going training and support from district personnel.
Local resources are used to conduct functional assessment-based behavior support planning (~10 hrs/week/student).
Summary of 5 Best Strategies:
More research is needed to describe how acknowledgement of expected student behavior can be delivered in a culturally appropriate manner.
Add data from direct observations and interviews to data from records.
Future research could benefit from more complete ethnicity data, especially in light of the new federal regulations on reporting race and ethnicity that will take effect in 2010-2011 (National Forum on Educational Statistics, 2008).
Recommendations for future research
American Academy of Pediatrics Committee on School Health. (2003). Out-of-school suspension and expulsion. Pediatrics, 112, 1206-1209. Retrieved from http://pediatrics.aappublications.org/cgi/content/full/112/5/1206
Cartledge, G. & Johnson, C.T. (2004). School violence and cultural sensitivity. In J. C. Conoley & A. P. Goldstein (Eds.) School violence intervention: A practical handbook. 2nd ed. (pp. 441-482). New York: Guilford Press.
Cartledge, G. & Milburn, J.F. (1996). Cultural diversity and social skill instruction: Understanding ethnic and gender differences. Champaign, IL; Research Press. Cartledge, G. & Kourea, L. (2008). Culturally responsive classrooms for culturally diverse students with and at risk for disabilities. Exceptional Children 74(3), 351-371.
Cartledge, G., Sentelle, J., Loe, S., Lambert, M.C., & Reed, E.S. (2001). To be young, gifted, and black? A case study of positive interventions within an inner-city classroom of African American students. Journal of Negro Education, 70(4), 243-254.
Cartledge, G., Singh, A., & Gibson, L. (2008). Practical behavior-management techniques to close the accessibility gap for students who are culturally and linguistically diverse. Preventing School Failure 52(3), 29- 38.
Crone, D., Hawken, L., & Bergstrom, M. (2007). A demonstration of training, implementing and using functional behavioral assessment in 10 elementary and middle school settings. Journal of Positive Behavior Interventions, 9, 15-29.
Crone, D. A., Horner, R. H., Hawken, L. S. (2004). Responding to problem behavior in schools: The Behavior Education Program. The Guilford Practical Intervention in the Schools Series. New York: Guilford Press.
Crone, D., Hawken, L., & Horner, R. (in press). Responding to problem behavior in schools, Second Edition: The Behavior Education Program. The Guilford Practical Intervention in the Schools Series. New York: Guilford Press.
References
Fletcher, J. (2008). Adolescent depression: Diagnosis, treatment, and educational attainment. Health Economics, 17, 1215-1235.
Hershfeldt, P. A., Sechrest, R., Pell, K. L.,Rosenberg, M. S., Bradshaw, C. P., & Leaf, P. J. (2009). Double-Check: A framework of cultural responsiveness applied to classroom behavior. TEACHING Exceptional Children Plus, 6(2) Article 5. Retrieved from http://escholarship.bc.edu/education/tecplus/vol6/iss2/art5
Lewis, T. J., & Sugai, G. (1999). Effective behavior support: A systems approach to proactive school-wide management. Focus on Exceptional Children, 31(6), 1-24.
May, S., Ard, W., Todd, A. W., Horner, R. H., Glasgow, A., Sugai, G., & Sprague, J. R. (2006). School-wide information system. Eugene: Educational and Community Supports, University of Oregon.
McLaughlin, K. A., Hilt, L. M., & Nolen-Hoeksema, S. (2007). Racial/ethnic differences in internalizing and externalizing symptoms in adolescents. Journal of Abnormal Psychology, 35, 801-816.
National Forum on Educational Statistics, Race/Ethnicity Data Implementation Task Force. (2008). Managing an identity crisis: Forum guide to implementing new federal race and ethnicity categories (NFES 2008-802). Washington, DC: National Center for Educational Statistics, Institute of Education Sciences, U.S. Department of Education.
Raffaele Mendez, L. M., & Knoff, H. M. (2003). Who gets suspended from school and why: A demographic analysis of schools and disciplinary infractions in a large school district. Education and Treatment of Children, 26(1), 30-51.
Sailor, W., Dunlap, G., Sugai, G., & Horner, R. (Eds.). (2009). Handbook of Positive Behavior Supports. A volume in the Issues in Clinical Child Psychology series, M. Roberts (Series Ed.). New York: Springer.
Skiba, R. J., Horner, R. H., Chung, C., Rausch, M. K., May, S., & Tobin, T. (in review). Race is not neutral: A national investigation of African American and Latino disproportionality in school discipline.
Skiba, R.J., Michael, R.S., Nardo, A.C., & Peterson, R. (2002). The color of discipline: Sources of racial and gender disproportionality in school punishment. Urban Review, 34, 317-342.
Skiba, R.J., Poloni-Staudinger, L., Simmons, A., Feggins-Azziz, L. & Chung, C. (2005). Unproven links: Can poverty explain ethnic disproportionality in special education? Journal of Special Education, 39, 130-144.
Sugai, G., Horner, R.H., & Todd, A. (2000) Effective Behavior Support Self-Assessment Survey (EBS-SAS). Eugene, OR: University of Oregon.
Tobin, T. J. (2008). Will functional interventions in versatile environments reduce dangerous behaviors? Journal of Behavior Analysis of Offender and Victim Treatment and Prevention,1, 171-186.
Tobin, T. J. (2005). Parents’ guide to functional assessment (Third edition). University of Oregon, College of Education, Educational and Community Supports, Eugene. Retrieved August 8, 2009, from http://uoregon.edu/~ttobin/Tobin-par-3.pdf as “Parents’ Guide, 3rd Edition.”
Tobin, T. J., Lewis-Palmer, T., & Sugai, G. (2002). School-wide and individualized effective behavior support: An explanation and an example. Behavior Analyst Today, 3(1), 51-75.
Tobin, T., & Martin, E. (2001). Can discipline referrals be reduced by functional behavioral assessments? East Lansing, MI: National Center for Research on Teacher Learning. (ERIC Document Reproduction Service No. ED 346 082). Retrieved August 8, 2009, from http://uoregon.edu/~ttobin/POSTERhan.htm as “Seven Out of Eight.”
Tobin, T. J., Rossetto Dickey, C., Horner, R. H., & Sugai, G. (2008). Comprehensive implementation of the three-tiered prevention approach to schoolwide behavior support: An Oregon case study. In C. R. Greenwood, T. R. Kratochwill, & M. Clements (Eds.), Schoolwide prevention models: Lessons learned in elementary schools (pp. 87-114). New York: Guilford.
U.S. Department of Education (October 19, 2007). Final guidance on maintaining, collecting, and reporting racial and ethnic data to the U.S. Department of Education. Federal Register at http://www.ed.gov/legislation/FedRegister/other/2007-4/101907c.pdf
Vincent, C. G. (2008). Schools’ use of SWIS to examine their ODR patterns across ethnic categories. Research Brief. Eugene: University of Oregon, Educational and Community Supports.
Vincent, C.G. & Tobin, T.J. (in review). The relationship between implementation of school-wide positive behavior support and disciplinary exclusion of students from various ethnic backgrounds with and without disabilities.


![Some Stuxnet Related Comments [excerpted from a longer presentation] Joe St Sauver, Ph.D. joe@uoregon.edu](https://img.pdfslide.net/doc/110x75/56649c945503460f9494fe46/some-stuxnet-related-comments-excerpted-from-a-longer-presentation-joe-st.jpg)