Embed Size (px)
Citation preview
Global Macroeconomic Updates - as of 13-9-2019
GDP yoy GDP qoq Interest Rate Inflation Jobless Debt/GDP
China 6.20% 1.60% 4.25% 2.80% 3.61% 50.50%
Japan 1.20% 0.40% -0.10% 0.50% 2.20% 238.20%
Hong Kong 0.50% -0.40% 2.50% 3.30% 2.90% 38.40%
Malaysia 4.90% 1.00% 3.00% 1.40% 3.30% 51.80%
Singapore 0.10% -3.30% 1.94% 0.40% 2.20% 112.20%
Thailand 2.30% 0.60% 1.50% 0.52% 1.10% 41.80%
Indonesia 5.05% 4.20% 5.50% 3.49% 5.01% 29.80%
U.K. 1.20% -0.20% 0.75% 2.10% 3.90% 84.70%
Germany 0.40% -0.10% 0.00% 1.40% 3.00% 60.90%
France 1.40% 0.30% 0.00% 1.10% 8.50% 98.40%
Euro Area 1.10% 0.20% 0.00% 1.00% 7.50% 85.10%
U.S. 2.30% 2.00% 2.25% 1.80% 3.70% 106.10%
Source : tradingeconomics.com
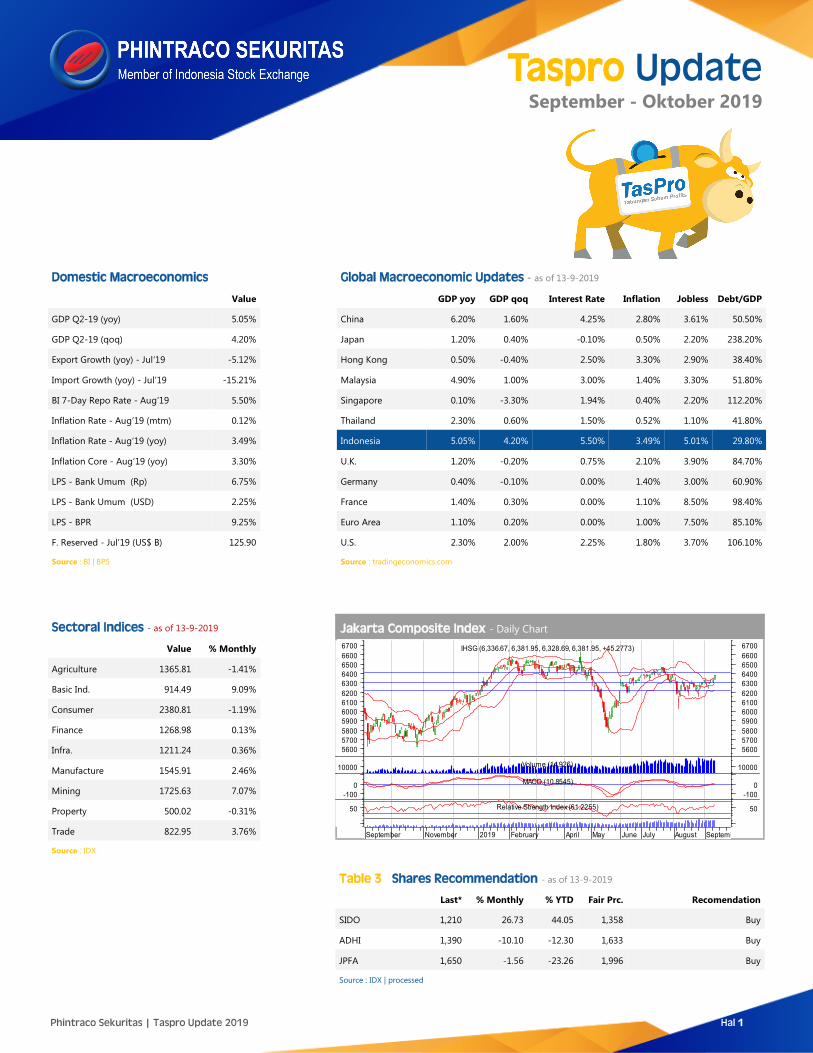
Jakarta Composite Index - Daily Chart
Sectoral Indices - as of 13-9-2019
Value % Monthly
Agriculture 1365.81 -1.41%
Basic Ind. 914.49 9.09%
Consumer 2380.81 -1.19%
Finance 1268.98 0.13%
Infra. 1211.24 0.36%
Manufacture 1545.91 2.46%
Mining 1725.63 7.07%
Property 500.02 -0.31%
Trade 822.95 3.76%
Source : IDX
Table 3 Shares Recommendation - as of 13-9-2019
Last* % Monthly % YTD Fair Prc. Recomendation
SIDO 1,210 26.73 44.05 1,358 Buy
ADHI 1,390 -10.10 -12.30 1,633 Buy
JPFA 1,650 -1.56 -23.26 1,996 Buy
Source : IDX | processed
Domestic Macroeconomics
Value
GDP Q2-19 (yoy) 5.05%
GDP Q2-19 (qoq) 4.20%
Export Growth (yoy) - Jul‘19 -5.12%
Import Growth (yoy) - Jul’19 -15.21%
BI 7-Day Repo Rate - Aug‘19 5.50%
Inflation Rate - Aug‘19 (mtm) 0.12%
Inflation Rate - Aug‘19 (yoy) 3.49%
Inflation Core - Aug‘19 (yoy) 3.30%
LPS - Bank Umum (Rp) 6.75%
LPS - Bank Umum (USD) 2.25%
LPS - BPR 9.25%
F. Reserved - Jul‘19 (US$ B) 125.90
Source : BI | BPS
Taspro Update
Phintraco Sekuritas | Taspro Update 2019 Hal 1
September - Oktober 2019
August September November 2019 February April May June July August September
50 50Relative Strength Index (61.2255)
-100
0
-100
0MACD (10.8545)
10000 10000Volume (14,926)
5600
5700
5800
5900
6000
6100
6200
6300
6400
6500
6600
6700
5600
5700
5800
5900
6000
6100
6200
6300
6400
6500
6600
6700IHSG (6,336.67, 6,381.95, 6,328.69, 6,381.95, +45.2773)
Major Shareholders
%
PT Hotel Candi Baru 81.60%
Public <5% 18.40%
Total 100%
Source : www.sidomuncul.com | IDX | as of 13-9-2019
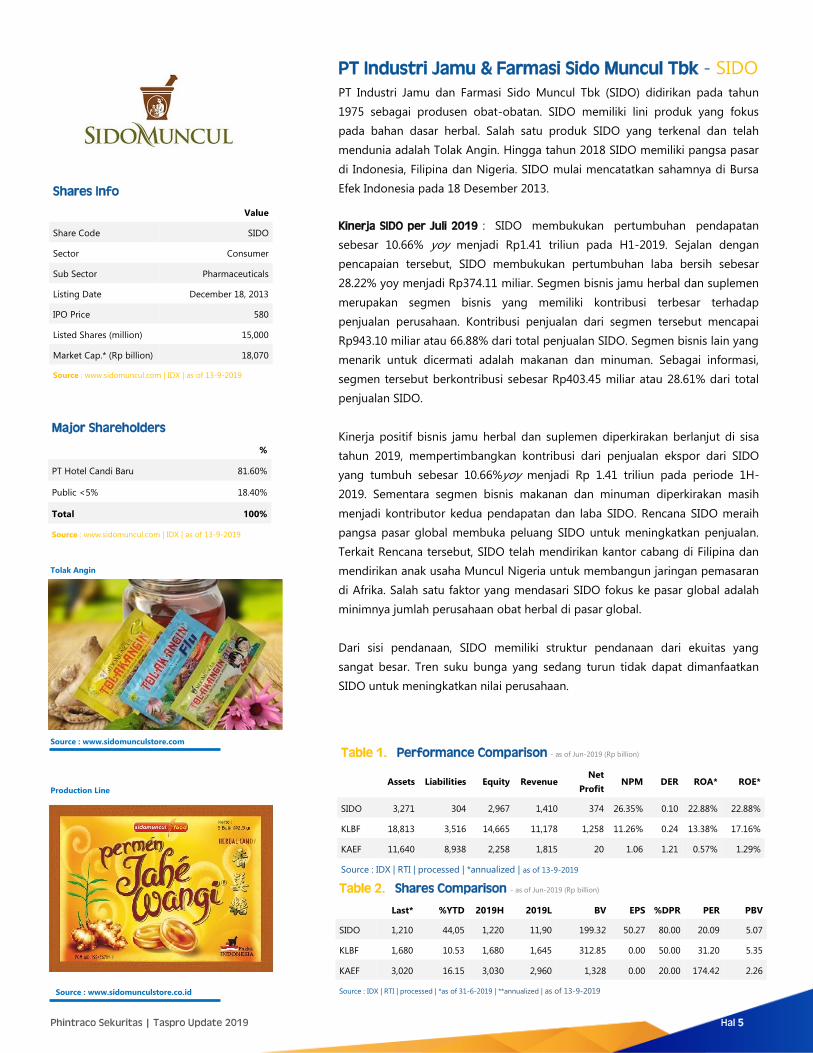
PT Industri Jamu & Farmasi Sido Muncul Tbk - SIDO
PT Industri Jamu dan Farmasi Sido Muncul Tbk (SIDO) didirikan pada tahun
1975 sebagai produsen obat-obatan. SIDO memiliki lini produk yang fokus
pada bahan dasar herbal. Salah satu produk SIDO yang terkenal dan telah
mendunia adalah Tolak Angin. Hingga tahun 2018 SIDO memiliki pangsa pasar
di Indonesia, Filipina dan Nigeria. SIDO mulai mencatatkan sahamnya di Bursa
Efek Indonesia pada 18 Desember 2013.
Kinerja SIDO per Juli 2019 : SIDO membukukan pertumbuhan pendapatan
sebesar 10.66% yoy menjadi Rp1.41 triliun pada H1-2019. Sejalan dengan
pencapaian tersebut, SIDO membukukan pertumbuhan laba bersih sebesar
28.22% yoy menjadi Rp374.11 miliar. Segmen bisnis jamu herbal dan suplemen
merupakan segmen bisnis yang memiliki kontribusi terbesar terhadap
penjualan perusahaan. Kontribusi penjualan dari segmen tersebut mencapai
Rp943.10 miliar atau 66.88% dari total penjualan SIDO. Segmen bisnis lain yang
menarik untuk dicermati adalah makanan dan minuman. Sebagai informasi,
segmen tersebut berkontribusi sebesar Rp403.45 miliar atau 28.61% dari total
penjualan SIDO.
Kinerja positif bisnis jamu herbal dan suplemen diperkirakan berlanjut di sisa
tahun 2019, mempertimbangkan kontribusi dari penjualan ekspor dari SIDO
yang tumbuh sebesar 10.66%yoy menjadi Rp 1.41 triliun pada periode 1H-
2019. Sementara segmen bisnis makanan dan minuman diperkirakan masih
menjadi kontributor kedua pendapatan dan laba SIDO. Rencana SIDO meraih
pangsa pasar global membuka peluang SIDO untuk meningkatkan penjualan.
Terkait Rencana tersebut, SIDO telah mendirikan kantor cabang di Filipina dan
mendirikan anak usaha Muncul Nigeria untuk membangun jaringan pemasaran
di Afrika. Salah satu faktor yang mendasari SIDO fokus ke pasar global adalah
minimnya jumlah perusahaan obat herbal di pasar global.
Dari sisi pendanaan, SIDO memiliki struktur pendanaan dari ekuitas yang
sangat besar. Tren suku bunga yang sedang turun tidak dapat dimanfaatkan
SIDO untuk meningkatkan nilai perusahaan.
Shares Info
Value
Share Code SIDO
Sector Consumer
Sub Sector Pharmaceuticals
Listing Date December 18, 2013
IPO Price 580
Listed Shares (million) 15,000
Market Cap.* (Rp billion) 18,070
Source : www.sidomuncul.com | IDX | as of 13-9-2019
Phintraco Sekuritas | Taspro Update 2019 Hal 5
Table 2. Shares Comparison - as of Jun-2019 (Rp billion)
Last* %YTD 2019H 2019L BV EPS %DPR PER PBV
SIDO 1,210 44,05 1,220 11,90 199.32 50.27 80.00 20.09 5.07
KLBF 1,680 10.53 1,680 1,645 312.85 0.00 50.00 31.20 5.35
KAEF 3,020 16.15 3,030 2,960 1,328 0.00 20.00 174.42 2.26
Source : IDX | RTI | processed | *as of 31-6-2019 | **annualized | as of 13-9-2019
Table 1. Performance Comparison - as of Jun-2019 (Rp billion)
Assets Liabilities Equity Revenue Net
Profit NPM DER ROA* ROE*
SIDO 3,271 304 2,967 1,410 374 26.35% 0.10 22.88% 22.88%
KLBF 18,813 3,516 14,665 11,178 1,258 11.26% 0.24 13.38% 17.16%
KAEF 11,640 8,938 2,258 1,815 20 1.06 1.21 0.57% 1.29%
Source : IDX | RTI | processed | *annualized | as of 13-9-2019
Tolak Angin
Source : www.sidomunculstore.com
Production Line
Source : www.sidomunculstore.co.id
PT Industri Jamu dan Farmasi Sido Muncul,Tbk - SIDO
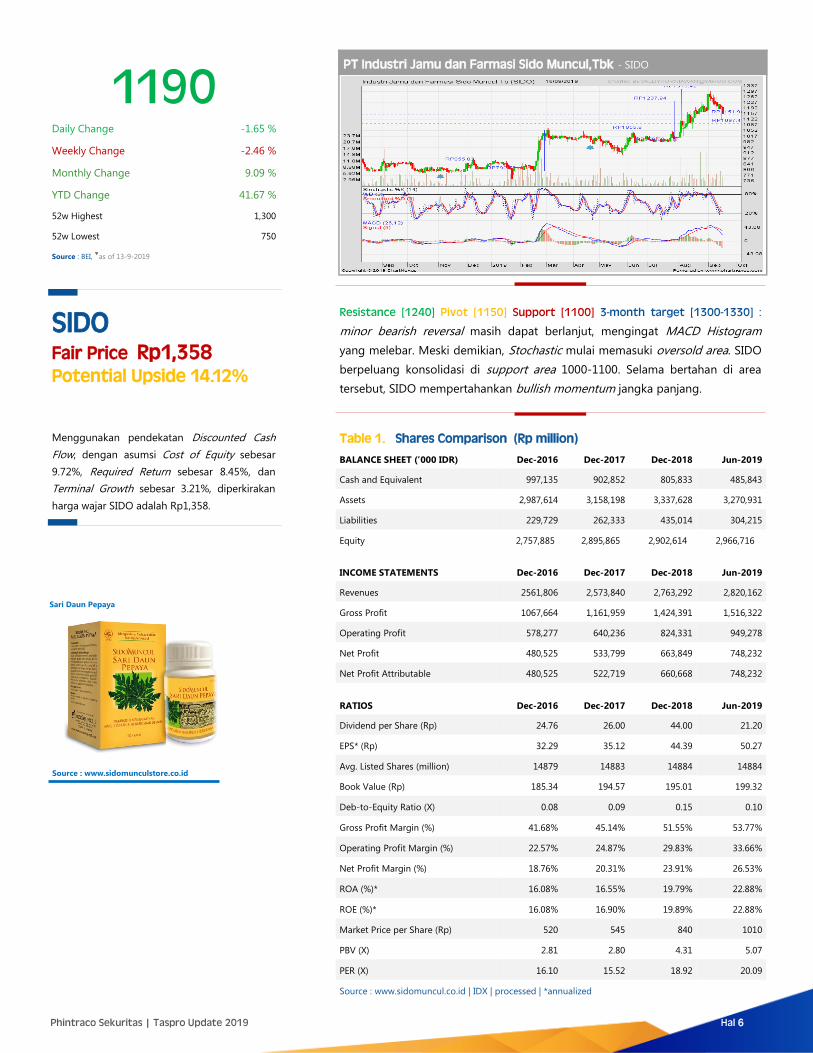
1190 Daily Change -1.65 %
Weekly Change -2.46 %
Monthly Change 9.09 %
YTD Change 41.67 %
52w Highest 1,300
52w Lowest 750
Source : BEI, as of 13-9-2019
Resistance [1240] Pivot [1150] Support [1100] 3-month target [1300-1330] :
minor bearish reversal masih dapat berlanjut, mengingat MACD Histogram
yang melebar. Meski demikian, Stochastic mulai memasuki oversold area. SIDO
berpeluang konsolidasi di support area 1000-1100. Selama bertahan di area
tersebut, SIDO mempertahankan bullish momentum jangka panjang.
Phintraco Sekuritas | Taspro Update 2019 Hal 6
Table 1. Shares Comparison (Rp million)
BALANCE SHEET (’000 IDR) Dec-2016 Dec-2017 Dec-2018 Jun-2019
Cash and Equivalent 997,135 902,852 805,833 485,843
Assets 2,987,614 3,158,198 3,337,628 3,270,931
Liabilities 229,729 262,333 435,014 304,215
Equity 2,757,885 2,895,865 2,902,614 2,966,716
INCOME STATEMENTS Dec-2016 Dec-2017 Dec-2018 Jun-2019
Revenues 2561,806 2,573,840 2,763,292 2,820,162
Gross Profit 1067,664 1,161,959 1,424,391 1,516,322
Operating Profit 578,277 640,236 824,331 949,278
Net Profit 480,525 533,799 663,849 748,232
Net Profit Attributable 480,525 522,719 660,668 748,232
RATIOS Dec-2016 Dec-2017 Dec-2018 Jun-2019
Dividend per Share (Rp) 24.76 26.00 44.00 21.20
EPS* (Rp) 32.29 35.12 44.39 50.27
Avg. Listed Shares (million) 14879 14883 14884 14884
Book Value (Rp) 185.34 194.57 195.01 199.32
Deb-to-Equity Ratio (X) 0.08 0.09 0.15 0.10
Gross Profit Margin (%) 41.68% 45.14% 51.55% 53.77%
Operating Profit Margin (%) 22.57% 24.87% 29.83% 33.66%
Net Profit Margin (%) 18.76% 20.31% 23.91% 26.53%
ROA (%)* 16.08% 16.55% 19.79% 22.88%
ROE (%)* 16.08% 16.90% 19.89% 22.88%
Market Price per Share (Rp) 520 545 840 1010
PBV (X) 2.81 2.80 4.31 5.07
PER (X) 16.10 15.52 18.92 20.09
Source : www.sidomuncul.co.id | IDX | processed | *annualized
SIDO Fair Price Rp1,358 Potential Upside 14.12%
Menggunakan pendekatan Discounted Cash
Flow, dengan asumsi Cost of Equity sebesar
9.72%, Required Return sebesar 8.45%, dan
Terminal Growth sebesar 3.21%, diperkirakan
harga wajar SIDO adalah Rp1,358.
Sari Daun Pepaya
Source : www.sidomunculstore.co.id
Major Shareholders
%
PT Japfa Ltd 52.43%
Treasury Stock 0.06%
Public <5% 47.51%
Total 100%
Source : www.japfacomfeed.co.id | IDX | as of 13-9-2019
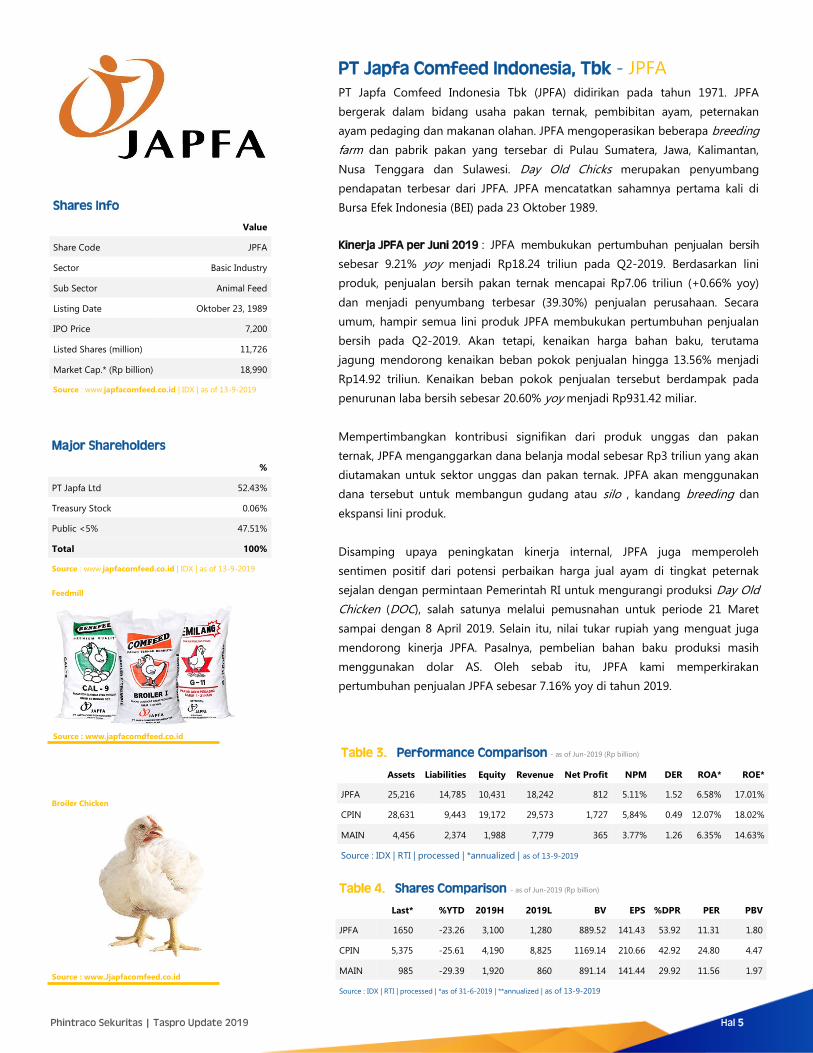
PT Japfa Comfeed Indonesia, Tbk - JPFA
PT Japfa Comfeed Indonesia Tbk (JPFA) didirikan pada tahun 1971. JPFA
bergerak dalam bidang usaha pakan ternak, pembibitan ayam, peternakan
ayam pedaging dan makanan olahan. JPFA mengoperasikan beberapa breeding
farm dan pabrik pakan yang tersebar di Pulau Sumatera, Jawa, Kalimantan,
Nusa Tenggara dan Sulawesi. Day Old Chicks merupakan penyumbang
pendapatan terbesar dari JPFA. JPFA mencatatkan sahamnya pertama kali di
Bursa Efek Indonesia (BEI) pada 23 Oktober 1989.
Kinerja JPFA per Juni 2019 : JPFA membukukan pertumbuhan penjualan bersih
sebesar 9.21% yoy menjadi Rp18.24 triliun pada Q2-2019. Berdasarkan lini
produk, penjualan bersih pakan ternak mencapai Rp7.06 triliun (+0.66% yoy)
dan menjadi penyumbang terbesar (39.30%) penjualan perusahaan. Secara
umum, hampir semua lini produk JPFA membukukan pertumbuhan penjualan
bersih pada Q2-2019. Akan tetapi, kenaikan harga bahan baku, terutama
jagung mendorong kenaikan beban pokok penjualan hingga 13.56% menjadi
Rp14.92 triliun. Kenaikan beban pokok penjualan tersebut berdampak pada
penurunan laba bersih sebesar 20.60% yoy menjadi Rp931.42 miliar.
Mempertimbangkan kontribusi signifikan dari produk unggas dan pakan
ternak, JPFA menganggarkan dana belanja modal sebesar Rp3 triliun yang akan
diutamakan untuk sektor unggas dan pakan ternak. JPFA akan menggunakan
dana tersebut untuk membangun gudang atau silo , kandang breeding dan
ekspansi lini produk.
Disamping upaya peningkatan kinerja internal, JPFA juga memperoleh
sentimen positif dari potensi perbaikan harga jual ayam di tingkat peternak
sejalan dengan permintaan Pemerintah RI untuk mengurangi produksi Day Old
Chicken (DOC), salah satunya melalui pemusnahan untuk periode 21 Maret
sampai dengan 8 April 2019. Selain itu, nilai tukar rupiah yang menguat juga
mendorong kinerja JPFA. Pasalnya, pembelian bahan baku produksi masih
menggunakan dolar AS. Oleh sebab itu, JPFA kami memperkirakan
pertumbuhan penjualan JPFA sebesar 7.16% yoy di tahun 2019.
Shares Info
Value
Share Code JPFA
Sector Basic Industry
Sub Sector Animal Feed
Listing Date Oktober 23, 1989
IPO Price 7,200
Listed Shares (million) 11,726
Market Cap.* (Rp billion) 18,990
Source : www.japfacomfeed.co.id | IDX | as of 13-9-2019
Phintraco Sekuritas | Taspro Update 2019 Hal 5
Table 4. Shares Comparison - as of Jun-2019 (Rp billion)
Last* %YTD 2019H 2019L BV EPS %DPR PER PBV
JPFA 1650 -23.26 3,100 1,280 889.52 141.43 53.92 11.31 1.80
CPIN 5,375 -25.61 4,190 8,825 1169.14 210.66 42.92 24.80 4.47
MAIN 985 -29.39 1,920 860 891.14 141.44 29.92 11.56 1.97
Source : IDX | RTI | processed | *as of 31-6-2019 | **annualized | as of 13-9-2019
Table 3. Performance Comparison - as of Jun-2019 (Rp billion)
Assets Liabilities Equity Revenue Net Profit NPM DER ROA* ROE*
JPFA 25,216 14,785 10,431 18,242 812 5.11% 1.52 6.58% 17.01%
CPIN 28,631 9,443 19,172 29,573 1,727 5,84% 0.49 12.07% 18.02%
MAIN 4,456 2,374 1,988 7,779 365 3.77% 1.26 6.35% 14.63%
Source : IDX | RTI | processed | *annualized | as of 13-9-2019
Feedmill
Source : www.japfacomdfeed.co.id
Broiler Chicken
Source : www.Jjapfacomfeed.co.id
PT Japfa Comfeed Indonesia, Tbk - JPFA
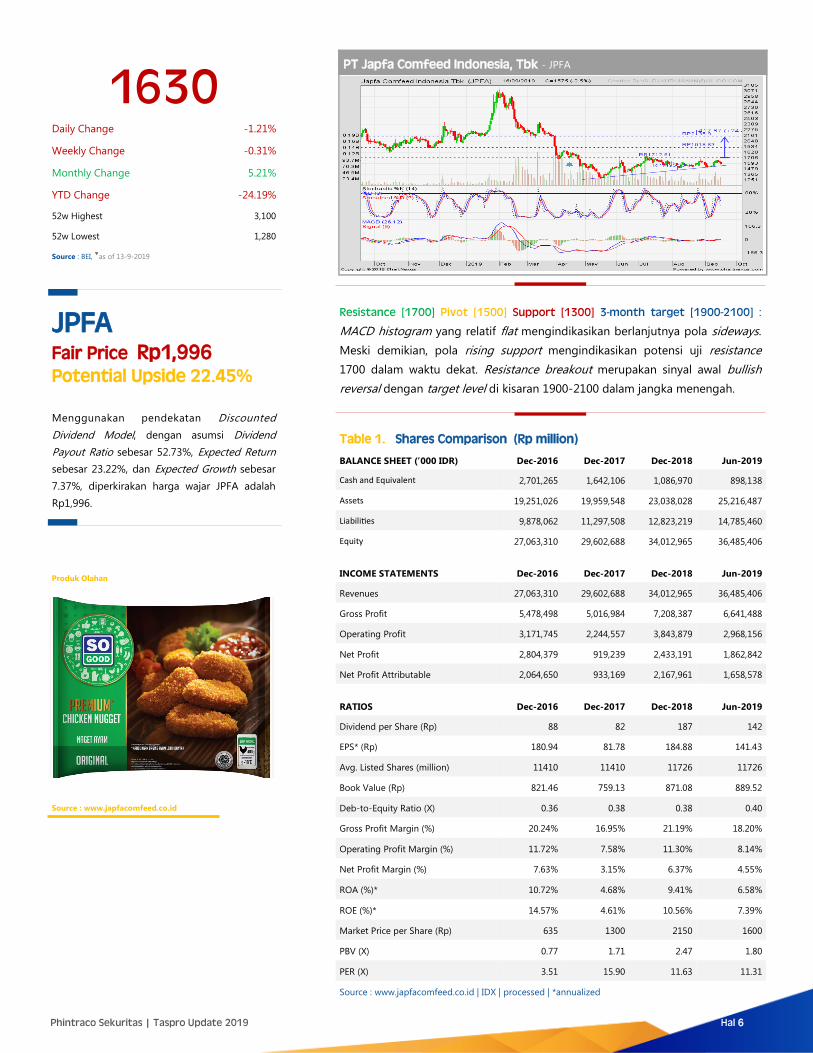
1630 Daily Change -1.21%
Weekly Change -0.31%
Monthly Change 5.21%
YTD Change -24.19%
52w Highest 3,100
52w Lowest 1,280
Source : BEI, as of 13-9-2019
Resistance [1700] Pivot [1500] Support [1300] 3-month target [1900-2100] :
MACD histogram yang relatif flat mengindikasikan berlanjutnya pola sideways.
Meski demikian, pola rising support mengindikasikan potensi uji resistance
1700 dalam waktu dekat. Resistance breakout merupakan sinyal awal bullish
reversal dengan target level di kisaran 1900-2100 dalam jangka menengah.
Phintraco Sekuritas | Taspro Update 2019 Hal 6
Table 1. Shares Comparison (Rp million)
BALANCE SHEET (’000 IDR) Dec-2016 Dec-2017 Dec-2018 Jun-2019
Cash and Equivalent 2,701,265 1,642,106 1,086,970 898,138
Assets 19,251,026 19,959,548 23,038,028 25,216,487
Liabilities 9,878,062 11,297,508 12,823,219 14,785,460
Equity 27,063,310 29,602,688 34,012,965 36,485,406
INCOME STATEMENTS Dec-2016 Dec-2017 Dec-2018 Jun-2019
Revenues 27,063,310 29,602,688 34,012,965 36,485,406
Gross Profit 5,478,498 5,016,984 7,208,387 6,641,488
Operating Profit 3,171,745 2,244,557 3,843,879 2,968,156
Net Profit 2,804,379 919,239 2,433,191 1,862,842
Net Profit Attributable 2,064,650 933,169 2,167,961 1,658,578
RATIOS Dec-2016 Dec-2017 Dec-2018 Jun-2019
Dividend per Share (Rp) 88 82 187 142
EPS* (Rp) 180.94 81.78 184.88 141.43
Avg. Listed Shares (million) 11410 11410 11726 11726
Book Value (Rp) 821.46 759.13 871.08 889.52
Deb-to-Equity Ratio (X) 0.36 0.38 0.38 0.40
Gross Profit Margin (%) 20.24% 16.95% 21.19% 18.20%
Operating Profit Margin (%) 11.72% 7.58% 11.30% 8.14%
Net Profit Margin (%) 7.63% 3.15% 6.37% 4.55%
ROA (%)* 10.72% 4.68% 9.41% 6.58%
ROE (%)* 14.57% 4.61% 10.56% 7.39%
Market Price per Share (Rp) 635 1300 2150 1600
PBV (X) 0.77 1.71 2.47 1.80
PER (X) 3.51 15.90 11.63 11.31
Source : www.japfacomfeed.co.id | IDX | processed | *annualized
JPFA Fair Price Rp1,996 Potential Upside 22.45%
Menggunakan pendekatan Discounted
Dividend Model, dengan asumsi Dividend
Payout Ratio sebesar 52.73%, Expected Return
sebesar 23.22%, dan Expected Growth sebesar
7.37%, diperkirakan harga wajar JPFA adalah
Rp1,996.
Produk Olahan
Source : www.japfacomfeed.co.id
Major Shareholders
%
Pemerintah Republik Indonesia 51.00%
Public <5% 49.00%
Total 100%
Source : www.adhi.co.id| IDX | as of 13-9-2019
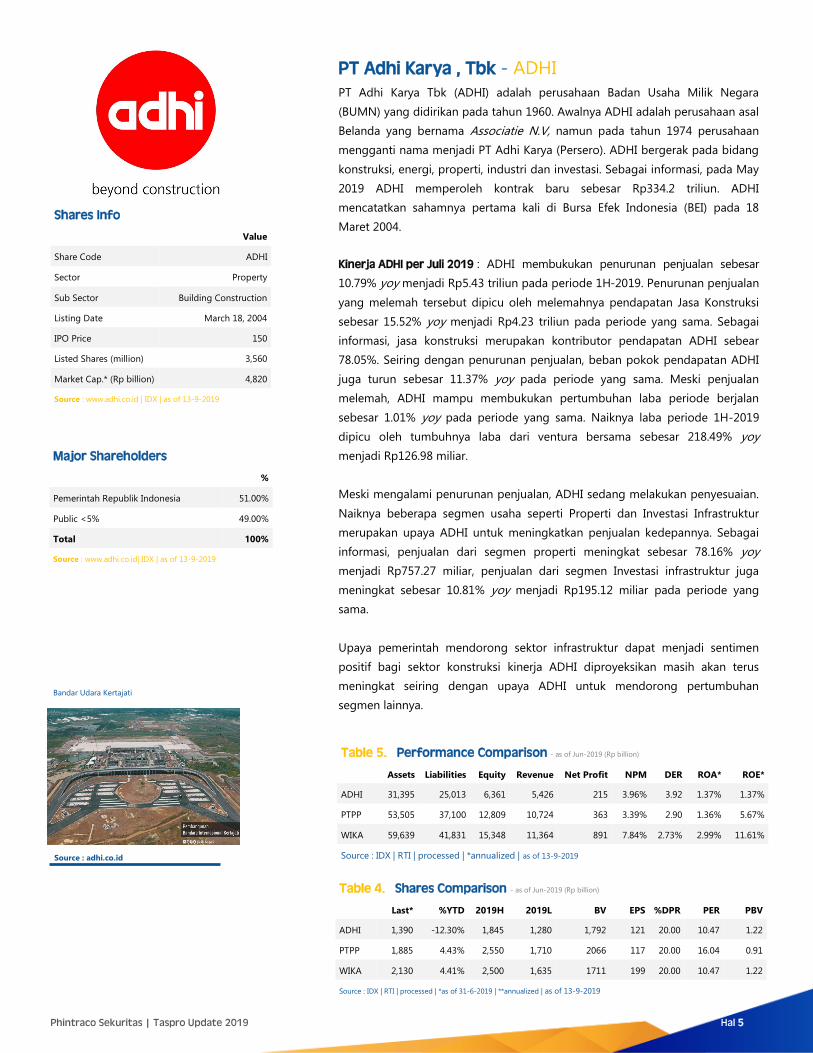
PT Adhi Karya , Tbk - ADHI
PT Adhi Karya Tbk (ADHI) adalah perusahaan Badan Usaha Milik Negara
(BUMN) yang didirikan pada tahun 1960. Awalnya ADHI adalah perusahaan asal
Belanda yang bernama Associatie N.V, namun pada tahun 1974 perusahaan
mengganti nama menjadi PT Adhi Karya (Persero). ADHI bergerak pada bidang
konstruksi, energi, properti, industri dan investasi. Sebagai informasi, pada May
2019 ADHI memperoleh kontrak baru sebesar Rp334.2 triliun. ADHI
mencatatkan sahamnya pertama kali di Bursa Efek Indonesia (BEI) pada 18
Maret 2004.
Kinerja ADHI per Juli 2019 : ADHI membukukan penurunan penjualan sebesar
10.79% yoy menjadi Rp5.43 triliun pada periode 1H-2019. Penurunan penjualan
yang melemah tersebut dipicu oleh melemahnya pendapatan Jasa Konstruksi
sebesar 15.52% yoy menjadi Rp4.23 triliun pada periode yang sama. Sebagai
informasi, jasa konstruksi merupakan kontributor pendapatan ADHI sebear
78.05%. Seiring dengan penurunan penjualan, beban pokok pendapatan ADHI
juga turun sebesar 11.37% yoy pada periode yang sama. Meski penjualan
melemah, ADHI mampu membukukan pertumbuhan laba periode berjalan
sebesar 1.01% yoy pada periode yang sama. Naiknya laba periode 1H-2019
dipicu oleh tumbuhnya laba dari ventura bersama sebesar 218.49% yoy
menjadi Rp126.98 miliar.
Meski mengalami penurunan penjualan, ADHI sedang melakukan penyesuaian.
Naiknya beberapa segmen usaha seperti Properti dan Investasi Infrastruktur
merupakan upaya ADHI untuk meningkatkan penjualan kedepannya. Sebagai
informasi, penjualan dari segmen properti meningkat sebesar 78.16% yoy
menjadi Rp757.27 miliar, penjualan dari segmen Investasi infrastruktur juga
meningkat sebesar 10.81% yoy menjadi Rp195.12 miliar pada periode yang
sama.
Upaya pemerintah mendorong sektor infrastruktur dapat menjadi sentimen
positif bagi sektor konstruksi kinerja ADHI diproyeksikan masih akan terus
meningkat seiring dengan upaya ADHI untuk mendorong pertumbuhan
segmen lainnya.
Shares Info
Value
Share Code ADHI
Sector Property
Sub Sector Building Construction
Listing Date March 18, 2004
IPO Price 150
Listed Shares (million) 3,560
Market Cap.* (Rp billion) 4,820
Source : www.adhi.co.id | IDX | as of 13-9-2019
Phintraco Sekuritas | Taspro Update 2019 Hal 5
Table 4. Shares Comparison - as of Jun-2019 (Rp billion)
Last* %YTD 2019H 2019L BV EPS %DPR PER PBV
ADHI 1,390 -12.30% 1,845 1,280 1,792 121 20.00 10.47 1.22
PTPP 1,885 4.43% 2,550 1,710 2066 117 20.00 16.04 0.91
WIKA 2,130 4.41% 2,500 1,635 1711 199 20.00 10.47 1.22
Source : IDX | RTI | processed | *as of 31-6-2019 | **annualized | as of 13-9-2019
Table 5. Performance Comparison - as of Jun-2019 (Rp billion)
Assets Liabilities Equity Revenue Net Profit NPM DER ROA* ROE*
ADHI 31,395 25,013 6,361 5,426 215 3.96% 3.92 1.37% 1.37%
PTPP 53,505 37,100 12,809 10,724 363 3.39% 2.90 1.36% 5.67%
WIKA 59,639 41,831 15,348 11,364 891 7.84% 2.73% 2.99% 11.61%
Source : IDX | RTI | processed | *annualized | as of 13-9-2019
Bandar Udara Kertajati
Source : adhi.co.id
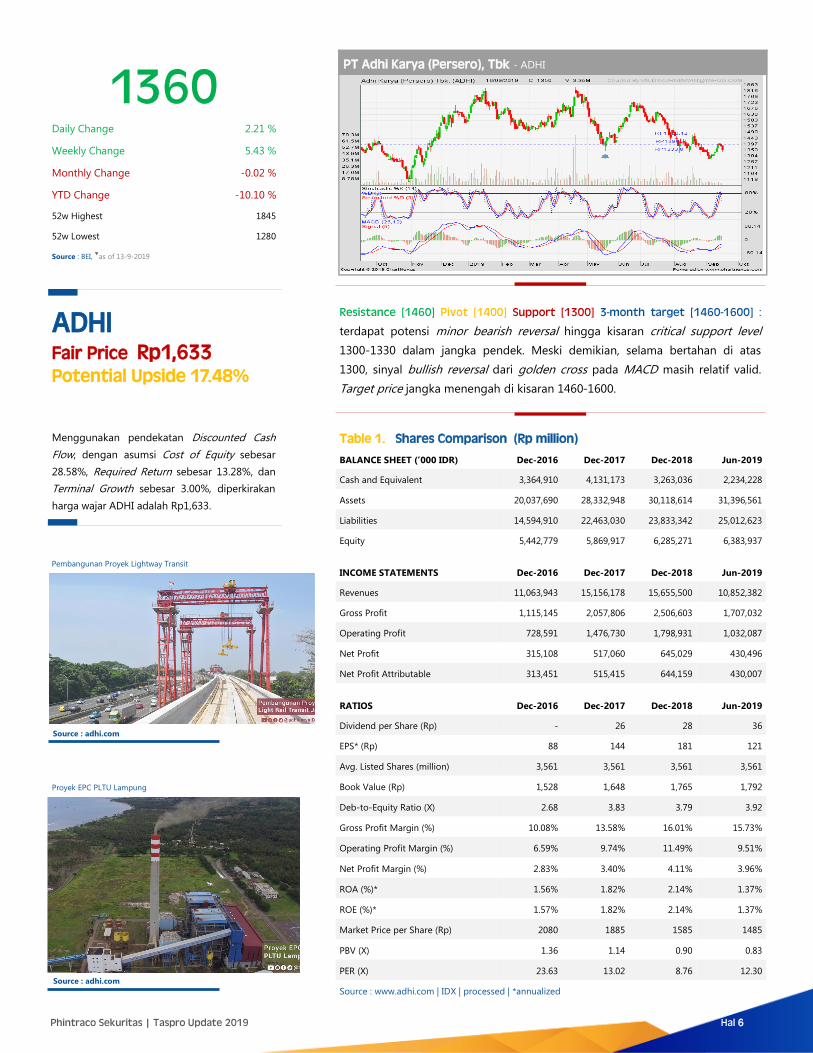
PT Adhi Karya (Persero), Tbk - ADHI
1360 Daily Change 2.21 %
Weekly Change 5.43 %
Monthly Change -0.02 %
YTD Change -10.10 %
52w Highest 1845
52w Lowest 1280
Source : BEI, as of 13-9-2019
Resistance [1460] Pivot [1400] Support [1300] 3-month target [1460-1600] :
terdapat potensi minor bearish reversal hingga kisaran critical support level
1300-1330 dalam jangka pendek. Meski demikian, selama bertahan di atas
1300, sinyal bullish reversal dari golden cross pada MACD masih relatif valid.
Target price jangka menengah di kisaran 1460-1600.
Phintraco Sekuritas | Taspro Update 2019 Hal 6
Table 1. Shares Comparison (Rp million)
BALANCE SHEET (’000 IDR) Dec-2016 Dec-2017 Dec-2018 Jun-2019
Cash and Equivalent 3,364,910 4,131,173 3,263,036 2,234,228
Assets 20,037,690 28,332,948 30,118,614 31,396,561
Liabilities 14,594,910 22,463,030 23,833,342 25,012,623
Equity 5,442,779 5,869,917 6,285,271 6,383,937
INCOME STATEMENTS Dec-2016 Dec-2017 Dec-2018 Jun-2019
Revenues 11,063,943 15,156,178 15,655,500 10,852,382
Gross Profit 1,115,145 2,057,806 2,506,603 1,707,032
Operating Profit 728,591 1,476,730 1,798,931 1,032,087
Net Profit 315,108 517,060 645,029 430,496
Net Profit Attributable 313,451 515,415 644,159 430,007
RATIOS Dec-2016 Dec-2017 Dec-2018 Jun-2019
Dividend per Share (Rp) - 26 28 36
EPS* (Rp) 88 144 181 121
Avg. Listed Shares (million) 3,561 3,561 3,561 3,561
Book Value (Rp) 1,528 1,648 1,765 1,792
Deb-to-Equity Ratio (X) 2.68 3.83 3.79 3.92
Gross Profit Margin (%) 10.08% 13.58% 16.01% 15.73%
Operating Profit Margin (%) 6.59% 9.74% 11.49% 9.51%
Net Profit Margin (%) 2.83% 3.40% 4.11% 3.96%
ROA (%)* 1.56% 1.82% 2.14% 1.37%
ROE (%)* 1.57% 1.82% 2.14% 1.37%
Market Price per Share (Rp) 2080 1885 1585 1485
PBV (X) 1.36 1.14 0.90 0.83
PER (X) 23.63 13.02 8.76 12.30
Source : www.adhi.com | IDX | processed | *annualized
ADHI Fair Price Rp1,633 Potential Upside 17.48%
Menggunakan pendekatan Discounted Cash
Flow, dengan asumsi Cost of Equity sebesar
28.58%, Required Return sebesar 13.28%, dan
Terminal Growth sebesar 3.00%, diperkirakan
harga wajar ADHI adalah Rp1,633.
Pembangunan Proyek Lightway Transit
Source : adhi.com
Proyek EPC PLTU Lampung
Source : adhi.com
DISCLAIMER
This report is provided for information purposes only. It is not a complete analysis of every material fact respecting any company, industry, security or investment. Opinions
expressed are subject to change without notice. Statements of fact have been obtained from sources considered reliable but no representation is made by Phintraco
Sekuritas or any of its affiliates as to their completeness or accuracy. Phintraco Sekuritas in this report, which position may change from time to time, buy or sell such securi-
ties or investments. Phintraco Sekuritas or its affiliates may from time to time perform investment banking or other services for, or solicit in investment banking or other
business from, any company mentioned in this
report. An employee of Phintraco Sekuritas or its
PHINTRACO SEKURITAS
The EAST Tower 16th Floor
Jl. Dr. Ide Anak Agung Gde Agung
Kav. E3.2 No. 1
Mega Kuningan, Jakarta 12950
Call Center : +62 21 2555 6111
P. +62 21 2555 6138
F. +62 21 2555 6139
www.phintracosekuritas.com
Kantor Cabang & Mitra GI BEI
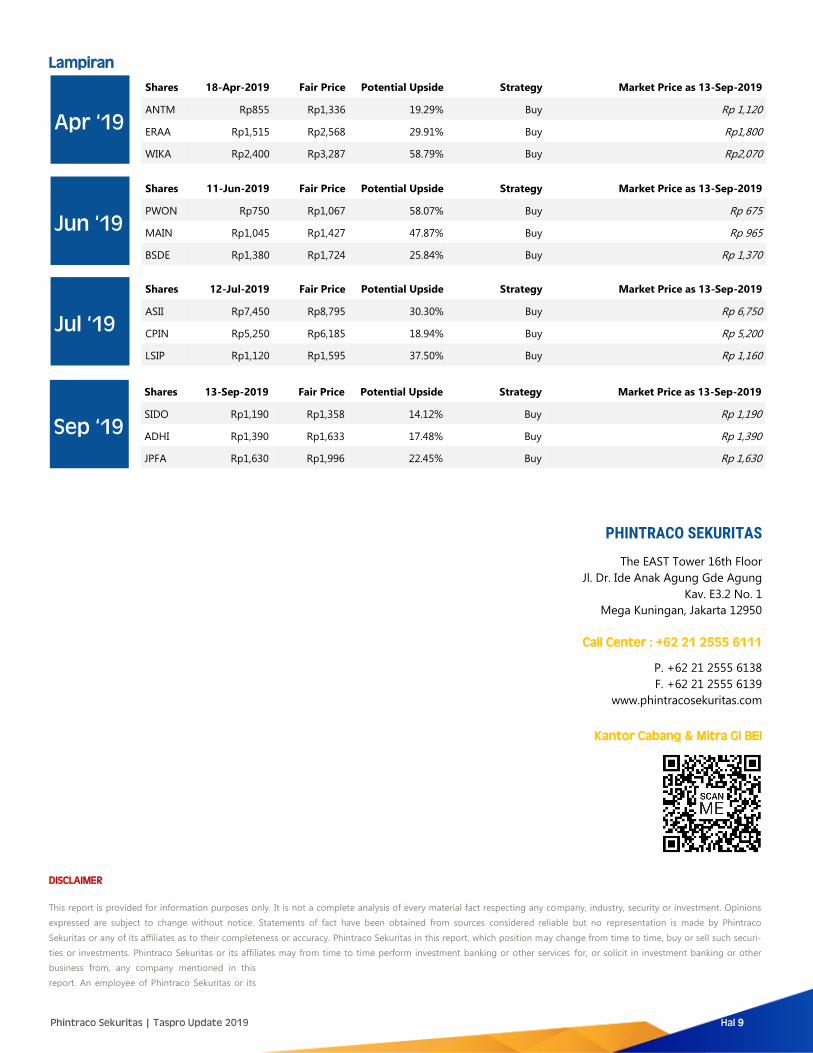
Lampiran
Shares 18-Apr-2019 Fair Price Potential Upside Strategy Market Price as 13-Sep-2019
Apr ‘19
ANTM Rp855 Rp1,336 19.29% Buy Rp 1,120
ERAA Rp1,515 Rp2,568 29.91% Buy Rp1,800
WIKA Rp2,400 Rp3,287 58.79% Buy Rp2,070
Phintraco Sekuritas | Taspro Update 2019 Hal 9
Shares 11-Jun-2019 Fair Price Potential Upside Strategy Market Price as 13-Sep-2019
Jun ‘19
PWON Rp750 Rp1,067 58.07% Buy Rp 675
MAIN Rp1,045 Rp1,427 47.87% Buy Rp 965
BSDE Rp1,380 Rp1,724 25.84% Buy Rp 1,370
Shares 12-Jul-2019 Fair Price Potential Upside Strategy Market Price as 13-Sep-2019
Jul ‘19
ASII Rp7,450 Rp8,795 30.30% Buy Rp 6,750
CPIN Rp5,250 Rp6,185 18.94% Buy Rp 5,200
LSIP Rp1,120 Rp1,595 37.50% Buy Rp 1,160
Shares 13-Sep-2019 Fair Price Potential Upside Strategy Market Price as 13-Sep-2019
Sep ‘19
SIDO Rp1,190 Rp1,358 14.12% Buy Rp 1,190
ADHI Rp1,390 Rp1,633 17.48% Buy Rp 1,390
JPFA Rp1,630 Rp1,996 22.45% Buy Rp 1,630