Embed Size (px)
Citation preview
TAURON Group’s H1 2013 financial results
Warsaw, August 22, 2013
Legal disclaimer
2
This presentation serves for information purposes only and should not be treated as investment-related advice.
This presentation has been prepared by TAURON Polska Energia S.A. (“the Company”).
Neither the Company nor any of its subsidiaries shall be held accountable for any damage resulting from the use
of this presentation or a part thereof, or its contents or in any other manner in connection with this presentation.
The recipients of this presentation shall bear exclusive responsibility for their own analyses and market
assessment as well as evaluation of the Company‟s market position and its potential results in the future based on
information contained in herein.
To the extent this presentation contains forward-looking statements related to the future, in particular such terms
as ”designed”, ”planned”, ”anticipated”, or other similar expressions (including their negation), they shall be
connected with the known and unknown risks, uncertainty and other factors which might result in actual results,
financial situation, actions and achievements being materially different from any future results, actions or
achievements expressed in such forward-looking statements.
Neither the Company nor any of its subsidiaries shall be obliged to provide the recipients of this presentation with
any additional information or to update this presentation
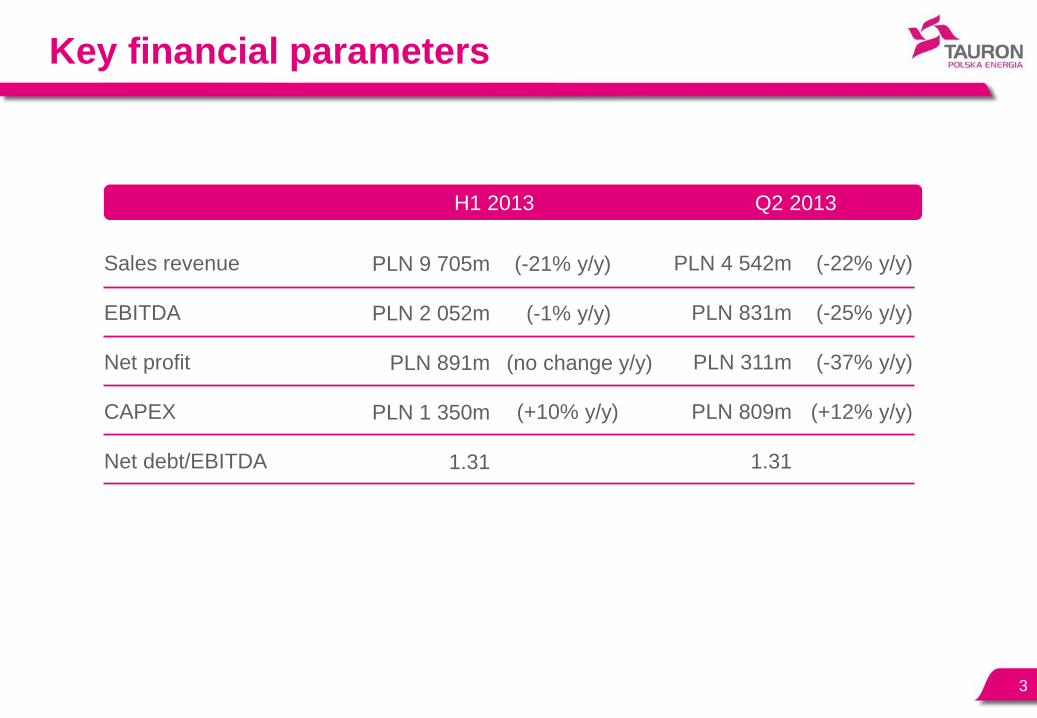
Key financial parameters
Sales revenue
EBITDA
Net profit
CAPEX
Net debt/EBITDA
3
H1 2013 Q2 2013
PLN 9 705m
PLN 2 052m
PLN 891m
PLN 1 350m
1.31
(-21% y/y)
(-1% y/y)
(no change y/y)
(+10% y/y)
PLN 4 542m
PLN 831m
PLN 311m
PLN 809m
1.31
(-22% y/y)
(-25% y/y)
(-37% y/y)
(+12% y/y)
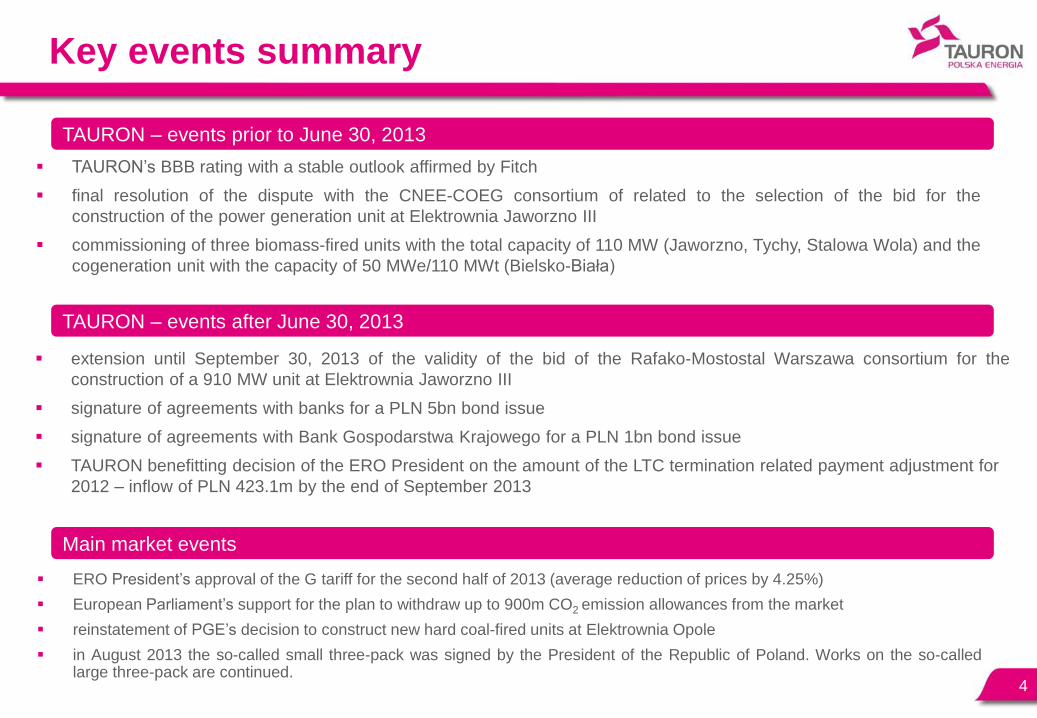
Key events summary
ERO President‟s approval of the G tariff for the second half of 2013 (average reduction of prices by 4.25%)
European Parliament‟s support for the plan to withdraw up to 900m CO2 emission allowances from the market
reinstatement of PGE‟s decision to construct new hard coal-fired units at Elektrownia Opole
in August 2013 the so-called small three-pack was signed by the President of the Republic of Poland. Works on the so-called large three-pack are continued.
4
TAURON‟s BBB rating with a stable outlook affirmed by Fitch
final resolution of the dispute with the CNEE-COEG consortium of related to the selection of the bid for the
construction of the power generation unit at Elektrownia Jaworzno III
commissioning of three biomass-fired units with the total capacity of 110 MW (Jaworzno, Tychy, Stalowa Wola) and the
cogeneration unit with the capacity of 50 MWe/110 MWt (Bielsko-Biała)
extension until September 30, 2013 of the validity of the bid of the Rafako-Mostostal Warszawa consortium for the
construction of a 910 MW unit at Elektrownia Jaworzno III
signature of agreements with banks for a PLN 5bn bond issue
signature of agreements with Bank Gospodarstwa Krajowego for a PLN 1bn bond issue
TAURON benefitting decision of the ERO President on the amount of the LTC termination related payment adjustment for
2012 – inflow of PLN 423.1m by the end of September 2013
Main market events
TAURON – events prior to June 30, 2013
TAURON – events after June 30, 2013
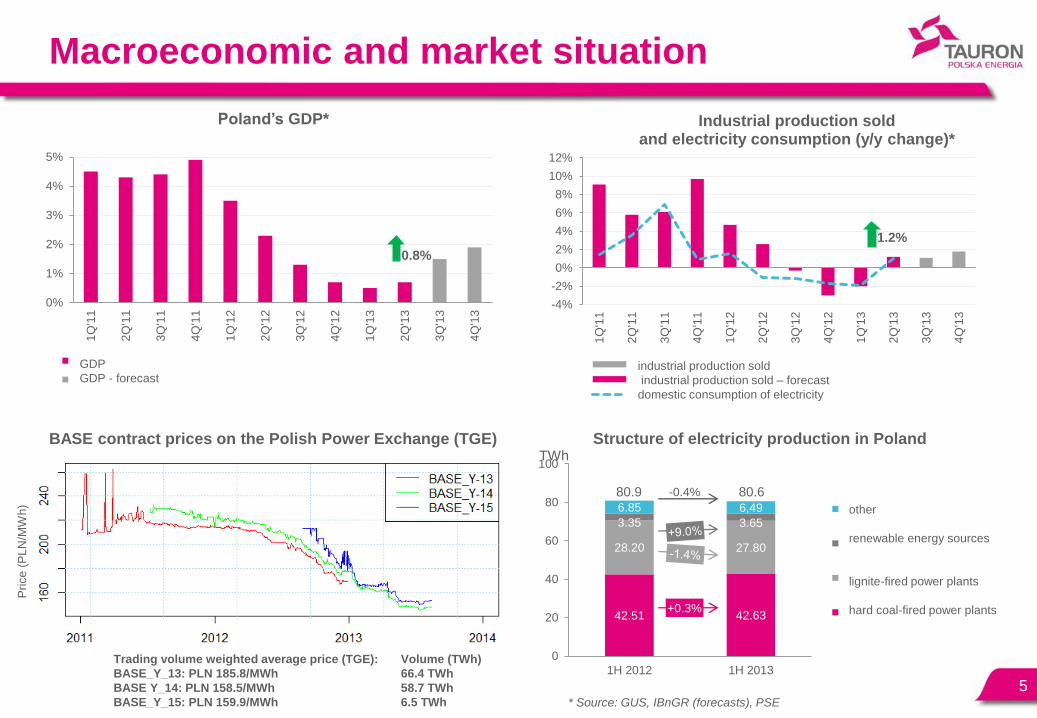
Macroeconomic and market situation
5
0%
1%
2%
3%
4%
5%
1Q
'11
2Q
'11
3Q
'11
4Q
'11
1Q
'12
2Q
'12
3Q
'12
4Q
'12
1Q
'13
2Q
'13
3Q
'13
4Q
'13
Poland’s GDP*
PKB
PKB - prognoza
GDP
GDP - forecast
42.51 42.63
28.20 27.80
3.35 3.65
6.85 6,49
0
20
40
60
80
100
1H 2012 1H 2013
Structure of electricity production in Poland
pozostałe
odnawialne źródła energii
el. cieplne na węgielbrunatny
el. cieplne na węgielkamienny
80.6 80.9
* Source: GUS, IBnGR (forecasts), PSE
TWh
+0.3%
-0.4%
0.8%
BASE contract prices on the Polish Power Exchange (TGE)
Trading volume weighted average price (TGE): Volume (TWh)
BASE_Y_13: PLN 185.8/MWh 66.4 TWh
BASE Y_14: PLN 158.5/MWh 58.7 TWh
BASE_Y_15: PLN 159.9/MWh 6.5 TWh
1.2%
-4%
-2%
0%
2%
4%
6%
8%
10%
12%
1Q
'11
2Q
'11
3Q
'11
4Q
'11
1Q
'12
2Q
'12
3Q
'12
4Q
'12
1Q
'13
2Q
'13
3Q
'13
4Q
'13
Industrial production sold and electricity consumption (y/y change)*
produkcja sprzedana przemysłu - prognoza
produkcja sprzedana przemysłu
krajowe zużycie energii elektrycznej
industrial production sold
industrial production sold – forecast
domestic consumption of electricity
other
renewable energy sources
lignite-fired power plants
hard coal-fired power plants
Pri
ce
(P
LN
/MW
h)
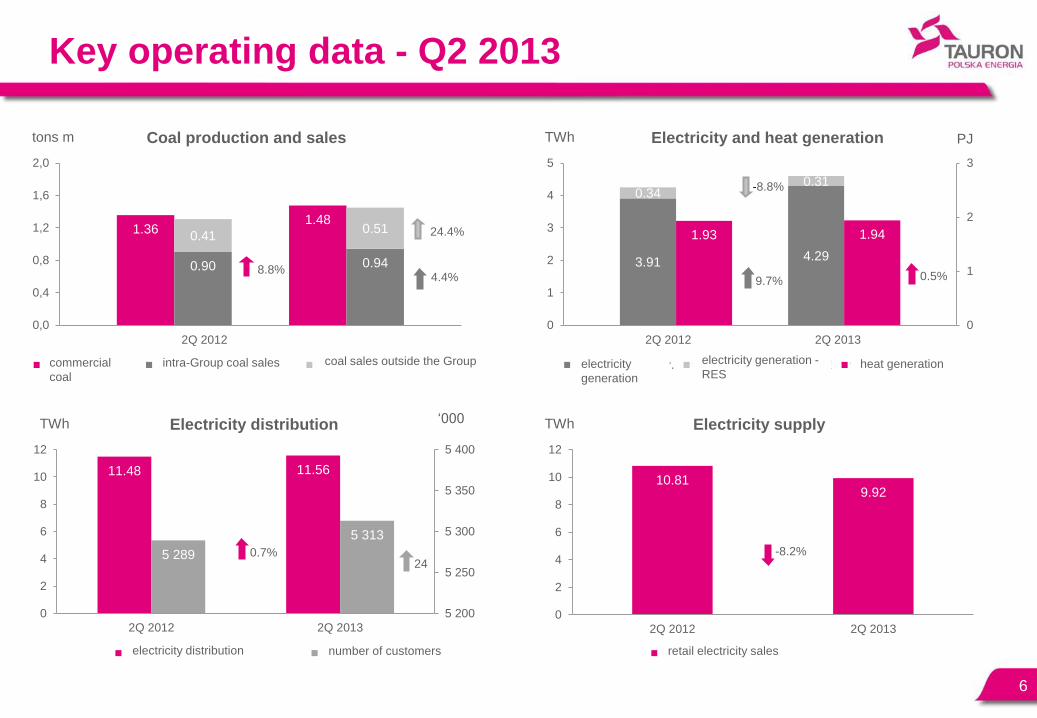
1.36 1.48
0.90 0.94
0.41 0.51
0,0
0,4
0,8
1,2
1,6
2,0
Coal production and sales
węgiel handlowy sprzedaż węgla do Grupy sprzedaż węgla poza Grupę
tons m
4.4%
24.4%
8.8%
Key operating data - Q2 2013
3.91 4.29
0.34 0.31
1.93 1.94
0
1
2
3
0
1
2
3
4
5
2Q 2012 2Q 2013
Electricity and heat generation
wytw.energii elektr. wytw. energii elektr. - OZE wytwarzanie ciepła
TWh PJ
0.5% 9.7%
-8.8%
6
11.48 11.56
5 289
5 313
5 200
5 250
5 300
5 350
5 400
0
2
4
6
8
10
12
2Q 2012 2Q 2013
Electricity distribution
dystrybucja energii elektrycznej liczba klientów
TWh „000
0.7% 24
2Q 2012 2Q 2013
10.81 9.92
0
2
4
6
8
10
12
2Q 2012 2Q 2013
Electricity supply
sprzedaż detaliczna energii elektrycznej
TWh
-8.2%
2Q 2012 2Q 2013
coal sales outside the Group commercial
coal
intra-Group coal sales heat generation electricity
generation
electricity generation -
RES
retail electricity sales electricity distribution
number of customers
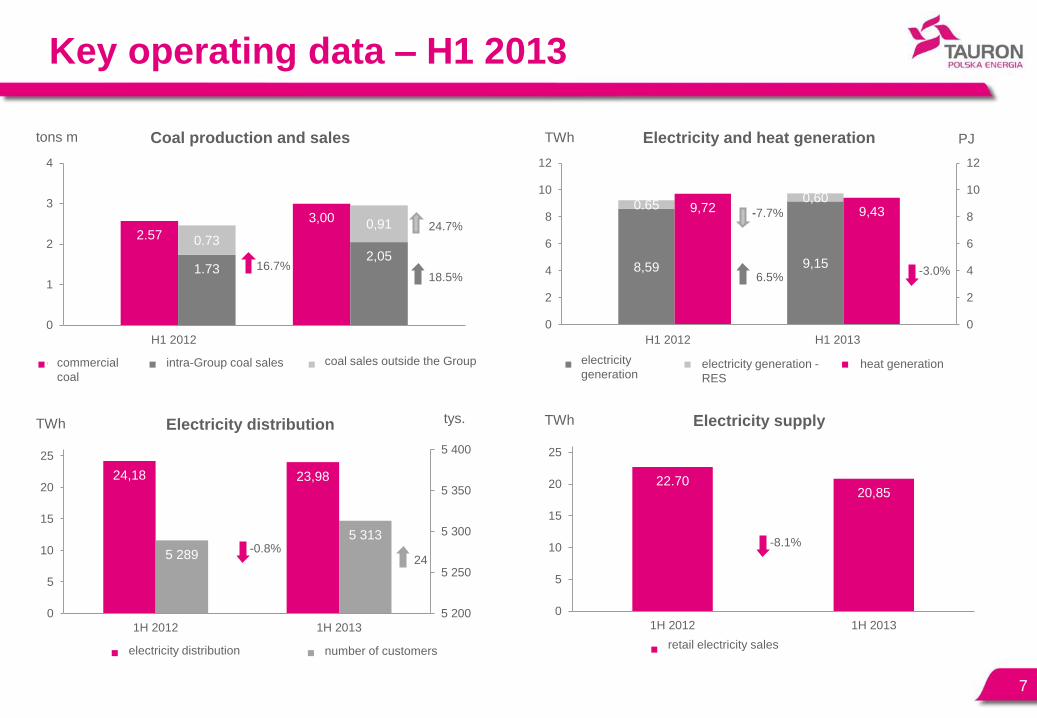
Key operating data – H1 2013
2.57
3,00
1.73 2,05
0.73
0,91
0
1
2
3
4
Coal production and sales
węgiel handlowy sprzedaż węgla do Grupy sprzedaż węgla poza Grupę
tons m
H1 2012 H1 2013
18.5%
24.7%
16.7% 8,59 9,15
0.65 0,60
9,72 9,43
0
2
4
6
8
10
12
0
2
4
6
8
10
12
1H 2012 1H 2013
Electricity and heat generation
wytw.energii elektr. wytw. energii elektr. - OZE wytwarzanie ciepła
TWh PJ
-3.0% 6.5%
-7.7%
electricity
generation
electricity generation -
RES
heat generation
7
24,18 23,98
5 289
5 313
5 200
5 250
5 300
5 350
5 400
0
5
10
15
20
25
1H 2012 1H 2013
Electricity distribution
dystrybucja energii elektrycznej liczba klientów
TWh tys.
-0.8% 24
H1 2012 H1 2013
22.70 20,85
0
5
10
15
20
25
1H 2012 1H 2013
Electricity supply
sprzedaż detaliczna energii elektrycznej
TWh
-8.1%
retail electricity sales
commercial
coal
intra-Group coal sales
coal sales outside the Group
electricity distribution
number of customers
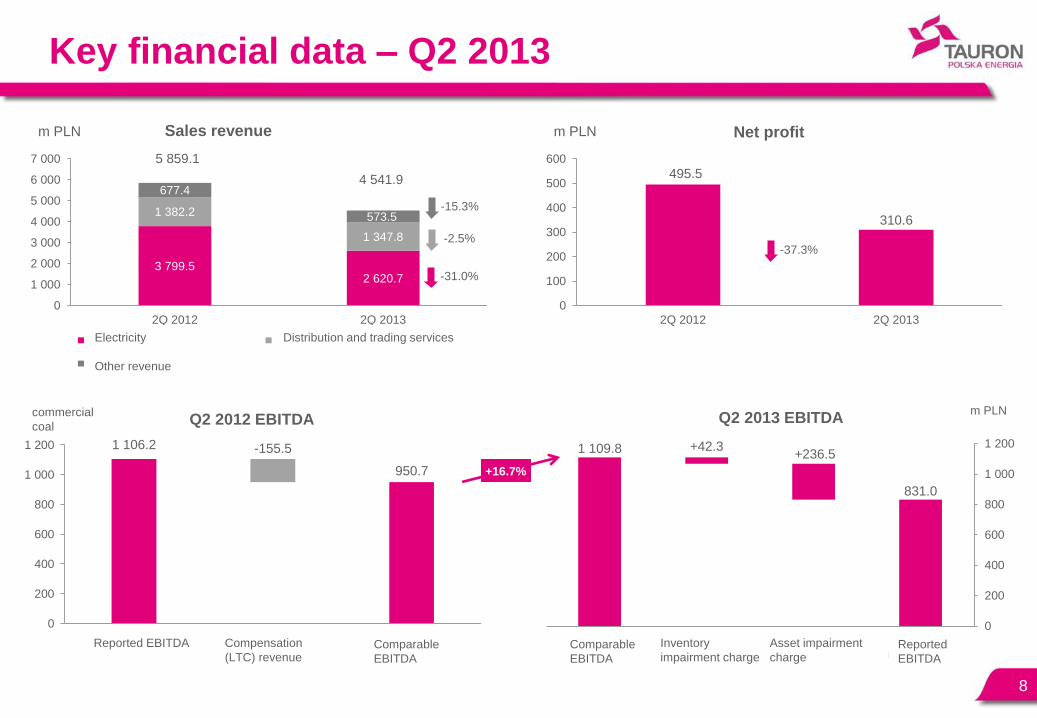
Key financial data – Q2 2013
3 799.5 2 620.7
1 382.2
1 347.8
677.4
573.5
0
1 000
2 000
3 000
4 000
5 000
6 000
7 000
2Q 2012 2Q 2013
Sales revenue
Energia elektryczna Usługi dystrybucyjne i handlowe
Pozostałe przychody
m PLN
5 859.1
4 541.9
-31.0%
-15.3%
-2.5%
Electricity
Other revenue
Distribution and trading services
8
495.5
310.6
0
100
200
300
400
500
600
2Q 2012 2Q 2013
Net profit m PLN
-37.3%
831.0
+236.5 +42.3 1 109.8
0
200
400
600
800
1 000
1 200
EBITDAraportowana
Odpis aktualizującywartość aktywów
Odpis aktualizującywartość zapasów
EBITDAporównywalna
Q2 2013 EBITDA m PLN
1 106.2 -155.5
950.7
0
200
400
600
800
1 000
1 200
EBITDAraportowana
Przychody z tytułurekompensaty (KDT)
EBITDAporównywalna
Q2 2012 EBITDA m PLN commercial
coal
+16.7%
Reported EBITDA Comparable
EBITDA
Compensation
(LTC) revenue Comparable
EBITDA
Reported
EBITDA
Inventory
impairment charge
Asset impairment
charge
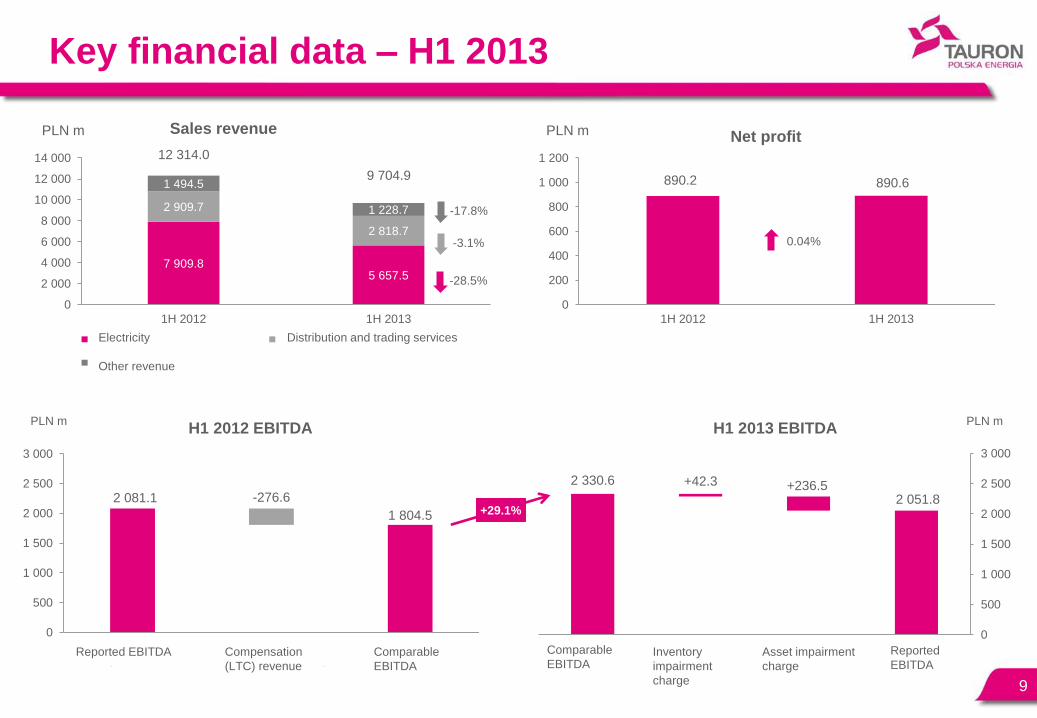
Key financial data – H1 2013
7 909.8 5 657.5
2 909.7
2 818.7
1 494.5
1 228.7
0
2 000
4 000
6 000
8 000
10 000
12 000
14 000
1H 2012 1H 2013
Sales revenue
Energia elektryczna Usługi dystrybucyjne i handlowe
Pozostałe przychody
PLN m
12 314.0
9 704.9
-28.5%
-17.8%
-3.1%
9
890.2 890.6
0
200
400
600
800
1 000
1 200
1H 2012 1H 2013
Net profit PLN m
0.04%
2 051.8 +236.5 +42.3 2 330.6
0
500
1 000
1 500
2 000
2 500
3 000
EBITDAraportowana
Odpis aktualizującywartość aktywów
Odpis aktualizującywartość zapasów
EBITDAporównywalna
H1 2013 EBITDA PLN m
2 081.1 -276.6
1 804.5
0
500
1 000
1 500
2 000
2 500
3 000
EBITDAraportowana
Przychody z tytułurekompensaty (KDT)
EBITDAporównywalna
H1 2012 EBITDA PLN m
+29.1%
Electricity
Other revenue
Distribution and trading services
Reported EBITDA Comparable
EBITDA Compensation
(LTC) revenue
Comparable
EBITDA
Reported
EBITDA Inventory
impairment
charge
Asset impairment
charge
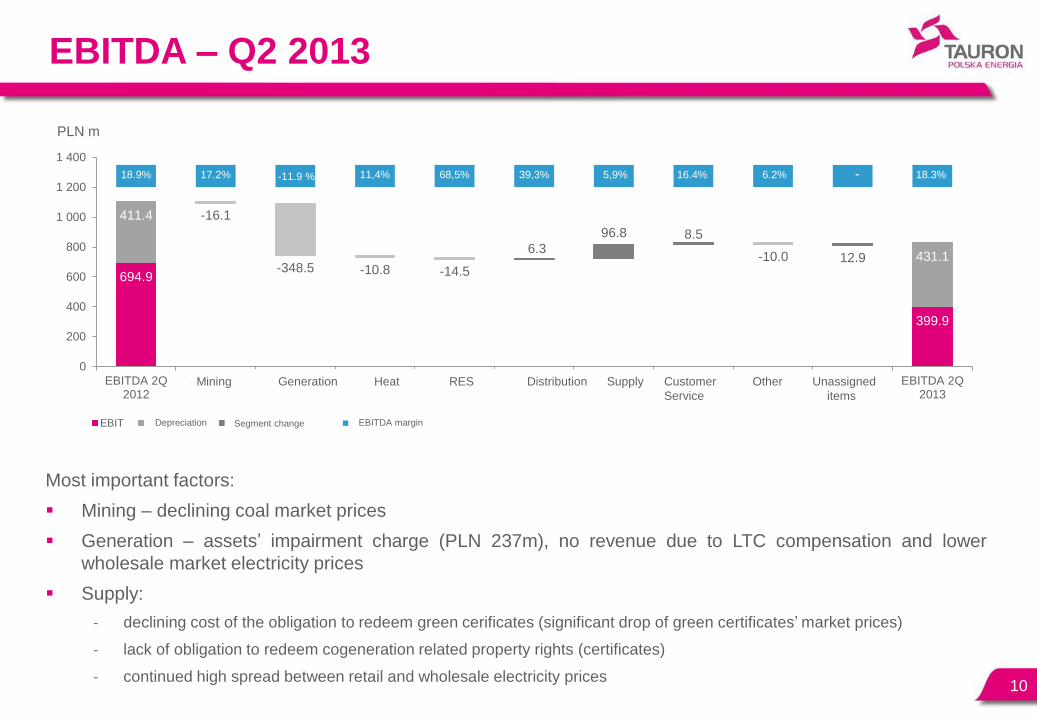
EBITDA – Q2 2013
Most important factors:
Mining – declining coal market prices
Generation – assets‟ impairment charge (PLN 237m), no revenue due to LTC compensation and lower
wholesale market electricity prices
Supply:
- declining cost of the obligation to redeem green cerificates (significant drop of green certificates‟ market prices)
- lack of obligation to redeem cogeneration related property rights (certificates)
- continued high spread between retail and wholesale electricity prices 10
694.9
399.9
411.4
431.1
-16.1
-348.5 -10.8 -14.5
6.3
96.8 8.5
-10.0 12.9
18.9% 17.2% 11,4% 68,5% 39,3% 5,9% 16.4% 6.2% 18.3%
0
200
400
600
800
1 000
1 200
1 400
EBITDA 2Q2012
Wydobycie Wytwarzanie Ciepło OZE Dystrybucja Sprzedaż Obsługaklienta
Pozostałe Pozycjenieprzypisane
EBITDA 2Q2013
EBIT Amortyzacja Zmiana w segmencie Marża EBITDA
PLN m
- -11.9 %
Mining Generation Heat RES Distribution Supply Customer Other Unassigned
Service items
Depreciation Segment change EBITDA margin
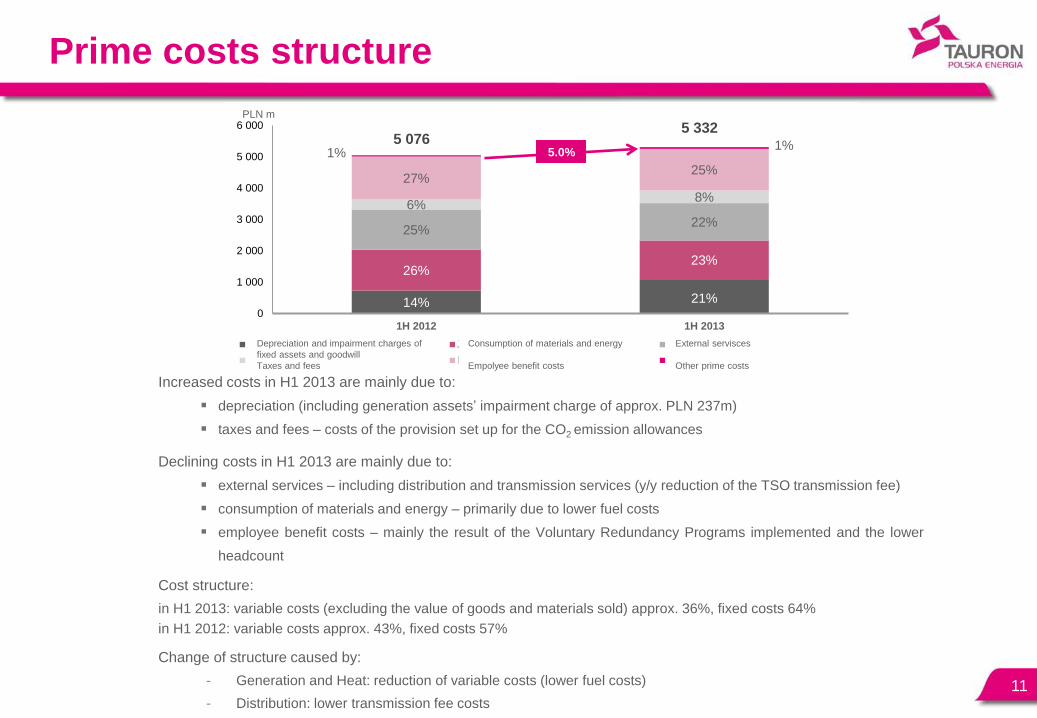
Prime costs structure
11
Increased costs in H1 2013 are mainly due to:
depreciation (including generation assets‟ impairment charge of approx. PLN 237m)
taxes and fees – costs of the provision set up for the CO2 emission allowances
Declining costs in H1 2013 are mainly due to:
external services – including distribution and transmission services (y/y reduction of the TSO transmission fee)
consumption of materials and energy – primarily due to lower fuel costs
employee benefit costs – mainly the result of the Voluntary Redundancy Programs implemented and the lower
headcount
Cost structure:
in H1 2013: variable costs (excluding the value of goods and materials sold) approx. 36%, fixed costs 64%
in H1 2012: variable costs approx. 43%, fixed costs 57%
Change of structure caused by:
- Generation and Heat: reduction of variable costs (lower fuel costs)
- Distribution: lower transmission fee costs
14% 21%
26% 23%
25% 22%
6% 8%
27% 25%
1% 1%
0
1 000
2 000
3 000
4 000
5 000
6 000
1H 2012 1H 2013
PLN m
Amortyzacja i odpisy aktualiz. ŚT i WN Zużycie materiałów i energii Usługi obce
Podatki i opłaty Koszty świadczeń pracowniczych Pozostałe koszty rodzajowe
5 076 5 332
5.0%
Depreciation and impairment charges of
fixed assets and goodwill
Taxes and fees
Consumption of materials and energy
Empolyee benefit costs
External servisces
Other prime costs
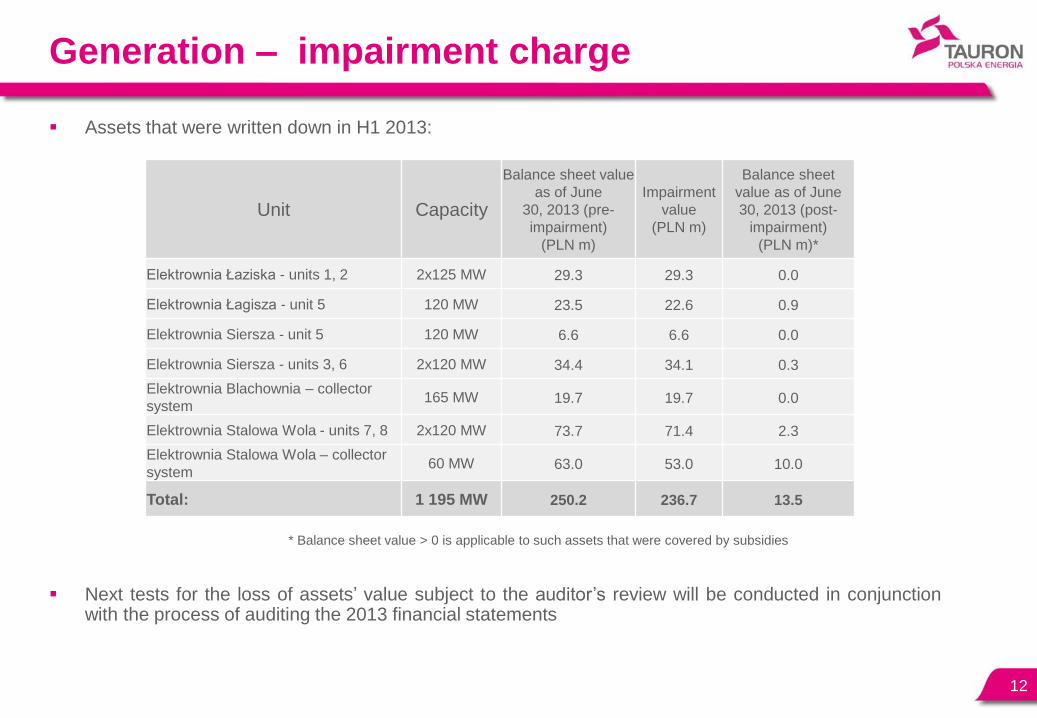
Generation – impairment charge
Assets that were written down in H1 2013:
* Balance sheet value > 0 is applicable to such assets that were covered by subsidies
Next tests for the loss of assets‟ value subject to the auditor‟s review will be conducted in conjunction with the process of auditing the 2013 financial statements
12
Unit Capacity
Balance sheet value
as of June
30, 2013 (pre-
impairment)
(PLN m)
Impairment
value
(PLN m)
Balance sheet
value as of June
30, 2013 (post-
impairment)
(PLN m)*
Elektrownia Łaziska - units 1, 2 2x125 MW 29.3 29.3 0.0
Elektrownia Łagisza - unit 5 120 MW 23.5 22.6 0.9
Elektrownia Siersza - unit 5 120 MW 6.6 6.6 0.0
Elektrownia Siersza - units 3, 6 2x120 MW 34.4 34.1 0.3
Elektrownia Blachownia – collector
system 165 MW 19.7 19.7 0.0
Elektrownia Stalowa Wola - units 7, 8 2x120 MW 73.7 71.4 2.3
Elektrownia Stalowa Wola – collector
system 60 MW 63.0 53.0 10.0
Total: 1 195 MW 250.2 236.7 13.5
Generation – prospects for 2013
13
Factors that may have a positive impact on the
earnings in H2 2013:
• decline of electricity market prices – realizing a higher margin
on electricity trading
• higher rate of utilizing the capacity of the 460 MW unit at
Elektrownia Łagisza
• increasing prices of property rights to certificates of origin for
electricity generated in RES
• lower per unit costs of hard coal and biofuels consumption
(PLN/GJ)
Factors that may have a negative impact on the
earnings in H2 2013:
• higher fixed costs (upgrades, external services, labor costs)
• higher costs of the provision for CO2
• lower heat sales
• lower margin on the EUA/CER/ERU exchange transactions
Distribution – key elements
14
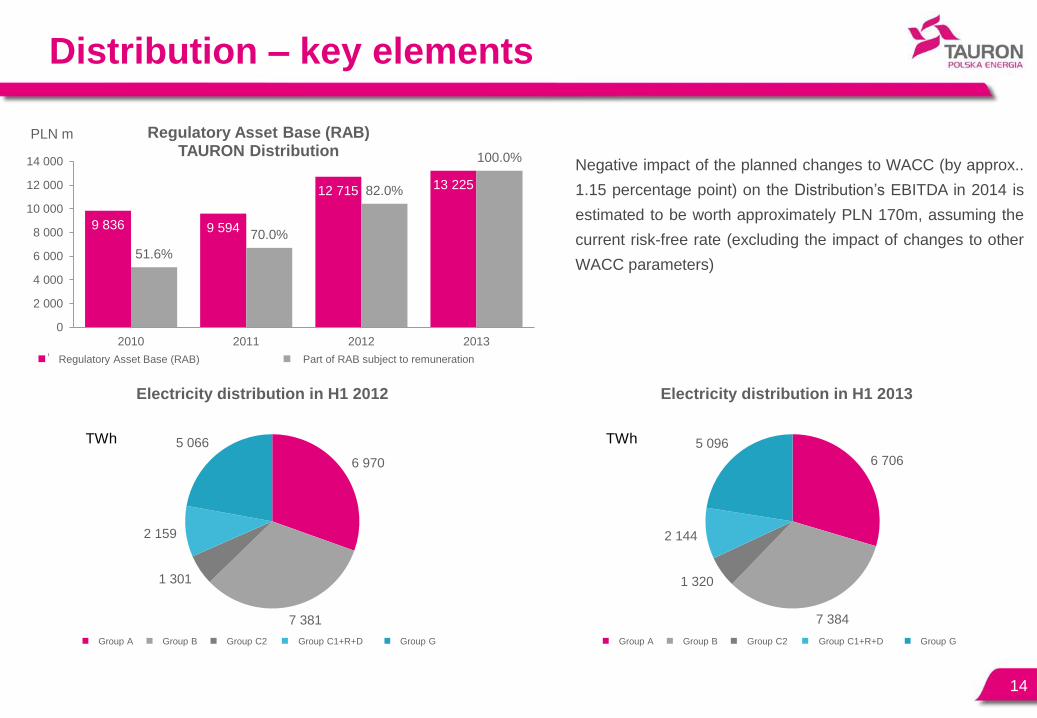
9 836 9 594
12 715 13 225
51.6%
70.0%
82.0%
100.0%
0
2 000
4 000
6 000
8 000
10 000
12 000
14 000
2010 2011 2012 2013
Regulatory Asset Base (RAB) TAURON Distribution
Wartość regulacyjna aktywów (WRA) Udział WRA podlegający wynagradzaniu
PLN m
6 706
7 384
1 320
2 144
5 096
Electricity distribution in H1 2013
Grupa A Grupa B Grupa C2 Grupa C1+R+D Grupa G
TWh
6 970
7 381
1 301
2 159
5 066
Electricity distribution in H1 2012
Grupa A Grupa B Grupa C2 Grupa C1+R+D Grupa G
TWh
Negative impact of the planned changes to WACC (by approx..
1.15 percentage point) on the Distribution‟s EBITDA in 2014 is
estimated to be worth approximately PLN 170m, assuming the
current risk-free rate (excluding the impact of changes to other
WACC parameters)
Group A Group A Group B Group B Group C2 Group C2 Group C1+R+D Group C1+R+D Group G Group G
Regulatory Asset Base (RAB) Part of RAB subject to remuneration
Debt and financing
15
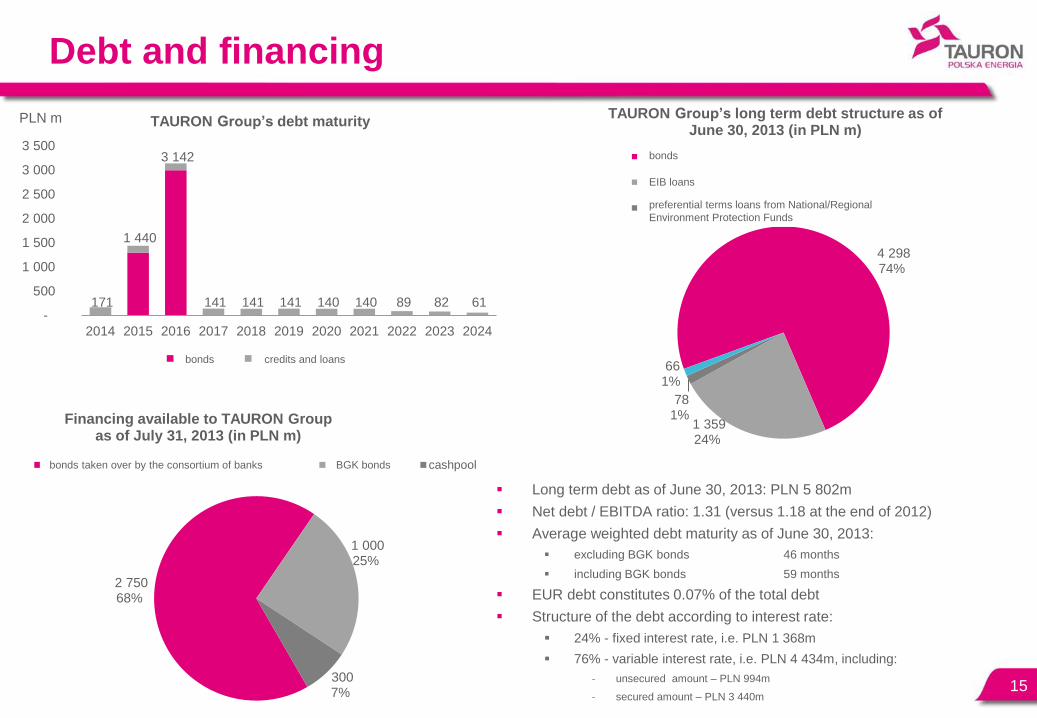
171
1 440
3 142
141 141 141 140 140 89 82 61 -
500
1 000
1 500
2 000
2 500
3 000
3 500
2014 2015 2016 2017 2018 2019 2020 2021 2022 2023 2024
TAURON Group’s debt maturity
obligacje kredyty i pożyczki
PLN m
4 298 74%
1 359 24%
78 1%
66 1%
TAURON Group’s long term debt structure as of June 30, 2013 (in PLN m)
obligacje
kredyty z EBI
pożyczki preferencyjne zNFOŚiGW/WFOŚiGW
2 750 68%
1 000 25%
300 7%
Financing available to TAURON Group as of July 31, 2013 (in PLN m)
obligacje obejmowane przez konsorcjum banków obligacje BGK cashpool
Long term debt as of June 30, 2013: PLN 5 802m
Net debt / EBITDA ratio: 1.31 (versus 1.18 at the end of 2012)
Average weighted debt maturity as of June 30, 2013:
excluding BGK bonds 46 months
including BGK bonds 59 months
EUR debt constitutes 0.07% of the total debt
Structure of the debt according to interest rate:
24% - fixed interest rate, i.e. PLN 1 368m
76% - variable interest rate, i.e. PLN 4 434m, including:
- unsecured amount – PLN 994m
- secured amount – PLN 3 440m
bonds credits and loans
bonds
EIB loans
preferential terms loans from National/Regional
Environment Protection Funds
bonds taken over by the consortium of banks BGK bonds
CAPEX
CAPEX per segment
16
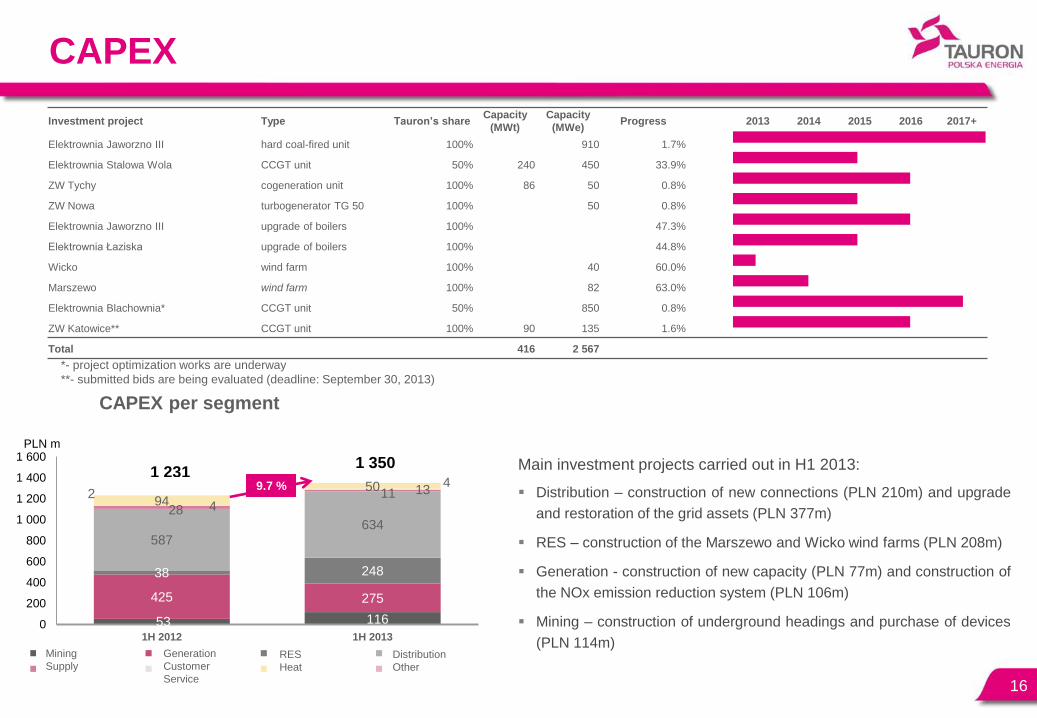
Main investment projects carried out in H1 2013:
Distribution – construction of new connections (PLN 210m) and upgrade
and restoration of the grid assets (PLN 377m)
RES – construction of the Marszewo and Wicko wind farms (PLN 208m)
Generation - construction of new capacity (PLN 77m) and construction of
the NOx emission reduction system (PLN 106m)
Mining – construction of underground headings and purchase of devices
(PLN 114m)
Investment project Type Tauron’s share Capacity
(MWt)
Capacity
(MWe) Progress 2013 2014 2015 2016 2017+
Elektrownia Jaworzno III hard coal-fired unit 100% 910 1.7%
Elektrownia Stalowa Wola CCGT unit 50% 240 450 33.9%
ZW Tychy cogeneration unit 100% 86 50 0.8%
ZW Nowa turbogenerator TG 50 100% 50 0.8%
Elektrownia Jaworzno III upgrade of boilers 100% 47.3%
Elektrownia Łaziska upgrade of boilers 100% 44.8%
Wicko wind farm 100% 40 60.0%
Marszewo wind farm 100% 82 63.0%
Elektrownia Blachownia* CCGT unit 50% 850 0.8%
ZW Katowice** CCGT unit 100% 90 135 1.6%
Total 416 2 567
*- project optimization works are underway
**- submitted bids are being evaluated (deadline: September 30, 2013)
53 116
425 275
38 248
587 634
28
11 4
13 94
50 2
4
0
200
400
600
800
1 000
1 200
1 400
1 600
1H 2012 1H 2013
Wydobycie Wytwarzanie OZE Dystrybucja
Sprzedaż Obsługa Klienta Ciepło Pozostałe
PLN m
1 231 1 350
9.7 %
Mining
Supply
Generation
Customer
Service
RES
Heat
Distribution
Other
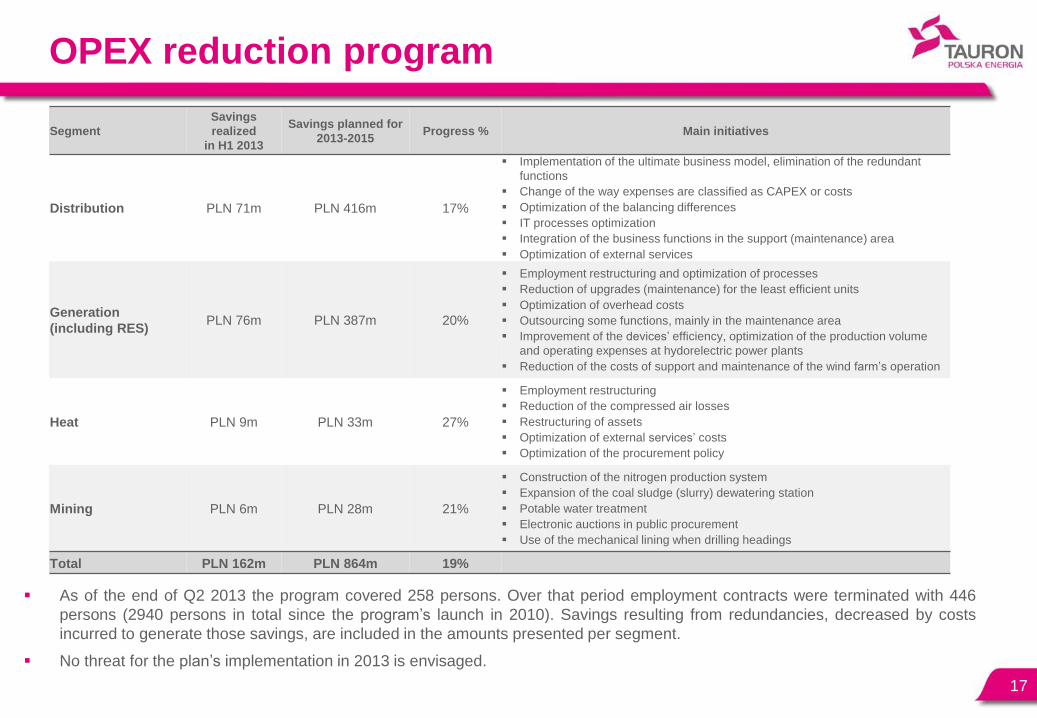
OPEX reduction program
As of the end of Q2 2013 the program covered 258 persons. Over that period employment contracts were terminated with 446
persons (2940 persons in total since the program‟s launch in 2010). Savings resulting from redundancies, decreased by costs
incurred to generate those savings, are included in the amounts presented per segment.
No threat for the plan‟s implementation in 2013 is envisaged.
17
Segment
Savings
realized
in H1 2013
Savings planned for
2013-2015 Progress % Main initiatives
Distribution PLN 71m PLN 416m 17%
Implementation of the ultimate business model, elimination of the redundant
functions
Change of the way expenses are classified as CAPEX or costs
Optimization of the balancing differences
IT processes optimization
Integration of the business functions in the support (maintenance) area
Optimization of external services
Generation
(including RES) PLN 76m PLN 387m 20%
Employment restructuring and optimization of processes
Reduction of upgrades (maintenance) for the least efficient units
Optimization of overhead costs
Outsourcing some functions, mainly in the maintenance area
Improvement of the devices‟ efficiency, optimization of the production volume
and operating expenses at hydorelectric power plants
Reduction of the costs of support and maintenance of the wind farm‟s operation
Heat PLN 9m PLN 33m 27%
Employment restructuring
Reduction of the compressed air losses
Restructuring of assets
Optimization of external services‟ costs
Optimization of the procurement policy
Mining PLN 6m PLN 28m 21%
Construction of the nitrogen production system
Expansion of the coal sludge (slurry) dewatering station
Potable water treatment
Electronic auctions in public procurement
Use of the mechanical lining when drilling headings
Total PLN 162m PLN 864m 19%
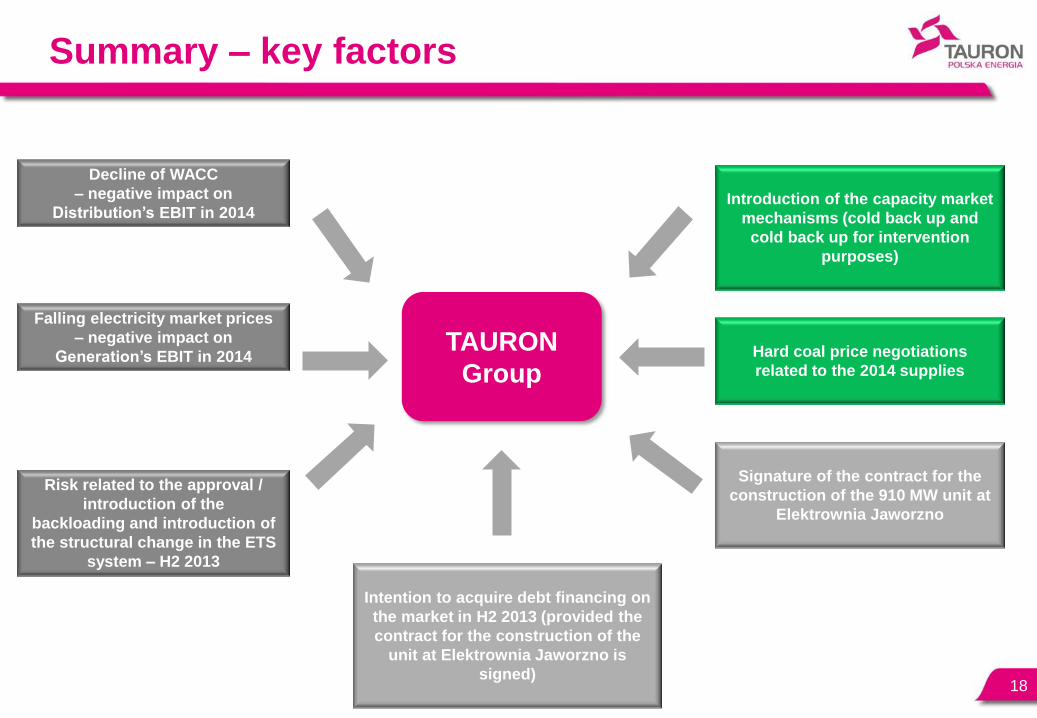
Summary – key factors
18
Decline of WACC
– negative impact on
Distribution’s EBIT in 2014
Falling electricity market prices
– negative impact on
Generation’s EBIT in 2014
Intention to acquire debt financing on
the market in H2 2013 (provided the
contract for the construction of the
unit at Elektrownia Jaworzno is
signed)
Signature of the contract for the
construction of the 910 MW unit at
Elektrownia Jaworzno
Hard coal price negotiations
related to the 2014 supplies
Introduction of the capacity market
mechanisms (cold back up and
cold back up for intervention
purposes)
TAURON
Group
Risk related to the approval /
introduction of the
backloading and introduction of
the structural change in the ETS
system – H2 2013

Thank you – Q&A
19
Investor Relations Office
Marcin Lauer
tel. + 48 32 774 27 06
Paweł Gaworzyński
tel. + 48 32 774 25 34
Magdalena Wilczek
tel. + 48 32 774 25 38
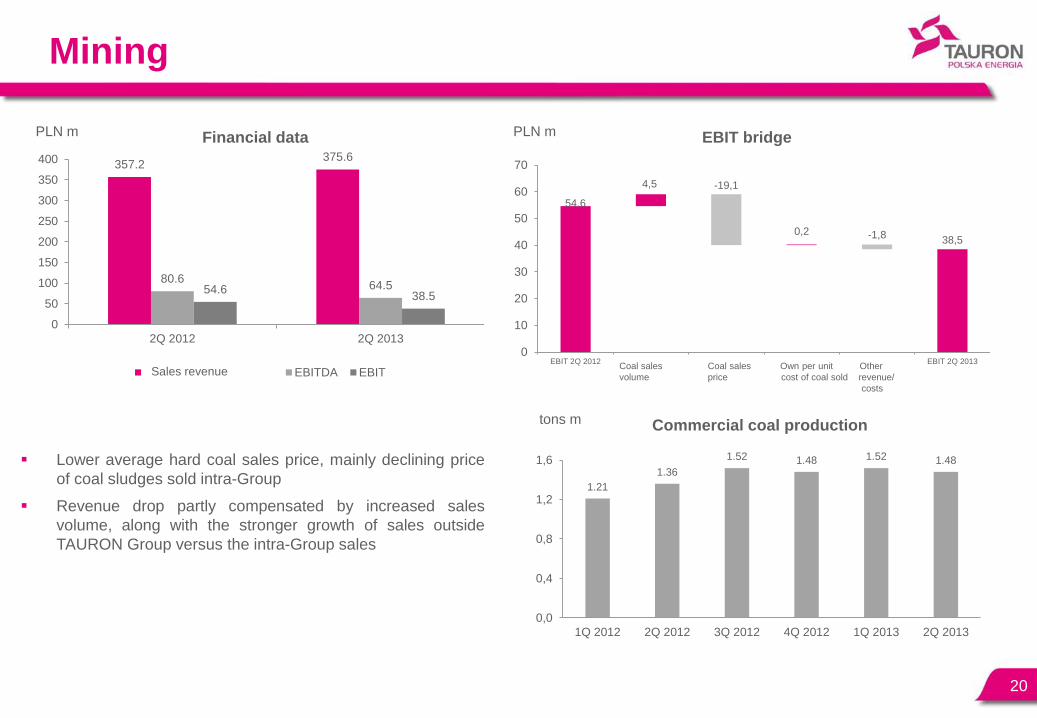
Mining
20
Lower average hard coal sales price, mainly declining price
of coal sludges sold intra-Group
Revenue drop partly compensated by increased sales
volume, along with the stronger growth of sales outside
TAURON Group versus the intra-Group sales
1.21
1.36
1.52 1.48 1.52 1.48
0,0
0,4
0,8
1,2
1,6
1Q 2012 2Q 2012 3Q 2012 4Q 2012 1Q 2013 2Q 2013
Commercial coal production tons m
357.2 375.6
80.6 64.5 54.6
38.5
0
50
100
150
200
250
300
350
400
2Q 2012 2Q 2013
Financial data
Przychody ze sprzedaży EBITDA EBIT
PLN m
54,6
4,5 -19,1
0,2 -1,8 38,5
0
10
20
30
40
50
60
70
EBIT 2Q 2012 Wolumen sprzedażywęgla
Cena sprzedażywęgla
Jedn. koszt własnysprzedanego węgla
Pozostałeprzychody/koszty
EBIT 2Q 2013
EBIT bridge PLN m
Sales revenue Coal sales Coal sales Own per unit Other
volume price cost of coal sold revenue/
costs
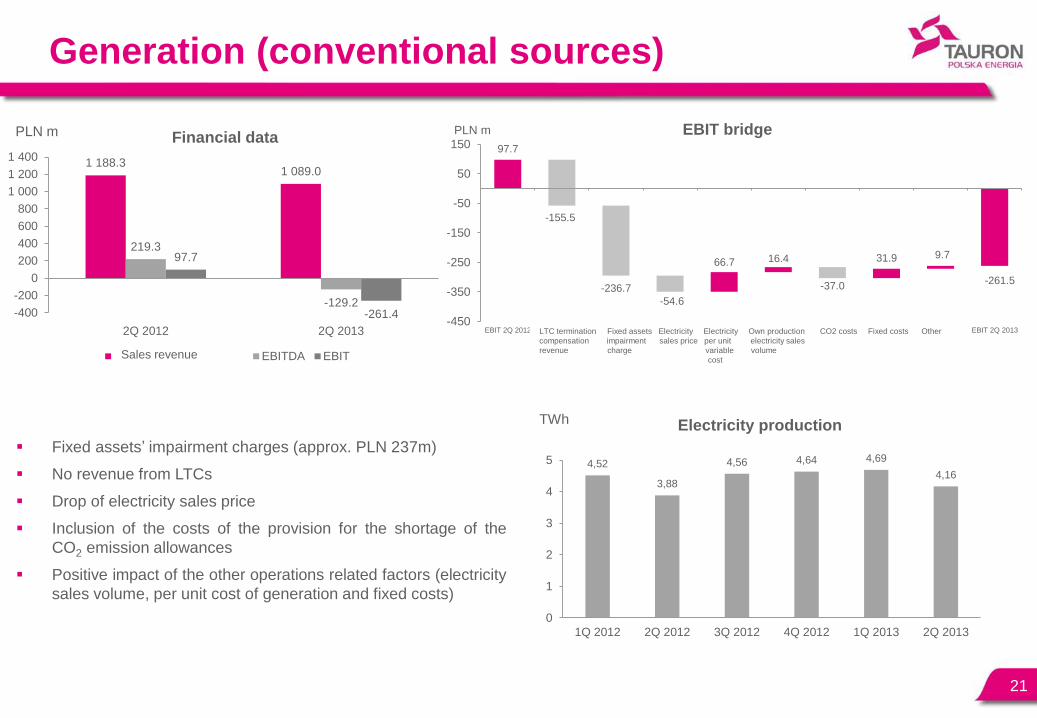
Generation (conventional sources)
21
Fixed assets‟ impairment charges (approx. PLN 237m)
No revenue from LTCs
Drop of electricity sales price
Inclusion of the costs of the provision for the shortage of the
CO2 emission allowances
Positive impact of the other operations related factors (electricity
sales volume, per unit cost of generation and fixed costs)
1 188.3 1 089.0
219.3
-129.2
97.7
-261.4 -400
-200
0
200
400
600
800
1 000
1 200
1 400
2Q 2012 2Q 2013
Financial data
Przychody ze sprzedaży EBITDA EBIT
PLN m
4,52
3,88
4,56 4,64 4,69
4,16
0
1
2
3
4
5
1Q 2012 2Q 2012 3Q 2012 4Q 2012 1Q 2013 2Q 2013
Electricity production TWh
97.7
66.7 16.4 31.9 9.7
-155.5
-236.7
-54.6
-37.0 -261.5
-450
-350
-250
-150
-50
50
150
EBIT 2Q 2012 Przychody z tyt.rekompensaty
KDT
Odpisaktualizującyaktywa trwałe
Cena sprzedażyenergii
Jednostkowykoszt zmienny
energii el.
Wolumensprzed. energii z
własnej prod.
Koszty CO2 Koszty stałe Pozostałe EBIT 2Q 2013
EBIT bridge PLN m
Sales revenue
LTC termination Fixed assets Electricity Electricity Own production CO2 costs Fixed costs Other
compensation impairment sales price per unit electricity sales
revenue charge variable volume
cost
Renewable Energy Sources (RES)
22
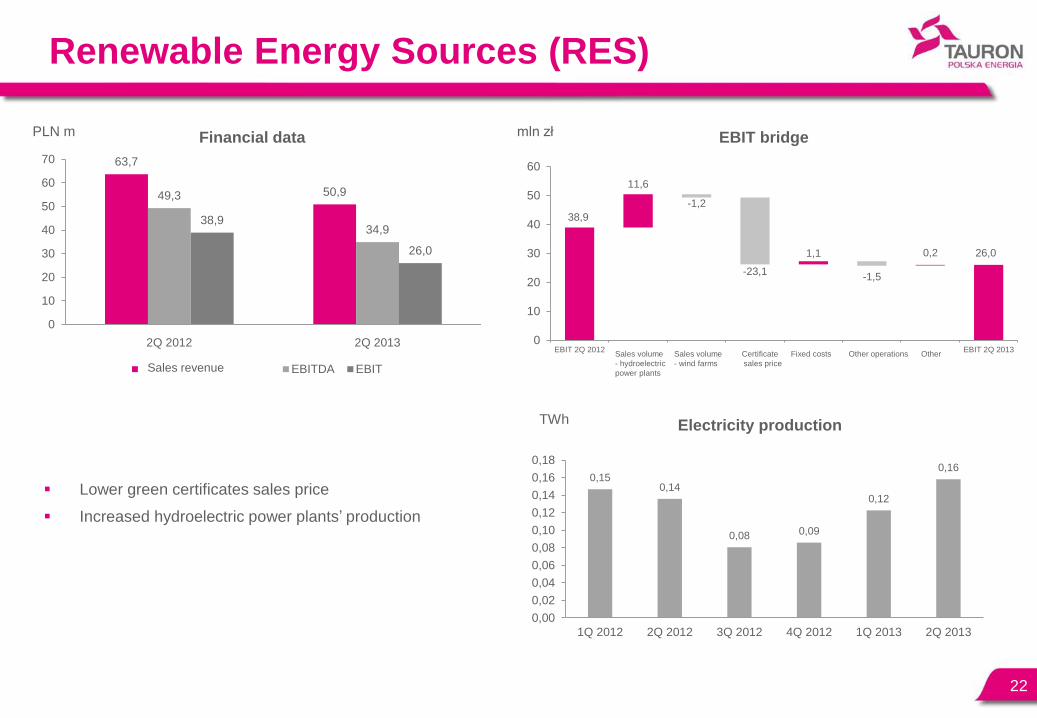
Lower green certificates sales price
Increased hydroelectric power plants‟ production
63,7
50,9 49,3
34,9 38,9
26,0
0
10
20
30
40
50
60
70
2Q 2012 2Q 2013
Financial data
Przychody ze sprzedaży EBITDA EBIT
PLN m
0,15 0,14
0,08 0,09
0,12
0,16
0,00
0,02
0,04
0,06
0,08
0,10
0,12
0,14
0,16
0,18
1Q 2012 2Q 2012 3Q 2012 4Q 2012 1Q 2013 2Q 2013
Electricity production TWh
38,9
11,6
-1,2
-23,1
1,1
-1,5
0,2 26,0
0
10
20
30
40
50
60
EBIT 2Q 2012 Wolumensprzedaży - el.
wodne
Wolumensprzedaży -el.wiatrowe
Cena sprzedażycertyfikatu
Koszty stałe Pozostaładziałalnośćoperacyjna
Pozostałe EBIT 2Q 2013
EBIT bridge mln zł
Sales revenue
Sales volume Sales volume Certificate Fixed costs Other operations Other
- hydroelectric - wind farms sales price
power plants
Distribution
23
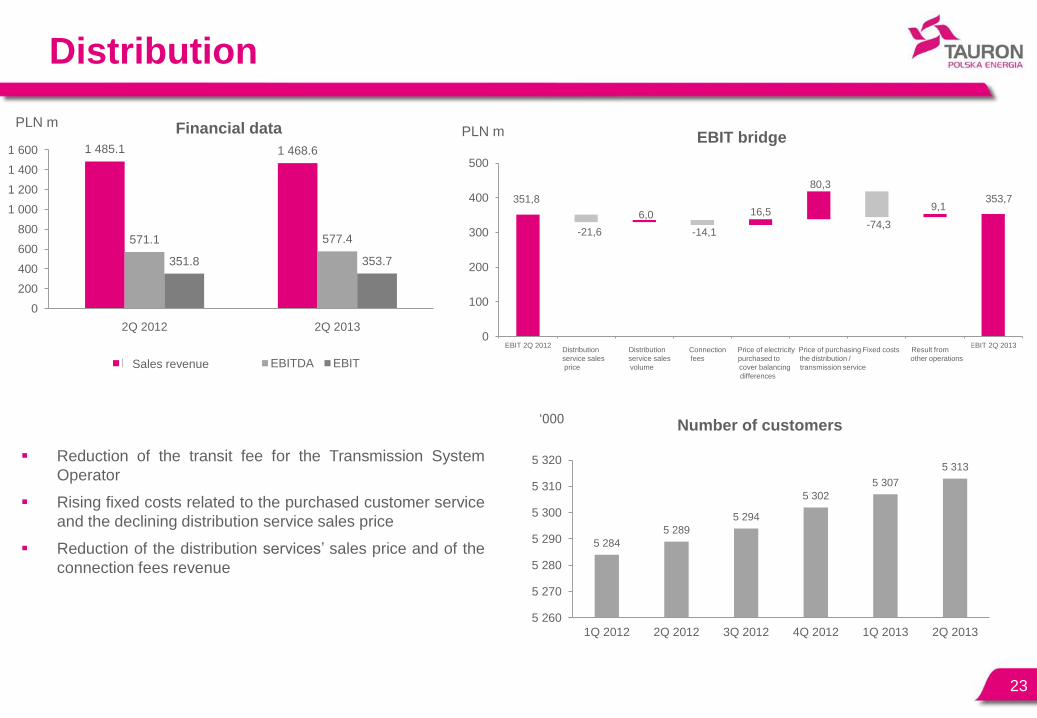
Reduction of the transit fee for the Transmission System
Operator
Rising fixed costs related to the purchased customer service
and the declining distribution service sales price
Reduction of the distribution services‟ sales price and of the
connection fees revenue
1 485.1 1 468.6
571.1 577.4
351.8 353.7
0
200
400
600
800
1 000
1 200
1 400
1 600
2Q 2012 2Q 2013
Financial data
Przychody ze sprzedaży EBITDA EBIT
PLN m
351,8
-21,6
6,0
-14,1
16,5
80,3
-74,3
9,1 353,7
0
100
200
300
400
500
EBIT 2Q 2012 Cena sprzedażyuslugi
dystrybucyjnej
Wolumensprzedaży usługi
dystrybucyjnej
Opłatyprzyłączeniowe
Cena zakupuenergii na
pokrycie różnicybilansowej
Cena zakupuusługi
dystrybucyjnej /przesyłowej
Koszty stałe Wynik na pozost.działalności
EBIT 2Q 2013
EBIT bridge PLN m
5 284
5 289
5 294
5 302
5 307
5 313
5 260
5 270
5 280
5 290
5 300
5 310
5 320
1Q 2012 2Q 2012 3Q 2012 4Q 2012 1Q 2013 2Q 2013
Number of customers „000
Sales revenue
Distribution Distribution Connection Price of electricity Price of purchasing Fixed costs Result from
service sales service sales fees purchased to the distribution / other operations
price volume cover balancing transmission service
differences
Supply
24
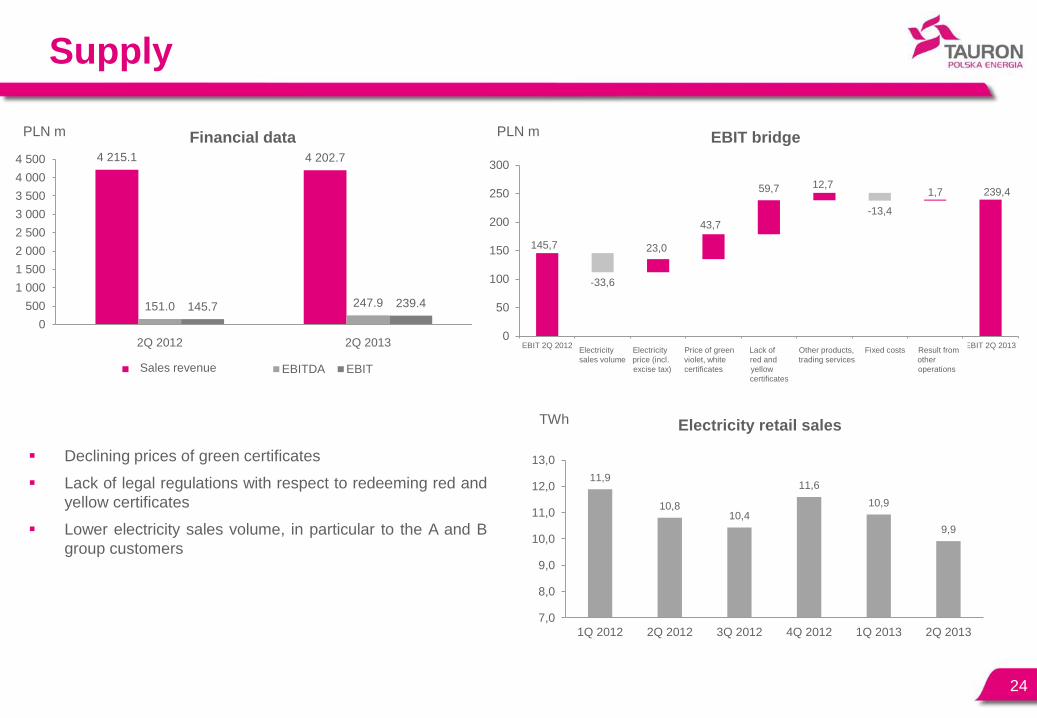
Declining prices of green certificates
Lack of legal regulations with respect to redeeming red and
yellow certificates
Lower electricity sales volume, in particular to the A and B
group customers
4 215.1 4 202.7
151.0 247.9 145.7 239.4
0
500
1 000
1 500
2 000
2 500
3 000
3 500
4 000
4 500
2Q 2012 2Q 2013
Financial data
Przychody ze sprzedaży EBITDA EBIT
PLN m
145,7
-33,6
23,0
43,7
59,7 12,7
-13,4
1,7 239,4
0
50
100
150
200
250
300
EBIT 2Q 2012 Wolumensprzedaży
energii
Cena energii (zakcyzą)
Cena PMzielonych,
fioletowych,białych
Brak PMczerwonych i
żółtych
Pozostałetowary, usługi
handlowe
Koszty stałe Wynik napozost.
działalności
EBIT 2Q 2013
EBIT bridge PLN m
11,9
10,8 10,4
11,6
10,9
9,9
7,0
8,0
9,0
10,0
11,0
12,0
13,0
1Q 2012 2Q 2012 3Q 2012 4Q 2012 1Q 2013 2Q 2013
Electricity retail sales TWh
Sales revenue
Electricity Electricity Price of green Lack of Other products, Fixed costs Result from
sales volume price (incl. violet, white red and trading services other
excise tax) certificates yellow operations
certificates
Heat
25
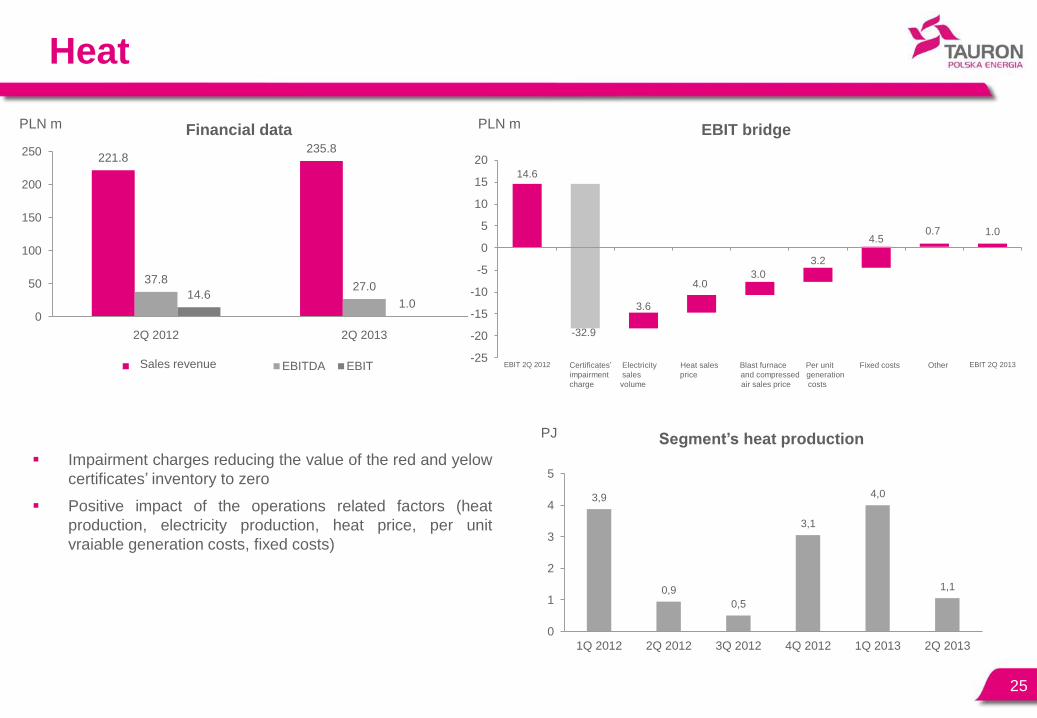
Impairment charges reducing the value of the red and yelow
certificates‟ inventory to zero
Positive impact of the operations related factors (heat
production, electricity production, heat price, per unit
vraiable generation costs, fixed costs)
221.8 235.8
37.8 27.0
14.6 1.0
0
50
100
150
200
250
2Q 2012 2Q 2013
Financial data
Przychody ze sprzedaży EBITDA EBIT
PLN m
14.6
1.0 0.7
-32.9
3.6
4.0 3.0
3.2
4.5
-25
-20
-15
-10
-5
0
5
10
15
20
EBIT 2Q 2012 Odpisaktualizujący
certyfikaty
Wolumensprzedaży energii
Cena sprzedażyciepła
Cena sprzedażydmuchu
wielkopiecowegoi sprężonego
powietrza
Jednostkowekoszty
wytwarzania
Koszty stałe Pozostałe EBIT 2Q 2013
EBIT bridge PLN m
3,9
0,9
0,5
3,1
4,0
1,1
0
1
2
3
4
5
1Q 2012 2Q 2012 3Q 2012 4Q 2012 1Q 2013 2Q 2013
Segment’s heat production PJ
Sales revenue Certificates‟ Electricity Heat sales Blast furnace Per unit Fixed costs Other
impairment sales price and compressed generation
charge volume air sales price costs
Customer Service
26
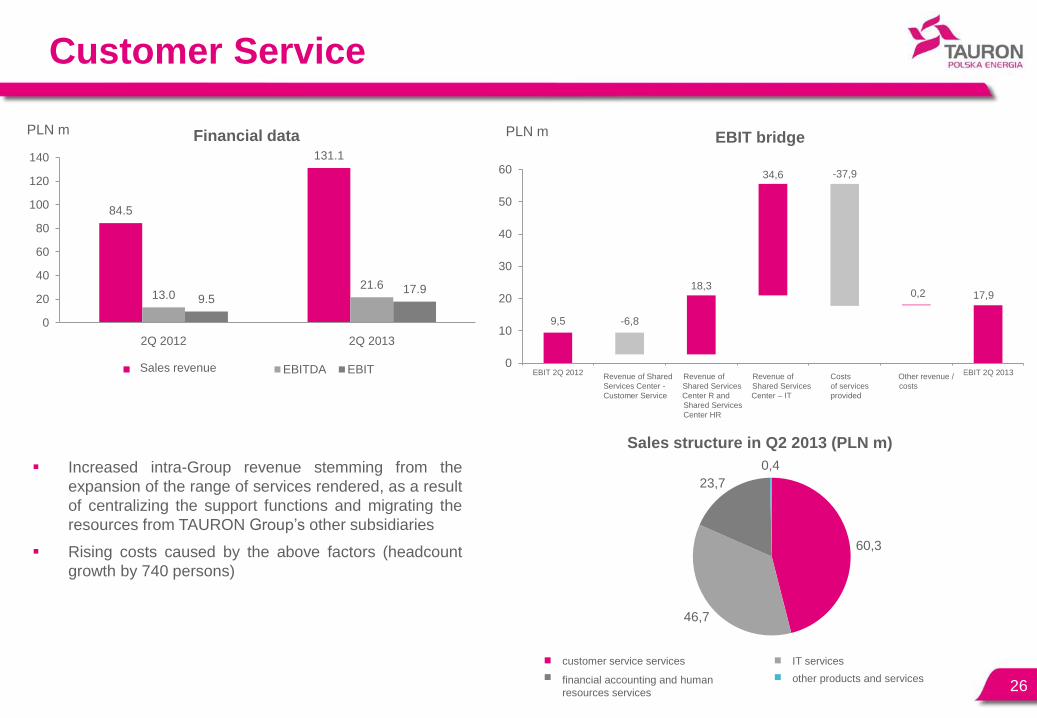
Increased intra-Group revenue stemming from the
expansion of the range of services rendered, as a result
of centralizing the support functions and migrating the
resources from TAURON Group‟s other subsidiaries
Rising costs caused by the above factors (headcount
growth by 740 persons)
84.5
131.1
13.0 21.6
9.5 17.9
0
20
40
60
80
100
120
140
2Q 2012 2Q 2013
Financial data
Przychody ze sprzedaży EBITDA EBIT
PLN m
60,3
46,7
23,7
0,4
Sales structure in Q2 2013 (PLN m)
usługi obsługi klienta usługi informatyczne
usługi finansowe księgowe i kadrowe pozostałe produkty i usługi
9,5 -6,8
18,3
34,6 -37,9
0,2 17,9
0
10
20
30
40
50
60
EBIT 2Q 2012 Przychody CUWOK
Przychody CUW R iCUW HR
Przychody CUW IT Kosztyświadczonych usług
Pozostałeprzychody/koszty
EBIT 2Q 2013
EBIT bridge PLN m
Sales revenue Revenue of Shared Revenue of Revenue of Costs Other revenue /
Services Center - Shared Services Shared Services of services costs
Customer Service Center R and Center – IT provided
Shared Services
Center HR
IT services
other products and services
customer service services
financial accounting and human
resources services
Electricity market price trends
27
Platforms:
TGE, TFS, GFI,
GPW-POEE
Forward BASE (Y+Q+M)
Forward PEAK (Y+Q+M)
Forward (weighted
average)
SPOT (TGE + GPW-POEE)
Total weighted average
Price
PLN/MWh
Volume
GWh
Price
PLN/MWh
Volume
GWh
Price
%
Volume
%
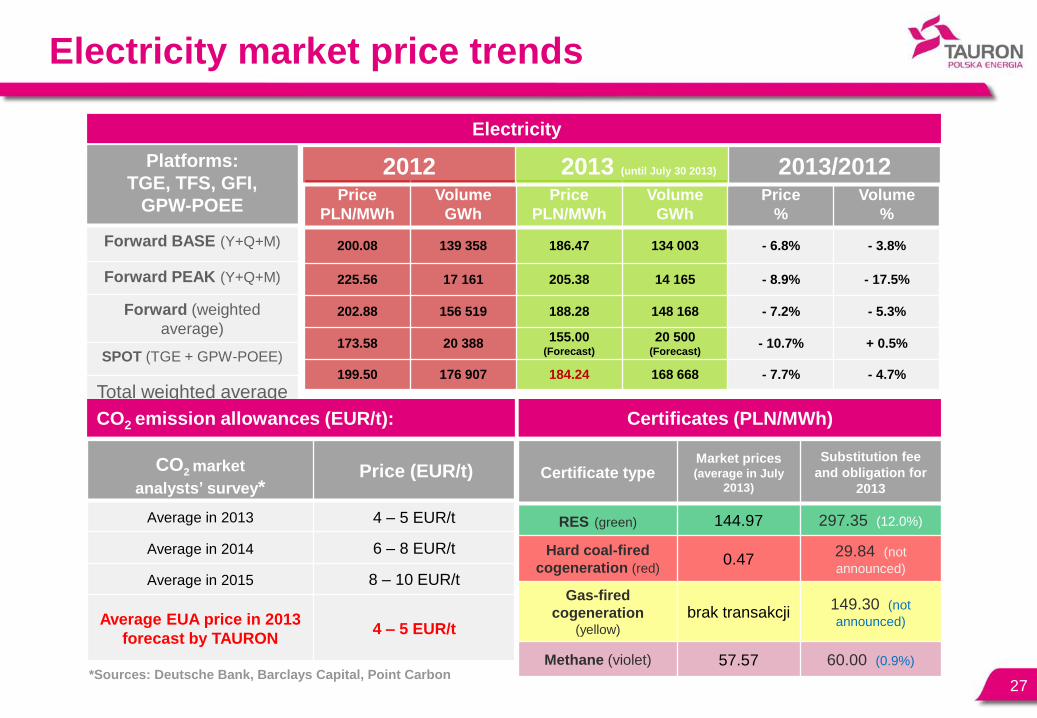
200.08 139 358 186.47 134 003 - 6.8% - 3.8%
225.56 17 161 205.38 14 165 - 8.9% - 17.5%
202.88 156 519 188.28 148 168 - 7.2% - 5.3%
173.58 20 388 155.00
(Forecast)
20 500 (Forecast)
- 10.7% + 0.5%
199.50 176 907 184.24 168 668 - 7.7% - 4.7%
Electricity
CO2 emission allowances (EUR/t): Certificates (PLN/MWh)
Certificate type Market prices (average in July
2013)
Substitution fee
and obligation for
2013
RES (green) 144.97 297.35 (12.0%)
Hard coal-fired
cogeneration (red) 0.47
29.84 (not
announced)
Gas-fired
cogeneration (yellow)
brak transakcji 149.30 (not
announced)
Methane (violet) 57.57 60.00 (0.9%)
2012 2013 (until July 30 2013) 2013/2012
CO2 market
analysts’ survey*
Price (EUR/t)
Average in 2013 4 – 5 EUR/t
Average in 2014 6 – 8 EUR/t
Average in 2015 8 – 10 EUR/t
Average EUA price in 2013
forecast by TAURON 4 – 5 EUR/t
*Sources: Deutsche Bank, Barclays Capital, Point Carbon
BASE contracting for 2013
28
140
150
160
170
180
190
200
210
220
2012-01-01 2012-03-05 2012-05-08 2012-07-11 2012-09-13 2012-11-16 2013-01-19 2013-03-24 2013-05-27 2013-07-30
Pri
ce
[P
LN
/MW
h]
Y-13 Q1-13 Q2-13 Q3-13 Q4-13
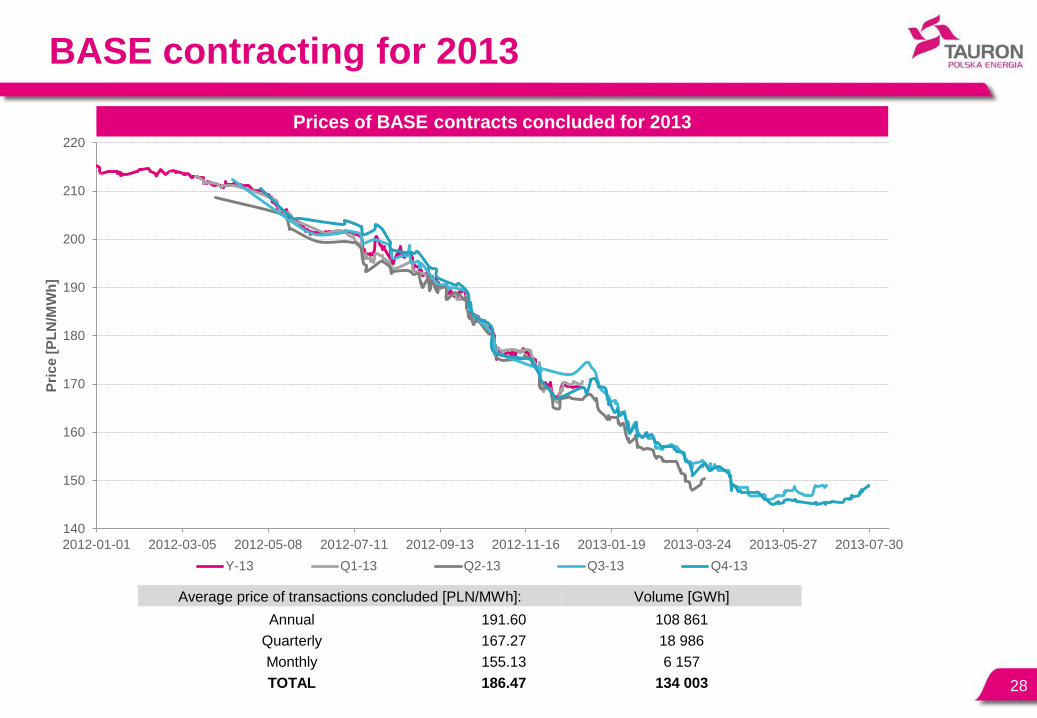
Prices of BASE contracts concluded for 2013
Average price of transactions concluded [PLN/MWh]: Volume [GWh]
Annual 191.60 108 861
Quarterly 167.27 18 986
Monthly 155.13 6 157
TOTAL 186.47 134 003
165
175
185
195
205
215
225
235
245
255
2012-01-01 2012-02-28 2012-04-26 2012-06-23 2012-08-20 2012-10-17 2012-12-14 2013-02-10 2013-04-09 2013-06-06 2013-08-03
Pri
ce
[P
LN
/MW
h]
Y-13 Q1-13 Q2-13 Q3-13 Q4-13
PEAK contracting for 2013
29
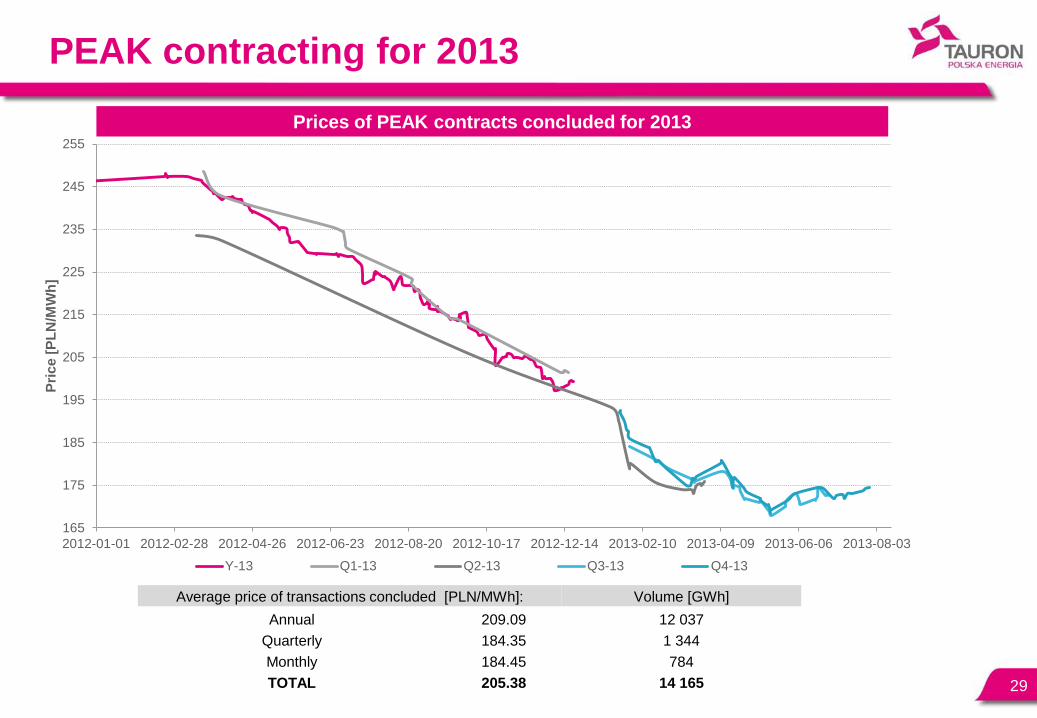
Prices of PEAK contracts concluded for 2013
Average price of transactions concluded [PLN/MWh]: Volume [GWh]
Annual 209.09 12 037
Quarterly 184.35 1 344
Monthly 184.45 784
TOTAL 205.38 14 165
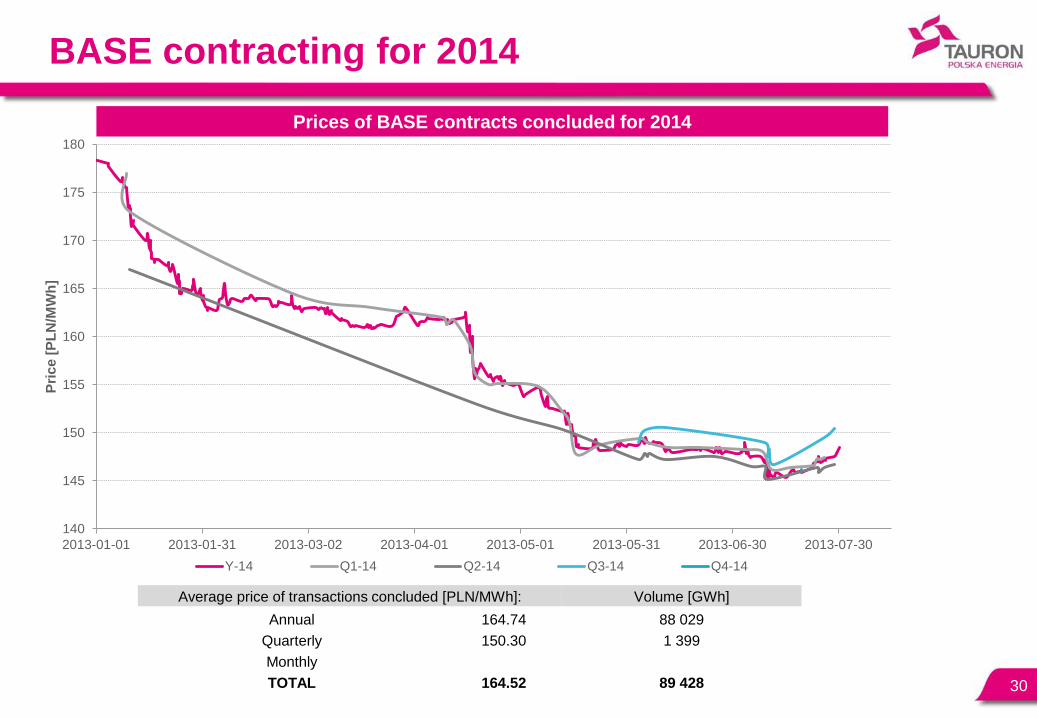
Average price of transactions concluded [PLN/MWh]: Volume [GWh]
Annual 164.74 88 029
Quarterly 150.30 1 399
Monthly
TOTAL 164.52 89 428
BASE contracting for 2014
30
140
145
150
155
160
165
170
175
180
2013-01-01 2013-01-31 2013-03-02 2013-04-01 2013-05-01 2013-05-31 2013-06-30 2013-07-30
Pri
ce
[P
LN
/MW
h]
Y-14 Q1-14 Q2-14 Q3-14 Q4-14
Prices of BASE contracts concluded for 2014
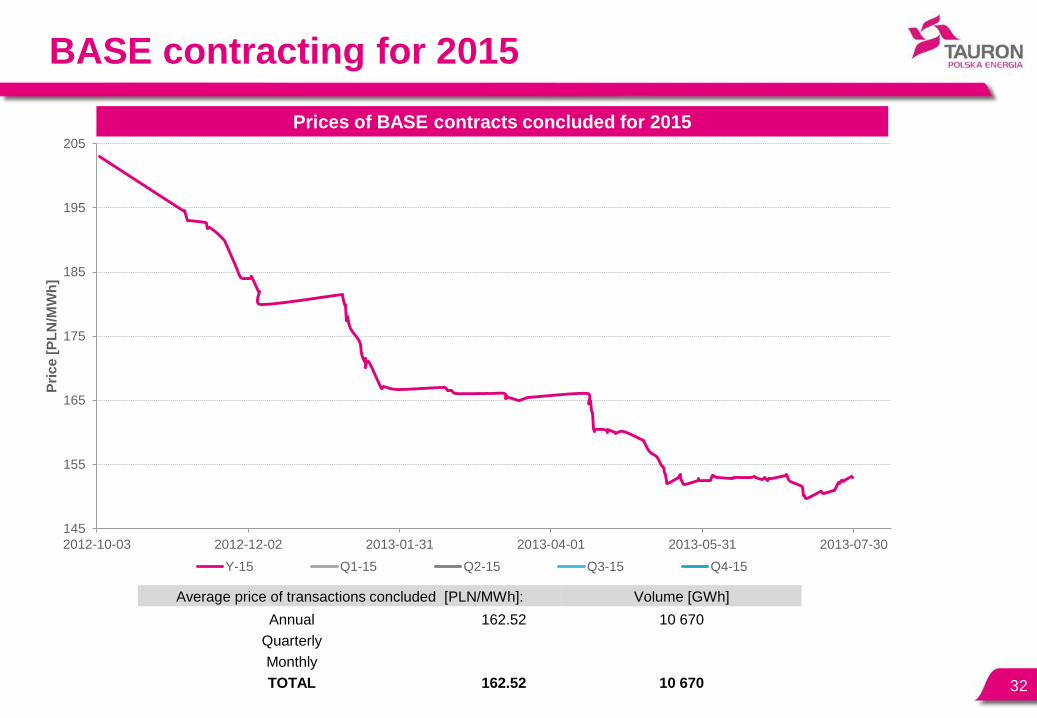
Average price of transactions concluded [PLN/MWh]: Volume [GWh]
Annual 176.52 5 186
Quarterly
Monthly
TOTAL 176.52 5 186
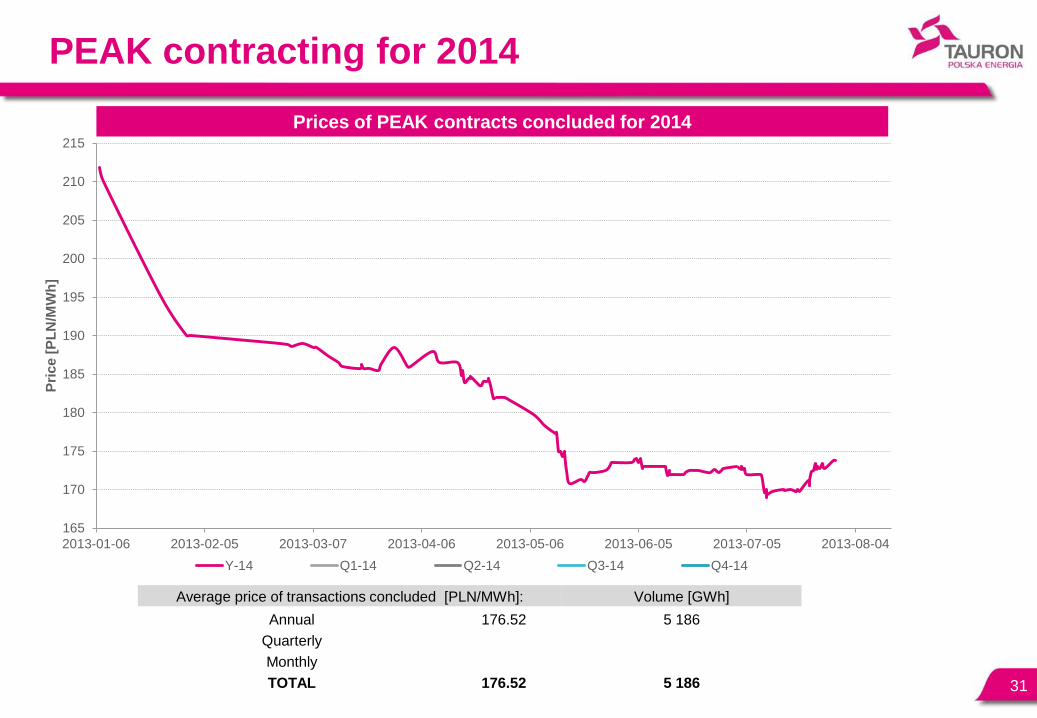
PEAK contracting for 2014
31
165
170
175
180
185
190
195
200
205
210
215
2013-01-06 2013-02-05 2013-03-07 2013-04-06 2013-05-06 2013-06-05 2013-07-05 2013-08-04
Pri
ce
[P
LN
/MW
h]
Y-14 Q1-14 Q2-14 Q3-14 Q4-14
Prices of PEAK contracts concluded for 2014
Average price of transactions concluded [PLN/MWh]: Volume [GWh]
Annual 162.52 10 670
Quarterly
Monthly
TOTAL 162.52 10 670
BASE contracting for 2015
32
145
155
165
175
185
195
205
2012-10-03 2012-12-02 2013-01-31 2013-04-01 2013-05-31 2013-07-30
Pri
ce
[P
LN
/MW
h]
Y-15 Q1-15 Q2-15 Q3-15 Q4-15
Prices of BASE contracts concluded for 2015