Embed Size (px)
Citation preview
TRANSIT COOPERATIVERESEARCHPROGRAMTCRP
REPORT 128
Sponsored by
the Federal
Transit Administration
Effects of TOD on Housing,Parking, and Travel
TRANSPORTATION RESEARCH BOARD 2008 EXECUTIVE COMMITTEE*
OFFICERS
CHAIR: Debra L. Miller, Secretary, Kansas DOT, Topeka VICE CHAIR: Adib K. Kanafani, Cahill Professor of Civil Engineering, University of California, Berkeley EXECUTIVE DIRECTOR: Robert E. Skinner, Jr., Transportation Research Board
MEMBERS
J. Barry Barker, Executive Director, Transit Authority of River City, Louisville, KYAllen D. Biehler, Secretary, Pennsylvania DOT, HarrisburgJohn D. Bowe, President, Americas Region, APL Limited, Oakland, CALarry L. Brown, Sr., Executive Director, Mississippi DOT, JacksonDeborah H. Butler, Executive Vice President, Planning, and CIO, Norfolk Southern Corporation,
Norfolk, VAWilliam A.V. Clark, Professor, Department of Geography, University of California, Los AngelesDavid S. Ekern, Commissioner, Virginia DOT, RichmondNicholas J. Garber, Henry L. Kinnier Professor, Department of Civil Engineering, University of Virginia,
CharlottesvilleJeffrey W. Hamiel, Executive Director, Metropolitan Airports Commission, Minneapolis, MNEdward A. (Ned) Helme, President, Center for Clean Air Policy, Washington, DCWill Kempton, Director, California DOT, SacramentoSusan Martinovich, Director, Nevada DOT, Carson CityMichael D. Meyer, Professor, School of Civil and Environmental Engineering, Georgia Institute of
Technology, AtlantaMichael R. Morris, Director of Transportation, North Central Texas Council of Governments, ArlingtonNeil J. Pedersen, Administrator, Maryland State Highway Administration, BaltimorePete K. Rahn, Director, Missouri DOT, Jefferson CitySandra Rosenbloom, Professor of Planning, University of Arizona, TucsonTracy L. Rosser, Vice President, Corporate Traffic, Wal-Mart Stores, Inc., Bentonville, ARRosa Clausell Rountree, Executive Director, Georgia State Road and Tollway Authority, AtlantaHenry G. (Gerry) Schwartz, Jr., Chairman (retired), Jacobs/Sverdrup Civil, Inc., St. Louis, MOC. Michael Walton, Ernest H. Cockrell Centennial Chair in Engineering, University of Texas, AustinLinda S. Watson, CEO, LYNX–Central Florida Regional Transportation Authority, OrlandoSteve Williams, Chairman and CEO, Maverick Transportation, Inc., Little Rock, AR
EX OFFICIO MEMBERS
Thad Allen (Adm., U.S. Coast Guard), Commandant, U.S. Coast Guard, Washington, DCJoseph H. Boardman, Federal Railroad Administrator, U.S.DOTRebecca M. Brewster, President and COO, American Transportation Research Institute, Smyrna, GAPaul R. Brubaker, Research and Innovative Technology Administrator, U.S.DOTGeorge Bugliarello, Chancellor, Polytechnic University of New York, Brooklyn, and Foreign Secretary,
National Academy of Engineering, Washington, DCSean T. Connaughton, Maritime Administrator, U.S.DOTLeRoy Gishi, Chief, Division of Transportation, Bureau of Indian Affairs, U.S. Department of the
Interior, Washington, DCEdward R. Hamberger, President and CEO, Association of American Railroads, Washington, DCJohn H. Hill, Federal Motor Carrier Safety Administrator, U.S.DOTJohn C. Horsley, Executive Director, American Association of State Highway and Transportation
Officials, Washington, DCCarl T. Johnson, Pipeline and Hazardous Materials Safety Administrator, U.S.DOTJ. Edward Johnson, Director, Applied Science Directorate, National Aeronautics and Space
Administration, John C. Stennis Space Center, MSWilliam W. Millar, President, American Public Transportation Association, Washington, DCNicole R. Nason, National Highway Traffic Safety Administrator, U.S.DOTJames Ray, Acting Administrator, Federal Highway Administration, U.S.DOT James S. Simpson, Federal Transit Administrator, U.S.DOTRobert A. Sturgell, Acting Administrator, Federal Aviation Administration, U.S.DOTRobert L. Van Antwerp (Lt. Gen., U.S. Army), Chief of Engineers and Commanding General,
U.S. Army Corps of Engineers, Washington, DC
TCRP OVERSIGHT AND PROJECTSELECTION COMMITTEE*
CHAIRRobert I. BrownsteinAECOM Consult, Inc.
MEMBERSAnn AugustSantee Wateree Regional Transportation AuthorityJohn BartosiewiczMcDonald Transit AssociatesMichael BlaylockJacksonville Transportation AuthorityLinda J. BohlingerHNTB Corp.Raul BravoRaul V. Bravo & AssociatesPeter CannitoMetropolitan Transportation Authority—Metro
North RailroadGregory CookVeolia TransportationTerry Garcia CrewsStarTranNathaniel P. Ford, Jr.SF Municipal Transportation AgencyKim R. GreenGFI GENFAREJill A. HoughNorth Dakota State UniversityAngela IannuzzielloENTRA ConsultantsJohn InglishUtah Transit AuthorityJeanne W. KriegEastern Contra Costa Transit AuthorityDavid A. LeeConnecticut TransitClarence W. MarsellaDenver Regional Transportation DistrictGary W. McNeilGO TransitMichael P. MelaniphyMotor Coach IndustriesFrank OteroPACO TechnologiesKeith ParkerCharlotte Area Transit SystemMichael ScanlonSan Mateo County Transit DistrictBeverly ScottMetropolitan Atlanta Rapid Transit AuthorityJames S. SimpsonFTAJames StemUnited Transportation UnionFrank TobeyFirst Transit
EX OFFICIO MEMBERSWilliam W. MillarAPTARobert E. Skinner, Jr.TRBJohn C. HorsleyAASHTOJames D. RayFHWA
TDC EXECUTIVE DIRECTORLouis SandersAPTA
SECRETARYChristopher W. JenksTRB
*Membership as of May 2008.*Membership as of June 2008.
TRANSPORTAT ION RESEARCH BOARDWASHINGTON, D.C.
2008www.TRB.org
T R A N S I T C O O P E R A T I V E R E S E A R C H P R O G R A M
TCRP REPORT 128
Research sponsored by the Federal Transit Administration in cooperation with the Transit Development Corporation
Subject Areas
Planning and Administration • Public Transit • Rail
Effects of TOD on Housing, Parking, and Travel
G. B. ArringtonPB PLACEMAKING
Portland, OR
Robert CerveroUNIVERSITY OF CALIFORNIA AT BERKELEY
Berkeley, CA
TCRP REPORT 128
Project H-27AISSN 1073-4872ISBN: 978-0-309-11748-7Library of Congress Control Number 2008907872
© 2008 Transportation Research Board
COPYRIGHT PERMISSION
Authors herein are responsible for the authenticity of their materials and for obtainingwritten permissions from publishers or persons who own the copyright to any previouslypublished or copyrighted material used herein.
Cooperative Research Programs (CRP) grants permission to reproduce material in thispublication for classroom and not-for-profit purposes. Permission is given with theunderstanding that none of the material will be used to imply TRB, AASHTO, FAA, FHWA,FMCSA, FTA, or Transit Development Corporation endorsement of a particular product,method, or practice. It is expected that those reproducing the material in this document foreducational and not-for-profit uses will give appropriate acknowledgment of the source ofany reprinted or reproduced material. For other uses of the material, request permissionfrom CRP.
NOTICE
The project that is the subject of this report was a part of the Transit Cooperative ResearchProgram conducted by the Transportation Research Board with the approval of theGoverning Board of the National Research Council. Such approval reflects the GoverningBoard’s judgment that the project concerned is appropriate with respect to both thepurposes and resources of the National Research Council.
The members of the technical advisory panel selected to monitor this project and to reviewthis report were chosen for recognized scholarly competence and with due considerationfor the balance of disciplines appropriate to the project. The opinions and conclusionsexpressed or implied are those of the research agency that performed the research, andwhile they have been accepted as appropriate by the technical panel, they are notnecessarily those of the Transportation Research Board, the National Research Council,the Transit Development Corporation, or the Federal Transit Administration of the U.S.Department of Transportation.
Each report is reviewed and accepted for publication by the technical panel according toprocedures established and monitored by the Transportation Research Board ExecutiveCommittee and the Governing Board of the National Research Council.
The Transportation Research Board of the National Academies, the National ResearchCouncil, the Transit Development Corporation, and the Federal Transit Administration(sponsor of the Transit Cooperative Research Program) do not endorse products ormanufacturers. Trade or manufacturers’ names appear herein solely because they areconsidered essential to the clarity and completeness of the project reporting.
TRANSIT COOPERATIVE RESEARCH PROGRAM
The nation’s growth and the need to meet mobility, environmental,and energy objectives place demands on public transit systems. Currentsystems, some of which are old and in need of upgrading, must expandservice area, increase service frequency, and improve efficiency to servethese demands. Research is necessary to solve operating problems, toadapt appropriate new technologies from other industries, and to intro-duce innovations into the transit industry. The Transit CooperativeResearch Program (TCRP) serves as one of the principal means bywhich the transit industry can develop innovative near-term solutionsto meet demands placed on it.
The need for TCRP was originally identified in TRB Special Report213—Research for Public Transit: New Directions, published in 1987and based on a study sponsored by the Urban Mass TransportationAdministration—now the Federal Transit Administration (FTA). Areport by the American Public Transportation Association (APTA),Transportation 2000, also recognized the need for local, problem-solving research. TCRP, modeled after the longstanding and success-ful National Cooperative Highway Research Program, undertakesresearch and other technical activities in response to the needs of tran-sit service providers. The scope of TCRP includes a variety of transitresearch fields including planning, service configuration, equipment,facilities, operations, human resources, maintenance, policy, andadministrative practices.
TCRP was established under FTA sponsorship in July 1992. Pro-posed by the U.S. Department of Transportation, TCRP was autho-rized as part of the Intermodal Surface Transportation Efficiency Actof 1991 (ISTEA). On May 13, 1992, a memorandum agreement out-lining TCRP operating procedures was executed by the three cooper-ating organizations: FTA, the National Academies, acting through theTransportation Research Board (TRB); and the Transit DevelopmentCorporation, Inc. (TDC), a nonprofit educational and research orga-nization established by APTA. TDC is responsible for forming theindependent governing board, designated as the TCRP Oversight andProject Selection (TOPS) Committee.
Research problem statements for TCRP are solicited periodically butmay be submitted to TRB by anyone at any time. It is the responsibilityof the TOPS Committee to formulate the research program by identi-fying the highest priority projects. As part of the evaluation, the TOPSCommittee defines funding levels and expected products.
Once selected, each project is assigned to an expert panel, appointedby the Transportation Research Board. The panels prepare project state-ments (requests for proposals), select contractors, and provide techni-cal guidance and counsel throughout the life of the project. The processfor developing research problem statements and selecting researchagencies has been used by TRB in managing cooperative research pro-grams since 1962. As in other TRB activities, TCRP project panels servevoluntarily without compensation.
Because research cannot have the desired impact if products fail toreach the intended audience, special emphasis is placed on dissemi-nating TCRP results to the intended end users of the research: tran-sit agencies, service providers, and suppliers. TRB provides a seriesof research reports, syntheses of transit practice, and other support-ing material developed by TCRP research. APTA will arrange forworkshops, training aids, field visits, and other activities to ensurethat results are implemented by urban and rural transit industrypractitioners.
The TCRP provides a forum where transit agencies can cooperativelyaddress common operational problems. The TCRP results support andcomplement other ongoing transit research and training programs.
Published reports of the
TRANSIT COOPERATIVE RESEARCH PROGRAM
are available from:
Transportation Research BoardBusiness Office500 Fifth Street, NWWashington, DC 20001
and can be ordered through the Internet at
http://www.national-academies.org/trb/bookstore
Printed in the United States of America

CRP STAFF FOR TCRP REPORT 128
Christopher W. Jenks, Director, Cooperative Research ProgramsCrawford F. Jencks, Deputy Director, Cooperative Research ProgramsGwen Chisholm Smith, Senior Program OfficerEileen P. Delaney, Director of PublicationsMargaret B. Hagood, Editor
TCRP PROJECT H-27A PANELField of Service Policy and Planning
Richard G. Bickel, AICP, Delaware Valley Regional Planning Commission, Philadelphia, PA (Chair)Edward A. Beimborn, University of Wisconsin–Milwaukee, Milwaukee, WITodd Hemingson, Capital Metropolitan Transportation Authority, Austin, TXJack Kanarek, New Jersey Transit Corporation, Newark, NJJack Limber, San Diego, CAAnastasia Loukaitous-Sideris, University of California–Los Angeles, Los Angeles, CAJeff Ordway, San Francisco Bay Area Rapid Transit District, Oakland, CAJeffrey L. Spencer, California DOT, Sacramento, CAEffie Stallsmith, FTA LiaisonRichard Weaver, APTA LiaisonPeter Shaw, TRB Liaison
AUTHOR ACKNOWLEDGMENTS
The research reported was performed under TCRP Project H-27A, lead by G.B. Arrington and RobertCervero.
Other authors of this report are Todd Borkowitz, Kimi Iboshi Sloop, Emily Hull, Jennifer Rosales, PBPlaceMaking, Portland, Oregon; Shelley Poticha and Jeff Wood, Center for Transit Oriented Develop-ment, Oakland, California; and Robert Dunphy and Carl Koelbel, Urban Land Institute, Washington, D.C.
Cover art: Illustration by Dan deAngeli.
C O O P E R A T I V E R E S E A R C H P R O G R A M S
TCRP Report 128: Effects of TOD on Housing, Parking, and Travel provides original data onTOD residential trip generation and parking, the behavior and motivation of TOD residents,employees, and employers in their mode choice. The report also identifies best practices to pro-mote, maintain, and improve TOD-related transit ridership.
This report will be helpful to project, land-use, and transportation planners; transit agencies;the development community; and federal, state, and local decision makers considering transit-oriented development.
This research builds on prior work done under TCRP Project H-27, which is publishedas TCRP Research Results Digest 52: Transit-Oriented Development and Joint Development inthe United States: A Literature Review and as TCRP Report 102: Transit-Oriented Develop-ment in the United States: Experiences, Challenges, and Prospects.
A related publication to this report, TCRP Research Results Digest 52: Transit-OrientedDevelopment and Joint Development in the United States: A Literature Review, reviews perti-nent literature and research findings related to TOD and joint development. It contains abibliography annotated by subject area.
TCRP Report 102 is a national assessment of TOD issues, barriers, and successes. TCRP102 included 10 case studies from a variety of geographic and development settings. Report102 indicated that increased ridership is the principal goal of transit agencies in supportingTODs. However, increased ridership as a result of TOD is a complex outcome involvingbehavioral, locational, and situational factors. The ties between livable communities andtransit ridership remained largely unaddressed.
TCRP Report 128 addresses the following fundamental questions: (1) What are the demo-graphic profiles of TOD residents and employers; (2) What motivates residents or employ-ers to locate in TODs; (3) What are the travel characteristics (e.g., frequency of travel by dif-ferent modes) of people who live or work in a TOD; (4) What was the travel pattern of theTOD resident prior to moving to the TOD; (5) What levels of transit connectivity to desiredorigins and destinations are required to promote transit ridership at TODs; (6)What moti-vates or impedes transit ridership in a TOD; (7)Which strategies have been effective inincreasing transit ridership at TODs; (8) What steps should transit agencies take in support-ing TODs to maximize transit ridership; and (9) What TOD land-use and design features(e.g., mixed land-use, traffic calming, bus bulbs, short blocks, street furniture) have had aneffect on travel patterns, transit ridership, or the decision to locate in a TOD?
F O R E W O R D
By Gwen Chisholm SmithStaff OfficerTransportation Research Board
C O N T E N T S
1 Summary1 Literature Review4 TOD Housing Transportation Performance
6 Section 1 Literature Review6 TOD Travel Characteristics
12 Transit System and Land Use Influences19 TOD Ridership Strategies22 TOD Resident/Tenant Characteristics
29 Section 2 Does TOD Housing Reduce Automobile Trips?29 Study Projects31 Study Methods32 Data Compilation36 Comparison of Vehicle Trip Generation Rates40 How Do Rates Vary?45 Multiple Regression Predictions of TOD Housing Trip Generation Rates47 Applying the Research: Four TOD Housing Case Studies51 Implications of Applying New Standards for TOD Housing54 Conclusion and Recommendations
57 References
S U M M A R Y
This research helps confirm what had been intuitively obvious: in the four metropolitanareas studied, transit-oriented development (TOD) housing produced considerably lesstraffic than what is generated by conventional development. Yet the way parking is designedfor most TODs is based on the assumption that there is little difference between TOD andconventional development with respect to the traffic they generate and the parking spacesthey are built with. One likely result of this fallacious assumption is that fewer TOD projectsget built. TOD developments that do get built are less affordable and less sustainable thanthey might be, because they are subject to incorrect assumptions about the traffic impact theygenerate. Many of the hoped for benefits (i.e., less time stuck in traffic and lower housingcosts), from the nearly $75 billion in public dollars invested in rail transit over the past 11 years,are not being realized.
The policy value of TOD projects (e.g., less automobile travel) is well understood. Thosepotential benefits are muted since most U.S. TODs are parked oblivious to the fact that a railstop is nearby. This study looks at the most recent literature on the subject and the actualtransportation performance of 17 TOD projects.
The report is divided into two sections:
• Section 1 - Literature Review• Section 2 - Research Findings
Literature Review
A lot more is known now about the travel performance of TODs. Whereas the first genera-tions of TOD focused primarily on advocacy and assisting early adopters, there now is increasedmeasurement and understanding of TOD travel outcomes. Some key findings in this literaturereview include:
• Between 1970 and 2000, transit ridership for work trips increased in TOD zones, whereas rid-ership declined markedly in the metro areas surrounding TODs.
• TOD households are twice as likely to not own a car and own roughly half as many cars ascomparable households not living in TODs.
• Among the factors that attract households to TOD, households consistently place high valueon neighborhood design, home prices and perceived value, and transit proximity.
• Access to high quality transit is becoming increasingly important to firms trying to attractcreative class workers (professionals who use knowledge to create new forms and problemsolve, such as architects, engineers, professors, artists, computer programmers, etc.) in theknowledge economy (the current phase of post-industrial United States, where economic
Effects of TOD on Housing, Parking, and Travel
1
2
development in cities is primarily through jobs and industries that are based on intellectualproperty).
The literature review focused on nine questions related to TOD travel characteristics, transitsystem and land-use influences, TOD ridership strategies and TOD resident/tenant characteris-tics. The most current knowledge on TOD was analyzed. The following is a summary of the keyconclusions for each question.
TOD Travel Characteristics
1. What are the travel characteristics (e.g., frequency of travel by different modes) of people wholive or work in a TOD?
2. What was the travel pattern of the TOD resident prior to moving to the TOD?
TOD commuters typically use transit two to five times more than other commuters in theregion. TOD transit mode share can vary from 5% to near 50%. The findings are similar for non-work trips: transit share is two to five times higher, although mode shares are typically lower thancommute trips (2% to 20%). The primary reason for the range is that transit use is heavilyinfluenced by relative travel times with automobile and extensiveness of transit service, whichcan vary markedly across regions. As the transit network links to more job centers, educationalopportunities, and cultural facilities, transit use increases. From this perspective, TOD type (e.g.,suburban neighborhood versus suburban center) is less important than specific location withinthe region and the quality of connecting transit service. Although one could reasonably infer theapproximate transit mode share of a hypothetical new TOD by comparing it to similar TODs inthe same, existing system, there is no rule of thumb or single mode share number that can beeasily applied to a hypothetical new TOD along a new rail or bus system. This is due to widelyvarying local travel conditions and employment distributions.
A primary reason for higher TOD transit use is self-selection. Current transit users and thoseprecluded to use transit seek out TOD. The travel pattern of TOD residents prior to moving tothe TOD depended on their previous access to transit. When work location was unchanged,often a significant percent (e.g., 50%) were transit users. Among commuters with no previoustransit access, transit use increased (up to 50%).
Transit System and Land Use Influences
1. What levels of transit connectivity to desired origins and destinations are required to promotetransit ridership at TODs?
2. What TOD land-use and design features (e.g., mixed land use, traffic calming, bus bulbs,short blocks, street furniture) have had an effect on travel patterns, transit ridership, or thedecision to locate in a TOD?
Research shows that system extensiveness is positively correlated with transit ridership. Exten-sive transit networks also are most often found in cities with worse traffic congestion (i.e., slow autotrip times) and higher parking costs, and these three factors work together to increase TOD transitridership. The general consensus is that transit service headways of 10 minutes are ideal to supporta transit lifestyle. There is no single, definitive threshold for connectivity, and measures such as trackmiles and number of transit stations are not the best predictors of ridership on their own. Whatmatters is transit travel times relative to auto travel times. For example, an extensive but very slowtransit system likely will attract few riders if highway congestion is not severe. Conversely, a singlefast rail corridor adjacent to a highly congested auto corridor likely will attract high ridership.
The location of jobs accessible by transit influences transit ridership. Systems that generate thehighest commute ridership have a high percentage of regional jobs accessible by fast transit. Forwork trips, proximity to rail stations is a stronger influence on transit use than land use mix orquality of walking environment. Thus, the most effective strategy to increase TOD ridership isto increase development densities in close proximity to transit. Employment densities at tripends have more influence on ridership than population densities at trip origins. It is critical tolocate jobs near transit in order to attract households to TODs. However, relative travel time(transit versus auto) is still more important than any land use factor (density, diversity of uses,design) in ridership.
Mixed uses in TODs allow the transit service to be used for a variety of trip purposes through-out the day and week, but as a travel benefit, this is not a primary consideration for prospectiveTOD residents. Employment access is a primary consideration. Mixed uses (e.g., local restau-rants) and urban design treatments (e.g., pedestrian pathways) are important for their amenityand design value in attracting residents and visitors or customers. TOD residents highly valuegood neighborhood design in addition to transit access to work. Urban design and the local land-use mix may influence which TOD prospective residents choose to live in. Good design also maymake a TOD a more desirable location to travel to.
TOD Ridership Strategies
1. What motivates or impedes transit ridership in a TOD?2. What strategies have been effective in increasing transit ridership at TODs?3. What steps should transit agencies take in supporting TODs to maximize transit ridership?
Factors that most influence transit ridership are station proximity, transit quality, and park-ing policies. Fast, frequent, and comfortable transit service will increase ridership, as will highparking charges and/or constrained parking supply. The availability of free or low-cost parkingis a major deterrent to transit ridership.
Successful ridership strategies include: TOD transit pass programs, parking reductions, andcar-sharing programs. TOD transit programs will be similar to other transit programs. That said,because TOD residents and households are by definition the nearest to transit, TODs should beamong the first locations that transit agencies implement specialized programs.
TOD (e.g., mixed uses, high densities, reduced parking) is still illegal around station areas inmany cities and transit districts, creating a barrier for development. Steps that transit agenciesare taking to promote TOD include: reconsidering replacement parking requirements at parkand rides, advocating for zoning changes with TOD entitlements, land assembly, joint develop-ment, and educational efforts (e.g., producing TOD guidebooks).
TOD Resident/Tenant Characteristics
1. What are the demographic profiles of TOD residents and employers?2. What motivates residents or employers to locate in TODs? Examples of motivators may
include the quality of schools, access to jobs, housing affordability, presence of transit ser-vices, neighborhood services and amenities, and community perception.
The majority of TOD residents along new transit systems are childless singles or couples. Theage spectrum is wide: often younger working professionals or older empty-nesters. TOD residentsmay have low, medium, or high incomes; this is driven by the design and price of the specific TODhousing. TOD developers are researching the market and proactively building products for tar-geted market sectors. The demographic characteristics allow developers to more finely target their
3

4
product to potential end users. More higher incomes are being served as the United States con-tinues to go through a robust construction phase of denser urban residential product.
TOD households typically own fewer cars because they have smaller households and becausethey may forgo extra cars due to transit’s proximity. TOD households are almost twice as likelyto not own any car and own almost half the number of cars of other households.
The top three reasons households give for selecting a TOD are housing/neighborhood design,housing cost, and proximity to transit.
TOD Housing Transportation Performance
Actual transportation performance of 17 TOD built projects was assessed by using pneumatictubes stretched across the driveways to count the passage of motorized vehicles. The housingprojects of varying sizes are in four urbanized areas of the country: Philadelphia/N.E. New Jersey;Portland, Oregon; metropolitan Washington, D.C.; and the East Bay of the San Francisco BayArea. To help understand the physical implications of the research, eight residential TOD siteplan case studies were developed to test some of the physical implications of reducing residen-tial parking ratios at a range of potential densities on a theoretical eight acre TOD.
One motivation for this research was to provide original and reliable data to help seed anupdate of the Institute of Transportation Engineers (ITE) trip generation and parking genera-tion rates, from which local traffic and parking impacts are typically derived, and impact fees areset. (A specific objective of the research has been to help prepare the way for ITE and ULI toupdate their guidance on parking for TODs to better reflect actual performance.) Some analystsare of the opinion there is a serious suburban bias in current ITE rates. Typically, empirical dataused to set generation rates are drawn from suburban areas with free and plentiful parking andlow-density single land uses. Since ITE’s auto trip reduction factors are based only on a fewmixed-use projects in Florida (to reflect internal trip capture), there has been little or no obser-vation of actual TODs. The end result is that auto trip generation is likely to be overstated forTODs. This can mean that TOD developers end up paying higher impact fees, proffers, andexactions than they should since such charges are usually tied to ITE rates.
Results of this research clearly show that TOD-housing results in fewer trips in the foururbanized areas that were studied. The research confirms the ITE trip generation and parkinggeneration rates underestimate automobile trip reduction for TOD housing. The ITE manualpresents weighted averages of trip generation. The weighted average vehicle trip rates for thisstudy were computed for all 17 projects combined for weekday, AM peak, and PM peak. Over atypical weekday period, the 17 surveyed TOD-housing projects averaged 44% fewer vehicle tripsthan estimated by the ITE manual (3.754 trips versus 6.715). Weighted average differentials wereeven larger during peak periods: 49% lower rates during the AM peak and 48% lower rates dur-ing the PM peak. To the degree that impact fees are based on peak travel conditions, one caninfer that traffic impacts studies might overstate the potential congestion-inducing effects ofTOD-housing in large rail-served metropolitan areas, such as Washington, D.C., by up to 50%.
One implication of the research is that parking ratios for residential TODs are likely to be over-stated by the same order of magnitude since they also are based on ITE data. Some of thecumulative impacts of over-parking TODs are illustrated in the site plan case studies. TOD siteplan case studies help to demonstrate that under the right conditions lowering residential park-ing ratios by 50% for TODs in station areas with quality transit service can result in:
• An increase between 20% to 33% in the potential density of a residential TOD, depending onthe residential building type;
• Savings from 5% to 36% on residential parking costs, after accounting for increases in thenumber of units to be parked from increased residential density; and
• Potentially greater developer profits and/or increased housing affordability from achievinghigher densities, lower capital costs for parking, and reduced traffic impact fees.
Rightsizing parking ratios and traffic generation to the actual performance of TOD wouldlikely result in some important implications on the physical form and performance of TODdevelopments:
• Local officials and neighborhoods may be more apt to support increases in residential densi-ties near transit if research shows TODs result in fewer trips than conventional development.
• TOD developers would have easier development approvals and the benefits of TOD wouldnot be compromised away.
• TOD developers would likely pay lower traffic-related impact fees and exactions. Thosesavings could be passed on to consumers as lower housing costs.
• With lower levels of traffic generated from TODs, it could be argued that it makes no sense toconstruct roadway improvements for TOD-related traffic that is not likely to materialize.
• Rightsizing new road and intersection improvements to reflect actual transportation per-formance could result in more compact development patterns and a higher quality pedestrianenvironment since less land may be used for road improvements.
• The potential for higher densities in TODs because of the decreased amount of land dedicatedto parking and the reduced cost of parking.
Smart growth requires smart calculations; impact fees, parking ratios, and road improvementsneed to account for the likely trip-reduction effects of TOD. Research study results indicate thatresidential TOD parking ratios can be tightened and fees lowered to reflect the actual trans-portation performance of TODs. Given that TODs have historically been over-parked, theincorporation of research results into revised parking ratios is an important step toward nationalrecognition of the expected community benefits of TOD.
5
6
For the TCRP H-27A project, the panel identified a numberof fundamental questions about transit ridership and TOD.For this literature review, the research team divided thesequestions into four general areas: 1) TOD travel characteris-tics; 2) transit system and land-use characteristics; 3) TODridership strategies; and 4) TOD resident/tenant characteristics.Findings related to these topic areas and specific questionsfollow.
The existing research provides a largely complete storyabout transit ridership and TOD. There is significant and verydetailed information about specific TOD projects in Portland,Oregon, Arlington County, Virginia (suburban Washington,D.C.), and the San Francisco Bay Area, where a significantamount of travel behavior data has been collected throughresident surveys (and academic research). At the macro level,U.S. Census data also has been thoroughly analyzed to revealdifferences between TOD households and other householdsin travel behavior and demographics. The findings are con-sistent with each other and consistent with economic andbehavior studies that explain why people travel as they do.Many cities still lack detailed primary (survey) data. Thatsaid, it is reasonable to assume that transportation and eco-nomic forces that shape TOD residency and travel behaviorin California, for instance, also would apply to other settings(e.g., Dallas).
A lot more is known about the travel performance of TODs.Whereas the first generations of TOD focused primarily onadvocacy and assisting early adopters, now there is increasedmeasurement and understanding of TOD travel outcomes.Some key findings in this literature review include:
• Between 1970 and 2000, transit ridership for work trips in-creased in TOD zones, whereas ridership declined markedlyin the metro areas surrounding TODs.
• TOD households are twice as likely to not own a car, andown roughly half as many cars as comparable householdsnot living in TODs.
• Among the factors that attract households to TOD, house-holds consistently place high value on neighborhood design,home prices and perceived value, and transit proximity.
• Access to high quality transit is becoming increasinglyimportant to firms trying to attract “creative class” workersin the knowledge economy.
In addition to the literature on TOD, there are larger bodiesof literature that address transit operations (to maximize rid-ership) and the travel impacts of development density, mixeduses, and urban design. This literature review does not describeall of those studies and focuses on research pertaining to TODspecifically. That said, some key findings from the generaltransit and land use literature are included, as they would notbe expected to differ significantly for TODs.
TOD Travel Characteristics
1. What are the travel characteristics (e.g., frequency of travelby different modes) of people who live or work in a TOD?
2. What was the travel pattern of the TOD resident prior tomoving to the TOD?
Key Conclusions
• TOD commuters typically use transit two to five times morethan other commuters in the region. TOD transit modeshare can vary from 5% to nearly 50%.
• Similar to findings for nonwork trips, transit share is twoto five times higher, although mode shares are typicallylower than commute trips (2% to 20%).
• The primary reason for range is that transit use is heavilyinfluenced by relative travel times with automobile andextensiveness of transit service, which can vary markedlyacross regions. As the transit network links to more jobcenters, educational opportunities, and cultural facilities,transit use increases. From this perspective, TOD type
S E C T I O N 1
Literature Review
(e.g., suburban neighborhood versus suburban center) isless important than specific location within the region andthe quality of connecting transit service.
• The transit mode shares are statistically reliable, and for anexisting rail system, one could reasonably infer the approx-imate transit mode share of a hypothetical new TOD bycomparing it to similar TODs in the same system.
• However, there is no rule of thumb or single mode sharenumber that can be easily applied to a hypothetical newTOD along a new rail or bus system, due to widely varyinglocal travel conditions and employment distributions.
• A primary reason for higher TOD transit use is self selec-tion. Current transit users and those predisposed to usetransit seek out TOD.
• When work location is unchanged, often a significant per-cent (e.g., 50%) were transit users before moving to the TOD.
• Among commuters with no previous transit access, transituse can increase (up to 50%).
Findings
The literature shows that those who live and work neartransit stops patronize transit appreciably more than the typ-ical resident of a region. The most recent comprehensive studyon the travel characteristics of TOD residents and workers isthe 2003 study, Travel Characteristics of Transit-Oriented De-velopment in California (Lund, Cervero, Willson, 2004). Inthis study, ridership statistics were developed for those livingat 26 residential sites near rail stations in California’s fourlargest metropolitan areas, as well as for a smaller sample ofoffice workers, retail shoppers, hotel workers, and guests ofprojects near rail stations.
Key findings about station-area residents include:
• Commute mode share: From travel-diary responses, aboutone-quarter of the surveyed California TOD residents tooktransit to work. This was nearly five times higher than tran-sit’s commute-trip modal share by residents who lived inthe surrounding community. This five-fold ridershipbonus associated with transit-oriented living is similar tothat found in a comprehensive survey of California TODresidents conducted in 1992 (Cervero, 1994). Patterns var-ied significantly across the state, with transit capture ratesof nearly 50% for several Bay Area TODs, and less than 5%for some Southern California locales. About half of theworking residents of all California TODs said they nevertake transit to work.
• Frequency of travel: Across the 26 surveyed residentialsites, 29% of tenants who responded to the survey indi-cated they commute by transit every workday, and another7% reported they commute several times a week. In thecase of the Pleasant Hill TOD, 49% of residents indicated
they took Bay Area Rapid Transit (BART) to work everyweekday.
• Noncommuter mode share: Transit served, on average, 8%of nonwork trips made by surveyed station-area residents,again with considerable variation across TODs. At BART’sPleasant Hill station for instance, transit served 15% of non-work trips compared to less than 2% for sampled projectsin Long Beach and Los Angeles. The differential betweentransit’s modal splits for work versus nonwork trips high-lights the role that self-selection plays in shaping travelchoices. Notably, people tend to move to TODs partly be-cause of the desire to rail-commute and express this pref-erence most visibly in their work-trip modal choice.
• Trends: Transit’s modal share remained fairly stable overthe 1993-2003 period for neighborhoods surrounding railstations. However, since transit’s market share of trips gen-erally eroded over this 10-year period, it appears that TODareas have weathered the secular trend toward decliningtransit ridership better than most settings.
• Length of residency: There is some evidence that those whohave lived the longest in California TODs tend to use tran-sit most often. Among those who lived in a TOD for morethan a decade, the share taking transit for their “main trips”(both work and nonwork purposes) averaged 29% versus17% among those who had lived in the TOD for less thanfive years.
• Intervening factors: Consistent with other research on modechoice, many other factors played a critical role in influ-encing the modal choices of station-area residents. Policiesthat significantly affected modal choices included: free park-ing at the workplace, flex-time privileges, employer contri-butions to the cost of transit passes, and, to a less degree,land-use variables like density and street connectivity.Additional information about these intervening factors isincluded in subsequent sections of this literature review.
Key findings about station-area office workers include:
• Commute mode share: From the survey of those work-ing at 10 predominantly suburban office buildings nearCalifornia rail stations, on average, around 12% traveled towork via rail transit. This is around five percentage pointsmore than rail’s market share for TOD office workers whowere surveyed in 1992 (Cervero, 1994). Modal splits variedmarkedly, however. For two of the 10 office projects, 25%or more of surveyed workers rail-commuted. These twoprojects are in downtown settings with comparatively highdensities, good regional accessibility, mandatory parkingcharges, and within a block of the rail station.
• Intervening factors: Besides proximity to rail transit, otherfactors that encouraged office workers to rail-commuteincluded: availability of free parking at the workplace;
7
employer-provided transit passes; quality of the walkingcorridor from the rail station to the office building; andfeeder bus frequency.
Key findings about station-area hotel patrons and employ-ees and retail customers include:
• Commute mode share: Of 111 workers surveyed at twohotels near rail transit in California, 41% traveled to workby rail transit.
• Travel by hotel patrons: Transit was not used to access hotelsnear rail stations among the small sample of guests whowere surveyed. More than half of the surveyed guests indi-cated that they used transit during their stay.
• Travel by retail patrons: Of 1,259 retail patrons surveyed atthree shopping facilities near rail stations in California,13% had arrived by rail transit.
Research from metropolitan Washington, D.C. also foundhigher transit market shares among station-area residents,attributable in part to the high levels of accessibility conferredby the Washington Metropolitan Area Transit Authority(WMATA) rail network (JHK and Associates, 1989). Overthe past three decades, Arlington County has channeled newdevelopment into high-density, mixed-use projects aroundfive closely spaced urban rail stations in the Rosslyn-BallstonCorridor, and employed a variety of techniques, includingtransportation demand management programs, to encourageresidents to use transit. As a result, 47% of residents use modesof travel other than the automobile to get to work, and 73%arrive at rail stations on foot, providing a cost savings because
neither the county nor WMATA have to provide long-termcommuter parking; land parcels that were devoted to park-ing early on have all been developed. About 40,000 ridersboard daily at the five urban stations in the Rosslyn-BallstonCorridor. About 29,000 riders board at the four suburbanstations farther out along the Orange Line; only 15% of thesetransit riders arrive at their stations on foot, while 58% arriveby car (Dittmar and Ohland, 2004).
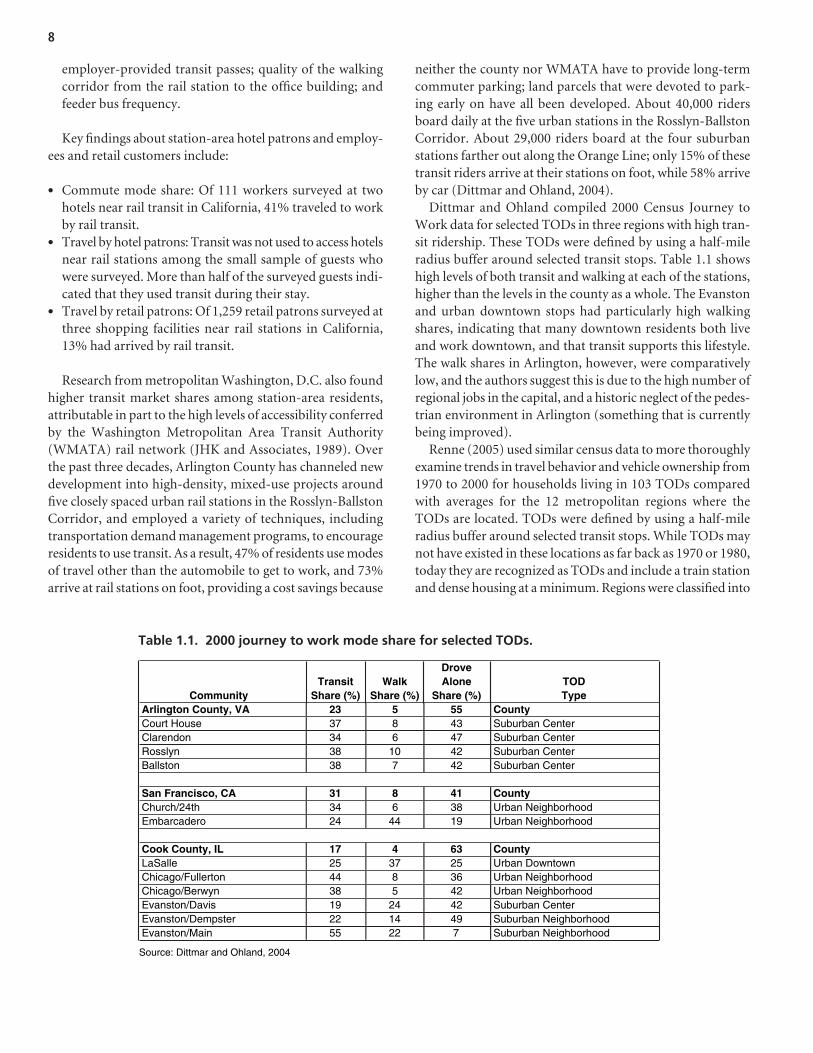
Dittmar and Ohland compiled 2000 Census Journey toWork data for selected TODs in three regions with high tran-sit ridership. These TODs were defined by using a half-mileradius buffer around selected transit stops. Table 1.1 showshigh levels of both transit and walking at each of the stations,higher than the levels in the county as a whole. The Evanstonand urban downtown stops had particularly high walkingshares, indicating that many downtown residents both liveand work downtown, and that transit supports this lifestyle.The walk shares in Arlington, however, were comparativelylow, and the authors suggest this is due to the high number ofregional jobs in the capital, and a historic neglect of the pedes-trian environment in Arlington (something that is currentlybeing improved).
Renne (2005) used similar census data to more thoroughlyexamine trends in travel behavior and vehicle ownership from1970 to 2000 for households living in 103 TODs comparedwith averages for the 12 metropolitan regions where theTODs are located. TODs were defined by using a half-mileradius buffer around selected transit stops. While TODs maynot have existed in these locations as far back as 1970 or 1980,today they are recognized as TODs and include a train stationand dense housing at a minimum. Regions were classified into
8
CommunityTransit
Share (%)Walk
Share (%)
DroveAlone
Share (%)TODType
Arlington County, VA 23 5 55 CountyCourt House 37 43 Suburban CenterClarendon 34 6
6
7
847 Suburban Center
Rosslyn 38 10 42 Suburban CenterBallston 38 42 Suburban Center
San Francisco, CA 31 8 41 CountyChurch/24th 34 38 Urban NeighborhoodEmbarcadero 24 44 19 Urban Neighborhood
Cook County, IL 17 4 63 CountyLaSalle 25 37 25 Urban DowntownChicago/Fullerton 44 8 36 Urban NeighborhoodChicago/Berwyn 38 5 42 Urban NeighborhoodEvanston/Davis 19 24 42 Suburban CenterEvanston/Dempster 22 14 49 Suburban NeighborhoodEvanston/Main 55 22 7 Suburban Neighborhood
Source: Dittmar and Ohland, 2004
Table 1.1. 2000 journey to work mode share for selected TODs.
three groups: older and redeveloping (e.g., Chicago, Illinois;New York/New Jersey), maturing heavy rail (e.g., Atlanta,Georgia; Miami, Florida; San Francisco, California; Washing-ton, D.C.), and growing regions with light rail (e.g., Portland,Oregon; San Diego, California; Los Angeles, California; Dallas,Texas; Denver, Colorado; and Salt Lake City, Utah).
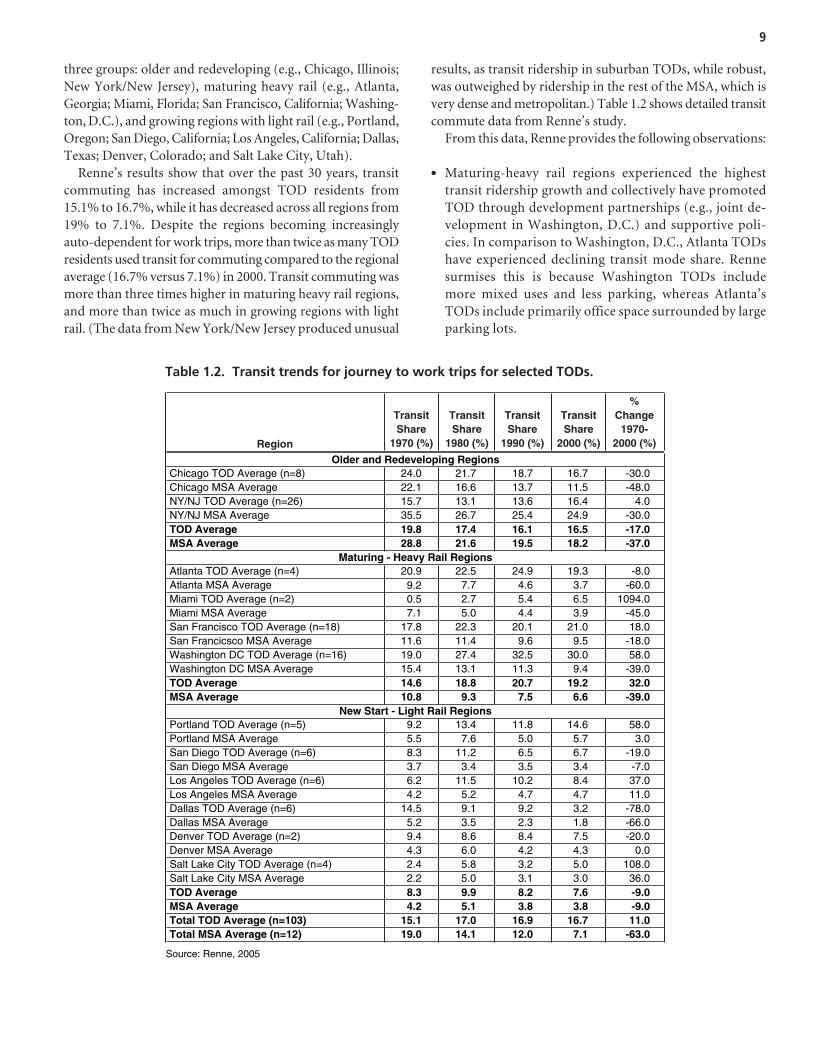
Renne’s results show that over the past 30 years, transitcommuting has increased amongst TOD residents from15.1% to 16.7%, while it has decreased across all regions from19% to 7.1%. Despite the regions becoming increasinglyauto-dependent for work trips, more than twice as many TODresidents used transit for commuting compared to the regionalaverage (16.7% versus 7.1%) in 2000. Transit commuting wasmore than three times higher in maturing heavy rail regions,and more than twice as much in growing regions with lightrail. (The data from New York/New Jersey produced unusual
results, as transit ridership in suburban TODs, while robust,was outweighed by ridership in the rest of the MSA, which isvery dense and metropolitan.) Table 1.2 shows detailed transitcommute data from Renne’s study.
From this data, Renne provides the following observations:
• Maturing-heavy rail regions experienced the highesttransit ridership growth and collectively have promotedTOD through development partnerships (e.g., joint de-velopment in Washington, D.C.) and supportive poli-cies. In comparison to Washington, D.C., Atlanta TODshave experienced declining transit mode share. Rennesurmises this is because Washington TODs includemore mixed uses and less parking, whereas Atlanta’sTODs include primarily office space surrounded by largeparking lots.
9
Region
TransitShare
1970 (%)
TransitShare
1980 (%)
TransitShare
1990 (%)
TransitShare
2000 (%)
%Change1970-
2000 (%)
Chicago TOD Average (n=8) 24.0 21.7 18.7 16.7 -30.0Chicago MSA Average 22.1 16.6 13.7 11.5 -48.0NY/NJ TOD Average (n=26) 15.7 13.1 13.6 16.4 4.0NY/NJ MSA Average 35.5 26.7 25.4 24.9 -30.0TOD Average 19.8 17.4 16.1 16.5 -17.0MSA Average 28.8 21.6 19.5 18.2 -37.0
Atlanta TOD Average (n=4) 20.9 22.5 24.9 19.3 -8.0Atlanta MSA Average 9.2 7.7 4.6 3.7 -60.0Miami TOD Average (n=2) 0.5 2.7 5.4 6.5 1094.0Miami MSA Average 7.1 5.0 4.4 3.9 -45.0San Francisco TOD Average (n=18) 17.8 22.3 20.1 21.0 18.0San Francicsco MSA Average 11.6 11.4 9.6 9.5 -18.0Washington DC TOD Average (n=16) 19.0 27.4 32.5 30.0 58.0Washington DC MSA Average 15.4 13.1 11.3 9.4 -39.0TOD Average 14.6 18.8 20.7 19.2 32.0MSA Average 10.8 9.3 7.5 6.6 -39.0
Portland TOD Average (n=5) 9.2 13.4 11.8 14.6 58.0Portland MSA Average 5.5 7.6 5.0 5.7 3.0San Diego TOD Average (n=6) 8.3 11.2 6.5 6.7 -19.0San Diego MSA Average 3.7 3.4 3.5 3.4 -7.0Los Angeles TOD Average (n=6) 6.2 11.5 10.2 8.4 37.0Los Angeles MSA Average 4.2 5.2 4.7 4.7 11.0Dallas TOD Average (n=6) 14.5 9.1 9.2 3.2 -78.0Dallas MSA Average 5.2 3.5 2.3 1.8 -66.0Denver TOD Average (n=2) 9.4 8.6 8.4 7.5 -20.0Denver MSA Average 4.3 6.0 4.2 4.3 0.0Salt Lake City TOD Average (n=4) 2.4 5.8 3.2 5.0 108.0Salt Lake City MSA Average 2.2 5.0 3.1 3.0 36.0TOD Average 9.9 8.2 7.6 -9.0MSA Average
8.34.2 5.1 3.8 3.8 -9.0
Total TOD Average (n=103) 15.1 17.0 16.9 16.7 11.0Total MSA Average (n=12) 19.0 14.1 12.0 7.1 -63.0
Source: Renne, 2005
Older and Redeveloping Regions
Maturing - Heavy Rail Regions
New Start - Light Rail Regions
Table 1.2. Transit trends for journey to work trips for selected TODs.
• Portland also has experienced high growth in transit use,very likely due to aggressive policies to promote transit useand TOD.
• Transit ridership growth also was realized in the TODs ofMiami, San Francisco, Los Angeles, and Salt Lake City.
• In San Diego, Dallas, and Denver, the rate of decline intransit use for TODs was greater than for the region,although transit use remains about twice as high. Sincethese TODs were not built until the late 1990s or after2000, more time may be needed to fully evaluate the longterm trend.
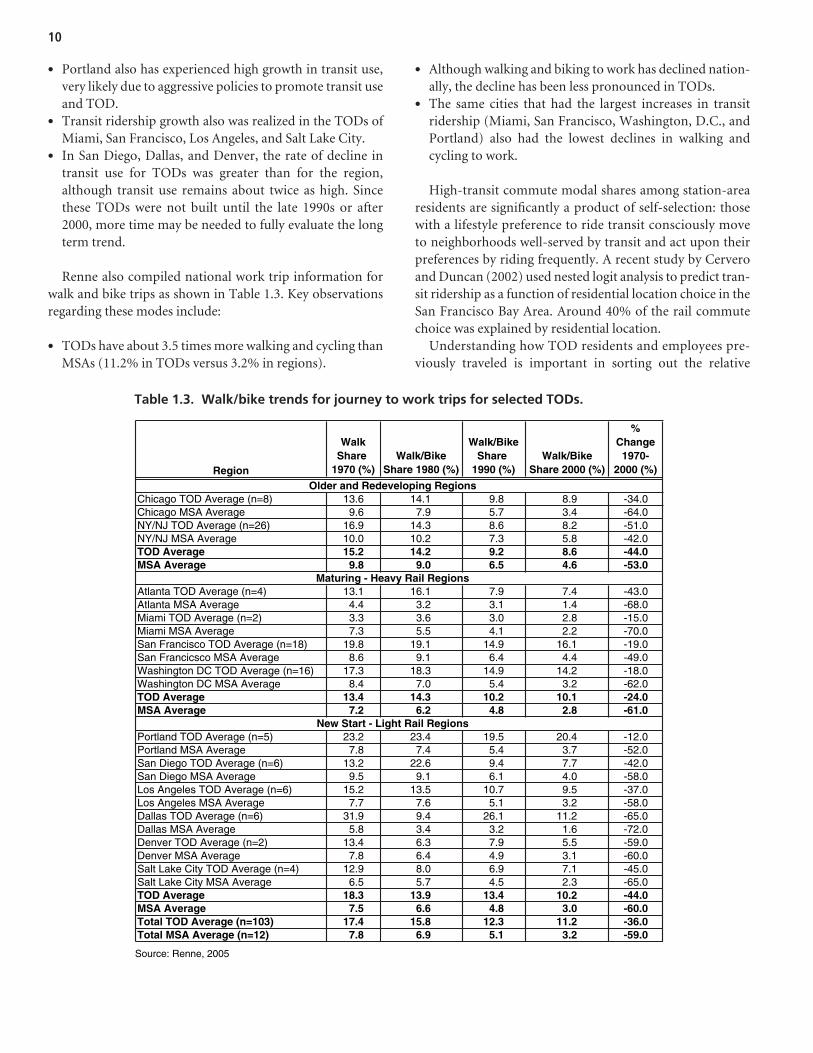
Renne also compiled national work trip information forwalk and bike trips as shown in Table 1.3. Key observationsregarding these modes include:
• TODs have about 3.5 times more walking and cycling thanMSAs (11.2% in TODs versus 3.2% in regions).
• Although walking and biking to work has declined nation-ally, the decline has been less pronounced in TODs.
• The same cities that had the largest increases in transitridership (Miami, San Francisco, Washington, D.C., andPortland) also had the lowest declines in walking andcycling to work.
High-transit commute modal shares among station-arearesidents are significantly a product of self-selection: thosewith a lifestyle preference to ride transit consciously moveto neighborhoods well-served by transit and act upon theirpreferences by riding frequently. A recent study by Cerveroand Duncan (2002) used nested logit analysis to predict tran-sit ridership as a function of residential location choice in theSan Francisco Bay Area. Around 40% of the rail commutechoice was explained by residential location.
Understanding how TOD residents and employees pre-viously traveled is important in sorting out the relative
10
Region
WalkShare
1970 (%)Walk/Bike
Share 1980 (%)
Walk/BikeShare
1990 (%)Walk/Bike
Share 2000 (%)
%Change1970-
2000 (%)
Chicago TOD Average (n=8) 13.6 14.1 9.8 8.9 -34.0Chicago MSA Average 9.6 7.9 5.7 3.4 -64.0NY/NJ TOD Average (n=26) 16.9 14.3 8.6 8.2 -51.0NY/NJ MSA Average 10.0 10.2 7.3 5.8 -42.0TOD Average 15.2 14.2 9.2 8.6 -44.0MSA Average 9.8 9.0 6.5 4.6 -53.0
Atlanta TOD Average (n=4) 13.1 16.1 7.9 7.4 -43.0Atlanta MSA Average 4.4 3.2 3.1 1.4 -68.0Miami TOD Average (n=2) 3.3 3.6 3.0 2.8 -15.0Miami MSA Average 7.3 5.5 4.1 2.2 -70.0San Francisco TOD Average (n=18) 19.8 19.1 14.9 16.1 -19.0San Francicsco MSA Average 8.6 9.1 6.4 4.4 -49.0Washington DC TOD Average (n=16) 17.3 18.3 14.9 14.2 -18.0Washington DC MSA Average 8.4 7.0 5.4 3.2 -62.0TOD Average 13.4 14.3 10.2 10.1 -24.0MSA Average 7.2 6.2 4.8 2.8 -61.0
Portland TOD Average (n=5) 23.2 23.4 19.5 20.4 -12.0Portland MSA Average 7.8 7.4 5.4 3.7 -52.0San Diego TOD Average (n=6) 13.2 22.6 9.4 7.7 -42.0San Diego MSA Average 9.5 9.1 6.1 4.0 -58.0Los Angeles TOD Average (n=6) 15.2 13.5 10.7 9.5 -37.0Los Angeles MSA Average 7.7 7.6 5.1 3.2 -58.0Dallas TOD Average (n=6) 31.9 9.4 26.1 11.2 -65.0Dallas MSA Average 5.8 3.4 3.2 1.6 -72.0Denver TOD Average (n=2) 13.4 6.3 7.9 5.5 -59.0Denver MSA Average 7.8 6.4 4.9 3.1 -60.0Salt Lake City TOD Average (n=4) 12.9 8.0 6.9 7.1 -45.0Salt Lake City MSA Average 6.5 5.7 4.5 2.3 -65.0TOD Average 18.3 13.9 13.4 10.2 -44.0MSA Average 7.5 6.6 4.8 3.0 -60.0Total TOD Average (n=103) 17.4 15.8 12.3 11.2 -36.0Total MSA Average (n=12) 7.8 6.9 5.1 3.2 -59.0
Source: Renne, 2005
Older and Redeveloping Regions
Maturing - Heavy Rail Regions
New Start - Light Rail Regions
Table 1.3. Walk/bike trends for journey to work trips for selected TODs.
importance of self-selection. If most TOD residents patronizedtransit prior to their move, then net ridership benefits aresomewhat reduced. Two California research projects throwsome light on this question. The 1992 study of ridership ofpeople living near California rail stops examined how theytravel to work at their prior residence (Cervero, 1994). Forthose whose job location did not change, surveys showed that56% of station-area residents rode transit to work at the pre-vious residence. Thus, TOD residency did not yield regionalmobility benefits in the case of nearly half of the sample.However, impacts were not inconsequential. Among thosewho drove to work when they previously lived away fromtransit, 52% switched to transit commuting after movingwithin a half mile walking distance of a rail station.
Similar findings have been observed in Portland, Oregon.At the Center Commons, an urban neighborhood TOD, about56% of survey respondents currently use an alternate modeof transportation (i.e., transit, bike, walk, carpool) to get towork; about 46% use transit. Prior to moving into the TOD,about 44% used an alternate mode for work trips, and 31%used transit. In comparison, transit work-trip mode share forthe city of Portland was 12.3% according to the 2000 Census.(Almost 75% of Center Commons respondents had an an-nual household income of $25,000 or less. About 78% ofwork trips on transit and 84% of nonwork trips on transit areby residents who make $25,000 or less per year.) For nonworktrips, 55% currently use an alternate mode of transportation,and 32% use transit. Previously, 42% used an alternate modefor nonwork trips, and 20% used transit (Switzer, 2002).
At Orenco Station, a more affluent suburban neighborhoodTOD, 18% of TOD commuters regularly use transit, 75% travelin single occupancy cars, and 2.7% carpool, bike, or walk(Podobnik, 2002). Sixty-nine percent of survey respondentsindicated that they use transit more often than in their pre-vious neighborhood, and 25% use transit at about the samelevel.
At The Merrick, an urban downtown TOD, 23% of resi-dents regularly commute to work or school by transit, 44%commute in a private vehicle, and 16% walk (Dill, 2005).Overall in Portland, 12% commute by transit, 76% byprivate vehicle, and 5% walk. The mode split for all tripsat The Merrick is: 18% transit, 53% personal vehicle, and29% walk. The Merrick residents also claim to drive lessand use transit and walk more compared to where theyused to live:
• 45% claim to drive a lot less now;• 23% claim to drive a little less now (total of 68% drive less
now);• 42% claim to use transit a lot more now;• 28% claim to use transit a little more now (total of 70% use
transit more now);
• 31% claim to walk a little more now; and• 16% claim to walk a lot more now (total of 47% claim to
walk more now).
The 2003 California survey of transit usage found a clearpattern of changes in travel behavior before and after mov-ing to a TOD. Among all residents surveyed, around 12%shifted from some form of automobile travel to transit fortheir main trip purposes; however, around 10% shifted fromtaking transit to auto travel after moving to a TOD, and 56%drove as much as when they lived away from a TOD. Thechange to car commuting was thought to reflect the trendtoward suburban employment in automobile-orientedsettings.
The 2003 California study also provides longitudinal in-sights into ridership trends among TOD projects. Overall, noevidence was found that transit modal shares changed as TODhousing projects matured. In the case of several surveyed hous-ing projects near BART’s Hayward and Union City stations,the shares of commutes by transit were in the 26% to 28%range in 1992 and 2003. In a few TODs where transit’s com-mute market shares increased over time, results could reflectfiltering effects: those who use rail transit may stay in placeand maintain longer residences while those not using transitmay be more likely to leave.
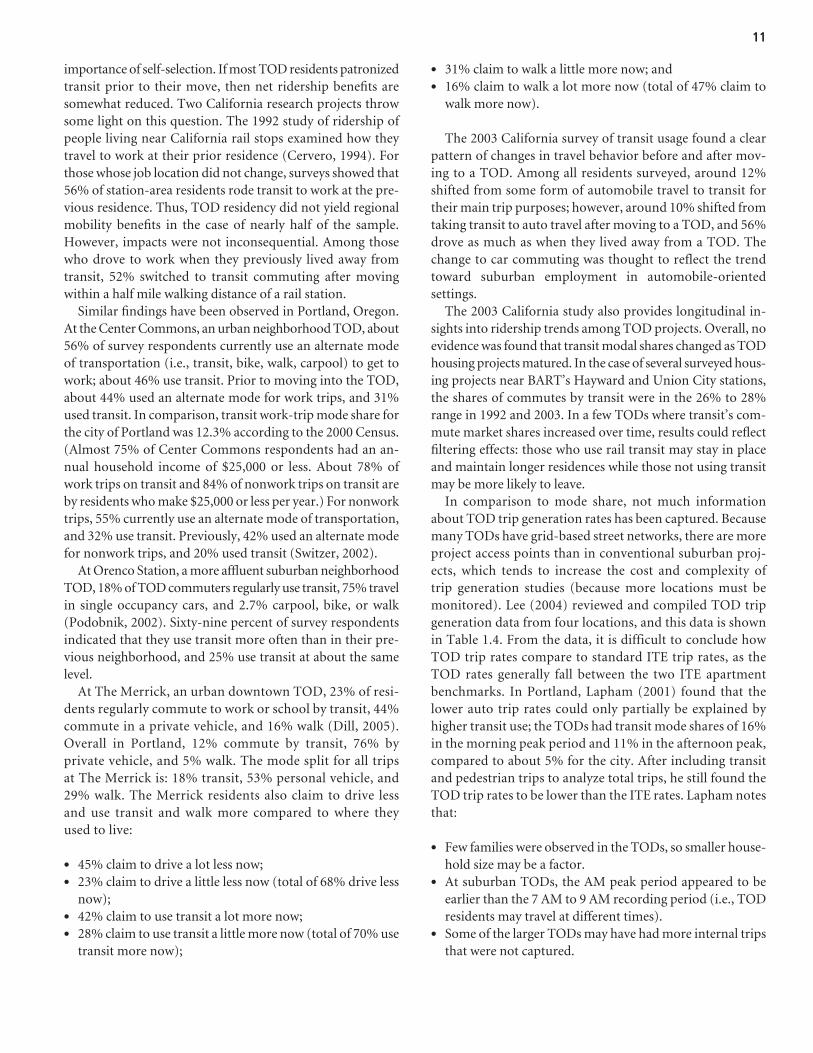
In comparison to mode share, not much informationabout TOD trip generation rates has been captured. Becausemany TODs have grid-based street networks, there are moreproject access points than in conventional suburban proj-ects, which tends to increase the cost and complexity oftrip generation studies (because more locations must bemonitored). Lee (2004) reviewed and compiled TOD tripgeneration data from four locations, and this data is shownin Table 1.4. From the data, it is difficult to conclude howTOD trip rates compare to standard ITE trip rates, as theTOD rates generally fall between the two ITE apartmentbenchmarks. In Portland, Lapham (2001) found that thelower auto trip rates could only partially be explained byhigher transit use; the TODs had transit mode shares of 16%in the morning peak period and 11% in the afternoon peak,compared to about 5% for the city. After including transitand pedestrian trips to analyze total trips, he still found theTOD trip rates to be lower than the ITE rates. Lapham notesthat:
• Few families were observed in the TODs, so smaller house-hold size may be a factor.
• At suburban TODs, the AM peak period appeared to beearlier than the 7 AM to 9 AM recording period (i.e., TODresidents may travel at different times).
• Some of the larger TODs may have had more internal tripsthat were not captured.
11
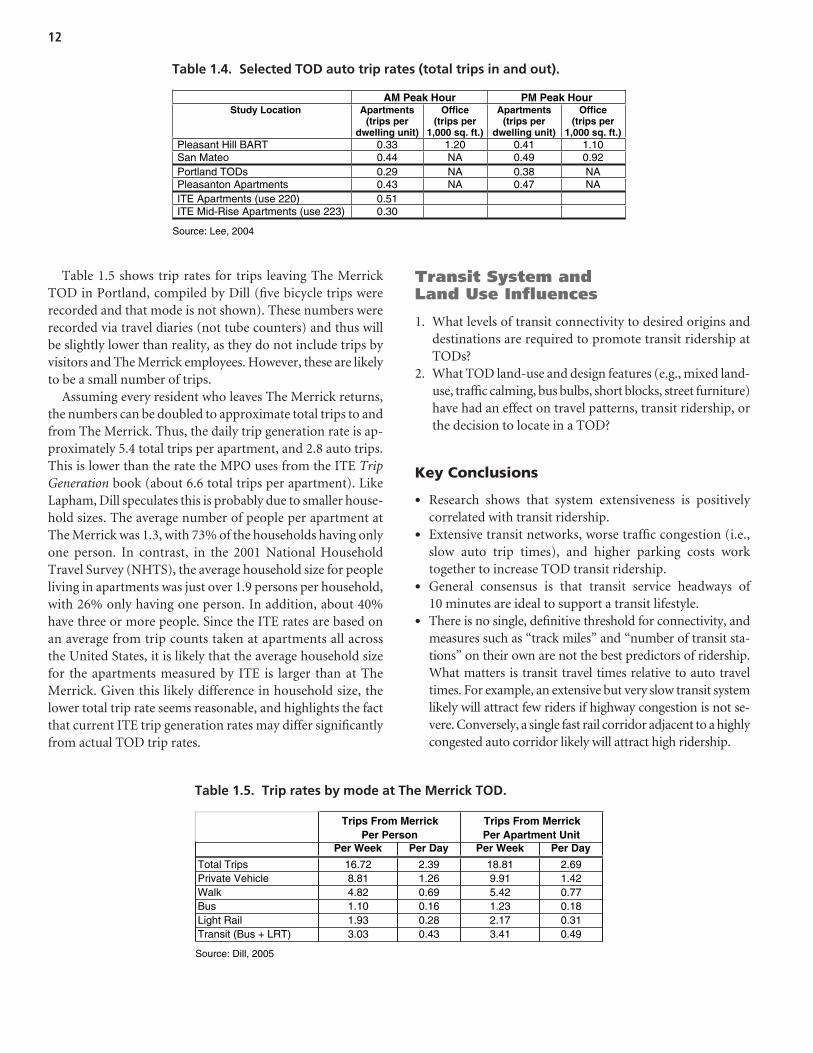
Table 1.5 shows trip rates for trips leaving The MerrickTOD in Portland, compiled by Dill (five bicycle trips wererecorded and that mode is not shown). These numbers wererecorded via travel diaries (not tube counters) and thus willbe slightly lower than reality, as they do not include trips byvisitors and The Merrick employees. However, these are likelyto be a small number of trips.
Assuming every resident who leaves The Merrick returns,the numbers can be doubled to approximate total trips to andfrom The Merrick. Thus, the daily trip generation rate is ap-proximately 5.4 total trips per apartment, and 2.8 auto trips.This is lower than the rate the MPO uses from the ITE TripGeneration book (about 6.6 total trips per apartment). LikeLapham, Dill speculates this is probably due to smaller house-hold sizes. The average number of people per apartment atThe Merrick was 1.3, with 73% of the households having onlyone person. In contrast, in the 2001 National HouseholdTravel Survey (NHTS), the average household size for peopleliving in apartments was just over 1.9 persons per household,with 26% only having one person. In addition, about 40%have three or more people. Since the ITE rates are based onan average from trip counts taken at apartments all acrossthe United States, it is likely that the average household sizefor the apartments measured by ITE is larger than at TheMerrick. Given this likely difference in household size, thelower total trip rate seems reasonable, and highlights the factthat current ITE trip generation rates may differ significantlyfrom actual TOD trip rates.
Transit System and Land Use Influences
1. What levels of transit connectivity to desired origins anddestinations are required to promote transit ridership atTODs?
2. What TOD land-use and design features (e.g., mixed land-use, traffic calming, bus bulbs, short blocks, street furniture)have had an effect on travel patterns, transit ridership, orthe decision to locate in a TOD?
Key Conclusions
• Research shows that system extensiveness is positivelycorrelated with transit ridership.
• Extensive transit networks, worse traffic congestion (i.e.,slow auto trip times), and higher parking costs worktogether to increase TOD transit ridership.
• General consensus is that transit service headways of10 minutes are ideal to support a transit lifestyle.
• There is no single, definitive threshold for connectivity, andmeasures such as “track miles” and “number of transit sta-tions” on their own are not the best predictors of ridership.What matters is transit travel times relative to auto traveltimes. For example, an extensive but very slow transit systemlikely will attract few riders if highway congestion is not se-vere. Conversely, a single fast rail corridor adjacent to a highlycongested auto corridor likely will attract high ridership.
12
AM Peak Hour PM Peak HourStudy Location Apartments
(trips perdwelling unit)
Office(trips per
1,000 sq. ft.)
Apartments(trips per
dwelling unit)
Office(trips per
1,000 sq. ft.)Pleasant Hill BART 0.33 1.20 0.41 1.10San Mateo 0.44 NA 0.49 0.92Portland TODs 0.29 NA 0.38 NAPleasanton Apartments 0.43 NA 0.47 NAITE Apartments (use 220) 0.51ITE Mid-Rise Apartments (use 223) 0.30
Source: Lee, 2004
Table 1.4. Selected TOD auto trip rates (total trips in and out).
Per Week Per Day Per Week Per Day
Total Trips 16.72 2.39 18.81 2.69Private Vehicle 8.81 1.26 9.91 1.42Walk 4.82 0.69 5.42 0.77Bus 1.10 0.16 1.23 0.18Light Rail 1.93 0.28 2.17 0.31Transit (Bus + LRT) 3.03 0.43 3.41 0.49
Source: Dill, 2005
Trips From MerrickPer Person
Trips From MerrickPer Apartment Unit
Table 1.5. Trip rates by mode at The Merrick TOD.
• The systems that will generate the highest commute rider-ship will have a high percentage of regional jobs accessibleby fast transit.
• For work trips, proximity to rail stations is a stronger in-fluence on transit use than land use mix or quality of walk-ing environment. The most effective strategy to increaseTOD ridership is to increase development densities in closeproximity to transit.
• Employment densities at trip ends have more influence onridership than population densities at trip origins. It is crit-ical to locate jobs near transit in order to attract householdsto TODs.
• Relative travel time (transit versus auto) is still more im-portant than any land use factor (density, diversity of uses,or design).
• Mixed uses in TODs allow the transit service to be used fora variety of trip purposes throughout the day and week, butas a travel benefit, this is not a primary consideration forprospective TOD residents. Employment access is a pri-mary consideration.
• Mixed uses (e.g., local restaurants) and urban design treat-ments (e.g., pedestrian pathways) are important for theiramenity and design value in attracting residents and visitors/customers. TOD residents highly value good neighborhooddesign in addition to transit access to work. Urban designand the local land use mix may influence which TODprospective residents choose to live in. Good design alsomay make a TOD a more desirable location to travel to.
Findings
There is no absolute dividing line or tipping point for tran-sit connectivity that translates into high transit ridership.From a transit perspective, connectivity can relate to thenumber of origins and destinations that can be accessed, thespeed of transit service, and/or the frequency of service con-necting origins and destinations. Mode choice studies ofTOD residents and office workers typically show that transittravel times and their comparison to private car travel times isthe strongest predictor of transit ridership. In other words,travel time differentials are a critical factor, and these differ-entials can vary greatly depending on local circumstances.
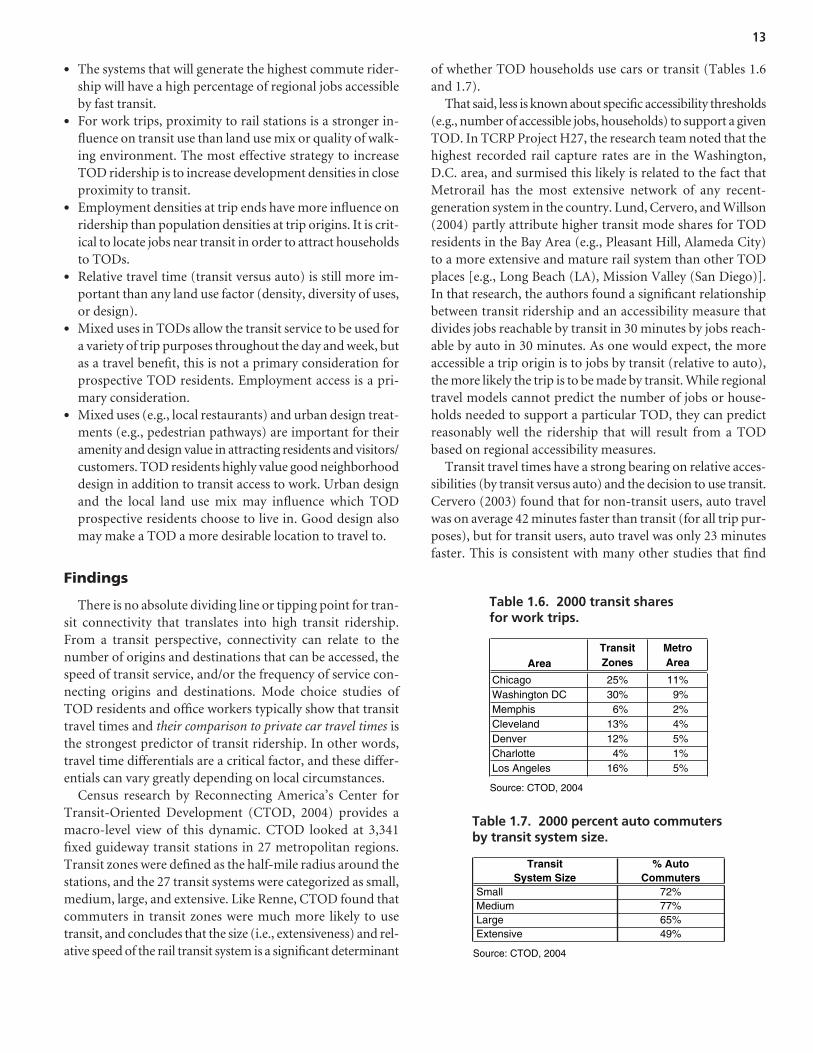
Census research by Reconnecting America’s Center forTransit-Oriented Development (CTOD, 2004) provides amacro-level view of this dynamic. CTOD looked at 3,341fixed guideway transit stations in 27 metropolitan regions.Transit zones were defined as the half-mile radius around thestations, and the 27 transit systems were categorized as small,medium, large, and extensive. Like Renne, CTOD found thatcommuters in transit zones were much more likely to usetransit, and concludes that the size (i.e., extensiveness) and rel-ative speed of the rail transit system is a significant determinant
of whether TOD households use cars or transit (Tables 1.6and 1.7).
That said, less is known about specific accessibility thresholds(e.g., number of accessible jobs, households) to support a givenTOD. In TCRP Project H27, the research team noted that thehighest recorded rail capture rates are in the Washington,D.C. area, and surmised this likely is related to the fact thatMetrorail has the most extensive network of any recent-generation system in the country. Lund, Cervero, and Willson(2004) partly attribute higher transit mode shares for TODresidents in the Bay Area (e.g., Pleasant Hill, Alameda City)to a more extensive and mature rail system than other TODplaces [e.g., Long Beach (LA), Mission Valley (San Diego)].In that research, the authors found a significant relationshipbetween transit ridership and an accessibility measure thatdivides jobs reachable by transit in 30 minutes by jobs reach-able by auto in 30 minutes. As one would expect, the moreaccessible a trip origin is to jobs by transit (relative to auto),the more likely the trip is to be made by transit. While regionaltravel models cannot predict the number of jobs or house-holds needed to support a particular TOD, they can predictreasonably well the ridership that will result from a TODbased on regional accessibility measures.
Transit travel times have a strong bearing on relative acces-sibilities (by transit versus auto) and the decision to use transit.Cervero (2003) found that for non-transit users, auto travelwas on average 42 minutes faster than transit (for all trip pur-poses), but for transit users, auto travel was only 23 minutesfaster. This is consistent with many other studies that find
AreaTransitZones
MetroArea
Chicago 25% 11%Washington DC 30% 9%Memphis 6% 2%Cleveland 13% 4%Denver 12% 5%Charlotte 4% 1%Los Angeles 16% 5%
Source: CTOD, 2004
TransitSystem Size
% AutoCommuters
Small 72%Medium 77%Large 65%Extensive 49%
Source: CTOD, 2004
Table 1.6. 2000 transit sharesfor work trips.
Table 1.7. 2000 percent auto commutersby transit system size.
13
that slow transit travel times retard ridership growth. Ridersalso care a lot about service reliability. Riders have been shownto be more sensitive to unpredictable delay than predictablewaiting times (Pratt, 2000, Chapter 9). TODs should be fo-cused toward transit facilities that offer clear travel speed andreliability advantages (e.g., rail lines or bus corridors with pri-ority design treatments).
Numerous studies under the broader topic of transit oper-ations have been completed to understand how improvedtransit service (i.e., faster speeds, improved frequency, differ-ent configurations) affects transit ridership. These studieshave typically been undertaken to increase transit ridership ingeneral, although the findings are directly applicable to im-proving TOD-focused transit service and/or locating newTODs. These studies have not been exhaustively reviewed forthis literature review. Rather, only some general findings arepresented here.
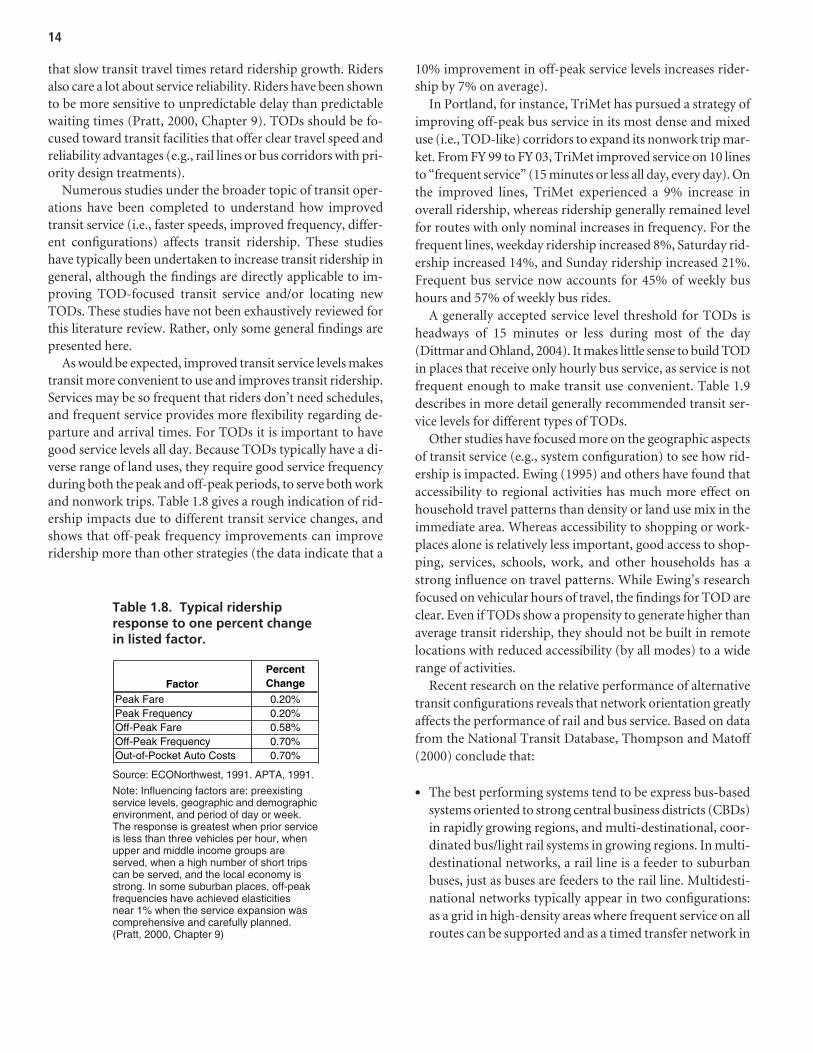
As would be expected, improved transit service levels makestransit more convenient to use and improves transit ridership.Services may be so frequent that riders don’t need schedules,and frequent service provides more flexibility regarding de-parture and arrival times. For TODs it is important to havegood service levels all day. Because TODs typically have a di-verse range of land uses, they require good service frequencyduring both the peak and off-peak periods, to serve both workand nonwork trips. Table 1.8 gives a rough indication of rid-ership impacts due to different transit service changes, andshows that off-peak frequency improvements can improveridership more than other strategies (the data indicate that a
10% improvement in off-peak service levels increases rider-ship by 7% on average).
In Portland, for instance, TriMet has pursued a strategy ofimproving off-peak bus service in its most dense and mixeduse (i.e., TOD-like) corridors to expand its nonwork trip mar-ket. From FY 99 to FY 03, TriMet improved service on 10 linesto “frequent service” (15 minutes or less all day, every day). Onthe improved lines, TriMet experienced a 9% increase inoverall ridership, whereas ridership generally remained levelfor routes with only nominal increases in frequency. For thefrequent lines, weekday ridership increased 8%, Saturday rid-ership increased 14%, and Sunday ridership increased 21%.Frequent bus service now accounts for 45% of weekly bushours and 57% of weekly bus rides.
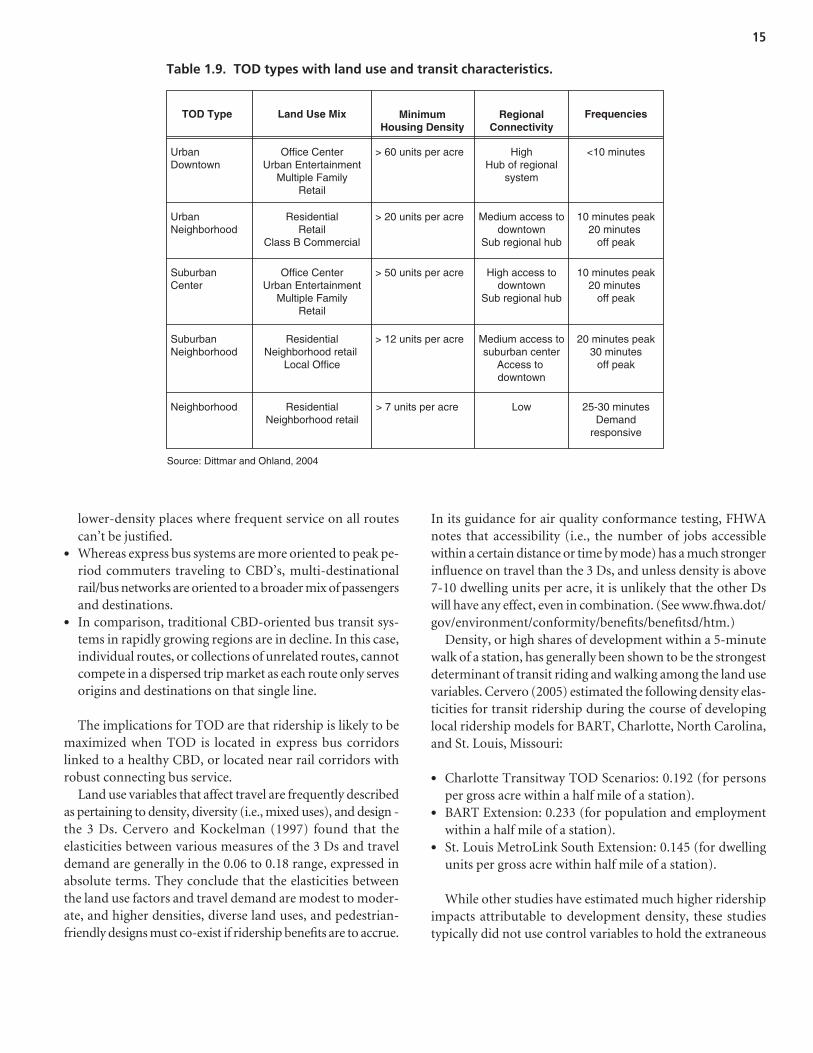
A generally accepted service level threshold for TODs isheadways of 15 minutes or less during most of the day(Dittmar and Ohland, 2004). It makes little sense to build TODin places that receive only hourly bus service, as service is notfrequent enough to make transit use convenient. Table 1.9describes in more detail generally recommended transit ser-vice levels for different types of TODs.
Other studies have focused more on the geographic aspectsof transit service (e.g., system configuration) to see how rid-ership is impacted. Ewing (1995) and others have found thataccessibility to regional activities has much more effect onhousehold travel patterns than density or land use mix in theimmediate area. Whereas accessibility to shopping or work-places alone is relatively less important, good access to shop-ping, services, schools, work, and other households has astrong influence on travel patterns. While Ewing’s researchfocused on vehicular hours of travel, the findings for TOD areclear. Even if TODs show a propensity to generate higher thanaverage transit ridership, they should not be built in remotelocations with reduced accessibility (by all modes) to a widerange of activities.
Recent research on the relative performance of alternativetransit configurations reveals that network orientation greatlyaffects the performance of rail and bus service. Based on datafrom the National Transit Database, Thompson and Matoff(2000) conclude that:
• The best performing systems tend to be express bus-basedsystems oriented to strong central business districts (CBDs)in rapidly growing regions, and multi-destinational, coor-dinated bus/light rail systems in growing regions. In multi-destinational networks, a rail line is a feeder to suburbanbuses, just as buses are feeders to the rail line. Multidesti-national networks typically appear in two configurations:as a grid in high-density areas where frequent service on allroutes can be supported and as a timed transfer network in
14
FactorPercentChange
Peak Fare 0.20%Peak Frequency 0.20%Off-Peak Fare 0.58%Off-Peak Frequency 0.70%Out-of-Pocket Auto Costs 0.70%
Table 1.8. Typical ridershipresponse to one percent changein listed factor.
Source: ECONorthwest, 1991. APTA, 1991.
Note: Influencing factors are: preexistingservice levels, geographic and demographicenvironment, and period of day or week.The response is greatest when prior serviceis less than three vehicles per hour, whenupper and middle income groups areserved, when a high number of short tripscan be served, and the local economy isstrong. In some suburban places, off-peakfrequencies have achieved elasticitiesnear 1% when the service expansion wascomprehensive and carefully planned.(Pratt, 2000, Chapter 9)
lower-density places where frequent service on all routescan’t be justified.
• Whereas express bus systems are more oriented to peak pe-riod commuters traveling to CBD’s, multi-destinationalrail/bus networks are oriented to a broader mix of passengersand destinations.
• In comparison, traditional CBD-oriented bus transit sys-tems in rapidly growing regions are in decline. In this case,individual routes, or collections of unrelated routes, cannotcompete in a dispersed trip market as each route only servesorigins and destinations on that single line.
The implications for TOD are that ridership is likely to bemaximized when TOD is located in express bus corridorslinked to a healthy CBD, or located near rail corridors withrobust connecting bus service.
Land use variables that affect travel are frequently describedas pertaining to density, diversity (i.e., mixed uses), and design -the 3 Ds. Cervero and Kockelman (1997) found that theelasticities between various measures of the 3 Ds and traveldemand are generally in the 0.06 to 0.18 range, expressed inabsolute terms. They conclude that the elasticities betweenthe land use factors and travel demand are modest to moder-ate, and higher densities, diverse land uses, and pedestrian-friendly designs must co-exist if ridership benefits are to accrue.
In its guidance for air quality conformance testing, FHWAnotes that accessibility (i.e., the number of jobs accessiblewithin a certain distance or time by mode) has a much strongerinfluence on travel than the 3 Ds, and unless density is above7-10 dwelling units per acre, it is unlikely that the other Dswill have any effect, even in combination. (See www.fhwa.dot/gov/environment/conformity/benefits/benefitsd/htm.)
Density, or high shares of development within a 5-minutewalk of a station, has generally been shown to be the strongestdeterminant of transit riding and walking among the land usevariables. Cervero (2005) estimated the following density elas-ticities for transit ridership during the course of developinglocal ridership models for BART, Charlotte, North Carolina,and St. Louis, Missouri:
• Charlotte Transitway TOD Scenarios: 0.192 (for personsper gross acre within a half mile of a station).
• BART Extension: 0.233 (for population and employmentwithin a half mile of a station).
• St. Louis MetroLink South Extension: 0.145 (for dwellingunits per gross acre within half mile of a station).
While other studies have estimated much higher ridershipimpacts attributable to development density, these studiestypically did not use control variables to hold the extraneous
15
Source: Dittmar and Ohland, 2004
TOD Type
UrbanDowntown
Office CenterUrban Entertainment
Multiple FamilyRetail
> 60 units per acre HighHub of regional
system
<10 minutes
UrbanNeighborhood
ResidentialRetail
Class B Commercial
> 20 units per acre Medium access todowntown
Sub regional hub
10 minutes peak20 minutes
off peak
SuburbanCenter
Office CenterUrban Entertainment
Multiple FamilyRetail
> 50 units per acre High access todowntown
Sub regional hub
10 minutes peak20 minutes
off peak
SuburbanNeighborhood
ResidentialNeighborhood retail
Local Office
> 12 units per acre Medium access tosuburban center
Access to downtown
20 minutes peak30 minutes
off peak
Neighborhood ResidentialNeighborhood retail
> 7 units per acre Low 25-30 minutesDemand
responsive
Land Use Mix MinimumHousing Density
RegionalConnectivity
Frequencies
Table 1.9. TOD types with land use and transit characteristics.
factors of transit service levels, household demographics, andparking constant (e.g., prices). As a result, these factors mayhave influenced the results. The TCRP H-1 study, for instance,estimated a high population density elasticity of 0.59, but failedto include a measure of transit service levels. After accountingfor transit service levels and other factors, Cervero re-estimatedthe density elasticity to be 0.192 (and the elasticity for thenumber of morning inbound trains was 0.59).
Employment densities at destinations are more importantthan population densities at trip origins. Having an office orworkplace near a transit stop is a strong motivator for manyAmericans to reside near transit and motivates people to buyinto high transit-accessible neighborhoods. The end result isthat having both ends of the trip within a convenient walk toand from a transit stop is key to high ridership levels.
Several studies have shown that good job accessibility viatransit is among the strongest predictors of whether station-area residents will take transit to work. The 1994 Cervero studyof commute choice among TOD residents of Bay Area TODsfound that having a workplace near a rail station stronglyencouraged rail commuting. Commuting to a job in BART-served downtown San Francisco or Oakland, for example,increased the likelihood of taking transit by 35% to 60%among residents of suburban East Bay TODs. In anotherstudy of California TODs, Cervero (1994) found that fourvariables–employment density, employment proximity totransit, commute behavior at the worker’s previous job, andoccupation–explained 92% of the mode split variation. Orig-inal research conducted by the team under TCRP H-27 forthe Rosslyn-Ballston corridor of Arlington County, Virginia,showed that nodes of concentrated development along transitcorridors translates into higher transit commute shares. InArlington County, every 100,000 square feet of office and retailfloorspace added from 1985 to 2002 increased average dailyMetrorail boardings and alightings by nearly 50 daily board-ings and alightings.
Research shows that proximity to rail stations is a strongerdeterminant of transit usage for work trips than land-use mixor quality of walking environment (Cervero, 1994). Concen-trating growth around rail stops often will yield high ridershipdividends almost regardless of the urban design attributesof the immediate area. Still, all transit trips involve walkingto some degree, thus the provision of safe, efficient, andcomfortable-feeling walking corridors between transit stationsand surrounding communities is an essential attribute ofsuccessful TODs. Mixed uses like housing, offices, retailshopping, and entertainment centers are important compo-nents of TOD since they produce all-day and all-week transittrips, thus exploiting available transit capacity.
Studies show that the urban design features of TOD tend tohave a modest influence (relative to physical proximity) on rid-ership patterns, and suggest the presence of an “indifference
zone” for longer-distance work trips. That is, once work com-muters are within one-quarter mile of a rail station, factors likemixed land uses, traffic calming, pedestrian amenities, andeven density seem to matter little. This is a consistent findingfrom studies on the ridership impacts of TOD, including thepreviously-cited research by Lund, Cervero, and Willson(2004). Availability, price, and convenience of parking stronglydetermine whether or not those working in TODs take transit.
Lund, Cervero, and Willson found that the onlyneighborhood-design variable that explained commutingtransit ridership among TOD residents was street connectiv-ity at the trip destination. Once controlling for the influencesof factors like travel time and transit accessibility, no attributesof walking quality or land-use composition in the neighbor-hoods of TOD residents had a significant impact on transitmode choice. Some of the correlations with transit ridershipfound in that study are:
• Pedestrian connectivity at trip destination: 0.37;• Sidewalks along shortest walk route: 0.16;• Street trees: 0.079;• Street lights: 0.178; and• Street furniture (benches, bus shelters): 0.137
The researchers also found that urban design variables exerta stronger influence for station area workers than for stationarea residents. Furthermore, within each TOD, some will valuepedestrian treatments highly, while others will not be deterredby their absence if transit is nearby. Thus, resident attitudesmatter considerably. That said, good urban design treatmentsprobably make living at higher densities more attractive.
Ewing and Cervero (2001) note that individual urban de-sign features seldom prove significant. Where an individualfeature appears to be significant, as did striped crosswalks inone study, the causality almost is certainly confounded withother variables. In this case, painting a few stripes across theroad is not likely to influence travel choices, and the numberof crosswalks must have captured other unmeasured featuresof the built environment.
Cervero (1994) concluded that for work trips,
Within a quarter to a half mile radius of a station, featuresof the built environment (ignoring issues of safety and urbanblight) matter little—as long as places are near a station, thephysical characteristics of the immediate neighborhood areinconsequential.
Another assessment underscores the importance of densityand proximity to a station, however, more value was attachedto the land-use composition of a TOD: “transit use dependsprimarily on local densities and secondarily on the degree ofland use mixing” (Ewing and Cervero, 2001). For instance,using data on more than 15,000 households from the 1985
16
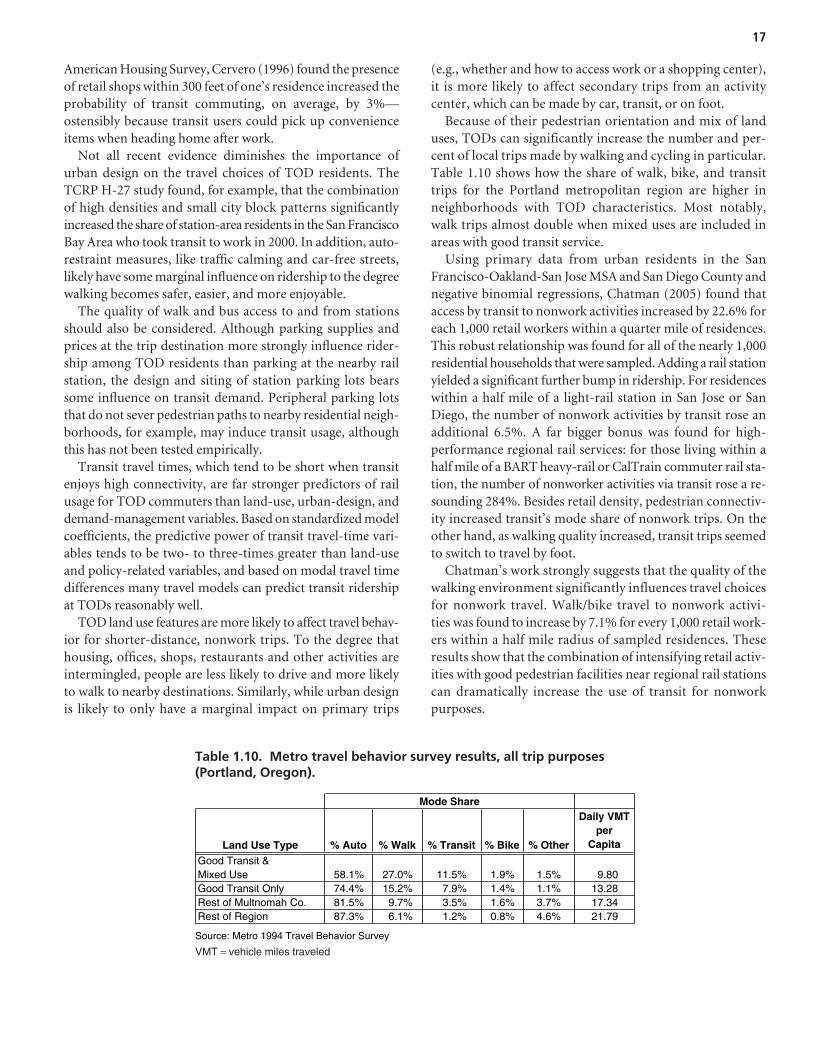
American Housing Survey, Cervero (1996) found the presenceof retail shops within 300 feet of one’s residence increased theprobability of transit commuting, on average, by 3%—ostensibly because transit users could pick up convenienceitems when heading home after work.
Not all recent evidence diminishes the importance ofurban design on the travel choices of TOD residents. TheTCRP H-27 study found, for example, that the combinationof high densities and small city block patterns significantlyincreased the share of station-area residents in the San FranciscoBay Area who took transit to work in 2000. In addition, auto-restraint measures, like traffic calming and car-free streets,likely have some marginal influence on ridership to the degreewalking becomes safer, easier, and more enjoyable.
The quality of walk and bus access to and from stationsshould also be considered. Although parking supplies andprices at the trip destination more strongly influence rider-ship among TOD residents than parking at the nearby railstation, the design and siting of station parking lots bearssome influence on transit demand. Peripheral parking lotsthat do not sever pedestrian paths to nearby residential neigh-borhoods, for example, may induce transit usage, althoughthis has not been tested empirically.
Transit travel times, which tend to be short when transitenjoys high connectivity, are far stronger predictors of railusage for TOD commuters than land-use, urban-design, anddemand-management variables. Based on standardized modelcoefficients, the predictive power of transit travel-time vari-ables tends to be two- to three-times greater than land-useand policy-related variables, and based on modal travel timedifferences many travel models can predict transit ridershipat TODs reasonably well.
TOD land use features are more likely to affect travel behav-ior for shorter-distance, nonwork trips. To the degree thathousing, offices, shops, restaurants and other activities areintermingled, people are less likely to drive and more likelyto walk to nearby destinations. Similarly, while urban designis likely to only have a marginal impact on primary trips
(e.g., whether and how to access work or a shopping center),it is more likely to affect secondary trips from an activitycenter, which can be made by car, transit, or on foot.
Because of their pedestrian orientation and mix of landuses, TODs can significantly increase the number and per-cent of local trips made by walking and cycling in particular.Table 1.10 shows how the share of walk, bike, and transittrips for the Portland metropolitan region are higher inneighborhoods with TOD characteristics. Most notably,walk trips almost double when mixed uses are included inareas with good transit service.
Using primary data from urban residents in the SanFrancisco-Oakland-San Jose MSA and San Diego County andnegative binomial regressions, Chatman (2005) found thataccess by transit to nonwork activities increased by 22.6% foreach 1,000 retail workers within a quarter mile of residences.This robust relationship was found for all of the nearly 1,000residential households that were sampled. Adding a rail stationyielded a significant further bump in ridership. For residenceswithin a half mile of a light-rail station in San Jose or SanDiego, the number of nonwork activities by transit rose anadditional 6.5%. A far bigger bonus was found for high-performance regional rail services: for those living within ahalf mile of a BART heavy-rail or CalTrain commuter rail sta-tion, the number of nonworker activities via transit rose a re-sounding 284%. Besides retail density, pedestrian connectiv-ity increased transit’s mode share of nonwork trips. On theother hand, as walking quality increased, transit trips seemedto switch to travel by foot.
Chatman’s work strongly suggests that the quality of thewalking environment significantly influences travel choicesfor nonwork travel. Walk/bike travel to nonwork activi-ties was found to increase by 7.1% for every 1,000 retail work-ers within a half mile radius of sampled residences. Theseresults show that the combination of intensifying retail activ-ities with good pedestrian facilities near regional rail stationscan dramatically increase the use of transit for nonworkpurposes.
17
Land Use Type % Auto % Walk % Transit % Bike % Other
Daily VMTper
Capita
Good Transit &Mixed Use 58.1% 27.0% 11.5% 1.9% 1.5% 9.80Good Transit Only 74.4% 15.2% 7.9% 1.4% 1.1% 13.28Rest of Multnomah Co. 81.5% 9.7% 3.5% 1.6% 3.7% 17.34Rest of Region 87.3% 6.1% 1.2% 0.8% 4.6% 21.79
Source: Metro 1994 Travel Behavior Survey
Mode Share
Table 1.10. Metro travel behavior survey results, all trip purposes(Portland, Oregon).
VMT = vehicle miles traveled
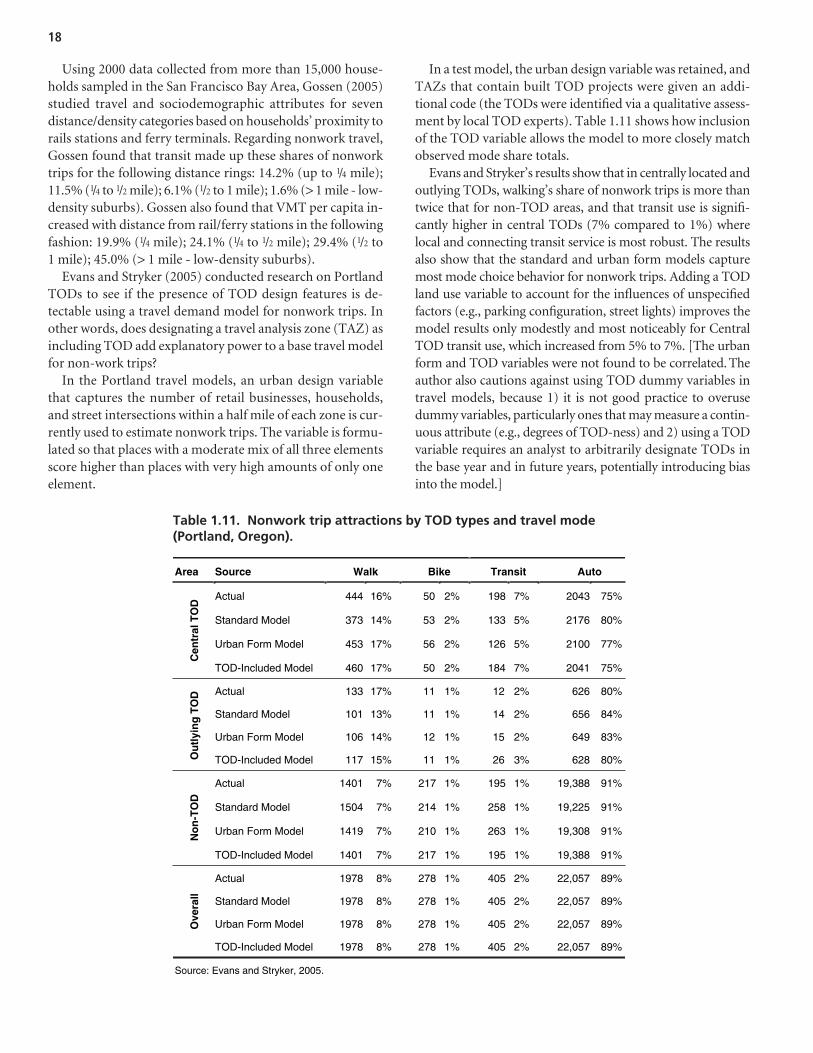
Using 2000 data collected from more than 15,000 house-holds sampled in the San Francisco Bay Area, Gossen (2005)studied travel and sociodemographic attributes for sevendistance/density categories based on households’ proximity torails stations and ferry terminals. Regarding nonwork travel,Gossen found that transit made up these shares of nonworktrips for the following distance rings: 14.2% (up to 1/4 mile);11.5% (1/4 to 1/2 mile); 6.1% (1/2 to 1 mile); 1.6% (> 1 mile - low-density suburbs). Gossen also found that VMT per capita in-creased with distance from rail/ferry stations in the followingfashion: 19.9% (1/4 mile); 24.1% (1/4 to 1/2 mile); 29.4% (1/2 to1 mile); 45.0% (> 1 mile - low-density suburbs).
Evans and Stryker (2005) conducted research on PortlandTODs to see if the presence of TOD design features is de-tectable using a travel demand model for nonwork trips. Inother words, does designating a travel analysis zone (TAZ) asincluding TOD add explanatory power to a base travel modelfor non-work trips?
In the Portland travel models, an urban design variablethat captures the number of retail businesses, households,and street intersections within a half mile of each zone is cur-rently used to estimate nonwork trips. The variable is formu-lated so that places with a moderate mix of all three elementsscore higher than places with very high amounts of only oneelement.
In a test model, the urban design variable was retained, andTAZs that contain built TOD projects were given an addi-tional code (the TODs were identified via a qualitative assess-ment by local TOD experts). Table 1.11 shows how inclusionof the TOD variable allows the model to more closely matchobserved mode share totals.
Evans and Stryker’s results show that in centrally located andoutlying TODs, walking’s share of nonwork trips is more thantwice that for non-TOD areas, and that transit use is signifi-cantly higher in central TODs (7% compared to 1%) wherelocal and connecting transit service is most robust. The resultsalso show that the standard and urban form models capturemost mode choice behavior for nonwork trips. Adding a TODland use variable to account for the influences of unspecifiedfactors (e.g., parking configuration, street lights) improves themodel results only modestly and most noticeably for CentralTOD transit use, which increased from 5% to 7%. [The urbanform and TOD variables were not found to be correlated. Theauthor also cautions against using TOD dummy variables intravel models, because 1) it is not good practice to overusedummy variables, particularly ones that may measure a contin-uous attribute (e.g., degrees of TOD-ness) and 2) using a TODvariable requires an analyst to arbitrarily designate TODs inthe base year and in future years, potentially introducing biasinto the model.]
18
Area Source Walk Bike Transit Auto
Actual 444 16% 50 2% 198 7% 2043 75%
Standard Model 373 14% 53 2% 133 5% 2176 80%
Urban Form Model 453 17% 56 2% 126 5% 2100 77%
Cen
tral
TO
D
TOD-Included Model 460 17% 50 2% 184 7% 2041 75%
Actual 133 17% 11 1% 12 2% 626 80%
Standard Model 101 13% 11 1% 14 2% 656 84%
Urban Form Model 106 14% 12 1% 15 2% 649 83%
Ou
tlyi
ng
TO
D
TOD-Included Model 117 15% 11 1% 26 3% 628 80%
Actual 1401 7% 217 1% 195 1% 19,388 91%
Standard Model 1504 7% 214 1% 258 1% 19,225 91%
Urban Form Model 1419 7% 210 1% 263 1% 19,308 91% No
n-T
OD
TOD-Included Model 1401 7% 217 1% 195 1% 19,388 91%
Actual 1978 8% 278 1% 405 2% 22,057 89%
Standard Model 1978 8% 278 1% 405 2% 22,057 89%
Urban Form Model 1978 8% 278 1% 405 2% 22,057 89% Ove
rall
TOD-Included Model 1978 8% 278 1% 405 2% 22,057 89%
Source: Evans and Stryker, 2005.
Table 1.11. Nonwork trip attractions by TOD types and travel mode(Portland, Oregon).
Mixed uses and urban design treatments can also reduceaverage trip distances. Evaluating shopping trips only, Handy(1993) analyzed the impacts of local accessibility on trip dis-tance and frequency, where accessibility reflected conven-ience to nearby supermarkets, drug stores, and dry cleanersnearby in small centers or stand-alone locations. In this case,accessibility was measured as a function of retail, service, andother non-industrial jobs in nearby zones (attractiveness)and off-peak travel times (impedance). The study concludedthat high levels of local access are associated with shortershopping distances, although no relationship was found fortrip frequency.
TOD Ridership Strategies
1. What motivates or impedes transit ridership in a TOD?2. What strategies have been effective in increasing transit
ridership at TODs?3. What steps should transit agencies take in supporting
TODs to maximize transit ridership?
Key Conclusions
• Factors that most influence transit ridership are stationproximity, transit quality, and parking policies.
• Fast, frequent, and comfortable transit service will increaseridership.
• High parking charges and/or constrained parking supplyalso will increase ridership.
• Free or low-cost parking is a major deterrent to transitridership.
• Successful strategies include: TOD transit pass programs,parking reductions, and car-sharing programs.
• TOD transit programs will be similar to other transit pro-grams. Because by definition TOD residents and house-holds are the nearest to transit, TODs should be among thefirst locations that transit agencies implement specializedprograms.
• TOD (e.g., mixed uses, high densities, reduced parking) isstill illegal around station areas in many cities and transitdistricts.
• Steps transit agencies are taking to promote TOD include:reconsidering replacement parking requirements at parkand rides, advocating for zoning changes with TOD entitle-ments, land assembly, joint development, and educationalefforts (e.g., producing TOD guidebooks).
Findings
The travel fundamentals of TOD transit ridership aresimilar to general transit ridership. Among the variablesamenable to policy change, transit service levels and pricesare the strongest predictors of ridership in a TOD. Next in
importance tends to be parking supplies and charges, followedby demand-management measures like employer provisionof free transit passes. Least influential tends to be land-useand urban design factors. Mixed land use and high-qualityurban design, however, can be important factors in drawingtenants to station areas in the first place, thus indirectly theirrole in shaping travel behavior in TODs can be substantial.While the factors listed above—transit service levels and park-ing management—strongly influence transit ridership, serviceenhancements and parking programs usually have not beenintroduced explicitly for the purposes of increasing ridershipat TODs.
In the transit planning literature, there is a large body ofresearch on what strategies are the most effective in generat-ing increased transit ridership. The 1995 TCRP study, TransitRidership Initiative, identified five main transit strategies toincrease ridership: service adjustments; fare and pricingadaptations; market and information activities; planning orientation (community- and customer-based approaches);and, service coordination, consolidation, and market segmen-tation. It is reasonable to expect that this family of conven-tional transit ridership strategies also will be effective in gen-erating increased ridership at TODs (that study is notsummarized here). Transit agencies interested in taking stepsto maximize ridership at TODs would be well advised to startwith these proven strategies. Among factors within the directcontrol of transit agencies, the provision of frequent, reliable,and comfortable transit services will induce ridership amongTOD residents and workers more than anything else. Pastridership models reveal that the quality of transit services (interms of speed and accessibility) are significant predictors oftransit mode choice among station-area residents. To iden-tify the most effective transit service strategies, the key deter-minants of travel demand for a specific setting need to beknown. One cannot easily generalize the findings from a fewurban settings in California and the Washington, D.C. area toall parts of the country.
That said, transit agencies also have shown considerablecreativity in pursuing a variety of TOD-specific strategies toincrease ridership at TODs. Transportation Demand Man-agement (TDM), initiating targeted pass programs, ad-dressing parking at a number of levels, car-sharing, modify-ing transit facility design, providing planning assistance,and developing TOD design guidelines are some strategiesundertaken by transit agencies to maximize ridership inTODs.
One of the best times to affect travel decisions and to en-courage transit use is when there is a change in home or joblocation. New TOD development offers a good opportunityto implement transit pass programs to attract individuals touse transit, and in general encourage others to change theirtransportation habits. A survey of commuters offered EcoTransit Passes through the Santa Clara Valley Transportation
19
Authority (VTA) found that after passes were given away thenumber of people driving a vehicle by themselves declinedfrom 76% to 60%. It also found that transit’s mode share in-creased from 11% to 27%, while parking demand declinedroughly 19% (Shoup, 1999).
Portland’s TriMet initiated a TOD Pass Program in Sep-tember 1998 at four TODs in Westside suburbs in conjunc-tion with the startup of the Westside LRT project. Residentsof these TODs were offered free transit passes. Among the keyfindings: in May 1999, 83% of Orenco Station respondentsreported using transit, where only 30% of them used it priorto the Westside LRT opening. From September 1998 to May1999, there was a 22% increase in the number of Orenco res-idents that use transit for commuting purposes.
To estimate the collective impacts of increased parkingcharges and a new transit pass program, Bianco (2000) con-ducted a study of the Lloyd District, a TOD employmentcenter near downtown Portland, immediately following theinstallation of the on-street parking meters. Programs imple-mented in the Lloyd District included:
• The new on-street parking meters;• A new transit pass program (Passport);• Emergency Ride Home program;• Two new express bus routes to the Lloyd District; and• Transfer facility improvements.
Survey respondents were asked to note how their commutebehavior changed one year after these programs were started.For all workers, SOV mode shared declined 7%. For Passporteligible workers, SOV use went down 19%, transit use in-creased 12%, and carpools increased also. The mode shareimpacts were immediate and large. Twenty-five percent of re-spondents indicated that their primary reason for change wasfor lifestyle reasons, 22% noted the parking charges, and 19%because of Passport (other reasons included new transit avail-ability, change in car ownership, and other). Thirty-six per-cent of respondents listed Passport as their secondary reasonfor change.
Transit agencies also have tailored car-sharing strategiesfor TODs. Research described later in this review shows thatcar ownership rates at TODs are significantly lower thanaverage. At the same time, the need to use a car for some tripsremains. Some TODs such as Buckman Heights in Portlandhave utilized car-sharing as a means to reduce the need forparking in the TOD while providing the option to drive ifneeded. Car-sharing allows individuals to have the benefits ofauto use for personal trips without the hassles and cost of carownership and reinforces transit-oriented lifestyles. Transitagencies have played an important role in advocating for andhelping to set-up car sharing. Companies like Flexcar providecar sharing in communities such as Portland, Vancouver
(WA), Seattle, Washington D.C., the San Francisco Bay area,Long Beach, and other Los Angeles areas (TriMet 1999).
Together with density (i.e., proximity to transit) and goodtransit service, a major driver of TOD ridership is the provi-sion and management of parking. Market profiles of TODresidences (e.g., small households with few cars) suggest thatparking-related strategies, like a relaxation of supply codesand the unbundling of parking and housing costs, could yieldlong-term ridership dividends. Thus, many transit agenciesand local governments desire to affect the amount and priceof parking provided.
Numerous studies found that transit ridership increaseswhen parking charges are implemented, and transit agenciesand local governments try to affect these too. Mildner, Strath-man, and Bianco (1997) found that cities with interventionistparking policies, high parking prices and limited supply,frequent transit service, and a high probability that travelerspay to park, are most likely to have high transit mode shares.Shifting from free to cost-recovery parking (prices that reflectthe full cost of providing parking facilities) typically reducesautomobile commuting by 10% to 30%, particularly if im-plemented with improved travel options and other TDMstrategies. (See http://www.vtpi.org/tdm/tdm26.htm. Somestudies have focused on the impacts of reducing parking sup-plies, but parking supplies are generally limited where land useis intense and land costs are high. In these cases, it is commonto see parking fees that correlate with land values, and therelationship between parking supply and transit demand iscaptive to the dominant role of parking pricing.)
At The Merrick TOD, only 17% of workers commuted byprivate vehicle if required to pay for parking at school orwork. In contrast, more than 70% of those with free parkingused a private vehicle. The most recent California study foundthat the likelihood of transit commuting rose by nearly 70%if station-area residents enjoyed flex-time privileges and hadto pay market rates for parking, compared to the scenario of noflex-time and free parking. The 1993 California study foundthe availability of abundant free parking to be the biggest de-terrent to transit riding among those living and working neartransit (Dill, 2005).
Restricted parking supplies at the workplace and employerfinancial assistance with transit costs also increased the oddsof station-area workers opting for rail transit. Figure 1.1 fromthe Lund et al. study reveals the relationship. Based on the ex-periences of the typical California TOD office worker, themodels showed with 25 feeder buses per day, a workplacewith 50% more parking spaces than workers and no employerhelp with transit costs, just 9% of office workers near aCalifornia rail station likely will commute by transit. At theother extreme, for a worker leaving a station with 400 dailyfeeder buses and heading to a worksite where the employerprovides transit-pass assistance and offers just one parking
20
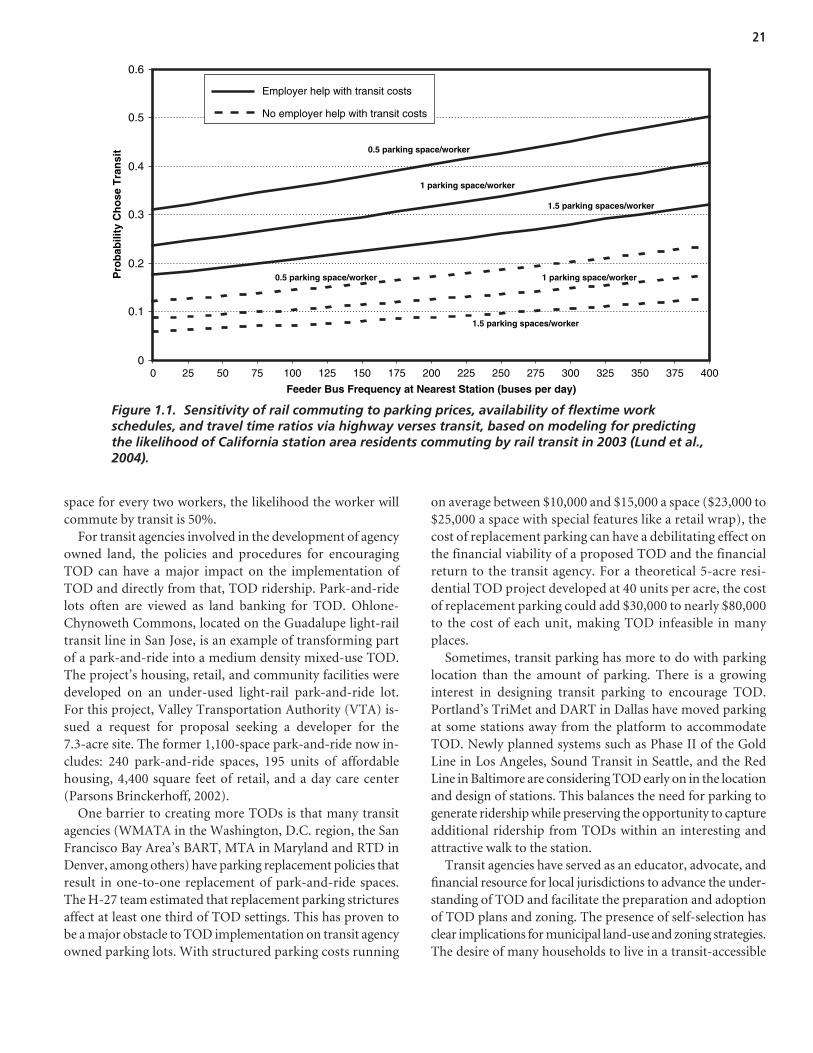
space for every two workers, the likelihood the worker willcommute by transit is 50%.
For transit agencies involved in the development of agencyowned land, the policies and procedures for encouragingTOD can have a major impact on the implementation ofTOD and directly from that, TOD ridership. Park-and-ridelots often are viewed as land banking for TOD. Ohlone-Chynoweth Commons, located on the Guadalupe light-railtransit line in San Jose, is an example of transforming partof a park-and-ride into a medium density mixed-use TOD.The project’s housing, retail, and community facilities weredeveloped on an under-used light-rail park-and-ride lot.For this project, Valley Transportation Authority (VTA) is-sued a request for proposal seeking a developer for the7.3-acre site. The former 1,100-space park-and-ride now in-cludes: 240 park-and-ride spaces, 195 units of affordablehousing, 4,400 square feet of retail, and a day care center(Parsons Brinckerhoff, 2002).
One barrier to creating more TODs is that many transitagencies (WMATA in the Washington, D.C. region, the SanFrancisco Bay Area’s BART, MTA in Maryland and RTD inDenver, among others) have parking replacement policies thatresult in one-to-one replacement of park-and-ride spaces.The H-27 team estimated that replacement parking stricturesaffect at least one third of TOD settings. This has proven tobe a major obstacle to TOD implementation on transit agencyowned parking lots. With structured parking costs running
on average between $10,000 and $15,000 a space ($23,000 to$25,000 a space with special features like a retail wrap), thecost of replacement parking can have a debilitating effect onthe financial viability of a proposed TOD and the financialreturn to the transit agency. For a theoretical 5-acre resi-dential TOD project developed at 40 units per acre, the costof replacement parking could add $30,000 to nearly $80,000to the cost of each unit, making TOD infeasible in manyplaces.
Sometimes, transit parking has more to do with parkinglocation than the amount of parking. There is a growinginterest in designing transit parking to encourage TOD.Portland’s TriMet and DART in Dallas have moved parkingat some stations away from the platform to accommodateTOD. Newly planned systems such as Phase II of the GoldLine in Los Angeles, Sound Transit in Seattle, and the RedLine in Baltimore are considering TOD early on in the locationand design of stations. This balances the need for parking togenerate ridership while preserving the opportunity to captureadditional ridership from TODs within an interesting andattractive walk to the station.
Transit agencies have served as an educator, advocate, andfinancial resource for local jurisdictions to advance the under-standing of TOD and facilitate the preparation and adoptionof TOD plans and zoning. The presence of self-selection hasclear implications for municipal land-use and zoning strategies.The desire of many households to live in a transit-accessible
21
0
0.1
0.2
0.3
0.4
0.5
0.6
Pro
bab
ility
Ch
ose
Tra
nsi
t
Employer help with transit costs
No employer help with transit costs
0.5 parking space/worker
1 parking space/worker
1.5 parking spaces/worker
0.5 parking space/worker 1 parking space/worker
1.5 parking spaces/worker
0 25 50 75 100 125 150 175 200 225 250 275 300 325 350 375 400
Feeder Bus Frequency at Nearest Station (buses per day)
Figure 1.1. Sensitivity of rail commuting to parking prices, availability of flextime workschedules, and travel time ratios via highway verses transit, based on modeling for predictingthe likelihood of California station area residents commuting by rail transit in 2003 (Lund et al.,2004).
location argues for market-responsive planning and zoning.Introducing zoning and building codes consistent with lifestylepreferences of TOD residents means individuals can moreeasily sort themselves into transit-served settings and act upontheir travel preferences. Preferential strategies, like LocationEfficient Mortgages (LEM), also can make it easier for morehouseholds to sort themselves into highly transit-accessibleneighborhoods.
Transit agencies, in this regard, cover a seemingly everexpanding range of activities. MTA in Maryland has beeninvesting $500,000 to $600,000 annually in TOD administra-tion and planning to create more livable places and increaseridership. MTA in Los Angeles, Sound Transit in Seattle, theRT in Sacramento, Triangle Transit in North Carolina, andTriMet in Portland are part of the growing list of transit agen-cies that have passed transit agency funds through to localgovernments to plan for TOD as part of developing new railsystems (Arrington, 2003).
BART has active planning partnerships underway at a dozendifferent stations with the objective of building stronger part-nerships with local governments and to encourage ridershipgrowth on its system. In an innovative twist on that theme,San Diego’s MTDB has a San Diego city planner assigned towork with MTDB’s planning staff as a liaison on TOD. NJTransit, the nation’s largest state transportation system, pro-vides TOD assistance to cities through the Transit-FriendlyCommunities (TFC) program and the Transit Village Initia-tive. The TFC program, started in 1996, allocates roughly$100,000 per community to hire preselected consulting teamsto get cities ready for serious transit village consideration.Charlotte Area Transit (CATS), together with the City ofCharlotte/Mecklenburg County, has developed a 25-yearregional transit/land-use plan, a joint development policy andstation area plans to guide growth along centers and corridors.Metra, Chicago’s commuter rail operator, has developed strate-gies, principles and approaches to residential development instation areas targeted at communities and real estate profes-sionals. Finally, Parsons Brinckerhoff has identified nearly100 transit agencies that have prepared TOD design guide-lines as part of a strategy to grow ridership and encourage theimplementation of more TODs.
TOD Resident/TenantCharacteristics
1. What are the demographic profiles of TOD residents andemployers?
2. What motivates residents or employers to locate in TODs?Examples of motivators may include the quality of schools,access to jobs, housing affordability, presence of transitservices, neighborhood services and amenities, and com-munity perception.
Key Conclusions
• The majority of TOD residents along new transit systemsare childless singles or couples.
• They are often younger working professionals, or olderempty-nesters. There is a wide age spectrum.
• They may have low, medium or high incomes; this is drivenby the design and price of the specific TOD housing, andTOD developers will target/be able to predict their market.More higher incomes are being served as the United Statescontinues to go through a robust construction phase ofdenser urban residential product.
• TOD households typically own fewer cars because theyhave smaller households, and because they may forgo extracars due to transit’s proximity. TOD households are almosttwice as likely to not own any car, and own almost half thenumber of cars of other households.
• The top three reasons households give for selecting a TODare housing/neighborhood design, housing cost, and prox-imity to transit.
Findings
With an expanding inventory of built TODs to observe andlearn from, there is a growing body of evidence about who isattracted to work, live, shop, and play in TODs. At the macrolevel, larger demographic trends washing over America withthe aging of the baby boomers and the growth of the Gener-ation X’ers (24-34) are helping drive a growing demand for amore urban real estate product. New Urban News (January/February 2003) cites the following factors as helping to drivethe trend: a doubling of demand for homes within an easywalk of stores, and an increase in buyers who prefer dense,compact homes. New Urban News quotes Dowell Meyer’sresearch indicating that this market segment is expected to ac-count for 31% of 2000-2010 homeowner growth. In addition,the number of U.S. households with children is projected todecline. In 1990 they constituted 33.6% of households; by2010 they will drop to 29.5% of households. These forces com-plement and reinforce the growing demand for TOD.
Survey data and anecdotal case-study data offer strong in-sights into the demographic make-up of TOD residents. TODsoften have large shares of childless couples, empty-nesters,Generation X’ers, and foreign immigrants (some of whomcome from places with a heritage of transit-oriented living).Table 1.12 shows the demographic characteristics of TODsstudied in the H-27 research. These data are consistent withother data showing that TODs attract smaller, typically child-less households.
Other research about who lives in TODs reinforces thesefindings. A recent study of Transit Villages in New Jersey(Renne, 2003) reveals that they cater to a younger population
22
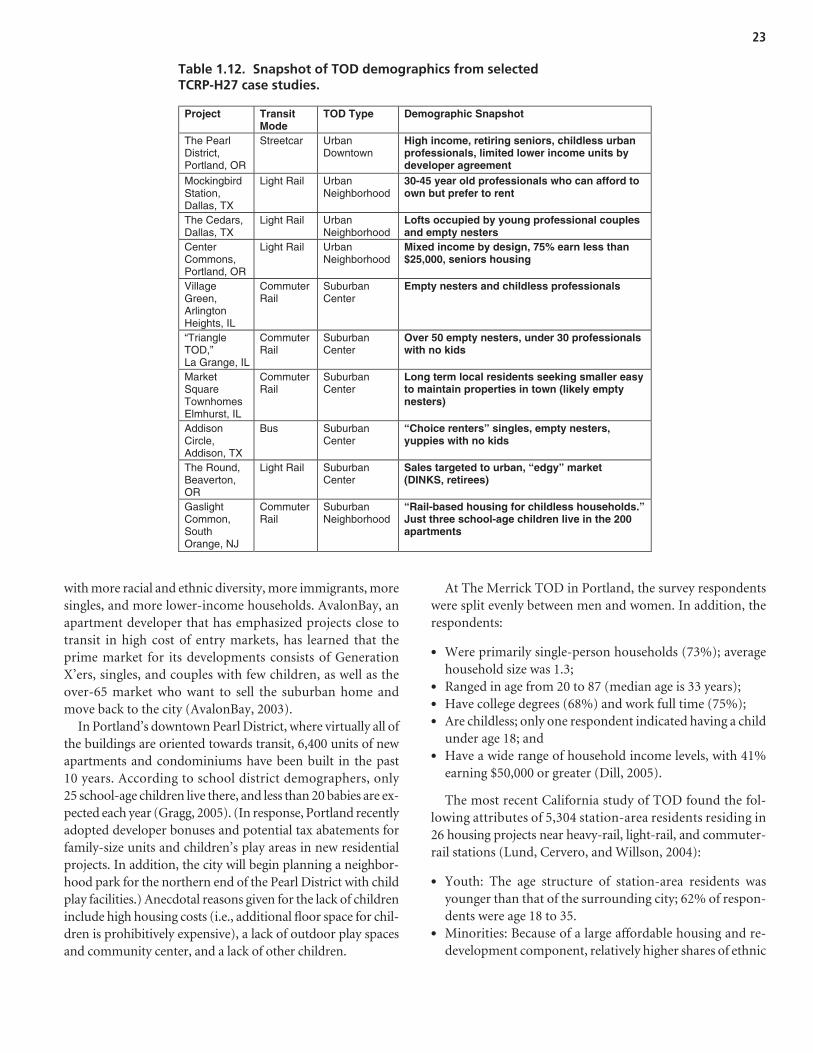
with more racial and ethnic diversity, more immigrants, moresingles, and more lower-income households. AvalonBay, anapartment developer that has emphasized projects close totransit in high cost of entry markets, has learned that theprime market for its developments consists of GenerationX’ers, singles, and couples with few children, as well as theover-65 market who want to sell the suburban home andmove back to the city (AvalonBay, 2003).
In Portland’s downtown Pearl District, where virtually all ofthe buildings are oriented towards transit, 6,400 units of newapartments and condominiums have been built in the past10 years. According to school district demographers, only25 school-age children live there, and less than 20 babies are ex-pected each year (Gragg, 2005). (In response, Portland recentlyadopted developer bonuses and potential tax abatements forfamily-size units and children’s play areas in new residentialprojects. In addition, the city will begin planning a neighbor-hood park for the northern end of the Pearl District with childplay facilities.) Anecdotal reasons given for the lack of childreninclude high housing costs (i.e., additional floor space for chil-dren is prohibitively expensive), a lack of outdoor play spacesand community center, and a lack of other children.
At The Merrick TOD in Portland, the survey respondentswere split evenly between men and women. In addition, therespondents:
• Were primarily single-person households (73%); averagehousehold size was 1.3;
• Ranged in age from 20 to 87 (median age is 33 years);• Have college degrees (68%) and work full time (75%);• Are childless; only one respondent indicated having a child
under age 18; and• Have a wide range of household income levels, with 41%
earning $50,000 or greater (Dill, 2005).
The most recent California study of TOD found the fol-lowing attributes of 5,304 station-area residents residing in26 housing projects near heavy-rail, light-rail, and commuter-rail stations (Lund, Cervero, and Willson, 2004):
• Youth: The age structure of station-area residents wasyounger than that of the surrounding city; 62% of respon-dents were age 18 to 35.
• Minorities: Because of a large affordable housing and re-development component, relatively higher shares of ethnic
23
Project Transit Mode
TOD Type Demographic Snapshot
The Pearl District, Portland, OR
Streetcar Urban Downtown
High income, retiring seniors, childless urban professionals, limited lower income units by developer agreement
Mockingbird Station, Dallas, TX
Light Rail Urban Neighborhood
30-45 year old professionals who can afford to own but prefer to rent
The Cedars, Dallas, TX
Light Rail Urban Neighborhood
Lofts occupied by young professional couples and empty nesters
Center Commons, Portland, OR
Light Rail Urban Neighborhood
Mixed income by design, 75% earn less than $25,000, seniors housing
Village Green, Arlington Heights, IL
Commuter Rail
Suburban Center
Empty nesters and childless professionals
“Triangle TOD,” La Grange, IL
Commuter Rail
Suburban Center
Over 50 empty nesters, under 30 professionals with no kids
Market Square Townhomes Elmhurst, IL
Commuter Rail
Suburban Center
Long term local residents seeking smaller easy to maintain properties in town (likely empty nesters)
Addison Circle, Addison, TX
Bus Suburban Center
“Choice renters” singles, empty nesters, yuppies with no kids
The Round, Beaverton, OR
Light Rail Suburban Center
Sales targeted to urban, “edgy” market (DINKS, retirees)
Gaslight Common, South Orange, NJ
Commuter Rail
Suburban Neighborhood
“Rail-based housing for childless households.” Just three school-age children live in the 200 apartments
Table 1.12. Snapshot of TOD demographics from selected TCRP-H27 case studies.
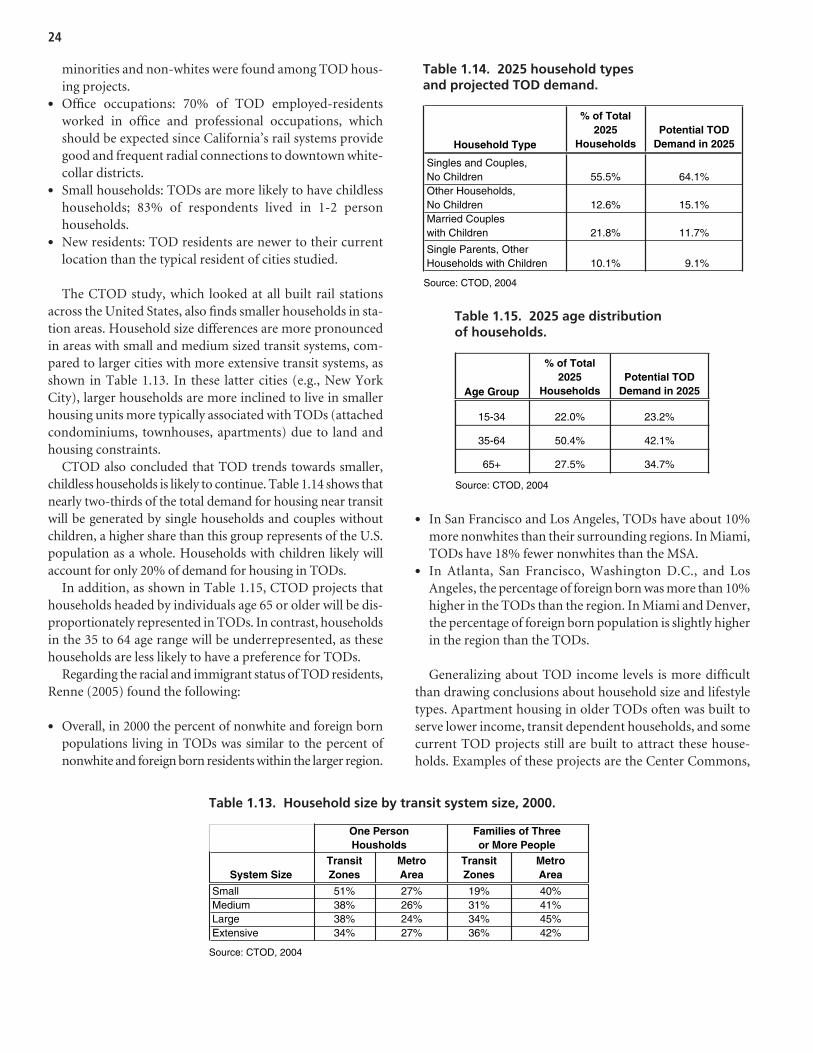
minorities and non-whites were found among TOD hous-ing projects.
• Office occupations: 70% of TOD employed-residentsworked in office and professional occupations, whichshould be expected since California’s rail systems providegood and frequent radial connections to downtown white-collar districts.
• Small households: TODs are more likely to have childlesshouseholds; 83% of respondents lived in 1-2 personhouseholds.
• New residents: TOD residents are newer to their currentlocation than the typical resident of cities studied.
The CTOD study, which looked at all built rail stationsacross the United States, also finds smaller households in sta-tion areas. Household size differences are more pronouncedin areas with small and medium sized transit systems, com-pared to larger cities with more extensive transit systems, asshown in Table 1.13. In these latter cities (e.g., New YorkCity), larger households are more inclined to live in smallerhousing units more typically associated with TODs (attachedcondominiums, townhouses, apartments) due to land andhousing constraints.
CTOD also concluded that TOD trends towards smaller,childless households is likely to continue. Table 1.14 shows thatnearly two-thirds of the total demand for housing near transitwill be generated by single households and couples withoutchildren, a higher share than this group represents of the U.S.population as a whole. Households with children likely willaccount for only 20% of demand for housing in TODs.
In addition, as shown in Table 1.15, CTOD projects thathouseholds headed by individuals age 65 or older will be dis-proportionately represented in TODs. In contrast, householdsin the 35 to 64 age range will be underrepresented, as thesehouseholds are less likely to have a preference for TODs.
Regarding the racial and immigrant status of TOD residents,Renne (2005) found the following:
• Overall, in 2000 the percent of nonwhite and foreign bornpopulations living in TODs was similar to the percent ofnonwhite and foreign born residents within the larger region.
• In San Francisco and Los Angeles, TODs have about 10%more nonwhites than their surrounding regions. In Miami,TODs have 18% fewer nonwhites than the MSA.
• In Atlanta, San Francisco, Washington D.C., and LosAngeles, the percentage of foreign born was more than 10%higher in the TODs than the region. In Miami and Denver,the percentage of foreign born population is slightly higherin the region than the TODs.
Generalizing about TOD income levels is more difficultthan drawing conclusions about household size and lifestyletypes. Apartment housing in older TODs often was built toserve lower income, transit dependent households, and somecurrent TOD projects still are built to attract these house-holds. Examples of these projects are the Center Commons,
24
System SizeTransitZones
MetroArea
TransitZones
MetroArea
Small 51% 27% 19% 40%Medium 38% 26% 31% 41%Large 38% 24% 34% 45%Extensive 34% 27% 36% 42%
Source: CTOD, 2004
One PersonHousholds
Families of Threeor More People
Table 1.13. Household size by transit system size, 2000.
Household Type
% of Total2025
HouseholdsPotential TOD
Demand in 2025
Singles and Couples,No Children 55.5% 64.1%Other Households,No Children 12.6% 15.1%Married Coupleswith Children 21.8% 11.7%
Single Parents, OtherHouseholds with Children 10.1% 9.1%
Source: CTOD, 2004
Table 1.14. 2025 household types and projected TOD demand.
Age Group
% of Total2025
HouseholdsPotential TOD
Demand in 2025
15-34 22.0% 23.2%
35-64 50.4% 42.1%
65+ 27.5% 34.7%
Source: CTOD, 2004
Table 1.15. 2025 age distributionof households.
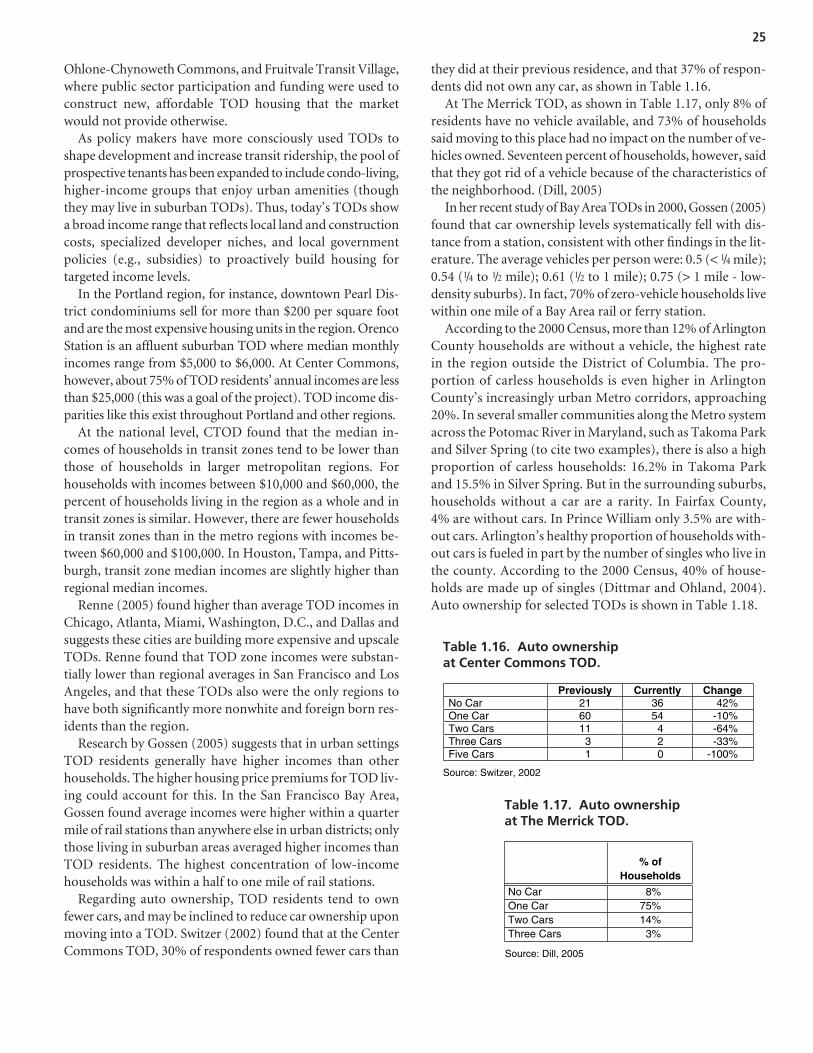
Ohlone-Chynoweth Commons, and Fruitvale Transit Village,where public sector participation and funding were used toconstruct new, affordable TOD housing that the marketwould not provide otherwise.
As policy makers have more consciously used TODs toshape development and increase transit ridership, the pool ofprospective tenants has been expanded to include condo-living,higher-income groups that enjoy urban amenities (thoughthey may live in suburban TODs). Thus, today’s TODs showa broad income range that reflects local land and constructioncosts, specialized developer niches, and local governmentpolicies (e.g., subsidies) to proactively build housing fortargeted income levels.
In the Portland region, for instance, downtown Pearl Dis-trict condominiums sell for more than $200 per square footand are the most expensive housing units in the region. OrencoStation is an affluent suburban TOD where median monthlyincomes range from $5,000 to $6,000. At Center Commons,however, about 75% of TOD residents’ annual incomes are lessthan $25,000 (this was a goal of the project). TOD income dis-parities like this exist throughout Portland and other regions.
At the national level, CTOD found that the median in-comes of households in transit zones tend to be lower thanthose of households in larger metropolitan regions. Forhouseholds with incomes between $10,000 and $60,000, thepercent of households living in the region as a whole and intransit zones is similar. However, there are fewer householdsin transit zones than in the metro regions with incomes be-tween $60,000 and $100,000. In Houston, Tampa, and Pitts-burgh, transit zone median incomes are slightly higher thanregional median incomes.
Renne (2005) found higher than average TOD incomes inChicago, Atlanta, Miami, Washington, D.C., and Dallas andsuggests these cities are building more expensive and upscaleTODs. Renne found that TOD zone incomes were substan-tially lower than regional averages in San Francisco and LosAngeles, and that these TODs also were the only regions tohave both significantly more nonwhite and foreign born res-idents than the region.
Research by Gossen (2005) suggests that in urban settingsTOD residents generally have higher incomes than otherhouseholds. The higher housing price premiums for TOD liv-ing could account for this. In the San Francisco Bay Area,Gossen found average incomes were higher within a quartermile of rail stations than anywhere else in urban districts; onlythose living in suburban areas averaged higher incomes thanTOD residents. The highest concentration of low-incomehouseholds was within a half to one mile of rail stations.
Regarding auto ownership, TOD residents tend to ownfewer cars, and may be inclined to reduce car ownership uponmoving into a TOD. Switzer (2002) found that at the CenterCommons TOD, 30% of respondents owned fewer cars than
they did at their previous residence, and that 37% of respon-dents did not own any car, as shown in Table 1.16.
At The Merrick TOD, as shown in Table 1.17, only 8% ofresidents have no vehicle available, and 73% of householdssaid moving to this place had no impact on the number of ve-hicles owned. Seventeen percent of households, however, saidthat they got rid of a vehicle because of the characteristics ofthe neighborhood. (Dill, 2005)
In her recent study of Bay Area TODs in 2000, Gossen (2005)found that car ownership levels systematically fell with dis-tance from a station, consistent with other findings in the lit-erature. The average vehicles per person were: 0.5 (< 1/4 mile);0.54 (1/4 to 1/2 mile); 0.61 (1/2 to 1 mile); 0.75 (> 1 mile - low-density suburbs). In fact, 70% of zero-vehicle households livewithin one mile of a Bay Area rail or ferry station.
According to the 2000 Census, more than 12% of ArlingtonCounty households are without a vehicle, the highest ratein the region outside the District of Columbia. The pro-portion of carless households is even higher in ArlingtonCounty’s increasingly urban Metro corridors, approaching20%. In several smaller communities along the Metro systemacross the Potomac River in Maryland, such as Takoma Parkand Silver Spring (to cite two examples), there is also a highproportion of carless households: 16.2% in Takoma Parkand 15.5% in Silver Spring. But in the surrounding suburbs,households without a car are a rarity. In Fairfax County,4% are without cars. In Prince William only 3.5% are with-out cars. Arlington’s healthy proportion of households with-out cars is fueled in part by the number of singles who live inthe county. According to the 2000 Census, 40% of house-holds are made up of singles (Dittmar and Ohland, 2004).Auto ownership for selected TODs is shown in Table 1.18.
25
Previously Currently ChangeNo Car 21 36 42%One Car 60 54 -10%Two Cars 11 4 -64%Three Cars 3 -33%Five Cars 1
20 -100%
Source: Switzer, 2002
% ofHouseholds
No Car 8%One Car 75%Two Cars 14%Three Cars 3%
Source: Dill, 2005
Table 1.16. Auto ownership at Center Commons TOD.
Table 1.17. Auto ownershipat The Merrick TOD.
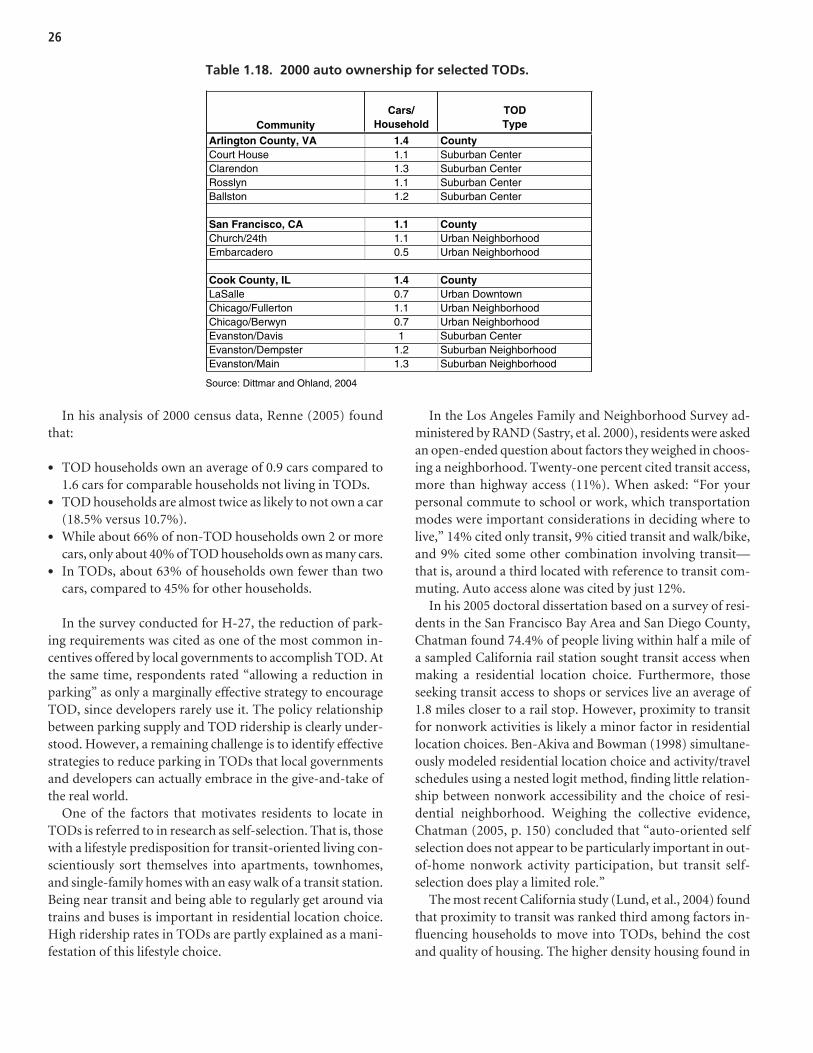
In his analysis of 2000 census data, Renne (2005) foundthat:
• TOD households own an average of 0.9 cars compared to1.6 cars for comparable households not living in TODs.
• TOD households are almost twice as likely to not own a car(18.5% versus 10.7%).
• While about 66% of non-TOD households own 2 or morecars, only about 40% of TOD households own as many cars.
• In TODs, about 63% of households own fewer than twocars, compared to 45% for other households.
In the survey conducted for H-27, the reduction of park-ing requirements was cited as one of the most common in-centives offered by local governments to accomplish TOD. Atthe same time, respondents rated “allowing a reduction inparking” as only a marginally effective strategy to encourageTOD, since developers rarely use it. The policy relationshipbetween parking supply and TOD ridership is clearly under-stood. However, a remaining challenge is to identify effectivestrategies to reduce parking in TODs that local governmentsand developers can actually embrace in the give-and-take ofthe real world.
One of the factors that motivates residents to locate inTODs is referred to in research as self-selection. That is, thosewith a lifestyle predisposition for transit-oriented living con-scientiously sort themselves into apartments, townhomes,and single-family homes with an easy walk of a transit station.Being near transit and being able to regularly get around viatrains and buses is important in residential location choice.High ridership rates in TODs are partly explained as a mani-festation of this lifestyle choice.
In the Los Angeles Family and Neighborhood Survey ad-ministered by RAND (Sastry, et al. 2000), residents were askedan open-ended question about factors they weighed in choos-ing a neighborhood. Twenty-one percent cited transit access,more than highway access (11%). When asked: “For yourpersonal commute to school or work, which transportationmodes were important considerations in deciding where tolive,” 14% cited only transit, 9% citied transit and walk/bike,and 9% cited some other combination involving transit—that is, around a third located with reference to transit com-muting. Auto access alone was cited by just 12%.
In his 2005 doctoral dissertation based on a survey of resi-dents in the San Francisco Bay Area and San Diego County,Chatman found 74.4% of people living within half a mile ofa sampled California rail station sought transit access whenmaking a residential location choice. Furthermore, thoseseeking transit access to shops or services live an average of1.8 miles closer to a rail stop. However, proximity to transitfor nonwork activities is likely a minor factor in residentiallocation choices. Ben-Akiva and Bowman (1998) simultane-ously modeled residential location choice and activity/travelschedules using a nested logit method, finding little relation-ship between nonwork accessibility and the choice of resi-dential neighborhood. Weighing the collective evidence,Chatman (2005, p. 150) concluded that “auto-oriented selfselection does not appear to be particularly important in out-of-home nonwork activity participation, but transit self-selection does play a limited role.”
The most recent California study (Lund, et al., 2004) foundthat proximity to transit was ranked third among factors in-fluencing households to move into TODs, behind the costand quality of housing. The higher density housing found in
26
CommunityCars/
HouseholdTODType
Arlington County, VA 1.4 CountyCourt House 1.1 Suburban CenterClarendon 1.3 Suburban CenterRosslyn 1.1 Suburban CenterBallston 1.2 Suburban Center
San Francisco, CA 1.1 CountyChurch/24th 1.1 Urban NeighborhoodEmbarcadero 0.5 Urban Neighborhood
Cook County, IL 1.4 CountyLaSalle 0.7 Urban DowntownChicago/Fullerton 1.1 Urban NeighborhoodChicago/Berwyn 0.7 Urban NeighborhoodEvanston/Davis 1 Suburban CenterEvanston/Dempster 1.2 Suburban NeighborhoodEvanston/Main 1.3 Suburban Neighborhood
Source: Dittmar and Ohland, 2004
Table 1.18. 2000 auto ownership for selected TODs.
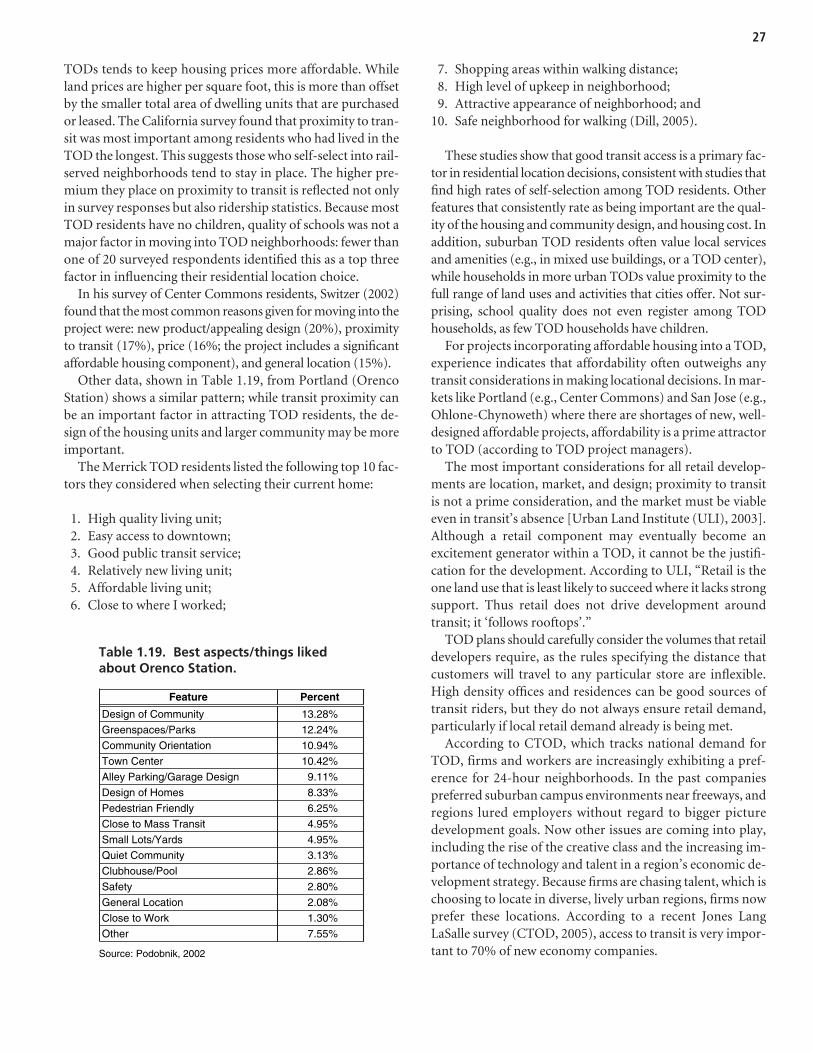
TODs tends to keep housing prices more affordable. Whileland prices are higher per square foot, this is more than offsetby the smaller total area of dwelling units that are purchasedor leased. The California survey found that proximity to tran-sit was most important among residents who had lived in theTOD the longest. This suggests those who self-select into rail-served neighborhoods tend to stay in place. The higher pre-mium they place on proximity to transit is reflected not onlyin survey responses but also ridership statistics. Because mostTOD residents have no children, quality of schools was not amajor factor in moving into TOD neighborhoods: fewer thanone of 20 surveyed respondents identified this as a top threefactor in influencing their residential location choice.
In his survey of Center Commons residents, Switzer (2002)found that the most common reasons given for moving into theproject were: new product/appealing design (20%), proximityto transit (17%), price (16%; the project includes a significantaffordable housing component), and general location (15%).
Other data, shown in Table 1.19, from Portland (OrencoStation) shows a similar pattern; while transit proximity canbe an important factor in attracting TOD residents, the de-sign of the housing units and larger community may be moreimportant.
The Merrick TOD residents listed the following top 10 fac-tors they considered when selecting their current home:
1. High quality living unit;2. Easy access to downtown;3. Good public transit service;4. Relatively new living unit;5. Affordable living unit;6. Close to where I worked;
7. Shopping areas within walking distance;8. High level of upkeep in neighborhood;9. Attractive appearance of neighborhood; and
10. Safe neighborhood for walking (Dill, 2005).
These studies show that good transit access is a primary fac-tor in residential location decisions, consistent with studies thatfind high rates of self-selection among TOD residents. Otherfeatures that consistently rate as being important are the qual-ity of the housing and community design, and housing cost. Inaddition, suburban TOD residents often value local servicesand amenities (e.g., in mixed use buildings, or a TOD center),while households in more urban TODs value proximity to thefull range of land uses and activities that cities offer. Not sur-prising, school quality does not even register among TODhouseholds, as few TOD households have children.
For projects incorporating affordable housing into a TOD,experience indicates that affordability often outweighs anytransit considerations in making locational decisions. In mar-kets like Portland (e.g., Center Commons) and San Jose (e.g.,Ohlone-Chynoweth) where there are shortages of new, well-designed affordable projects, affordability is a prime attractorto TOD (according to TOD project managers).
The most important considerations for all retail develop-ments are location, market, and design; proximity to transitis not a prime consideration, and the market must be viableeven in transit’s absence [Urban Land Institute (ULI), 2003].Although a retail component may eventually become anexcitement generator within a TOD, it cannot be the justifi-cation for the development. According to ULI, “Retail is theone land use that is least likely to succeed where it lacks strongsupport. Thus retail does not drive development aroundtransit; it ‘follows rooftops’.”
TOD plans should carefully consider the volumes that retaildevelopers require, as the rules specifying the distance thatcustomers will travel to any particular store are inflexible.High density offices and residences can be good sources oftransit riders, but they do not always ensure retail demand,particularly if local retail demand already is being met.
According to CTOD, which tracks national demand forTOD, firms and workers are increasingly exhibiting a pref-erence for 24-hour neighborhoods. In the past companiespreferred suburban campus environments near freeways, andregions lured employers without regard to bigger picturedevelopment goals. Now other issues are coming into play,including the rise of the creative class and the increasing im-portance of technology and talent in a region’s economic de-velopment strategy. Because firms are chasing talent, which ischoosing to locate in diverse, lively urban regions, firms nowprefer these locations. According to a recent Jones LangLaSalle survey (CTOD, 2005), access to transit is very impor-tant to 70% of new economy companies.
27
Feature Percent
Design of Community 13.28%
Greenspaces/Parks 12.24%
Community Orientation 10.94%
Town Center 10.42%
Alley Parking/Garage Design 9.11%
Design of Homes 8.33%
Pedestrian Friendly 6.25%
Close to Mass Transit 4.95%
Small Lots/Yards 4.95%
Quiet Community 3.13%
Clubhouse/Pool 2.86%
Safety 2.80%
General Location 2.08%
Close to Work 1.30%
Other 7.55%
Source: Podobnik, 2002
Table 1.19. Best aspects/things likedabout Orenco Station.
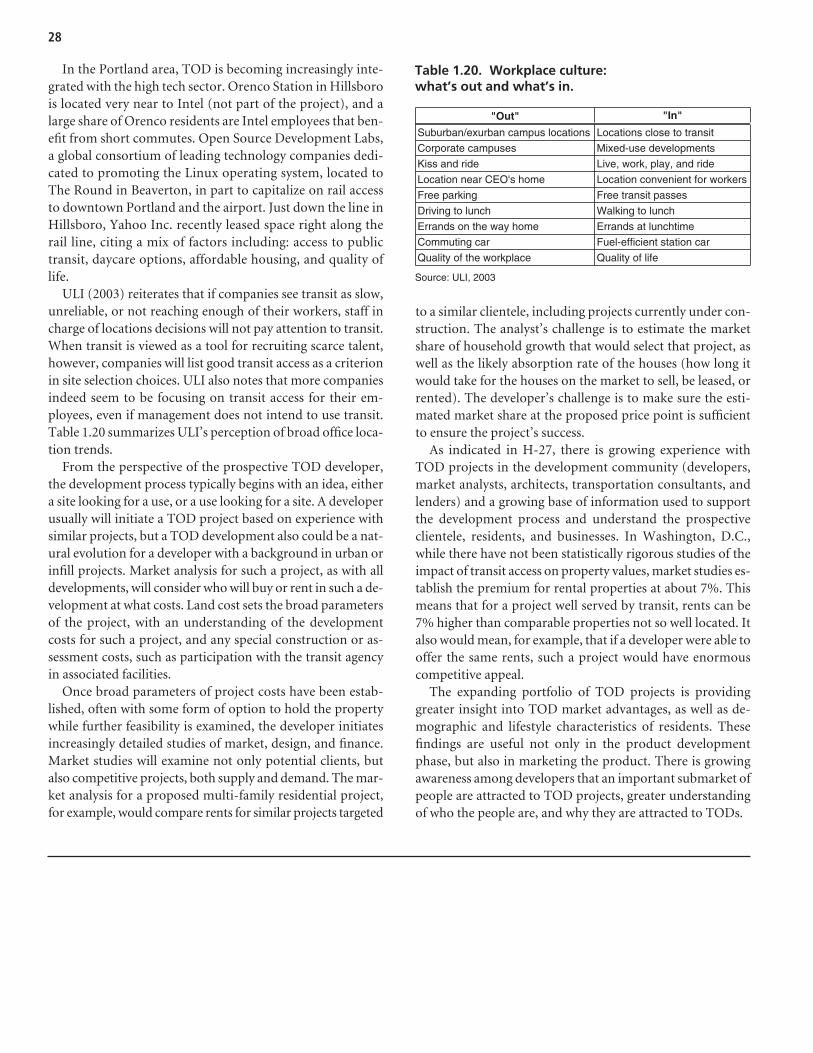
In the Portland area, TOD is becoming increasingly inte-grated with the high tech sector. Orenco Station in Hillsborois located very near to Intel (not part of the project), and alarge share of Orenco residents are Intel employees that ben-efit from short commutes. Open Source Development Labs,a global consortium of leading technology companies dedi-cated to promoting the Linux operating system, located toThe Round in Beaverton, in part to capitalize on rail accessto downtown Portland and the airport. Just down the line inHillsboro, Yahoo Inc. recently leased space right along therail line, citing a mix of factors including: access to publictransit, daycare options, affordable housing, and quality oflife.
ULI (2003) reiterates that if companies see transit as slow,unreliable, or not reaching enough of their workers, staff incharge of locations decisions will not pay attention to transit.When transit is viewed as a tool for recruiting scarce talent,however, companies will list good transit access as a criterionin site selection choices. ULI also notes that more companiesindeed seem to be focusing on transit access for their em-ployees, even if management does not intend to use transit.Table 1.20 summarizes ULI’s perception of broad office loca-tion trends.
From the perspective of the prospective TOD developer,the development process typically begins with an idea, eithera site looking for a use, or a use looking for a site. A developerusually will initiate a TOD project based on experience withsimilar projects, but a TOD development also could be a nat-ural evolution for a developer with a background in urban orinfill projects. Market analysis for such a project, as with alldevelopments, will consider who will buy or rent in such a de-velopment at what costs. Land cost sets the broad parametersof the project, with an understanding of the developmentcosts for such a project, and any special construction or as-sessment costs, such as participation with the transit agencyin associated facilities.
Once broad parameters of project costs have been estab-lished, often with some form of option to hold the propertywhile further feasibility is examined, the developer initiatesincreasingly detailed studies of market, design, and finance.Market studies will examine not only potential clients, butalso competitive projects, both supply and demand. The mar-ket analysis for a proposed multi-family residential project,for example, would compare rents for similar projects targeted
to a similar clientele, including projects currently under con-struction. The analyst’s challenge is to estimate the marketshare of household growth that would select that project, aswell as the likely absorption rate of the houses (how long itwould take for the houses on the market to sell, be leased, orrented). The developer’s challenge is to make sure the esti-mated market share at the proposed price point is sufficientto ensure the project’s success.
As indicated in H-27, there is growing experience withTOD projects in the development community (developers,market analysts, architects, transportation consultants, andlenders) and a growing base of information used to supportthe development process and understand the prospectiveclientele, residents, and businesses. In Washington, D.C.,while there have not been statistically rigorous studies of theimpact of transit access on property values, market studies es-tablish the premium for rental properties at about 7%. Thismeans that for a project well served by transit, rents can be7% higher than comparable properties not so well located. Italso would mean, for example, that if a developer were able tooffer the same rents, such a project would have enormouscompetitive appeal.
The expanding portfolio of TOD projects is providinggreater insight into TOD market advantages, as well as de-mographic and lifestyle characteristics of residents. Thesefindings are useful not only in the product developmentphase, but also in marketing the product. There is growingawareness among developers that an important submarket ofpeople are attracted to TOD projects, greater understandingof who the people are, and why they are attracted to TODs.
28
"Out" "In"
Suburban/exurban campus locations Locations close to transit
Corporate campuses Mixed-use developments
Kiss and ride Live, work, play, and ride
Location near CEO's home Location convenient for workers
Free parking Free transit passes
Driving to lunch Walking to lunch
Errands on the way home Errands at lunchtime
Commuting car Fuel-efficient station car
Quality of the workplace Quality of life
Source: ULI, 2003
Table 1.20. Workplace culture: what’s out and what’s in.
29
TOD has attracted interest as a tool for promoting smartgrowth, leveraging economic development, and catering toshifting market demands and lifestyle preferences. Part of theappeal TODs hold is they behave differently from conven-tional development patterns. People living and working inTODs walk more, use transit more, and own fewer cars thanthe rest of their region. TOD households are twice as likelyto not own a car, and own roughly half as many cars as theaverage household. At an individual station TOD can in-crease ridership by 20% to 40% and up to 5% overall at theregional level. Residents living near transit are 5 to 6 timesmore likely to commute by transit than other residents intheir region. Self-selection is a major contributor to the ben-efits of TOD, meaning that people choosing to live in a TODare predisposed to use transit (Cervero, et al., 2004).
Given their performance characteristics, TODs present anopportunity to accommodate increased density withoutmany negative impacts associated with the automobile. Whileresearch clearly points to how TODs perform differently, thebody of information on TOD travel characteristics has yet tohave an impact on industry guidance for projects near majortransit stations.
This research seeks to bridge one of the widest knowledgegaps on the effects of TOD on travel demand: automobile tripgeneration rates for residential TODs. Empirical evidence onvehicle trip generation can inform the setting of parking re-quirements for projects near major transit stations. Despitethe existing body of research and supportive local develop-ment, codes developers and financial institutions still tend toprefer conventional parking ratios in TODs. As a conse-quence most TODs are oblivious to the fact that a rail stop isnearby and as a result, their potential benefits (e.g., reducedauto travel) are muted. Structured parking in particular has asignificant impact on development costs and is prohibitivelyexpensive in most markets. Lower TOD parking ratios andreduced parking could reduce construction costs, leading tosomewhat denser TODs in some markets.
Similarly, many proposed TOD projects have been haltedabruptly or redesigned at lower densities due to fears thatdense development will flood surrounding streets with autotraffic. Part of the problem lays in the inadequacy of currenttrip generation estimates, which are thought to overstate thepotential auto impacts of TOD. ITE trip generation andparking generation rates are the standards from which localtraffic and parking impacts are typically derived, and impactfees are set. Some analysts are of the opinion that there is aserious suburban bias in the current ITE rates. Typically,empirical data used to set generation rates are drawn fromsuburban areas with free and plentiful parking and low-densitysingle land uses. Moreover, ITE’s auto trip reduction factors,to reflect internal trip capture, are based on only a few mixed-use projects in Florida; there has been little or no observationof actual TODs. The end result is that auto trip generation islikely to be overstated for TODs. This can mean that TOD de-velopers end up paying higher impact fees, proffers, andexactions than they should since such charges are usually tiedto ITE rates. Smart growth requires smart calculations, thusimpact fees need to account for the likely trip reductioneffects of TOD.
Study Projects
This study aims to fill knowledge gaps by compiling andanalyzing original empirical data on vehicle trip generationrates for a representative sample of multi-family housingprojects near rail transit stations. This was done by countingthe passage of motorized vehicles using pneumatic tubesstretched across the driveways of 17 transit-oriented housingprojects of varying sizes in four urbanized areas of the country:Philadelphia/N.E. New Jersey; Portland, Oregon; metropoli-tan Washington, D.C.; and the East Bay of the San FranciscoBay Area (Figure 2.1). Rail services in these areas are of a highquality and span across four major urban rail technologies:commuter rail (Philadelphia SEPTA and NJ Transit); heavy
S E C T I O N 2
Does TOD Housing Reduce Automobile Trips?
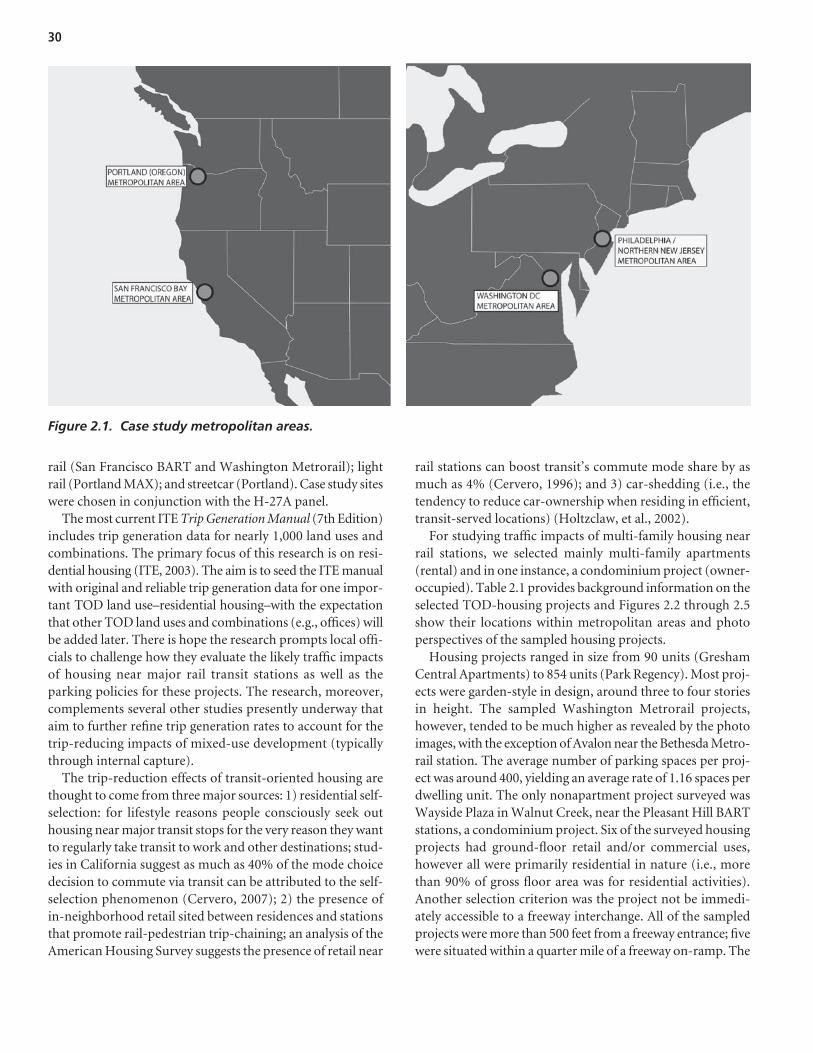
30
rail (San Francisco BART and Washington Metrorail); lightrail (Portland MAX); and streetcar (Portland). Case study siteswere chosen in conjunction with the H-27A panel.
The most current ITE Trip Generation Manual (7th Edition)includes trip generation data for nearly 1,000 land uses andcombinations. The primary focus of this research is on resi-dential housing (ITE, 2003). The aim is to seed the ITE manualwith original and reliable trip generation data for one impor-tant TOD land use–residential housing–with the expectationthat other TOD land uses and combinations (e.g., offices) willbe added later. There is hope the research prompts local offi-cials to challenge how they evaluate the likely traffic impactsof housing near major rail transit stations as well as theparking policies for these projects. The research, moreover,complements several other studies presently underway thataim to further refine trip generation rates to account for thetrip-reducing impacts of mixed-use development (typicallythrough internal capture).
The trip-reduction effects of transit-oriented housing arethought to come from three major sources: 1) residential self-selection: for lifestyle reasons people consciously seek outhousing near major transit stops for the very reason they wantto regularly take transit to work and other destinations; stud-ies in California suggest as much as 40% of the mode choicedecision to commute via transit can be attributed to the self-selection phenomenon (Cervero, 2007); 2) the presence ofin-neighborhood retail sited between residences and stationsthat promote rail-pedestrian trip-chaining; an analysis of theAmerican Housing Survey suggests the presence of retail near
rail stations can boost transit’s commute mode share by asmuch as 4% (Cervero, 1996); and 3) car-shedding (i.e., thetendency to reduce car-ownership when residing in efficient,transit-served locations) (Holtzclaw, et al., 2002).
For studying traffic impacts of multi-family housing nearrail stations, we selected mainly multi-family apartments(rental) and in one instance, a condominium project (owner-occupied). Table 2.1 provides background information on theselected TOD-housing projects and Figures 2.2 through 2.5show their locations within metropolitan areas and photoperspectives of the sampled housing projects.
Housing projects ranged in size from 90 units (GreshamCentral Apartments) to 854 units (Park Regency). Most proj-ects were garden-style in design, around three to four storiesin height. The sampled Washington Metrorail projects,however, tended to be much higher as revealed by the photoimages, with the exception of Avalon near the Bethesda Metro-rail station. The average number of parking spaces per proj-ect was around 400, yielding an average rate of 1.16 spaces perdwelling unit. The only nonapartment project surveyed wasWayside Plaza in Walnut Creek, near the Pleasant Hill BARTstations, a condominium project. Six of the surveyed housingprojects had ground-floor retail and/or commercial uses,however all were primarily residential in nature (i.e., morethan 90% of gross floor area was for residential activities).Another selection criterion was the project not be immedi-ately accessible to a freeway interchange. All of the sampledprojects were more than 500 feet from a freeway entrance; fivewere situated within a quarter mile of a freeway on-ramp. The
Figure 2.1. Case study metropolitan areas.
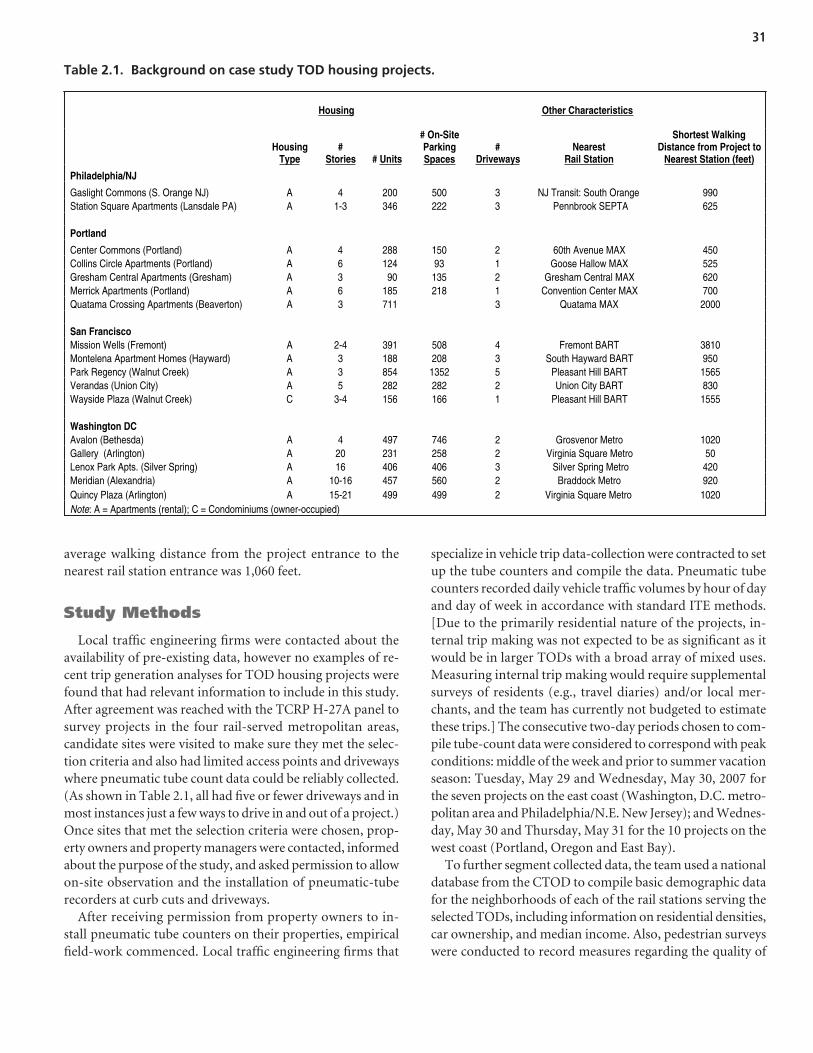
31
average walking distance from the project entrance to thenearest rail station entrance was 1,060 feet.
Study Methods
Local traffic engineering firms were contacted about theavailability of pre-existing data, however no examples of re-cent trip generation analyses for TOD housing projects werefound that had relevant information to include in this study.After agreement was reached with the TCRP H-27A panel tosurvey projects in the four rail-served metropolitan areas,candidate sites were visited to make sure they met the selec-tion criteria and also had limited access points and drivewayswhere pneumatic tube count data could be reliably collected.(As shown in Table 2.1, all had five or fewer driveways and inmost instances just a few ways to drive in and out of a project.)Once sites that met the selection criteria were chosen, prop-erty owners and property managers were contacted, informedabout the purpose of the study, and asked permission to allowon-site observation and the installation of pneumatic-tuberecorders at curb cuts and driveways.
After receiving permission from property owners to in-stall pneumatic tube counters on their properties, empiricalfield-work commenced. Local traffic engineering firms that
specialize in vehicle trip data-collection were contracted to setup the tube counters and compile the data. Pneumatic tubecounters recorded daily vehicle traffic volumes by hour of dayand day of week in accordance with standard ITE methods.[Due to the primarily residential nature of the projects, in-ternal trip making was not expected to be as significant as itwould be in larger TODs with a broad array of mixed uses.Measuring internal trip making would require supplementalsurveys of residents (e.g., travel diaries) and/or local mer-chants, and the team has currently not budgeted to estimatethese trips.] The consecutive two-day periods chosen to com-pile tube-count data were considered to correspond with peakconditions: middle of the week and prior to summer vacationseason: Tuesday, May 29 and Wednesday, May 30, 2007 forthe seven projects on the east coast (Washington, D.C. metro-politan area and Philadelphia/N.E. New Jersey); and Wednes-day, May 30 and Thursday, May 31 for the 10 projects on thewest coast (Portland, Oregon and East Bay).
To further segment collected data, the team used a nationaldatabase from the CTOD to compile basic demographic datafor the neighborhoods of each of the rail stations serving theselected TODs, including information on residential densities,car ownership, and median income. Also, pedestrian surveyswere conducted to record measures regarding the quality of
Housing Other Characteristics
HousingType
#Stories # Units
# On-Site ParkingSpaces
#Driveways
NearestRail Station
Shortest Walking Distance from Project to
Nearest Station (feet)
Philadelphia/NJ
Gaslight Commons (S. Orange NJ) A 4 200 500 3 NJ Transit: South Orange 990 Station Square Apartments (Lansdale PA) A 1-3 346 222 3 Pennbrook SEPTA 625
Portland
Center Commons (Portland) A 4 288 150 2 60th Avenue MAX 450Collins Circle Apartments (Portland) A 6 124 93 1 Goose Hallow MAX 525Gresham Central Apartments (Gresham) A 3 90 135 2 Gresham Central MAX 620 Merrick Apartments (Portland) A 6 185 218 1 Convention Center MAX 700 Quatama Crossing Apartments (Beaverton) A 3 711 3 Quatama MAX 2000
San Francisco Mission Wells (Fremont) A 2-4 391 508 4 Fremont BART 3810Montelena Apartment Homes (Hayward) A 3 188 208 3 South Hayward BART 950Park Regency (Walnut Creek) A 3 854 1352 5 Pleasant Hill BART 1565Verandas (Union City) A 5 282 282 2 Union City BART 830Wayside Plaza (Walnut Creek) C 3-4 156 166 1 Pleasant Hill BART 1555
Washington DC Avalon (Bethesda) A 4 497 746 2 Grosvenor Metro 1020Gallery (Arlington) A 20 231 258 2 Virginia Square Metro 50Lenox Park Apts. (Silver Spring) A 16 406 406 3 Silver Spring Metro 420Meridian (Alexandria) A 10-16 457 560 2 Braddock Metro 920Quincy Plaza (Arlington) A 15-21 499 499 2 Virginia Square Metro 1020 Note: A = Apartments (rental); C = Condominiums (owner-occupied)
Table 2.1. Background on case study TOD housing projects.
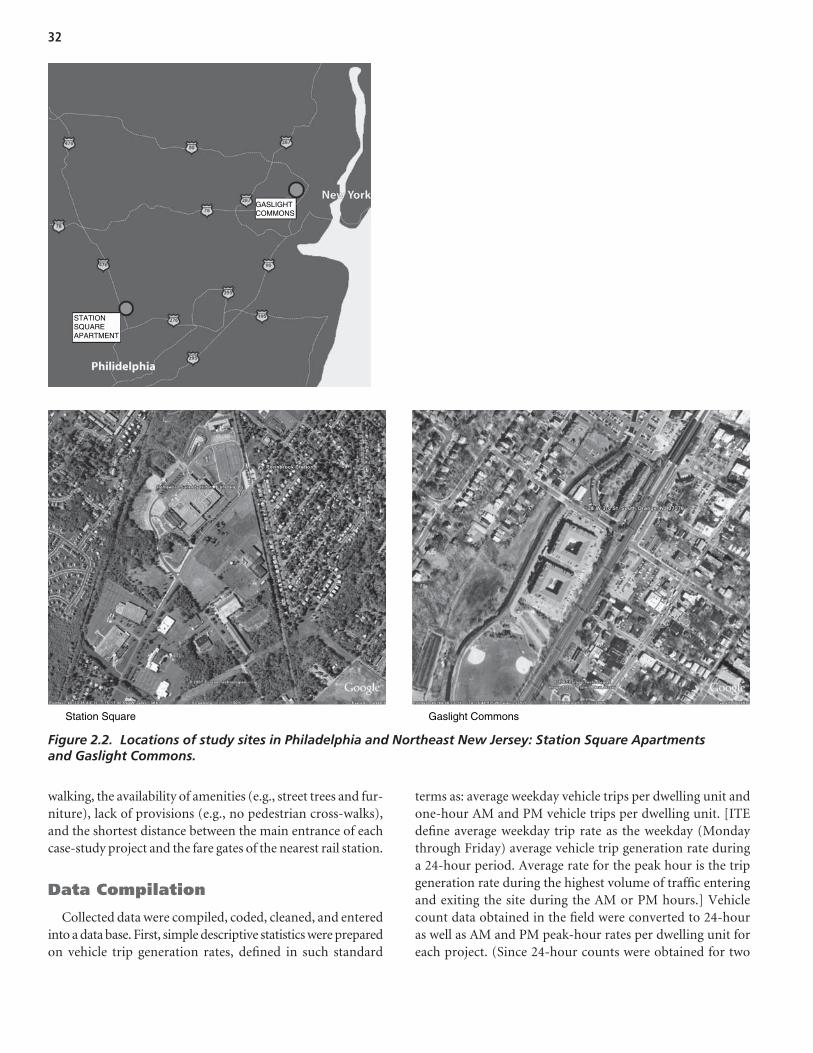
32
walking, the availability of amenities (e.g., street trees and fur-niture), lack of provisions (e.g., no pedestrian cross-walks),and the shortest distance between the main entrance of eachcase-study project and the fare gates of the nearest rail station.
Data Compilation
Collected data were compiled, coded, cleaned, and enteredinto a data base. First, simple descriptive statistics were preparedon vehicle trip generation rates, defined in such standard
terms as: average weekday vehicle trips per dwelling unit andone-hour AM and PM vehicle trips per dwelling unit. [ITEdefine average weekday trip rate as the weekday (Mondaythrough Friday) average vehicle trip generation rate duringa 24-hour period. Average rate for the peak hour is the tripgeneration rate during the highest volume of traffic enteringand exiting the site during the AM or PM hours.] Vehiclecount data obtained in the field were converted to 24-houras well as AM and PM peak-hour rates per dwelling unit foreach project. (Since 24-hour counts were obtained for two
Station Square Gaslight Commons
STATIONSQUAREAPARTMENT
GASLIGHTCOMMONS
Figure 2.2. Locations of study sites in Philadelphia and Northeast New Jersey: Station Square Apartmentsand Gaslight Commons.
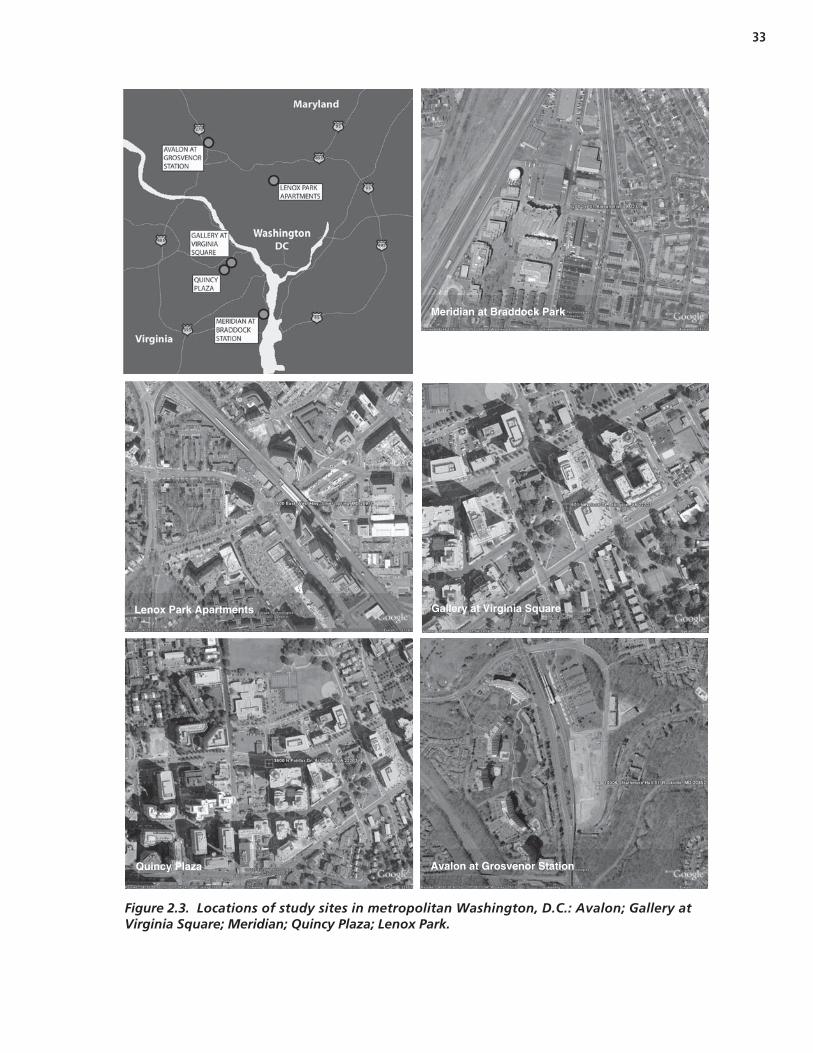
33
Avalon at Grosvenor Station
Lenox Park Apartments Gallery at Virginia Square
Quincy Plaza
Meridian at Braddock Park
Figure 2.3. Locations of study sites in metropolitan Washington, D.C.: Avalon; Gallery atVirginia Square; Meridian; Quincy Plaza; Lenox Park.
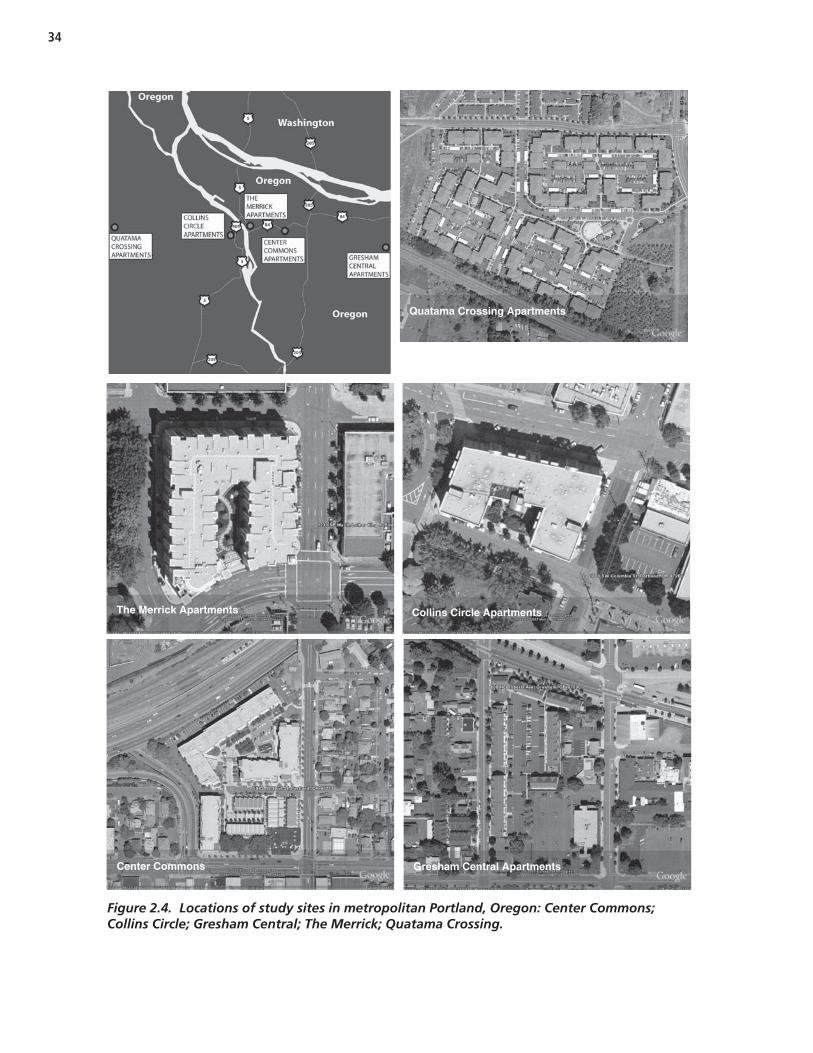
34
Quatama Crossing Apartments
Collins Circle Apartments The Merrick Apartments
Center Commons Gresham Central Apartments
Figure 2.4. Locations of study sites in metropolitan Portland, Oregon: Center Commons;Collins Circle; Gresham Central; The Merrick; Quatama Crossing.
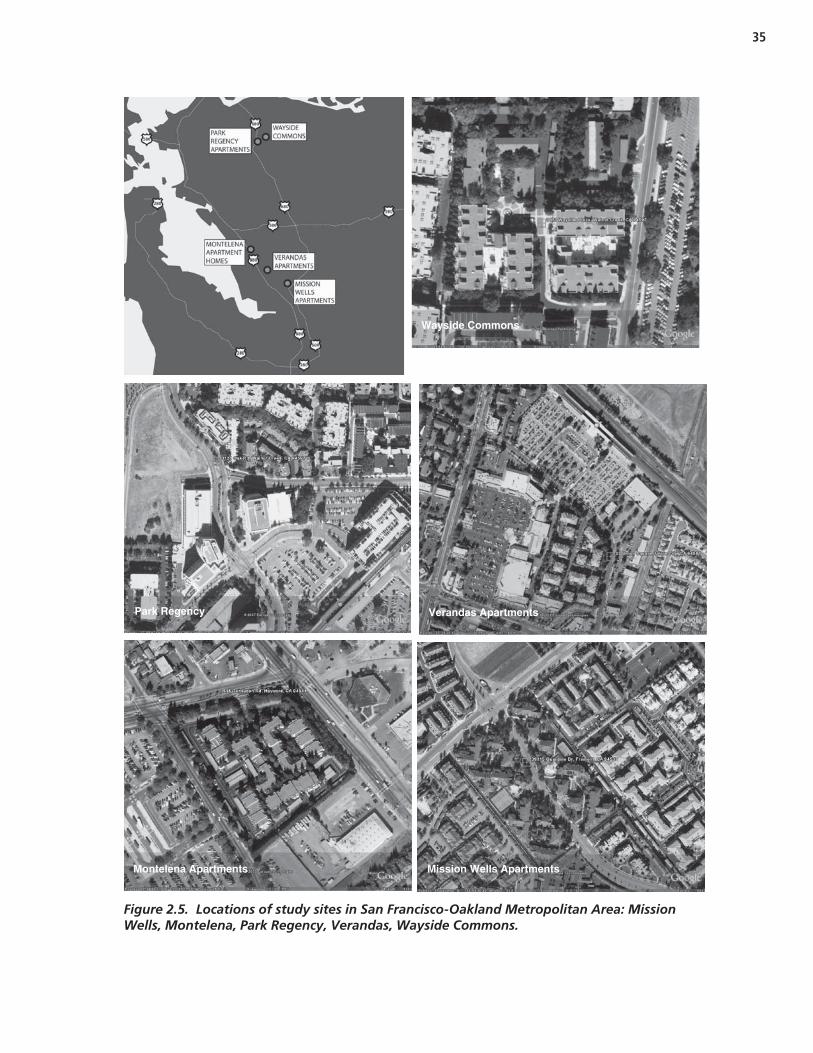
35
Montelena Apartments Mission Wells Apartments
Wayside Commons
Park Regency Verandas Apartments
Figure 2.5. Locations of study sites in San Francisco-Oakland Metropolitan Area: MissionWells, Montelena, Park Regency, Verandas, Wayside Commons.
consecutive weekdays, one-day estimates were computed bydividing the two 24-hour counts by two.) For all 17 TOD-housing projects combined, a weighted average trip generationrate was estimated. (The ITE manual defines weighted aver-age as the sum of trip ends for all projects divided by the sumof the independent variable, which in this case is number ofdwelling units.) The computed rates for TOD-housing proj-ects were compared to those found in the latest edition of theITE manual for the equivalent land use (i.e., apartments andcondominiums) (ITE, 2003). Comparisons are drawn usingthe ITE manual’s weighted averages as well as estimates de-rived from best-fitting regression equations. The degree towhich there are systematic differences in estimated and actualtrip generation and parking generation rates of TODs arehighlighted. The types of TOD projects for which there appearto be the largest discrepancies are identified.
Additionally, results were cross-classified among sampledprojects in terms of distance to CBD, distance to the neareststation, parking provisions, and other factors including thequality of walking environment (e.g., with or without adjoin-ing sidewalks). Multivariate regression equations that predictthe trip generation rates of TOD housing as a function ofthese and other variables also are estimated.
Lastly, the implications of research findings for various pub-lic policies and practices are discussed. To the degree that TOD-housing projects exhibit below-normal trip generation rates, astrong case can be made for using sliding-scale impact fees toevaluate new TOD proposals. This might, for instance, result inlowering the estimated trip generation rates within a quartermile of a station and with continuous sidewalk access and in amixed-use neighborhood by a fixed percent, such as 20%.
Comparison of Vehicle TripGeneration Rates
TOD-housing clearly reduces auto trips in the four urban-ized areas that were studied. Below, results for both 24-hourperiods as well as peak periods are summarized.
Average Weekday Trip Comparisons
Table 2.2 shows that in all cases, 24-hour weekday vehicletrip rates were considerably below the ITE weighted averagerate for similar uses. [The comparable ITE land use categoryfor 16 of the 17 projects is Apartments (ITE Code 220). Theaverage trip rate for apartments is 6.72 vehicle trips perdwelling unit on a weekday based on the experiences of 86 apartment projects across the United States (averaging 212dwelling units in size). The best-fitting regression equationfor apartments is:
T = 6.01(X) + 150.35 (R2 = 0.88)
where T = Vehicle Trip Ends and X = Number of DwellingUnits. For the Wayside Commons projects, the correspondingITE land-use category is Residential Condominium (ITECode 230). The average trip rate for condominiums is 5.68vehicle trips per dwelling unit on a weekday based on theexperiences of 54 owner-occupied condominium and town-house projects across the United States (averaging 183 dwellingunits in size). The best-fitting regression equation for condo-miniums is:
Ln(T) = 0.85(X) + 2.55 (R2 = 0.83)
where
T = Vehicle Trip Ends,X = Number of Dwelling Units, and
Ln = natural logarithm.
Taking the (unweighted) average across the 17 case-studyprojects, TOD-housing projects generated around 47% lessvehicle traffic than that predicted by the ITE manual (3.55trips per dwelling unit for TOD-housing versus 6.67 trips perdwelling unit by ITE estimates). This held true using both theweighted average ITE rate as well as the ITE rates predictedusing the best fitting regression equations. Results were quitesimilar in both cases.
The biggest trip reduction effects were found in theWashington, D.C. metropolitan area. Among the five mid-to-high rise apartment projects near Metrorail stations outsidethe District of Columbia, vehicle trip generation rates weremore than 60% below that predicted by the ITE manual. There,24-hour vehicle trip rates ranged from a high of 4.72 trip endsper dwelling unit at the more suburban Avalon project nearthe Grosvenor Metrorail Station (and outside the beltway) toa low of around one vehicle weekday for every two dwellingunits at the Meridian near Alexandria’s Braddock Station. Thecomparatively low vehicle trip generation rates for TOD-housing near Washington Metrorail stations matches up withrecent findings on high transit modal splits for a 2005 surveyof 18 residential sites (WMATA, 2006). For projects within aquarter mile of a Metrorail station (which matched thelocations of all five TOD housing projects studied in the Wash-ington metropolitan area), on average 49% of residents usedMetrorail for their commute or school trips. One of the proj-ects surveyed, the Avalon apartments at Grosvenor Station,also was surveyed in the 2005 study. The Avalon, which had thehighest trip generation rate among the five projects surveyed inthe Washington area, had an impressively high work-and-school trip transit modal split in the 2005 survey: 54%.
It is important to realize that high transit ridership levelsand significant trip reduction in metropolitan Washington istied to the region’s successful effort to create a network of
36
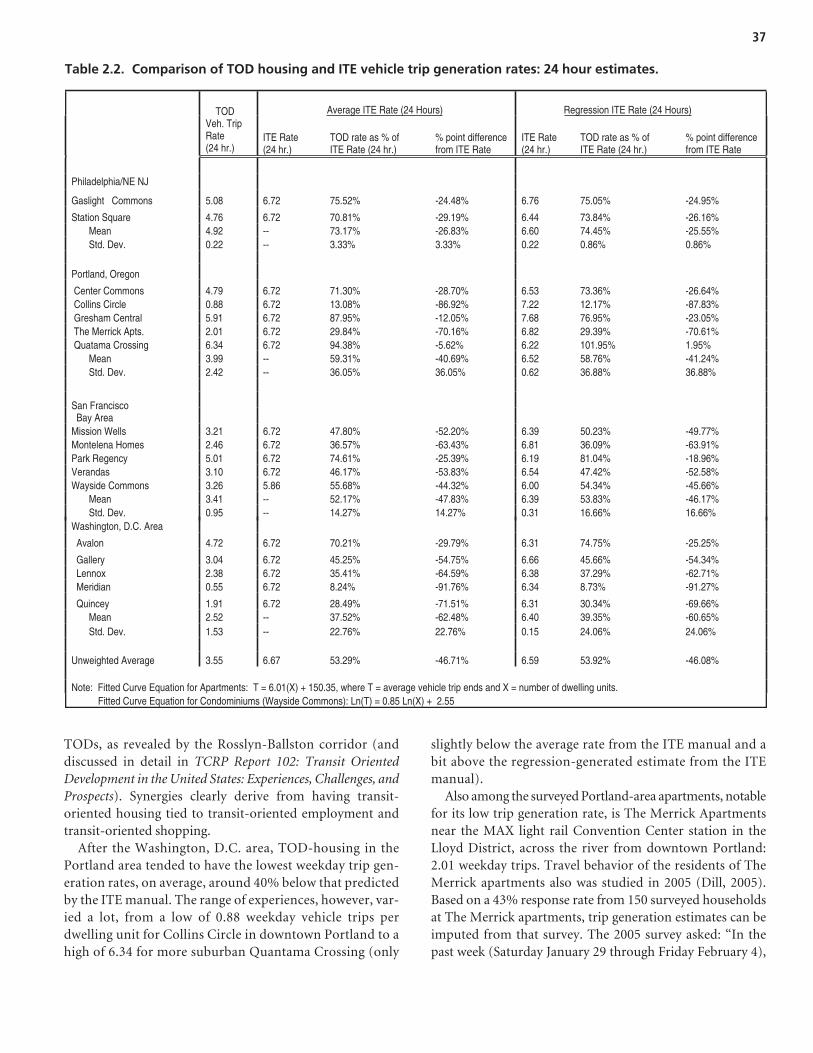
37
TODs, as revealed by the Rosslyn-Ballston corridor (anddiscussed in detail in TCRP Report 102: Transit OrientedDevelopment in the United States: Experiences, Challenges, andProspects). Synergies clearly derive from having transit-oriented housing tied to transit-oriented employment andtransit-oriented shopping.
After the Washington, D.C. area, TOD-housing in thePortland area tended to have the lowest weekday trip gen-eration rates, on average, around 40% below that predictedby the ITE manual. The range of experiences, however, var-ied a lot, from a low of 0.88 weekday vehicle trips perdwelling unit for Collins Circle in downtown Portland to ahigh of 6.34 for more suburban Quantama Crossing (only
slightly below the average rate from the ITE manual and abit above the regression-generated estimate from the ITEmanual).
Also among the surveyed Portland-area apartments, notablefor its low trip generation rate, is The Merrick Apartmentsnear the MAX light rail Convention Center station in theLloyd District, across the river from downtown Portland:2.01 weekday trips. Travel behavior of the residents of TheMerrick apartments also was studied in 2005 (Dill, 2005).Based on a 43% response rate from 150 surveyed householdsat The Merrick apartments, trip generation estimates can beimputed from that survey. The 2005 survey asked: “In thepast week (Saturday January 29 through Friday February 4),
Average ITE Rate (24 Hours) Regression ITE Rate (24 Hours) TOD Veh. Trip Rate (24 hr.)
ITE Rate (24 hr.)
TOD rate as % of ITE Rate (24 hr.)
% point difference from ITE Rate
ITE Rate (24 hr.)
TOD rate as % of ITE Rate (24 hr.)
% point difference from ITE Rate
Philadelphia/NE NJ
Gaslight Commons 5.08 6.72 75.52% -24.48% 6.76 75.05% -24.95%
Station Square 4.76 6.72 70.81% -29.19% 6.44 73.84% -26.16% Mean 4.92 -- 73.17% -26.83% 6.60 74.45% -25.55% Std. Dev. 0.22 -- 3.33% 3.33% 0.22 0.86% 0.86%
Portland, Oregon
Center Commons 4.79 6.72 71.30% -28.70% 6.53 73.36% -26.64% Collins Circle 0.88 6.72 13.08% -86.92% 7.22 12.17% -87.83% Gresham Central 5.91 6.72 87.95% -12.05% 7.68 76.95% -23.05% The Merrick Apts. 2.01 6.72 29.84% -70.16% 6.82 29.39% -70.61% Quatama Crossing 6.34 6.72 94.38% -5.62% 6.22 101.95% 1.95% Mean 3.99 -- 59.31% -40.69% 6.52 58.76% -41.24% Std. Dev. 2.42 -- 36.05% 36.05% 0.62 36.88% 36.88%
San Francisco Bay Area Mission Wells 3.21 6.72 47.80% -52.20% 6.39 50.23% -49.77% Montelena Homes 2.46 6.72 36.57% -63.43% 6.81 36.09% -63.91% Park Regency 5.01 6.72 74.61% -25.39% 6.19 81.04% -18.96% Verandas 3.10 6.72 46.17% -53.83% 6.54 47.42% -52.58% Wayside Commons 3.26 5.86 55.68% -44.32% 6.00 54.34% -45.66% Mean 3.41 -- 52.17% -47.83% 6.39 53.83% -46.17% Std. Dev. 0.95 -- 14.27% 14.27% 0.31 16.66% 16.66% Washington, D.C. Area
Avalon 4.72 6.72 70.21% -29.79% 6.31 74.75% -25.25%
Gallery 3.04 6.72 45.25% -54.75% 6.66 45.66% -54.34% Lennox 2.38 6.72 35.41% -64.59% 6.38 37.29% -62.71% Meridian 0.55 6.72 8.24% -91.76% 6.34 8.73% -91.27%
Quincey 1.91 6.72 28.49% -71.51% 6.31 30.34% -69.66% Mean 2.52 -- 37.52% -62.48% 6.40 39.35% -60.65% Std. Dev. 1.53 -- 22.76% 22.76% 0.15 24.06% 24.06% Unweighted Average 3.55 6.67 53.29% -46.71% 6.59 53.92% -46.08%
Note: Fitted Curve Equation for Apartments: T = 6.01(X) + 150.35, where T = average vehicle trip ends and X = number of dwelling units. Fitted Curve Equation for Condominiums (Wayside Commons): Ln(T) = 0.85 Ln(X) + 2.55
Table 2.2. Comparison of TOD housing and ITE vehicle trip generation rates: 24 hour estimates.
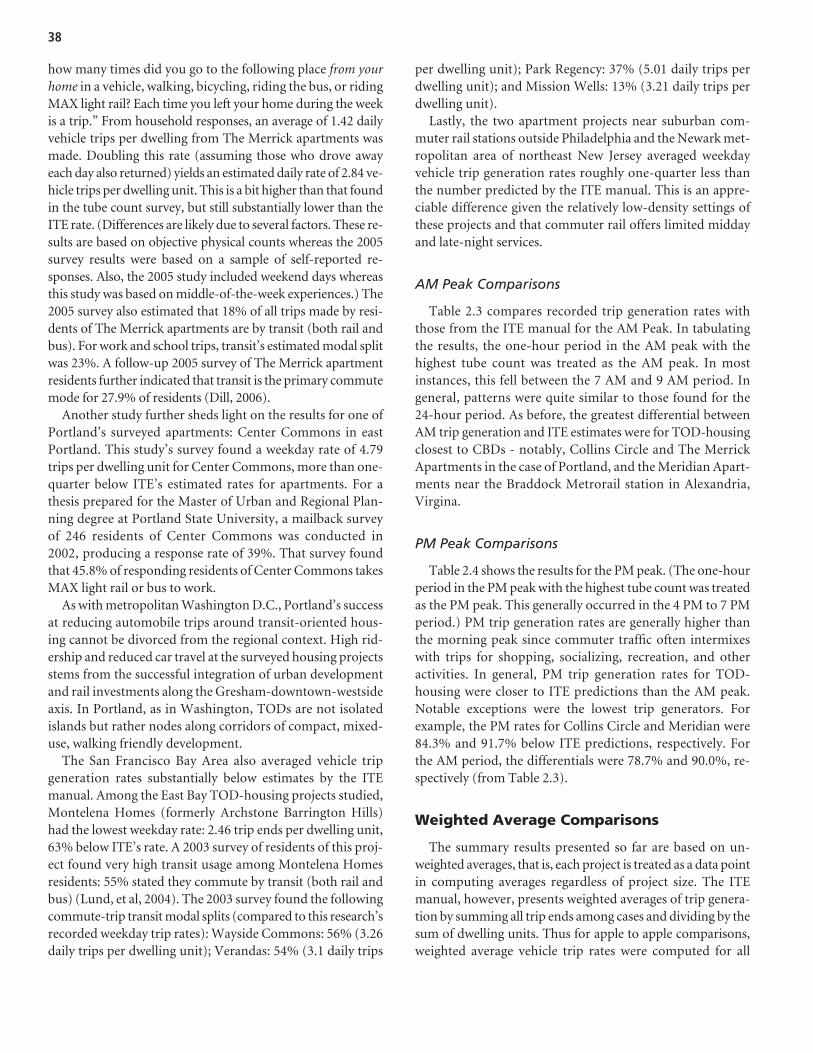
how many times did you go to the following place from yourhome in a vehicle, walking, bicycling, riding the bus, or ridingMAX light rail? Each time you left your home during the weekis a trip.” From household responses, an average of 1.42 dailyvehicle trips per dwelling from The Merrick apartments wasmade. Doubling this rate (assuming those who drove awayeach day also returned) yields an estimated daily rate of 2.84 ve-hicle trips per dwelling unit. This is a bit higher than that foundin the tube count survey, but still substantially lower than theITE rate. (Differences are likely due to several factors. These re-sults are based on objective physical counts whereas the 2005survey results were based on a sample of self-reported re-sponses. Also, the 2005 study included weekend days whereasthis study was based on middle-of-the-week experiences.) The2005 survey also estimated that 18% of all trips made by resi-dents of The Merrick apartments are by transit (both rail andbus). For work and school trips, transit’s estimated modal splitwas 23%. A follow-up 2005 survey of The Merrick apartmentresidents further indicated that transit is the primary commutemode for 27.9% of residents (Dill, 2006).
Another study further sheds light on the results for one ofPortland’s surveyed apartments: Center Commons in eastPortland. This study’s survey found a weekday rate of 4.79trips per dwelling unit for Center Commons, more than one-quarter below ITE’s estimated rates for apartments. For athesis prepared for the Master of Urban and Regional Plan-ning degree at Portland State University, a mailback surveyof 246 residents of Center Commons was conducted in2002, producing a response rate of 39%. That survey foundthat 45.8% of responding residents of Center Commons takesMAX light rail or bus to work.
As with metropolitan Washington D.C., Portland’s successat reducing automobile trips around transit-oriented hous-ing cannot be divorced from the regional context. High rid-ership and reduced car travel at the surveyed housing projectsstems from the successful integration of urban developmentand rail investments along the Gresham-downtown-westsideaxis. In Portland, as in Washington, TODs are not isolatedislands but rather nodes along corridors of compact, mixed-use, walking friendly development.
The San Francisco Bay Area also averaged vehicle tripgeneration rates substantially below estimates by the ITEmanual. Among the East Bay TOD-housing projects studied,Montelena Homes (formerly Archstone Barrington Hills)had the lowest weekday rate: 2.46 trip ends per dwelling unit,63% below ITE’s rate. A 2003 survey of residents of this proj-ect found very high transit usage among Montelena Homesresidents: 55% stated they commute by transit (both rail andbus) (Lund, et al, 2004). The 2003 survey found the followingcommute-trip transit modal splits (compared to this research’srecorded weekday trip rates): Wayside Commons: 56% (3.26daily trips per dwelling unit); Verandas: 54% (3.1 daily trips
per dwelling unit); Park Regency: 37% (5.01 daily trips perdwelling unit); and Mission Wells: 13% (3.21 daily trips perdwelling unit).
Lastly, the two apartment projects near suburban com-muter rail stations outside Philadelphia and the Newark met-ropolitan area of northeast New Jersey averaged weekdayvehicle trip generation rates roughly one-quarter less thanthe number predicted by the ITE manual. This is an appre-ciable difference given the relatively low-density settings ofthese projects and that commuter rail offers limited middayand late-night services.
AM Peak Comparisons
Table 2.3 compares recorded trip generation rates withthose from the ITE manual for the AM Peak. In tabulatingthe results, the one-hour period in the AM peak with thehighest tube count was treated as the AM peak. In mostinstances, this fell between the 7 AM and 9 AM period. Ingeneral, patterns were quite similar to those found for the24-hour period. As before, the greatest differential betweenAM trip generation and ITE estimates were for TOD-housingclosest to CBDs - notably, Collins Circle and The MerrickApartments in the case of Portland, and the Meridian Apart-ments near the Braddock Metrorail station in Alexandria,Virgina.
PM Peak Comparisons
Table 2.4 shows the results for the PM peak. (The one-hourperiod in the PM peak with the highest tube count was treatedas the PM peak. This generally occurred in the 4 PM to 7 PMperiod.) PM trip generation rates are generally higher thanthe morning peak since commuter traffic often intermixeswith trips for shopping, socializing, recreation, and otheractivities. In general, PM trip generation rates for TOD-housing were closer to ITE predictions than the AM peak.Notable exceptions were the lowest trip generators. Forexample, the PM rates for Collins Circle and Meridian were84.3% and 91.7% below ITE predictions, respectively. Forthe AM period, the differentials were 78.7% and 90.0%, re-spectively (from Table 2.3).
Weighted Average Comparisons
The summary results presented so far are based on un-weighted averages, that is, each project is treated as a data pointin computing averages regardless of project size. The ITEmanual, however, presents weighted averages of trip genera-tion by summing all trip ends among cases and dividing by thesum of dwelling units. Thus for apple to apple comparisons,weighted average vehicle trip rates were computed for all
38
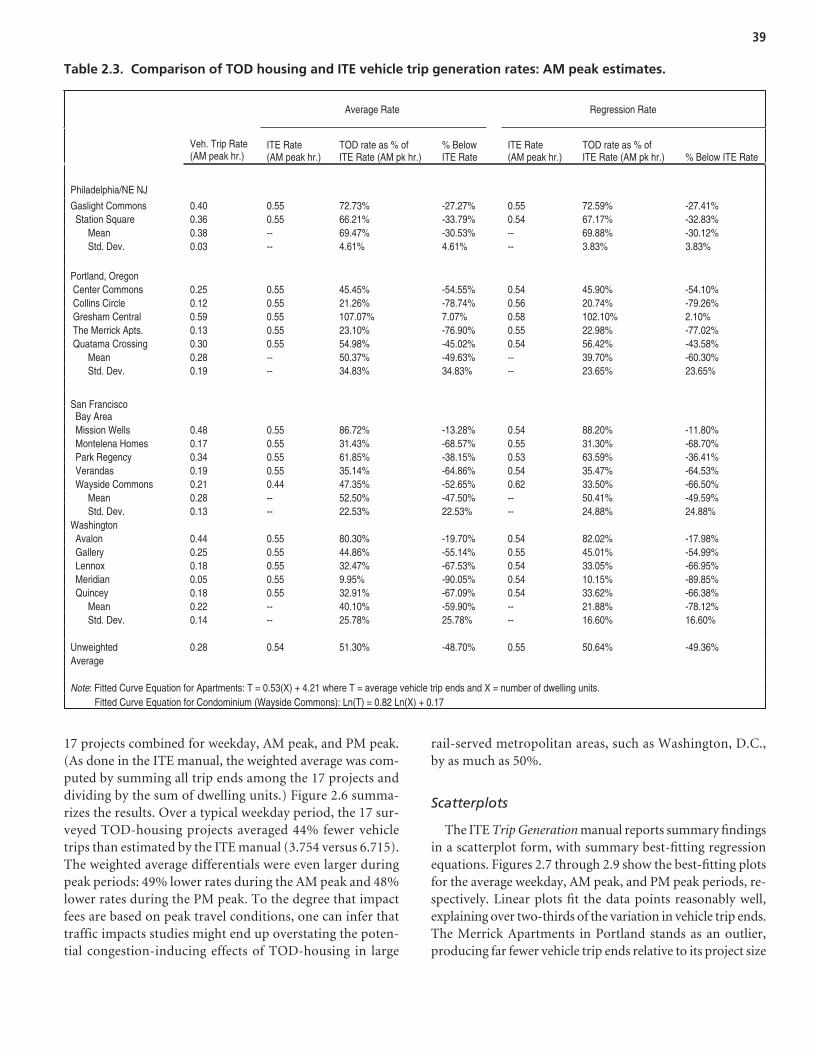
39
17 projects combined for weekday, AM peak, and PM peak.(As done in the ITE manual, the weighted average was com-puted by summing all trip ends among the 17 projects anddividing by the sum of dwelling units.) Figure 2.6 summa-rizes the results. Over a typical weekday period, the 17 sur-veyed TOD-housing projects averaged 44% fewer vehicletrips than estimated by the ITE manual (3.754 versus 6.715).The weighted average differentials were even larger duringpeak periods: 49% lower rates during the AM peak and 48%lower rates during the PM peak. To the degree that impactfees are based on peak travel conditions, one can infer thattraffic impacts studies might end up overstating the poten-tial congestion-inducing effects of TOD-housing in large
rail-served metropolitan areas, such as Washington, D.C.,by as much as 50%.
Scatterplots
The ITE Trip Generation manual reports summary findingsin a scatterplot form, with summary best-fitting regressionequations. Figures 2.7 through 2.9 show the best-fitting plotsfor the average weekday, AM peak, and PM peak periods, re-spectively. Linear plots fit the data points reasonably well,explaining over two-thirds of the variation in vehicle trip ends.The Merrick Apartments in Portland stands as an outlier,producing far fewer vehicle trip ends relative to its project size
Average Rate Regression Rate
Veh. Trip Rate (AM peak hr.)
ITE Rate (AM peak hr.)
TOD rate as % of ITE Rate (AM pk hr.)
% Below ITE Rate
ITE Rate (AM peak hr.)
TOD rate as % of ITE Rate (AM pk hr.) % Below ITE Rate
Philadelphia/NE NJ Gaslight Commons 0.40 0.55 72.73% -27.27% 0.55 72.59% -27.41% Station Square 0.36 0.55 66.21% -33.79% 0.54 67.17% -32.83% Mean 0.38 -- 69.47% -30.53% -- 69.88% -30.12% Std. Dev. 0.03 -- 4.61% 4.61% -- 3.83% 3.83%
Portland, Oregon Center Commons 0.25 0.55 45.45% -54.55% 0.54 45.90% -54.10% Collins Circle 0.12 0.55 21.26% -78.74% 0.56 20.74% -79.26% Gresham Central 0.59 0.55 107.07% 7.07% 0.58 102.10% 2.10% The Merrick Apts. 0.13 0.55 23.10% -76.90% 0.55 22.98% -77.02% Quatama Crossing 0.30 0.55 54.98% -45.02% 0.54 56.42% -43.58% Mean 0.28 -- 50.37% -49.63% -- 39.70% -60.30% Std. Dev. 0.19 -- 34.83% 34.83% -- 23.65% 23.65%
San Francisco Bay Area Mission Wells 0.48 0.55 86.72% -13.28% 0.54 88.20% -11.80% Montelena Homes 0.17 0.55 31.43% -68.57% 0.55 31.30% -68.70% Park Regency 0.34 0.55 61.85% -38.15% 0.53 63.59% -36.41% Verandas 0.19 0.55 35.14% -64.86% 0.54 35.47% -64.53% Wayside Commons 0.21 0.44 47.35% -52.65% 0.62 33.50% -66.50% Mean 0.28 -- 52.50% -47.50% -- 50.41% -49.59% Std. Dev. 0.13 -- 22.53% 22.53% -- 24.88% 24.88% Washington Avalon 0.44 0.55 80.30% -19.70% 0.54 82.02% -17.98% Gallery 0.25 0.55 44.86% -55.14% 0.55 45.01% -54.99% Lennox 0.18 0.55 32.47% -67.53% 0.54 33.05% -66.95% Meridian 0.05 0.55 9.95% -90.05% 0.54 10.15% -89.85% Quincey 0.18 0.55 32.91% -67.09% 0.54 33.62% -66.38% Mean 0.22 -- 40.10% -59.90% -- 21.88% -78.12% Std. Dev. 0.14 -- 25.78% 25.78% -- 16.60% 16.60% Unweighted 0.28 0.54 51.30% -48.70% 0.55 50.64% -49.36% Average Note: Fitted Curve Equation for Apartments: T = 0.53(X) + 4.21 where T = average vehicle trip ends and X = number of dwelling units. Fitted Curve Equation for Condominium (Wayside Commons): Ln(T) = 0.82 Ln(X) + 0.17
Table 2.3. Comparison of TOD housing and ITE vehicle trip generation rates: AM peak estimates.
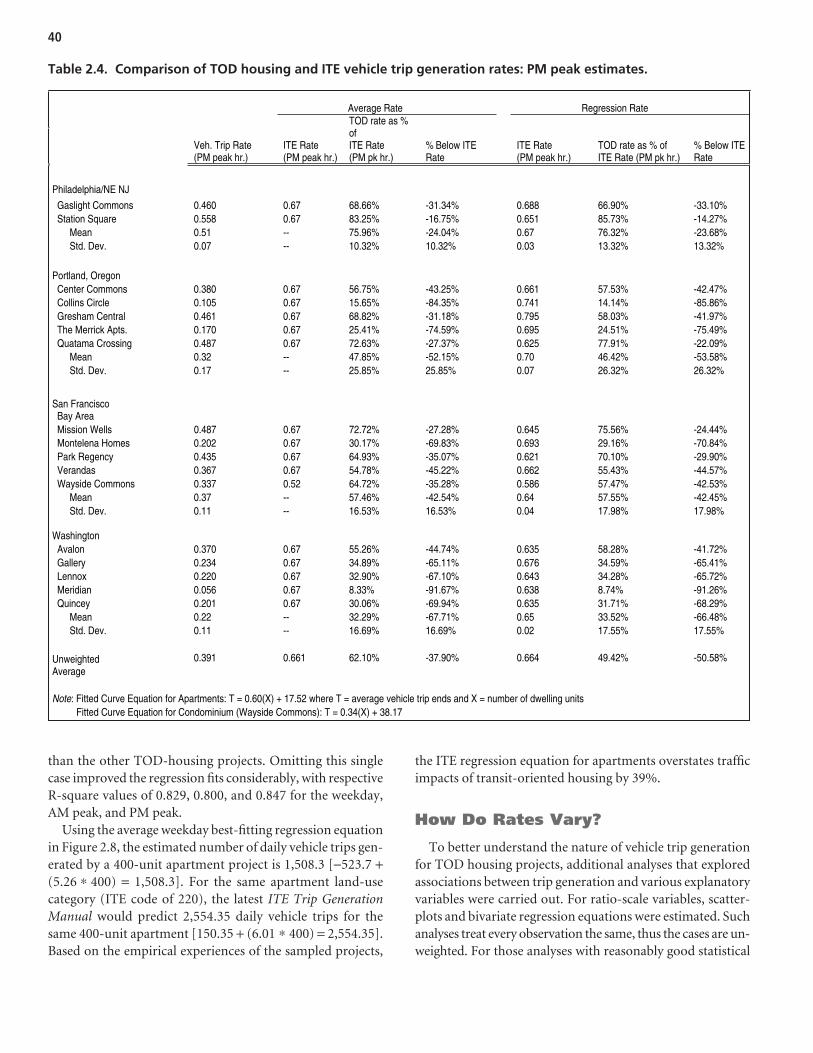
40
than the other TOD-housing projects. Omitting this singlecase improved the regression fits considerably, with respectiveR-square values of 0.829, 0.800, and 0.847 for the weekday,AM peak, and PM peak.
Using the average weekday best-fitting regression equationin Figure 2.8, the estimated number of daily vehicle trips gen-erated by a 400-unit apartment project is 1,508.3 [−523.7 +(5.26 ∗ 400) = 1,508.3]. For the same apartment land-usecategory (ITE code of 220), the latest ITE Trip GenerationManual would predict 2,554.35 daily vehicle trips for thesame 400-unit apartment [150.35 + (6.01 ∗ 400) = 2,554.35].Based on the empirical experiences of the sampled projects,
the ITE regression equation for apartments overstates trafficimpacts of transit-oriented housing by 39%.
How Do Rates Vary?
To better understand the nature of vehicle trip generationfor TOD housing projects, additional analyses that exploredassociations between trip generation and various explanatoryvariables were carried out. For ratio-scale variables, scatter-plots and bivariate regression equations were estimated. Suchanalyses treat every observation the same, thus the cases are un-weighted. For those analyses with reasonably good statistical
Average Rate Regression Rate
Veh. Trip Rate(PM peak hr.)
ITE Rate(PM peak hr.)
TOD rate as % ofITE Rate(PM pk hr.)
% Below ITE Rate
ITE Rate(PM peak hr.)
TOD rate as % of ITE Rate (PM pk hr.)
% Below ITE Rate
Philadelphia/NE NJ Gaslight Commons 0.460 0.67 68.66% -31.34% 0.688 66.90% -33.10% Station Square 0.558 0.67 83.25% -16.75% 0.651 85.73% -14.27% Mean 0.51 -- 75.96% -24.04% 0.67 76.32% -23.68% Std. Dev. 0.07 -- 10.32% 10.32% 0.03 13.32% 13.32%
Portland, Oregon Center Commons 0.380 0.67 56.75% -43.25% 0.661 57.53% -42.47% Collins Circle 0.105 0.67 15.65% -84.35% 0.741 14.14% -85.86% Gresham Central 0.461 0.67 68.82% -31.18% 0.795 58.03% -41.97% The Merrick Apts. 0.170 0.67 25.41% -74.59% 0.695 24.51% -75.49% Quatama Crossing 0.487 0.67 72.63% -27.37% 0.625 77.91% -22.09% Mean 0.32 -- 47.85% -52.15% 0.70 46.42% -53.58% Std. Dev. 0.17 -- 25.85% 25.85% 0.07 26.32% 26.32%
San Francisco Bay Area Mission Wells 0.487 0.67 72.72% -27.28% 0.645 75.56% -24.44% Montelena Homes 0.202 0.67 30.17% -69.83% 0.693 29.16% -70.84% Park Regency 0.435 0.67 64.93% -35.07% 0.621 70.10% -29.90% Verandas 0.367 0.67 54.78% -45.22% 0.662 55.43% -44.57% Wayside Commons 0.337 0.52 64.72% -35.28% 0.586 57.47% -42.53% Mean 0.37 -- 57.46% -42.54% 0.64 57.55% -42.45% Std. Dev. 0.11 -- 16.53% 16.53% 0.04 17.98% 17.98%
Washington Avalon 0.370 0.67 55.26% -44.74% 0.635 58.28% -41.72% Gallery 0.234 0.67 34.89% -65.11% 0.676 34.59% -65.41% Lennox 0.220 0.67 32.90% -67.10% 0.643 34.28% -65.72% Meridian 0.056 0.67 8.33% -91.67% 0.638 8.74% -91.26% Quincey 0.201 0.67 30.06% -69.94% 0.635 31.71% -68.29% Mean 0.22 -- 32.29% -67.71% 0.65 33.52% -66.48% Std. Dev. 0.11 -- 16.69% 16.69% 0.02 17.55% 17.55%
0.391 0.661 62.10% -37.90% 0.664 49.42% -50.58% Unweighted
Average Note: Fitted Curve Equation for Apartments: T = 0.60(X) + 17.52 where T = average vehicle trip ends and X = number of dwelling units
Fitted Curve Equation for Condominium (Wayside Commons): T = 0.34(X) + 38.17
Table 2.4. Comparison of TOD housing and ITE vehicle trip generation rates: PM peak estimates.
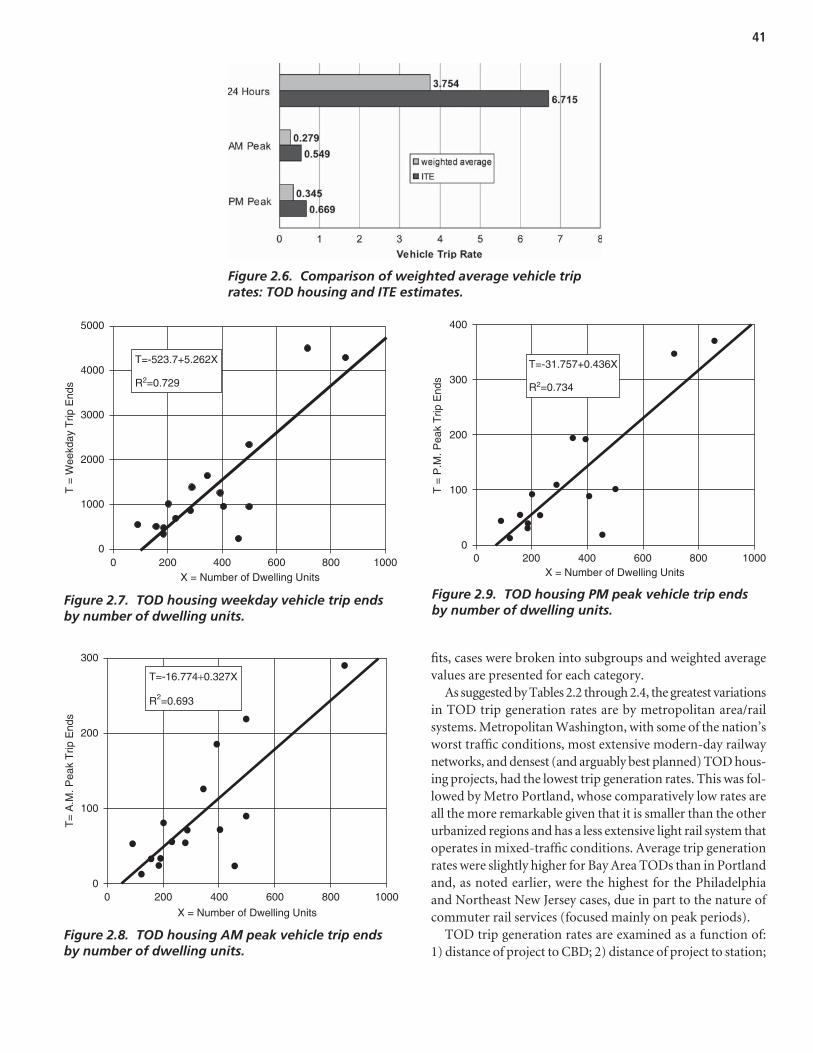
41
fits, cases were broken into subgroups and weighted averagevalues are presented for each category.
As suggested by Tables 2.2 through 2.4, the greatest variationsin TOD trip generation rates are by metropolitan area/railsystems. Metropolitan Washington, with some of the nation’sworst traffic conditions, most extensive modern-day railwaynetworks, and densest (and arguably best planned) TOD hous-ing projects, had the lowest trip generation rates. This was fol-lowed by Metro Portland, whose comparatively low rates areall the more remarkable given that it is smaller than the otherurbanized regions and has a less extensive light rail system thatoperates in mixed-traffic conditions. Average trip generationrates were slightly higher for Bay Area TODs than in Portlandand, as noted earlier, were the highest for the Philadelphiaand Northeast New Jersey cases, due in part to the nature ofcommuter rail services (focused mainly on peak periods).
TOD trip generation rates are examined as a function of:1) distance of project to CBD; 2) distance of project to station;
Figure 2.6. Comparison of weighted average vehicle triprates: TOD housing and ITE estimates.
5000
4000
3000
2000
1000
00 200 400 600
X = Number of Dwelling Units
T =
Wee
kday
Trip
End
s
800 1000
T=-523.7+5.262X
R2=0.729
Figure 2.7. TOD housing weekday vehicle trip endsby number of dwelling units.
X = Number of Dwelling Units
T=
A.M
. Pea
k T
rip E
nds
00
100
200
300
200 400 600 800 1000
T=-16.774+0.327X
R2=0.693
Figure 2.8. TOD housing AM peak vehicle trip endsby number of dwelling units.
400
300
200
100
00 200 400 600
X = Number of Dwelling Units
T =
P.M
. Pea
k T
rip E
nds
800 1000
T=-31.757+0.436X
R2=0.734
Figure 2.9. TOD housing PM peak vehicle trip endsby number of dwelling units.
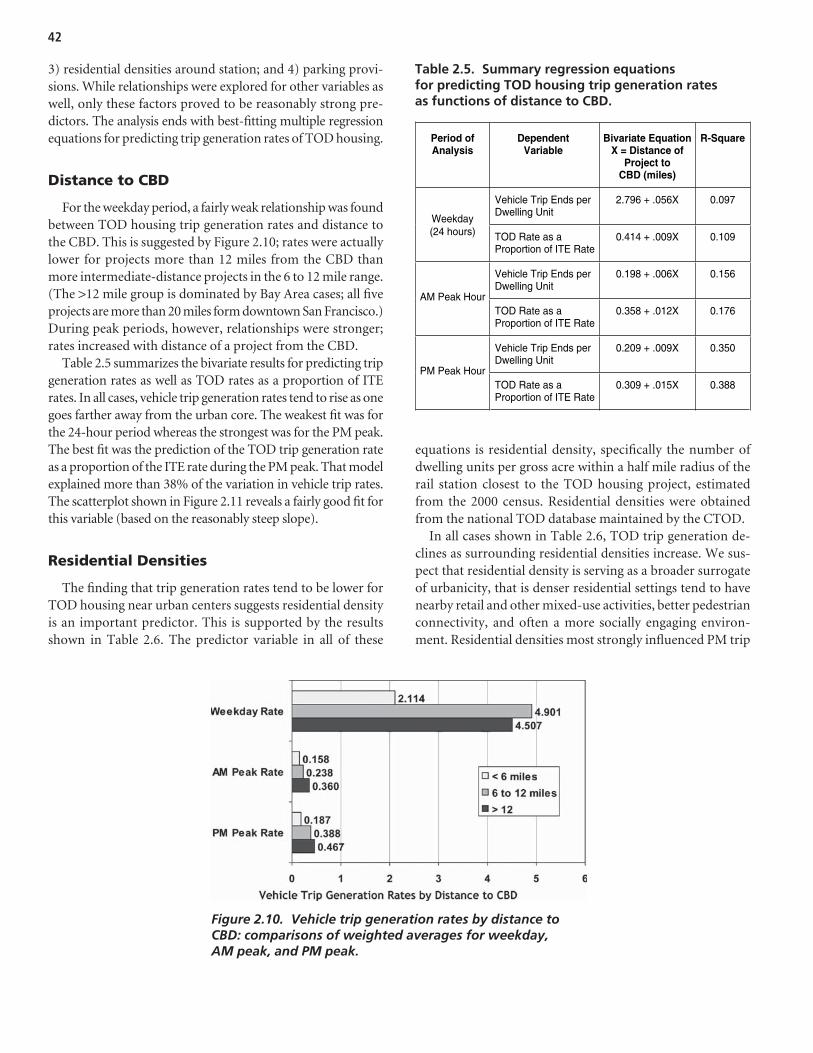
42
3) residential densities around station; and 4) parking provi-sions. While relationships were explored for other variables aswell, only these factors proved to be reasonably strong pre-dictors. The analysis ends with best-fitting multiple regressionequations for predicting trip generation rates of TOD housing.
Distance to CBD
For the weekday period, a fairly weak relationship was foundbetween TOD housing trip generation rates and distance tothe CBD. This is suggested by Figure 2.10; rates were actuallylower for projects more than 12 miles from the CBD thanmore intermediate-distance projects in the 6 to 12 mile range.(The >12 mile group is dominated by Bay Area cases; all fiveprojects are more than 20 miles form downtown San Francisco.)During peak periods, however, relationships were stronger;rates increased with distance of a project from the CBD.
Table 2.5 summarizes the bivariate results for predicting tripgeneration rates as well as TOD rates as a proportion of ITErates. In all cases, vehicle trip generation rates tend to rise as onegoes farther away from the urban core. The weakest fit was forthe 24-hour period whereas the strongest was for the PM peak.The best fit was the prediction of the TOD trip generation rateas a proportion of the ITE rate during the PM peak. That modelexplained more than 38% of the variation in vehicle trip rates.The scatterplot shown in Figure 2.11 reveals a fairly good fit forthis variable (based on the reasonably steep slope).
Residential Densities
The finding that trip generation rates tend to be lower forTOD housing near urban centers suggests residential densityis an important predictor. This is supported by the resultsshown in Table 2.6. The predictor variable in all of these
equations is residential density, specifically the number ofdwelling units per gross acre within a half mile radius of therail station closest to the TOD housing project, estimatedfrom the 2000 census. Residential densities were obtainedfrom the national TOD database maintained by the CTOD.
In all cases shown in Table 2.6, TOD trip generation de-clines as surrounding residential densities increase. We sus-pect that residential density is serving as a broader surrogateof urbanicity, that is denser residential settings tend to havenearby retail and other mixed-use activities, better pedestrianconnectivity, and often a more socially engaging environ-ment. Residential densities most strongly influenced PM trip
Figure 2.10. Vehicle trip generation rates by distance toCBD: comparisons of weighted averages for weekday,AM peak, and PM peak.
Period ofAnalysis
DependentVariable X = Distance of
Project to
Bivariate Equation
CBD (miles)
R-Square
Vehicle Trip Ends per Dwelling Unit
2.796 + .056X 0.097
Weekday(24 hours) TOD Rate as a
Proportion of ITE Rate 0.414 + .009X 0.109
Vehicle Trip Ends per Dwelling Unit
0.198 + .006X 0.156
AM Peak Hour
TOD Rate as a Proportion of ITE Rate
0.358 + .012X 0.176
Vehicle Trip Ends per Dwelling Unit
0.209 + .009X 0.350
PM Peak Hour
TOD Rate as a Proportion of ITE Rate
0.309 + .015X 0.388
Table 2.5. Summary regression equationsfor predicting TOD housing trip generation ratesas functions of distance to CBD.
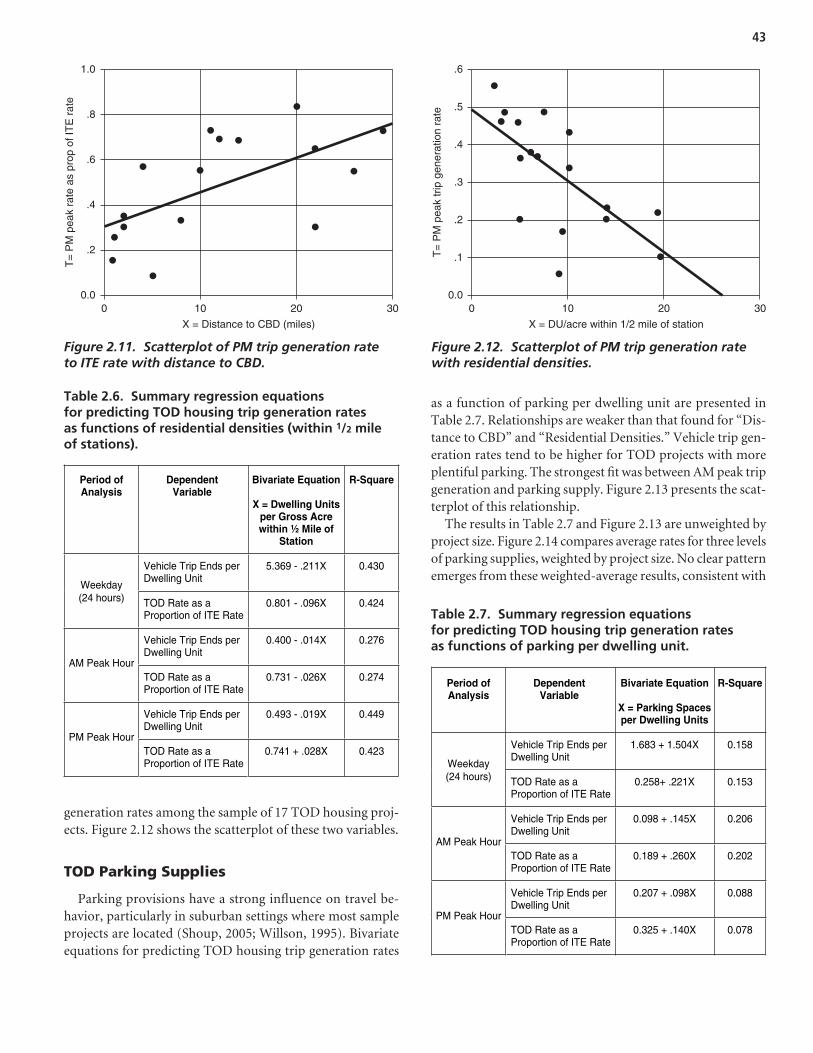
43
generation rates among the sample of 17 TOD housing proj-ects. Figure 2.12 shows the scatterplot of these two variables.
TOD Parking Supplies
Parking provisions have a strong influence on travel be-havior, particularly in suburban settings where most sampleprojects are located (Shoup, 2005; Willson, 1995). Bivariateequations for predicting TOD housing trip generation rates
as a function of parking per dwelling unit are presented inTable 2.7. Relationships are weaker than that found for “Dis-tance to CBD” and “Residential Densities.” Vehicle trip gen-eration rates tend to be higher for TOD projects with moreplentiful parking. The strongest fit was between AM peak tripgeneration and parking supply. Figure 2.13 presents the scat-terplot of this relationship.
The results in Table 2.7 and Figure 2.13 are unweighted byproject size. Figure 2.14 compares average rates for three levelsof parking supplies, weighted by project size. No clear patternemerges from these weighted-average results, consistent with
Period ofAnalysis
DependentVariable
per Gross Acrewithin ½ Mile of
X = Dwelling Units
Bivariate Equation
Station
R-Square
Vehicle Trip Ends per Dwelling Unit
5.369 - .211X 0.430
Weekday(24 hours) TOD Rate as a
Proportion of ITE Rate 0.801 - .096X 0.424
Vehicle Trip Ends per Dwelling Unit
0.400 - .014X 0.276
AM Peak Hour
TOD Rate as a Proportion of ITE Rate
0.731 - .026X 0.274
Vehicle Trip Ends per Dwelling Unit
0.493 - .019X 0.449
PM Peak Hour
TOD Rate as a Proportion of ITE Rate
0.741 + .028X 0.423
Table 2.6. Summary regression equationsfor predicting TOD housing trip generation ratesas functions of residential densities (within 1/2 mileof stations).
Period ofAnalysis
DependentVariable
X = Parking Spaces
Bivariate Equation
per Dwelling Units
R-Square
Vehicle Trip Ends per Dwelling Unit
1.683 + 1.504X 0.158
Weekday(24 hours) TOD Rate as a
Proportion of ITE Rate 0.258+ .221X 0.153
Vehicle Trip Ends per Dwelling Unit
0.098 + .145X 0.206
AM Peak HourTOD Rate as a Proportion of ITE Rate
0.189 + .260X 0.202
Vehicle Trip Ends per Dwelling Unit
0.207 + .098X 0.088
PM Peak HourTOD Rate as a Proportion of ITE Rate
0.325 + .140X 0.078
Table 2.7. Summary regression equationsfor predicting TOD housing trip generation ratesas functions of parking per dwelling unit.
X = DU/acre within 1/2 mile of station
T=
PM
pea
k tr
ip g
ener
atio
n ra
te
00.0
.1
.2
.3
.4
.6
.5
10 20 30
Figure 2.12. Scatterplot of PM trip generation ratewith residential densities.
X = Distance to CBD (miles)
T=
PM
pea
k ra
te a
s pr
op o
f IT
E r
ate
00.0
.2
.4
.6
.8
1.0
10 20 30
Figure 2.11. Scatterplot of PM trip generation rateto ITE rate with distance to CBD.
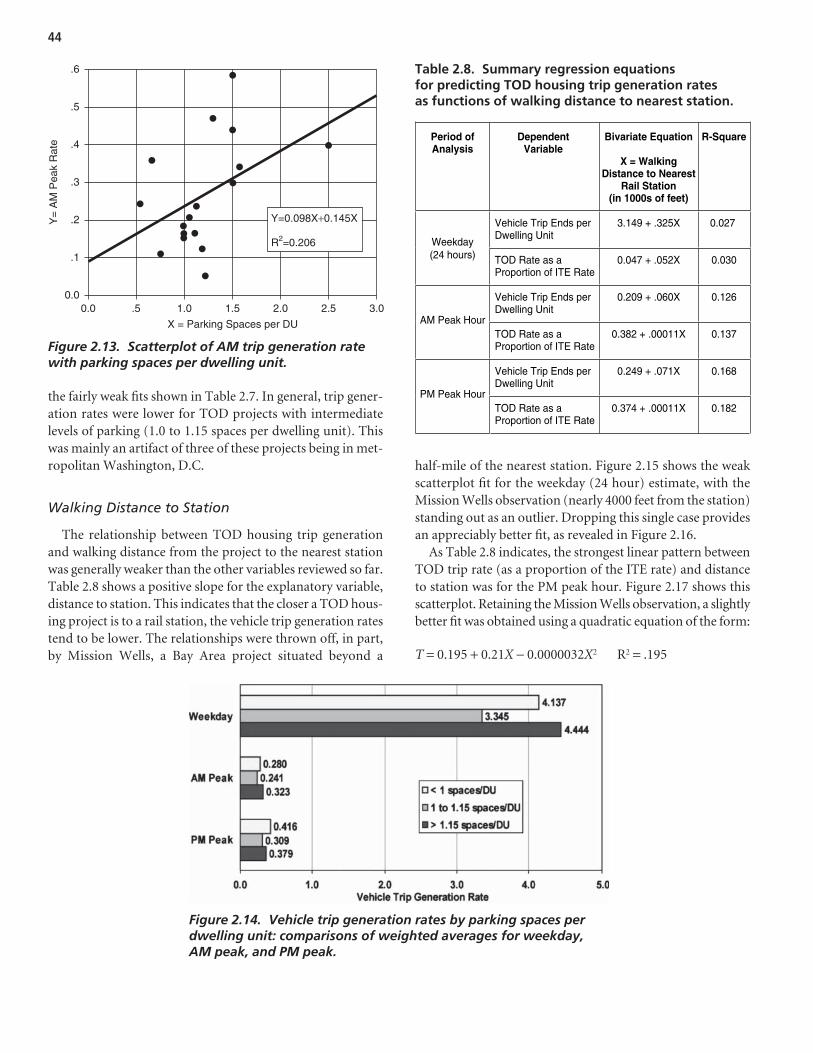
44
the fairly weak fits shown in Table 2.7. In general, trip gener-ation rates were lower for TOD projects with intermediatelevels of parking (1.0 to 1.15 spaces per dwelling unit). Thiswas mainly an artifact of three of these projects being in met-ropolitan Washington, D.C.
Walking Distance to Station
The relationship between TOD housing trip generationand walking distance from the project to the nearest stationwas generally weaker than the other variables reviewed so far.Table 2.8 shows a positive slope for the explanatory variable,distance to station. This indicates that the closer a TOD hous-ing project is to a rail station, the vehicle trip generation ratestend to be lower. The relationships were thrown off, in part,by Mission Wells, a Bay Area project situated beyond a
half-mile of the nearest station. Figure 2.15 shows the weakscatterplot fit for the weekday (24 hour) estimate, with theMission Wells observation (nearly 4000 feet from the station)standing out as an outlier. Dropping this single case providesan appreciably better fit, as revealed in Figure 2.16.
As Table 2.8 indicates, the strongest linear pattern betweenTOD trip rate (as a proportion of the ITE rate) and distanceto station was for the PM peak hour. Figure 2.17 shows thisscatterplot. Retaining the Mission Wells observation, a slightlybetter fit was obtained using a quadratic equation of the form:
T = 0.195 + 0.21X − 0.0000032X2 R2 = .195
X = Parking Spaces per DU
Y=
AM
Pea
k R
ate
0.0 .50.0
.1
.2
.3
.4
.6
.5
1.0 2.01.5 2.5 3.0
Y=0.098X+0.145X
R2=0.206
Figure 2.13. Scatterplot of AM trip generation ratewith parking spaces per dwelling unit.
Figure 2.14. Vehicle trip generation rates by parking spaces perdwelling unit: comparisons of weighted averages for weekday,AM peak, and PM peak.
Period ofAnalysis
DependentVariable
Distance to NearestRail Station
X = Walking
Bivariate Equation
(in 1000s of feet)
R-Square
Vehicle Trip Ends per Dwelling Unit
3.149 + .325X 0.027
Weekday(24 hours) TOD Rate as a
Proportion of ITE Rate 0.047 + .052X 0.030
Vehicle Trip Ends per Dwelling Unit
0.209 + .060X 0.126
AM Peak Hour
TOD Rate as a Proportion of ITE Rate
0.382 + .00011X 0.137
Vehicle Trip Ends per Dwelling Unit
0.249 + .071X 0.168
PM Peak Hour
TOD Rate as a Proportion of ITE Rate
0.374 + .00011X 0.182
Table 2.8. Summary regression equationsfor predicting TOD housing trip generation ratesas functions of walking distance to nearest station.
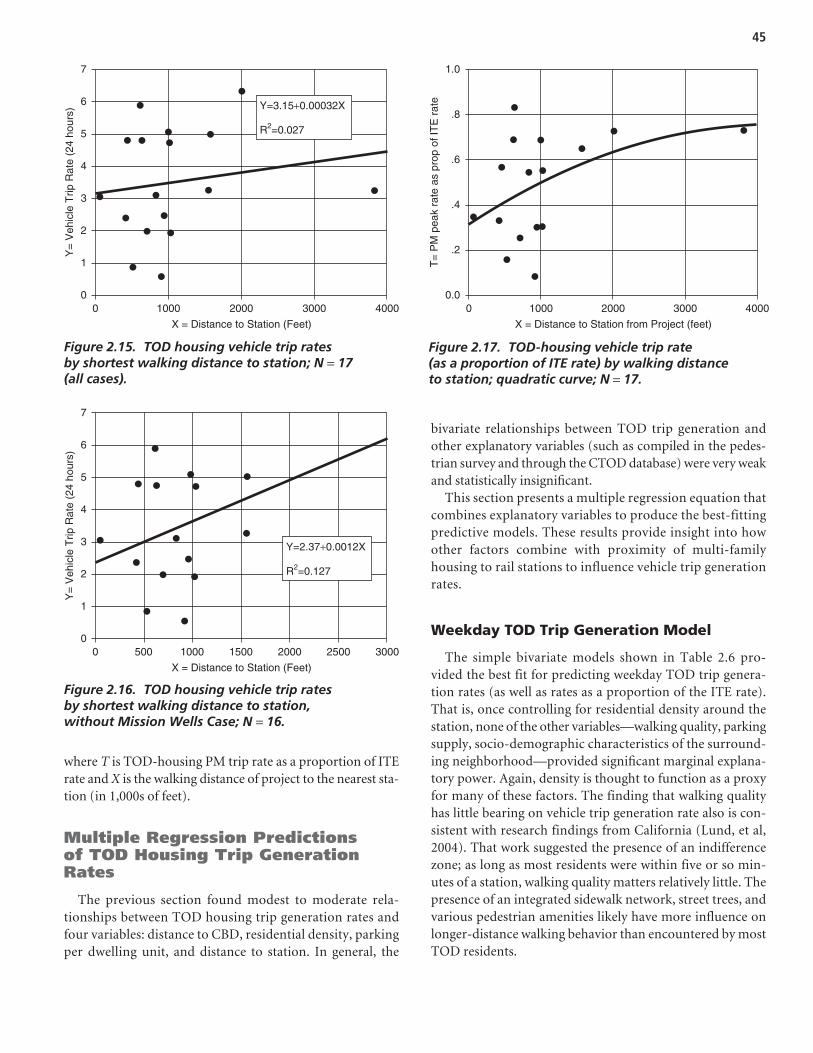
45
where T is TOD-housing PM trip rate as a proportion of ITErate and X is the walking distance of project to the nearest sta-tion (in 1,000s of feet).
Multiple Regression Predictionsof TOD Housing Trip GenerationRates
The previous section found modest to moderate rela-tionships between TOD housing trip generation rates andfour variables: distance to CBD, residential density, parkingper dwelling unit, and distance to station. In general, the
bivariate relationships between TOD trip generation andother explanatory variables (such as compiled in the pedes-trian survey and through the CTOD database) were very weakand statistically insignificant.
This section presents a multiple regression equation thatcombines explanatory variables to produce the best-fittingpredictive models. These results provide insight into howother factors combine with proximity of multi-familyhousing to rail stations to influence vehicle trip generationrates.
Weekday TOD Trip Generation Model
The simple bivariate models shown in Table 2.6 pro-vided the best fit for predicting weekday TOD trip genera-tion rates (as well as rates as a proportion of the ITE rate).That is, once controlling for residential density around thestation, none of the other variables—walking quality, parkingsupply, socio-demographic characteristics of the surround-ing neighborhood—provided significant marginal explana-tory power. Again, density is thought to function as a proxyfor many of these factors. The finding that walking qualityhas little bearing on vehicle trip generation rate also is con-sistent with research findings from California (Lund, et al,2004). That work suggested the presence of an indifferencezone; as long as most residents were within five or so min-utes of a station, walking quality matters relatively little. Thepresence of an integrated sidewalk network, street trees, andvarious pedestrian amenities likely have more influence onlonger-distance walking behavior than encountered by mostTOD residents.
X = Distance to Station (Feet)
Y=
Veh
icle
Trip
Rat
e (2
4 ho
urs)
00
1
2
3
4
7
6
5
1000 2000 3000 4000
Y=3.15+0.00032X
R2=0.027
Figure 2.15. TOD housing vehicle trip ratesby shortest walking distance to station; N = 17(all cases).
X = Distance to Station (Feet)
Y=
Veh
icle
Trip
Rat
e (2
4 ho
urs)
00
1
2
3
4
7
6
5
1000500 1500 2000 2500 3000
Y=2.37+0.0012X
R2=0.127
Figure 2.16. TOD housing vehicle trip ratesby shortest walking distance to station,without Mission Wells Case; N = 16.
X = Distance to Station from Project (feet)
T=
PM
pea
k ra
te a
s pr
op o
f IT
E r
ate
00.0
.2
.4
.6
.8
1.0
1000 2000 3000 4000
Figure 2.17. TOD-housing vehicle trip rate(as a proportion of ITE rate) by walking distanceto station; quadratic curve; N = 17.
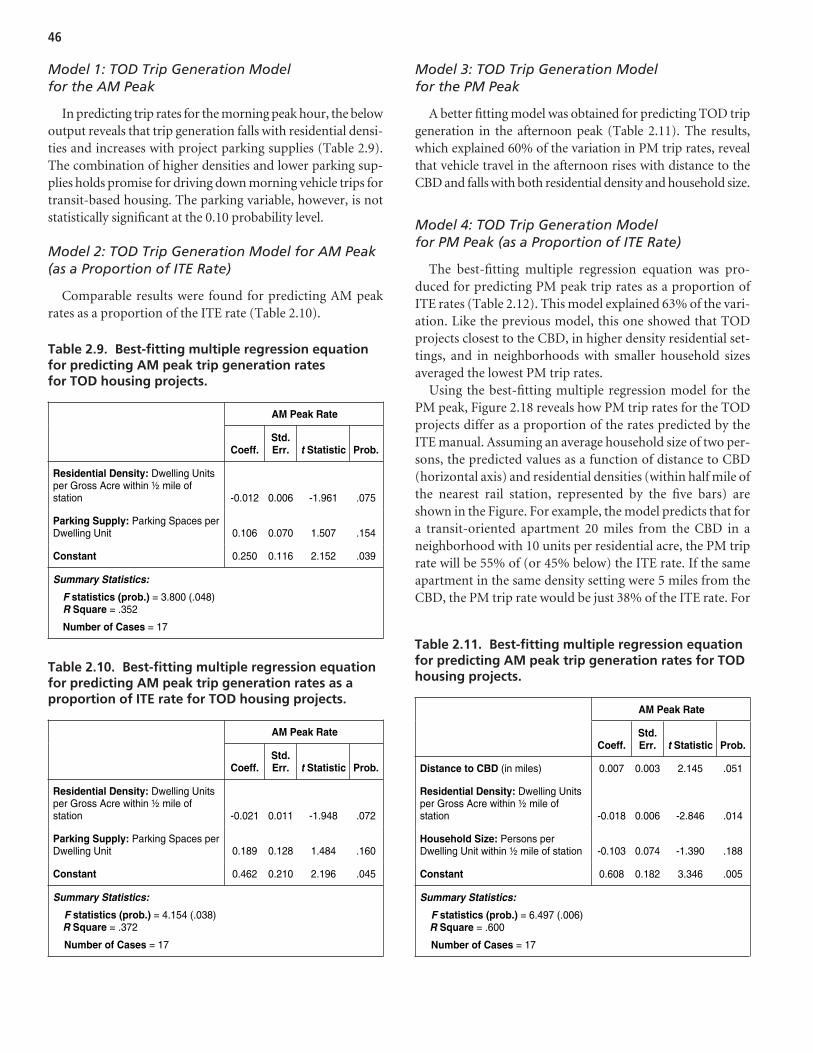
46
Model 1: TOD Trip Generation Modelfor the AM Peak
In predicting trip rates for the morning peak hour, the belowoutput reveals that trip generation falls with residential densi-ties and increases with project parking supplies (Table 2.9).The combination of higher densities and lower parking sup-plies holds promise for driving down morning vehicle trips fortransit-based housing. The parking variable, however, is notstatistically significant at the 0.10 probability level.
Model 2: TOD Trip Generation Model for AM Peak(as a Proportion of ITE Rate)
Comparable results were found for predicting AM peakrates as a proportion of the ITE rate (Table 2.10).
Model 3: TOD Trip Generation Modelfor the PM Peak
A better fitting model was obtained for predicting TOD tripgeneration in the afternoon peak (Table 2.11). The results,which explained 60% of the variation in PM trip rates, revealthat vehicle travel in the afternoon rises with distance to theCBD and falls with both residential density and household size.
Model 4: TOD Trip Generation Modelfor PM Peak (as a Proportion of ITE Rate)
The best-fitting multiple regression equation was pro-duced for predicting PM peak trip rates as a proportion ofITE rates (Table 2.12). This model explained 63% of the vari-ation. Like the previous model, this one showed that TODprojects closest to the CBD, in higher density residential set-tings, and in neighborhoods with smaller household sizesaveraged the lowest PM trip rates.
Using the best-fitting multiple regression model for thePM peak, Figure 2.18 reveals how PM trip rates for the TODprojects differ as a proportion of the rates predicted by theITE manual. Assuming an average household size of two per-sons, the predicted values as a function of distance to CBD(horizontal axis) and residential densities (within half mile ofthe nearest rail station, represented by the five bars) areshown in the Figure. For example, the model predicts that fora transit-oriented apartment 20 miles from the CBD in aneighborhood with 10 units per residential acre, the PM triprate will be 55% of (or 45% below) the ITE rate. If the sameapartment in the same density setting were 5 miles from theCBD, the PM trip rate would be just 38% of the ITE rate. For
AM Peak Rate
Coeff.Std.Err. t Statistic Prob.
Residential Density: Dwelling Unitsper Gross Acre within ½ mile ofstation -0.012 0.006 -1.961 .075
Parking Supply: Parking Spaces perDwelling Unit 0.106 0.070 1.507 .154
Constant 0.250 0.116 2.152 .039
Summary Statistics:
F statistics (prob.) = 3.800 (.048)R Square = .352
Number of Cases = 17
AM Peak Rate
Coeff.Std.Err. t Statistic Prob.
Residential Density: Dwelling Unitsper Gross Acre within ½ mile ofstation -0.021 0.011 -1.948 .072
Parking Supply: Parking Spaces perDwelling Unit 0.189 0.128 1.484 .160
Constant 0.462 0.210 2.196 .045
Summary Statistics:
F statistics (prob.) = 4.154 (.038)R Square = .372
Number of Cases = 17
Table 2.9. Best-fitting multiple regression equationfor predicting AM peak trip generation ratesfor TOD housing projects.
Table 2.10. Best-fitting multiple regression equationfor predicting AM peak trip generation rates as aproportion of ITE rate for TOD housing projects.
AM Peak Rate
Coeff.Std.Err. t Statistic Prob.
Residential Density: Dwelling Unitsper Gross Acre within ½ mile ofstation -0.018 0.006 -2.846 .014
Household Size: Persons per Dwelling Unit within ½ mile of station -0.103 0.074 -1.390 .188
Constant 0.608 0.182 3.346 .005
Distance to CBD (in miles) 0.007 0.003 2.145 .051
Summary Statistics:
F statistics (prob.) = 6.497 (.006)R Square = .600
Number of Cases = 17
Table 2.11. Best-fitting multiple regression equationfor predicting AM peak trip generation rates for TODhousing projects.
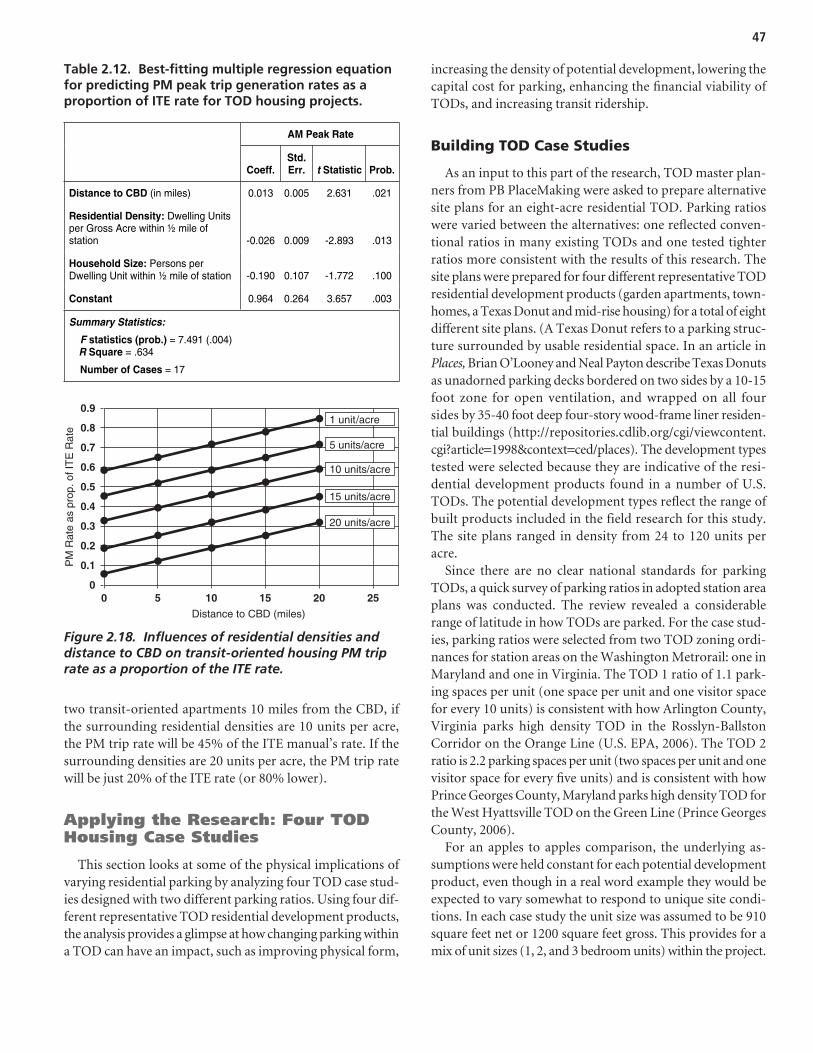
47
two transit-oriented apartments 10 miles from the CBD, ifthe surrounding residential densities are 10 units per acre,the PM trip rate will be 45% of the ITE manual’s rate. If thesurrounding densities are 20 units per acre, the PM trip ratewill be just 20% of the ITE rate (or 80% lower).
Applying the Research: Four TODHousing Case Studies
This section looks at some of the physical implications ofvarying residential parking by analyzing four TOD case stud-ies designed with two different parking ratios. Using four dif-ferent representative TOD residential development products,the analysis provides a glimpse at how changing parking withina TOD can have an impact, such as improving physical form,
increasing the density of potential development, lowering thecapital cost for parking, enhancing the financial viability ofTODs, and increasing transit ridership.
Building TOD Case Studies
As an input to this part of the research, TOD master plan-ners from PB PlaceMaking were asked to prepare alternativesite plans for an eight-acre residential TOD. Parking ratioswere varied between the alternatives: one reflected conven-tional ratios in many existing TODs and one tested tighterratios more consistent with the results of this research. Thesite plans were prepared for four different representative TODresidential development products (garden apartments, town-homes, a Texas Donut and mid-rise housing) for a total of eightdifferent site plans. (A Texas Donut refers to a parking struc-ture surrounded by usable residential space. In an article inPlaces, Brian O’Looney and Neal Payton describe Texas Donutsas unadorned parking decks bordered on two sides by a 10-15foot zone for open ventilation, and wrapped on all foursides by 35-40 foot deep four-story wood-frame liner residen-tial buildings (http://repositories.cdlib.org/cgi/viewcontent.cgi?article=1998&context=ced/places). The development typestested were selected because they are indicative of the resi-dential development products found in a number of U.S.TODs. The potential development types reflect the range ofbuilt products included in the field research for this study.The site plans ranged in density from 24 to 120 units peracre.
Since there are no clear national standards for parkingTODs, a quick survey of parking ratios in adopted station areaplans was conducted. The review revealed a considerablerange of latitude in how TODs are parked. For the case stud-ies, parking ratios were selected from two TOD zoning ordi-nances for station areas on the Washington Metrorail: one inMaryland and one in Virginia. The TOD 1 ratio of 1.1 park-ing spaces per unit (one space per unit and one visitor spacefor every 10 units) is consistent with how Arlington County,Virginia parks high density TOD in the Rosslyn-BallstonCorridor on the Orange Line (U.S. EPA, 2006). The TOD 2ratio is 2.2 parking spaces per unit (two spaces per unit and onevisitor space for every five units) and is consistent with howPrince Georges County, Maryland parks high density TOD forthe West Hyattsville TOD on the Green Line (Prince GeorgesCounty, 2006).
For an apples to apples comparison, the underlying as-sumptions were held constant for each potential developmentproduct, even though in a real word example they would beexpected to vary somewhat to respond to unique site condi-tions. In each case study the unit size was assumed to be 910square feet net or 1200 square feet gross. This provides for amix of unit sizes (1, 2, and 3 bedroom units) within the project.
AM Peak Rate
Coeff.Std.Err. t Statistic Prob.
Residential Density: Dwelling Unitsper Gross Acre within ½ mile ofstation -0.026 0.009 -2.893 .013
Household Size: Persons per Dwelling Unit within ½ mile of station -0.190 0.107 -1.772 .100
Constant 0.964 0.264 3.657 .003
Distance to CBD (in miles) 0.013 0.005 2.631 .021
Summary Statistics:
F statistics (prob.) = 7.491 (.004) R Square = .634
Number of Cases = 17
Table 2.12. Best-fitting multiple regression equationfor predicting PM peak trip generation rates as aproportion of ITE rate for TOD housing projects.
Distance to CBD (miles)
PM
Rat
e as
pro
p. o
f IT
E R
ate
0
0.9
0.8
0.7
0.6
0.5
0.4
0.3
0.2
0.1
05 10 15 20 25
1 unit/acre
5 units/acre
10 units/acre
15 units/acre
20 units/acre
Figure 2.18. Influences of residential densities anddistance to CBD on transit-oriented housing PM triprate as a proportion of the ITE rate.
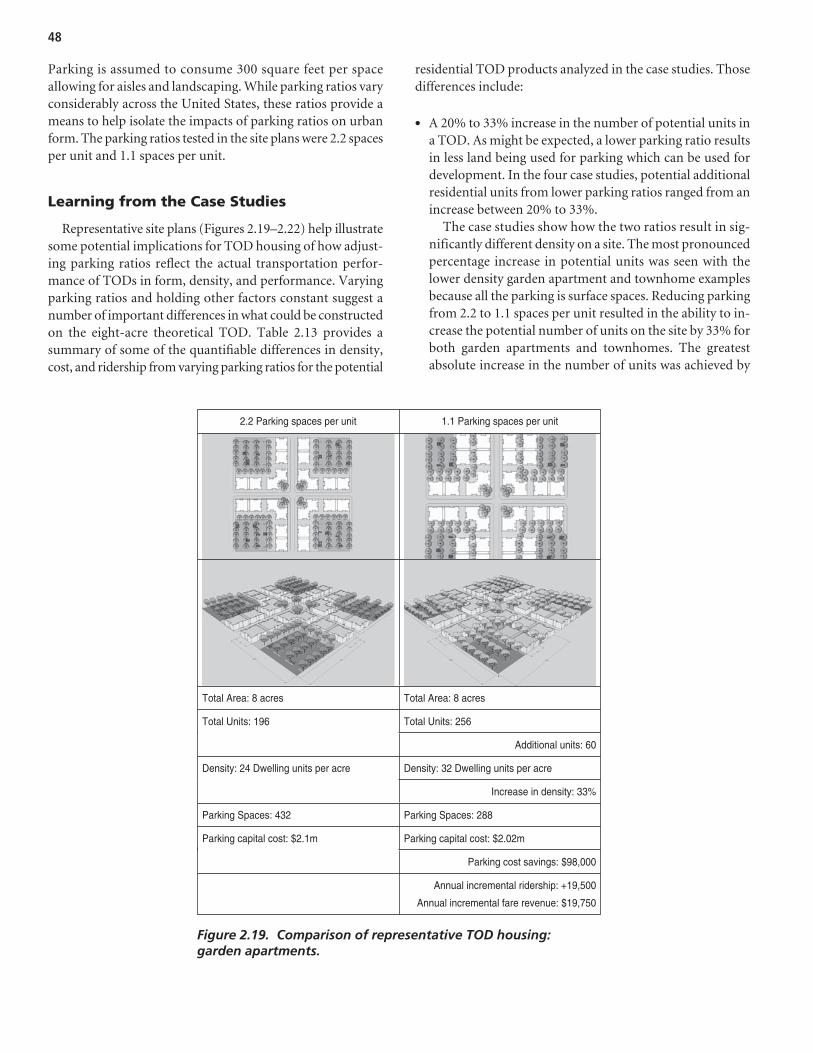
48
Parking is assumed to consume 300 square feet per spaceallowing for aisles and landscaping. While parking ratios varyconsiderably across the United States, these ratios provide ameans to help isolate the impacts of parking ratios on urbanform. The parking ratios tested in the site plans were 2.2 spacesper unit and 1.1 spaces per unit.
Learning from the Case Studies
Representative site plans (Figures 2.19–2.22) help illustratesome potential implications for TOD housing of how adjust-ing parking ratios reflect the actual transportation perfor-mance of TODs in form, density, and performance. Varyingparking ratios and holding other factors constant suggest anumber of important differences in what could be constructedon the eight-acre theoretical TOD. Table 2.13 provides asummary of some of the quantifiable differences in density,cost, and ridership from varying parking ratios for the potential
residential TOD products analyzed in the case studies. Thosedifferences include:
• A 20% to 33% increase in the number of potential units ina TOD. As might be expected, a lower parking ratio resultsin less land being used for parking which can be used fordevelopment. In the four case studies, potential additionalresidential units from lower parking ratios ranged from anincrease between 20% to 33%.
The case studies show how the two ratios result in sig-nificantly different density on a site. The most pronouncedpercentage increase in potential units was seen with thelower density garden apartment and townhome examplesbecause all the parking is surface spaces. Reducing parkingfrom 2.2 to 1.1 spaces per unit resulted in the ability to in-crease the potential number of units on the site by 33% forboth garden apartments and townhomes. The greatest absolute increase in the number of units was achieved by
Total Area: 8 acres
2.2 Parking spaces per unit 1.1 Parking spaces per unit
Total Area: 8 acres
Total Units: 256 Total Units: 196
Additional units: 60
Density: 32 Dwelling units per acre Density: 24 Dwelling units per acre
Increase in density: 33%
Parking Spaces: 432 Parking Spaces: 288
Parking capital cost: $2.02m Parking capital cost: $2.1m
Parking cost savings: $98,000
Annual incremental ridership: +19,500
Annual incremental fare revenue: $19,750
Figure 2.19. Comparison of representative TOD housing: garden apartments.
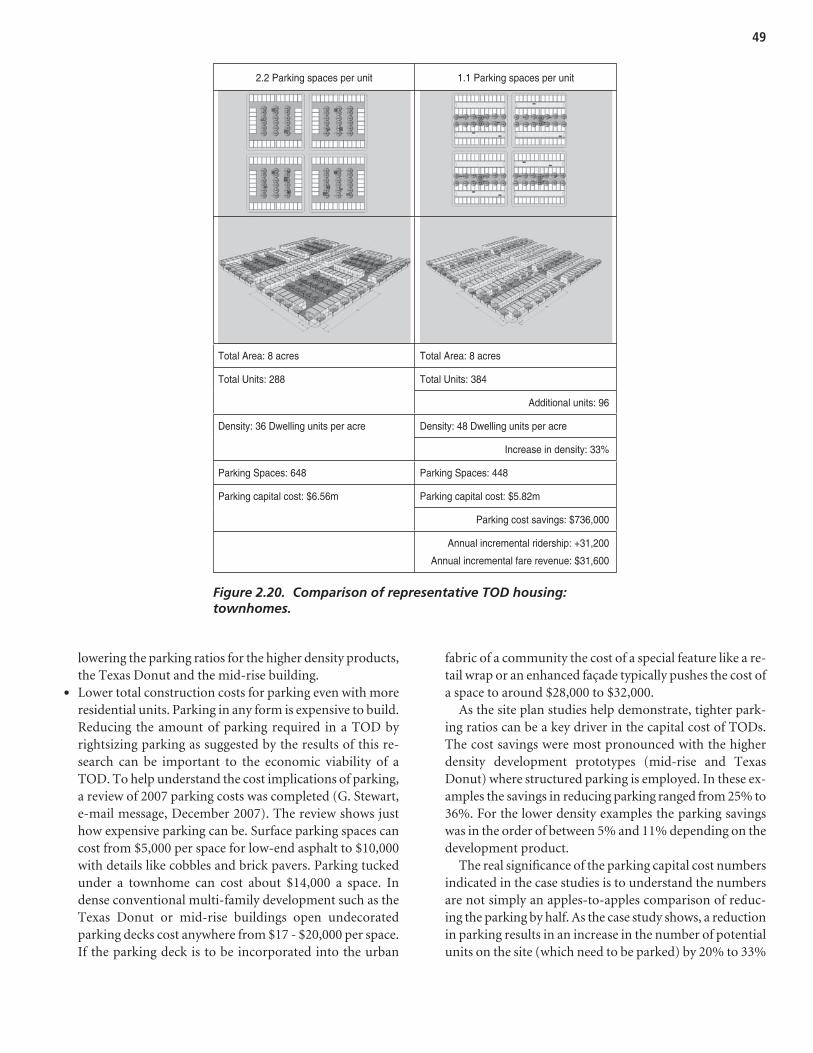
49
lowering the parking ratios for the higher density products,the Texas Donut and the mid-rise building.
• Lower total construction costs for parking even with moreresidential units. Parking in any form is expensive to build.Reducing the amount of parking required in a TOD byrightsizing parking as suggested by the results of this re-search can be important to the economic viability of aTOD. To help understand the cost implications of parking,a review of 2007 parking costs was completed (G. Stewart,e-mail message, December 2007). The review shows justhow expensive parking can be. Surface parking spaces cancost from $5,000 per space for low-end asphalt to $10,000with details like cobbles and brick pavers. Parking tuckedunder a townhome can cost about $14,000 a space. Indense conventional multi-family development such as theTexas Donut or mid-rise buildings open undecoratedparking decks cost anywhere from $17 - $20,000 per space.If the parking deck is to be incorporated into the urban
fabric of a community the cost of a special feature like a re-tail wrap or an enhanced façade typically pushes the cost ofa space to around $28,000 to $32,000.
As the site plan studies help demonstrate, tighter park-ing ratios can be a key driver in the capital cost of TODs.The cost savings were most pronounced with the higherdensity development prototypes (mid-rise and TexasDonut) where structured parking is employed. In these ex-amples the savings in reducing parking ranged from 25% to36%. For the lower density examples the parking savingswas in the order of between 5% and 11% depending on thedevelopment product.
The real significance of the parking capital cost numbersindicated in the case studies is to understand the numbersare not simply an apples-to-apples comparison of reduc-ing the parking by half. As the case study shows, a reductionin parking results in an increase in the number of potentialunits on the site (which need to be parked) by 20% to 33%
Total Area: 8 acres Total Area: 8 acres
Total Units: 384 Total Units: 288
Additional units: 96
Density: 48 Dwelling units per acre Density: 36 Dwelling units per acre
Increase in density: 33%
Parking Spaces: 648 Parking Spaces: 448
Parking capital cost: $5.82m Parking capital cost: $6.56m
Parking cost savings: $736,000
Annual incremental ridership: +31,200
Annual incremental fare revenue: $31,600
2.2 Parking spaces per unit 1.1 Parking spaces per unit
Figure 2.20. Comparison of representative TOD housing:townhomes.
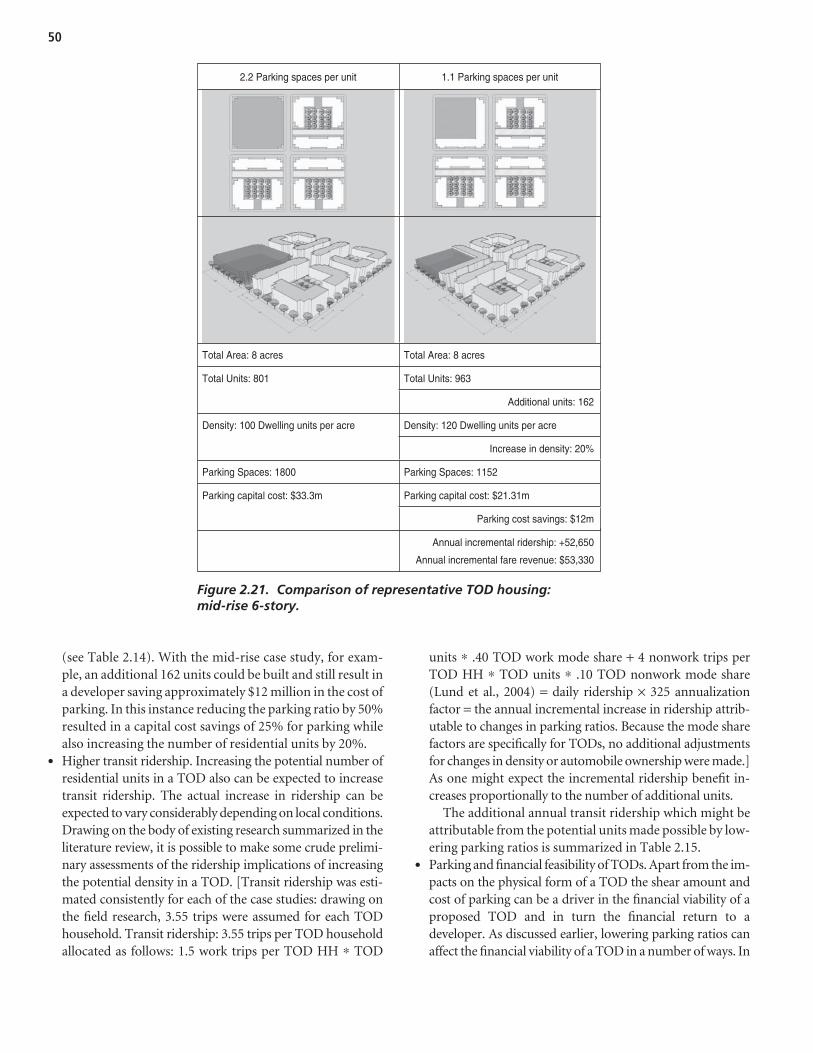
50
(see Table 2.14). With the mid-rise case study, for exam-ple, an additional 162 units could be built and still result ina developer saving approximately $12 million in the cost ofparking. In this instance reducing the parking ratio by 50%resulted in a capital cost savings of 25% for parking whilealso increasing the number of residential units by 20%.
• Higher transit ridership. Increasing the potential number ofresidential units in a TOD also can be expected to increasetransit ridership. The actual increase in ridership can beexpected to vary considerably depending on local conditions.Drawing on the body of existing research summarized in theliterature review, it is possible to make some crude prelimi-nary assessments of the ridership implications of increasingthe potential density in a TOD. [Transit ridership was esti-mated consistently for each of the case studies: drawing onthe field research, 3.55 trips were assumed for each TODhousehold. Transit ridership: 3.55 trips per TOD householdallocated as follows: 1.5 work trips per TOD HH ∗ TOD
units ∗ .40 TOD work mode share + 4 nonwork trips perTOD HH ∗ TOD units ∗ .10 TOD nonwork mode share(Lund et al., 2004) = daily ridership × 325 annualizationfactor = the annual incremental increase in ridership attrib-utable to changes in parking ratios. Because the mode sharefactors are specifically for TODs, no additional adjustmentsfor changes in density or automobile ownership were made.]As one might expect the incremental ridership benefit in-creases proportionally to the number of additional units.
The additional annual transit ridership which might beattributable from the potential units made possible by low-ering parking ratios is summarized in Table 2.15.
• Parking and financial feasibility of TODs. Apart from the im-pacts on the physical form of a TOD the shear amount andcost of parking can be a driver in the financial viability of aproposed TOD and in turn the financial return to adeveloper. As discussed earlier, lowering parking ratios canaffect the financial viability of a TOD in a number of ways. In
Total Area: 8 acres Total Area: 8 acres
Total Units: 963 Total Units: 801
Additional units: 162
Density: 120 Dwelling units per acre Density: 100 Dwelling units per acre
Increase in density: 20%
Parking Spaces: 1800 Parking Spaces: 1152
Parking capital cost: $21.31m Parking capital cost: $33.3m
Parking cost savings: $12m
Annual incremental ridership: +52,650
Annual incremental fare revenue: $53,330
2.2 Parking spaces per unit 1.1 Parking spaces per unit
Figure 2.21. Comparison of representative TOD housing:mid-rise 6-story.
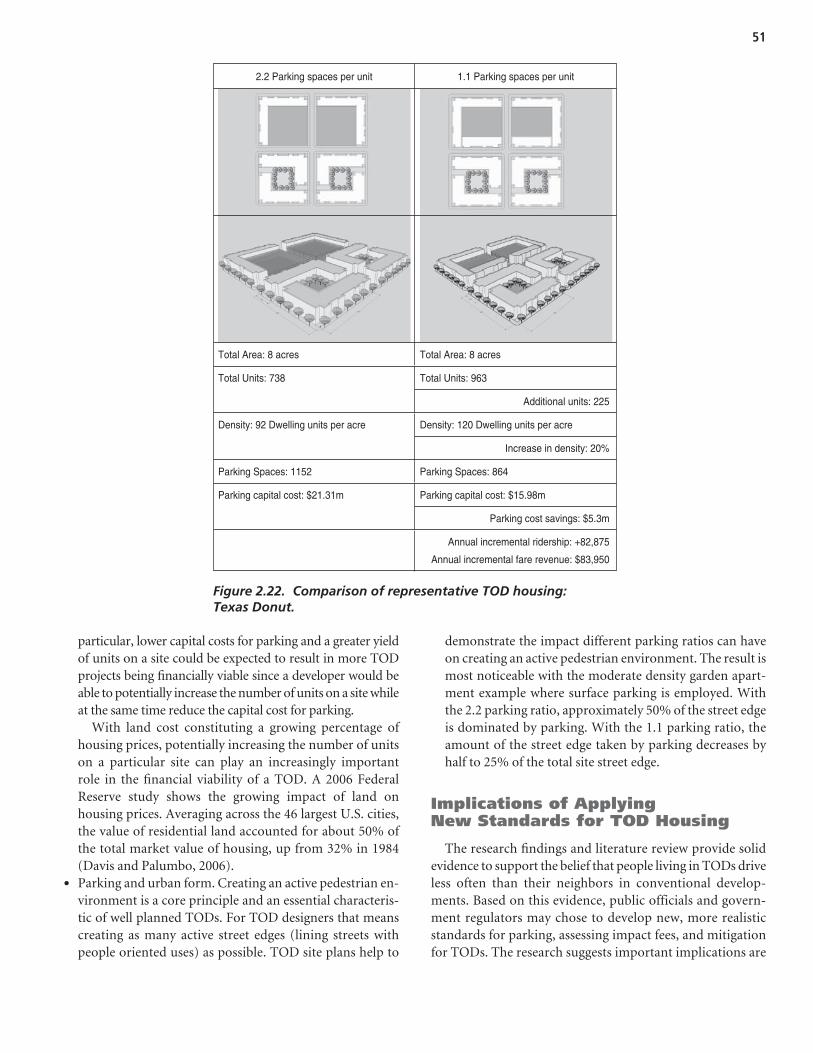
51
particular, lower capital costs for parking and a greater yieldof units on a site could be expected to result in more TODprojects being financially viable since a developer would beable to potentially increase the number of units on a site whileat the same time reduce the capital cost for parking.
With land cost constituting a growing percentage ofhousing prices, potentially increasing the number of unitson a particular site can play an increasingly importantrole in the financial viability of a TOD. A 2006 FederalReserve study shows the growing impact of land onhousing prices. Averaging across the 46 largest U.S. cities,the value of residential land accounted for about 50% ofthe total market value of housing, up from 32% in 1984(Davis and Palumbo, 2006).
• Parking and urban form. Creating an active pedestrian en-vironment is a core principle and an essential characteris-tic of well planned TODs. For TOD designers that meanscreating as many active street edges (lining streets withpeople oriented uses) as possible. TOD site plans help to
demonstrate the impact different parking ratios can haveon creating an active pedestrian environment. The result ismost noticeable with the moderate density garden apart-ment example where surface parking is employed. Withthe 2.2 parking ratio, approximately 50% of the street edgeis dominated by parking. With the 1.1 parking ratio, theamount of the street edge taken by parking decreases byhalf to 25% of the total site street edge.
Implications of Applying New Standards for TOD Housing
The research findings and literature review provide solidevidence to support the belief that people living in TODs driveless often than their neighbors in conventional develop-ments. Based on this evidence, public officials and govern-ment regulators may chose to develop new, more realisticstandards for parking, assessing impact fees, and mitigationfor TODs. The research suggests important implications are
Total Area: 8 acres Total Area: 8 acres
Total Units: 963 Total Units: 738
Additional units: 225
Density: 120 Dwelling units per acre Density: 92 Dwelling units per acre
Increase in density: 20%
Parking Spaces: 1152 Parking Spaces: 864
Parking capital cost: $15.98m Parking capital cost: $21.31m
Parking cost savings: $5.3m
Annual incremental ridership: +82,875
Annual incremental fare revenue: $83,950
2.2 Parking spaces per unit 1.1 Parking spaces per unit
Figure 2.22. Comparison of representative TOD housing: Texas Donut.
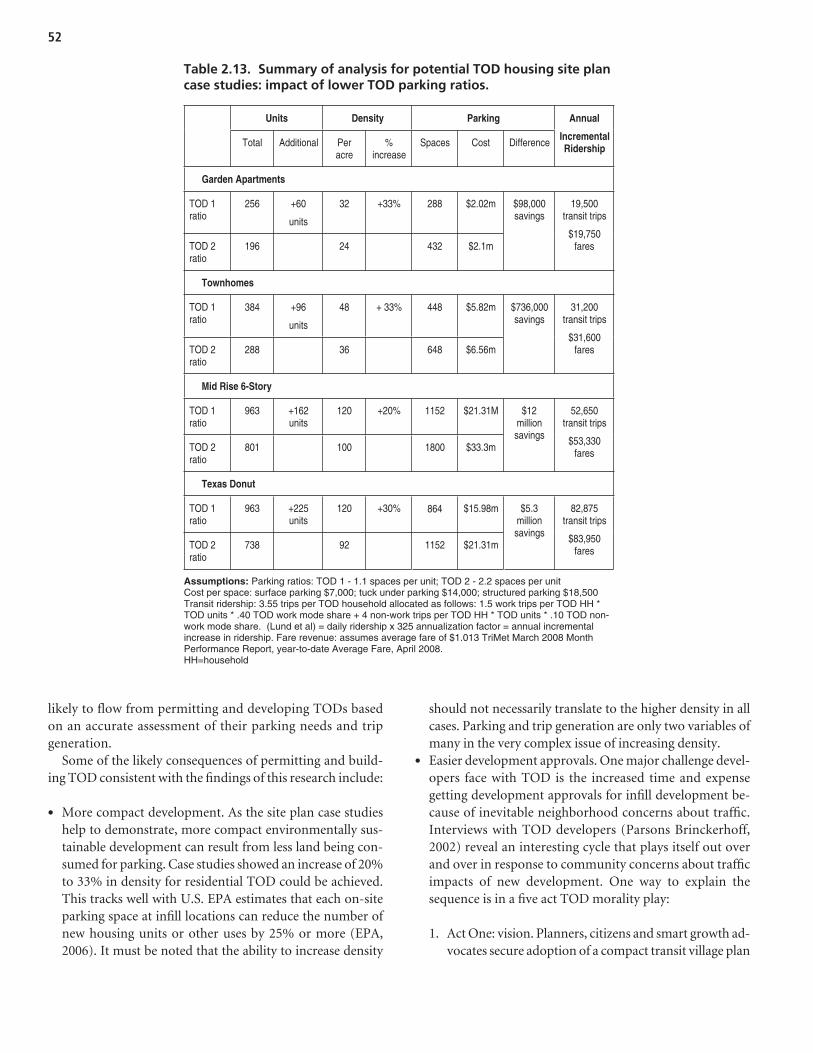
52
likely to flow from permitting and developing TODs basedon an accurate assessment of their parking needs and tripgeneration.
Some of the likely consequences of permitting and build-ing TOD consistent with the findings of this research include:
• More compact development. As the site plan case studieshelp to demonstrate, more compact environmentally sus-tainable development can result from less land being con-sumed for parking. Case studies showed an increase of 20%to 33% in density for residential TOD could be achieved.This tracks well with U.S. EPA estimates that each on-siteparking space at infill locations can reduce the number ofnew housing units or other uses by 25% or more (EPA,2006). It must be noted that the ability to increase density
Units Density Parking
Total Additional Per acre
% increase
Spaces Cost Difference
Annual
Incremental Ridership
Garden Apartments
TOD 1 ratio
256 +60
units
32 +33% 288 $2.02m
TOD 2 ratio
196 24 432 $2.1m
$98,000 savings
19,500 transit trips
$19,750 fares
Townhomes
TOD 1 ratio
384 +96
units
48 + 33% 448 $5.82m
TOD 2 ratio
288 36 648 $6.56m
$736,000 savings
31,200 transit trips
$31,600 fares
Mid Rise 6-Story
TOD 1 ratio
963 +162 units
120 +20% 1152 $21.31M
TOD 2 ratio
801 100 1800 $33.3m
$12 million savings
52,650 transit trips
$53,330 fares
Texas Donut
TOD 1 ratio
963 +225 units
120 +30%
1152 $21.31m
TOD 2 ratio
738 92
864 $15.98m $5.3 million savings
82,875 transit trips
$83,950 fares
Assumptions: Parking ratios: TOD 1 - 1.1 spaces per unit; TOD 2 - 2.2 spaces per unit Cost per space: surface parking $7,000; tuck under parking $14,000; structured parking $18,500 Transit ridership: 3.55 trips per TOD household allocated as follows: 1.5 work trips per TOD HH * TOD units * .40 TOD work mode share + 4 non-work trips per TOD HH * TOD units * .10 TOD non- work mode share. (Lund et al) = daily ridership x 325 annualization factor = annual incremental increase in ridership. Fare revenue: assumes average fare of $1.013 TriMet March 2008 Month Performance Report, year-to-date Average Fare, April 2008. HH=household
Table 2.13. Summary of analysis for potential TOD housing site plancase studies: impact of lower TOD parking ratios.
should not necessarily translate to the higher density in allcases. Parking and trip generation are only two variables ofmany in the very complex issue of increasing density.
• Easier development approvals. One major challenge devel-opers face with TOD is the increased time and expense getting development approvals for infill development be-cause of inevitable neighborhood concerns about traffic.Interviews with TOD developers (Parsons Brinckerhoff,2002) reveal an interesting cycle that plays itself out overand over in response to community concerns about trafficimpacts of new development. One way to explain the sequence is in a five act TOD morality play:
1. Act One: vision. Planners, citizens and smart growth ad-vocates secure adoption of a compact transit village plan
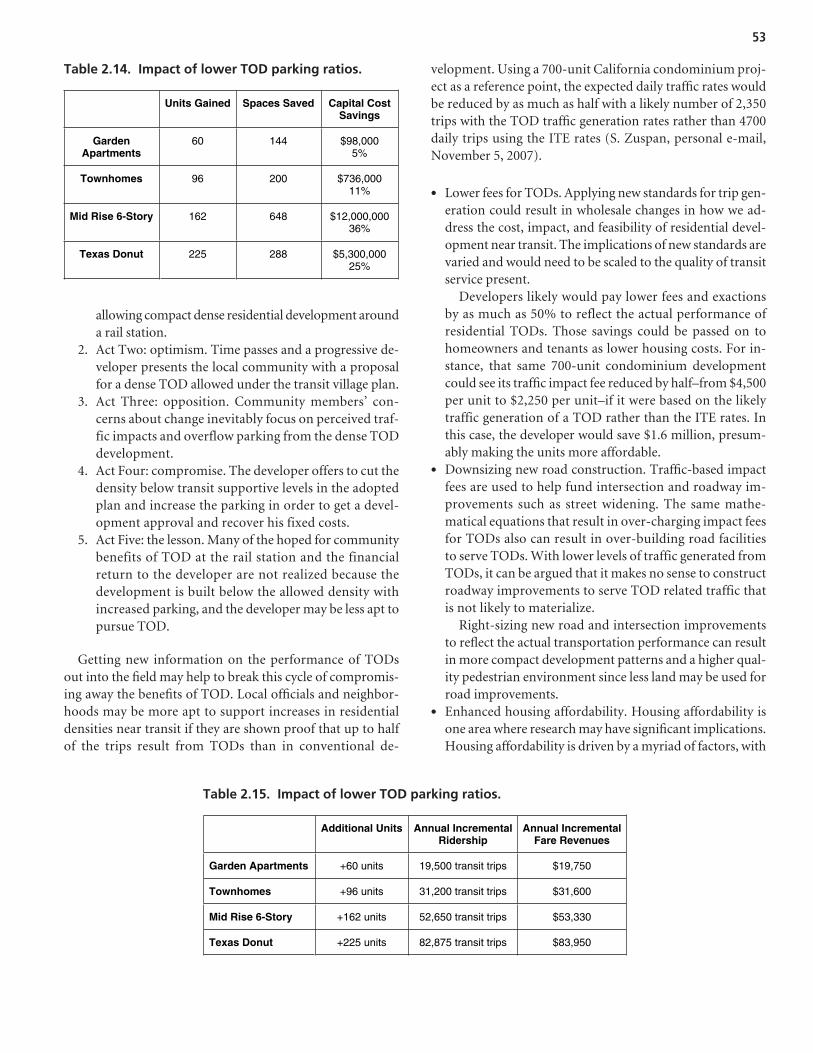
53
allowing compact dense residential development arounda rail station.
2. Act Two: optimism. Time passes and a progressive de-veloper presents the local community with a proposalfor a dense TOD allowed under the transit village plan.
3. Act Three: opposition. Community members’ con-cerns about change inevitably focus on perceived traf-fic impacts and overflow parking from the dense TODdevelopment.
4. Act Four: compromise. The developer offers to cut thedensity below transit supportive levels in the adoptedplan and increase the parking in order to get a devel-opment approval and recover his fixed costs.
5. Act Five: the lesson. Many of the hoped for communitybenefits of TOD at the rail station and the financialreturn to the developer are not realized because thedevelopment is built below the allowed density withincreased parking, and the developer may be less apt topursue TOD.
Getting new information on the performance of TODsout into the field may help to break this cycle of compromis-ing away the benefits of TOD. Local officials and neighbor-hoods may be more apt to support increases in residentialdensities near transit if they are shown proof that up to halfof the trips result from TODs than in conventional de-
velopment. Using a 700-unit California condominium proj-ect as a reference point, the expected daily traffic rates wouldbe reduced by as much as half with a likely number of 2,350trips with the TOD traffic generation rates rather than 4700daily trips using the ITE rates (S. Zuspan, personal e-mail,November 5, 2007).
• Lower fees for TODs. Applying new standards for trip gen-eration could result in wholesale changes in how we ad-dress the cost, impact, and feasibility of residential devel-opment near transit. The implications of new standards arevaried and would need to be scaled to the quality of transitservice present.
Developers likely would pay lower fees and exactionsby as much as 50% to reflect the actual performance ofresidential TODs. Those savings could be passed on tohomeowners and tenants as lower housing costs. For in-stance, that same 700-unit condominium developmentcould see its traffic impact fee reduced by half–from $4,500per unit to $2,250 per unit–if it were based on the likelytraffic generation of a TOD rather than the ITE rates. Inthis case, the developer would save $1.6 million, presum-ably making the units more affordable.
• Downsizing new road construction. Traffic-based impactfees are used to help fund intersection and roadway im-provements such as street widening. The same mathe-matical equations that result in over-charging impact feesfor TODs also can result in over-building road facilitiesto serve TODs. With lower levels of traffic generated fromTODs, it can be argued that it makes no sense to constructroadway improvements to serve TOD related traffic thatis not likely to materialize.
Right-sizing new road and intersection improvementsto reflect the actual transportation performance can resultin more compact development patterns and a higher qual-ity pedestrian environment since less land may be used forroad improvements.
• Enhanced housing affordability. Housing affordability isone area where research may have significant implications.Housing affordability is driven by a myriad of factors, with
Units Gained Spaces Saved Capital CostSavings
GardenApartments
60 144 $98,0005%
Townhomes 96 200 $736,00011%
Mid Rise 6-Story 162 648 $12,000,00036%
Texas Donut 225 288 $5,300,00025%
Table 2.14. Impact of lower TOD parking ratios.
Additional Units Annual IncrementalRidership
Annual IncrementalFare Revenues
Garden Apartments +60 units 19,500 transit trips $19,750
Townhomes +96 units 31,200 transit trips $31,600
Mid Rise 6-Story +162 units 52,650 transit trips $53,330
Texas Donut +225 units 82,875 transit trips $83,950
Table 2.15. Impact of lower TOD parking ratios.
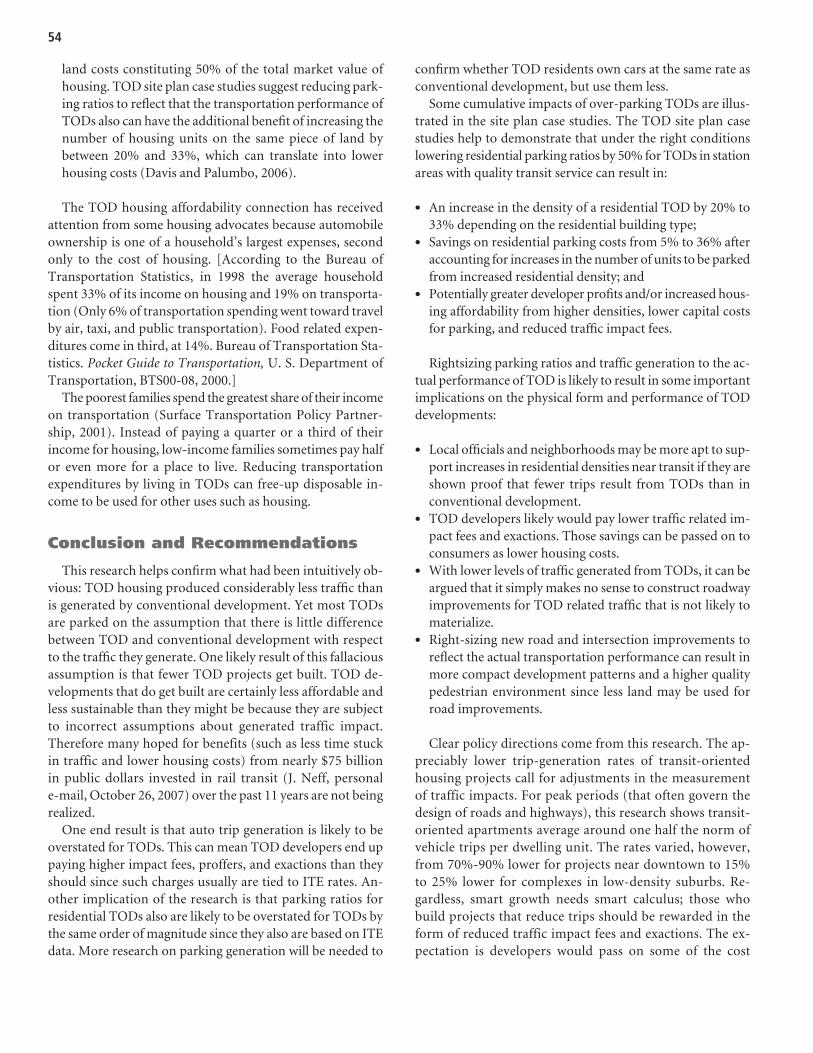
land costs constituting 50% of the total market value ofhousing. TOD site plan case studies suggest reducing park-ing ratios to reflect that the transportation performance ofTODs also can have the additional benefit of increasing thenumber of housing units on the same piece of land bybetween 20% and 33%, which can translate into lowerhousing costs (Davis and Palumbo, 2006).
The TOD housing affordability connection has receivedattention from some housing advocates because automobileownership is one of a household’s largest expenses, secondonly to the cost of housing. [According to the Bureau ofTransportation Statistics, in 1998 the average householdspent 33% of its income on housing and 19% on transporta-tion (Only 6% of transportation spending went toward travelby air, taxi, and public transportation). Food related expen-ditures come in third, at 14%. Bureau of Transportation Sta-tistics. Pocket Guide to Transportation, U. S. Department ofTransportation, BTS00-08, 2000.]
The poorest families spend the greatest share of their incomeon transportation (Surface Transportation Policy Partner-ship, 2001). Instead of paying a quarter or a third of theirincome for housing, low-income families sometimes pay halfor even more for a place to live. Reducing transportationexpenditures by living in TODs can free-up disposable in-come to be used for other uses such as housing.
Conclusion and Recommendations
This research helps confirm what had been intuitively ob-vious: TOD housing produced considerably less traffic thanis generated by conventional development. Yet most TODsare parked on the assumption that there is little differencebetween TOD and conventional development with respectto the traffic they generate. One likely result of this fallaciousassumption is that fewer TOD projects get built. TOD de-velopments that do get built are certainly less affordable andless sustainable than they might be because they are subjectto incorrect assumptions about generated traffic impact.Therefore many hoped for benefits (such as less time stuckin traffic and lower housing costs) from nearly $75 billionin public dollars invested in rail transit (J. Neff, personale-mail, October 26, 2007) over the past 11 years are not beingrealized.
One end result is that auto trip generation is likely to beoverstated for TODs. This can mean TOD developers end uppaying higher impact fees, proffers, and exactions than theyshould since such charges usually are tied to ITE rates. An-other implication of the research is that parking ratios forresidential TODs also are likely to be overstated for TODs bythe same order of magnitude since they also are based on ITEdata. More research on parking generation will be needed to
confirm whether TOD residents own cars at the same rate asconventional development, but use them less.
Some cumulative impacts of over-parking TODs are illus-trated in the site plan case studies. The TOD site plan casestudies help to demonstrate that under the right conditionslowering residential parking ratios by 50% for TODs in stationareas with quality transit service can result in:
• An increase in the density of a residential TOD by 20% to33% depending on the residential building type;
• Savings on residential parking costs from 5% to 36% afteraccounting for increases in the number of units to be parkedfrom increased residential density; and
• Potentially greater developer profits and/or increased hous-ing affordability from higher densities, lower capital costsfor parking, and reduced traffic impact fees.
Rightsizing parking ratios and traffic generation to the ac-tual performance of TOD is likely to result in some importantimplications on the physical form and performance of TODdevelopments:
• Local officials and neighborhoods may be more apt to sup-port increases in residential densities near transit if they areshown proof that fewer trips result from TODs than inconventional development.
• TOD developers likely would pay lower traffic related im-pact fees and exactions. Those savings can be passed on toconsumers as lower housing costs.
• With lower levels of traffic generated from TODs, it can beargued that it simply makes no sense to construct roadwayimprovements for TOD related traffic that is not likely tomaterialize.
• Right-sizing new road and intersection improvements toreflect the actual transportation performance can result inmore compact development patterns and a higher qualitypedestrian environment since less land may be used forroad improvements.
Clear policy directions come from this research. The ap-preciably lower trip-generation rates of transit-orientedhousing projects call for adjustments in the measurementof traffic impacts. For peak periods (that often govern thedesign of roads and highways), this research shows transit-oriented apartments average around one half the norm ofvehicle trips per dwelling unit. The rates varied, however,from 70%-90% lower for projects near downtown to 15%to 25% lower for complexes in low-density suburbs. Re-gardless, smart growth needs smart calculus; those whobuild projects that reduce trips should be rewarded in theform of reduced traffic impact fees and exactions. The ex-pectation is developers would pass on some of the cost
54
savings to tenants, thus making housing near rail stationsmore affordable.
To date, few jurisdictions have introduced sliding scale feestructures to reflect the lowering of trip generation for TODs.Santa Clara County California’s Congestion ManagementAgency has produced guidelines for a 9% trip reduction forhousing within 2,000 feet of a light-rail or commuter-railstation. While this is a positive step, according to our researchfindings, this adjustment is a bit tepid. Similarly, the URBEMISsoftware program sponsored by the California Air ResourcesBoard, used to estimate the air quality impacts of new devel-opment, calls for up to a 15% lowering of trip rates for hous-ing in settings with intensive transit services–again, likely onthe low side based on these findings. More in line with thefindings presented here are the vehicle trip reductions grantedto the White Flint Metro Center project, a mega-scale, mixed-use joint development project being built at Washington,D.C. Metrorail’s North Bethesda Station. With some 1.2 mil-lion square feet of office space, 250,000 square feet ofcommercial-retail, and 375 residential units scheduled atbuild out, the project was granted a 40% reduction in esti-mated trip rates for the housing component based on prox-imity to transit.
The trip reduction benefits of TOD call for other develop-ment incentives, like lower parking ratios, flexible parkingcodes, market-responsive zoning, streamlining the projectreview and permitting process, and investments in support-ive public infrastructure. Trip reduction also suggests TODsare strong markets for car-sharing. Recent research in theSan Francisco Bay Area reveals that those who participate incarsharing lower their car ownership levels around 10%, withhigher vehicle-shedding rates among those living near railstations (Cervero, Golub, and Nee, 2007). The combinationof reducing off-street parking and increasing carsharingoptions would yield other benefits, including reducing theamount of impervious surface (and thus water run-off andheat island effects) and the creation of more walkable scalesof development. Such practices are not heavy-handed plan-ning interventions but rather market-oriented responses,namely efforts to set design standards and provide mobilityoptions in keeping with the market preferences of those whoopt to live near rail transit stations.
Recommendations
With this research data to support the belief that peopleliving in TODs drive less often than their neighbors in con-ventional developments, public officials and governmentregulators have the evidence needed to develop new, morerealistic standards for assessing impact fees and mitigation forTODs. Developing residential TODs based on an accurateassessment of their traffic impacts should result in easier
development approvals, better planned and more compactcommunities, increased transit ridership, and more afford-able housing. Tightening residential TOD parking ratios toreflect the actual transportation performance of TODs will bea very important step toward realizing the expected commu-nity benefits of TOD and enhancing their financial feasibil-ity. In many TODs, the community and developer benefitshave been understated because they have been over-parked.Additional research also is suggested to further address someof the questions addressed in the literature review.
To help realize the benefits of TOD the team recommendsthe following:
1. Work with ITE and ULI to develop new trip generationand parking guidance for TOD.
In the opinion of the authors, the highest priority shouldbe placed on working with ITE and the ULI to develop andimplement new guidance on trip generation and parkingfor TOD housing. The research suggests developers arebeing charged impact fees for non-existent trips and re-quired to build expensive parking spaces that are notneeded. Parking ratios developed using ITE trip generationrates over-park TODs by as much as 50%. In developingnew guidance on parking, it will be important to accountfor a variance in trip generation factors such as the qualityof transit service and the distance of a station from the CBD.
The project team contacted ITE to share the panel’s in-terest in working with ITE to develop new guidelines. In response, Lisa M. Fontana Tierney, P.E., Traffic EngineeringSenior Director ITE, commented, “Once the results of thestudy are finalized and submitted to ITE, we will reviewthe information and consider it for inclusion in a futureITE resource. Based on my understanding of the work, itseems that it would be appropriate to consider the resultsof your study as part of a future edition of the ITE TripGeneration Handbook. We expect to begin the updateprocess for this Handbook in early 2009.”
2. Broadly disseminate the findings of this research.Benefits of TOD are muted since most TODs parking
and traffic impacts assessments are oblivious to the factthat a rail stop is nearby. Broadly distributing results of theresearch can help lead to right-sizing TOD-housing regu-lations for parking and transportation impact fees andhigher intensity of development appropriate for TODs.With information in hand to confirm TOD housingproduces fewer trips than conventional development, itshould be somewhat easier to get local approval to buildadditional TODs without unnecessarily negotiating awaythe intensity of development envisioned in adoptedTOD plans.
As an interim step, the findings of the research havebeen presented at the 2007 Rail~Volution Conference in
55
56
Miami, Florida, the 2008 Congress for the New UrbanismConference in Austin, Texas, and a transportation semi-nar at Portland State University. Findings also are slated tobe presented at the 2008 ITE Annual Conference in Ana-heim, California, and have been accepted for publicationby the Journal of Public Transportation.
The findings also will be shared with other researchersdoing similar research, including the mixed-use tripgeneration research being done at the Texas Transporta-tion Institute and NCHRP Project 08-66, “Trip Genera-tion Rates for Transportation Impact Analysis of InfillDevelopment.”
3. Seek funding for additional research on TOD land uses.The research presented here covers only one land use
type found in TODs. Additional research will be necessaryto broaden the knowledge of the trip generation, the park-ing characteristics of TOD land uses, and the impact ofTOD on ensuring ridership in TODs.
The research needs identified by the team and the panelflow from the field research, the literature review and thestate-of-the practice of what we know and don’t knowabout ensuring ridership from TOD:
a. Research into the parking demand and trip generationcharacteristics of office, retail, and mixed-use in TODs.This research also should consider the parking demandsof the land uses and the degree to which different land
uses have different annual peak parking demands, andhow the annual peak parking demands differ from theaverage daily demand. Parking utilization informationis needed for all TOD land uses.
b. Research into self selection and change in travel pat-terns after residents move into a TOD. A mode sharesurvey could be mailed to residents of selected TODsand analyzed at a cost of approximately $3,500 perTOD. The before and after study of Center Commonsreferenced in the literature review was done in thismanner.
c. Research on the impact of design features (e.g., mixedland-use, traffic calming, bus bulbs, short blocks, streetfurniture), travel patterns, transit ridership, or the deci-sion to locate in a TOD. Intuitively we know “designmatters” but there is very little data to show the impactof design on transit use, location decisions to live in aTOD or what design features have the greatest impact.
d. Research into what motivates employers to locate inTODs. There is a growing body of information on res-idential TODs and locational decisions. At the sametime, there is very little understanding how to impactretail and commercial locational decisions to be part ofa TOD. As a starting point, phone interviews of com-mercial leasing agents and tenants in TODs could betaken to distinguish the role TOD/transit may play inlocational decisions.
57
2005 Development-Related Ridership Survey: Final Report. WashingtonMetropolitan Area Transit Authority, March 2006.
Approved West Hyattsville Transit District Development Plan andTDOZMA for the Transit District Overlay Zone. Prince GeorgesCounty Planning Department, Marlboro, Maryland, 2006.
Arrington, G. Transportation Research Circular E-C058: Light Rail andthe American City: State-of-the-Practice for Transit-Oriented Devel-opment. Transportation Research Board of the National Academies,Washington, D.C., 2003.
Arrington, G. Reinventing the American Dream of a Livable Community:Light Rail and Smart Growth in Portland. Conference on Light RailTransit Investment for the Future. Dallas, Texas, 2000.
AvalonBay Communities, Inc. A Developer’s Perspective. APTA RailConference, June 2003.
Belzer, D. and Autler, G. Transit Oriented Development: Moving fromRhetoric to Reality. Great American Station Foundation andBrookings Center on Metropolitan Policy, Brookings Institution,Washington, D.C., June 2002.
Ben-Akiva, M. and Bowman, J. Integration of an Activity-Based ModelSystem and a Residential Location Model. Urban Studies, Vol. 35,No. 7, 1998, pp. 1231–1253.
Bianco, M. J. Effective Transportation Demand Management: Com-bining Parking Pricing, Transit Incentives and TransportationManagement in a Mixed-Use District in Portland, Oregon. Pre-sented at 79th Annual Meeting of Transportation Research Board,Washington, D.C., 2000.
Center for Transit-Oriented Development. Hidden in Plain Sight: Cap-turing the Demand for Housing Near Transit. Oakland, California,September 2004.
Center for Transit-Oriented Development. Bringing TOD to Scale.http://www.reconnectingamerica.org/html/TOD/tod_to_scale.htm.September 30, 2005.
Cervero, R. Research Monograph 45: Ridership Impacts of Transit-FocusedDevelopment in California, Berkeley, Institute of Urban and RegionalDevelopment, 1994.
Cervero, R. TCRP Research Results Digest 4: Transit Ridership Initiative.Transportation Research Board, National Research Council,Washington, D.C., 1995.
Cervero, R. Mixed Land Uses and Commuting: Evidence from theAmerican Housing Survey, Transportation Research Part A, Vol. 30,No. 5, 1996, pp. 361–377.
Cervero, R., and Kockelman, K. Travel Demand and the 3Ds: Density,Design, and Diversity. Transportation Research D, Vol. 2, No. 3,1997, pp. 199–219.
Cervero, R. Ridership Impacts of Transit-Focused Development inCalifornia. Monograph 45, Institute of Urban and Regional Devel-opment, University of California, Berkeley, 2003.
Cevero, R. Transit Oriented Development’s Ridership Bonus: A Productof Self Selection and Public Policies. Environment and Planning A,Vol. 39, 2007, pp. 2068–2085.
Cervero, R. Built Environments and Mode Choice: Toward a Nor-mative Framework, Transportation Research D, Vol. 7, 2002,pp. 265–284.
Cervero, R., and Duncan, M. Residential Self-Selection and Rail Com-muting: A Nested Logit Analysis. Institute of Urban and RegionalDevelopment. Berkeley, California, 2002.
Cervero, R., et al. TCRP Report 102: Transit Oriented Development in theUnited States: Experiences, Challenges, and Prospects. Transporta-tion Research Board of the National Academies, Washington, D.C.,2004.
Cervero, R., Golub, A., and Nee, B. City CarShare: Longer-Term Travel-Demand and Car Ownership Impacts. In Transportation ResearchRecord: Journal of the Transportation Research Board, No. 1992.Transportation Research Board of the National Academies,Washingotn, D.C., 2007, pp. 70–80.
Cervero, R. Off-Line Modeling of Transportation and Land Use Futures.Department of City and Regional Planning. University of California,Berkeley, May 2005.
Chatman, D. How the Built Environment Influences Non-Work Travel:Theoretical and Empirical Essays. PhD dissertation. University ofCalifornia, Los Angeles, 2005.
Community Building Sourcebook, TriMet, Portland, OR (1999).Davis, M. A., and Palumbo, M. The Price of Residential Land in Large
U.S. Cities. Working paper No. 2006-26. June 2006. http://ssrn.com/abstract=943771.
Dill, J. Survey of Merrick TOD Residents. Portland State University,Oregon, March, 2005.
Dill, J. Travel and transit Use at Portland Area Transit-Oriented Devel-opments (TODs). Transportation Northwest (TransNow), Portland,Oregon, May 2006.
Dittmar, H. and Ohland, G. The New Transit Town: Best-Practices inTransit Oriented Development. Island Press, Washington, D.C., 2004.
Dueker, K., Strathman, J., and Bianco, M. TCRP Report 40: Strategies toAttract Auto Users to Public Transportation. TRB, National ResearchCouncil, Washington, D.C., 1998.
ECONorthwest. Peak and Off-Peak Frequencies, Out-of-Pocket Costs:A Framework for Developing and Evaluating Policies to InfluenceTransit Ridership and Urban Form. 1991.
References
Evans, J., and Stryker, A. TCRP Project B-12B - Technical Report 1. Un-published report. TCRP Transportation Research Board of theNational Academies, Washington, D.C., March, 2005.
Ewing, R., and Cervero, R. Travel and the Built Environment: A Syn-thesis. In Transportation Research Record: Journal of the Transporta-tion Research Board, No. 1780, TRB, National Research Council,Washington, D.C., 2001, pp. 87–114.
Ewing, R. Beyond Density, Mode Choice, and Single-Purpose Trips. Trans-portation Quarterly, Vol. 49, No. 4, Fall 1995.
Federal Transit Administration. FTA New Starts Workshop, San Jose,California, June 12, 2003.
Gossen, R. Travel Characteristics of TOD and Non-TOD Residents inthe San Francisco Bay Area: Evidence from the 2000 Bay Area TravelSurvey. Working Paper. Metropolitan Transportation Commission,Oakland, California, 2005.
Gragg, R. No Kids on the Block. The Oregonian Newspaper, July 7, 2005.JHK and Associates. Development-Related Survey II. Washington Met-
ropolitan Area Transit Authority, 1987 and 1989.Handy, S. Regional Versus Local Accessibility: Implications for Nonwork
Travel. In Transportation Research Record 1400, TRB, NationalResearch Council, Washington, D.C., 1993, pp. 58–66.
Holtzclaw, J., Clear, R., Dittmar, H., Goldstein, D., and Haas, P. LocationEfficiency: Neighborhood and Socio-Economic Characteristics De-termine Auto ownership and Use–Studies in Chicago, Los Angeles,and San Francisco. Transportation Planning and Technology,Vol. 25, 2002, pp. 1–27.
Lapham, M. Transit Oriented Development - Trip Generation and ModeSplit in the Portland Metropolitan Region. Portland State University,Oregon, March 2001.
Lee, R.W. Review of Literature on TOD Trip Generation Relevant toHacienda Business Park. Memorandum Presented to HaciendaBusiness Park Owners Association by Fehr & Peers. August 2004.
Lund, H. M., Cervero, R., and Willson, R. Travel Characteristics ofTransit-Focused Development in California. Oakland. Bay Area RapidTransit District and California Department of Transportation, 2004.
Metro, Travel Behavior/Activity Survey, 1994.Mildner, G., Strathman, J., and Bianco, M. Parking Policies and
Commuting Behavior. Transportation Quarterly, Vol. 51, No.1,pp. 111–125. Winter 1997.
New Urban News. “America Must Urbanize as the Population Ages.”January/February 2003. Accessed March 28, 2003. http://www.newurbannews.com/housingmarketing.html.
Parking Spaces/Community Places: Finding the Balance ThroughSmart Growth Solutions. U.S. Environmental Protection Agency,Washington, D.C., 2006.
Parsons Brinckerhoff. Factors for Success in California’s Transit-OrientedDevelopment. Sacramento: California Department of Transporta-tion, Statewide Transit-Oriented Development Study, 2002.
Parsons Brinckerhoff. Northwest Transit Corridor TOD implementationGuidebook. Northwest Municipal Conference, May 2003.
Parsons Brinckerhoff, J. Zupan, R. Cervero, and Stein-Hudson. TCRPReport 16: Transit and Urban Form. Transportation Research Board,National Research Council. Washington, D.C., 1996.
Peak and Off-Peak Fares: Effects of Fare Changes on Bus Ridership. APTA,Washington, D.C., 1991.
Podobnik, B. The Social and Environmental Achievements of NewUrbanism: Evidence from Orenco Station. Lewis and Clark College,Portland, Oregon, November 2002.
Pratt, R. H. TCRP Web Document 12: Traveler Response to Trans-portation System Changes. Transit Cooperative Research Pro-gram. Transportation Research Board. Washington, D.C. March,2000.
Renne, J. Evaluation of the New Jersey Transit Village Initiative ExecutiveSummary. Alan M. Voorhees Transportation Center, Edward J.Bloustein School of Planning and Public Policy, Rutgers University,New Brunswick, New Jersey, December 2003.
Renne, J. Transit Oriented Development: Measuring Benefits, AnalyzingTrends, and Evaluating Policy. Dissertation Submitted to GraduateProgram in Urban Planning and Policy Development, RutgersUniversity 2005.
Ross, C. L. and Dunning, A. E. Land Use Transportation Interaction: AnExamination of the 1995 NPTS Data. U.S. Department of Trans-portation Federal Highway Administration, October 1997.
Sastry, N., Ghosh-Dastidar, B., Adams, J., and Pebley, A. The Design ofa Multilevel Longitudinal Survey of Children, Families, and Com-munities: The Los Angeles Family and Neighborhood Survey. RAND,Santa Monica, California, 2000.
Shoup, D. The High Cost of Free Parking. Planners Press, Chicago, Ill.,2005.
Shoup, D. C. In Lieu of Required Parking. Journal of Planning Educa-tion and Research, Vol. 18, No. 4, 1999, pp. 307–320.
Shoup, D. Truth in Transportation Planning. Journal of Transportationand Statistics, Vol. 66, 2003, pp. 1–16.
Surface Transportation Policy Partnership. http://www.transact.org/Progress/jan01/table.htm.
Switzer, C. The Center Commons Transit Oriented Development: A CaseStudy. Master of Urban and Regional Planning Thesis, PortlandState University, Oregan, 2002.
Ten Principles for Successful Development Around Transit. Urban LandInstitute, Washington, D.C., 2003.
Thompson, G., and Matoff, T. Network Philosophy Affects Performanceof Transit Investments in U.S. Urban Areas. Presented at 8th JointConference on Light Rail Transit, Dallas, Texas, November 2000.
Trip Generation, 7th edition. Institution of Transportation Engineers,Washington, D.C., 2003.
Whoriskey, P. Tysons Project Adds Dimension to Rail Proposal.Washington Post, June 22, 2003.
Willson, R. Suburban Parking Requirements: A Tacit Policy for Auto-mobile Use and Sprawl. Journal of the American Planning Association,Vol. 61, No. 1, 1995, pp. 29–42.
58
Abbreviations and acronyms used without definitions in TRB publications:
AAAE American Association of Airport ExecutivesAASHO American Association of State Highway OfficialsAASHTO American Association of State Highway and Transportation OfficialsACI–NA Airports Council International–North AmericaACRP Airport Cooperative Research ProgramADA Americans with Disabilities ActAPTA American Public Transportation AssociationASCE American Society of Civil EngineersASME American Society of Mechanical EngineersASTM American Society for Testing and MaterialsATA Air Transport AssociationATA American Trucking AssociationsCTAA Community Transportation Association of AmericaCTBSSP Commercial Truck and Bus Safety Synthesis ProgramDHS Department of Homeland SecurityDOE Department of EnergyEPA Environmental Protection AgencyFAA Federal Aviation AdministrationFHWA Federal Highway AdministrationFMCSA Federal Motor Carrier Safety AdministrationFRA Federal Railroad AdministrationFTA Federal Transit AdministrationIEEE Institute of Electrical and Electronics EngineersISTEA Intermodal Surface Transportation Efficiency Act of 1991ITE Institute of Transportation EngineersNASA National Aeronautics and Space AdministrationNASAO National Association of State Aviation OfficialsNCFRP National Cooperative Freight Research ProgramNCHRP National Cooperative Highway Research ProgramNHTSA National Highway Traffic Safety AdministrationNTSB National Transportation Safety BoardSAE Society of Automotive EngineersSAFETEA-LU Safe, Accountable, Flexible, Efficient Transportation Equity Act: A Legacy for Users (2005)TCRP Transit Cooperative Research ProgramTEA-21 Transportation Equity Act for the 21st Century (1998)TRB Transportation Research BoardTSA Transportation Security AdministrationU.S.DOT United States Department of Transportation