Embed Size (px)
Citation preview
Transit Switch DesignAnalysis (Phase I)
TRANSIT COOPERATIVERESEARCHPROGRAMTCRP
REPORT 71,Volume 2
Sponsored by
the Federal
Transit Administration
TCRP OVERSIGHT AND PROJECTSELECTION COMMITTEE(as of October 2002)
CHAIRJ. BARRY BARKERTransit Authority of River City
MEMBERSDANNY ALVAREZ Miami-Dade Transit AgencyKAREN ANTIONKaren Antion ConsultingGORDON AOYAGIMontgomery County GovernmentJEAN PAUL BAILLYUnion Internationale des Transports PublicsRONALD L. BARNESCentral Ohio Transit AuthorityLINDA J. BOHLINGERHNTB Corp.ANDREW BONDS, JR.Parsons Transportation Group, Inc.JENNIFER L. DORNFTANATHANIEL P. FORD, SR.Metropolitan Atlanta RTACONSTANCE GARBERYork County Community Action Corp.FRED M. GILLIAMCapital Metropolitan Transportation AuthorityKIM R. GREENGFI GENFARESHARON GREENESharon Greene & AssociatesKATHERINE M. HUNTER-ZAWORSKIOregon State UniversityROBERT H. IRWINBritish Columbia TransitCELIA G. KUPERSMITHGolden Gate Bridge, Highway and
Transportation DistrictPAUL J. LARROUSSENational Transit Institute DAVID A. LEEConnecticut TransitCLARENCE W. MARSELLADenver Regional Transportation DistrictFAYE L. M. MOORESoutheastern Pennsylvania Transportation
AuthoritySTEPHANIE L. PINSONGilbert Tweed Associates, Inc.ROBERT H. PRINCE, JR.DMJM+HARRIS JEFFERY M. ROSENBERGAmalgamated Transit UnionRICHARD J. SIMONETTApbConsultPAUL P. SKOUTELAS Port Authority of Allegheny CountyLINDA S. WATSONCorpus Christi RTA
EX OFFICIO MEMBERSWILLIAM W. MILLARAPTAMARY E. PETERSFHWAJOHN C. HORSLEYAASHTOROBERT E. SKINNER, JR.TRB
TDC EXECUTIVE DIRECTORLOUIS F. SANDERSAPTA
SECRETARYROBERT J. REILLYTRB
TRANSPORTATION RESEARCH BOARD EXECUTIVE COMMITTEE 2003 (Membership as of March 2003)
OFFICERS
Chair: Genevieve Giuliano, Director and Prof., School of Policy, Planning, and Development, USC, Los AngelesVice Chair: Michael S. Townes, Exec. Dir., Transportation District Commission of Hampton Roads, Hampton, VAExecutive Director: Robert E. Skinner, Jr., Transportation Research Board
MEMBERS
MICHAEL W. BEHRENS, Executive Director, Texas DOTJOSEPH H. BOARDMAN, Commissioner, New York State DOTSARAH C. CAMPBELL, President, TransManagement, Inc., Washington, DCE. DEAN CARLSON, Secretary of Transportation, Kansas DOTJOANNE F. CASEY, President, Intermodal Association of North AmericaJAMES C. CODELL III, Secretary, Kentucky Transportation CabinetJOHN L. CRAIG, Director, Nebraska Department of RoadsBERNARD S. GROSECLOSE, JR., President and CEO, South Carolina State Ports AuthoritySUSAN HANSON, Landry University Prof. of Geography, Graduate School of Geography, Clark UniversityLESTER A. HOEL, L. A. Lacy Distinguished Professor, Depart. of Civil Engineering, University of VirginiaHENRY L. HUNGERBEELER, Director, Missouri DOTADIB K. KANAFANI, Cahill Prof. and Chair, Dept. of Civil and Environmental Engineering, University of
California at Berkeley RONALD F. KIRBY, Director of Transportation Planning, Metropolitan Washington Council of GovernmentsHERBERT S. LEVINSON, Principal, Herbert S. Levinson Transportation Consultant, New Haven, CTMICHAEL D. MEYER, Professor, School of Civil and Environmental Engineering, Georgia Institute of
TechnologyJEFF P. MORALES, Director of Transportation, California DOTKAM MOVASSAGHI, Secretary of Transportation, Louisiana Department of Transportation and DevelopmentCAROL A. MURRAY, Commissioner, New Hampshire DOTDAVID PLAVIN, President, Airports Council International, Washington, DC JOHN REBENSDORF, Vice Pres., Network and Service Planning, Union Pacific Railroad Co., Omaha, NECATHERINE L. ROSS, Executive Director, Georgia Regional Transportation AgencyJOHN M. SAMUELS, Sr. Vice Pres.-Operations Planning & Support, Norfolk Southern Corporation, Norfolk, VAPAUL P. SKOUTELAS, CEO, Port Authority of Allegheny County, Pittsburgh, PAMARTIN WACHS, Director, Institute of Transportation Studies, University of California at BerkeleyMICHAEL W. WICKHAM, Chairman and CEO, Roadway Express, Inc., Akron, OH
EX OFFICIO MEMBERS
MIKE ACOTT, President, National Asphalt Pavement Association MARION C. BLAKEY, Federal Aviation Administrator, U.S.DOT REBECCA M. BREWSTER, President and CEO, American Transportation Research Institute, Atlanta, GATHOMAS H. COLLINS (Adm., U.S. Coast Guard), Commandant, U.S. Coast Guard JENNIFER L. DORN, Federal Transit Administrator, U.S.DOT ELLEN G. ENGLEMAN, Research and Special Programs Administrator, U.S.DOT ROBERT B. FLOWERS (Lt. Gen., U.S. Army), Chief of Engineers and Commander, U.S. Army Corps of
EngineersHAROLD K. FORSEN, Foreign Secretary, National Academy of Engineering EDWARD R. HAMBERGER, President and CEO, Association of American Railroads JOHN C. HORSLEY, Exec. Dir., American Association of State Highway and Transportation Officials MICHAEL P. JACKSON, Deputy Secretary of Transportation, U.S.DOT ROGER L. KING, Chief Applications Technologist, National Aeronautics and Space AdministrationROBERT S. KIRK, Director, Office of Advanced Automotive Technologies, U.S. DOERICK KOWALEWSKI, Acting Director, Bureau of Transportation Statistics, U.S.DOTWILLIAM W. MILLAR, President, American Public Transportation Association MARY E. PETERS, Federal Highway Administrator, U.S.DOTSUZANNE RUDZINSKI, Director, Office of Transportation and Air Quality, U.S. EPAJEFFREY W. RUNGE, National Highway Traffic Safety Administrator, U.S.DOTALLAN RUTTER, Federal Railroad Administrator, U.S.DOTANNETTE M. SANDBERG, Deputy Administrator, Federal Motor Carrier Safety Administration, U.S.DOT WILLIAM G. SCHUBERT, Maritime Administrator, U.S.DOT
TRANSIT COOPERATIVE RESEARCH PROGRAM
Transportation Research Board Executive Committee Subcommittee for TCRPGENEVIEVE GIULIANO, University of Southern California, Los Angeles (Chair)E. DEAN CARLSON, Kansas DOTJENNIFER L. DORN, Federal Transit Administration, U.S.DOT LESTER A. HOEL, University of VirginiaWILLIAM W. MILLAR, American Public Transportation AssociationROBERT E. SKINNER, JR., Transportation Research BoardPAUL P. SKOUTELAS, Port Authority of Allegheny County, Pittsburgh, PAMICHAEL S. TOWNES, Transportation District Commission of Hampton Roads, Hampton, VA
T R A N S P O R T A T I O N R E S E A R C H B O A R DWASHINGTON, D.C.
2003www.TRB.org
T R A N S I T C O O P E R A T I V E R E S E A R C H P R O G R A M
TCRP REPORT 71, Volume 2
Research Sponsored by the Federal Transit Administration in Cooperation with the Transit Development Corporation
SUBJECT AREAS
Public Transit • Rail
Transit Switch DesignAnalysis (Phase 1)
SATYA P. SINGH
DAVID D. DAVIS
and
SEMIH KALAY
Transportation Technology Center, Inc.Pueblo, CO
TRANSIT COOPERATIVE RESEARCH PROGRAM
The nation’s growth and the need to meet mobility,environmental, and energy objectives place demands on publictransit systems. Current systems, some of which are old and in needof upgrading, must expand service area, increase service frequency,and improve efficiency to serve these demands. Research isnecessary to solve operating problems, to adapt appropriate newtechnologies from other industries, and to introduce innovations intothe transit industry. The Transit Cooperative Research Program(TCRP) serves as one of the principal means by which the transitindustry can develop innovative near-term solutions to meetdemands placed on it.
The need for TCRP was originally identified in TRB SpecialReport 213—Research for Public Transit: New Directions,published in 1987 and based on a study sponsored by the Urban MassTransportation Administration—now the Federal Transit Admin-istration (FTA). A report by the American Public TransportationAssociation (APTA), Transportation 2000, also recognized the needfor local, problem-solving research. TCRP, modeled after thelongstanding and successful National Cooperative HighwayResearch Program, undertakes research and other technical activitiesin response to the needs of transit service providers. The scope ofTCRP includes a variety of transit research fields including plan-ning, service configuration, equipment, facilities, operations, humanresources, maintenance, policy, and administrative practices.
TCRP was established under FTA sponsorship in July 1992.Proposed by the U.S. Department of Transportation, TCRP wasauthorized as part of the Intermodal Surface TransportationEfficiency Act of 1991 (ISTEA). On May 13, 1992, a memorandumagreement outlining TCRP operating procedures was executed bythe three cooperating organizations: FTA; the National Academies,acting through the Transportation Research Board (TRB); and the Transit Development Corporation, Inc. (TDC), a nonprofiteducational and research organization established by APTA.TDC is responsible for forming the independent governing board,designated as the TCRP Oversight and Project Selection (TOPS)Committee.
Research problem statements for TCRP are solicited periodicallybut may be submitted to TRB by anyone at any time. It is theresponsibility of the TOPS Committee to formulate the researchprogram by identifying the highest priority projects. As part of theevaluation, the TOPS Committee defines funding levels andexpected products.
Once selected, each project is assigned to an expert panel,appointed by the Transportation Research Board. The panels prepareproject statements (requests for proposals), select contractors, andprovide technical guidance and counsel throughout the life of theproject. The process for developing research problem statements andselecting research agencies has been used by TRB in managingcooperative research programs since 1962. As in other TRB activ-ities, TCRP project panels serve voluntarily without compensation.
Because research cannot have the desired impact if products failto reach the intended audience, special emphasis is placed ondisseminating TCRP results to the intended end users of theresearch: transit agencies, service providers, and suppliers. TRBprovides a series of research reports, syntheses of transit practice,and other supporting material developed by TCRP research. APTAwill arrange for workshops, training aids, field visits, and otheractivities to ensure that results are implemented by urban and ruraltransit industry practitioners.
The TCRP provides a forum where transit agencies cancooperatively address common operational problems. The TCRPresults support and complement other ongoing transit research andtraining programs.
TCRP REPORT 71, Volume 2
Project D-07(2) FY’99ISSN 1073-4872ISBN 0-309-06701-3Library of Congress Control Number 2001135523
© 2003 Transportation Research Board
Price $18.00
NOTICE
The project that is the subject of this report was a part of the Transit CooperativeResearch Program conducted by the Transportation Research Board with theapproval of the Governing Board of the National Research Council. Suchapproval reflects the Governing Board’s judgment that the project concerned isappropriate with respect to both the purposes and resources of the NationalResearch Council.
The members of the technical advisory panel selected to monitor this project andto review this report were chosen for recognized scholarly competence and withdue consideration for the balance of disciplines appropriate to the project. Theopinions and conclusions expressed or implied are those of the research agencythat performed the research, and while they have been accepted as appropriateby the technical panel, they are not necessarily those of the TransportationResearch Board, the National Research Council, the Transit DevelopmentCorporation, or the Federal Transit Administration of the U.S. Department ofTransportation.
Each report is reviewed and accepted for publication by the technical panelaccording to procedures established and monitored by the TransportationResearch Board Executive Committee and the Governing Board of the NationalResearch Council.
Special Notice
The Transportation Research Board, the National Research Council, the TransitDevelopment Corporation, and the Federal Transit Administration (sponsor ofthe Transit Cooperative Research Program) do not endorse products ormanufacturers. Trade or manufacturers’ names appear herein solely because theyare considered essential to the clarity and completeness of the project reporting.
Published reports of the
TRANSIT COOPERATIVE RESEARCH PROGRAM
are available from:
Transportation Research BoardBusiness Office500 Fifth Street, NWWashington, DC 20001
and can be ordered through the Internet athttp://www.national-academies.org/trb/bookstore
Printed in the United States of America
The National Academy of Sciences is a private, nonprofit, self-perpetuating society of distinguished schol-ars engaged in scientific and engineering research, dedicated to the furtherance of science and technology and to their use for the general welfare. On the authority of the charter granted to it by the Congress in 1863, the Academy has a mandate that requires it to advise the federal government on scientific and techni-cal matters. Dr. Bruce M. Alberts is president of the National Academy of Sciences.
The National Academy of Engineering was established in 1964, under the charter of the National Acad-emy of Sciences, as a parallel organization of outstanding engineers. It is autonomous in its administration and in the selection of its members, sharing with the National Academy of Sciences the responsibility for advising the federal government. The National Academy of Engineering also sponsors engineering programs aimed at meeting national needs, encourages education and research, and recognizes the superior achieve-ments of engineers. Dr. William A. Wulf is president of the National Academy of Engineering.
The Institute of Medicine was established in 1970 by the National Academy of Sciences to secure the services of eminent members of appropriate professions in the examination of policy matters pertaining to the health of the public. The Institute acts under the responsibility given to the National Academy of Sciences by its congressional charter to be an adviser to the federal government and, on its own initiative, to identify issues of medical care, research, and education. Dr. Harvey V. Fineberg is president of the Institute of Medicine.
The National Research Council was organized by the National Academy of Sciences in 1916 to associate the broad community of science and technology with the Academy’s purposes of furthering knowledge and advising the federal government. Functioning in accordance with general policies determined by the Acad-emy, the Council has become the principal operating agency of both the National Academy of Sciences and the National Academy of Engineering in providing services to the government, the public, and the scientific and engineering communities. The Council is administered jointly by both the Academies and the Institute of Medicine. Dr. Bruce M. Alberts and Dr. William A. Wulf are chair and vice chair, respectively, of the National Research Council.
The Transportation Research Board is a division of the National Research Council, which serves the National Academy of Sciences and the National Academy of Engineering. The Board’s mission is to promote innovation and progress in transportation by stimulating and conducting research, facilitating the dissemination of information, and encouraging the implementation of research results. The Board’s varied activities annually engage more than 4,000 engineers, scientists, and other transportation researchers and practitioners from the public and private sectors and academia, all of whom contribute their expertise in the public interest. The program is supported by state transportation departments, federal agencies including the component administrations of the U.S. Department of Transportation, and other organizations and individuals interested in the development of transportation. www.TRB.org
www.national-academies.org
COOPERATIVE RESEARCH PROGRAMS STAFF
ROBERT J. REILLY, Director, Cooperative Research ProgramsCHRISTOPHER W. JENKS, TCRP ManagerEILEEN P. DELANEY, Managing EditorHILARY FREER, Associate Editor II
PROJECT PANEL D-07(2)Field of Engineering of Fixed Facilities
ANTHONY BOHARA, Southeastern Pennsylvania Transportation Authority (Chair)STELIAN CANJEA, New Jersey Transit CorporationLANCE G. COOPER, Olney, MDEARLE M. HUGHES, Gannett Fleming Transit & Rail Systems, Audubon, PAJAMES NELSON, Wilson, Ihrig & Associates, Inc., Oakland, CAJOSEPH A. ORIOLO, Massachusetts Bay Transportation AuthorityFREDERICK E. SMITH, Metropolitan Transportation Authority—New York City TransitCHARLES L. STANFORD, Houston, TXJEFFREY G. MORA, FTA Liaison RepresentativeLOUIS F. SANDERS, APTA Liaison RepresentativeGUNARS SPONS, FRA Liaison RepresentativeELAINE KING, TRB Liaison Representative
FOREWORDBy Christopher W. Jenks
Staff OfficerTransportation Research
Board
This report presents the results of a research task carried out under TCRP ProjectD-7, Joint Rail Transit-Related Research with the Association of American Rail-roads/Transportation Technology Center, Inc., Transit Switch Design Analysis(Phase I). Under this task, a new switch design concept for transit was developed. Aprototype of the switch will be produced and tested in Phase II of the effort. This reportshould be of interest to engineers responsible for design, construction, maintenance,and operation of rail transit systems.
Over the years, a number of track-related research problem statements have beensubmitted for consideration in the TCRP project-selection process. In many instances,the research requested has been similar to research currently being performed for theFederal Railroad Administration (FRA) and the freight railroads by the Association ofAmerican Railroads’ (AAR) Transportation Technology Center, Inc. (TTCI) in Pueblo,Colorado. Transit track, signal, and rail vehicle experts reviewed the research beingconducted by TTCI. Based on this effort, several research topics were identified whereTCRP funding could be used to take advantage of research currently being performedat the TTCI for the benefit of the transit industry. A final report on one of these effortsis presented in this publication.
Transit Switch Design Analysis (Phase I)
Transit switch designs in the early 1900s were quite sophisticated by today’s stan-dards. These switches gave excellent service for many years, often outliving the lowercost but simpler replacement designs that followed. Many of the earlier designs becameobsolete because most were unique to a particular transit system, and in some cases,casting patterns are no longer available.
At a number of transit systems, it has been observed that often the best-performing switches on their systems were the oldest switches. The original switchesoften had service lives of 50 years or more and often outlive replacement switchesby 100 to 1,000%.
In this project, TTCI modeled the performance of trains operating over an older,tangential design spiraled geometry Number 8 turnout, an AREMA Number 8 lateralturnout with a curved switch design, and several variations of these two designs. Thestudy was designed to determine the switch characteristics that contribute to the goodperformance and long life of the older switches. Based on this evaluation, a switchdesign encompassing these characteristics was developed. A prototype of this designwill be produced and field tested in Phase II of the project.
CONTENTS 1 SUMMARY
4 CHAPTER 1 Introduction1.1 SEPTA Switch Inspection, 41.2 Wheel Inspection, 7
8 CHAPTER 2 NUCARSTM Model Development2.1 Vehicle Model, 8 2.2 Track Models, 8
2.2.1 SEPTA Turnout, 92.2.2 AREMA Replacement Turnout, 9
2.3 Wheel/Rail Contact Model, 92.3.1 SEPTA Turnout, 102.3.2 AREMA Turnout, 10
11 CHAPTER 3 Parametric Study of Switch/Turnout Design Features3.1 Lateral Loads, 113.2 Accelerations, 163.3 Other Parameters, 16
3.3.1 Wheel Vertical Loads, 163.3.2 Car Body and Bolster Accelerations, 263.3.3 Wheel and Axle L/V Ratios, 26
3.4 Wear Indices, 37
38 CHAPTER 4 Findings and Conclusions
40 REFERENCES
CONTENTS
Transportation Technology Center, Inc. (TTCI), a wholly owned subsidiary of theAssociation of American Railroads (AAR), modeled the performance of SoutheasternPennsylvania Transportation Authority (SEPTA) B-IV cars operating over a SEPTAtangential design spiraled geometry Number 8 lateral turnout, an American RailwayEngineering Maintenance-of-Way Association (AREMA) Number 8 lateral turnoutwith a 13-ft curved switch design, and several variations of these two designs. Thestudy was designed to determine which switch design features contribute to the goodperformance and long service life of the SEPTA switches. These design elements willbe applied to current switch design to develop a low-cost, high-performance switch forfuture use.
No discussion of switch geometry is complete without the rest of the turnout. Theselection of switch geometry affects the turnout closure curve alignment. The relativelengths of the SEPTA car versus the switch and turnout make inclusion of the entireturnout essential to the study. The switch is 13 ft long with the lead length of the num-ber 8 turnout being 57 ft. The B-IV car is 68 ft long with the truck spacing producinga 48-ft wheelbase. Thus, when the trailing truck of the car is moving through the switch,the lead truck is moving through the frog. Thus, the track modeled included the entireturnout with track beyond the frog being tangent at the frog angle. To reflect the actualanalysis done, the term “turnout” is used in the report, even though the focus of thestudy is clearly on the switch design. In most of the scenarios modeled, the switch pro-duced the maximum forces or accelerations. However, in some operating scenarios, theturnout closure curve alignment may generate the maximum forces or accelerations.
The as-built SEPTA tangential design spiraled geometry Number 8 lateral turnoutperforms well in comparison with the per-plan AREMA Number 8 secant, circulargeometry switch turnout. In its intended service of 5- to 15-mph operation, the switchis superior to the AREMA switch in minimizing loads and accelerations. However, theSEPTA switch turnout does show higher than desired accelerations under B-IV caroperations. This may cause ride quality concerns at higher speeds.
Parametric studies of some design features were conducted to determine their effectson switch performance. Tangential switch entry is essential to the good performance ofthe SEPTA switch. Elimination of a kink angle and its resultant abrupt spike in dynamic
SUMMARY
TRANSIT SWITCH DESIGN ANALYSIS (PHASE I)
loading produce a smooth ride and more even switch wear. The spiral switch entry andexit curves are effective at smoothing the ride through the switch, minimizing jerk byevening out the change in accelerations. However, the very small radius of closurecurve may adversely affect ride quality for certain types of equipment (i.e., longer cars)or service (higher speeds).
The advantages of the SEPTA switch turnout are not fully realized because of thelonger length of the B-IV cars. The extremely short radius closure curves of the turnoutcause the cars to “stringline,” creating relatively high lateral forces. These forcesincrease rapidly with speed. The AREMA designs, with their larger radius closurecurves, better accommodate the longer cars at higher speeds.
The use of Austenitic Manganese Steel (AMS) castings for the switch points in theSEPTA switch produces a tough, durable switch point. When introduced, the AMSpoint was vastly superior to rail steels of the time. However, modern rail steels performas well as AMS in curve wear. The layout of current switches, with good geometry andguardrails, make the advantages of AMS almost redundant. The high cost of fabricat-ing AMS switch points makes it an uneconomic choice for modern switches.
The housed switch point is a feature that provides benefits for switches with signif-icant diverging traffic. The switch point is thickened to make it more robust and dimin-ish the risk of split switch derailments. The stock rail is diminished to accomplish this,which may result in a foreshortened life for this component. A housing would help toeliminate the sharp dynamic loading and localized wear at the point of switch on AREMAswitches seen in the field, as well as those seen in NUCARS™ simulations done forthis study. The running surface discontinuity at the point of switch seen at the gage faceis especially important if guardrails are not used in the switch.
Guardrails in the switch are needed for safety reasons. The guardrails ensure that a safeoperation is maintained as the switch wears and deforms. The guardrail and back of wheelflange contact are nearly vertical, even on worn components. Thus, wheel climb is lesslikely than with worn wheel flange/switch point contact. As for switch performance, thedynamic loads in the switch are little changed. Switch point life is improved by transfer-ring wear from switch point to guard rail.
Use of guardrails in front of the switch protects the switch points from impacts. Thegood switch geometry and housed point design of the SEPTA switch diminishes theeffectiveness of the guardrails.
Separating the point of switch from the point of curvature (or point of spiral in thecase of the SEPTA switch), where the point of curvature comes first, is good for rela-tively low-speed mainline operations. The mainline trains have to negotiate a smallcurve as a penalty for making the diverging route curve somewhat larger. This designis a compromise between a lateral switch and an equilateral switch, but is biased heav-ily toward a lateral switch configuration. This also helps the curved switch point at theexpense of the straight switch point by lining up wheels for the diverging route curveprior to the switch point. This contributes to the good wear performance of the SEPTAswitches.
The NUCARS™ simulations suggest that the best replacement for the SEPTA Num-ber 8 spiral switch turnout would be a modified AREMA Number 8 turnout with ahoused switch point, a tangential entry to the switch, a switch rail with a radius of 372 ft, and the closure rail of the same radius as the switch rail. The lead length of thisturnout is 59 ft, but the frog is larger than a Number 8. This turnout produces smoothsteering of B-IV cars for both the facing point and trailing point runs. Wheel lateralloads are comparable to the SEPTA turnout at low speeds and are lower at higherspeeds. Unlike the SEPTA turnout, the increase in lateral loads is quite gradual—from5 to 25 mph. This change in the maximum wheel lateral loads from 5 mph to 25 mph
2
3
is less than 20%. The improved ride quality for this replacement turnout is also evidentfrom smaller car body lateral and yaw accelerations, reduced axle lateral and yawaccelerations, lesser vertical unloading and loading of the wheels, and lower L/V ratios.Further, the improved ride quality gives tread and flange wear indices that are gener-ally uniform through the turnout curvature, thereby indicating even wear and probablya longer life for this replacement option.
Phase II of this project will develop a replacement switch for the SEPTA spiraldesign. The aforementioned modified AREMA switch will serve as the starting pointfor this design.
4
CHAPTER 1
INTRODUCTION
Transit switch designs in the early 1900s were quite sophis-ticated by today’s standards, with features that have been redis-covered and are being implemented in modern high-speedswitch designs. These switches gave excellent service formany years, often outliving the lower cost but simpler replace-ment designs that followed. Many of the designs becameobsolete because most were unique to a particular transitcompany and, in some cases, casting patterns were no longeravailable.
TCRP members observed that often the best performingswitches on their systems were the oldest switches. The orig-inal tangential and spiral geometry switches often had servicelives of 50 years or more. Additionally, these switches wouldoutlive their replacement designs by 100 to 1,000%.
The switches produced in the 1900s share some or all ofthe following features:
• Tangential geometry (no entry kink angle);• Spiral geometry (variable switch curvature);• Housed switch points;• Austenitic Manganese Steel (AMS) switch points and
stock rails;• Guard rails in front of the switch; and• Guard rails in the switch.
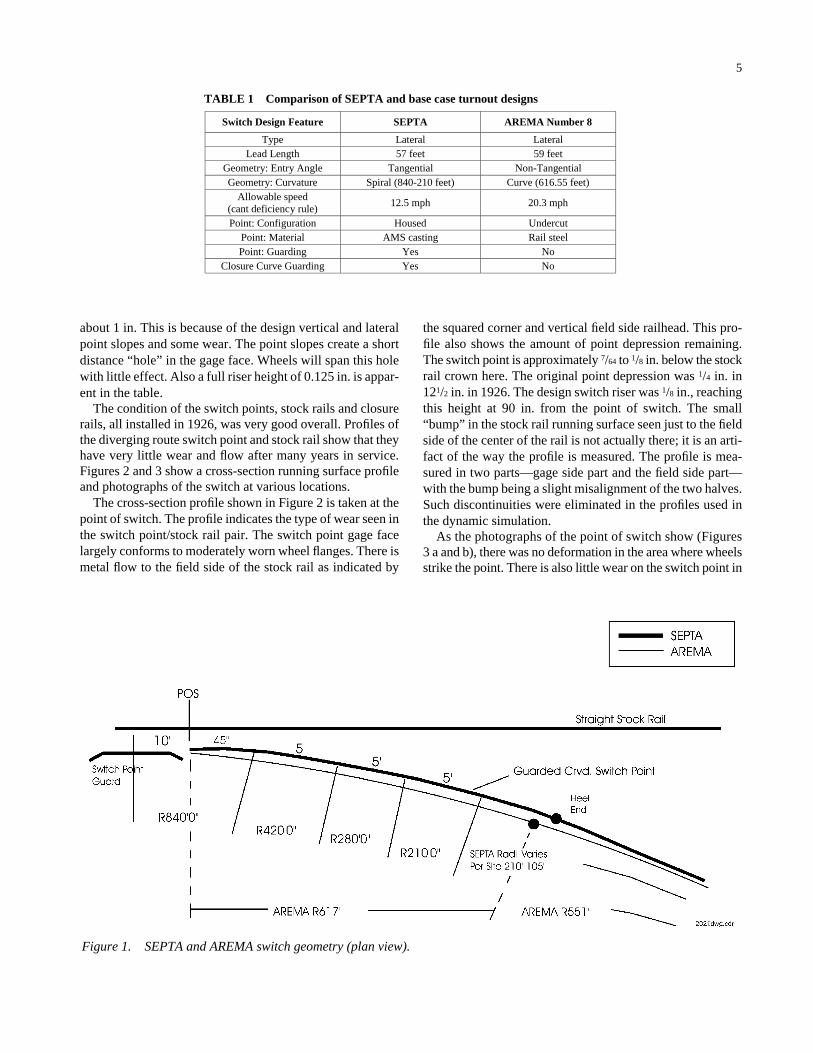
The Switch Design Evaluation Technical Advisory Group(TAG) selected a design used by the Southeastern Pennsyl-vania Transit Authority (SEPTA) as a representative of agood performance switch design. Table 1 lists the features ofthe SEPTA spiral switch turnout compared with an Ameri-can Railway Engineering Maintenance of Way Association(AREMA) Number 8 lateral switch turnout. The objectivesof the two switch designs are clearly different. The SEPTAswitch turnout is built for ride quality with smoothed transi-tions and spiral curves to minimize the rate of change of accel-erations. The AREMA switch turnout is built for economy,speed, and component durability. By having a large kink(entry) angle and large radius closure curve, the designgeometry of the AREMA switch turnout maximizes allow-able speed under the “cant deficiency” rule—the Federal Rail-road Administration’s (FRA) rule for speed in curves. TheSEPTA switch turnout designers were not subject to this rule;
thus minimum switch closure curve radius and maximumcant deficiency were not important issues for them.
Figure 1 compares the layouts of the SEPTA and theAREMA switches. The geometry and alignment differencescan be seen from this plot. The SEPTA switch spiral geom-etry produces a lower entry angle for facing point and a lowerexit angle for trailing point movements.
1.1 SEPTA SWITCH INSPECTION
On May 23, 2000, Transportation Technology Center, Inc.(TTCI) and SEPTA track engineering personnel inspected aSEPTA spiral geometry switch at Erie Avenue on the BroadStreet Subway line based in Philadelphia, Pennsylvania. Theswitch was measured for gage, cross level, and running sur-face profiles to be used in the switch design modeling effort.A total of 25 profiles were measured through the divergingroute of the switch and were used to develop the vehicle trackdynamics model of the switch. An accurate representation ofthe track running surface is essential in the simulation. Pro-files were measured at 24-in. intervals throughout the diverg-ing route switch point. Additional measurements were madefor 10 ft in front of the switch point. Profile measurementspacing was reduced to 6 in. in the critical point of switcharea where running surface changes are more abrupt. Nearthe point of switch, the profile included the stock rail runningsurface as well.
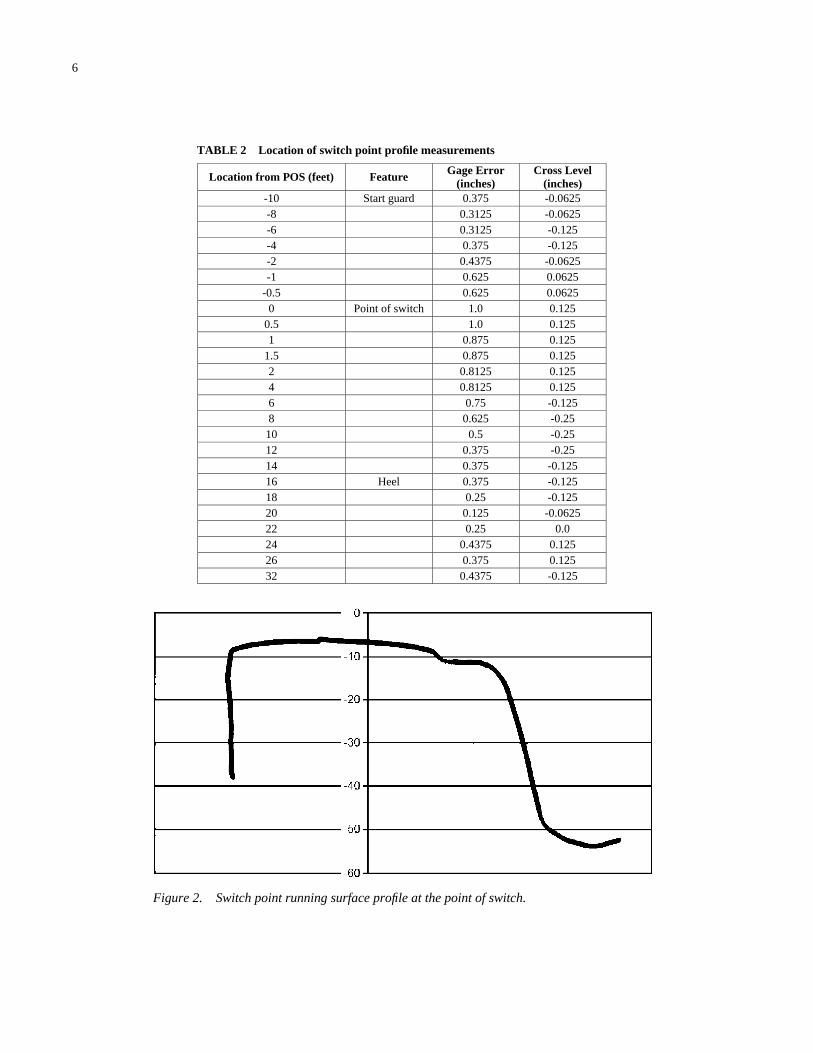
Table 2 lists the locations of the measurements, as well asthe corresponding gage error and cross level. The gage erroras listed is defined as the difference between the left rail lat-eral perturbation and right rail lateral perturbation. A plus(+) value indicates a wide gage, while a minus (−) valueindicates a tight gage. Similarly, cross level is defined as thedifference between the left rail vertical perturbation and theright rail vertical perturbation. The signs of cross levelsgiven in the table are for the facing point runs such that aplus value indicates that the left rail is higher and a minusvalues indicates that the right rail is higher. The signs for thetrailing point runs will be opposite to those shown in thetable. As can be seen, a wide gage exists all through theturnout. Gage error is greatest near the point of switch at
about 1 in. This is because of the design vertical and lateralpoint slopes and some wear. The point slopes create a shortdistance “hole” in the gage face. Wheels will span this holewith little effect. Also a full riser height of 0.125 in. is appar-ent in the table.
The condition of the switch points, stock rails and closurerails, all installed in 1926, was very good overall. Profiles ofthe diverging route switch point and stock rail show that theyhave very little wear and flow after many years in service.Figures 2 and 3 show a cross-section running surface profileand photographs of the switch at various locations.
The cross-section profile shown in Figure 2 is taken at thepoint of switch. The profile indicates the type of wear seen inthe switch point/stock rail pair. The switch point gage facelargely conforms to moderately worn wheel flanges. There ismetal flow to the field side of the stock rail as indicated by
5
the squared corner and vertical field side railhead. This pro-file also shows the amount of point depression remaining.The switch point is approximately 7/64 to 1/8 in. below the stockrail crown here. The original point depression was 1/4 in. in121/2 in. in 1926. The design switch riser was 1/8 in., reachingthis height at 90 in. from the point of switch. The small“bump” in the stock rail running surface seen just to the fieldside of the center of the rail is not actually there; it is an arti-fact of the way the profile is measured. The profile is mea-sured in two parts—gage side part and the field side part—with the bump being a slight misalignment of the two halves.Such discontinuities were eliminated in the profiles used inthe dynamic simulation.
As the photographs of the point of switch show (Figures3 a and b), there was no deformation in the area where wheelsstrike the point. There is also little wear on the switch point in
TABLE 1 Comparison of SEPTA and base case turnout designs
Switch Design Feature SEPTA AREMA Number 8
Type Lateral Lateral Lead Length 57 feet 59 feet
Geometry: Entry Angle Tangential Non-Tangential Geometry: Curvature Spiral (840-210 feet) Curve (616.55 feet)
Allowable speed (cant deficiency rule)
12.5 mph 20.3 mph
Point: Configuration Housed Undercut Point: Material AMS casting Rail steel Point: Guarding Yes No
Closure Curve Guarding Yes No
Figure 1. SEPTA and AREMA switch geometry (plan view).
6
TABLE 2 Location of switch point profile measurements
Location from POS (feet) Feature Gage Error (inches)
Cross Level (inches)
-10 Start guard 0.375 -0.0625 -8 0.3125 -0.0625 -6 0.3125 -0.125 -4 0.375 -0.125 -2 0.4375 -0.0625 -1 0.625 0.0625
-0.5 0.625 0.0625 0 Point of switch 1.0 0.125
0.5 1.0 0.125 1 0.875 0.125
1.5 0.875 0.125 2 0.8125 0.125 4 0.8125 0.125 6 0.75 -0.125 8 0.625 -0.25 10 0.5 -0.25 12 0.375 -0.25 14 0.375 -0.125 16 Heel 0.375 -0.125 18 0.25 -0.125 20 0.125 -0.0625 22 0.25 0.0 24 0.4375 0.125 26 0.375 0.125 32 0.4375 -0.125
Figure 2. Switch point running surface profile at the point of switch.
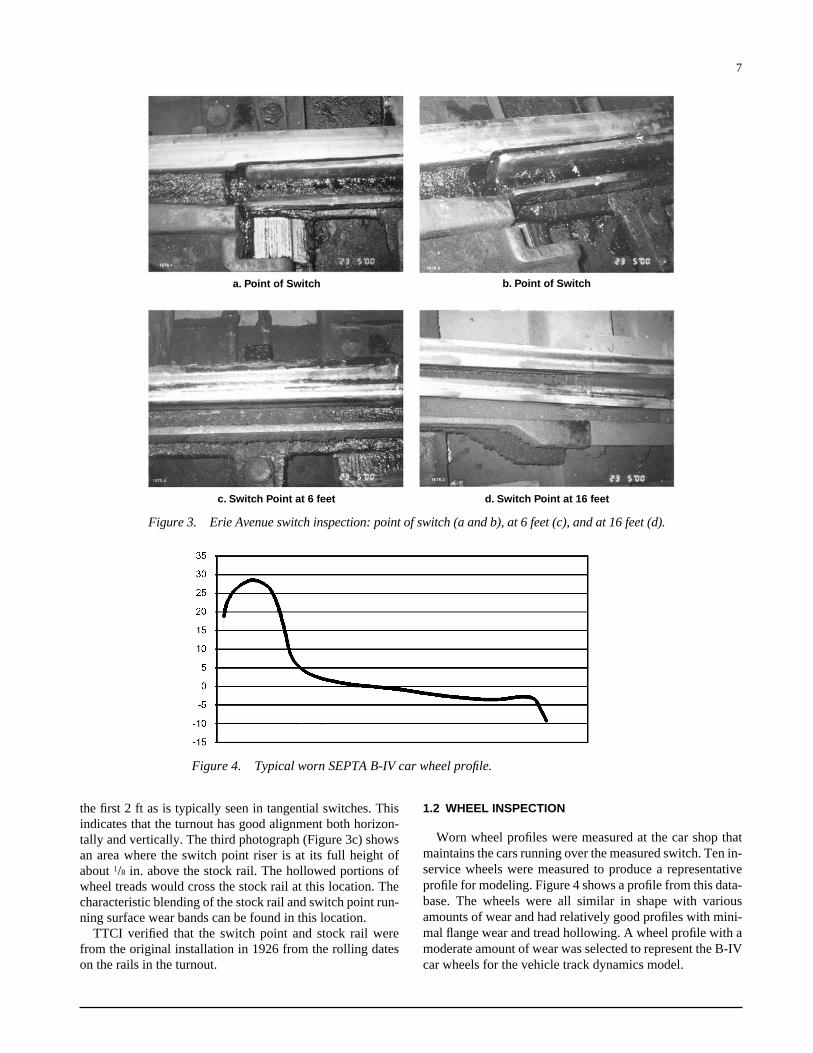
the first 2 ft as is typically seen in tangential switches. Thisindicates that the turnout has good alignment both horizon-tally and vertically. The third photograph (Figure 3c) showsan area where the switch point riser is at its full height ofabout 1/8 in. above the stock rail. The hollowed portions ofwheel treads would cross the stock rail at this location. Thecharacteristic blending of the stock rail and switch point run-ning surface wear bands can be found in this location.
TTCI verified that the switch point and stock rail werefrom the original installation in 1926 from the rolling dateson the rails in the turnout.
7
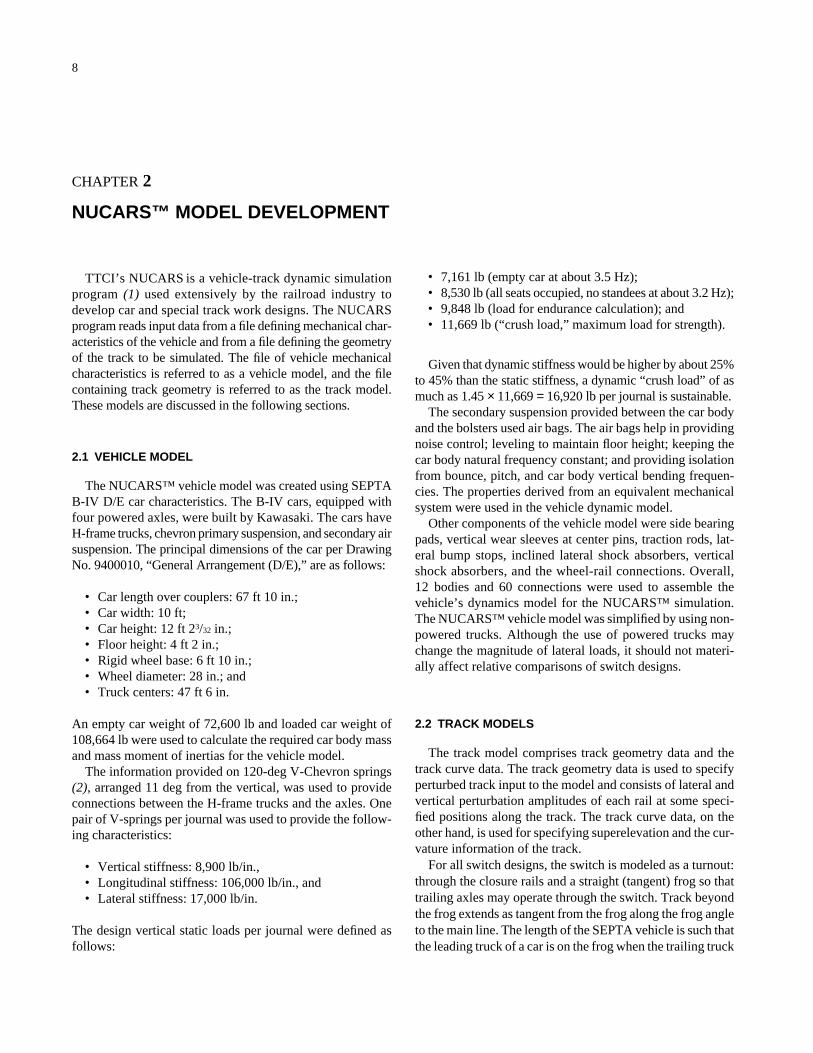
1.2 WHEEL INSPECTION
Worn wheel profiles were measured at the car shop thatmaintains the cars running over the measured switch. Ten in-service wheels were measured to produce a representativeprofile for modeling. Figure 4 shows a profile from this data-base. The wheels were all similar in shape with variousamounts of wear and had relatively good profiles with mini-mal flange wear and tread hollowing. A wheel profile with amoderate amount of wear was selected to represent the B-IVcar wheels for the vehicle track dynamics model.
Figure 4. Typical worn SEPTA B-IV car wheel profile.
a. Point of Switch b. Point of Switch
c. Switch Point at 6 feet d. Switch Point at 16 feet
Figure 3. Erie Avenue switch inspection: point of switch (a and b), at 6 feet (c), and at 16 feet (d).
8
CHAPTER 2
NUCARS™ MODEL DEVELOPMENT
TTCI’s NUCARS is a vehicle-track dynamic simulationprogram (1) used extensively by the railroad industry todevelop car and special track work designs. The NUCARSprogram reads input data from a file defining mechanical char-acteristics of the vehicle and from a file defining the geometryof the track to be simulated. The file of vehicle mechanicalcharacteristics is referred to as a vehicle model, and the filecontaining track geometry is referred to as the track model.These models are discussed in the following sections.
2.1 VEHICLE MODEL
The NUCARS™ vehicle model was created using SEPTAB-IV D/E car characteristics. The B-IV cars, equipped withfour powered axles, were built by Kawasaki. The cars haveH-frame trucks, chevron primary suspension, and secondary airsuspension. The principal dimensions of the car per DrawingNo. 9400010, “General Arrangement (D/E),” are as follows:
• Car length over couplers: 67 ft 10 in.;• Car width: 10 ft;• Car height: 12 ft 23/32 in.;• Floor height: 4 ft 2 in.;• Rigid wheel base: 6 ft 10 in.;• Wheel diameter: 28 in.; and• Truck centers: 47 ft 6 in.
An empty car weight of 72,600 lb and loaded car weight of108,664 lb were used to calculate the required car body massand mass moment of inertias for the vehicle model.
The information provided on 120-deg V-Chevron springs(2), arranged 11 deg from the vertical, was used to provideconnections between the H-frame trucks and the axles. Onepair of V-springs per journal was used to provide the follow-ing characteristics:
• Vertical stiffness: 8,900 lb/in.,• Longitudinal stiffness: 106,000 lb/in., and• Lateral stiffness: 17,000 lb/in.
The design vertical static loads per journal were defined asfollows:
• 7,161 lb (empty car at about 3.5 Hz);• 8,530 lb (all seats occupied, no standees at about 3.2 Hz);• 9,848 lb (load for endurance calculation); and• 11,669 lb (“crush load,” maximum load for strength).
Given that dynamic stiffness would be higher by about 25%to 45% than the static stiffness, a dynamic “crush load” of asmuch as 1.45 × 11,669 = 16,920 lb per journal is sustainable.
The secondary suspension provided between the car bodyand the bolsters used air bags. The air bags help in providingnoise control; leveling to maintain floor height; keeping thecar body natural frequency constant; and providing isolationfrom bounce, pitch, and car body vertical bending frequen-cies. The properties derived from an equivalent mechanicalsystem were used in the vehicle dynamic model.
Other components of the vehicle model were side bearingpads, vertical wear sleeves at center pins, traction rods, lat-eral bump stops, inclined lateral shock absorbers, verticalshock absorbers, and the wheel-rail connections. Overall,12 bodies and 60 connections were used to assemble thevehicle’s dynamics model for the NUCARS™ simulation.The NUCARS™ vehicle model was simplified by using non-powered trucks. Although the use of powered trucks maychange the magnitude of lateral loads, it should not materi-ally affect relative comparisons of switch designs.
2.2 TRACK MODELS
The track model comprises track geometry data and thetrack curve data. The track geometry data is used to specifyperturbed track input to the model and consists of lateral andvertical perturbation amplitudes of each rail at some speci-fied positions along the track. The track curve data, on theother hand, is used for specifying superelevation and the cur-vature information of the track.
For all switch designs, the switch is modeled as a turnout:through the closure rails and a straight (tangent) frog so thattrailing axles may operate through the switch. Track beyondthe frog extends as tangent from the frog along the frog angleto the main line. The length of the SEPTA vehicle is such thatthe leading truck of a car is on the frog when the trailing truck
9
is on the switch. This track configuration, essentially a turnoutwith a moveable point frog, allows full analysis of vehicleperformance on the switch while minimizing the effects ofthe frog or track layout beyond the frog.
Thus, all simulations were done using this type of turnoutmodel to analyze the effects of switch design features. Theterm “turnout” will be used to describe the track models ana-lyzed in the report.
2.2.1 SEPTA Turnout
The SEPTA tangential design spiraled geometry switch isin a Number 8 lateral turnout. It has a spiral geometry (840 ftto 210 ft). The alignment, gage, cross level, and vertical pro-file in NUCARS™ were modeled according to inspectionmeasurements made by TTCI personnel. The track curvatureinformation was used from Drawing No. V-97163 and Draw-ing No. 7-W-16984, both provided by SEPTA (3, 4). Trackmodels for both the facing point diverging right and trailingpoint diverging left moves were made. This case is desig-nated as “SEPTA As-is.”
A variation of the SEPTA switch with a nontangentialgeometry was also developed to simulate conditions some-what similar to the AREMA design. This was done by intro-ducing an entry (kink) angle in the track curve data. Intro-duction of an entry angle equal in magnitude to that of theAREMA design entailed changing the SEPTA switch turnoutcurvature geometry substantially. This option on the equalityof entry angle magnitudes was therefore abandoned. Instead,it was decided that a change should only be made in the840-ft-radius arc and that the rest of the switch curvature datashould not be changed. Drawing No. V-97163 shows that thepoint of switch is 6 ft from the beginning of the 10-ft-long 840-ft-radius arc when looking in the facing point direction. A kinkangle having a magnitude of 8′11″ (0.1364 deg) was introducedat the point of switch. The radius of the remaining 840-ft arc,following the point of switch, was then changed to 1680 ft. Therest of the original curve data was used. In this manner, thelead length equal to that of the SEPTA As-is turnout was main-tained. This case is designated as “SEPTA-Kink.”
2.2.2 AREMA Replacement Turnout
The comparison switch used for the design analysis is thenontangential, AREMA Number 8 lateral turnout with curvedsplit switch and uniform risers (5). The length of the switchrail is 13 ft with a switch radius of 616.55 ft correspondingto Point Detail No. 5100 per Portfolio of Trackwork Plans ofAREMA. The top cut is 6 ft and the full riser height is 1/4 in.The angle at point (entry angle or kink angle) is 1 deg, 41min., 31 sec. (1.692 deg). The curved closure rail is 41.05 ft
long and has a radius of curvature of 550.75 ft. The actuallead, equal to the distance between the point of switch and1/2-in. point of frog, is 58 ft, 111/8 in.
The track geometry data and the track curve data weremodeled as they would be for a new AREMA Number 8turnout. This case is designated as “AREMA As-is.” Trackmodels for both the facing-point diverging-right and trailing-point diverging-left moves were made.
Again, to identify and evaluate the performance due tochanges in the design features, four different variations of theAREMA Number 8 turnout were developed to compare theirperformance with the SEPTA switch. These four variationsare as follows:
• Tangential AREMA Number 8 turnout (without entryangle) designated as “AREMA-Case 1.”
• Tangential AREMA Number 8 turnout with switch andcurved closure rail radii of 372 ft to give a lead lengthequal to that of the AREMA As-is turnout. This case isdesignated as “AREMA-Case 2.”
• Tangential AREMA Number 8 turnout with curved clo-sure rail of same radius as switch rail radius designatedas “AREMA-Case 3.”
• Nontangential AREMA Number 8 turnout with curvedclosure rail of same radius as switch radius designatedas “AREMA-Case 4.”
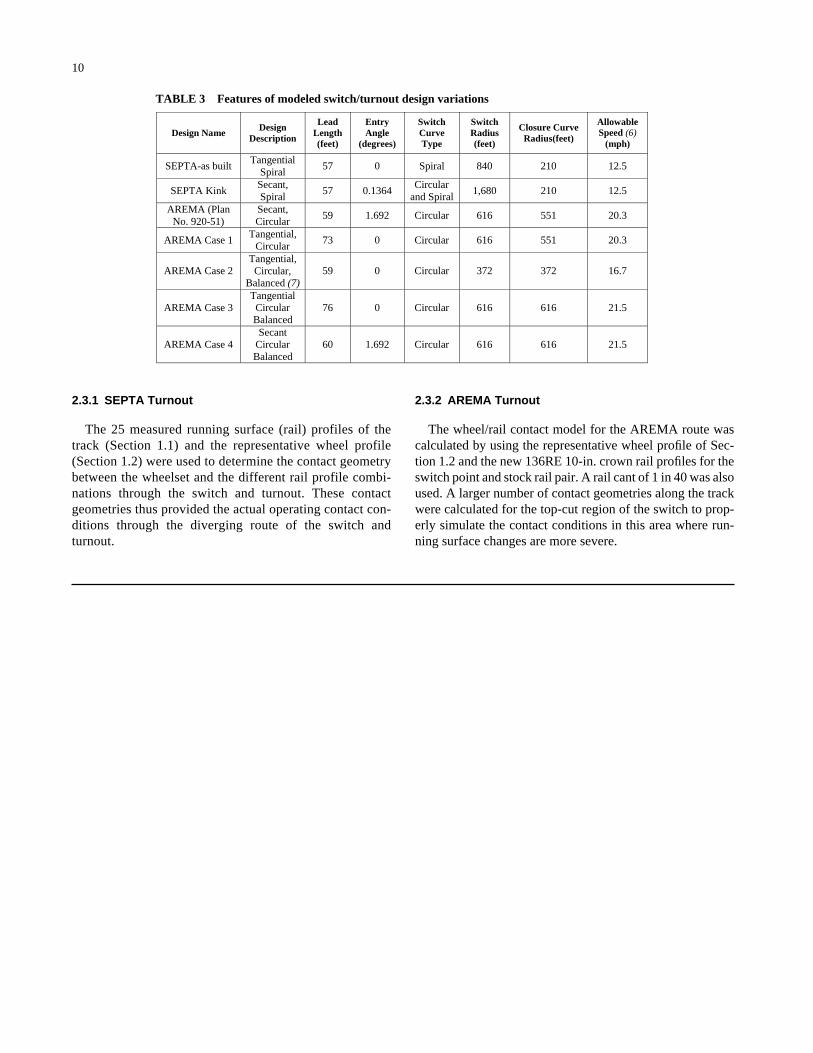
Table 3 lists the features of the design variations described.
2.3 WHEEL/RAIL CONTACT MODEL
The wheel/rail contact model describes the contact betweenthe wheels and the rails. This description is provided for var-ious lateral positions (shifts) of the wheelset relative to therails. In addition, contact geometry is defined as a function ofdistance along the track. Even though the SEPTA switch hasAMS casting points and the AREMA switch has rail steelpoints, a distinction regarding steels is not made in the con-tact model.
Positions of contact between the wheelset and rails for var-ious shifts of the wheelset relative to the rails are calculatedusing the profile geometry of each wheel; the wheels’ radii;the back-to-back spacing of the wheels and the profile shapesof the two rails, their cant angle, and the track gage. Corre-sponding to each contact position, the pertaining geometricparameters (e.g., wheelset roll angle, rolling radii difference,contact angles, and contact areas) are calculated based on theassumptions of the Hertzian contact between the wheels andrails. By defining these at various locations along the turnout,the wheel/rail contact model all through the switch is thusdefined. Between any two consecutive locations along thetrack, the contact model defined for the first location is used.
10
2.3.1 SEPTA Turnout
The 25 measured running surface (rail) profiles of thetrack (Section 1.1) and the representative wheel profile(Section 1.2) were used to determine the contact geometrybetween the wheelset and the different rail profile combi-nations through the switch and turnout. These contactgeometries thus provided the actual operating contact con-ditions through the diverging route of the switch andturnout.
2.3.2 AREMA Turnout
The wheel/rail contact model for the AREMA route wascalculated by using the representative wheel profile of Sec-tion 1.2 and the new 136RE 10-in. crown rail profiles for theswitch point and stock rail pair. A rail cant of 1 in 40 was alsoused. A larger number of contact geometries along the trackwere calculated for the top-cut region of the switch to prop-erly simulate the contact conditions in this area where run-ning surface changes are more severe.
TABLE 3 Features of modeled switch/turnout design variations
Design NameDesign
Description
LeadLength(feet)
EntryAngle
(degrees)
SwitchCurve Type
Switch Radius(feet)
Closure CurveRadius(feet)
Allowable Speed (6)
(mph)
SEPTA-as built Tangential
Spiral 57 0 Spiral 840 210 12.5
SEPTA Kink Secant, Spiral
57 0.1364 Circular
and Spiral 1,680 210 12.5
AREMA (Plan No. 920-51)
Secant, Circular
59 1.692 Circular 616 551 20.3
AREMA Case 1 Tangential,
Circular 73 0 Circular 616 551 20.3
AREMA Case 2 Tangential,
Circular, Balanced (7)
59 0 Circular 372 372 16.7
AREMA Case 3 Tangential
Circular Balanced
76 0 Circular 616 616 21.5
AREMA Case 4 Secant
Circular Balanced
60 1.692 Circular 616 616 21.5
11
CHAPTER 3
PARAMETRIC STUDY OF SWITCH/TURNOUT DESIGN FEATURES
Variations in design parameters for the study include tan-gential and nontangential entry to the switch and the changesin the radii of the switch and curved closure rails. The effectof speed on various designs, for both the facing-pointdiverging-to-right runs and the trailing-point diverging-to-left runs, was evaluated and compared with the SEPTAAs-is turnout and a new AREMA Number 8 turnout. Maxi-mum lateral loads, maximum wheel L/V ratios, maximumsum (axle) L/V ratios, minimum wheel/rail vertical loads,maximum lateral accelerations, and the wear indices werefactors in assessing design performance.
Of the various replacement designs listed in Table 3, twooptions have lead lengths more or less equal to the SEPTAturnout: the AREMA Number 8 per Plan No. 920-51 (AREMAAs-is) and the AREMA-Case 2. Both AREMA options havea lead length of about 59 ft and circular curvature geometry.The AREMA per Plan has an entry angle while Case 2 is tan-gential. Based on this information, these two designs are themost practical replacement options. As such, this reportfocuses on the performance comparisons of the B-IV carsthrough the SEPTA As-is turnout and these two AREMAreplacement options.
3.1 LATERAL LOADS
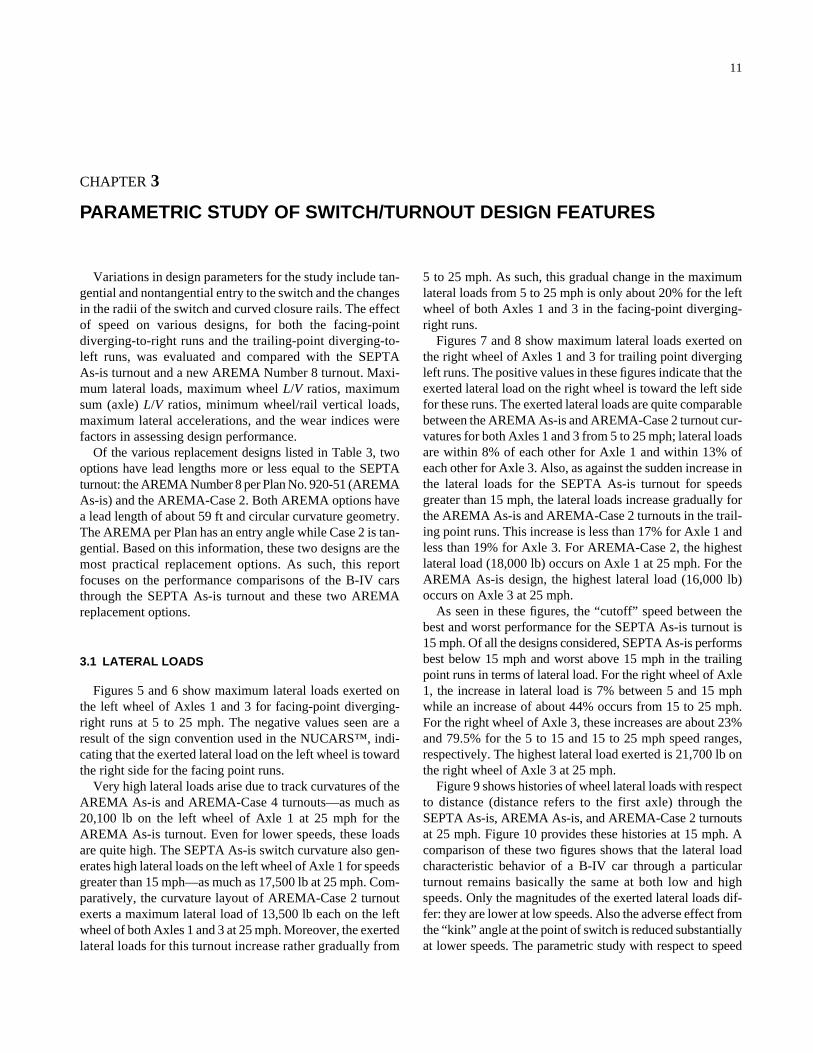
Figures 5 and 6 show maximum lateral loads exerted onthe left wheel of Axles 1 and 3 for facing-point diverging-right runs at 5 to 25 mph. The negative values seen are aresult of the sign convention used in the NUCARS™, indi-cating that the exerted lateral load on the left wheel is towardthe right side for the facing point runs.
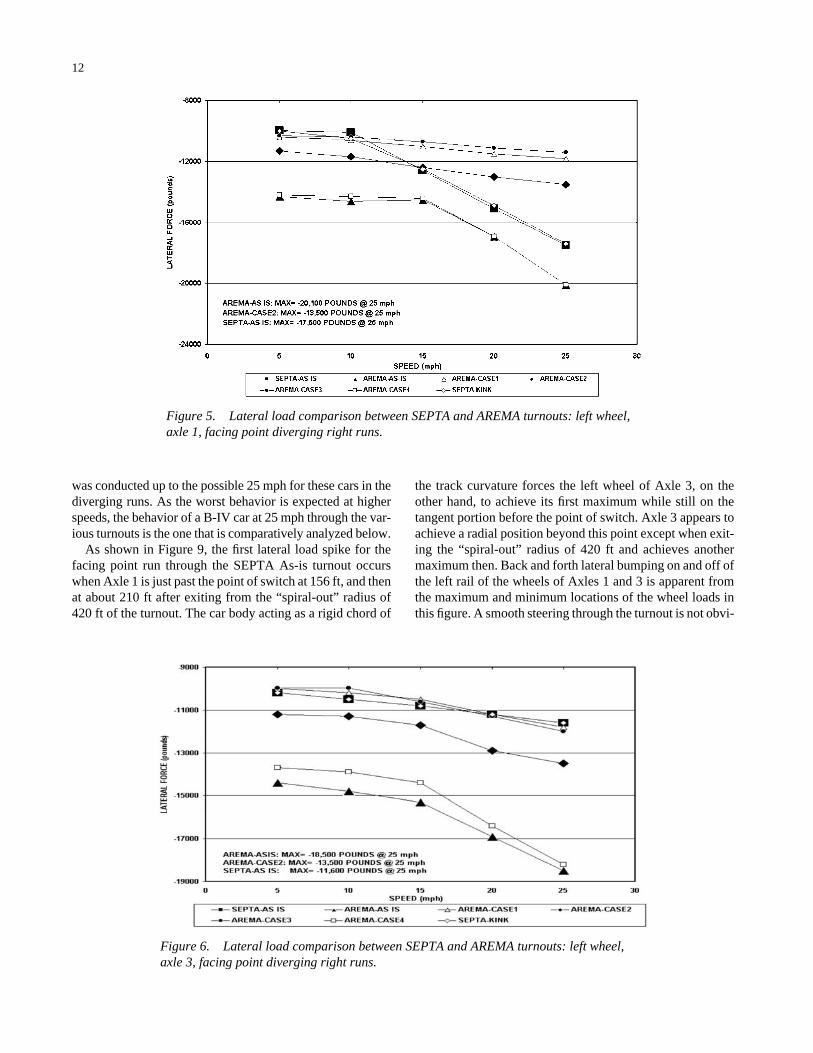
Very high lateral loads arise due to track curvatures of theAREMA As-is and AREMA-Case 4 turnouts—as much as20,100 lb on the left wheel of Axle 1 at 25 mph for theAREMA As-is turnout. Even for lower speeds, these loadsare quite high. The SEPTA As-is switch curvature also gen-erates high lateral loads on the left wheel of Axle 1 for speedsgreater than 15 mph—as much as 17,500 lb at 25 mph. Com-paratively, the curvature layout of AREMA-Case 2 turnoutexerts a maximum lateral load of 13,500 lb each on the leftwheel of both Axles 1 and 3 at 25 mph. Moreover, the exertedlateral loads for this turnout increase rather gradually from
5 to 25 mph. As such, this gradual change in the maximumlateral loads from 5 to 25 mph is only about 20% for the leftwheel of both Axles 1 and 3 in the facing-point diverging-right runs.
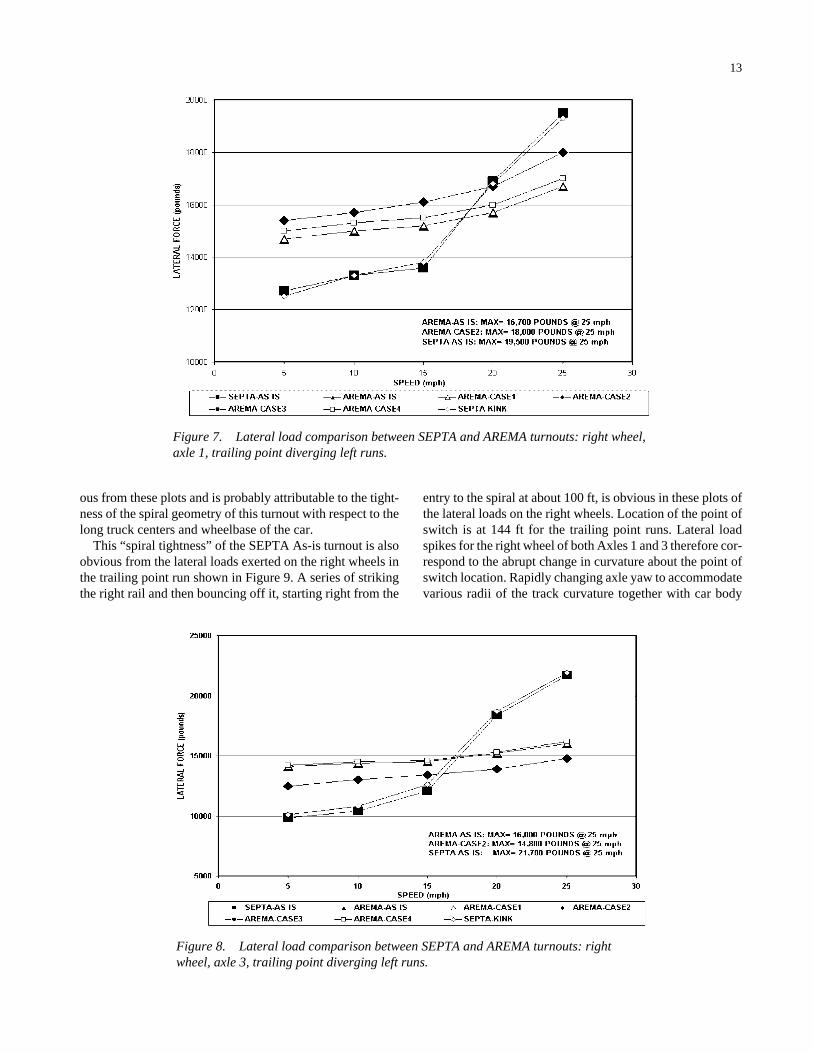
Figures 7 and 8 show maximum lateral loads exerted onthe right wheel of Axles 1 and 3 for trailing point divergingleft runs. The positive values in these figures indicate that theexerted lateral load on the right wheel is toward the left sidefor these runs. The exerted lateral loads are quite comparablebetween the AREMA As-is and AREMA-Case 2 turnout cur-vatures for both Axles 1 and 3 from 5 to 25 mph; lateral loadsare within 8% of each other for Axle 1 and within 13% ofeach other for Axle 3. Also, as against the sudden increase inthe lateral loads for the SEPTA As-is turnout for speedsgreater than 15 mph, the lateral loads increase gradually forthe AREMA As-is and AREMA-Case 2 turnouts in the trail-ing point runs. This increase is less than 17% for Axle 1 andless than 19% for Axle 3. For AREMA-Case 2, the highestlateral load (18,000 lb) occurs on Axle 1 at 25 mph. For theAREMA As-is design, the highest lateral load (16,000 lb)occurs on Axle 3 at 25 mph.
As seen in these figures, the “cutoff” speed between thebest and worst performance for the SEPTA As-is turnout is15 mph. Of all the designs considered, SEPTA As-is performsbest below 15 mph and worst above 15 mph in the trailingpoint runs in terms of lateral load. For the right wheel of Axle1, the increase in lateral load is 7% between 5 and 15 mphwhile an increase of about 44% occurs from 15 to 25 mph.For the right wheel of Axle 3, these increases are about 23%and 79.5% for the 5 to 15 and 15 to 25 mph speed ranges,respectively. The highest lateral load exerted is 21,700 lb onthe right wheel of Axle 3 at 25 mph.
Figure 9 shows histories of wheel lateral loads with respectto distance (distance refers to the first axle) through theSEPTA As-is, AREMA As-is, and AREMA-Case 2 turnoutsat 25 mph. Figure 10 provides these histories at 15 mph. Acomparison of these two figures shows that the lateral loadcharacteristic behavior of a B-IV car through a particularturnout remains basically the same at both low and highspeeds. Only the magnitudes of the exerted lateral loads dif-fer: they are lower at low speeds. Also the adverse effect fromthe “kink” angle at the point of switch is reduced substantiallyat lower speeds. The parametric study with respect to speed
was conducted up to the possible 25 mph for these cars in thediverging runs. As the worst behavior is expected at higherspeeds, the behavior of a B-IV car at 25 mph through the var-ious turnouts is the one that is comparatively analyzed below.
As shown in Figure 9, the first lateral load spike for thefacing point run through the SEPTA As-is turnout occurswhen Axle 1 is just past the point of switch at 156 ft, and thenat about 210 ft after exiting from the “spiral-out” radius of420 ft of the turnout. The car body acting as a rigid chord of
12
the track curvature forces the left wheel of Axle 3, on theother hand, to achieve its first maximum while still on thetangent portion before the point of switch. Axle 3 appears toachieve a radial position beyond this point except when exit-ing the “spiral-out” radius of 420 ft and achieves anothermaximum then. Back and forth lateral bumping on and off ofthe left rail of the wheels of Axles 1 and 3 is apparent fromthe maximum and minimum locations of the wheel loads inthis figure. A smooth steering through the turnout is not obvi-
Figure 6. Lateral load comparison between SEPTA and AREMA turnouts: left wheel,axle 3, facing point diverging right runs.
Figure 5. Lateral load comparison between SEPTA and AREMA turnouts: left wheel,axle 1, facing point diverging right runs.
ous from these plots and is probably attributable to the tight-ness of the spiral geometry of this turnout with respect to thelong truck centers and wheelbase of the car.
This “spiral tightness” of the SEPTA As-is turnout is alsoobvious from the lateral loads exerted on the right wheels inthe trailing point run shown in Figure 9. A series of strikingthe right rail and then bouncing off it, starting right from the
13
entry to the spiral at about 100 ft, is obvious in these plots ofthe lateral loads on the right wheels. Location of the point ofswitch is at 144 ft for the trailing point runs. Lateral loadspikes for the right wheel of both Axles 1 and 3 therefore cor-respond to the abrupt change in curvature about the point ofswitch location. Rapidly changing axle yaw to accommodatevarious radii of the track curvature together with car body
Figure 7. Lateral load comparison between SEPTA and AREMA turnouts: right wheel,axle 1, trailing point diverging left runs.
Figure 8. Lateral load comparison between SEPTA and AREMA turnouts: rightwheel, axle 3, trailing point diverging left runs.
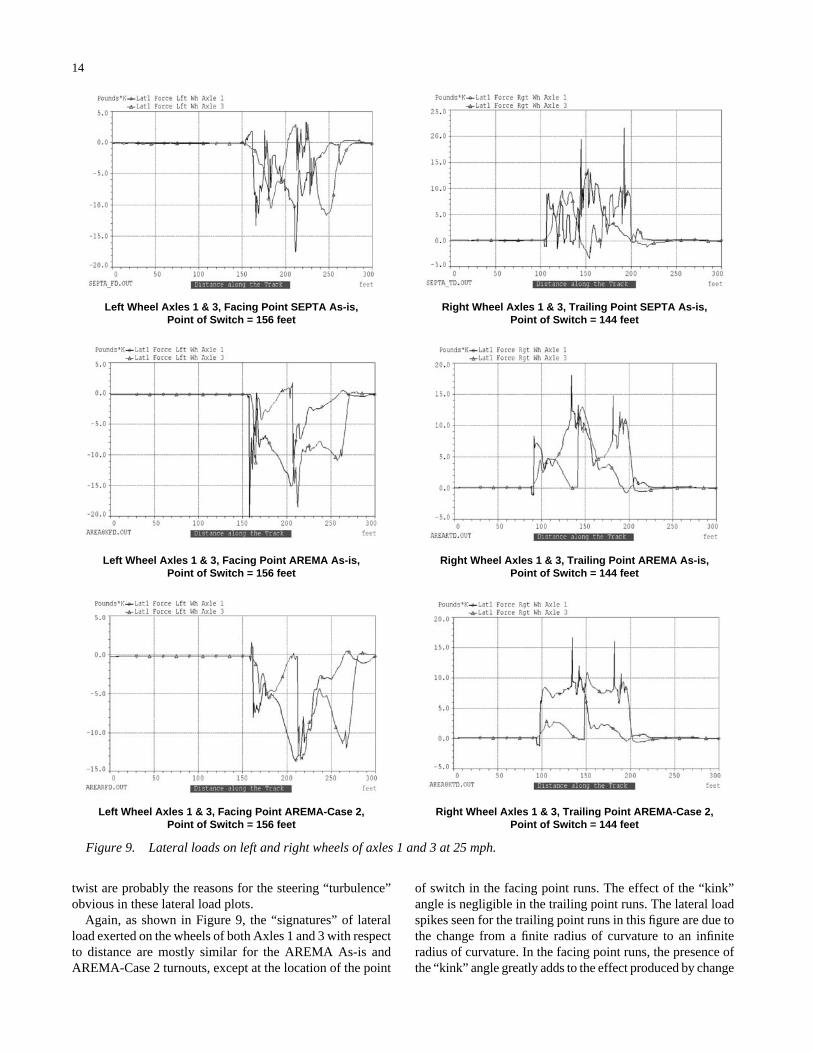
twist are probably the reasons for the steering “turbulence”obvious in these lateral load plots.
Again, as shown in Figure 9, the “signatures” of lateralload exerted on the wheels of both Axles 1 and 3 with respectto distance are mostly similar for the AREMA As-is andAREMA-Case 2 turnouts, except at the location of the point
14
of switch in the facing point runs. The effect of the “kink”angle is negligible in the trailing point runs. The lateral loadspikes seen for the trailing point runs in this figure are due tothe change from a finite radius of curvature to an infiniteradius of curvature. In the facing point runs, the presence ofthe “kink” angle greatly adds to the effect produced by change
Figure 9. Lateral loads on left and right wheels of axles 1 and 3 at 25 mph.
Left Wheel Axles 1 & 3, Facing Point SEPTA As-is, Point of Switch = 156 feet
Right Wheel Axles 1 & 3, Trailing Point SEPTA As-is, Point of Switch = 144 feet
Right Wheel Axles 1 & 3, Trailing Point AREMA-Case 2, Point of Switch = 144 feet
Left Wheel Axles 1 & 3, Facing Point AREMA-Case 2, Point of Switch = 156 feet
Right Wheel Axles 1 & 3, Trailing Point AREMA As-is, Point of Switch = 144 feet
Left Wheel Axles 1 & 3, Facing Point AREMA As-is, Point of Switch = 156 feet

in the curvature at the point of switch. A comparison of lat-eral loads between AREMA As-is with kink angle and theAREMA-Case 2 without kink angle, shows that the suddenchange in direction due to the “kink” angle can increase lat-eral loads in the vicinity of the point of switch as much as3 times when the kink angle is present.
15
On the other hand, a comparison with the SEPTA turnoutshows that the progression of exerted lateral loads on wheelsthrough the curvatures of these AREMA turnouts is morepredictable. As an example, the sudden change in directiondue to the kink angle that produces a sharp lateral load spikefor the left wheel of Axle 1 in the facing point run. However,
Figure 10. Lateral loads on left and right wheels of axles 1 and 3 at 15 mph.
Left Wheel Axles 1 & 3, Facing Point SEPTA As-is, Point of Switch = 156 feet
Right Wheel Axles 1 & 3, Trailing Point SEPTA As-is, Point of Switch = 144 feet
Right Wheel Axles 1 & 3, Trailing Point AREMA-Case 2, Point of Switch = 144 feet
Left Wheel Axles 1 & 3, Facing Point AREMA-Case 2, Point of Switch = 156 feet
Right Wheel Axles 1 & 3, Trailing Point AREMA As-is, Point of Switch = 144 feet
Left Wheel Axles 1 & 3, Facing Point AREMA As-is, Point of Switch = 156 feet
the wheel quickly recovers and then resumes a rather smoothsteering through the switch rail and closure rail curves gener-ating gradually increasing lateral loads due only to the curva-ture effect till exiting to the tangent portion at the frog. Theleft wheel of Axle 3 follows the same pattern. In trailing pointruns, a smoother negotiation of B-IV cars through the curva-ture of the AREMA As-is turnout than those of the SEPTAAs-is and AREMA-Case 2 turnouts is obvious. The radii ofcurvature of the AREMA As-is turnout are larger. Also, theindividual curve lengths in it are longer; therefore, the carbody chord effect does not seem to affect the lateral loads forthis turnout unduly, although a marginal chord effect isapparent for the AREMA-Case 2 turnout due to a few erraticchanges in the lateral loads for this turnout.
To summarize, comparable lateral wheel loads at speedslower than 15 mph and lower lateral wheel loads at speedsgreater than 15 mph, with respect to the SEPTA As-is turnout,are generated for the AREMA-Case 2 turnout. Further, thereis evidence of smoother steering through the AREMA-Case2 turnout than through the SEPTA As-is turnout. The switch,with its larger radius closure curve, does not suffer as muchfrom the adverse effects of a tight curvature: car body twist,the chord effect and rapidly changing axle yaw. From thestudy of lateral loads, it therefore appears that the AREMA-Case 2 design could be a good replacement option for theSEPTA As-is turnout.
3.2 ACCELERATIONS
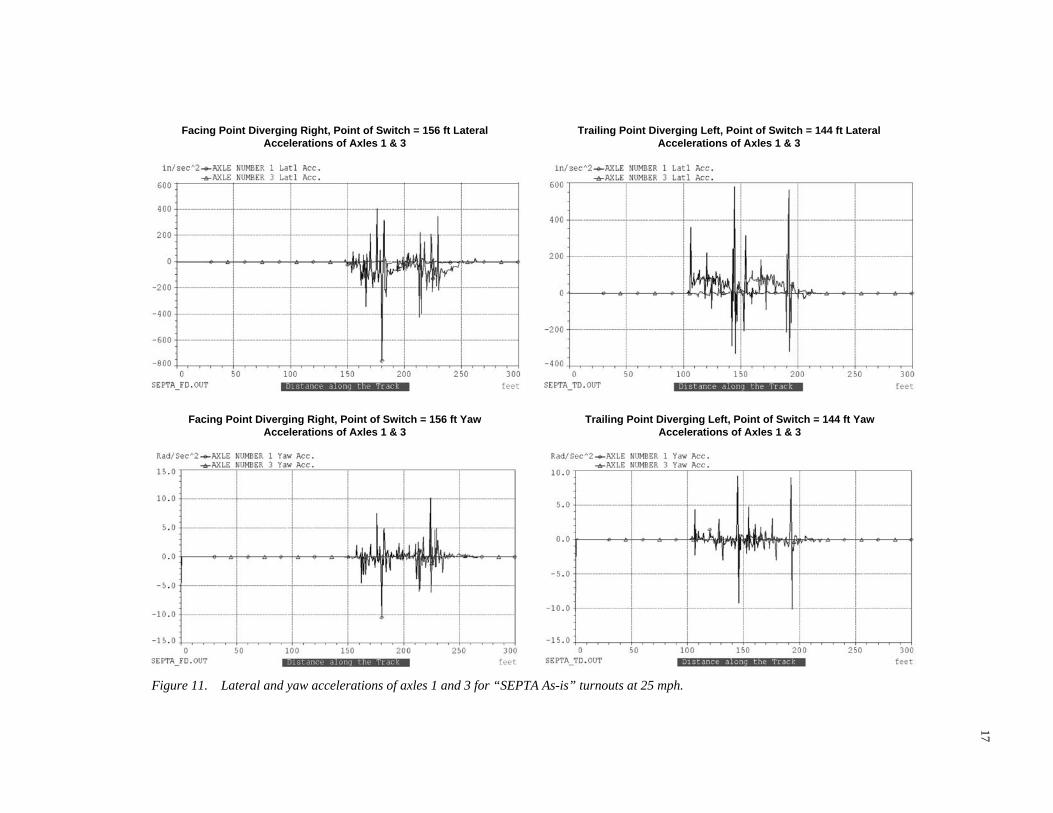
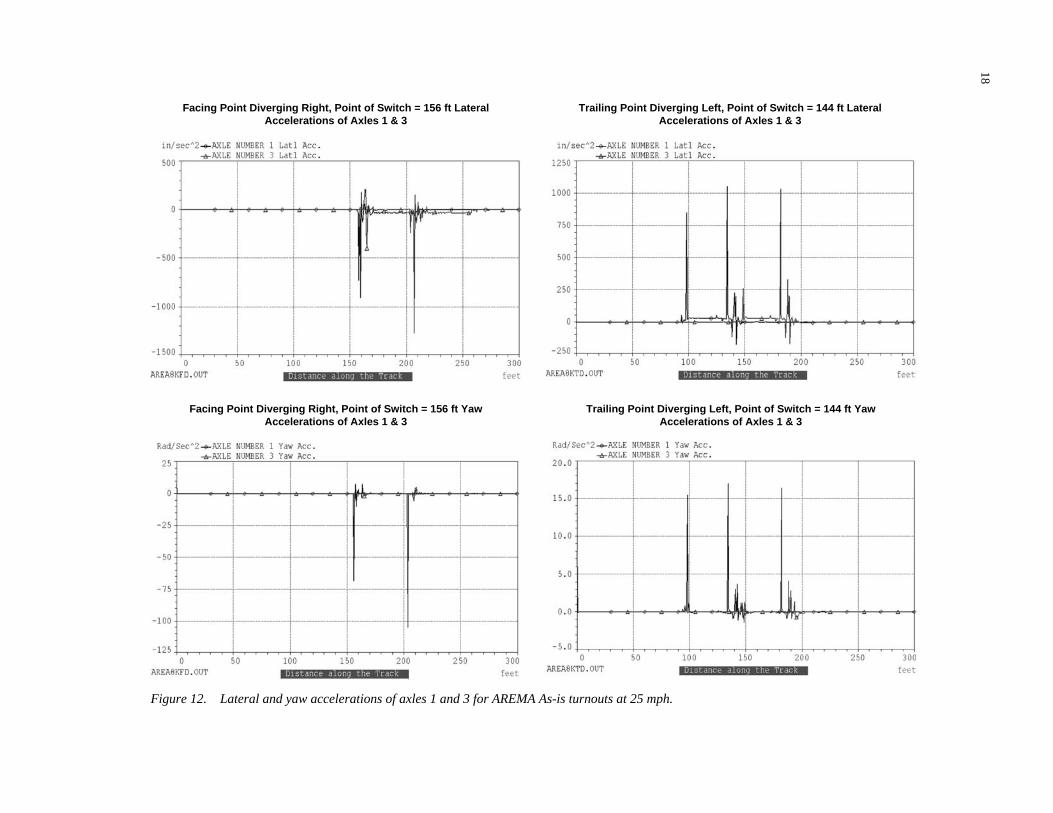
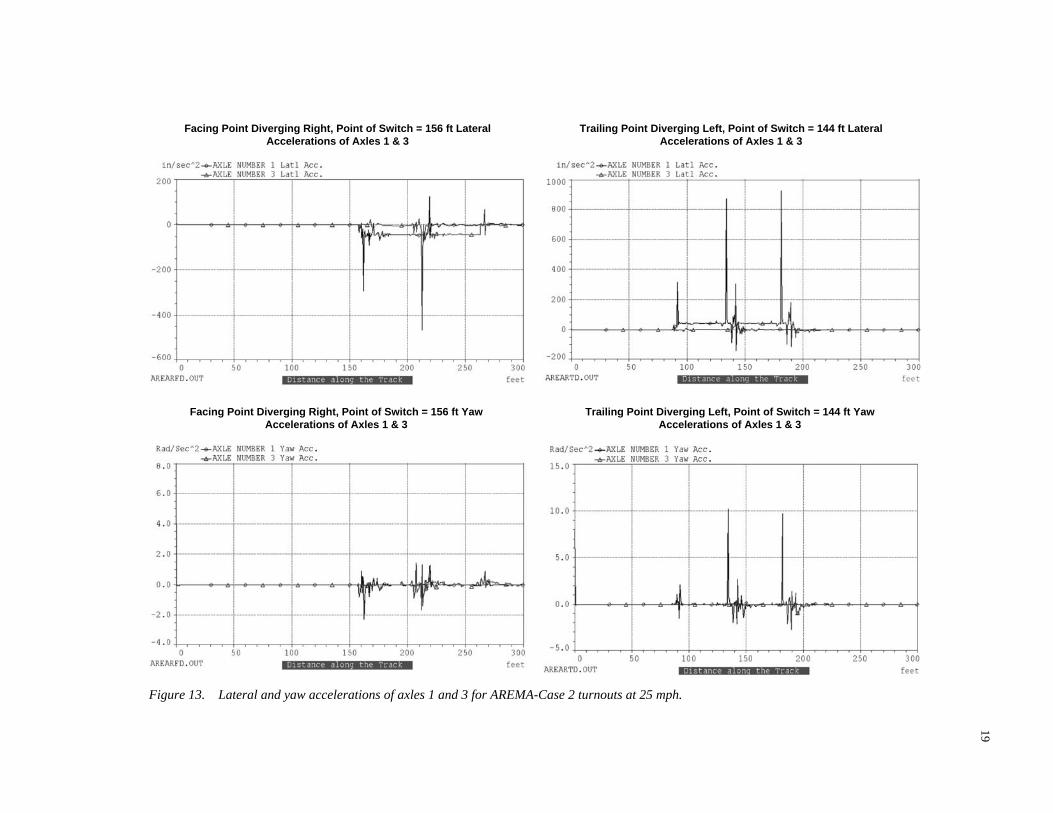
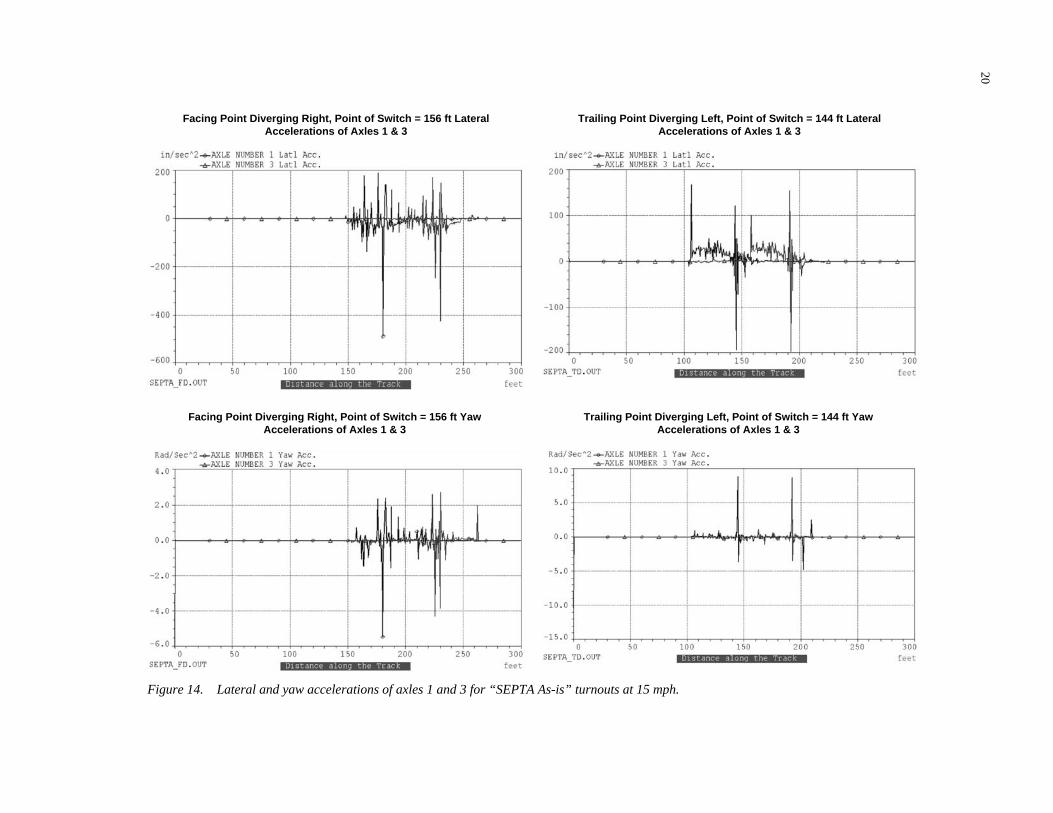
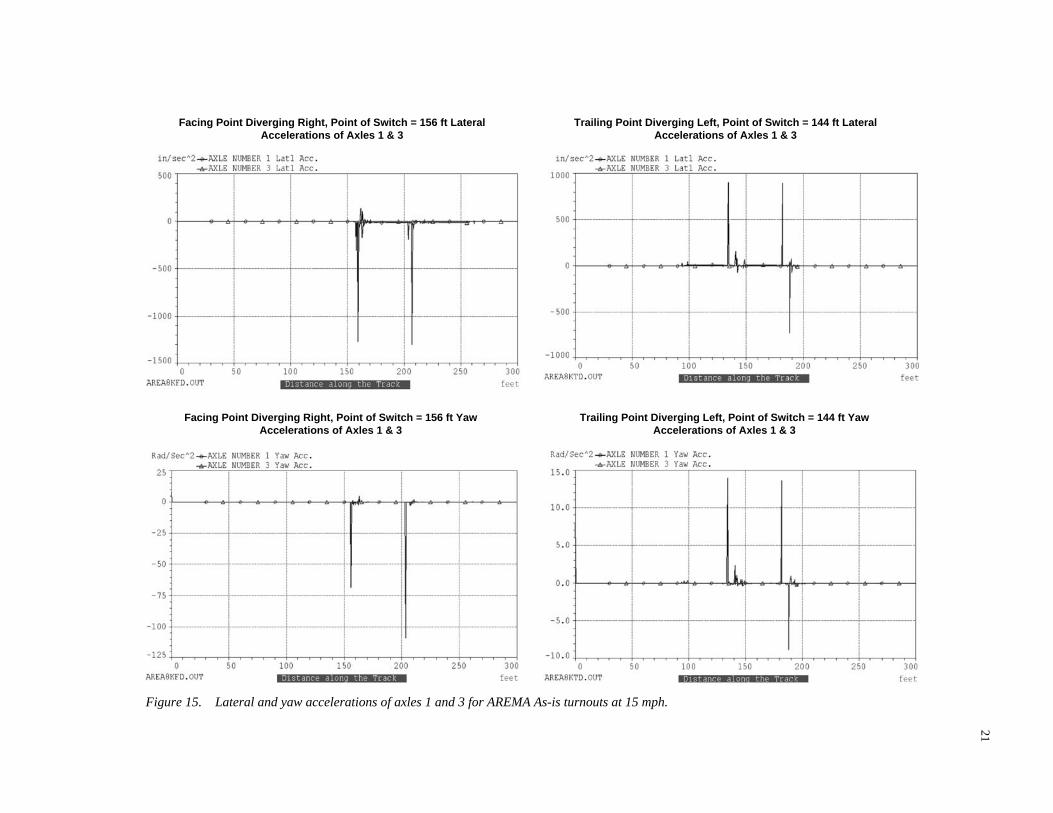
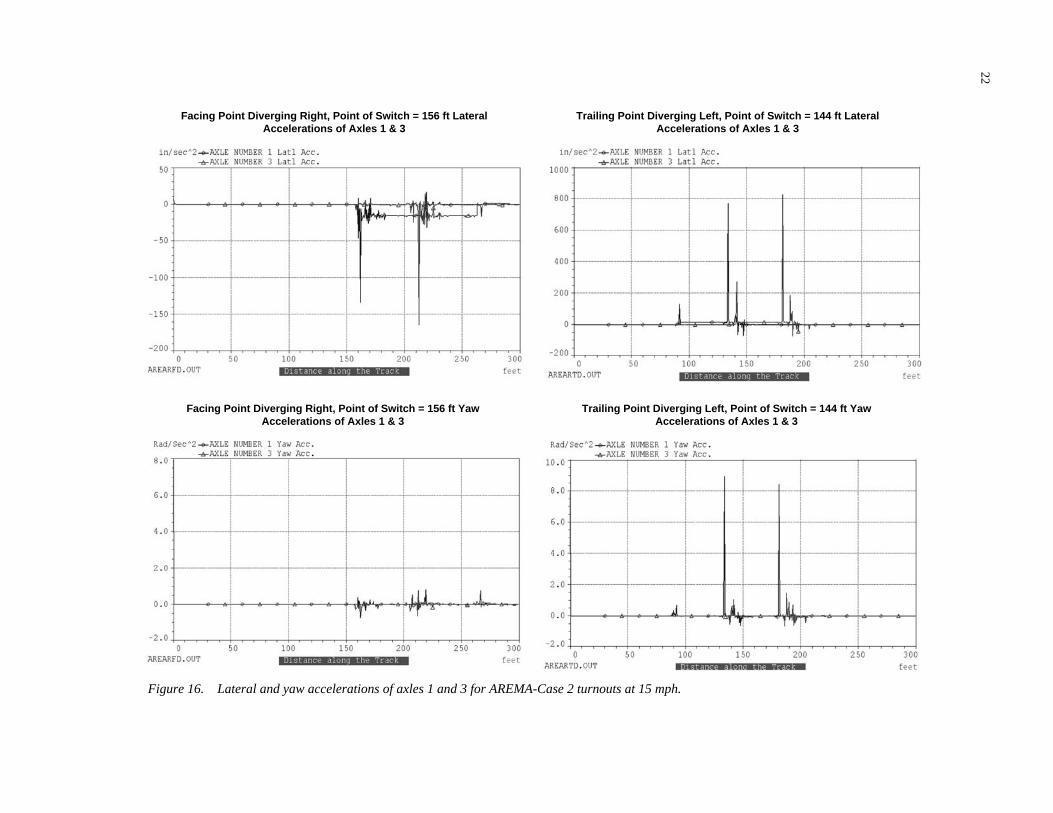
With respect to the lateral and yaw accelerations of Axles1 and 3 at 25 mph, Figures 11 through 13 depict an “agitated”negotiation of the B-IV cars through the SEPTA As-isturnout against the rather “quiet” negotiation of the same carsthrough both the AREMA As-is and AREMA-Case 2 turnoutcurvatures. Figures 14 through 16 show that a similar con-clusion can be derived at lower speeds from a comparison ofthese accelerations at 15 mph. A comparison of lateral andyaw accelerations of the axles at 15 and 25 mph also showsthat the characteristic behavior of the B-IV cars through aparticular turnout curvature remains the same at low and highspeeds. In particular for the SEPTA As-is turnout, it is appar-ent that at the lower speed of 15 mph many changes in axleyaw acceleration occur in order to accommodate various cur-vatures, but these changes are not very severe. Also, it maybe noted from Figures 11, 12, 15, and 16 that the high accel-eration spikes, associated with the change from infinite radiusof the tangent track to the finite radius of the curved track, areeither eliminated or dramatically reduced at lower speed.This behavior is clearer for trailing point runs.
A comparison of the responses of the B-IV car at the high-est possible speed of 25 mph through these turnouts showsthat, except in the neighborhood of the point of switch and/orwhile transiting from an infinite radius of the tangent track tothe finite radius of the turnout curvature, axle lateral and yawaccelerations for both the AREMA As-is and AREMA-Case
16
2 turnouts are very small in magnitude in both the facing andtrailing point runs. Also, these accelerations are more or lessconstant over most of the length of the main curves of theseturnouts. Such a constancy of accelerations would happenonly with the smooth steering of the B-IV cars through theseturnouts. For the SEPTA As-is turnout this, of course, is notso. Rapid changes in accelerations occur due to the long caradjusting to many radius of curvature changes in the turnout—an indication that the steering is not smooth. For the AREMAturnouts, these rapid changes do not occur, and both Axles 1and 3 appear to steer the B-IV cars smoothly through theseturnouts.
3.3 OTHER PARAMETERS
Figures 17 through 26 provide various plots of other pa-rameters, such as vertical wheel loads, car body accelerations,bolster accelerations, and L/V ratios. The graphs in theseplots are pretty much self-explanatory and reinforce the factthat the AREMA-Case 2 turnout curvature geometry is bet-ter suited for B-IV cars than that of the SEPTA As-is turnouteven at low operating speeds. Only a very brief descriptionof these parameters is given in the following sections.
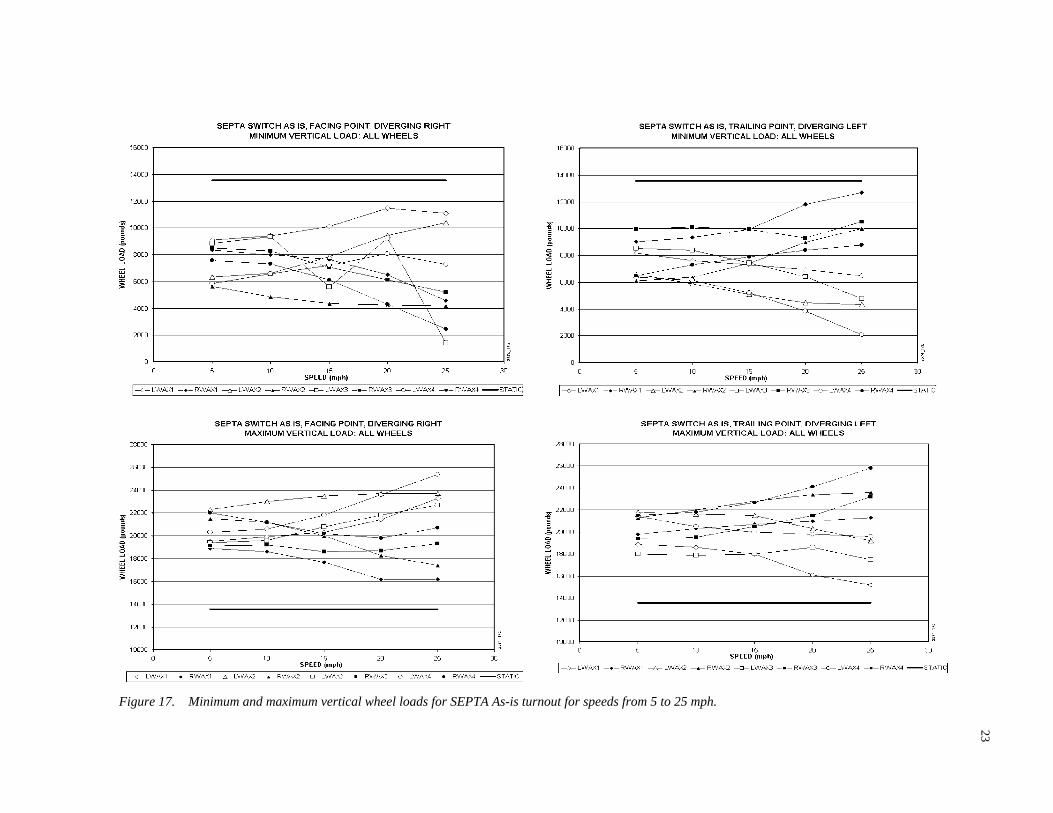
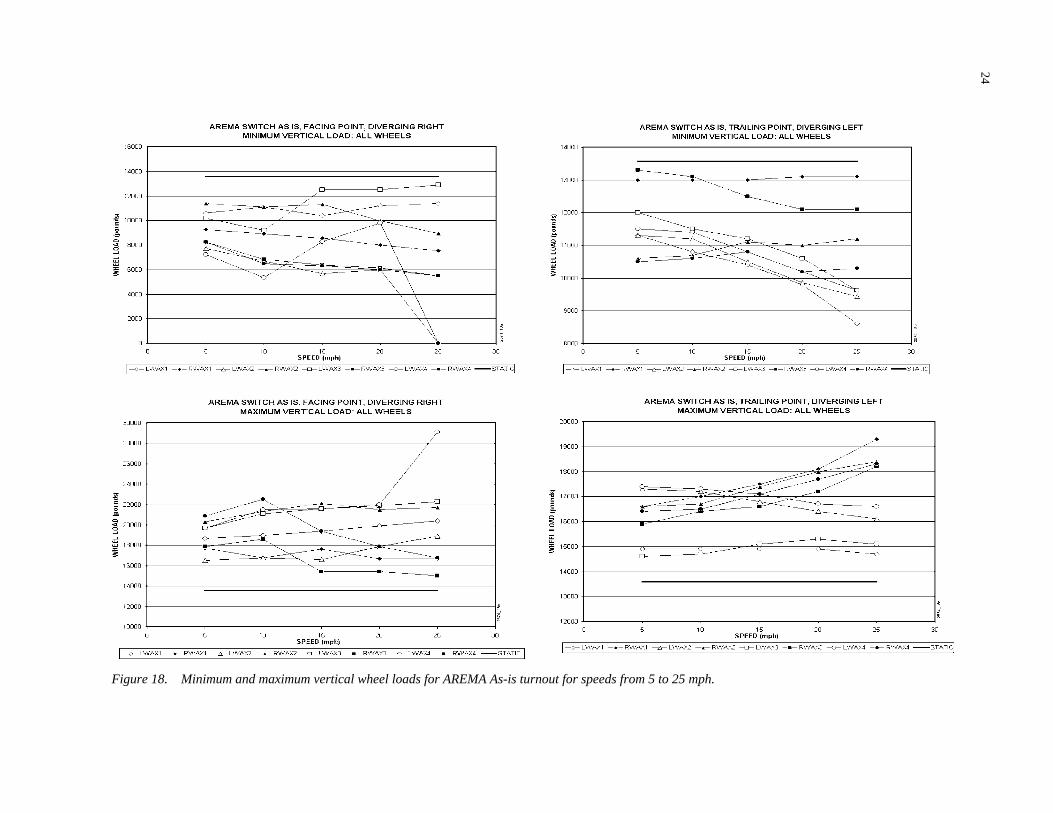
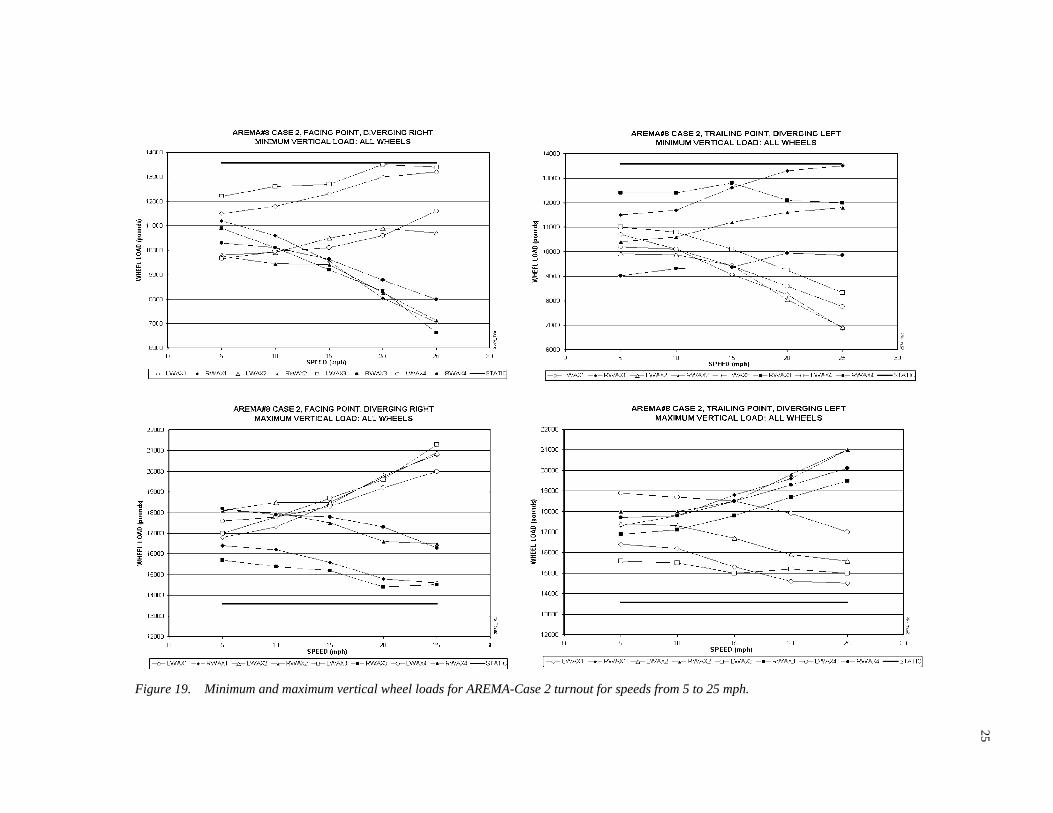
3.3.1 Wheel Vertical Loads
Two factors are important when investigating wheel ver-tical loads: (1) magnitude of the range between loading andunloading of a wheel and the axle-to-axle variation of thisrange—this will indicate the ride quality as to whether the caris rocking and twisting through the turnout; and (2) theamount of unloading in comparison to the wheel static load—this is important to assess the possibility of rail roll overbecause of the high lateral loads exerted by a yawed axle.
Figures 17 through 19 show minimum and maximum wheelvertical loads on all axles of the B-IV car, in the facing pointand trailing point runs from 5 to 25 mph, for SEPTA As-is,AREMA As-is, and AREMA-Case 2 turnouts, respectively.Also, in Table 4, the maximum unloading, loading, and therange of vertical wheel loads at 25 mph for these three turnoutsare tabulated. As seen in Table 4, wheel unloading of asmuch as 89.5% below the wheel static load occurs at leftwheel of Axle 3 in facing point run at 25 mph for the SEPTAAs-is turnout. The maximum loading for this same wheel isabout 67.1% above the static wheel load at 25 mph. This is avery large range. For the left wheel of Axle 1, the range is18.3% unloading to 71.5% loading. A comparison of themaximum ranges of wheel vertical loads between leadingand trailing trucks shows that the range is as much as 138%larger on the trailing truck wheels than on the leading truckwheels. This is also evident for the trailing point run.
For a facing point run at 25 mph, the AREMA As-isturnout curvature generates a maximum unloading of 100%for the wheels of the rear axle of the rear truck. As such, the
(text continues on page 26)
17
Figure 11. Lateral and yaw accelerations of axles 1 and 3 for “SEPTA As-is” turnouts at 25 mph.
Trailing Point Diverging Left, Point of Switch = 144 ft YawAccelerations of Axles 1 & 3
Facing Point Diverging Right, Point of Switch = 156 ft YawAccelerations of Axles 1 & 3
Trailing Point Diverging Left, Point of Switch = 144 ft LateralAccelerations of Axles 1 & 3
Facing Point Diverging Right, Point of Switch = 156 ft LateralAccelerations of Axles 1 & 3
18
Figure 12. Lateral and yaw accelerations of axles 1 and 3 for AREMA As-is turnouts at 25 mph.
Trailing Point Diverging Left, Point of Switch = 144 ft YawAccelerations of Axles 1 & 3
Facing Point Diverging Right, Point of Switch = 156 ft YawAccelerations of Axles 1 & 3
Trailing Point Diverging Left, Point of Switch = 144 ft LateralAccelerations of Axles 1 & 3
Facing Point Diverging Right, Point of Switch = 156 ft LateralAccelerations of Axles 1 & 3
19
Figure 13. Lateral and yaw accelerations of axles 1 and 3 for AREMA-Case 2 turnouts at 25 mph.
Trailing Point Diverging Left, Point of Switch = 144 ft YawAccelerations of Axles 1 & 3
Facing Point Diverging Right, Point of Switch = 156 ft YawAccelerations of Axles 1 & 3
Trailing Point Diverging Left, Point of Switch = 144 ft LateralAccelerations of Axles 1 & 3
Facing Point Diverging Right, Point of Switch = 156 ft LateralAccelerations of Axles 1 & 3
20
Figure 14. Lateral and yaw accelerations of axles 1 and 3 for “SEPTA As-is” turnouts at 15 mph.
Trailing Point Diverging Left, Point of Switch = 144 ft YawAccelerations of Axles 1 & 3
Facing Point Diverging Right, Point of Switch = 156 ft YawAccelerations of Axles 1 & 3
Trailing Point Diverging Left, Point of Switch = 144 ft LateralAccelerations of Axles 1 & 3
Facing Point Diverging Right, Point of Switch = 156 ft LateralAccelerations of Axles 1 & 3
21
Figure 15. Lateral and yaw accelerations of axles 1 and 3 for AREMA As-is turnouts at 15 mph.
Trailing Point Diverging Left, Point of Switch = 144 ft YawAccelerations of Axles 1 & 3
Facing Point Diverging Right, Point of Switch = 156 ft YawAccelerations of Axles 1 & 3
Trailing Point Diverging Left, Point of Switch = 144 ft LateralAccelerations of Axles 1 & 3
Facing Point Diverging Right, Point of Switch = 156 ft LateralAccelerations of Axles 1 & 3
22
Figure 16. Lateral and yaw accelerations of axles 1 and 3 for AREMA-Case 2 turnouts at 15 mph.
Trailing Point Diverging Left, Point of Switch = 144 ft YawAccelerations of Axles 1 & 3
Facing Point Diverging Right, Point of Switch = 156 ft YawAccelerations of Axles 1 & 3
Trailing Point Diverging Left, Point of Switch = 144 ft LateralAccelerations of Axles 1 & 3
Facing Point Diverging Right, Point of Switch = 156 ft LateralAccelerations of Axles 1 & 3
23
Figure 17. Minimum and maximum vertical wheel loads for SEPTA As-is turnout for speeds from 5 to 25 mph.
24
Figure 18. Minimum and maximum vertical wheel loads for AREMA As-is turnout for speeds from 5 to 25 mph.
25
Figure 19. Minimum and maximum vertical wheel loads for AREMA-Case 2 turnout for speeds from 5 to 25 mph.
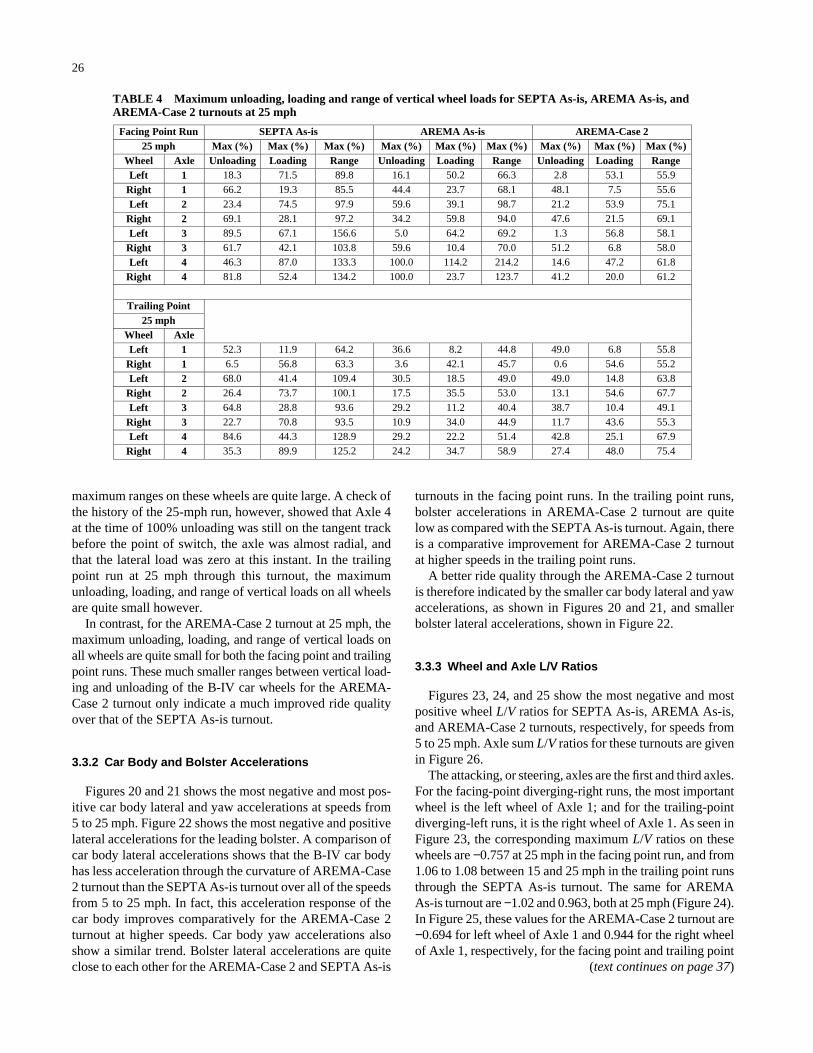
maximum ranges on these wheels are quite large. A check ofthe history of the 25-mph run, however, showed that Axle 4at the time of 100% unloading was still on the tangent trackbefore the point of switch, the axle was almost radial, andthat the lateral load was zero at this instant. In the trailingpoint run at 25 mph through this turnout, the maximumunloading, loading, and range of vertical loads on all wheelsare quite small however.
In contrast, for the AREMA-Case 2 turnout at 25 mph, themaximum unloading, loading, and range of vertical loads onall wheels are quite small for both the facing point and trailingpoint runs. These much smaller ranges between vertical load-ing and unloading of the B-IV car wheels for the AREMA-Case 2 turnout only indicate a much improved ride qualityover that of the SEPTA As-is turnout.
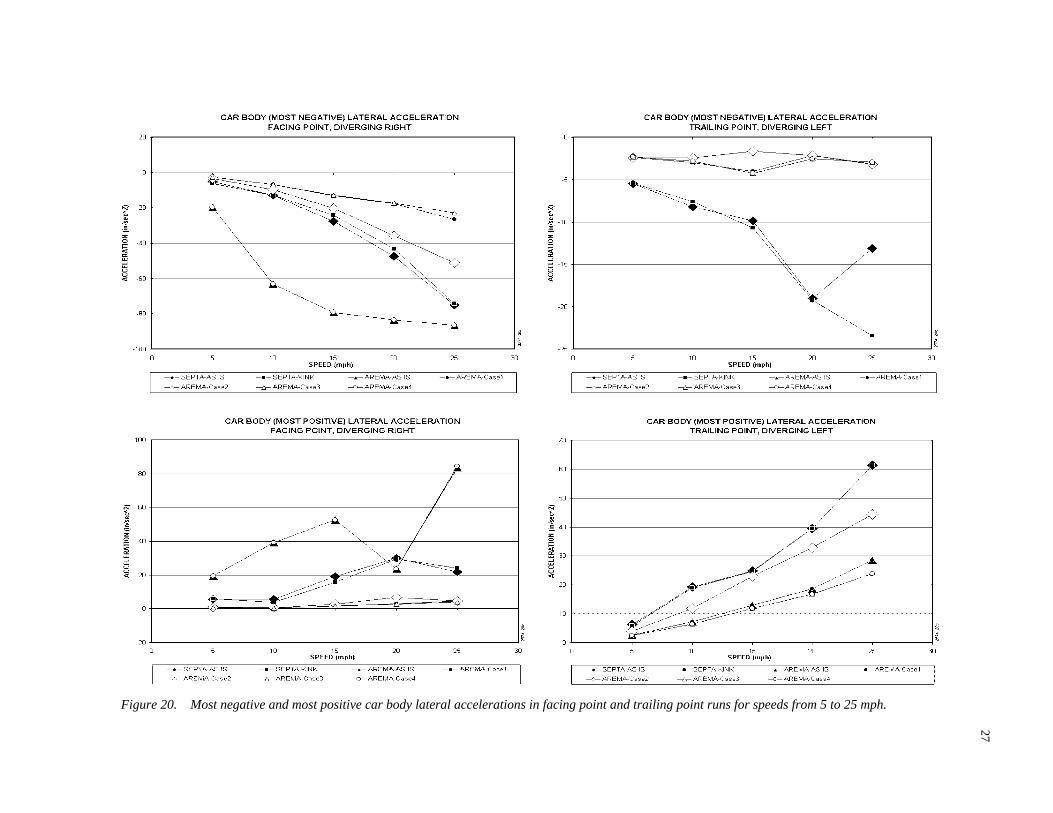
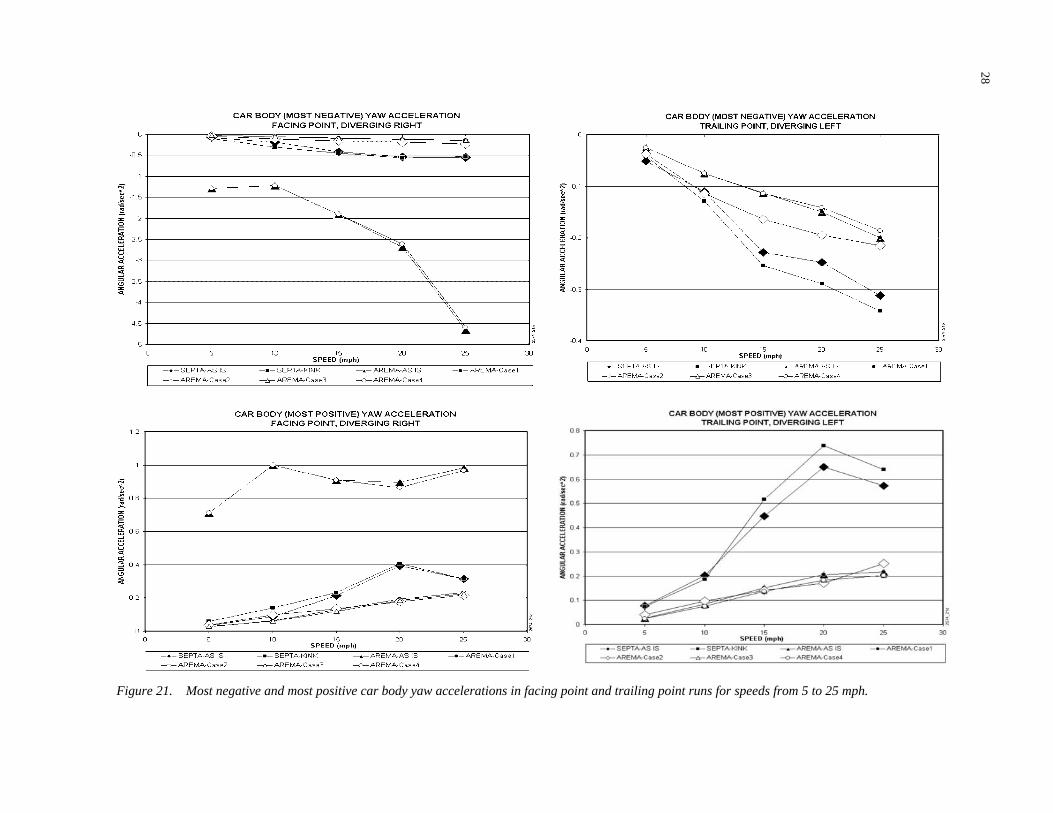
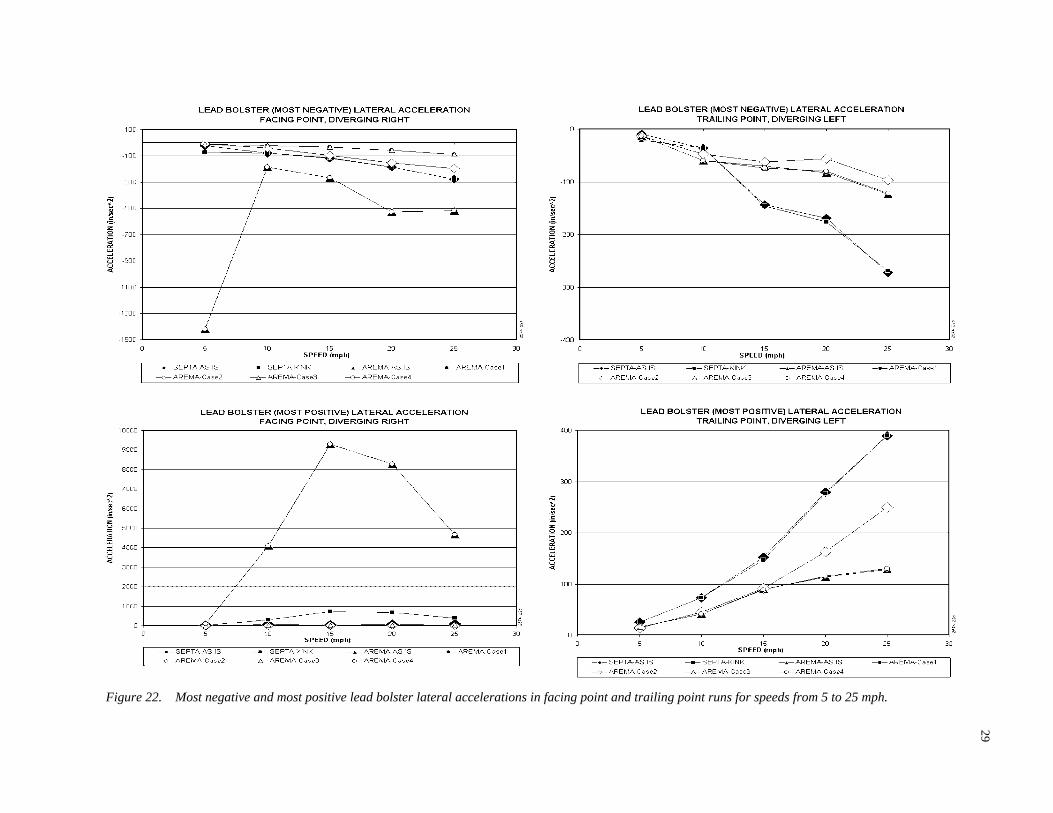
3.3.2 Car Body and Bolster Accelerations
Figures 20 and 21 shows the most negative and most pos-itive car body lateral and yaw accelerations at speeds from5 to 25 mph. Figure 22 shows the most negative and positivelateral accelerations for the leading bolster. A comparison ofcar body lateral accelerations shows that the B-IV car bodyhas less acceleration through the curvature of AREMA-Case2 turnout than the SEPTA As-is turnout over all of the speedsfrom 5 to 25 mph. In fact, this acceleration response of thecar body improves comparatively for the AREMA-Case 2turnout at higher speeds. Car body yaw accelerations alsoshow a similar trend. Bolster lateral accelerations are quiteclose to each other for the AREMA-Case 2 and SEPTA As-is
26
turnouts in the facing point runs. In the trailing point runs,bolster accelerations in AREMA-Case 2 turnout are quitelow as compared with the SEPTA As-is turnout. Again, thereis a comparative improvement for AREMA-Case 2 turnoutat higher speeds in the trailing point runs.
A better ride quality through the AREMA-Case 2 turnoutis therefore indicated by the smaller car body lateral and yawaccelerations, as shown in Figures 20 and 21, and smallerbolster lateral accelerations, shown in Figure 22.
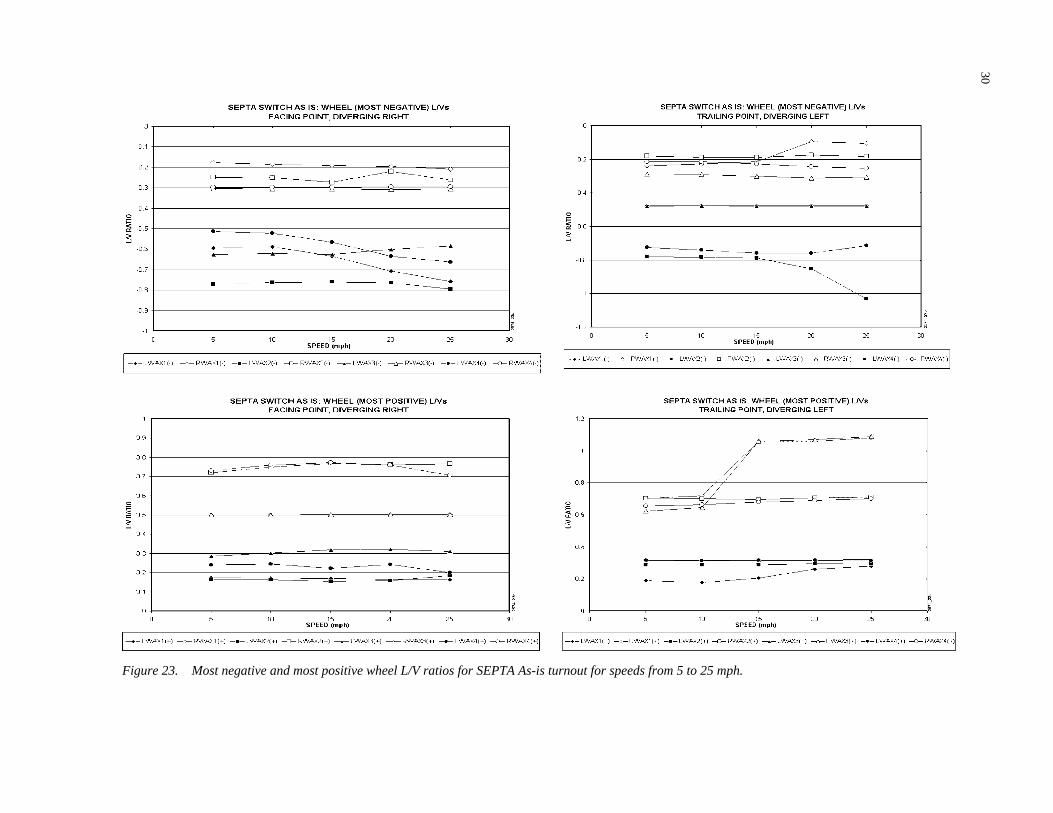
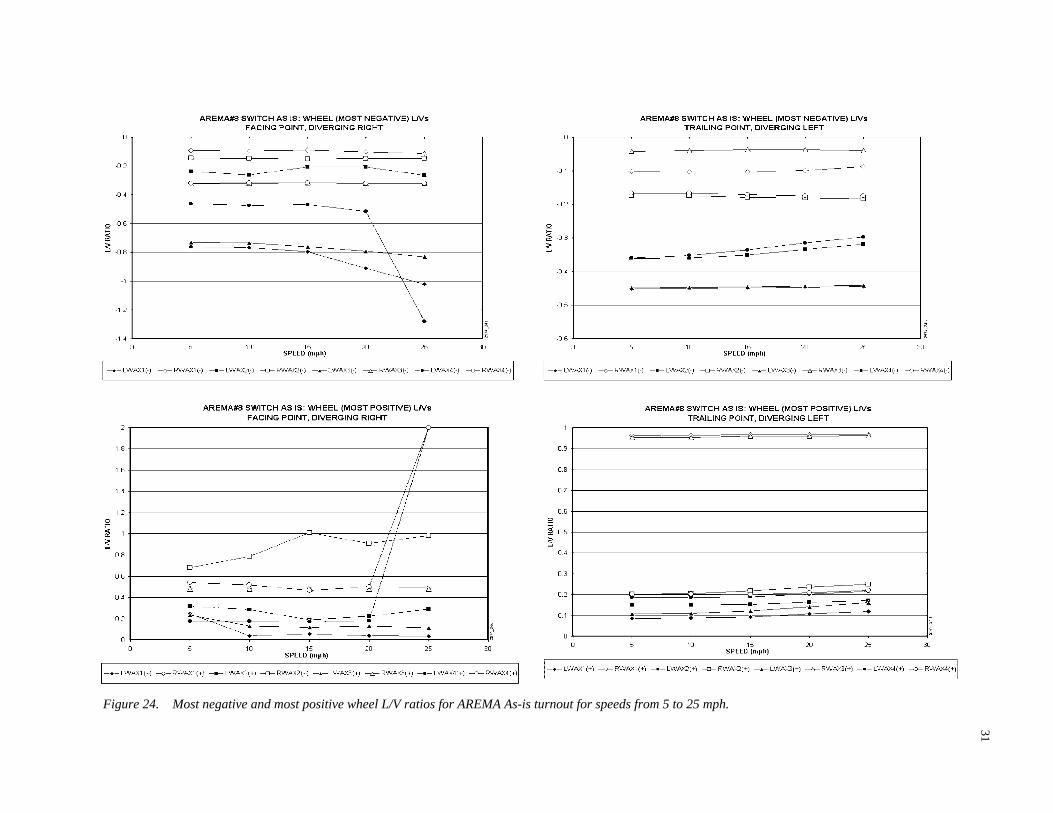
3.3.3 Wheel and Axle L/V Ratios
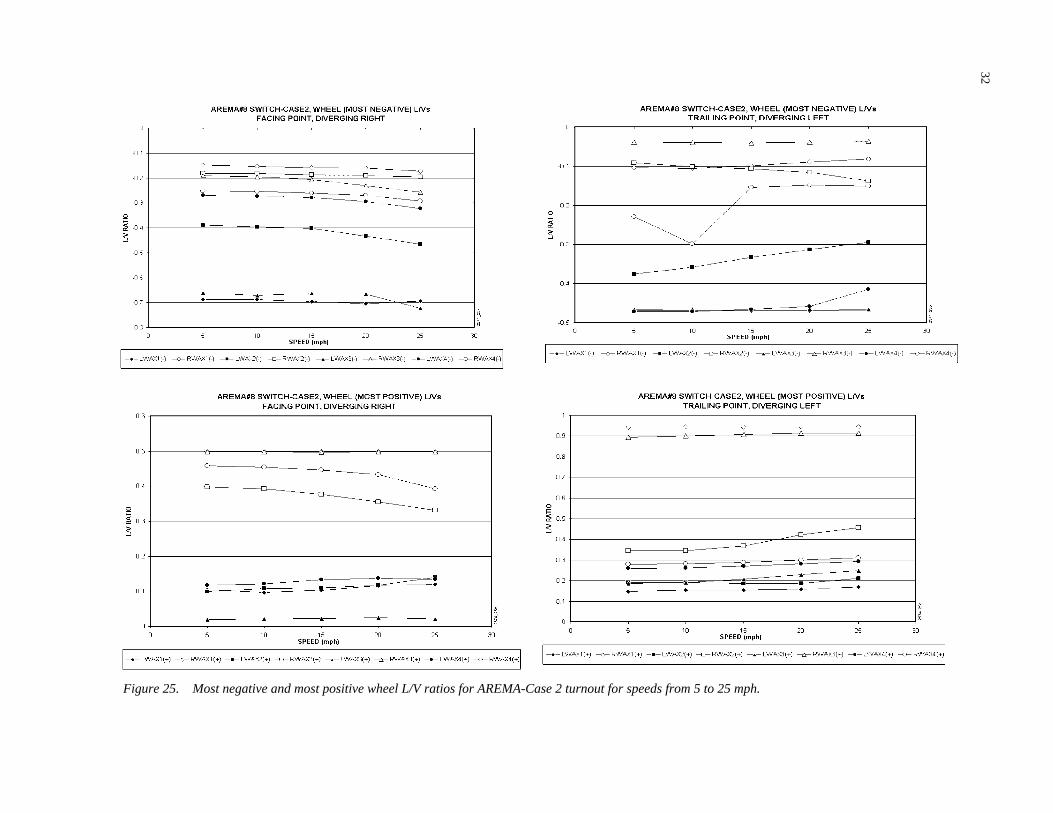
Figures 23, 24, and 25 show the most negative and mostpositive wheel L/V ratios for SEPTA As-is, AREMA As-is,and AREMA-Case 2 turnouts, respectively, for speeds from5 to 25 mph. Axle sum L/V ratios for these turnouts are givenin Figure 26.
The attacking, or steering, axles are the first and third axles.For the facing-point diverging-right runs, the most importantwheel is the left wheel of Axle 1; and for the trailing-pointdiverging-left runs, it is the right wheel of Axle 1. As seen inFigure 23, the corresponding maximum L/V ratios on thesewheels are −0.757 at 25 mph in the facing point run, and from1.06 to 1.08 between 15 and 25 mph in the trailing point runsthrough the SEPTA As-is turnout. The same for AREMAAs-is turnout are −1.02 and 0.963, both at 25 mph (Figure 24).In Figure 25, these values for the AREMA-Case 2 turnout are−0.694 for left wheel of Axle 1 and 0.944 for the right wheelof Axle 1, respectively, for the facing point and trailing point
TABLE 4 Maximum unloading, loading and range of vertical wheel loads for SEPTA As-is, AREMA As-is, andAREMA-Case 2 turnouts at 25 mph
Facing Point Run SEPTA As-is AREMA As-is AREMA-Case 2 25 mph Max (%) Max (%) Max (%) Max (%) Max (%) Max (%) Max (%) Max (%) Max (%)
Wheel Axle Unloading Loading Range Unloading Loading Range Unloading Loading Range Left 1 18.3 71.5 89.8 16.1 50.2 66.3 2.8 53.1 55.9
Right 1 66.2 19.3 85.5 44.4 23.7 68.1 48.1 7.5 55.6
Left 2 23.4 74.5 97.9 59.6 39.1 98.7 21.2 53.9 75.1
Right 2 69.1 28.1 97.2 34.2 59.8 94.0 47.6 21.5 69.1
Left 3 89.5 67.1 156.6 5.0 64.2 69.2 1.3 56.8 58.1
Right 3 61.7 42.1 103.8 59.6 10.4 70.0 51.2 6.8 58.0 Left 4 46.3 87.0 133.3 100.0 114.2 214.2 14.6 47.2 61.8
Right 4 81.8 52.4 134.2 100.0 23.7 123.7 41.2 20.0 61.2
Trailing Point
25 mph Wheel Axle
Left 1 52.3 11.9 64.2 36.6 8.2 44.8 49.0 6.8 55.8
Right 1 6.5 56.8 63.3 3.6 42.1 45.7 0.6 54.6 55.2
Left 2 68.0 41.4 109.4 30.5 18.5 49.0 49.0 14.8 63.8
Right 2 26.4 73.7 100.1 17.5 35.5 53.0 13.1 54.6 67.7
Left 3 64.8 28.8 93.6 29.2 11.2 40.4 38.7 10.4 49.1
Right 3 22.7 70.8 93.5 10.9 34.0 44.9 11.7 43.6 55.3 Left 4 84.6 44.3 128.9 29.2 22.2 51.4 42.8 25.1 67.9
Right 4 35.3 89.9 125.2 24.2 34.7 58.9 27.4 48.0 75.4
(text continues on page 37)
27
Figure 20. Most negative and most positive car body lateral accelerations in facing point and trailing point runs for speeds from 5 to 25 mph.
28
Figure 21. Most negative and most positive car body yaw accelerations in facing point and trailing point runs for speeds from 5 to 25 mph.
29
Figure 22. Most negative and most positive lead bolster lateral accelerations in facing point and trailing point runs for speeds from 5 to 25 mph.
30
Figure 23. Most negative and most positive wheel L/V ratios for SEPTA As-is turnout for speeds from 5 to 25 mph.
31
Figure 24. Most negative and most positive wheel L/V ratios for AREMA As-is turnout for speeds from 5 to 25 mph.
32
Figure 25. Most negative and most positive wheel L/V ratios for AREMA-Case 2 turnout for speeds from 5 to 25 mph.
33
Figure 26. Comparison of axle sum L/V ratios between SEPTA As-is, AREMA As-is, and AREMA-Case 2 turnouts forspeeds from 5 to 25 mph.
34
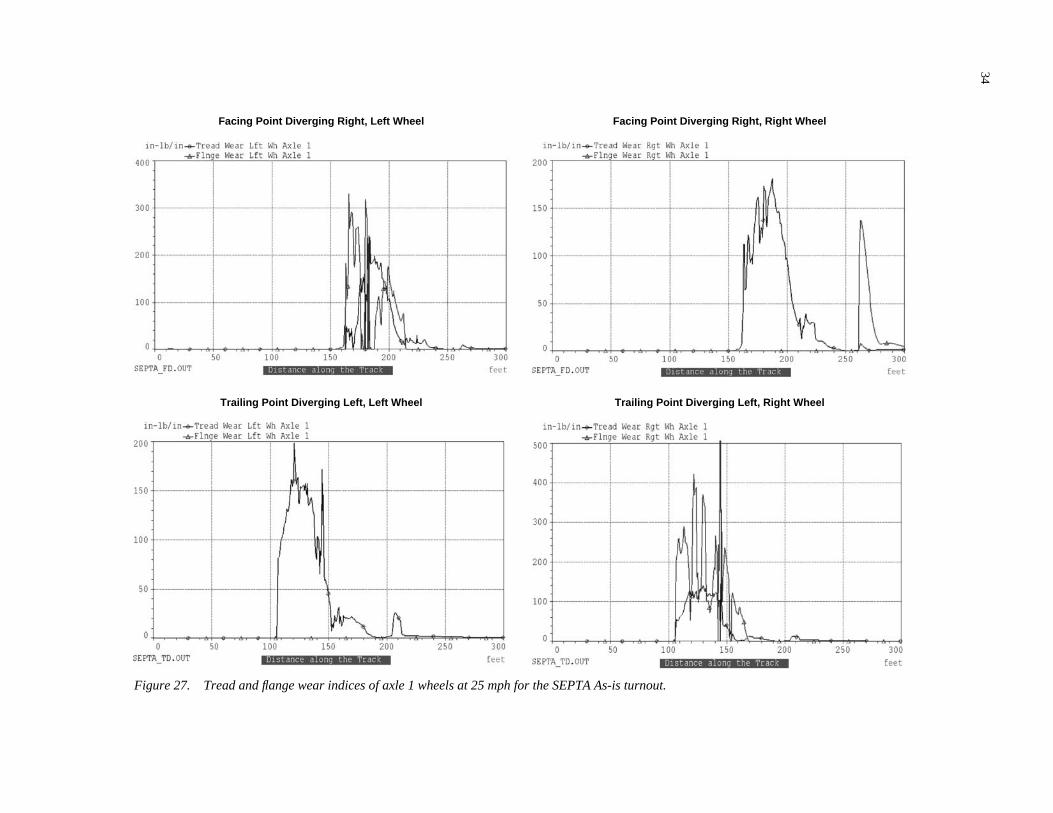
Figure 27. Tread and flange wear indices of axle 1 wheels at 25 mph for the SEPTA As-is turnout.
Facing Point Diverging Right, Left Wheel Facing Point Diverging Right, Right Wheel
Trailing Point Diverging Left, Left Wheel Trailing Point Diverging Left, Right Wheel
35
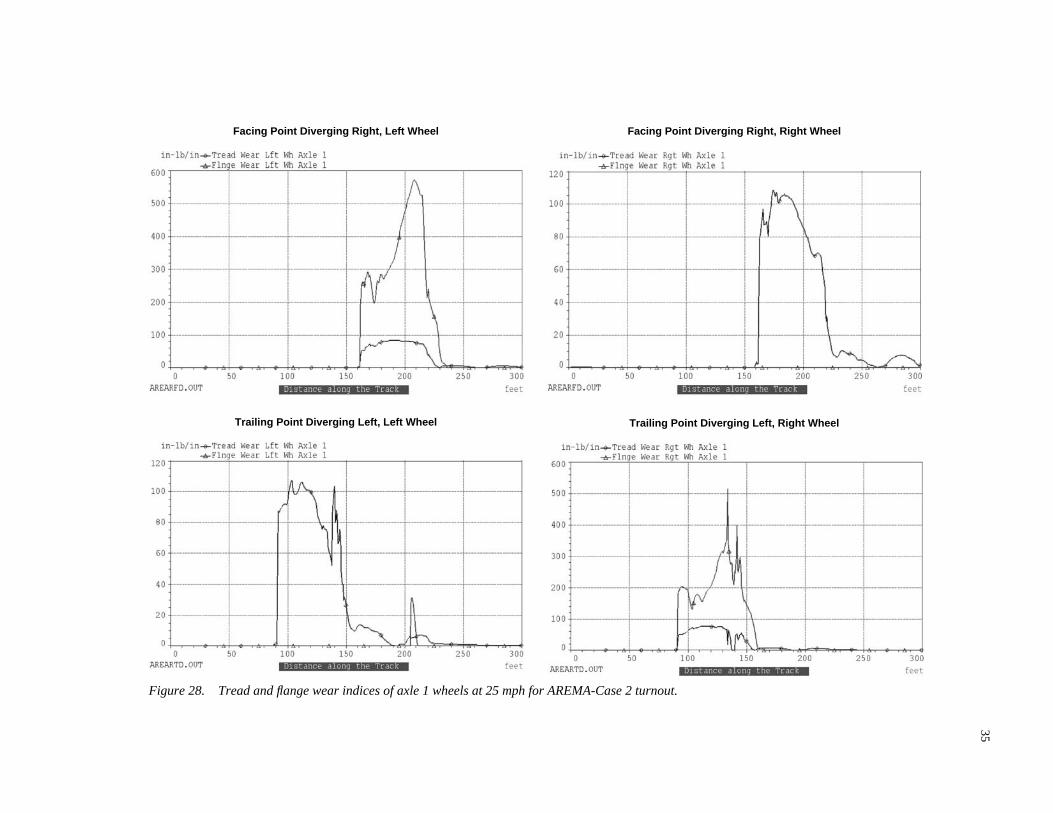
Figure 28. Tread and flange wear indices of axle 1 wheels at 25 mph for AREMA-Case 2 turnout.
Facing Point Diverging Right, Left Wheel Facing Point Diverging Right, Right Wheel
Trailing Point Diverging Left, Left Wheel Trailing Point Diverging Left, Right Wheel

36
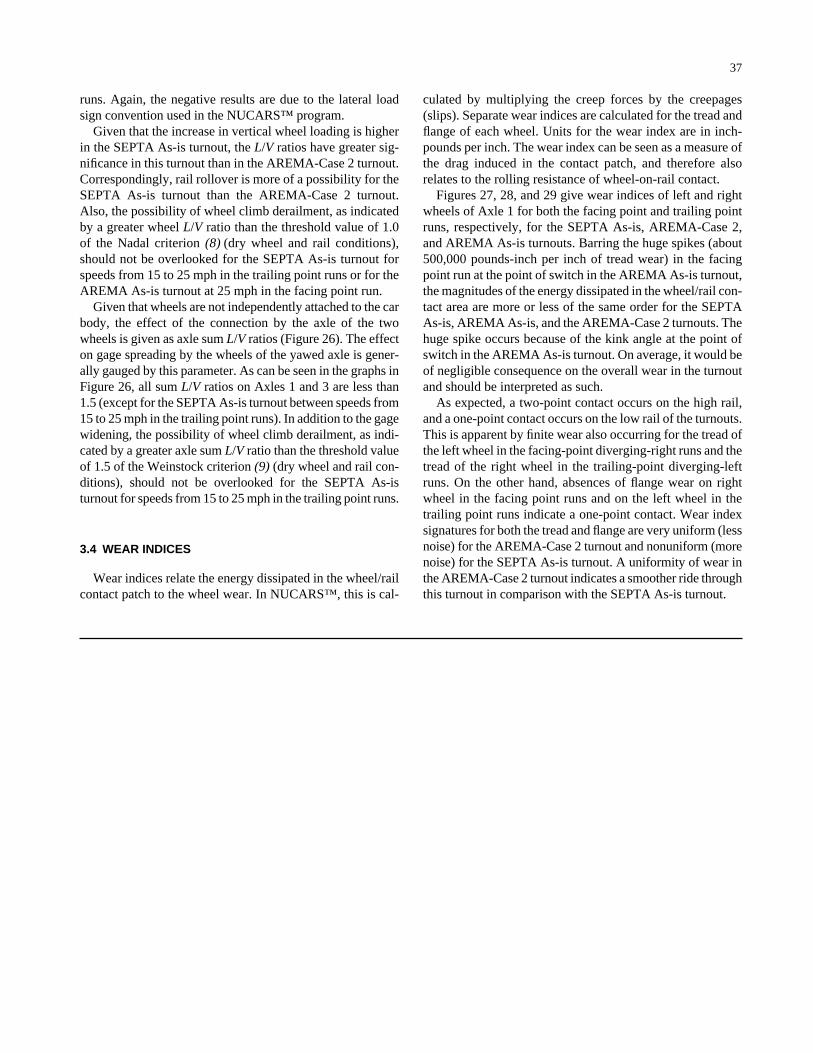
Figure 29. Tread and flange wear indices of axle 1 wheels at 25 mph for AREMA As-is turnout.
Facing Point Diverging Right, Left Wheel Facing Point Diverging Right, Right Wheel
Trailing Point Diverging Left, Left Wheel Trailing Point Diverging Left, Right Wheel
runs. Again, the negative results are due to the lateral loadsign convention used in the NUCARS™ program.
Given that the increase in vertical wheel loading is higherin the SEPTA As-is turnout, the L/V ratios have greater sig-nificance in this turnout than in the AREMA-Case 2 turnout.Correspondingly, rail rollover is more of a possibility for theSEPTA As-is turnout than the AREMA-Case 2 turnout.Also, the possibility of wheel climb derailment, as indicatedby a greater wheel L/V ratio than the threshold value of 1.0of the Nadal criterion (8) (dry wheel and rail conditions),should not be overlooked for the SEPTA As-is turnout forspeeds from 15 to 25 mph in the trailing point runs or for theAREMA As-is turnout at 25 mph in the facing point run.
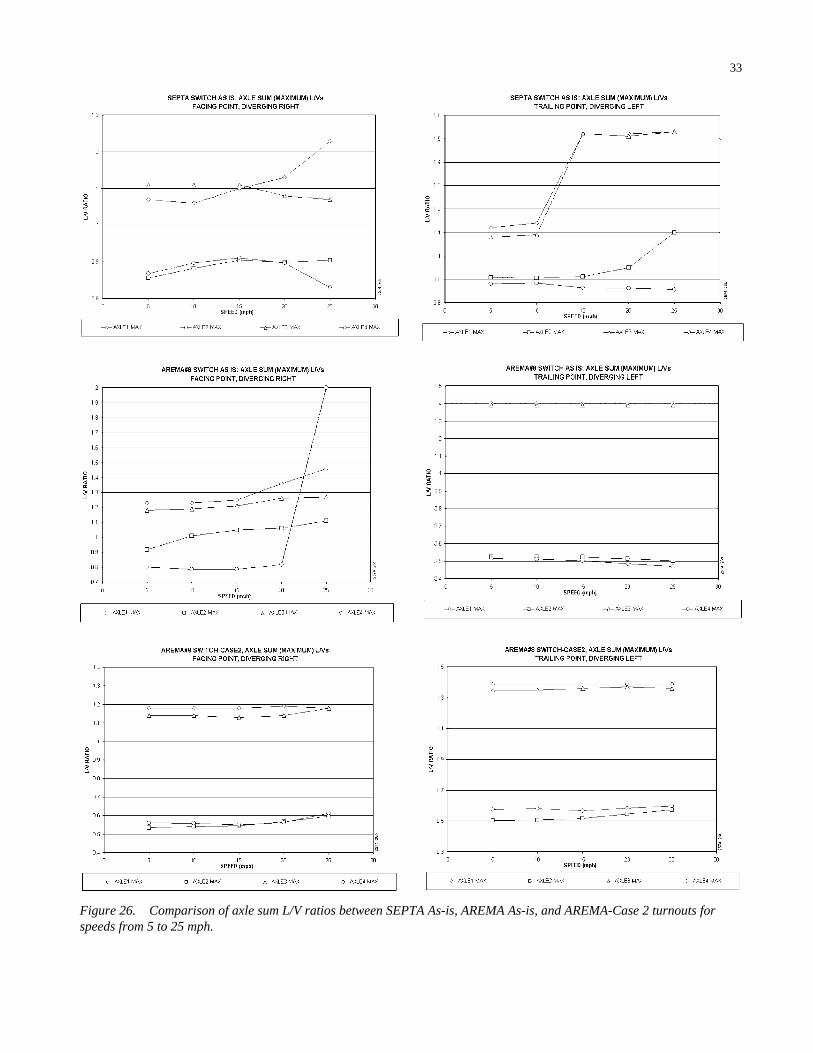
Given that wheels are not independently attached to the carbody, the effect of the connection by the axle of the twowheels is given as axle sum L/V ratios (Figure 26). The effecton gage spreading by the wheels of the yawed axle is gener-ally gauged by this parameter. As can be seen in the graphs inFigure 26, all sum L/V ratios on Axles 1 and 3 are less than1.5 (except for the SEPTA As-is turnout between speeds from15 to 25 mph in the trailing point runs). In addition to the gagewidening, the possibility of wheel climb derailment, as indi-cated by a greater axle sum L/V ratio than the threshold valueof 1.5 of the Weinstock criterion (9) (dry wheel and rail con-ditions), should not be overlooked for the SEPTA As-isturnout for speeds from 15 to 25 mph in the trailing point runs.
3.4 WEAR INDICES
Wear indices relate the energy dissipated in the wheel/railcontact patch to the wheel wear. In NUCARS™, this is cal-
37
culated by multiplying the creep forces by the creepages(slips). Separate wear indices are calculated for the tread andflange of each wheel. Units for the wear index are in inch-pounds per inch. The wear index can be seen as a measure ofthe drag induced in the contact patch, and therefore alsorelates to the rolling resistance of wheel-on-rail contact.
Figures 27, 28, and 29 give wear indices of left and rightwheels of Axle 1 for both the facing point and trailing pointruns, respectively, for the SEPTA As-is, AREMA-Case 2,and AREMA As-is turnouts. Barring the huge spikes (about500,000 pounds-inch per inch of tread wear) in the facingpoint run at the point of switch in the AREMA As-is turnout,the magnitudes of the energy dissipated in the wheel/rail con-tact area are more or less of the same order for the SEPTAAs-is, AREMA As-is, and the AREMA-Case 2 turnouts. Thehuge spike occurs because of the kink angle at the point ofswitch in the AREMA As-is turnout. On average, it would beof negligible consequence on the overall wear in the turnoutand should be interpreted as such.
As expected, a two-point contact occurs on the high rail,and a one-point contact occurs on the low rail of the turnouts.This is apparent by finite wear also occurring for the tread ofthe left wheel in the facing-point diverging-right runs and thetread of the right wheel in the trailing-point diverging-leftruns. On the other hand, absences of flange wear on rightwheel in the facing point runs and on the left wheel in thetrailing point runs indicate a one-point contact. Wear indexsignatures for both the tread and flange are very uniform (lessnoise) for the AREMA-Case 2 turnout and nonuniform (morenoise) for the SEPTA As-is turnout. A uniformity of wear inthe AREMA-Case 2 turnout indicates a smoother ride throughthis turnout in comparison with the SEPTA As-is turnout.
38
CHAPTER 4
FINDINGS AND CONCLUSIONS
The as-built SEPTA tangential design spiraled geometryswitch in a Number 8 turnout performs well in comparisonwith the per-plan AREMA 13-ft curved switch Number 8turnout. In its intended service, with 5- to 15-mph operations,the switch is superior to the AREMA switch in minimizingloads and accelerations. However, the SEPTA switch doesshow higher than desired accelerations under B-IV car oper-ations. An improved performance switch can be developedfor this particular operation.
Parametric studies of some design features were conductedto determine their effects on switch performance. Tangentialswitch entry is essential to the good performance of theSEPTA switch. Elimination of a kink angle and its resultantabrupt spike in dynamic loading produce a smooth ride andmore even switch wear. The spiral switch entry and exit curvesare effective at smoothing the ride through the switch byevening the accelerations. However, the resultant very smallradius closure curve may be detrimental for certain types ofequipment (i.e., longer cars) or service (higher speeds).
In this particular case, the advantages of the SEPTA switchare not fully utilized with the B-IV cars because of the lengthof these cars. The extremely short radius closure curves of theswitch cause the cars to “stringline,” creating relatively highlateral forces. These forces increase rapidly with speed. TheAREMA designs, with larger radius closure curves, accom-modate the longer cars better at higher speeds.
The use of AMS castings for the switch points in the SEPTAswitch produces a tough and durable switch point. When theswitches were initially produced, the AMS point was vastlysuperior to rail steels of the time. However, modern rail steelsperform as well as AMS in curve wear. The layout of theswitch, with good geometry and guardrails, make the advan-tages of AMS almost redundant. The high cost of fabricatingAMS switch points makes this a costly choice for modernswitches.
The housed switch point is a feature that provides benefitsfor switches with significant diverging traffic. The switch pointis thickened to make it more robust and diminish the risk ofsplit switch derailments. The stock rail is diminished to accom-plish this, which may result in a foreshortened life for this com-ponent. The effect of housing will be to eliminate the sharpdynamic loading and localized wear at the point of switch seenin the field on AREMA switches and in the NUCARS™ sim-ulations done for this study. The running surface discontinu-
ity at the point of switch seen at the gage face is especiallyimportant if guardrails are not used in the switch.
Using guardrails in the switch is necessary for safety rea-sons; the guardrails ensure that a safe operation is maintainedas the switch wears and deforms. The guardrail and back ofwheel flange contact are nearly vertical, even on worn com-ponents. Thus, wheel climb is less likely than with wornwheel flange/switch point contact. As for switch performance,the dynamic loads in the switch are little changed. Switchpoint life is improved by transferring wear from switch pointto guard rail.
Use of guardrails in front of the switch protects the switchpoints from impacts. The need for, or effectiveness of, theguardrails is diminished by the good switch geometry andhoused point design of the SEPTA switch.
The idea of separating the point of switch from the pointof curvature (or point of spiral, in the case of the SEPTAswitch), where the point of curvature comes first, is good forrelatively low speed mainline operations. The mainline trainshave to negotiate a small curve as a penalty for making thediverging route curve somewhat larger. This design is a com-promise between a lateral switch and an equilateral switchbut is biased heavily toward a lateral switch configuration.This also helps the curved switch point at the expense of thestraight switch point by lining up wheels for the divergingroute curve prior to the switch point, thereby contributing tothe good wear performance of the SEPTA switches.
The performance of the replacement option AREMA Num-ber 8 nontangential turnout (designated as AREMA As-is)having an angle at point of 1 deg 41 ft 31 in. is poor to some-what equivalent as compared with the SEPTA As-is turnout.Very high lateral loads arise due to the entry angle or kinkangle of the AREMA As-is turnout. These loads are as highas 20,100 lb at 25 mph on the left wheel of Axle 1 in thefacing-point diverging-right run. Even at lower speeds, highlateral loads are produced—as much as 14,300 lb at 5 mphon the left wheel of Axle 1. Performances evaluated in termsof L/V ratios, lateral accelerations of axles, bolsters, and carbody suggest that AREMA As-is is not on par with the per-formance of the existing SEPTA As-is turnout.
The performance of the SEPTA As-is switch when usedby the B-IV car is highly speed dependent. Up to 15 mph, theSEPTA As-is switch performs better than AREMA typeswitches of similar lead length. However, performance dimin-
39
ishes rapidly with operating speeds above 10 to 15 mph. Forexample, in trailing-point diverging-left runs, lateral loads asmuch as 21,700 lb at 25 mph are generated on the right wheelof Axle 3. Even though the track curvature layout of thisturnout contains a tangential entry to the spiral (840 to 210 ft)with an exit spiral of 210 to 420 ft corresponding to the fac-ing point diverging right runs, the “tightness” of the spiralgeometry with respect to the long truck centers and wheelbaseof the B-IV cars gives rise to nonsmooth steering through thisturnout due to the car body acting as a long rigid chord of thetrack curve. This chord accommodation to various radii ofthe track curvature is evidenced by high wheel lateral loads,rapidly changing axle lateral and yaw accelerations, high ver-tical unloading and loading of the wheels, and high L/V ratios.A degenerated ride quality is therefore evident for the SEPTAAs-is turnout.
Thus, both switch designs have deficiencies for servicewith the B-IV cars at speeds above 10 to 15 mph. A betterswitch would employ the good features of each design:
• Tangential switch entry of SEPTA designs and• Large closure radius of AREMA designs.
The modeled AREMA-Case 2 is an example of this typeof switch. The lack of “tightness” of the track curvatures (andconsequently the removal of the adverse effects due to carbody twist, its chord effect, and rapid changes in axle yaw)are evident in the performance of the B-IV cars on theAREMA-Case 2 turnout. This replacement option consists of
a tangential entry to a switch rail of 372-ft radius and a clo-sure rail of the same radius as the switch radius to give a leadlength of 59 ft, which is very close to the lead length of theSEPTA As-is turnout.
Smooth steering of B-IV cars through the curvature of theAREMA-Case 2 turnout results for both the facing point andtrailing point runs. Wheel lateral loads increase graduallyfrom 5 to 25 mph. This change in the maximum wheel lateralloads from 5 mph to 25 mph is less than 20%. The improvedride quality is also evident from smaller car body lateral andyaw accelerations, reduced axle lateral and yaw accelera-tions, lesser vertical unloading and loading of the wheels, andlower L/V ratios. The improved ride quality results in treadand flange wear indices that are generally uniform throughthe turnout curvature, indicating an even wear and probablya longer life for the AREMA-Case 2 turnout.
For speeds less than 15 mph, performance of B-IV carsthrough the diverging route of the SEPTA As-is turnout ismarginal at best. At speeds higher than 15 mph, the ride qual-ity of these “long” cars degrades very fast. Of the variousreplacement curvatures analyzed, it appears that the AREMA-Case 2 turnout will be the best replacement for the existingSEPTA As-is turnout for all speeds from 5 to 25 mph. Theride quality of the B-IV cars improves significantly throughthe AREMA-Case 2 turnout curvature as compared with theSEPTA As-is turnout curvature.
The second phase of this project will develop a prototypeswitch for transit use. The AREMA-Case 2 switch geometrywill serve as a starting point for the design of the switch.
40
REFERENCES
1. Handal, Stephan, “Partial Validation of a Generalized TurnoutModel Based on NUCARS™,” Report R-797, Association ofAmerican Railroads, Washington, D.C. (March 1992).
2. Lord Corporation, V Spring Bonded (for Philadelphia), DrawingNumber VSB-1201-10 (February 1990).
3. Wm. Wharton Jr. and Company, Inc., Contract No. 124 for Cityof Philadelphia, Manganese Switch 840-210 Spiral for BroadStreet Subway, Drawing Number V-97163, Easton, Pennsylva-nia (August 1926).
4. SEPTA, BSS-Erie Avenue Upper Level Special Work, DrawingNumber 7-W-16984 (February 1976).
5. AREMA, “Portfolio of Trackwork Plans,” Plan Number 121-62(1996).
6. FRA, Track Safety Standards, Part 213 (1999).7. Willow, Robert, “Compound Point Geometry,” AREMA Sym-
posium on Turnouts and Special Trackwork (August 1996).8. Nadal , M. J., “Theorie de la Stabilite des Locomotives,” Part 2,
Movement de Lacet, Annales des Mines, 10, 232 (1896).9. Weinstock, H., “Wheel Climb Derailment Criteria for Evaluation
of Rail Vehicle Safety,” American Society of Mechanical Engi-neers Paper 84-WA/RT-1, 1984 ASME Winter Annual Meeting,Phoenix, Arizona (1984).
Abbreviations used without definitions in TRB publications:
AASHO American Association of State Highway OfficialsAASHTO American Association of State Highway and Transportation OfficialsAPTA American Public Transportation AssociationASCE American Society of Civil EngineersASME American Society of Mechanical EngineersASTM American Society for Testing and MaterialsATA American Trucking AssociationsCTAA Community Transportation Association of AmericaCTBSSP Commercial Truck and Bus Safety Synthesis ProgramFAA Federal Aviation AdministrationFHWA Federal Highway AdministrationFMCSA Federal Motor Carrier Safety AdministrationFRA Federal Railroad AdministrationFTA Federal Transit AdministrationIEEE Institute of Electrical and Electronics EngineersITE Institute of Transportation EngineersNCHRP National Cooperative Highway Research ProgramNCTRP National Cooperative Transit Research and Development ProgramNHTSA National Highway Traffic Safety AdministrationNTSB National Transportation Safety BoardSAE Society of Automotive EngineersTCRP Transit Cooperative Research ProgramTRB Transportation Research BoardU.S.DOT United States Department of Transportation