Embed Size (px)
Citation preview
TEACHER EFFECTIVENESS INITIATIVE VALUE-ADDED TRAINING
Value-Added Research Center (VARC)
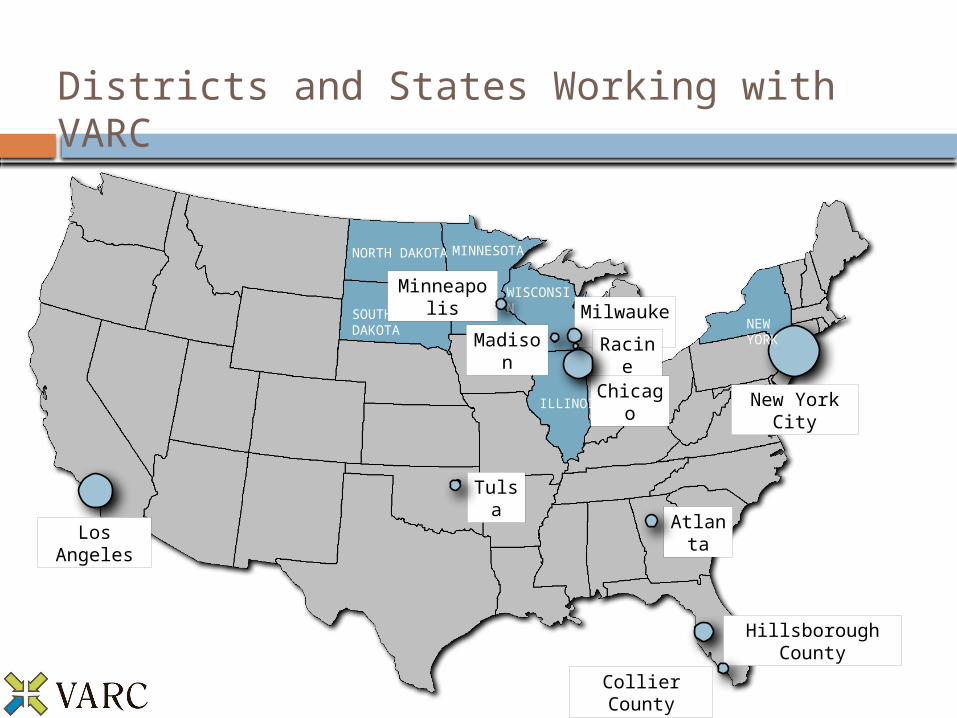
MinneapolisMilwaukee
Racine
Chicago
Madison
Tulsa
Atlanta
New York City
Los Angeles
Hillsborough County
NORTH DAKOTA
SOUTH DAKOTA
MINNESOTA
WISCONSIN
ILLINOIS
Districts and States Working with VARC
Collier County
NEW YORK
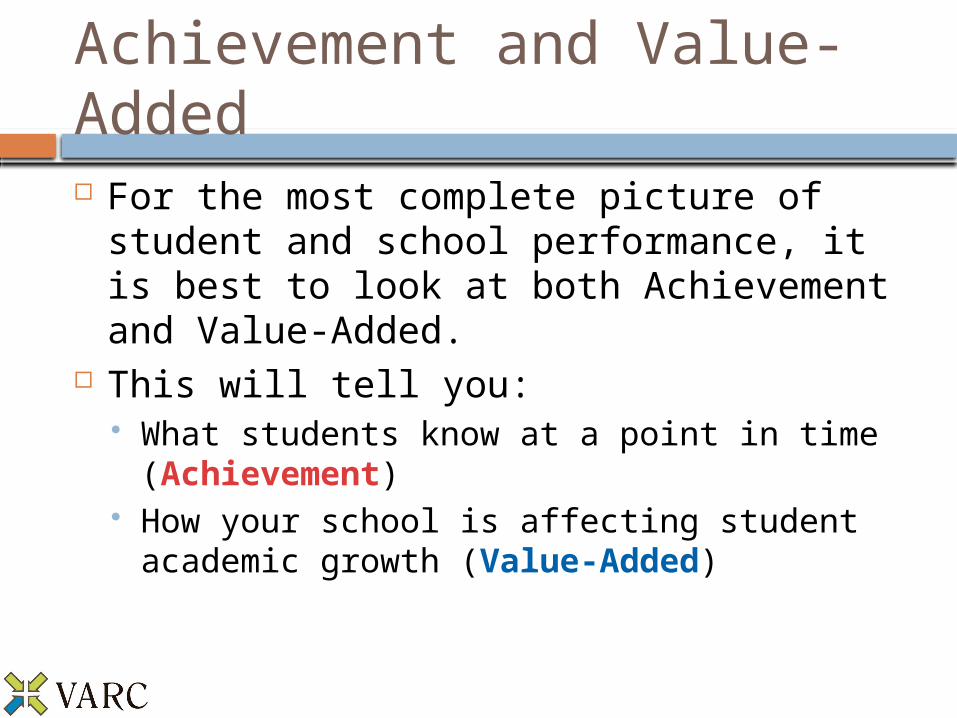
For the most complete picture of student and school performance, it is best to look at both Achievement and Value-Added.
This will tell you: What students know at a point in time
(Achievement) How your school is affecting student
academic growth (Value-Added)
Achievement and Value-Added
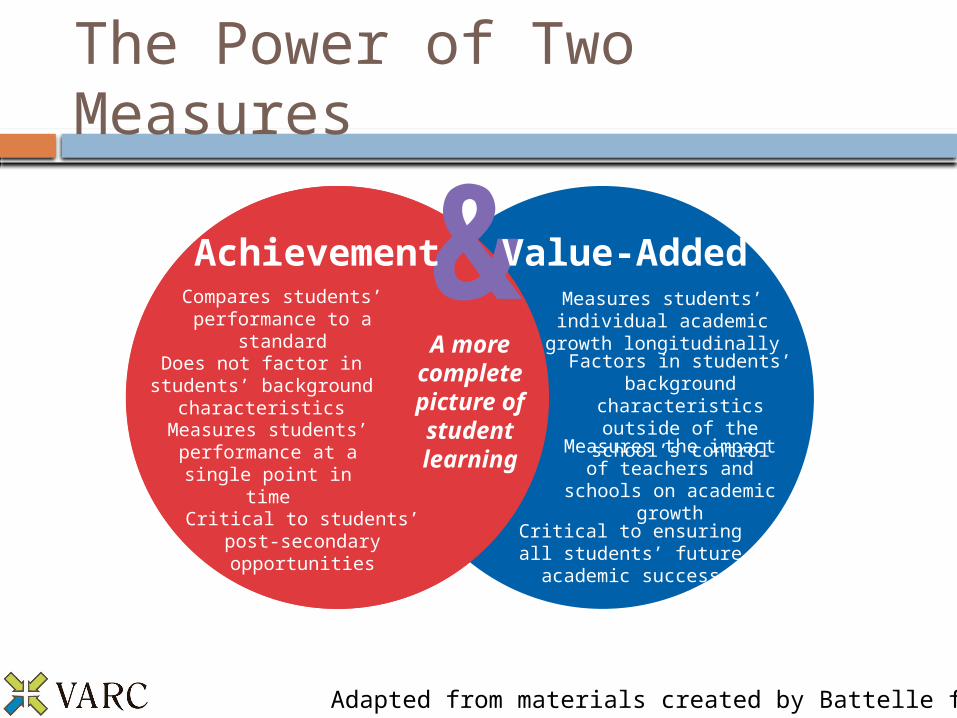
The Power of Two Measures
&A more
complete picture of student learning
Achievement Value-AddedCompares students’
performance to a standard
Does not factor in students’ background characteristics
Measures students’ performance at a single
point in time
Critical to students’ post-secondary opportunities
Measures students’ individual academic growth longitudinally
Factors in students’ background characteristics
outside of the school’s control
Critical to ensuring all students’ future academic success
Measures the impact of teachers and schools on
academic growth
Adapted from materials created by Battelle for Kids
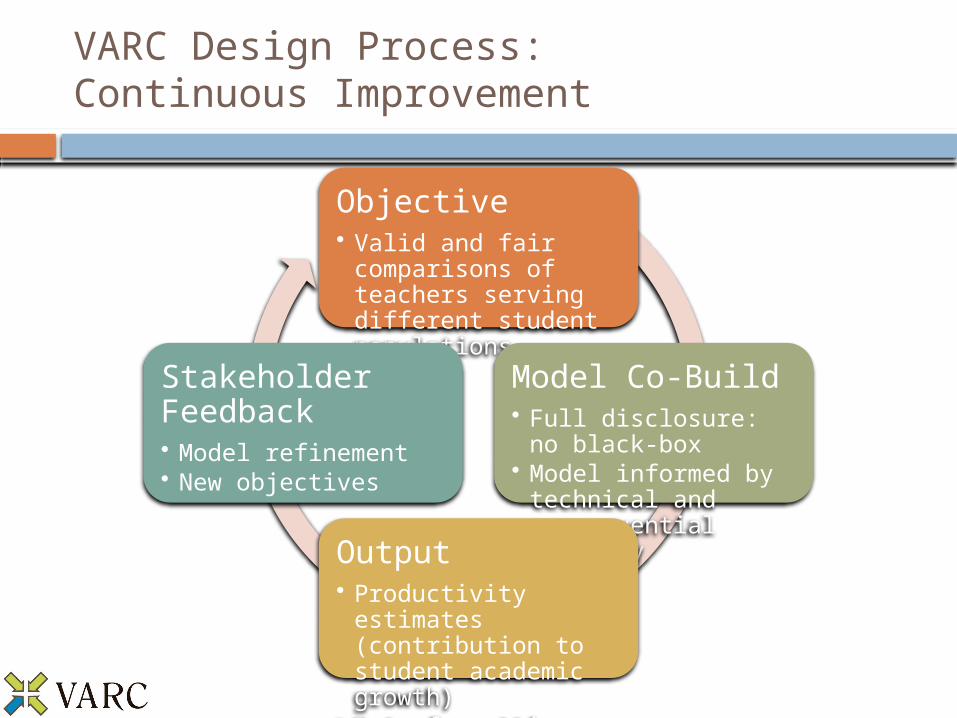
VARC Design Process: Continuous Improvement
Objective• Valid and fair
comparisons of teachers serving different student populations
Model Co-Build• Full disclosure: no
black-box• Model informed by
technical and consequential validity
Output• Productivity estimates
(contribution to student academic growth)
• Data formatting
Stakeholder Feedback• Model refinement• New objectives
The Oak Tree Analogy
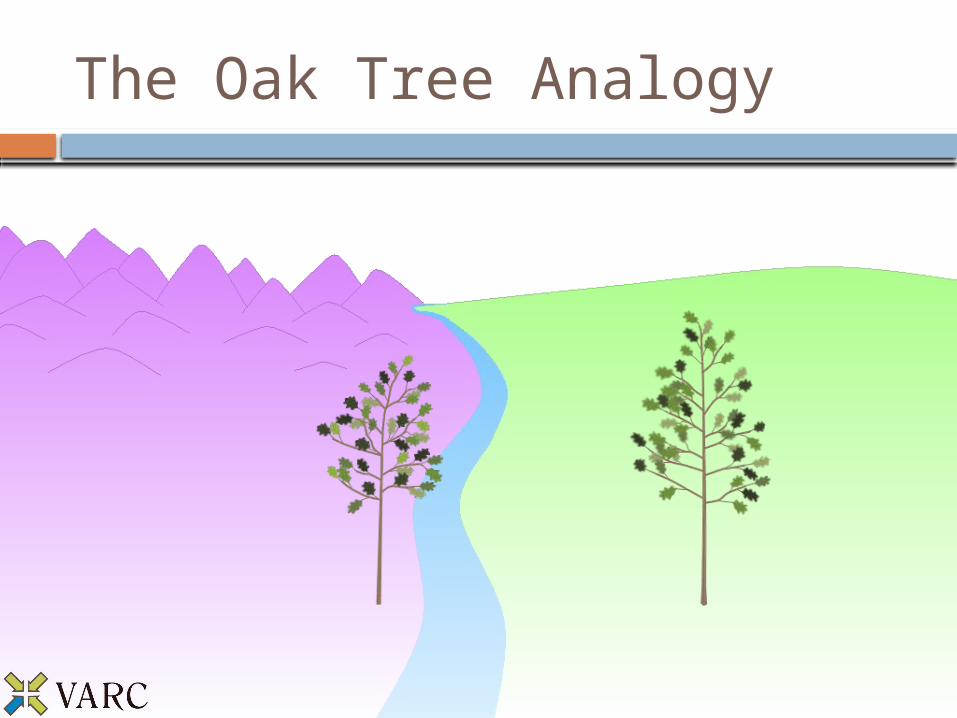
The Oak Tree Analogy
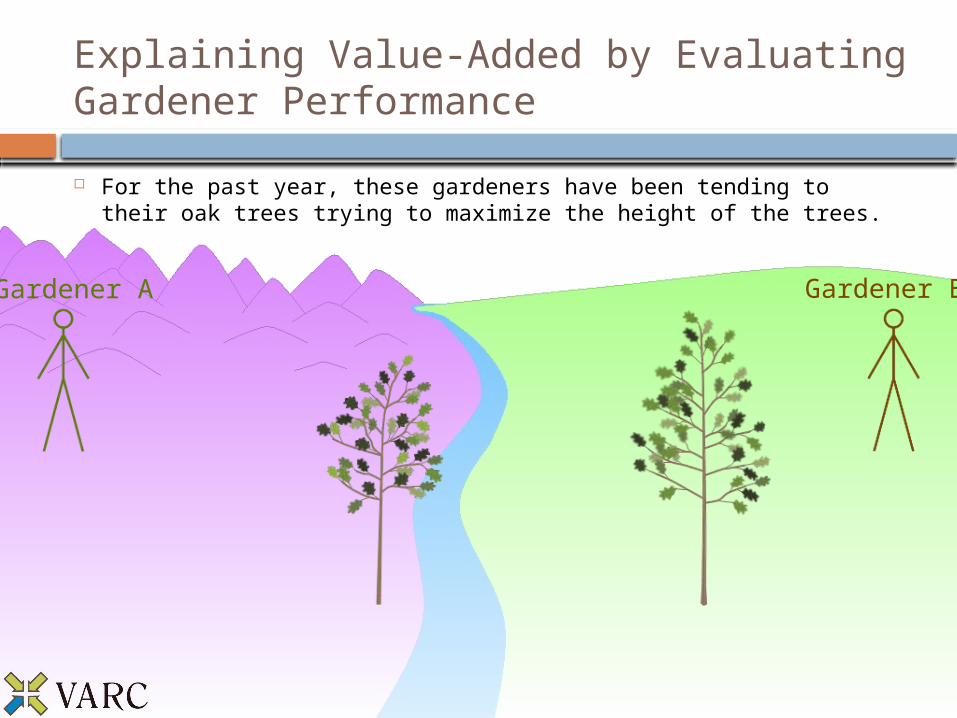
Gardener A Gardener B
Explaining Value-Added by Evaluating Gardener Performance
For the past year, these gardeners have been tending to their oak trees trying to maximize the height of the trees.
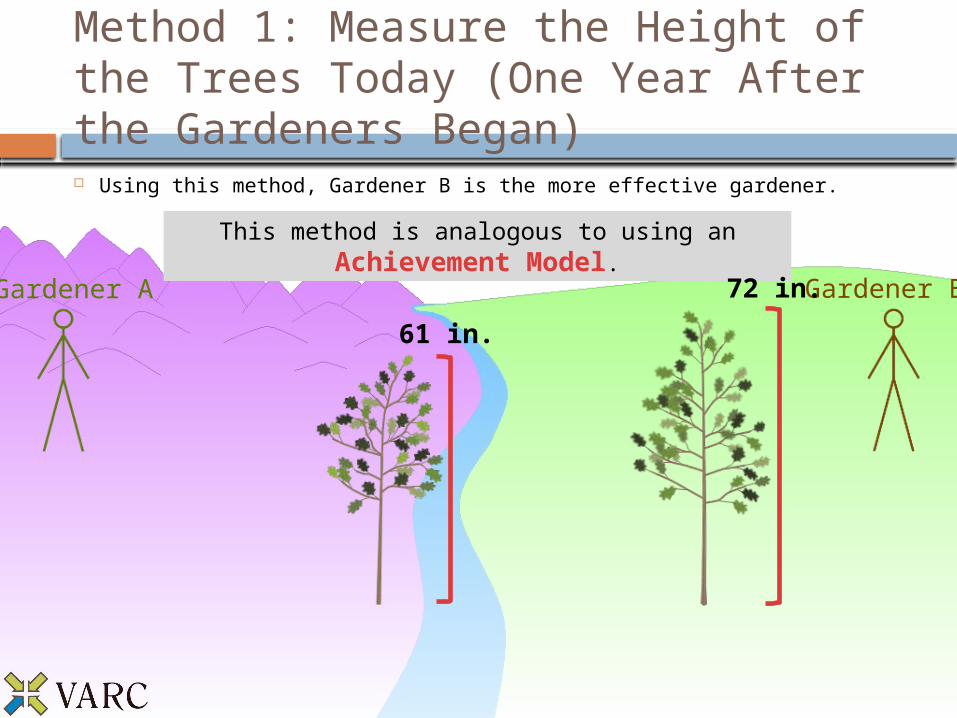
This method is analogous to using an Achievement Model.
Gardener A Gardener B
61 in.
72 in.
Method 1: Measure the Height of the Trees Today (One Year After the Gardeners Began) Using this method, Gardener B is the more effective gardener.
Pause and Reflect
How is this similar to how schools have been evaluated in the past?
What information is missing from our gardener evaluation?
61 in.
72 in.Gardener A Gardener B
Oak AAge 4
(Today)
Oak BAge 4
(Today)
Oak AAge 3
(1 year ago)
Oak BAge 3
(1 year ago)
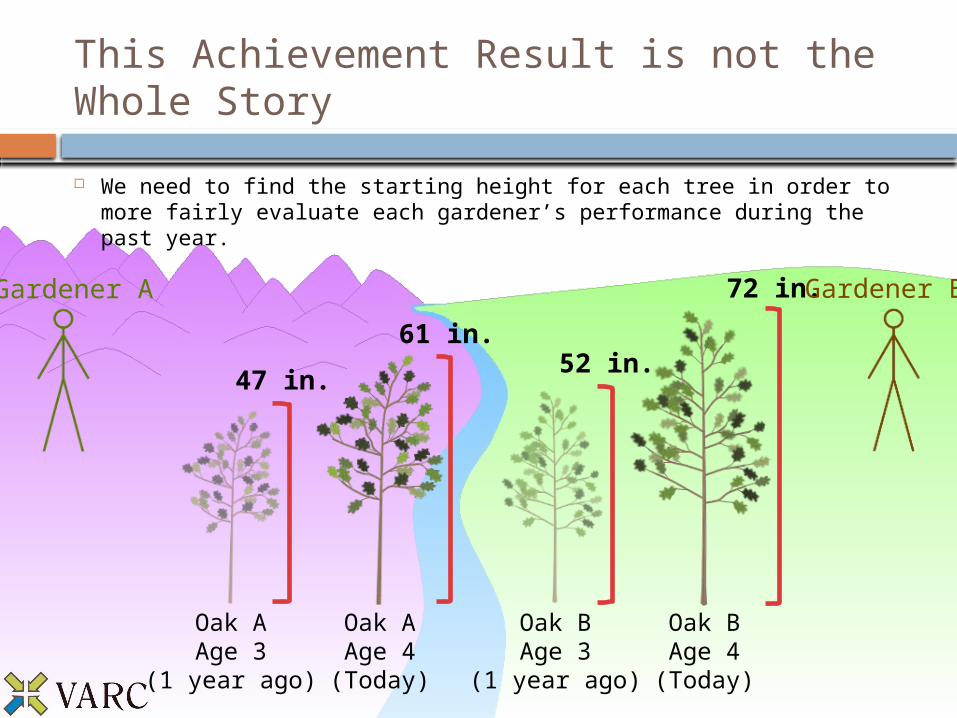
47 in.52 in.
This Achievement Result is not the Whole Story
We need to find the starting height for each tree in order to more fairly evaluate each gardener’s performance during the past year.
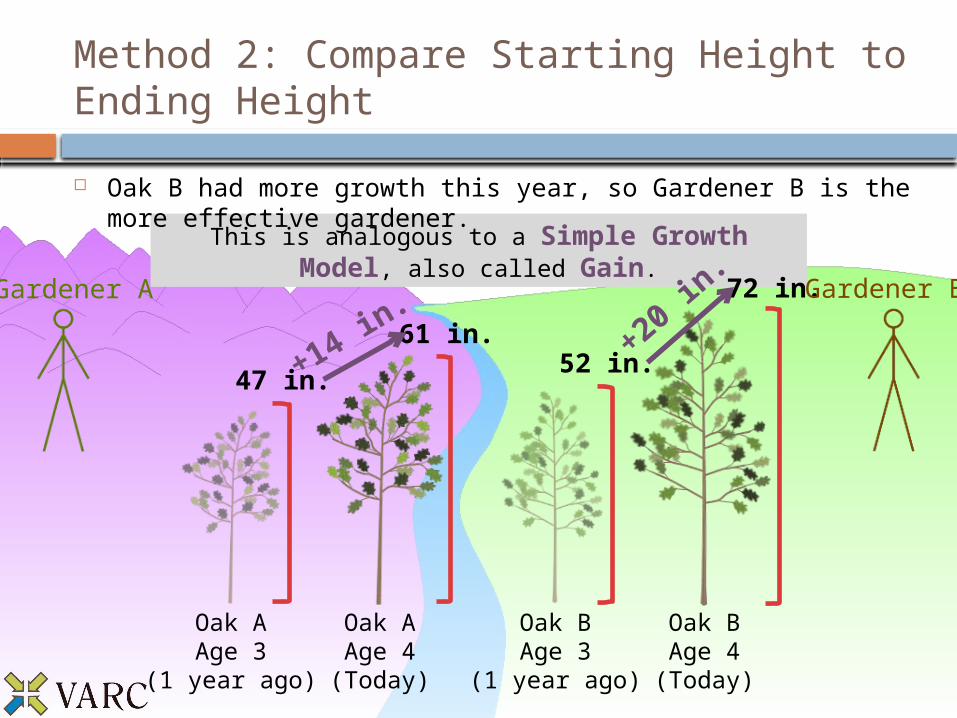
This is analogous to a Simple Growth Model, also called Gain.
61 in.
72 in.Gardener A Gardener B
Oak AAge 4
(Today)
Oak BAge 4
(Today)
Oak AAge 3
(1 year ago)
Oak BAge 3
(1 year ago)
47 in.52 in.+14 in. +20 in
.
Method 2: Compare Starting Height to Ending Height
Oak B had more growth this year, so Gardener B is the more effective gardener.
Gardener A Gardener B
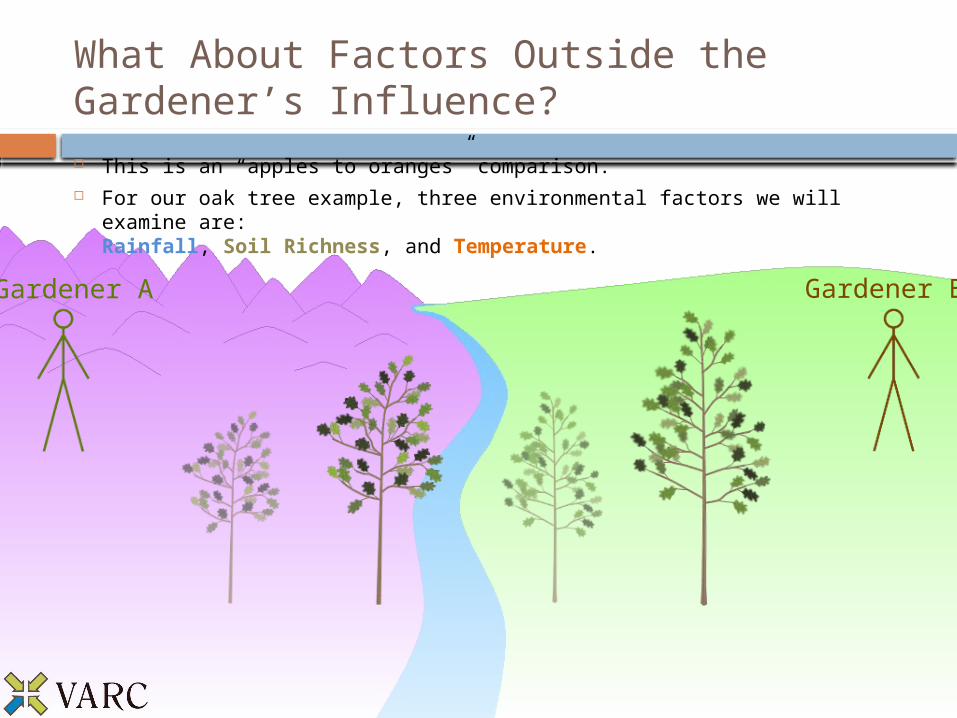
What About Factors Outside the Gardener’s Influence? This is an “apples to oranges” comparison. For our oak tree example, three environmental factors we will examine are:
Rainfall, Soil Richness, and Temperature.
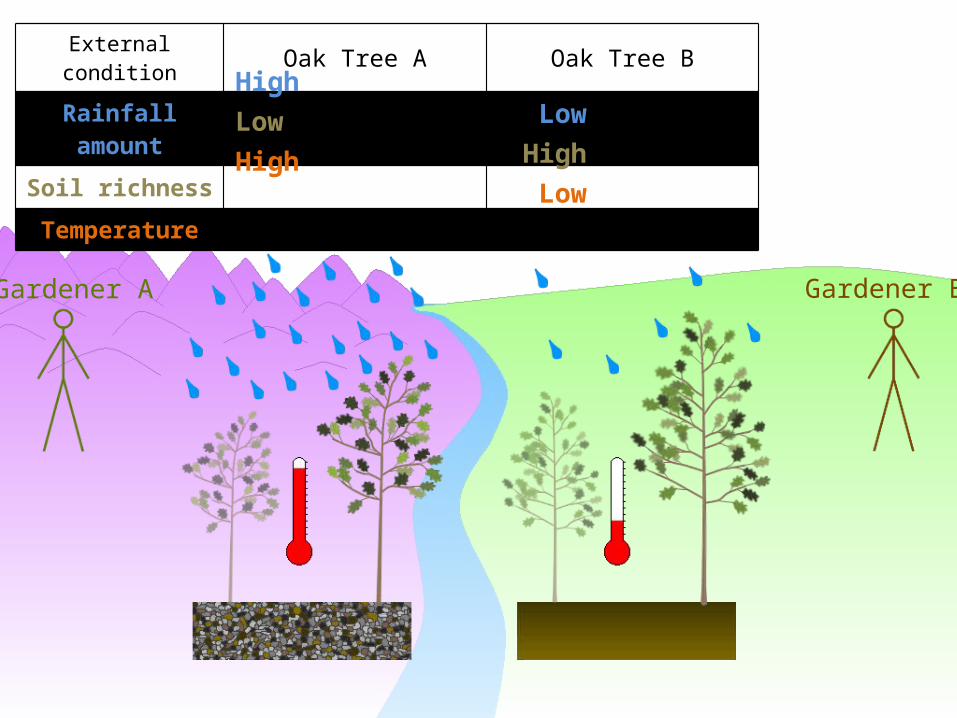
External condition Oak Tree A Oak Tree B
Rainfall amount
Soil richness
Temperature
High LowLow HighHigh Low
Gardener A Gardener B
Gardener A Gardener B
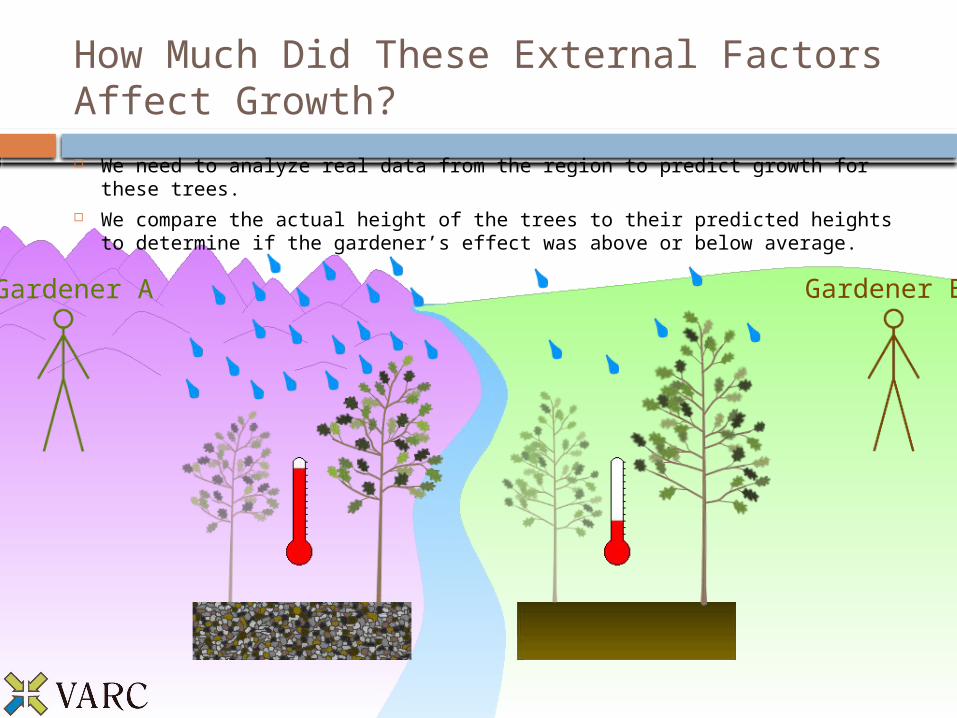
How Much Did These External Factors Affect Growth? We need to analyze real data from the region to predict growth for these trees. We compare the actual height of the trees to their predicted heights to
determine if the gardener’s effect was above or below average.
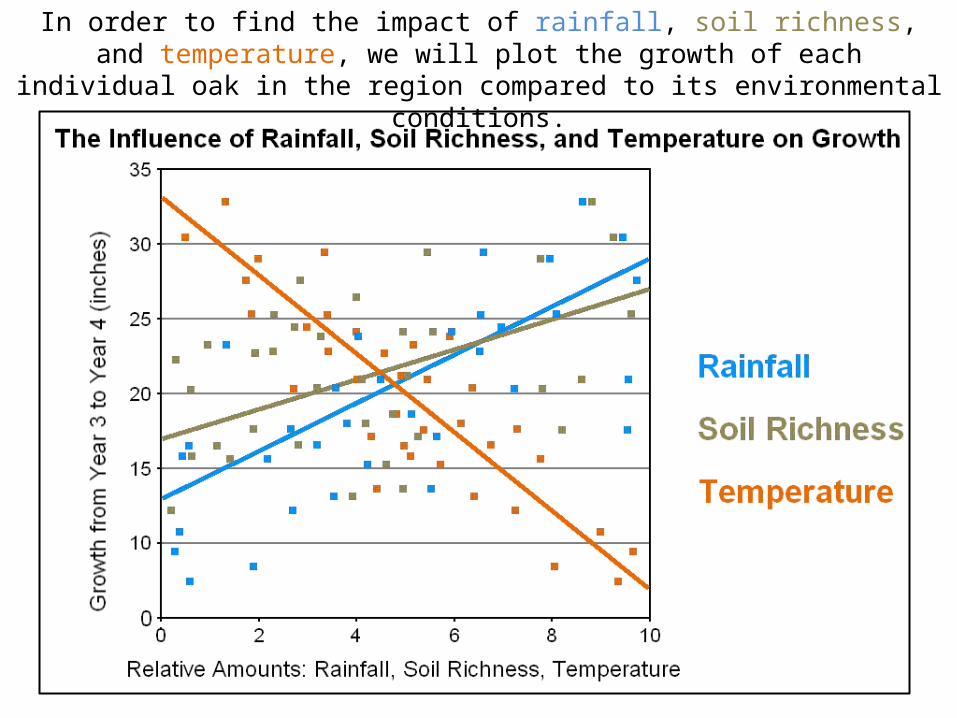
In order to find the impact of rainfall, soil richness, and temperature, we will plot the growth of each individual oak in the region compared to its environmental conditions.
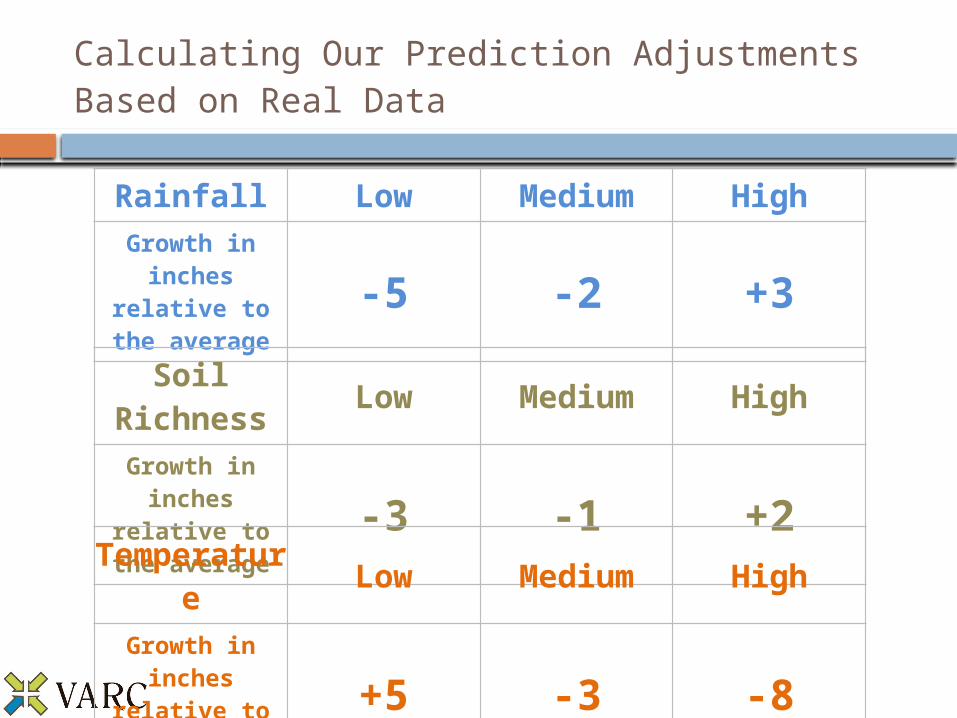
Rainfall Low Medium HighGrowth in
inches relative to
the average
-5 -2 +3
Soil Richness
Low Medium High
Growth in inches
relative to the average
-3 -1 +2Temperatu
reLow Medium High
Growth in inches
relative to the average
+5 -3 -8
Calculating Our Prediction Adjustments Based on Real Data
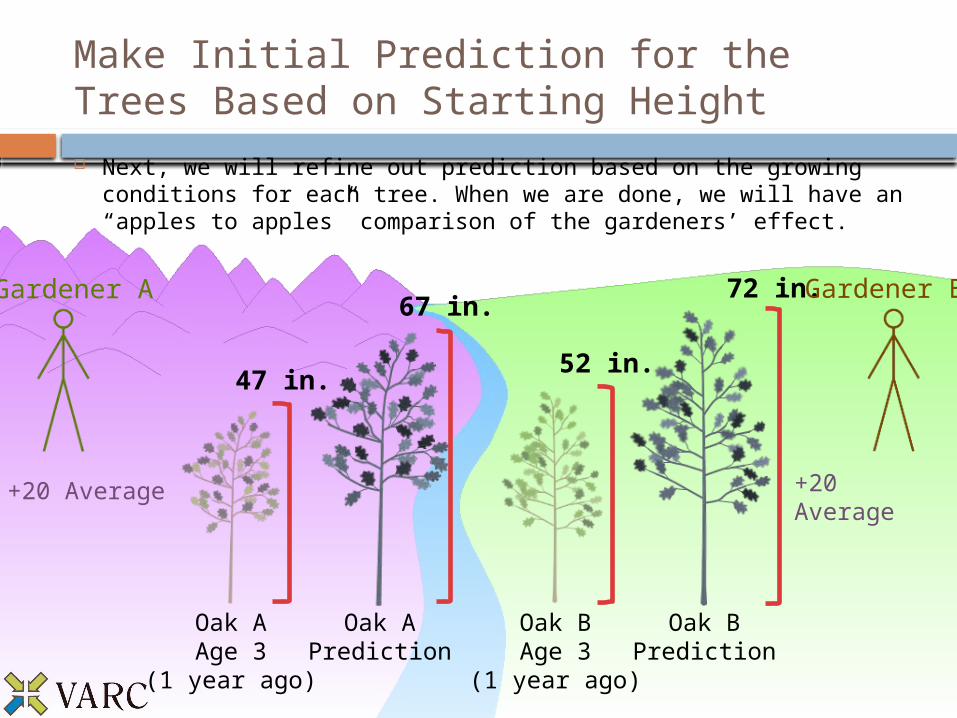
Oak AAge 3
(1 year ago)
Oak BAge 3
(1 year ago)
67 in.72 in.Gardener A Gardener B
Oak APrediction
Oak BPrediction
47 in.52 in.
+20 Average+20 Average
Make Initial Prediction for the Trees Based on Starting Height
Next, we will refine out prediction based on the growing conditions for each tree. When we are done, we will have an “apples to apples” comparison of the gardeners’ effect.
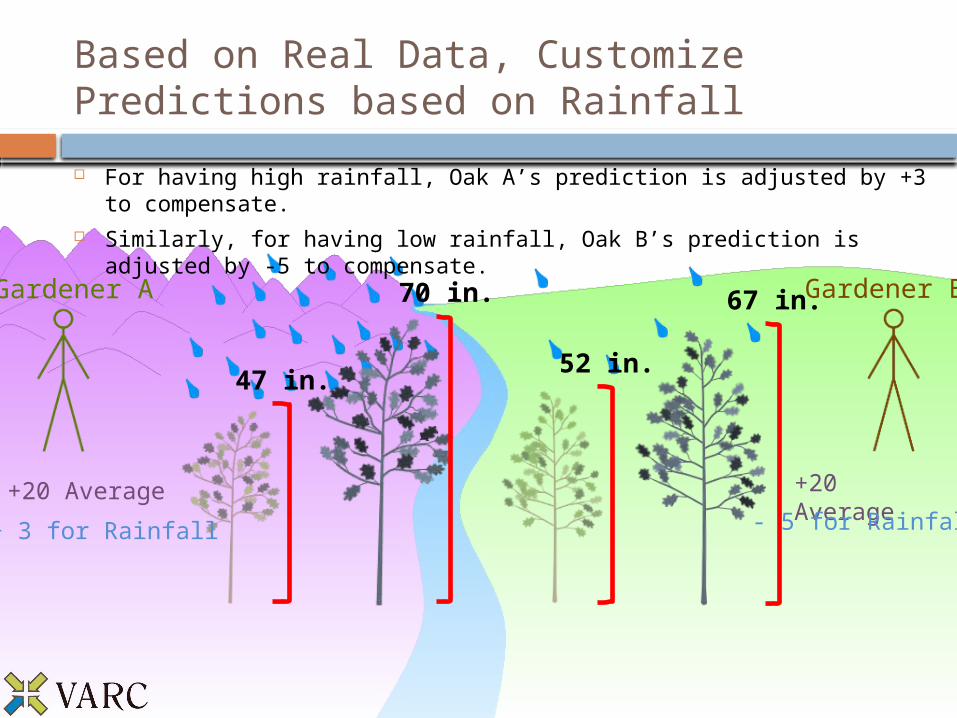
70 in. 67 in.Gardener A Gardener B
47 in.52 in.
+20 Average+20 Average
+ 3 for Rainfall - 5 for Rainfall
Based on Real Data, Customize Predictions based on Rainfall
For having high rainfall, Oak A’s prediction is adjusted by +3 to compensate.
Similarly, for having low rainfall, Oak B’s prediction is adjusted by -5 to compensate.
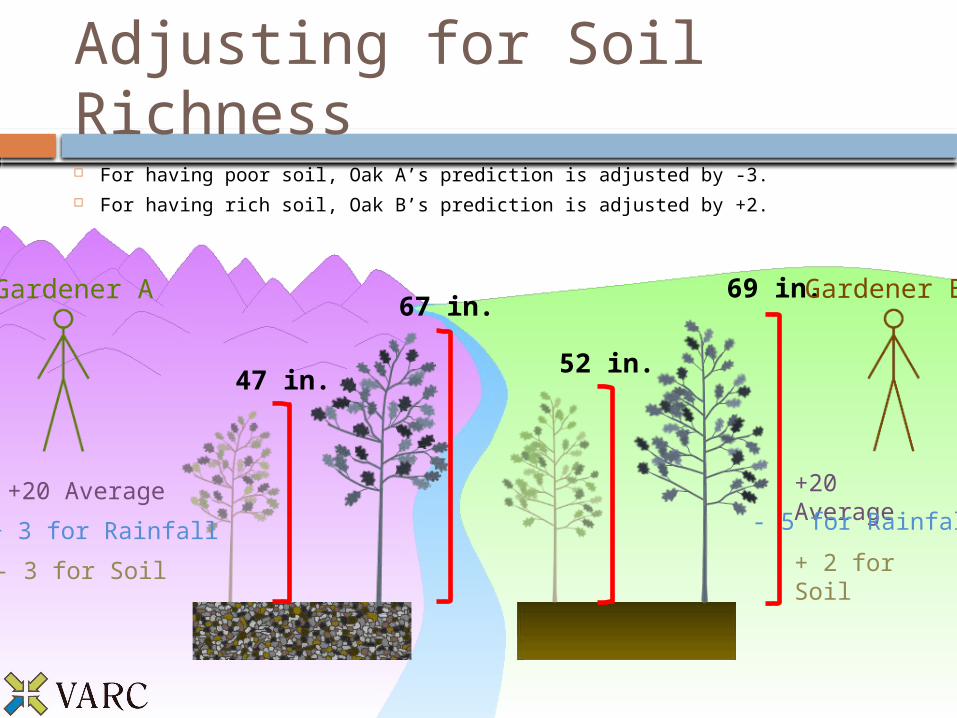
67 in.69 in.Gardener A Gardener B
47 in.52 in.
+20 Average+20 Average
+ 3 for Rainfall
- 3 for Soil + 2 for Soil
- 5 for Rainfall
Adjusting for Soil Richness For having poor soil, Oak A’s prediction is adjusted by -3. For having rich soil, Oak B’s prediction is adjusted by +2.
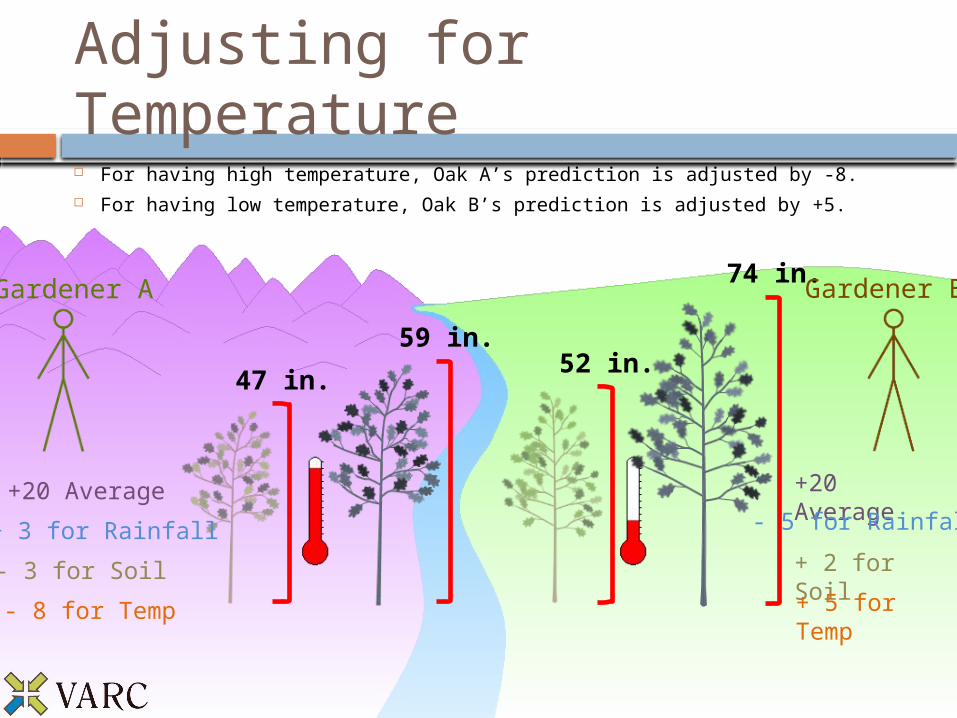
59 in.
74 in.Gardener A Gardener B
47 in.52 in.
+20 Average+20 Average
+ 3 for Rainfall
- 3 for Soil + 2 for Soil
- 8 for Temp + 5 for Temp
- 5 for Rainfall
Adjusting for Temperature For having high temperature, Oak A’s prediction is adjusted by -8. For having low temperature, Oak B’s prediction is adjusted by +5.
+20 Average+20 Average
+ 3 for Rainfall
- 3 for Soil + 2 for Soil
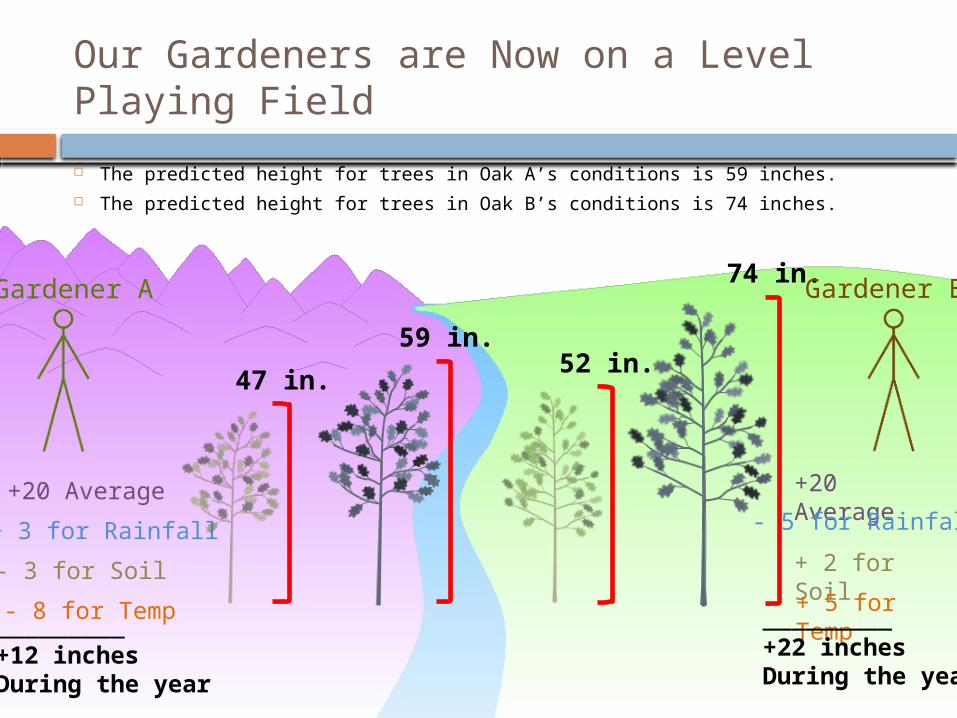
- 8 for Temp + 5 for Temp_________+12 inchesDuring the year
_________+22 inches During the year
59 in.
74 in.Gardener A Gardener B
47 in.52 in.
- 5 for Rainfall
Our Gardeners are Now on a Level Playing Field
The predicted height for trees in Oak A’s conditions is 59 inches. The predicted height for trees in Oak B’s conditions is 74 inches.
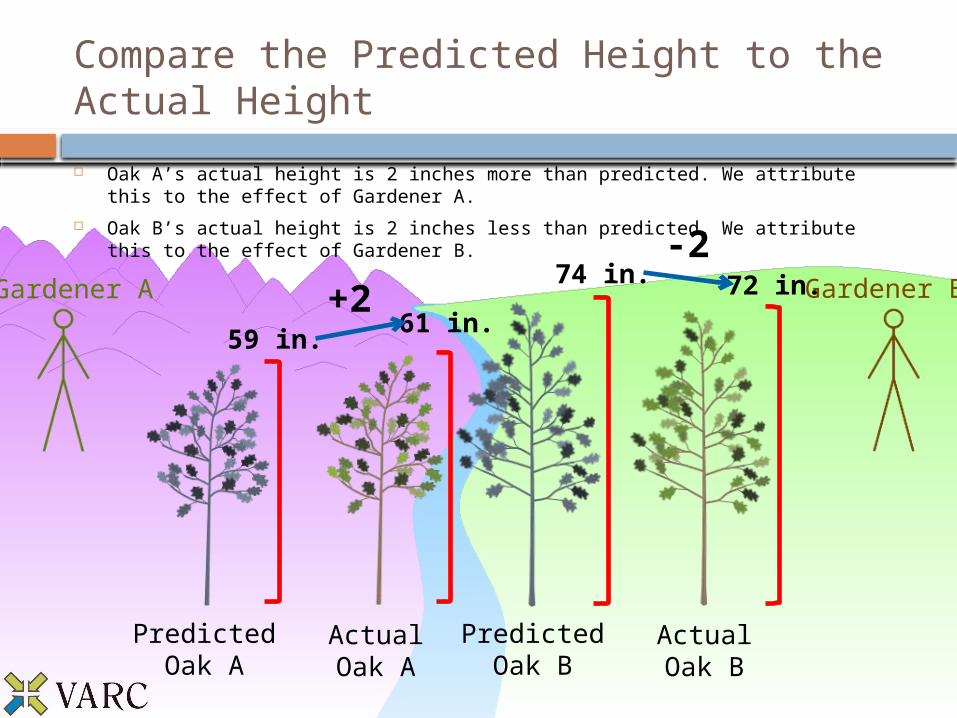
PredictedOak A
PredictedOak B
ActualOak A
ActualOak B
59 in.
74 in.Gardener A Gardener B61 in.
72 in.+2-2
Compare the Predicted Height to the Actual Height Oak A’s actual height is 2 inches more than predicted. We attribute this to the effect
of Gardener A. Oak B’s actual height is 2 inches less than predicted. We attribute this to the effect
of Gardener B.
This is analogous to a Value-Added measure.
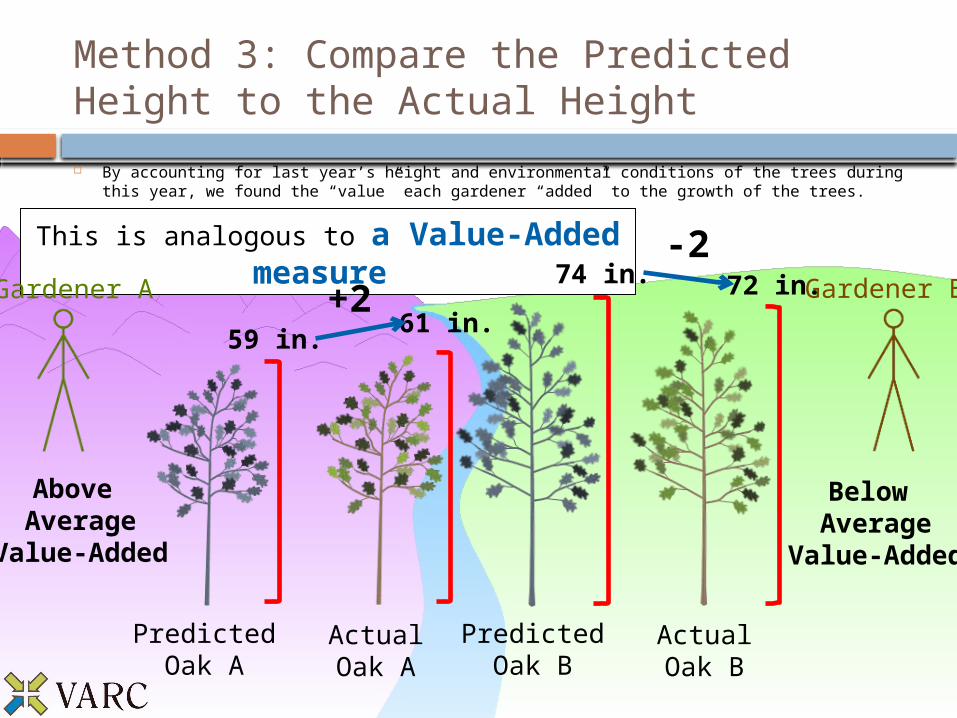
Above Average
Value-Added
Below Average
Value-Added
PredictedOak A
PredictedOak B
ActualOak A
ActualOak B
59 in.
74 in.Gardener A Gardener B61 in.
72 in.+2-2
Method 3: Compare the Predicted Height to the Actual Height
By accounting for last year’s height and environmental conditions of the trees during this year, we found the “value” each gardener “added” to the growth of the trees.
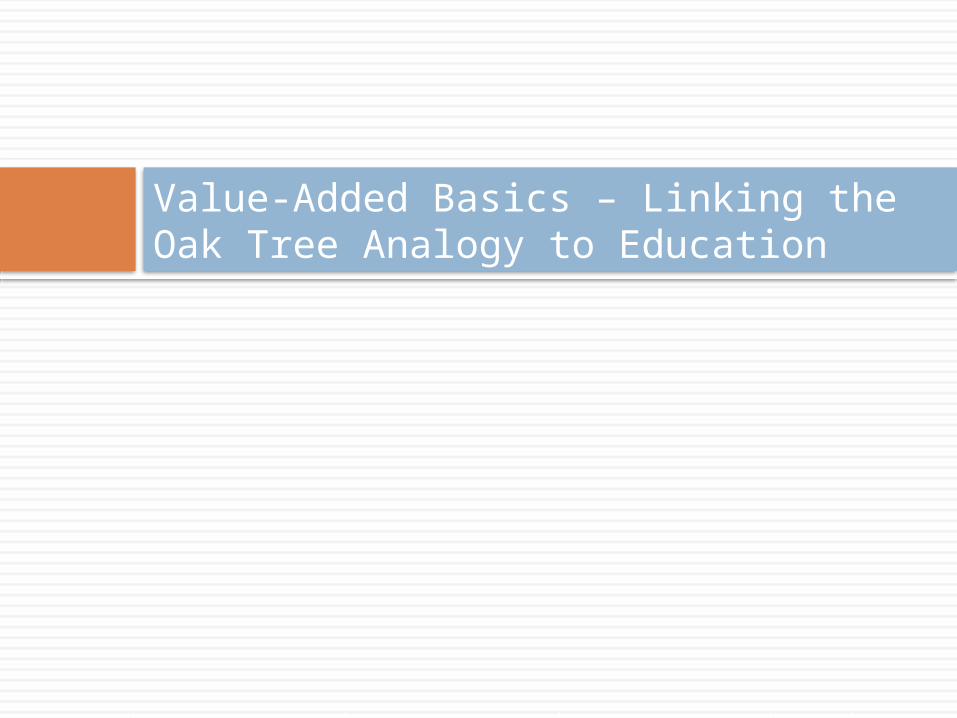
Value-Added Basics – Linking the Oak Tree Analogy to Education
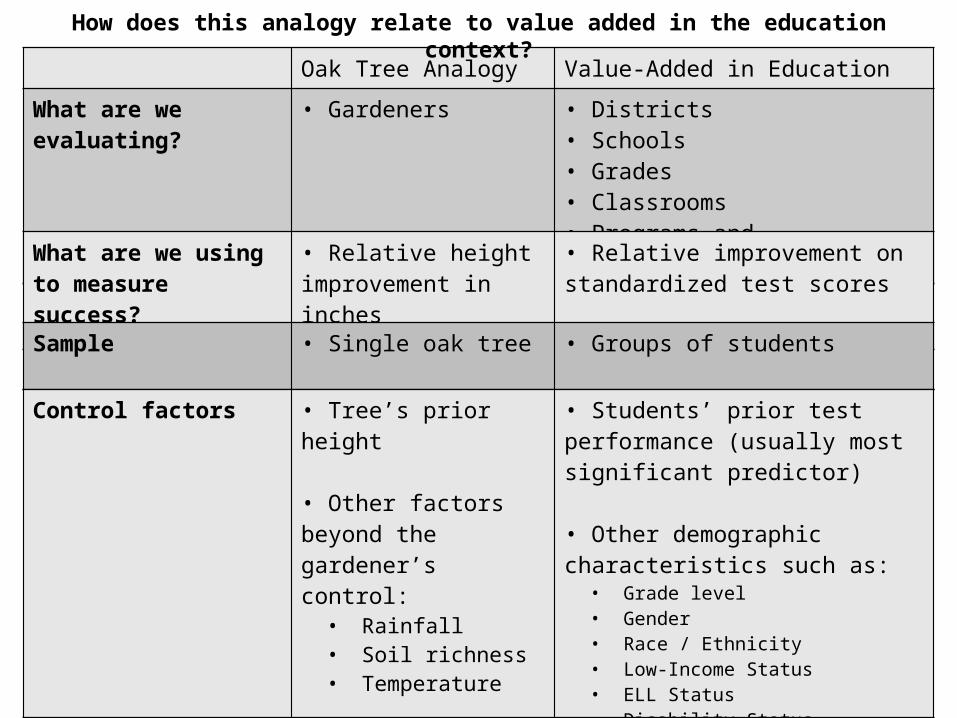
Oak Tree Analogy Value-Added in Education
What are we evaluating?
• Gardeners • Districts• Schools• Grades• Classrooms• Programs and Interventions
How does this analogy relate to value added in the education context?
What are we using to measure success?
• Relative height improvement in inches
• Relative improvement on standardized test scores
Sample • Single oak tree • Groups of students
Control factors • Tree’s prior height
• Other factors beyond the gardener’s control:
• Rainfall• Soil richness• Temperature
• Students’ prior test performance (usually most significant predictor)
• Other demographic characteristics such as:
• Grade level• Gender• Race / Ethnicity• Low-Income Status• ELL Status• Disability Status• Section 504 Status
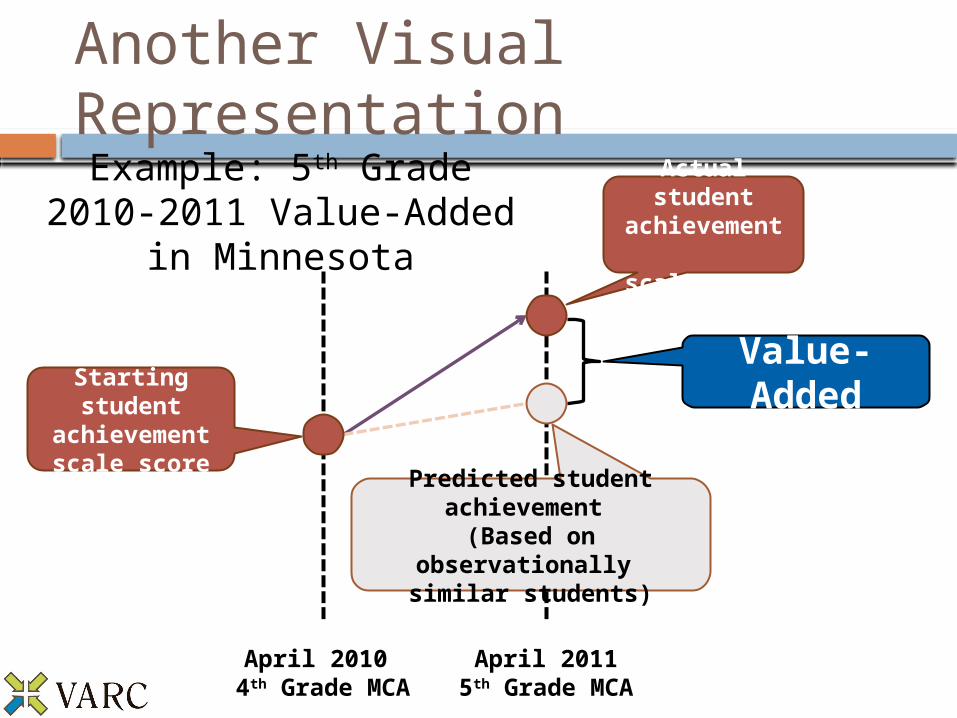
Another Visual Representation
April 20115th Grade MCA
Actual student
achievement
scale score
Predicted student achievement
(Based on observationally similar students)
Value-Added
Starting student
achievement scale score
April 2010 4th Grade MCA
Example: 5th Grade 2010-2011 Value-Added in Minnesota