Embed Size (px)
Citation preview
EUR 22891 EN - 2008
Teachers’ salaries in comparison withother occupational groups
Ulf Fredriksson
The mission of the JRC is to provide customer-driven scientific and technical support for the conception, development, implementation and monitoring of EU policies. As a service of the European Commission, the JRC functions as a reference centre of science and technology for the Union. Close to the policy-making process, it serves the common interest of the Member States, while being independent of special interests, whether private or national. European Commission Joint Research Centre Contact information Address: JRC, TP 361, Via Fermi, 21020, Ispra (VA), Italy E-mail: [email protected] Tel.: +39-0332-786111 Fax: +39-0332785226 http://www.jrc.ec.europa.eu Legal Notice Neither the European Commission nor any person acting on behalf of the Commission is responsible for the use which might be made of this publication. A great deal of additional information on the European Union is available on the Internet. It can be accessed through the Europa server http://europa.eu/ JRC 37303 EUR 22891 EN Luxembourg: Office for Official Publications of the European Communities © European Communities, 2008 Reproduction is authorised provided the source is acknowledged Printed in ispra, Italy
3
Teachers’ salaries in comparison with other occupational groups∗ 1. Introduction 1.1. Background
Many countries have in recent years experienced a shortage of teachers. According to a report from the
European Commission/Eurydice (2002), 13 countries out of the 31 EU, EEA and Candidate Countries were
experiencing a shortage of teachers in general lower secondary education. According to the same report, another
eight countries were experiencing a situation with both shortages and surpluses of teachers in general lower
secondary education. The OECD survey on upper secondary schools (OECD, 2004) observed that 49 % of
students in participating countries were in schools which had major difficulties in hiring qualified teachers in
computer science/information technology. The same survey also noted that 33 % of students were in schools
with difficulties hiring teachers in mathematics, 33 % in schools with difficulties hiring teachers in technology,
32 % in schools with difficulties hiring teachers in foreign languages and 30 % in schools with difficulties
hiring teachers in science.
One reason for these shortages seems to be the age structure of the teaching profession. In Key Data on
Education in Europe of 1995 (European Commission/Eurydice) the following observation was made:
"The ageing of the teaching profession is probably explained in part by the fall in pupil numbers during the 1980s. This was experienced in a majority of Member States (with the exception of Greece and Finland, where the population in the primary schools remained fairly stable), the 1960s having seen a very high birth rate and a vast recruitment of teachers by and large everywhere in the European Union. Consequently, the career advancement of staff in post since then has not been balanced by a significant recruitment of younger teachers. In the light of the present position, it is to be expected that a considerable proportion of teachers who were recruited in the 1960s will be departing on retirement in the next few years. In this general situation, it will be important to ensure that the planning of teacher supply and demand managed so as to meet the professional requirements throughout the
∗ The idea of using UBS data to compare teachers’ salaries with salaries in other occupations occurred several years ago when I worked as research coordinator for Education International. I then started to pursue this idea with the help of Ms. Catherine Tinnin. Catherine managed to acquire all the booklets from UBS, with the exception of the very first one from 1971. Due to other tasks I had to put this study to one side for a time. When in Spring 2006 I found the opportunity to work on the material it was only possible due to the effort that Catherine already had invested in collecting and sorting information. Thank you, Catherine, for the work you did to make this study possible. I would also like to thank Ms. Simone Hofer at UBS for her willingness to provide further information and to answer my questions about the UBS surveys and Beatrice d’Hombres at CRELL who has helped me with the calculations in annex xxxviii.
4
European Union and avoid the risk of shortages or surpluses." (European Commission/Eurydice, 1995, p.107).
Statistics from Eurydice/Eurostat have shown that teacher shortages are likely to increase in many countries. “In
years to come, one important issue facing educational policies will be that of tackling the replacement of a very
large proportion of teachers” (European Commission/Eurydice/Eurostat, 2000, p. xviii). In an analyse based on
national data from 2000/01 Eurydice (2002) calculated that out of 32 European education systems 14 had a
teacher shortage and 8 both teacher shortage and surplus. The OECD makes similar observations in the report
Teachers Matter: Attracting, Developing and Retaining Effective Teachers (OECD, 2005a).
“There are two broad concerns about the supply of teachers. One relates to teacher numbers: many countries are either currently experiencing, or will shortly face, a quantitative shortage of teachers. There are particular concerns about teacher shortages in areas such as mathematics, science, ICT and languages. Teacher shortage problems seem to be most acute in schools serving disadvantaged or isolated communities. The other concern is more qualitative, and reflects trends in the composition of the teacher workforce in terms of academic background, gender, knowledge and skills. The ageing of the teaching workforce is compounding recruitment concerns. On average, 26% of primary teachers and 31% of secondary teachers in OECD countries are aged over 50 years, and many will retire in the next few years” (p. 39, OECD, 2005a).
The European Commission reports on Progress towards the Lisbon Objectives in Education and Training
(European Commission, 2004, 2005, 2006) have also noted that a large number of teachers will go into
retirement in the coming years and that there will thus be a need to recruit a large number of new teachers.
It has been known for a long time that teaching is an ageing profession. As early as 1990 it was noted in the
OECD report The Teacher Today: “The worries expressed in some quarters about lack of ‘new blood’ and
possible sudden future teacher shortage address issues that are, as yet, medium- to long-term, admitting still of
sustained long-term solutions where analysis suggests that problems are likely to arise. But if this should be
mistaken as grounds for complacency, it needs to be added that as long-term phenomena they are
correspondingly less amenable to immediate solutions when the time comes. Lack of ‘fresh blood,’ by its very
nature, cannot be rectified overnight." (OECD, 1990, p. 28).
Taking into consideration the quotation above, the shortage of teachers experienced in the first years of the years
00’s is not unexpected. When the supply side is studied there are at least three possible inter-related factors
giving rise to shortages in some countries:
1) There have been difficulties in attracting students to teacher education. As a result, there have been
vacant places on teacher education programmes, and moreover the entry requirements for such
programmes may have been lowered;

5
2) The necessary steps have not been taken to meet the problem of the shortage by increasing the number
of places available on teacher education programmes;
3) A sufficient number of students may have completed teacher education but never started working as
teachers; others have left teaching after only a few years in the profession.
Probably all the three reasons mentioned above have interplayed. The reasons behind teacher shortages have
been widely discussed (c.f. OECD 1990, 2005). Developments related to early retirement, increased
participation in secondary education, increased demand for teachers due to changes in the curriculum are among
those factors mentioned. Among the many underlying explanatory factors may also be the level of teachers’
salaries. It is sometimes assumed that developments in teachers’ salaries have been less favourable than in other
comparable professions. If this is indeed the case, there could be at least two obvious consequences: first,
practicing teachers might leave the profession for a more lucrative occupation; second, since the attractiveness
of a profession to potential students is often somewhat dependent on the prospective salary, young people may
be less motivated to choose a career in teaching.
The attractiveness of the teaching profession is related to the reasons for young people to decide to become
teachers. There is a large number of different factors that influence a young person who decides to become
teachers. In research on the reasons for becoming a teacher it has been shown that many teachers report that they
have chosen the teaching profession because they wished to deal with children or they wished to teach (OECD,
2005). Salaries may not be the major reason for young people to become teachers, but it has an influence on
their choice of professional career. It seems that teacher salaries relative to those in other occupations have a
greater influence on teachers’ decisions to return to teaching after a career interruption and to remain in the
profession than one the decision to become teacher (OECD, 2005a).
Difficulties in attracting new teachers may have an impact not only on the teaching profession itself, but also on
the quality of education. The importance of qualified teachers has been recognised in several reports. The
OECD (2005a) has noted that among those variables which are potentially open to policy influence, teachers
and teaching are those which have the most important influence on student achievement. The OECD concludes
that the “teaching profession needs to be competitive with other occupations in attracting talented and
motivated people” (OECD 2005a, p.39).
When problems related to teacher shortages are discussed it has to be mentioned that recently some reports have
indicated that the teacher shortage may not be as drastic as earlier believed. In Sweden a report from the
Swedish National Agency for Higher Education noted that a future shortage will be limited to teachers in early
childhood education, while in other areas there may even be a surplus of teachers (Högskoleverket, 2006). An
international study on teacher mobility (GHK, in press) came to similar conclusions and noted that only some
countries will be faced with a teacher shortage in the coming years. In relation to this it may also be relevant to
note that OECD (2005a) observed in the study Attracting, Developing and Retaining Effective Teachers that
6
there are only limited international data available on teacher shortages: “At international level there is no clear,
universally accepted measure of what actually constitutes a teacher shortage” (OECD, 2005a, p. 41).
1.2. EU indicators
One of the areas related to education within the Lisbon process which have been identified as requiring
indicators is centred on teachers. The European Commission’s reports Progress towards the Lisbon objectives in
education and training (European Commission, 2004, 2005, 2006) contains a chapter on teachers (“Improving
the quality of teachers and trainers”).
The indicators on teachers actually used in the progress reports are:
• Age of teachers
• Numbers of young people
• Ratio of pupils to teaching staff
It is obvious that these indicators have been designed to relate the supply of teachers to the demand. However,
although the age composition of the teaching force certainly affects the supply of teachers, it is not the only
factor at play. The attractiveness of the teaching profession probably has a significant influence on the
willingness of active teachers to stay in the profession and of young people to enter the profession in the first
place.
One element of the attractiveness of a profession is the idea of ‘status,’ in the sense of how a profession is
perceived in a society. It is assumed that professions with a high status are more attractive than those with low,
and salary levels are most probably essential to any measure of this concept. Furthermore, the important point
may not be the actual salary of a profession, but rather how this salary compares with the salaries of other
professions. Such information, in relation to teachers, could complement well the picture of teacher supply and
demand given in the European Commission’s progress reports.
1.3. Purpose of this study
The purpose of this study is to make an overview of existing international data on teacher salaries in order to see
to which extent such data contains comparisons between teacher salaries and the salaries of other occupations.
Data available from the Union Bank of Switzerland (UBS) will be looked at specifically in order to analyse
whether UBS provides internationally comparable information on how teachers' salaries stand in relation to the
salaries of other occupational groups. Such a comparison may help to shed more light on the question of how to
attract young people to the teaching profession and how to keep teachers in the profession. The results could
also be used to decide whether that it would be of general interest to collect this type of information on a regular
basis.
7
2. Existing data Several international agencies have published data on teachers’ salaries, but there is not much information
available on an international basis for the comparison of teachers’ salaries with the salaries of other professional
groups.
2.1. UNESCO
UNESCO has not published much data on teachers’ salaries. The monitoring reports Education for All (EFA
Global Monitoring Report Team, 2002, 2003, 2004) contain information on total numbers of teachers,
percentage of trained teachers and pupil-teacher ratio for a large number of countries, but nothing on teachers’
salaries. The database of the UNESCO Institute for Statistics (UIS, 2006) contains no information on teachers’
salaries, with the exception of data which have been collected as part of the WEI programme (World Education
Indicators).1 This programme will be further described in the section on the OECD.
In 2002 UNESCO and the ILO published the report A statistical profile of the teaching profession written by
Maria Teresa Siniscalco. The report is mainly a summary of information available on teachers in other
international publications such as UNESCO, ILO and OECD reports.
2.2. OECD
Since 1992 the OECD has published the report Education at a Glance, containing basic statistics on education
in OECD and some additional countries. The report has been published in twelve editions (1992, 1993, 1995,
1996, 1997, 1998, 2000, 2001, 2003, 2004, 2005 and 2006). Education at a Glance covers the OECD countries.2
Since 1995 teachers’ salaries have been included in the report. Education at a Glance from 2005 (OECD,
2005b) presents salaries in equivalent US dollars, converted into PPP (“purchasing power parity”) and as a ratio
of GDP per capita. The starting salary, the salary after 15 years in the profession and the salary at the top of the
scale are shown, as well as statutory salaries per hour of net teaching time. It is also shown how statutory
salaries have developed for teachers between 1996 and 2003. Education at a Glance from 2005 focus on
teachers in lower secondary education, but information is also available on primary teachers in public
institutions, teachers in upper secondary public institutions and teachers in upper secondary vocational
programmes in public institutions.
1 The countries who participated in the WEI programme are Argentina, Brazil, Chile, China, Egypt, Indonesia, Jordan, Malaysia, Paraguay, Peru, Philippines, Russian Federation, Thailand, Tunisia, Uruguay and Zimbabwe. 2 Australia, Austria, Belgium, Canada, Czech Republic, Denmark, Finland, France, Germany, Greece, Hungary, Iceland, Ireland, Italy, Japan, Korea, Luxembourg, Mexico, Netherlands, New Zealand, Norway, Portugal, Spain, Sweden, Switzerland, Turkey, United Kingdom and United States.
8
In 2001 the report contained a comparison of average primary teachers’ salaries with the salaries of other
selected public employees (OECD, 2001). The selection of public employees contained the following
occupations: draughtsman, pre-primary teacher, computer operator, nurse, social worker, executive officer,
mathematics teacher in secondary education, sanitary engineer, civil engineer, head teacher and public health
physician. The 2003 report contained a comparison of average secondary teachers’ salaries with the salaries of
other selected public employees (OECD, 2003). The selection of public employees contained the following
occupations: draughtsman, pre-primary teacher, computer operator, librarian, social worker, executive officer,
university lecturer, town planer, civil engineer, head teacher agricultural scientist and primary teacher.
In 2001 the OECD also published, in co-operation with the UNESCO Institute for Statistics, the report Teachers
for tomorrow’s schools. Analysis of the world education indicators. This publication largely contains the same
figures as Education at a Glance (2001), but deals in greater detail with the situation of teachers. In the report
not only OECD countries are included, but also countries participating in the WEI programme.
2.3. European Union
Since 1994, Eurydice/Eurostat has published Key Data on Education in the European Union. Editions were
published in 1994, 1995, 1997, 2000, 2002 and 2005. In 1995 teachers were dealt with in a thematic dossier
“Teachers in the European Union.”
The 2005 edition of Key Data on Education in the European Union devoted a section to teachers. Information
was given about teacher education, continuing professional development, employment status, workload, salaries
relative to per capita income number of teachers, percentage of teachers working part-time, distribution of
teachers by age, age of retirement and percentage of female teachers. The data relate to 2002/03. EU countries,
as well as EEA countries and pre-accession countries are covered in the book.
2.4. Other studies
Before the OECD and the EU started to cover teachers’ salaries on a regular basis in their publications several
attempts had been made by other organisations to compile data.
WCOTP (the World Confederation of Organizations in the Teaching Profession) organised, in 1978, 1980 and
1986, studies comparing salaries, training, working hours, etc., in various European countries. These studies
were based on information submitted by member organisations in response to a questionnaire originally
developed by WCOTP in co-operation with the ILO. The reports contained salaries presented in national
currencies and converted into Swiss Francs. No attempt to compare purchasing power was made. On 6-8 April,
1991, WCOTP organised a conference in Sofia, Bulgaria, on salaries, pensions, working time and negotiations.
In preparation for the conference WCOTP member organisations were asked to contribute basic information
about these issues in their countries. The information collected was presented in the report Teachers, salaries,
9
pensions, working time and negotiations (WCOTP, 1991). Salaries were presented in national currencies and
converted into Swiss Francs based on the exchange rate at the end of January 1991. No attempt to compare
purchasing power was made.
In 1976 the German Institute for International Education Research (DIPF – Deutsches Institut für Internationale
Pädagogische Forschung) published a book entitled: Teachers’ salaries in international comparison (Döbrich,
Kodron and Kolbe, 1976). The book contained a detailed discussion of the methodology for comparing
teachers’ salaries and the problems related to the comparisons. Information had been collected from Belgium,
the Federal Republic of Germany, Denmark, the German Democratic Republic, England & Wales, France,
Ireland, Italy, Luxembourg, Netherlands, the People’s Republic of Poland, Sweden and the USA. The starting
and the final salaries for primary teachers, lower secondary teachers and upper secondary teachers were
compared for 1975. The comparisons were made in German Marks (DM) with adjustment for purchasing
power. Differences in salary structures were also discussed. In 1980 IFFTU (the International Federation of Free
Teacher Unions) asked Peter Döbrich to write a report on the employment and working conditions of teachers in
preparation for an ILO conference. The report, Employment and Conditions of Work of Teachers, was published
by IFFTU in 1981 with the support of GEW (Gewerkschaft Erziehung und Wissenschaft). It contained mainly a
general discussion of the problems facing the teaching profession and, to a lesser extent, statistical information
about working conditions in various countries. Information on teachers’ working conditions had been collected
by sending a questionnaire to IFFTU member organisations.
In 1993 AFT (the American Federation of Teachers) published the report How U.S Teachers Measure Up
Internationally. A Comparative Study of Teacher Pay, Training and Conditions of Service. The report had been
written by the research department of AFT with the purpose of comparing the salaries and working conditions
of American teachers with those of teachers in other industrialised countries. The report contained information
on working hours, salaries, retirement, social security, etc. The information had been collected through contacts
with teachers’ unions and Ministries of Education in other countries, the embassies of other countries in the U.S.
and U.S Embassies abroad. Information collected earlier by WCOTP and IFFTU (see above) was also used.
Lärarförbundet (Sweden) organised a comparative study of salaries in Sweden and some EU countries in 1993.
The results were published in the report Lärares löner i Sverige och några EG-länder (“Teachers’ salaries in
Sweden and some EU countries”) (Fredriksson & Edlund, 1993). The information used in the study was based
on figures collected from teacher unions in Sweden, France, Portugal, United Kingdom and Germany.
Information was collected on teachers’ monthly salaries, average taxation, compulsory deductions and the
average cost of renting of an apartment or house. Based on these figures the net salary, the disposable income
and the disposable income adjusted for purchasing power were calculated.
10
2.5. Limitations with existing data
The data on teacher salaries used in most publications are based on the annual statutory salary, i.e. the official
pay scales. This is not the same as the actual salary, which may vary within a country depending on teachers’
additional educational experience, part-time employment, regional discrepancies depending on special
allowances for remote areas, family bonuses and benefits, such as reduced rates on public transport. In almost
every case the gross salaries are compared, which means that the great differences in tax systems between
countries are not considered (OECD, 2003). There are also differences between countries in the typical family
situation. In some countries it is more common that only one income is supporting the family, while in others
there are generally two.
In order to make salaries comparable they are converted in many reports into U.S. dollars using purchasing
power parities (PPP) as a way of equalising the purchasing powers of different currencies.3 Another way, used
by the OECD and EU, of making teachers’ salaries comparable is to describe them as a ratio of GDP per capita.
This type of comparison has several limitations. As has been pointed out in OECD reports, “there is a
significant association between teachers' salaries and GDP per capita” (OECD, 2002, p.333). High teacher
salaries expressed as a ratio of GDP per capita often occur in countries with a low GDP per capita.
The OECD has been critical about measuring teachers’ salaries as a ratio of GDP per capita: “The main
indicator that is currently used, teachers’ statutory salary expressed as a ratio of GDP per capita has a number
of limitations […]” (OECD, 2002, p.79). One of these limitations is that the indicator “does not reflect salary
levels in comparable occupations” (ibid.). The OECD suggests, “A more appropriate indicator would compare
teachers’ actual salaries and other benefits with those of workers in professions requiring similar qualifications
and at similar age levels. Such data are not yet available at international level” (ibid.). A similar
recommendation is made in the ILO/UNESCO Recommendation concerning the Status of Teachers
(ILO/UNESCO, 1966). In article 15:2 of the Recommendation it is suggested that a relevant way to compare
teachers’ salaries would be to compare them “with salaries paid in other occupations requiring similar or
equivalent qualifications” (ILO/UNESCO, 1966). Unfortunately there is not much information available which
allows such comparisons.
3. Prices and Earnings – data collected by UBS One attempt to compare salaries and prices across countries has been made by the Union Bank of Switzerland
(UBS). Their booklet Prices and Earnings Around the Globe has been published by the economists at UBS
every three years since 1971. Thirteen surveys have been published to date, the latest in 2006.
3 PPPs are the rates of currency conversion, which eliminates the differences in price levels among the countries (OECD, 2003, p.442).
11
3.1. The UBS study: Prices and Earnings
Prices and Earnings Around the Globe compares the prices of goods and services, wages, wage deductions and
working hours, along with the resulting purchasing power, in a number of cities across all continents. According
to UBS, there are “a number of reasons why it makes sense to compare prices and earnings in an increasingly
globalized world” (UBS, 2003, p.4). The primary reason given by UBS is to help to give companies with
foreign subsidiaries, tourists and business travellers to have an idea of the prices they have to pay in different
cities. It is noted that if prices are seen in isolation they “tell us little about what locals can actually afford”
(ibid.).
For the study in 2006 standardised price and earnings studies were carried out in 71 cities between February and
April 2006. The data were collected by local UBS offices, partner banks, chambers of commerce, universities,
the student organization AIESEC and selected individuals (UBS, 2006).
All figures are converted into one currency. In the English version of the study the currency used is USD. To
smooth the effects of daily fluctuation in exchange rates the average exchange rate for the data collection period
was used (UBS, 2006).
3.2. Teachers in the “Prices and Earnings”
The study from 2006 contains information about salaries in 14 selected occupations. These occupations were
chosen with the purpose to be “a representative cross-section of workers in the industrial and service sectors”
(UBS, 2006, p.26). The occupations have also been selected for their amenability to international comparison:
“The occupations surveyed are ones that as far as possible can be similarly defined all around the word” (UBS,
2003, p 21), “…the professions were selected with an eye to being able to collect and delimit comparable data
the world over” (UBBS, 2006 p. 26,). One of the occupations covered in Prices and Earnings Around the Globe
is primary teacher.
The data presented in Prices and Earnings Around the Globe will be used in this paper for a comparison of
teachers’ salaries with the salaries of other occupational groups in a number of major European cities. It may
also be possible to see how teachers’ salaries have developed over a number of years in relation to the salaries of
other occupational groups. The results of the analysis may help to determine whether this type of data has an
added value in comparison with other available data on teachers’ salaries and whether it would be of interest to
collect such data on a regular basis.
12
4. A comparison of teachers’ salaries with those of other occupations in
European cities
In this section the UBS data will be used to examine how teachers’ salaries stand in relation to the salaries of
other occupational groups their relative development over a number of years. In order to understand the context
of the UBS survey, the cities involved will first be listed and discussed in subsection 4.1. Subsection 4.2 will
explain how the salaries of teachers have been calculated. The third subsection will list the other occupations
covered in the UBS surveys and explain how the salaries in the various occupations have been calculated. In the
fourth subsection a comparison will be made between primary teachers’ salaries and the salaries of other
professions in a number of cities for the period 1979 to 2006. In the final subsection a comparison will be made
between primary teachers’ salaries and the salaries of a number of other occupations in 2003 and 2006.
4.1. Cities
The UBS data is not collected on the basis of countries, but rather of cities. The idea has been to give a broad
base of data representing important cities in all continents. The set of cities has not been constant over all
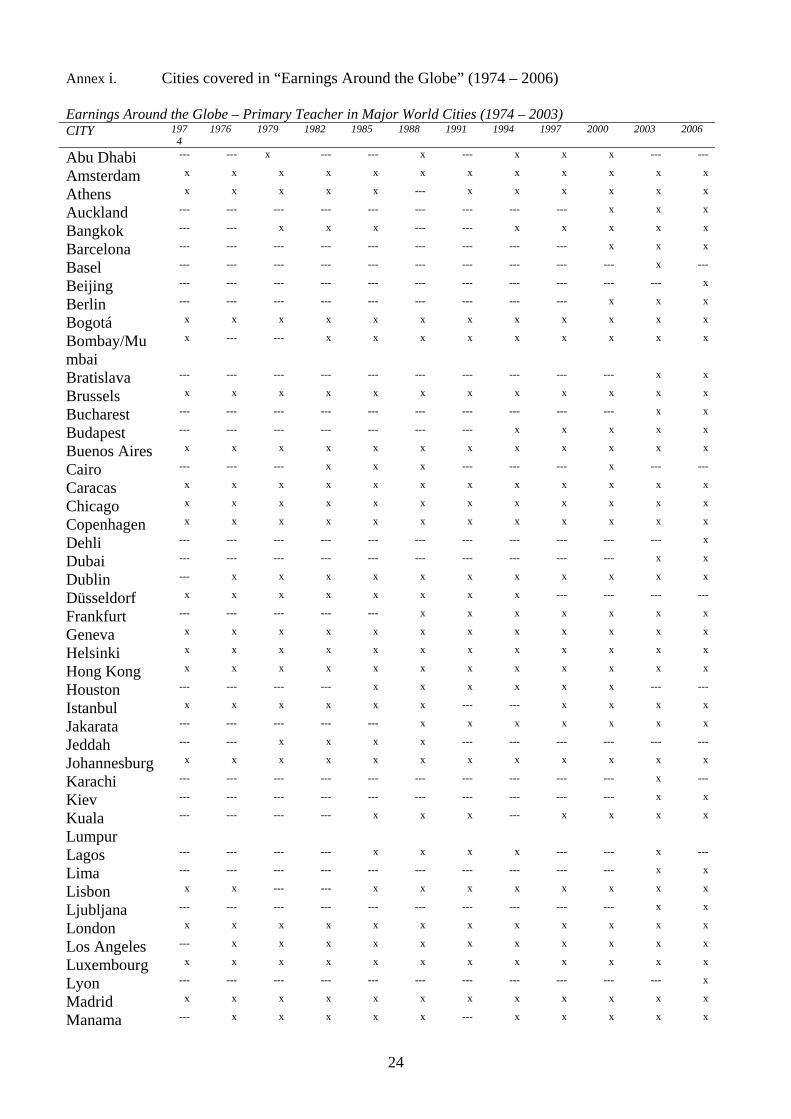
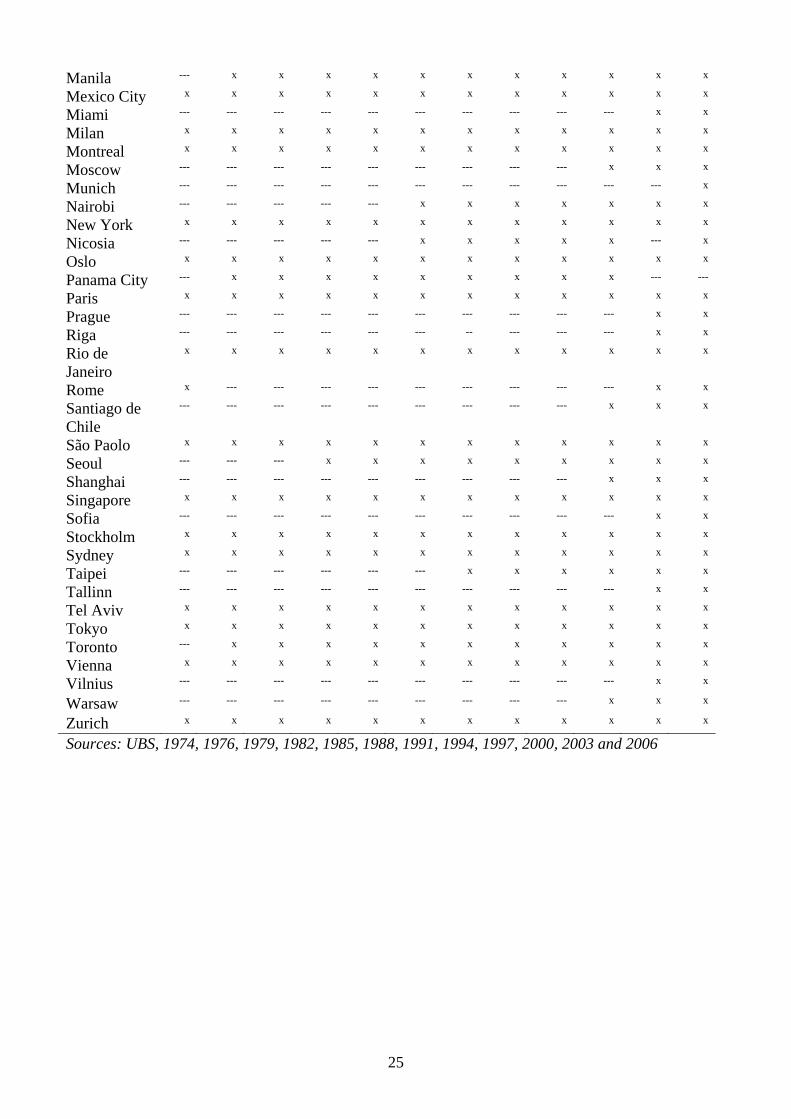
surveys; some have been covered by all surveys, others have been added and some have been removed. Annex i
gives an overview of which cities have been covered in different surveys.
The focus in this report is on cities in EU, EEA and Candidate Countries. In total 34 cities from this group of
countries are covered by the UBS surveys. Twelve of these cities are covered by all the surveys undertaken from
1974 to 2006 and 13 cities covered by all surveys undertaken between 1979 and 2006. In the 2003 survey data
are available for 30 cities in the EU, EEA and Candidate Countries and in the 2006 survey data from 33 cities.
The data from the twelve cities covered during the years 1977 to 2006 will be used for a comparison between
primary teachers’ salaries and the salaries of other occupations over time (see section 4.4). The 2003 and the
2006 data will be used to make a comparison between salaries in a number of occupations for these years (see
section 4.5).
4.2. Teachers’ salaries
Primary teachers are one of the occupational groups included in the UBS surveys. The income of a primary
teacher has been based on the yearly salary of a primary teacher who has been teaching in the public education
system for about 10 years. Data are collected on teacher 35 years old, married and with two children (UBS,
2006, p. 44).
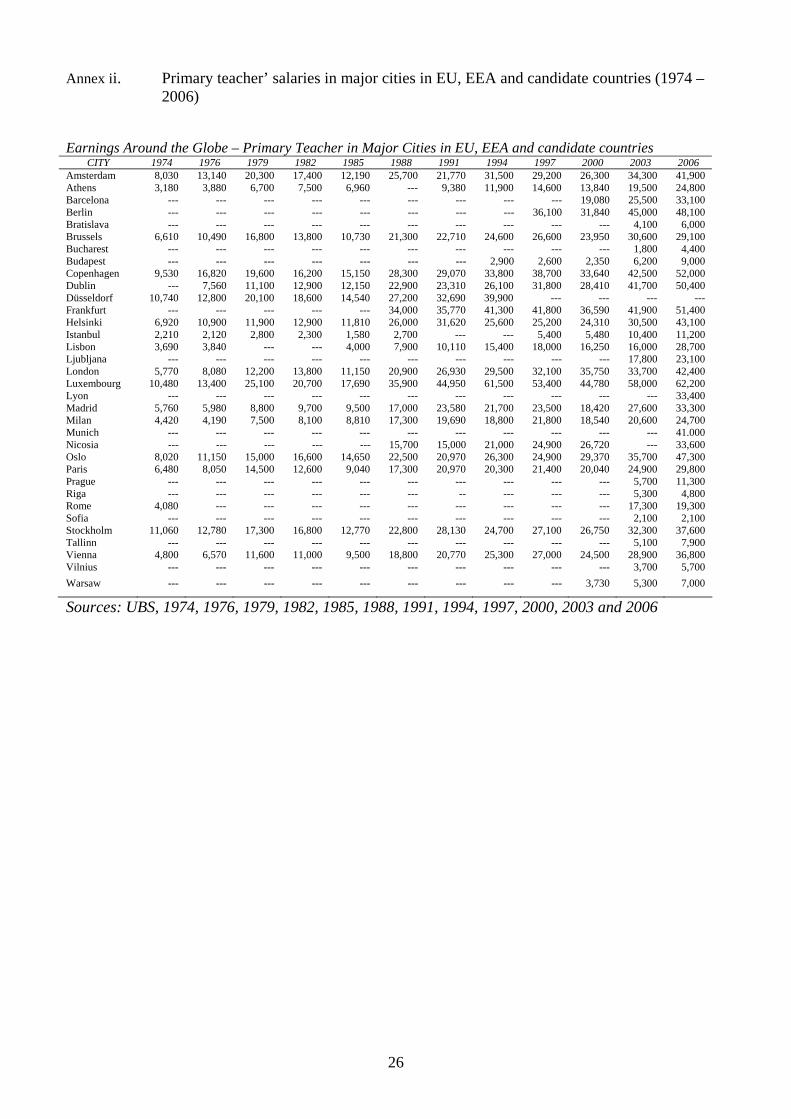
Annex ii shows the gross income per year in USD for primary teachers in the 34 cities in the EU, EEA and
Candidate Countries included in the UBS surveys. As can be seen in annex ii there are great differences in the
salaries of primary teachers in different cities. As mentioned earlier these figures are difficult to interpret; they
13
begin to make sense only when compared with the general costs of living in the city and/or the income in other
professions.
4.3. Occupations
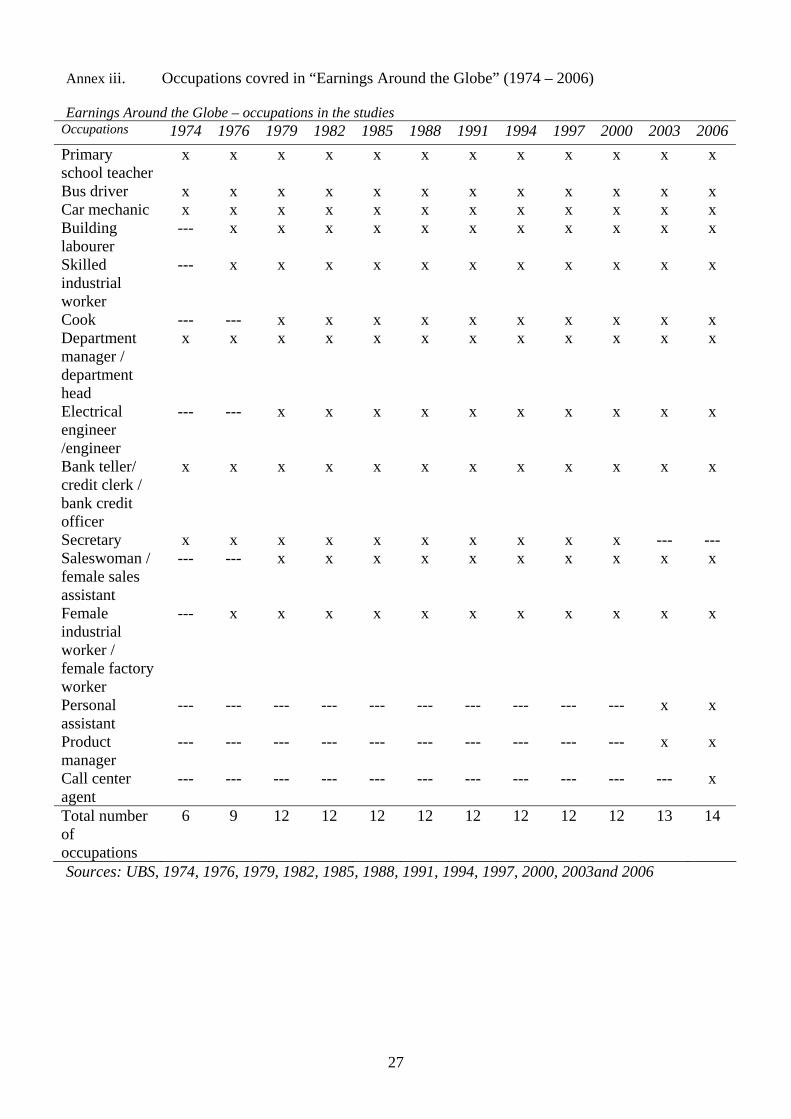
In addition to information about the salaries of primary teachers the UBS survey also contains information about
a number of other occupations. In annex iii the occupations covered in the UBS surveys are listed and it is
indicated in which years different occupations have been surveyed.
The study in 1974 covered six occupational groups (primary school teachers, bus drivers, car mechanics,
department managers, bank teller/credit clerks and secretaries). In the study in 1976 three more groups were
added (building labourers, skilled industrial workers and female industrial workers), and in 1979 a further three
(cooks, department managers, electric or mechanical engineers and saleswomen). These have been the twelve
occupations covered in the surveys from 1979 to 2000. In the survey in 2003 two new groups were added
(personal assistants and product managers) and one was removed from the survey (secretaries). As can be seen
in table 4 is the description of a secretary and of a personal assistant fairly similar. The 2006 survey contained
the same occupations as in 2003 with the addition of call centre agents.
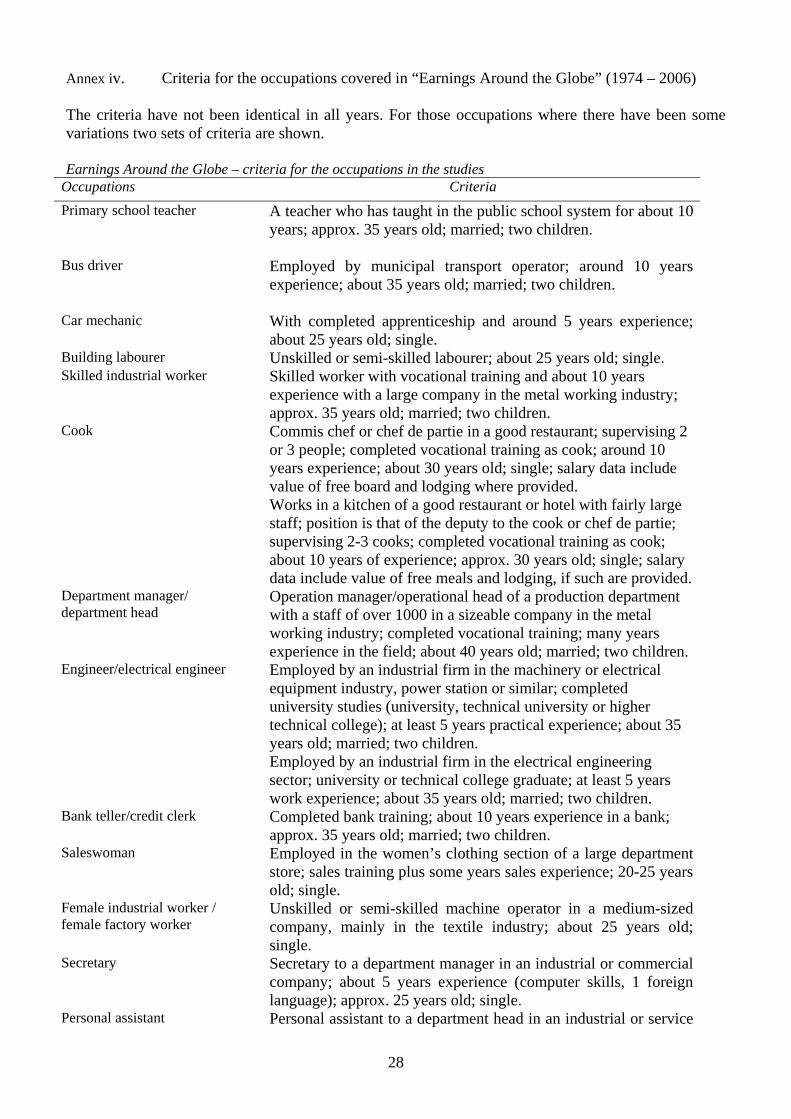
The uniform criteria used for all occupations were: job experience, age and marital status (UBS, 2003, p. 7). The
specific criteria for individual occupations are listed in annex iv. The criteria have not been identical in all years.
For those occupations where there have been some variations two sets of criteria are shown in annex iv.
As can be seen in annex iv the criteria used are not the same for all occupations. Primary teachers are supposed
to have taught for about 10 years and to be approximately 35 years old and married with two children. For other
occupations the criteria specified younger persons, such as saleswomen, who are assumed to be single and aged
20 to 25. In other cases older persons have been specified, such as department managers, who are assumed to be
40 years old and married with two children. In this report teachers will be compared both with all the
occupations listed in annex iv and with a smaller number of occupations for which the criteria used correspond
more closely with the criteria used for teachers. This smaller group of occupations will include primary teachers,
bus drivers, skilled industrial workers, engineers, bank tellers and product managers.
In the UBS surveys a selection of representative companies in each city are asked to supply appropriate data.
Basically 30-35 different employers contribute data for each occupation in each city. Several studies are
conducted and compared to each other. To ensure data quality the collected data is also compared with other
sources for a cross-check, such as ILO data. Still UBS notes in 2003: “Since our pay figures for each occupation
and city were compiled from a limited number of companies and thus do not constitute statistical averages,
using a different selection could give different results in some places” (UBS, 2003, p.21) and in 2006: “Because
our figures do not represent statistical averages, and their collection was limited to just a few companies for
each profession, a choice of different firms might produce different results” (UBS, 2006, p.26).
14
The gross income for every occupation is the “annual gross income including fringe benefits such as profit-
sharing, bonuses, holiday pay, additional month’s salary payment, family allowances” (ibid..).
4.4. Teachers’ salaries compared with other occupations over time
As shown in subsection 4.1, twelve cities in the EU, EEA and Candidate Countries are covered by all the
surveys undertaken from 1974 to 2006. In the table below the data from 1974 and 1976 have been excluded,
because in these years data were only collected from 6 and 9 occupations respectively (see subsection 4.3). For
the years 1979 to 2006 data is available from 13 cities in the EU, EEA and Candidate Countries. It should also
be borne in mind that the survey in 2003 covered 13 occupations, including two which were not covered in
earlier years. The survey in 2006 covered 14 occupations, including one which was not covered in 2003.
The table below shows the rank of teachers’ salaries. Rank 1 means that teachers had the highest salary among
the twelve occupational groups in that city in the year of reference, while rank 12 means that teachers had the
lowest salary among the twelve occupational groups in that city that year (for more details see annexes v –
xxxvii).
15
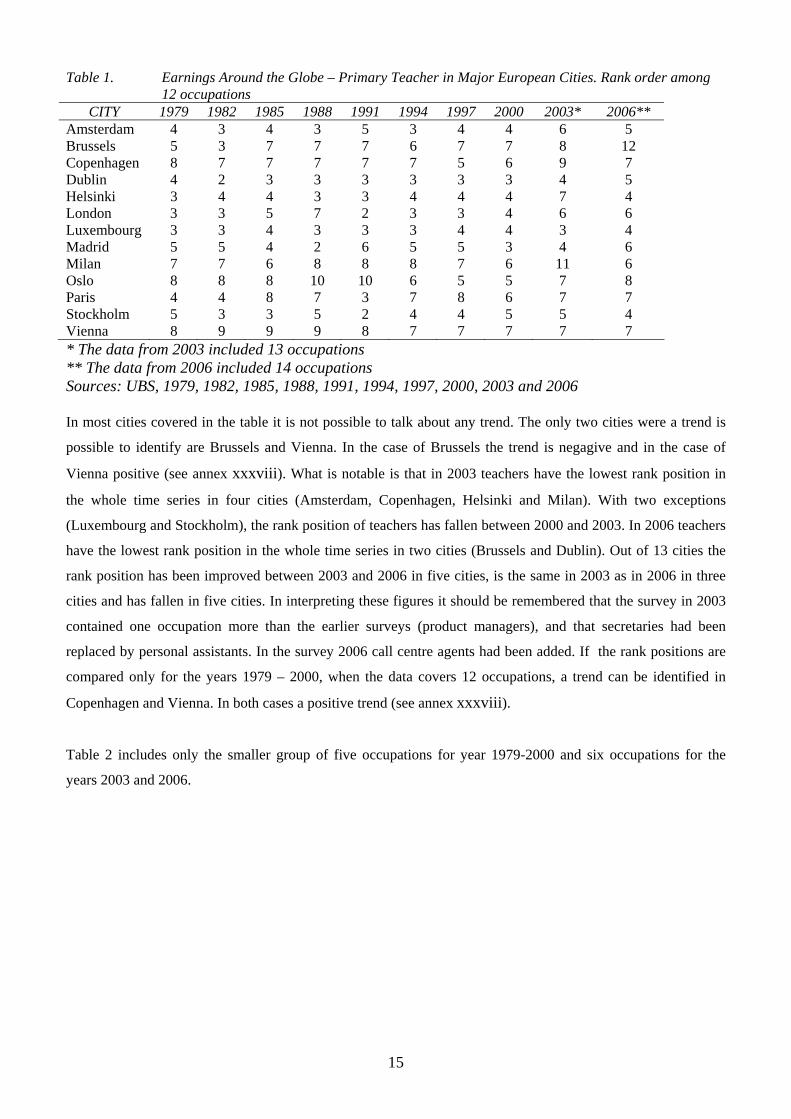
Table 1. Earnings Around the Globe – Primary Teacher in Major European Cities. Rank order among 12 occupations
CITY 1979 1982 1985 1988 1991 1994 1997 2000 2003* 2006** Amsterdam 4 3 4 3 5 3 4 4 6 5 Brussels 5 3 7 7 7 6 7 7 8 12 Copenhagen 8 7 7 7 7 7 5 6 9 7 Dublin 4 2 3 3 3 3 3 3 4 5 Helsinki 3 4 4 3 3 4 4 4 7 4 London 3 3 5 7 2 3 3 4 6 6 Luxembourg 3 3 4 3 3 3 4 4 3 4 Madrid 5 5 4 2 6 5 5 3 4 6 Milan 7 7 6 8 8 8 7 6 11 6 Oslo 8 8 8 10 10 6 5 5 7 8 Paris 4 4 8 7 3 7 8 6 7 7 Stockholm 5 3 3 5 2 4 4 5 5 4 Vienna 8 9 9 9 8 7 7 7 7 7 * The data from 2003 included 13 occupations ** The data from 2006 included 14 occupations Sources: UBS, 1979, 1982, 1985, 1988, 1991, 1994, 1997, 2000, 2003 and 2006 In most cities covered in the table it is not possible to talk about any trend. The only two cities were a trend is
possible to identify are Brussels and Vienna. In the case of Brussels the trend is negagive and in the case of
Vienna positive (see annex xxxviii). What is notable is that in 2003 teachers have the lowest rank position in
the whole time series in four cities (Amsterdam, Copenhagen, Helsinki and Milan). With two exceptions
(Luxembourg and Stockholm), the rank position of teachers has fallen between 2000 and 2003. In 2006 teachers
have the lowest rank position in the whole time series in two cities (Brussels and Dublin). Out of 13 cities the
rank position has been improved between 2003 and 2006 in five cities, is the same in 2003 as in 2006 in three
cities and has fallen in five cities. In interpreting these figures it should be remembered that the survey in 2003
contained one occupation more than the earlier surveys (product managers), and that secretaries had been
replaced by personal assistants. In the survey 2006 call centre agents had been added. If the rank positions are
compared only for the years 1979 – 2000, when the data covers 12 occupations, a trend can be identified in
Copenhagen and Vienna. In both cases a positive trend (see annex xxxviii).
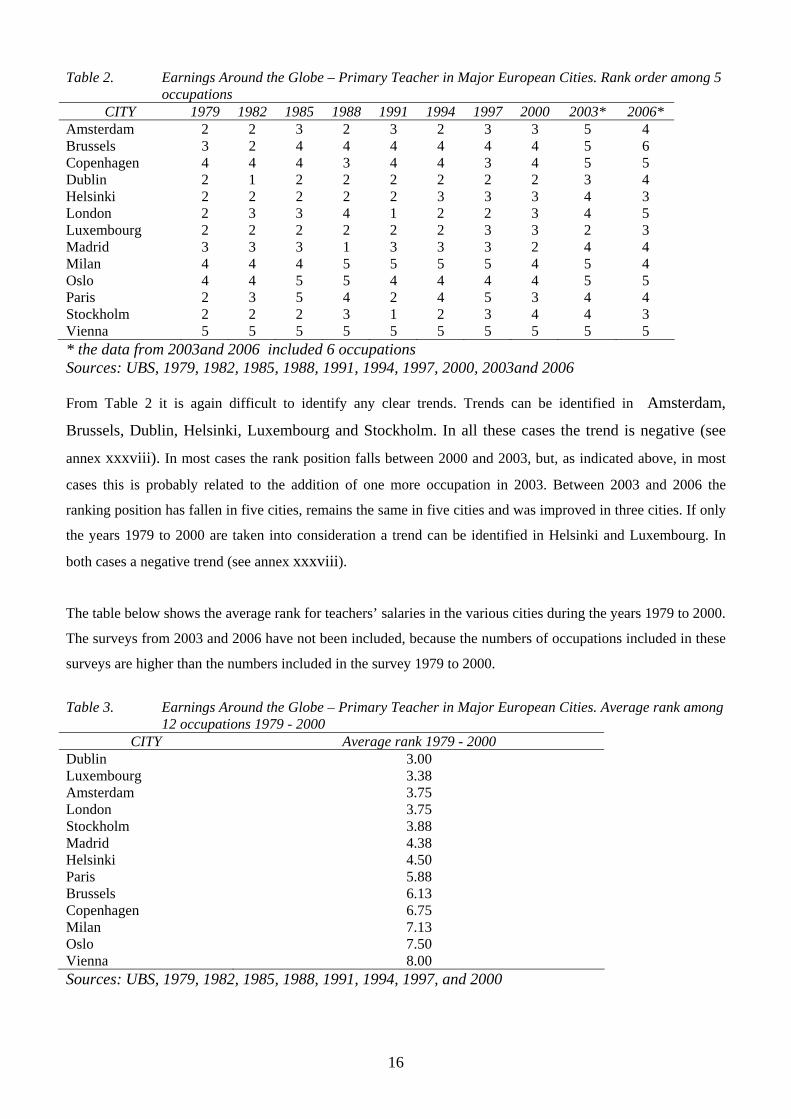
Table 2 includes only the smaller group of five occupations for year 1979-2000 and six occupations for the
years 2003 and 2006.
16
Table 2. Earnings Around the Globe – Primary Teacher in Major European Cities. Rank order among 5 occupations
CITY 1979 1982 1985 1988 1991 1994 1997 2000 2003* 2006* Amsterdam 2 2 3 2 3 2 3 3 5 4 Brussels 3 2 4 4 4 4 4 4 5 6 Copenhagen 4 4 4 3 4 4 3 4 5 5 Dublin 2 1 2 2 2 2 2 2 3 4 Helsinki 2 2 2 2 2 3 3 3 4 3 London 2 3 3 4 1 2 2 3 4 5 Luxembourg 2 2 2 2 2 2 3 3 2 3 Madrid 3 3 3 1 3 3 3 2 4 4 Milan 4 4 4 5 5 5 5 4 5 4 Oslo 4 4 5 5 4 4 4 4 5 5 Paris 2 3 5 4 2 4 5 3 4 4 Stockholm 2 2 2 3 1 2 3 4 4 3 Vienna 5 5 5 5 5 5 5 5 5 5 * the data from 2003and 2006 included 6 occupations Sources: UBS, 1979, 1982, 1985, 1988, 1991, 1994, 1997, 2000, 2003and 2006 From Table 2 it is again difficult to identify any clear trends. Trends can be identified in Amsterdam,
Brussels, Dublin, Helsinki, Luxembourg and Stockholm. In all these cases the trend is negative (see
annex xxxviii). In most cases the rank position falls between 2000 and 2003, but, as indicated above, in most
cases this is probably related to the addition of one more occupation in 2003. Between 2003 and 2006 the
ranking position has fallen in five cities, remains the same in five cities and was improved in three cities. If only
the years 1979 to 2000 are taken into consideration a trend can be identified in Helsinki and Luxembourg. In
both cases a negative trend (see annex xxxviii).
The table below shows the average rank for teachers’ salaries in the various cities during the years 1979 to 2000.
The surveys from 2003 and 2006 have not been included, because the numbers of occupations included in these
surveys are higher than the numbers included in the survey 1979 to 2000.
Table 3. Earnings Around the Globe – Primary Teacher in Major European Cities. Average rank among
12 occupations 1979 - 2000 CITY Average rank 1979 - 2000
Dublin 3.00 Luxembourg 3.38 Amsterdam 3.75 London 3.75 Stockholm 3.88 Madrid 4.38 Helsinki 4.50 Paris 5.88 Brussels 6.13 Copenhagen 6.75 Milan 7.13 Oslo 7.50 Vienna 8.00 Sources: UBS, 1979, 1982, 1985, 1988, 1991, 1994, 1997, and 2000
17
As can be seen, Dublin seems to be the city with the highest average rank for teachers’ salaries during the period
1979 to 2000, while Vienna seems to be the city with lowest average rank.
4.5. Teachers’ salaries compared with other occupations in 2006
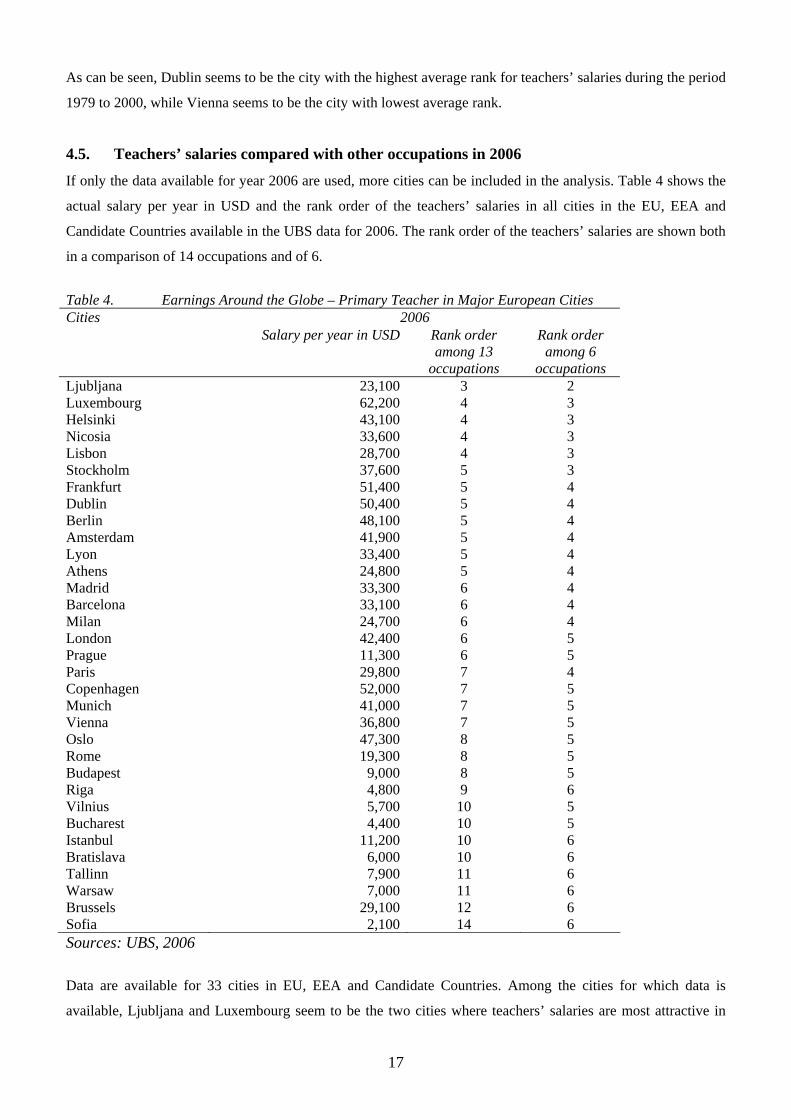
If only the data available for year 2006 are used, more cities can be included in the analysis. Table 4 shows the
actual salary per year in USD and the rank order of the teachers’ salaries in all cities in the EU, EEA and
Candidate Countries available in the UBS data for 2006. The rank order of the teachers’ salaries are shown both
in a comparison of 14 occupations and of 6.
Table 4. Earnings Around the Globe – Primary Teacher in Major European Cities
2006 Cities Salary per year in USD Rank order
among 13 occupations
Rank order among 6
occupations Ljubljana 23,100 3 2 Luxembourg 62,200 4 3 Helsinki 43,100 4 3 Nicosia 33,600 4 3 Lisbon 28,700 4 3 Stockholm 37,600 5 3 Frankfurt 51,400 5 4 Dublin 50,400 5 4 Berlin 48,100 5 4 Amsterdam 41,900 5 4 Lyon 33,400 5 4 Athens 24,800 5 4 Madrid 33,300 6 4 Barcelona 33,100 6 4 Milan 24,700 6 4 London 42,400 6 5 Prague 11,300 6 5 Paris 29,800 7 4 Copenhagen 52,000 7 5 Munich 41,000 7 5 Vienna 36,800 7 5 Oslo 47,300 8 5 Rome 19,300 8 5 Budapest 9,000 8 5 Riga 4,800 9 6 Vilnius 5,700 10 5 Bucharest 4,400 10 5 Istanbul 11,200 10 6 Bratislava 6,000 10 6 Tallinn 7,900 11 6 Warsaw 7,000 11 6 Brussels 29,100 12 6 Sofia 2,100 14 6 Sources: UBS, 2006
Data are available for 33 cities in EU, EEA and Candidate Countries. Among the cities for which data is
available, Ljubljana and Luxembourg seem to be the two cities where teachers’ salaries are most attractive in
18
comparison with the other professions for which salary information is available. It can be noted that while
teaching is one of the best paid occupations in some cities, it is one of the worst paid in others.
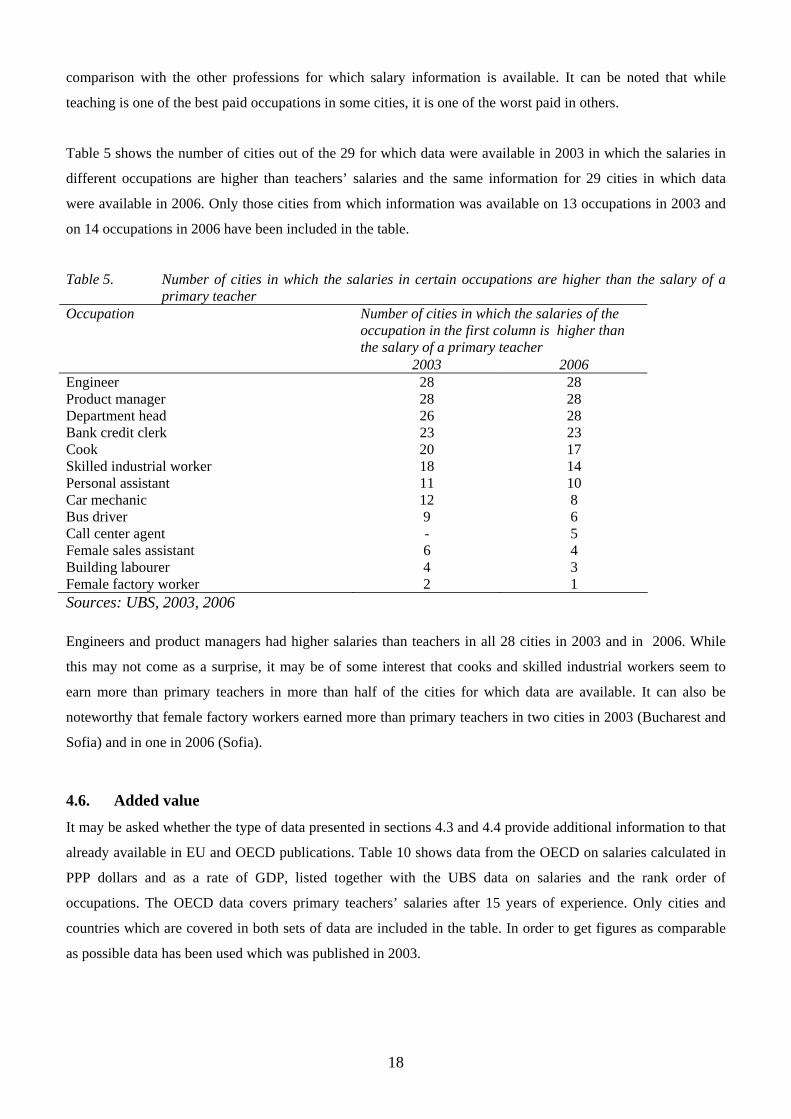
Table 5 shows the number of cities out of the 29 for which data were available in 2003 in which the salaries in
different occupations are higher than teachers’ salaries and the same information for 29 cities in which data
were available in 2006. Only those cities from which information was available on 13 occupations in 2003 and
on 14 occupations in 2006 have been included in the table.
Table 5. Number of cities in which the salaries in certain occupations are higher than the salary of a primary teacher
Number of cities in which the salaries of the occupation in the first column is higher than the salary of a primary teacher
Occupation
2003 2006 Engineer 28 28 Product manager 28 28 Department head 26 28 Bank credit clerk 23 23 Cook 20 17 Skilled industrial worker 18 14 Personal assistant 11 10 Car mechanic 12 8 Bus driver 9 6 Call center agent - 5 Female sales assistant 6 4 Building labourer 4 3 Female factory worker 2 1 Sources: UBS, 2003, 2006 Engineers and product managers had higher salaries than teachers in all 28 cities in 2003 and in 2006. While
this may not come as a surprise, it may be of some interest that cooks and skilled industrial workers seem to
earn more than primary teachers in more than half of the cities for which data are available. It can also be
noteworthy that female factory workers earned more than primary teachers in two cities in 2003 (Bucharest and
Sofia) and in one in 2006 (Sofia).
4.6. Added value
It may be asked whether the type of data presented in sections 4.3 and 4.4 provide additional information to that
already available in EU and OECD publications. Table 10 shows data from the OECD on salaries calculated in
PPP dollars and as a rate of GDP, listed together with the UBS data on salaries and the rank order of
occupations. The OECD data covers primary teachers’ salaries after 15 years of experience. Only cities and
countries which are covered in both sets of data are included in the table. In order to get figures as comparable
as possible data has been used which was published in 2003.
19
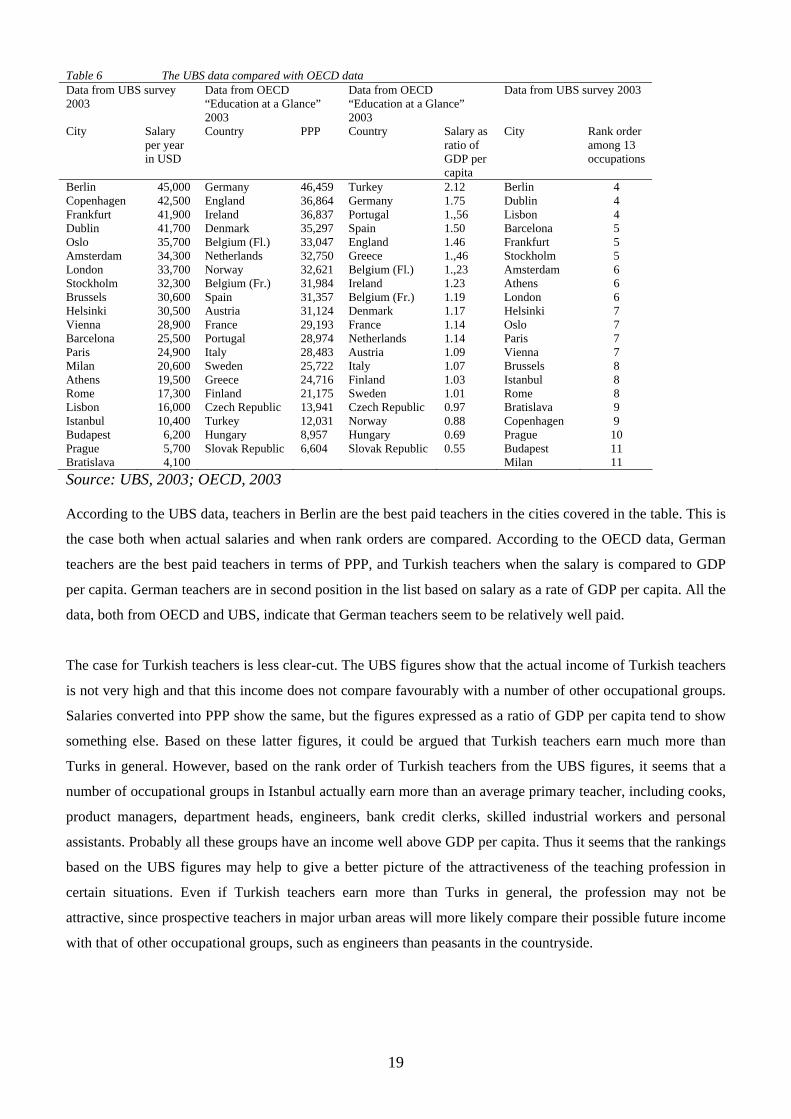
Table 6 The UBS data compared with OECD data Data from UBS survey 2003
Data from OECD “Education at a Glance” 2003
Data from OECD “Education at a Glance” 2003
Data from UBS survey 2003
City Salary per year in USD
Country PPP Country Salary as ratio of GDP per capita
City Rank order among 13 occupations
Berlin 45,000 Germany 46,459 Turkey 2.12 Berlin 4 Copenhagen 42,500 England 36,864 Germany 1.75 Dublin 4 Frankfurt 41,900 Ireland 36,837 Portugal 1.,56 Lisbon 4 Dublin 41,700 Denmark 35,297 Spain 1.50 Barcelona 5 Oslo 35,700 Belgium (Fl.) 33,047 England 1.46 Frankfurt 5 Amsterdam 34,300 Netherlands 32,750 Greece 1.,46 Stockholm 5 London 33,700 Norway 32,621 Belgium (Fl.) 1.,23 Amsterdam 6 Stockholm 32,300 Belgium (Fr.) 31,984 Ireland 1.23 Athens 6 Brussels 30,600 Spain 31,357 Belgium (Fr.) 1.19 London 6 Helsinki 30,500 Austria 31,124 Denmark 1.17 Helsinki 7 Vienna 28,900 France 29,193 France 1.14 Oslo 7 Barcelona 25,500 Portugal 28,974 Netherlands 1.14 Paris 7 Paris 24,900 Italy 28,483 Austria 1.09 Vienna 7 Milan 20,600 Sweden 25,722 Italy 1.07 Brussels 8 Athens 19,500 Greece 24,716 Finland 1.03 Istanbul 8 Rome 17,300 Finland 21,175 Sweden 1.01 Rome 8 Lisbon 16,000 Czech Republic 13,941 Czech Republic 0.97 Bratislava 9 Istanbul 10,400 Turkey 12,031 Norway 0.88 Copenhagen 9 Budapest 6,200 Hungary 8,957 Hungary 0.69 Prague 10 Prague 5,700 Slovak Republic 6,604 Slovak Republic 0.55 Budapest 11 Bratislava 4,100 Milan 11 Source: UBS, 2003; OECD, 2003 According to the UBS data, teachers in Berlin are the best paid teachers in the cities covered in the table. This is
the case both when actual salaries and when rank orders are compared. According to the OECD data, German
teachers are the best paid teachers in terms of PPP, and Turkish teachers when the salary is compared to GDP
per capita. German teachers are in second position in the list based on salary as a rate of GDP per capita. All the
data, both from OECD and UBS, indicate that German teachers seem to be relatively well paid.
The case for Turkish teachers is less clear-cut. The UBS figures show that the actual income of Turkish teachers
is not very high and that this income does not compare favourably with a number of other occupational groups.
Salaries converted into PPP show the same, but the figures expressed as a ratio of GDP per capita tend to show
something else. Based on these latter figures, it could be argued that Turkish teachers earn much more than
Turks in general. However, based on the rank order of Turkish teachers from the UBS figures, it seems that a
number of occupational groups in Istanbul actually earn more than an average primary teacher, including cooks,
product managers, department heads, engineers, bank credit clerks, skilled industrial workers and personal
assistants. Probably all these groups have an income well above GDP per capita. Thus it seems that the rankings
based on the UBS figures may help to give a better picture of the attractiveness of the teaching profession in
certain situations. Even if Turkish teachers earn more than Turks in general, the profession may not be
attractive, since prospective teachers in major urban areas will more likely compare their possible future income
with that of other occupational groups, such as engineers than peasants in the countryside.
20
4.6. Limitations of the UBS surveys
There are a number of limitations related to the data available in the UBS publications. The UBS data
has not been collected for the purpose of doing comparisons between different occupations. For a comparison
between teachers’ salaries and other occupations it may be of greater interest to compare teaching with
occupations which require a similar length of education. The selection of occupations made in the UBS studies
is premised on the idea of giving a general overview of the earnings of different occupational groups in society.
A serious limitation is that the data collected by UBS has not been based on an appropriate, random selection of
workplaces. This may be of minor importance for the calculation of teachers’ salaries, because in most countries
teachers’ salaries are strictly regulated, with agreed steps on a given salary scale (European
Commission/Eurydice/Eurostat, 2005). For other occupations, however, this may mean that the actual salaries
may have been inflated or understated. From the information available it is not possible to ascertain whether this
has actually happened and in which direction possible errors may have been made. UBS has compared collected
data with other sources, such as ILO data, for a cross-check. This may have helped to minimize possible
problems with the quality of the data.
It is important to keep in mind that the UBS data have been collected in mayor cities. The teacher salary scales
are in many countries more compressed and rigid than in other professions. This means that teachers in big
cities often earn almost the same as teachers in rural areas. Salaries for other professions tend to be higher in
major city areas than in rural areas. For example, a teacher that is at the lower end of the salary scale in Istanbul
may have a salary that is lower than other professions in Istanbul, but still higher than the salaries of other
professions in for example in Eastern Anatolia. A teacher in London may have a salary which is lower than the
salaries of several other occupations in London, but the same salary may compare much more favourable with
the same occupations in a smaller town in a rural area.
The UBS data only takes salaries into consideration. In many countries teachers may have other advantaged that
are not related to the salary. Even if the salary does not look attractive in comparison with other occupations the
whole package of working conditions may still be favourable when compared with other occupations. To get a
full picture of the attractiveness of teachers working conditions it would be necessary to include working hours,
job security, possibilities for promotion and a number of other issues.
The UBS data only covers the salaries of primary teachers. Primary teachers may be the largest group of
teachers in many countries, but there are also many other groups of teachers. Generally it can be assumed that
primary teachers earn more than pre-school teachers, but less than secondary teachers. This may be true in
almost all countries, but what probably is widely different is the size of the differences between different
categories of teachers. To get a full picture of the attractiveness of the teaching profession it would be necessary
to also have information about other groups of teachers.
21
In the UBS data information has been collected in most cases for those who have 10 years of working
experience, are married and have two children. Depending on the salary scales in different countries this may
have various implications. In some countries the teachers may still expect a substantial growth of their salaries,
while in others the growth may start be slower already after 10 years. Due to the fact that teachers often have
salaries fixed according to the scale the development of the salaries are more predictable than for other
professions. To get a full picture of how attractive teachers’ salaries may be it would be necessary to also look
into how the salary develops over time for an individual and compare this with what could be a predicted
development for other occupations. To get this type of data for a large number of cities or countries may be
rather difficult.
5. Conclusions and discussion The purpose of this study was to explore whether existing data provide internationally comparable information
on how teachers’ salaries compare with salaries in other occupations. It can be concluded that this type of
information is not available from the major providers of data on teachers and education. UBS provides this type
of data to a certain extent, but with several weaknesses. First, the UBS data has not been collected for these
purposes. Second, it may be of greater interest to compare teaching with occupations which require a similar
length of education, rather than with the occupations covered by the UBS studies. The selection of occupations
made in the UBS studies is premised on the idea of giving a general overview of the earnings of different
occupational groups in society. Third, the data collected by UBS has not been based on an appropriate, random
selection of workplaces. This may be of minor importance for the calculation of teachers’ salaries, because in
most countries teachers’ salaries are strictly regulated, with agreed steps on a given salary scale (European
Commission/Eurydice/Eurostat, 2005). For other occupations, however, this may mean that the actual salaries
may have been inflated or understated. From the information available it is not possible to ascertain whether this
has actually happened and in which direction possible errors may have been made. UBS has compared collected
data with other sources, such as ILO data, for a cross-check. This may have helped to minimize possible
problems with the quality of the data.
The time series of the rank position of teachers’ salary levels did not show any specific general trend in relation
to other occupations. The rankings have changed in relation to other occupations in several cities, but in most
cases without any clear trajectory. When the analysis is restricted to a comparison of the five occupations based
on more or less the same criteria concerning working experience, age and family, the picture changes slightly.
Generally, teachers’ salaries seem to be fairly stable in rank order in relation to the other occupations, but there
is a downwards trend in some cities. In 2003 and 2006 engineers and product managers had higher salaries than
teachers in 28 cities out of 29 under examination and teachers earned more than building workers and female
factory workers in most cities.
22
The case of Turkish teachers’ salaries showed that this type of comparison may add another perspective to the
debate on how to attract young people to the teaching profession. In this regard the type of data collected by
UBS could be of interest for further analysis of how to make the teaching profession attractive.
If this data can open up new approaches to the analysis of the attractiveness of teaching profession, it could be
of interest to collect and analyse such information on a regular basis. There are basically two possibilities to
obtain data: either to use the existing UBS data with their advantages and disadvantages, or to use more formal
channels to acquire this information. In the latter case it would then be possible to decide which occupations
would be relevant to for the purpose of comparison. In the long run information on the relation between
teachers’ salaries and the salaries of other professions could be used to construct an indicator on the
attractiveness of the teaching profession.

23
Annexes i. Cities covered in “Earnings Around the Globe” (1974 – 2006) ii. Primary teacher’ salaries in major cities in EU, EEA and candidate countries (1974 – 2006) iii. Occupations covered in “Earnings Around the Globe” (1974 – 2006) iv. Criteria for the occupations covered in “Earnings Around the Globe” (1974 – 2006) 34 cities from the EU, EEA and Candidate Countries have been covered by the UBS surveys between 1974 and 2006. The annexes i. – xxxiii contains tables for 33 of these cities. Düsseldorf, where data was only collected 1974 – 1994, is not included. v. Amsterdam vi. Athens vii. Barcelona viii. Berlin ix. Bratislava x. Brussels xi. Bucharest xii. Budapest xiii. Copenhagen xiv. Dublin xv. Frankfurt xvi. Helsinki xvii. Istanbul xviii. Lisbon xix. Ljubljana xx. London xxi. Luxembourg xxii. Lyon xxiii Madrid xxiv Milan xxv Munich xxvi. Nicosia xxvii. Oslo xxviii. Paris xxix. Prague xxx. Riga xxxi. Rome xxxii. Sofia xxxiii. Stockholm xxxiv. Tallinn xxxv. Vienna xxxvi. Vilnius xxxvii Warsaw xxxviii Teacher salaries - trends
24
Annex i. Cities covered in “Earnings Around the Globe” (1974 – 2006) Earnings Around the Globe – Primary Teacher in Major World Cities (1974 – 2003) CITY 197
4 1976 1979 1982 1985 1988 1991 1994 1997 2000 2003 2006
Abu Dhabi --- --- x --- --- x --- x x x --- ---
Amsterdam x x x x x x x x x x x x
Athens x x x x x --- x x x x x x
Auckland --- --- --- --- --- --- --- --- --- x x x
Bangkok --- --- x x x --- --- x x x x x
Barcelona --- --- --- --- --- --- --- --- --- x x x
Basel --- --- --- --- --- --- --- --- --- --- x ---
Beijing --- --- --- --- --- --- --- --- --- --- --- x
Berlin --- --- --- --- --- --- --- --- --- x x x
Bogotá x x x x x x x x x x x x
Bombay/Mumbai
x --- --- x x x x x x x x x
Bratislava --- --- --- --- --- --- --- --- --- --- x x
Brussels x x x x x x x x x x x x
Bucharest --- --- --- --- --- --- --- --- --- --- x x
Budapest --- --- --- --- --- --- --- x x x x x
Buenos Aires x x x x x x x x x x x x
Cairo --- --- --- x x x --- --- --- x --- ---
Caracas x x x x x x x x x x x x
Chicago x x x x x x x x x x x x
Copenhagen x x x x x x x x x x x x
Dehli --- --- --- --- --- --- --- --- --- --- --- x
Dubai --- --- --- --- --- --- --- --- --- --- x x
Dublin --- x x x x x x x x x x x
Düsseldorf x x x x x x x x --- --- --- ---
Frankfurt --- --- --- --- --- x x x x x x x
Geneva x x x x x x x x x x x x
Helsinki x x x x x x x x x x x x
Hong Kong x x x x x x x x x x x x
Houston --- --- --- --- x x x x x x --- ---
Istanbul x x x x x x --- --- x x x x
Jakarata --- --- --- --- --- x x x x x x x
Jeddah --- --- x x x x --- --- --- --- --- ---
Johannesburg x x x x x x x x x x x x
Karachi --- --- --- --- --- --- --- --- --- --- x ---
Kiev --- --- --- --- --- --- --- --- --- --- x x
Kuala Lumpur
--- --- --- --- x x x --- x x x x
Lagos --- --- --- --- x x x x --- --- x ---
Lima --- --- --- --- --- --- --- --- --- --- x x
Lisbon x x --- --- x x x x x x x x
Ljubljana --- --- --- --- --- --- --- --- --- --- x x
London x x x x x x x x x x x x
Los Angeles --- x x x x x x x x x x x
Luxembourg x x x x x x x x x x x x
Lyon --- --- --- --- --- --- --- --- --- --- --- x
Madrid x x x x x x x x x x x x
Manama --- x x x x x --- x x x x x
25
Manila --- x x x x x x x x x x x
Mexico City x x x x x x x x x x x x
Miami --- --- --- --- --- --- --- --- --- --- x x
Milan x x x x x x x x x x x x
Montreal x x x x x x x x x x x x
Moscow --- --- --- --- --- --- --- --- --- x x x
Munich --- --- --- --- --- --- --- --- --- --- --- x
Nairobi --- --- --- --- --- x x x x x x x
New York x x x x x x x x x x x x
Nicosia --- --- --- --- --- x x x x x --- x
Oslo x x x x x x x x x x x x
Panama City --- x x x x x x x x x --- ---
Paris x x x x x x x x x x x x
Prague --- --- --- --- --- --- --- --- --- --- x x
Riga --- --- --- --- --- --- -- --- --- --- x x
Rio de Janeiro
x x x x x x x x x x x x
Rome x --- --- --- --- --- --- --- --- --- x x
Santiago de Chile
--- --- --- --- --- --- --- --- --- x x x
São Paolo x x x x x x x x x x x x
Seoul --- --- --- x x x x x x x x x
Shanghai --- --- --- --- --- --- --- --- --- x x x
Singapore x x x x x x x x x x x x
Sofia --- --- --- --- --- --- --- --- --- --- x x
Stockholm x x x x x x x x x x x x
Sydney x x x x x x x x x x x x
Taipei --- --- --- --- --- --- x x x x x x
Tallinn --- --- --- --- --- --- --- --- --- --- x x
Tel Aviv x x x x x x x x x x x x
Tokyo x x x x x x x x x x x x
Toronto --- x x x x x x x x x x x
Vienna x x x x x x x x x x x x
Vilnius --- --- --- --- --- --- --- --- --- --- x x
Warsaw --- --- --- --- --- --- --- --- --- x x x
Zurich x x x x x x x x x x x x
Sources: UBS, 1974, 1976, 1979, 1982, 1985, 1988, 1991, 1994, 1997, 2000, 2003 and 2006
26
Annex ii. Primary teacher’ salaries in major cities in EU, EEA and candidate countries (1974 – 2006)
Earnings Around the Globe – Primary Teacher in Major Cities in EU, EEA and candidate countries
CITY 1974 1976 1979 1982 1985 1988 1991 1994 1997 2000 2003 2006 Amsterdam 8,030 13,140 20,300 17,400 12,190 25,700 21,770 31,500 29,200 26,300 34,300 41,900 Athens 3,180 3,880 6,700 7,500 6,960 --- 9,380 11,900 14,600 13,840 19,500 24,800 Barcelona --- --- --- --- --- --- --- --- --- 19,080 25,500 33,100 Berlin --- --- --- --- --- --- --- --- 36,100 31,840 45,000 48,100 Bratislava --- --- --- --- --- --- --- --- --- --- 4,100 6,000 Brussels 6,610 10,490 16,800 13,800 10,730 21,300 22,710 24,600 26,600 23,950 30,600 29,100 Bucharest --- --- --- --- --- --- --- --- --- --- 1,800 4,400 Budapest --- --- --- --- --- --- --- 2,900 2,600 2,350 6,200 9,000 Copenhagen 9,530 16,820 19,600 16,200 15,150 28,300 29,070 33,800 38,700 33,640 42,500 52,000 Dublin --- 7,560 11,100 12,900 12,150 22,900 23,310 26,100 31,800 28,410 41,700 50,400 Düsseldorf 10,740 12,800 20,100 18,600 14,540 27,200 32,690 39,900 --- --- --- --- Frankfurt --- --- --- --- --- 34,000 35,770 41,300 41,800 36,590 41,900 51,400 Helsinki 6,920 10,900 11,900 12,900 11,810 26,000 31,620 25,600 25,200 24,310 30,500 43,100 Istanbul 2,210 2,120 2,800 2,300 1,580 2,700 --- --- 5,400 5,480 10,400 11,200 Lisbon 3,690 3,840 --- --- 4,000 7,900 10,110 15,400 18,000 16,250 16,000 28,700 Ljubljana --- --- --- --- --- --- --- --- --- --- 17,800 23,100 London 5,770 8,080 12,200 13,800 11,150 20,900 26,930 29,500 32,100 35,750 33,700 42,400 Luxembourg 10,480 13,400 25,100 20,700 17,690 35,900 44,950 61,500 53,400 44,780 58,000 62,200 Lyon --- --- --- --- --- --- --- --- --- --- --- 33,400 Madrid 5,760 5,980 8,800 9,700 9,500 17,000 23,580 21,700 23,500 18,420 27,600 33,300 Milan 4,420 4,190 7,500 8,100 8,810 17,300 19,690 18,800 21,800 18,540 20,600 24,700 Munich --- --- --- --- --- --- --- --- --- --- --- 41.000 Nicosia --- --- --- --- --- 15,700 15,000 21,000 24,900 26,720 --- 33,600 Oslo 8,020 11,150 15,000 16,600 14,650 22,500 20,970 26,300 24,900 29,370 35,700 47,300 Paris 6,480 8,050 14,500 12,600 9,040 17,300 20,970 20,300 21,400 20,040 24,900 29,800 Prague --- --- --- --- --- --- --- --- --- --- 5,700 11,300 Riga --- --- --- --- --- --- -- --- --- --- 5,300 4,800 Rome 4,080 --- --- --- --- --- --- --- --- --- 17,300 19,300 Sofia --- --- --- --- --- --- --- --- --- --- 2,100 2,100 Stockholm 11,060 12,780 17,300 16,800 12,770 22,800 28,130 24,700 27,100 26,750 32,300 37,600 Tallinn --- --- --- --- --- --- --- --- --- --- 5,100 7,900 Vienna 4,800 6,570 11,600 11,000 9,500 18,800 20,770 25,300 27,000 24,500 28,900 36,800 Vilnius --- --- --- --- --- --- --- --- --- --- 3,700 5,700 Warsaw --- --- --- --- --- --- --- --- --- 3,730 5,300 7,000
Sources: UBS, 1974, 1976, 1979, 1982, 1985, 1988, 1991, 1994, 1997, 2000, 2003 and 2006
27
Annex iii. Occupations covred in “Earnings Around the Globe” (1974 – 2006) Earnings Around the Globe – occupations in the studies
Occupations 1974 1976 1979 1982 1985 1988 1991 1994 1997 2000 2003 2006 Primary school teacher
x x x x x x x x x x x x
Bus driver x x x x x x x x x x x x Car mechanic x x x x x x x x x x x x Building labourer
--- x x x x x x x x x x x
Skilled industrial worker
--- x x x x x x x x x x x
Cook --- --- x x x x x x x x x x Department manager / department head
x x x x x x x x x x x x
Electrical engineer /engineer
--- --- x x x x x x x x x x
Bank teller/ credit clerk / bank credit officer
x x x x x x x x x x x x
Secretary x x x x x x x x x x --- --- Saleswoman / female sales assistant
--- --- x x x x x x x x x x
Female industrial worker / female factory worker
--- x x x x x x x x x x x
Personal assistant
--- --- --- --- --- --- --- --- --- --- x x
Product manager
--- --- --- --- --- --- --- --- --- --- x x
Call center agent
--- --- --- --- --- --- --- --- --- --- --- x
Total number of occupations
6 9 12 12 12 12 12 12 12 12 13 14
Sources: UBS, 1974, 1976, 1979, 1982, 1985, 1988, 1991, 1994, 1997, 2000, 2003and 2006
28
Annex iv. Criteria for the occupations covered in “Earnings Around the Globe” (1974 – 2006) The criteria have not been identical in all years. For those occupations where there have been some variations two sets of criteria are shown. Earnings Around the Globe – criteria for the occupations in the studies
Occupations Criteria Primary school teacher A teacher who has taught in the public school system for about 10
years; approx. 35 years old; married; two children.
Bus driver Employed by municipal transport operator; around 10 years experience; about 35 years old; married; two children.
Car mechanic With completed apprenticeship and around 5 years experience; about 25 years old; single.
Building labourer Unskilled or semi-skilled labourer; about 25 years old; single. Skilled industrial worker Skilled worker with vocational training and about 10 years
experience with a large company in the metal working industry; approx. 35 years old; married; two children.
Cook Commis chef or chef de partie in a good restaurant; supervising 2 or 3 people; completed vocational training as cook; around 10 years experience; about 30 years old; single; salary data include value of free board and lodging where provided. Works in a kitchen of a good restaurant or hotel with fairly large staff; position is that of the deputy to the cook or chef de partie; supervising 2-3 cooks; completed vocational training as cook; about 10 years of experience; approx. 30 years old; single; salary data include value of free meals and lodging, if such are provided.
Department manager/ department head
Operation manager/operational head of a production department with a staff of over 1000 in a sizeable company in the metal working industry; completed vocational training; many years experience in the field; about 40 years old; married; two children.
Engineer/electrical engineer Employed by an industrial firm in the machinery or electrical equipment industry, power station or similar; completed university studies (university, technical university or higher technical college); at least 5 years practical experience; about 35 years old; married; two children. Employed by an industrial firm in the electrical engineering sector; university or technical college graduate; at least 5 years work experience; about 35 years old; married; two children.
Bank teller/credit clerk Completed bank training; about 10 years experience in a bank; approx. 35 years old; married; two children.
Saleswoman Employed in the women’s clothing section of a large department store; sales training plus some years sales experience; 20-25 years old; single.
Female industrial worker / female factory worker
Unskilled or semi-skilled machine operator in a medium-sized company, mainly in the textile industry; about 25 years old; single.
Secretary Secretary to a department manager in an industrial or commercial company; about 5 years experience (computer skills, 1 foreign language); approx. 25 years old; single.
Personal assistant Personal assistant to a department head in an industrial or service

29
company; around 5 years experience (PC skills, 1 foreign language); about 25 years old; single.
Product manager Employed in the pharmaceuticals, chemicals or food industry; middle-management position; university or technical college graduate; at least 5 years’ experience in the field; about 35 years old; married; no children.
Call center agent Trained agent at an inbound call/service centre, e.g. in the telecommunication or technology sector, about 25 years, single
Sources: UBS, 1974, 1976, 1979, 1982, 1985, 1988, 1991, 1994, 1997, 2000, 2003 and 2006
30
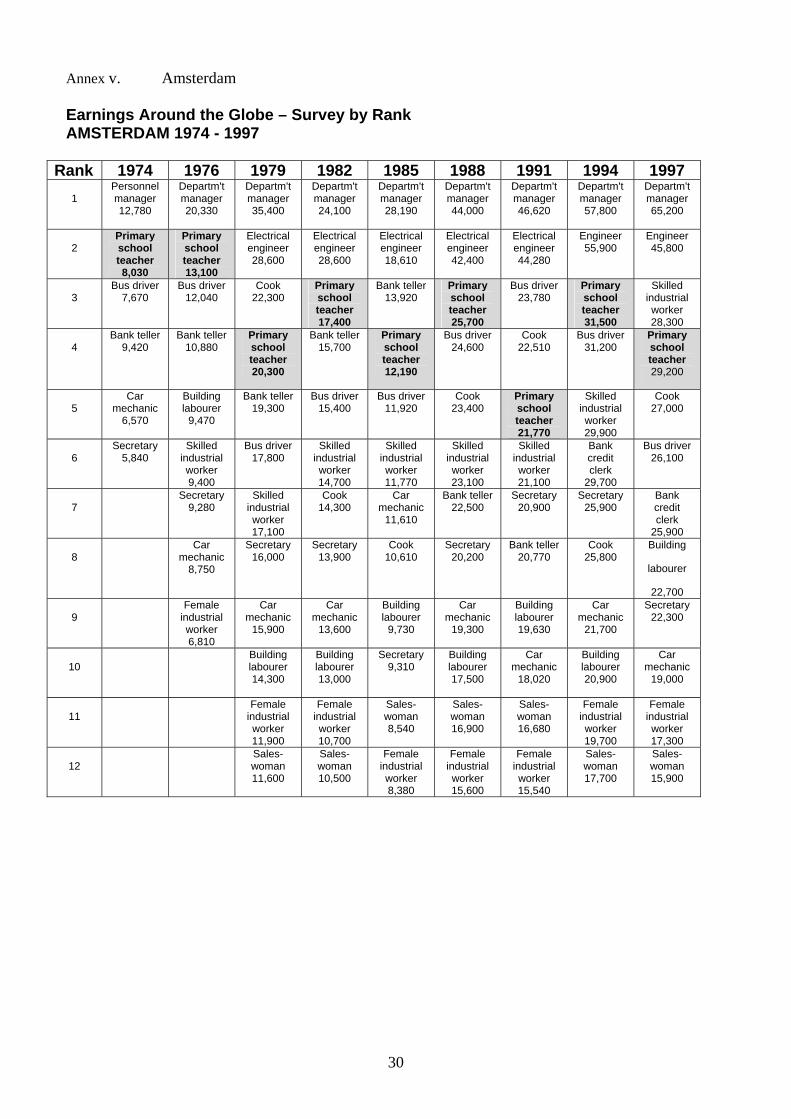
Annex v. Amsterdam Earnings Around the Globe – Survey by Rank AMSTERDAM 1974 - 1997
Rank 1974 1976 1979 1982 1985 1988 1991 1994 1997
1
Personnel manager 12,780
Departm't manager 20,330
Departm't manager 35,400
Departm't manager 24,100
Departm't manager 28,190
Departm't manager 44,000
Departm't manager 46,620
Departm't manager 57,800
Departm't manager 65,200
2
Primary school teacher 8,030
Primary school teacher 13,100
Electrical engineer 28,600
Electrical engineer 28,600
Electrical engineer 18,610
Electrical engineer 42,400
Electrical engineer 44,280
Engineer 55,900
Engineer 45,800
3
Bus driver 7,670
Bus driver 12,040
Cook 22,300
Primary school teacher 17,400
Bank teller 13,920
Primary school teacher 25,700
Bus driver 23,780
Primary school teacher 31,500
Skilled industrial worker 28,300
4
Bank teller 9,420
Bank teller 10,880
Primary school teacher 20,300
Bank teller 15,700
Primary school teacher 12,190
Bus driver 24,600
Cook 22,510
Bus driver 31,200
Primary school teacher 29,200
5
Car mechanic
6,570
Building labourer
9,470
Bank teller 19,300
Bus driver 15,400
Bus driver 11,920
Cook 23,400
Primary school teacher 21,770
Skilled industrial worker 29,900
Cook 27,000
6
Secretary 5,840
Skilled industrial worker 9,400
Bus driver 17,800
Skilled industrial worker 14,700
Skilled industrial worker 11,770
Skilled industrial worker 23,100
Skilled industrial worker 21,100
Bank credit clerk
29,700
Bus driver 26,100
7
Secretary 9,280
Skilled industrial worker 17,100
Cook 14,300
Car mechanic
11,610
Bank teller 22,500
Secretary 20,900
Secretary 25,900
Bank credit clerk
25,900
8
Car mechanic
8,750
Secretary 16,000
Secretary 13,900
Cook 10,610
Secretary 20,200
Bank teller 20,770
Cook 25,800
Building
labourer
22,700
9 Female
industrial worker 6,810
Car mechanic
15,900
Car mechanic
13,600
Building labourer
9,730
Car mechanic
19,300
Building labourer 19,630
Car mechanic
21,700
Secretary 22,300
10
Building labourer 14,300
Building labourer 13,000
Secretary 9,310
Building labourer 17,500
Car mechanic
18,020
Building labourer 20,900
Car mechanic
19,000
11
Female industrial worker 11,900
Female industrial worker 10,700
Sales-woman 8,540
Sales-woman 16,900
Sales-woman 16,680
Female industrial worker 19,700
Female industrial worker 17,300
12
Sales-woman 11,600
Sales-woman 10,500
Female industrial worker 8,380
Female industrial worker 15,600
Female industrial worker 15,540
Sales-woman 17,700
Sales-woman 15,900
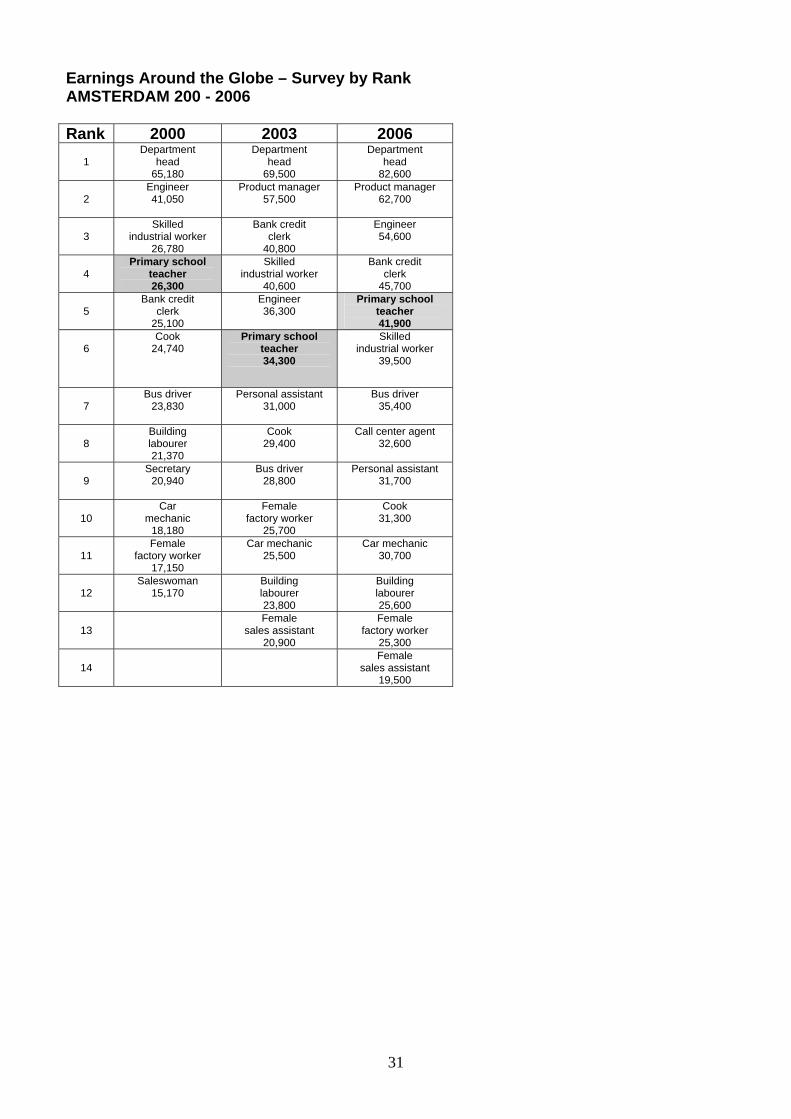
31
Earnings Around the Globe – Survey by Rank AMSTERDAM 200 - 2006 Rank 2000 2003 2006
1
Department head
65,180
Department head
69,500
Department head
82,600
2 Engineer 41,050
Product manager 57,500
Product manager 62,700
3 Skilled
industrial worker 26,780
Bank credit clerk
40,800
Engineer 54,600
4 Primary school
teacher 26,300
Skilled industrial worker
40,600
Bank credit clerk
45,700
5
Bank credit clerk
25,100
Engineer 36,300
Primary school teacher 41,900
6
Cook 24,740
Primary school teacher 34,300
Skilled industrial worker
39,500
7
Bus driver 23,830
Personal assistant 31,000
Bus driver 35,400
8 Building labourer 21,370
Cook 29,400
Call center agent 32,600
9 Secretary
20,940
Bus driver 28,800
Personal assistant 31,700
10 Car
mechanic 18,180
Female factory worker
25,700
Cook 31,300
11 Female
factory worker 17,150
Car mechanic 25,500
Car mechanic 30,700
12
Saleswoman 15,170
Building labourer 23,800
Building labourer 25,600
13
Female sales assistant
20,900
Female factory worker
25,300
14
Female sales assistant
19,500
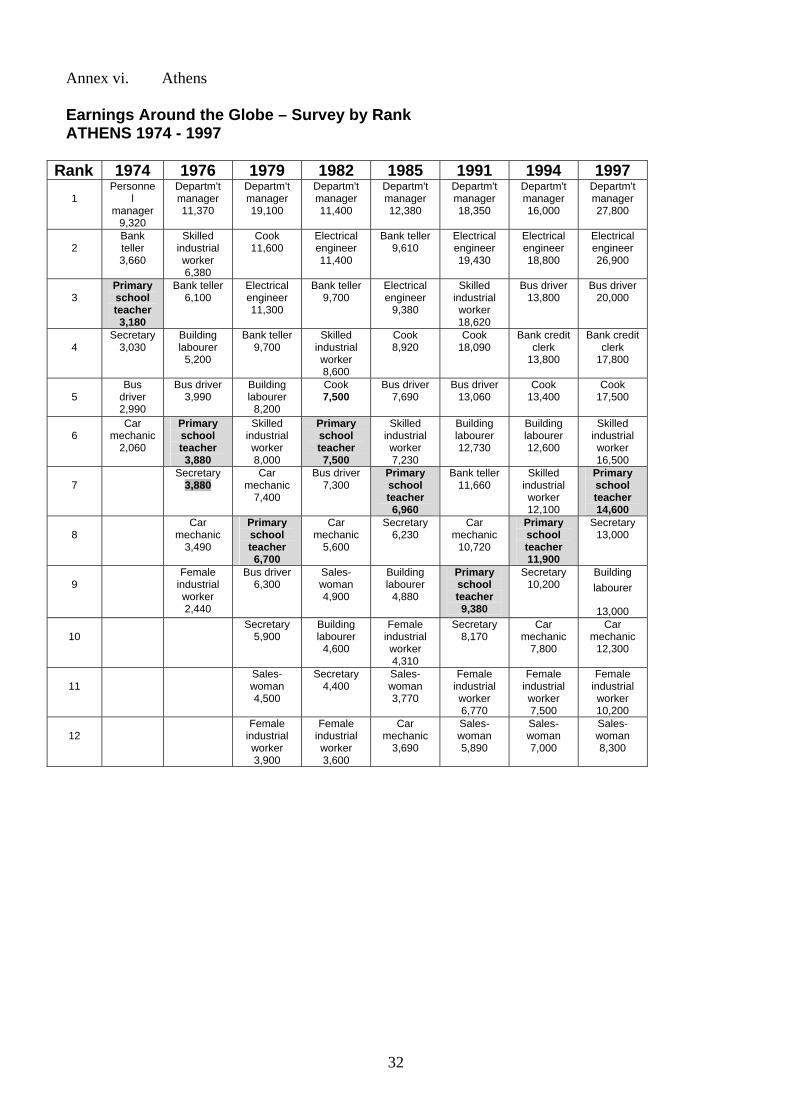
32
Annex vi. Athens Earnings Around the Globe – Survey by Rank ATHENS 1974 - 1997
Rank 1974 1976 1979 1982 1985 1991 1994 1997
1
Personnel
manager 9,320
Departm't manager 11,370
Departm't manager 19,100
Departm't manager 11,400
Departm't manager 12,380
Departm't manager 18,350
Departm't manager 16,000
Departm't manager 27,800
2
Bank teller 3,660
Skilled industrial worker 6,380
Cook 11,600
Electrical engineer 11,400
Bank teller 9,610
Electrical engineer 19,430
Electrical engineer 18,800
Electrical engineer 26,900
3
Primary school teacher 3,180
Bank teller 6,100
Electrical engineer 11,300
Bank teller 9,700
Electrical engineer
9,380
Skilled industrial worker 18,620
Bus driver 13,800
Bus driver 20,000
4
Secretary 3,030
Building labourer
5,200
Bank teller 9,700
Skilled industrial worker 8,600
Cook 8,920
Cook 18,090
Bank credit clerk
13,800
Bank credit clerk
17,800
5
Bus driver 2,990
Bus driver 3,990
Building labourer
8,200
Cook 7,500
Bus driver 7,690
Bus driver 13,060
Cook 13,400
Cook 17,500
6 Car
mechanic 2,060
Primary school teacher 3,880
Skilled industrial worker 8,000
Primary school teacher 7,500
Skilled industrial worker 7,230
Building labourer 12,730
Building labourer 12,600
Skilled industrial worker 16,500
7
Secretary 3,880
Car mechanic
7,400
Bus driver 7,300
Primary school teacher 6,960
Bank teller 11,660
Skilled industrial worker 12,100
Primary school teacher 14,600
8
Car mechanic
3,490
Primary school teacher 6,700
Car mechanic
5,600
Secretary 6,230
Car mechanic
10,720
Primary school teacher 11,900
Secretary 13,000
9
Female industrial worker 2,440
Bus driver 6,300
Sales-woman 4,900
Building labourer
4,880
Primary school teacher 9,380
Secretary 10,200
Building labourer
13,000
10
Secretary 5,900
Building labourer
4,600
Female industrial worker 4,310
Secretary 8,170
Car mechanic
7,800
Car mechanic
12,300
11
Sales-woman 4,500
Secretary 4,400
Sales-woman 3,770
Female industrial worker 6,770
Female industrial worker 7,500
Female industrial worker 10,200
12
Female industrial worker 3,900
Female industrial worker 3,600
Car mechanic
3,690
Sales-woman 5,890
Sales-woman 7,000
Sales-woman 8,300
33
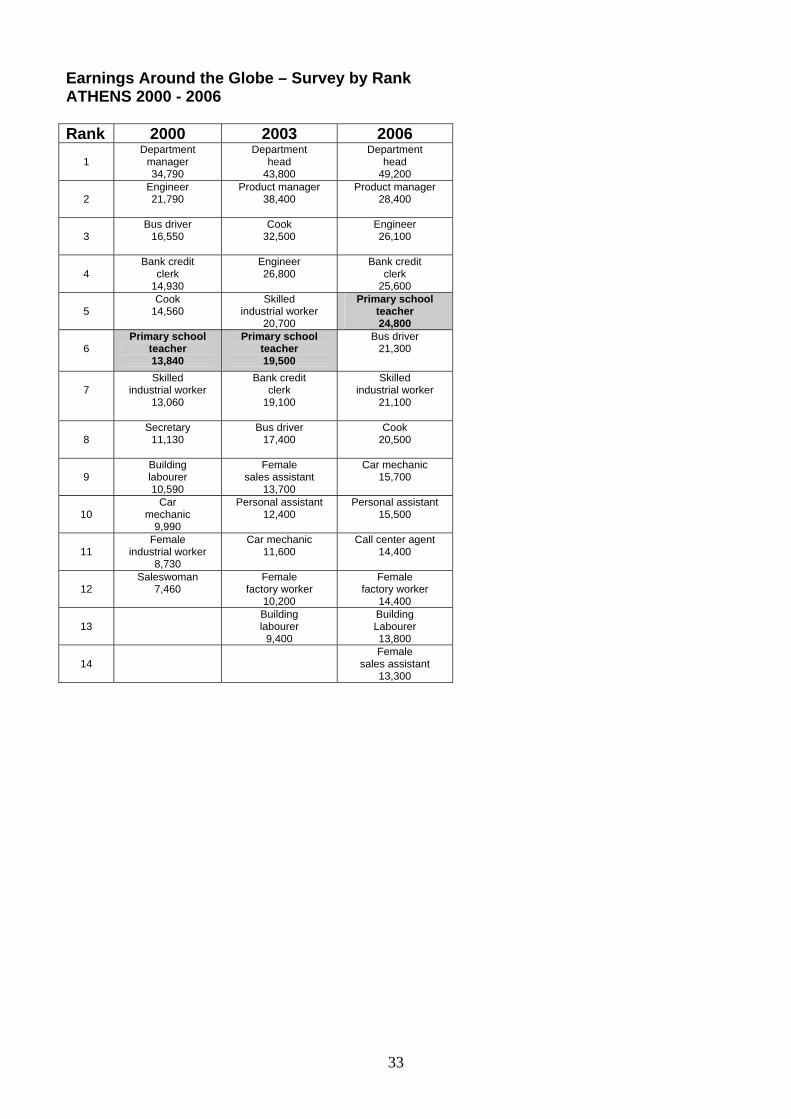
Earnings Around the Globe – Survey by Rank ATHENS 2000 - 2006 Rank 2000 2003 2006
1
Department manager 34,790
Department head
43,800
Department head
49,200
2 Engineer 21,790
Product manager 38,400
Product manager 28,400
3 Bus driver
16,550
Cook 32,500
Engineer 26,100
4
Bank credit clerk
14,930
Engineer 26,800
Bank credit clerk
25,600
5
Cook 14,560
Skilled industrial worker
20,700
Primary school teacher 24,800
6
Primary school teacher 13,840
Primary school teacher 19,500
Bus driver 21,300
7
Skilled industrial worker
13,060
Bank credit clerk
19,100
Skilled industrial worker
21,100
8
Secretary 11,130
Bus driver 17,400
Cook 20,500
9
Building labourer 10,590
Female sales assistant
13,700
Car mechanic 15,700
10
Car mechanic
9,990
Personal assistant 12,400
Personal assistant 15,500
11 Female
industrial worker 8,730
Car mechanic 11,600
Call center agent 14,400
12
Saleswoman 7,460
Female factory worker
10,200
Female factory worker
14,400
13
Building labourer
9,400
Building Labourer 13,800
14
Female sales assistant
13,300
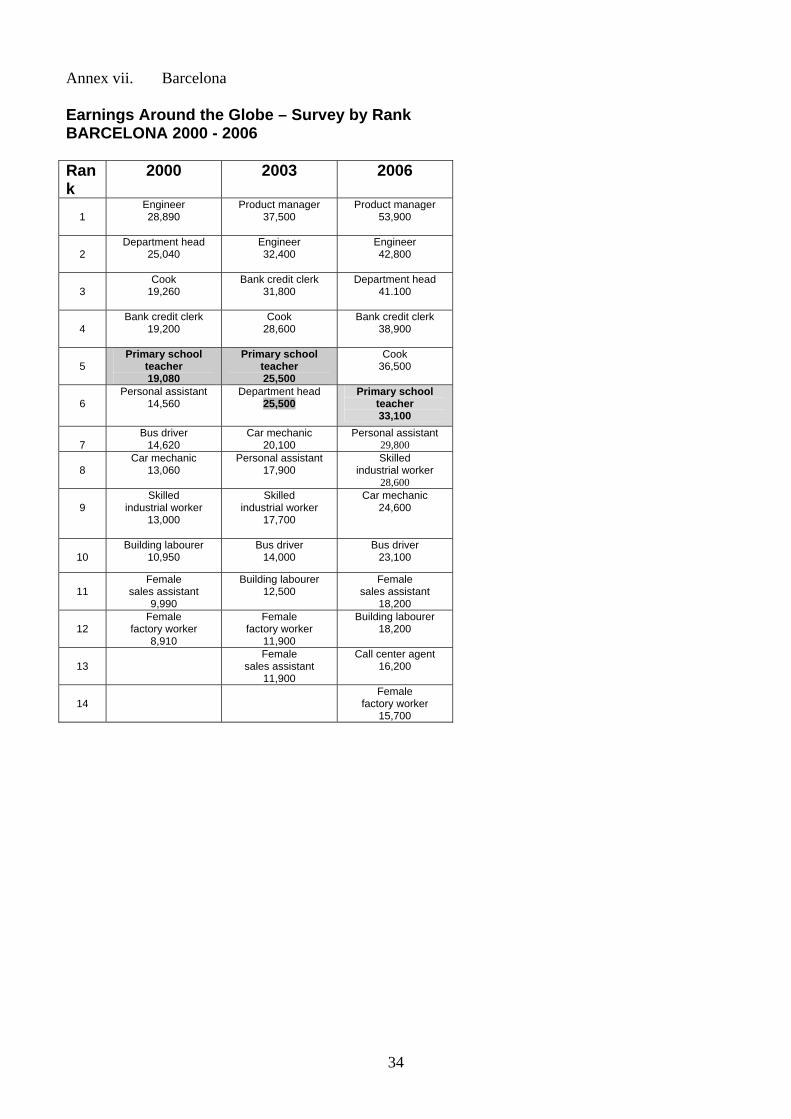
34
Annex vii. Barcelona
Earnings Around the Globe – Survey by Rank BARCELONA 2000 - 2006 Rank
2000 2003 2006
1
Engineer 28,890
Product manager 37,500
Product manager 53,900
2
Department head 25,040
Engineer 32,400
Engineer 42,800
3 Cook
19,260
Bank credit clerk 31,800
Department head 41.100
4
Bank credit clerk 19,200
Cook 28,600
Bank credit clerk 38,900
5
Primary school teacher 19,080
Primary school teacher 25,500
Cook 36,500
6 Personal assistant
14,560
Department head 25,500
Primary school teacher 33,100
7
Bus driver 14,620
Car mechanic 20,100
Personal assistant 29,800
8
Car mechanic 13,060
Personal assistant 17,900
Skilled industrial worker
28,600
9 Skilled
industrial worker 13,000
Skilled industrial worker
17,700
Car mechanic 24,600
10
Building labourer 10,950
Bus driver 14,000
Bus driver 23,100
11
Female sales assistant
9,990
Building labourer 12,500
Female sales assistant
18,200
12
Female factory worker
8,910
Female factory worker
11,900
Building labourer 18,200
13
Female sales assistant
11,900
Call center agent 16,200
14
Female factory worker
15,700
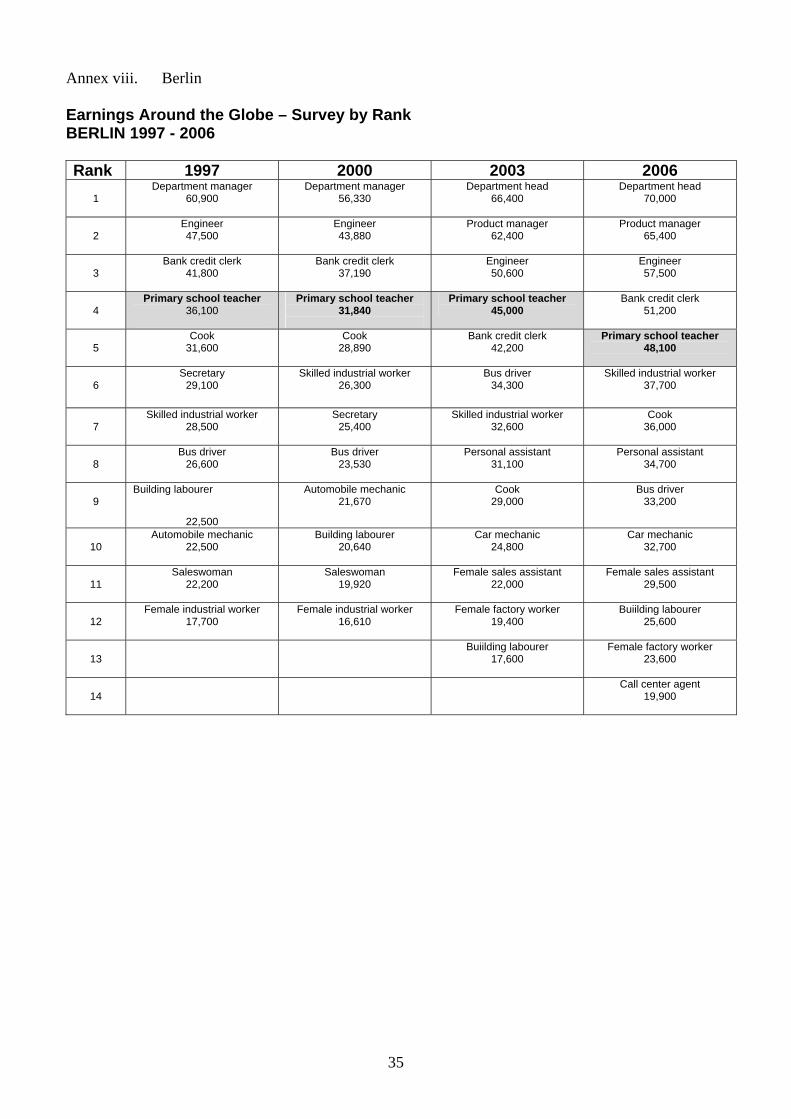
35
Annex viii. Berlin Earnings Around the Globe – Survey by Rank BERLIN 1997 - 2006 Rank 1997 2000 2003 2006
1
Department manager 60,900
Department manager 56,330
Department head 66,400
Department head 70,000
2 Engineer 47,500
Engineer 43,880
Product manager 62,400
Product manager 65,400
3
Bank credit clerk 41,800
Bank credit clerk 37,190
Engineer 50,600
Engineer 57,500
4
Primary school teacher 36,100
Primary school teacher 31,840
Primary school teacher 45,000
Bank credit clerk 51,200
5
Cook 31,600
Cook 28,890
Bank credit clerk 42,200
Primary school teacher 48,100
6
Secretary 29,100
Skilled industrial worker 26,300
Bus driver 34,300
Skilled industrial worker 37,700
7
Skilled industrial worker 28,500
Secretary 25,400
Skilled industrial worker 32,600
Cook 36,000
8
Bus driver 26,600
Bus driver 23,530
Personal assistant 31,100
Personal assistant 34,700
9 Building labourer
22,500
Automobile mechanic 21,670
Cook 29,000
Bus driver 33,200
10
Automobile mechanic 22,500
Building labourer 20,640
Car mechanic 24,800
Car mechanic 32,700
11
Saleswoman 22,200
Saleswoman 19,920
Female sales assistant 22,000
Female sales assistant 29,500
12
Female industrial worker 17,700
Female industrial worker 16,610
Female factory worker 19,400
Buiilding labourer 25,600
13
Buiilding labourer 17,600
Female factory worker 23,600
14
Call center agent 19,900
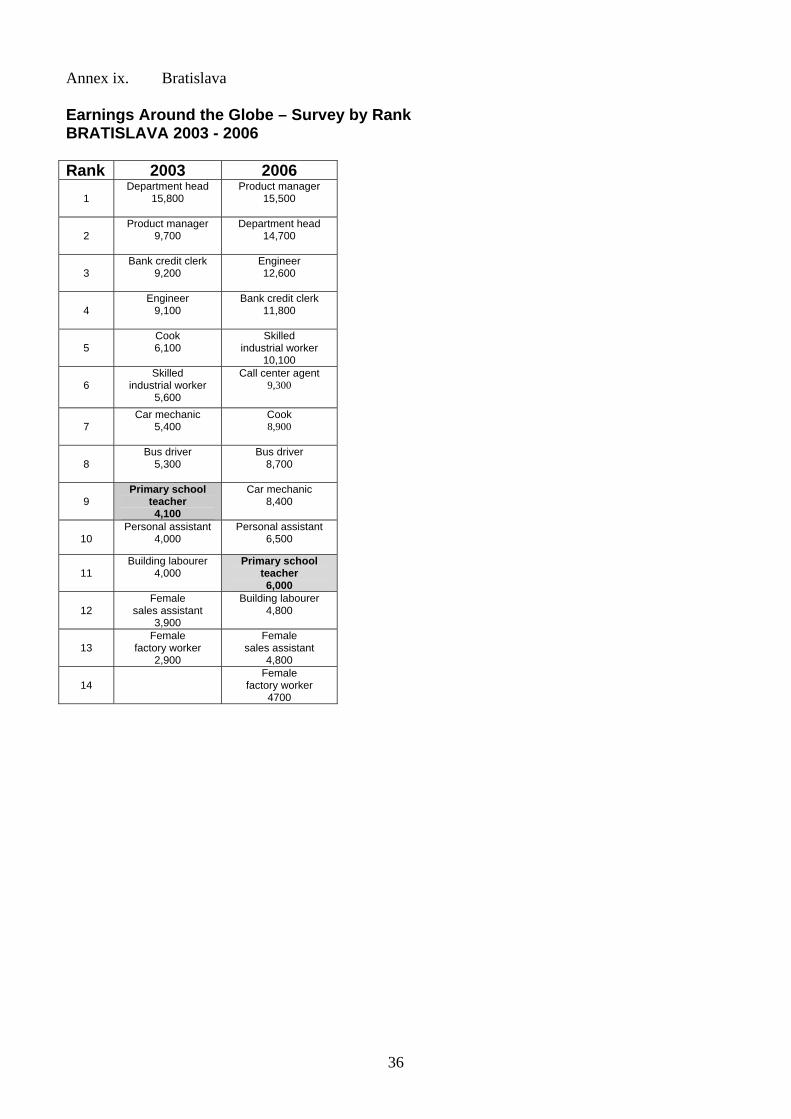
36
Annex ix. Bratislava Earnings Around the Globe – Survey by Rank BRATISLAVA 2003 - 2006 Rank 2003 2006
1
Department head 15,800
Product manager 15,500
2 Product manager
9,700
Department head 14,700
3 Bank credit clerk
9,200
Engineer 12,600
4 Engineer
9,100
Bank credit clerk 11,800
5
Cook 6,100
Skilled industrial worker
10,100
6 Skilled
industrial worker 5,600
Call center agent 9,300
7
Car mechanic 5,400
Cook 8,900
8
Bus driver 5,300
Bus driver 8,700
9 Primary school
teacher 4,100
Car mechanic 8,400
10 Personal assistant
4,000 Personal assistant
6,500
11
Building labourer 4,000
Primary school teacher 6,000
12
Female sales assistant
3,900
Building labourer 4,800
13
Female factory worker
2,900
Female sales assistant
4,800
14
Female factory worker
4700
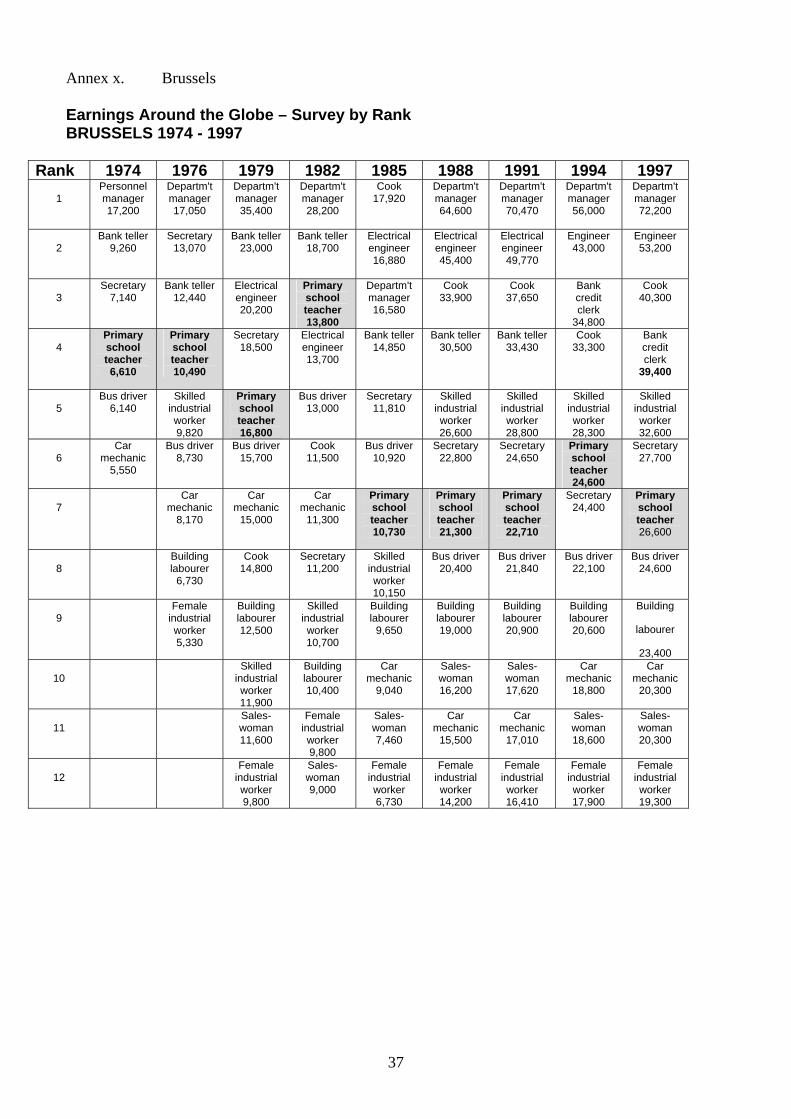
37
Annex x. Brussels Earnings Around the Globe – Survey by Rank BRUSSELS 1974 - 1997
Rank 1974 1976 1979 1982 1985 1988 1991 1994 1997
1
Personnel manager 17,200
Departm't manager 17,050
Departm't manager 35,400
Departm't manager 28,200
Cook 17,920
Departm't manager 64,600
Departm't manager 70,470
Departm't manager 56,000
Departm't manager 72,200
2
Bank teller 9,260
Secretary 13,070
Bank teller 23,000
Bank teller 18,700
Electrical engineer 16,880
Electrical engineer 45,400
Electrical engineer 49,770
Engineer 43,000
Engineer 53,200
3
Secretary 7,140
Bank teller 12,440
Electrical engineer 20,200
Primary school teacher 13,800
Departm't manager 16,580
Cook 33,900
Cook 37,650
Bank credit clerk
34,800
Cook 40,300
4
Primary school teacher 6,610
Primary school teacher 10,490
Secretary 18,500
Electrical engineer 13,700
Bank teller 14,850
Bank teller 30,500
Bank teller 33,430
Cook 33,300
Bank credit clerk
39,400
5
Bus driver 6,140
Skilled industrial worker 9,820
Primary school teacher 16,800
Bus driver 13,000
Secretary 11,810
Skilled industrial worker 26,600
Skilled industrial worker 28,800
Skilled industrial worker 28,300
Skilled industrial worker 32,600
6
Car mechanic
5,550
Bus driver 8,730
Bus driver 15,700
Cook 11,500
Bus driver 10,920
Secretary 22,800
Secretary 24,650
Primary school teacher 24,600
Secretary 27,700
7
Car mechanic
8,170
Car mechanic
15,000
Car mechanic
11,300
Primary school teacher 10,730
Primary school teacher 21,300
Primary school teacher 22,710
Secretary 24,400
Primary school teacher 26,600
8
Building labourer
6,730
Cook 14,800
Secretary 11,200
Skilled industrial worker 10,150
Bus driver 20,400
Bus driver 21,840
Bus driver 22,100
Bus driver 24,600
9
Female industrial worker 5,330
Building labourer 12,500
Skilled industrial worker 10,700
Building labourer
9,650
Building labourer 19,000
Building labourer 20,900
Building labourer 20,600
Building
labourer
23,400
10 Skilled
industrial worker 11,900
Building labourer 10,400
Car mechanic
9,040
Sales-woman 16,200
Sales-woman 17,620
Car mechanic
18,800
Car mechanic
20,300
11
Sales-woman 11,600
Female industrial worker 9,800
Sales-woman 7,460
Car mechanic
15,500
Car mechanic
17,010
Sales-woman 18,600
Sales-woman 20,300
12
Female industrial worker 9,800
Sales-woman 9,000
Female industrial worker 6,730
Female industrial worker 14,200
Female industrial worker 16,410
Female industrial worker 17,900
Female industrial worker 19,300
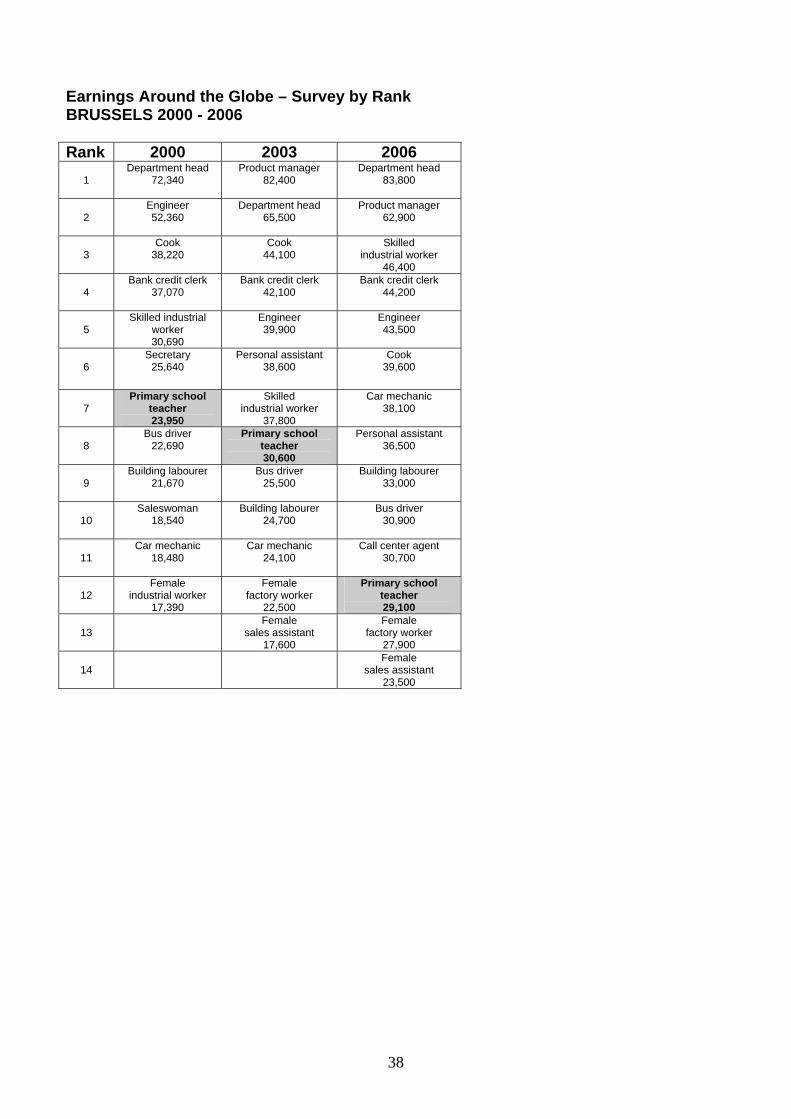
38
Earnings Around the Globe – Survey by Rank BRUSSELS 2000 - 2006 Rank 2000 2003 2006
1
Department head 72,340
Product manager 82,400
Department head 83,800
2
Engineer 52,360
Department head 65,500
Product manager 62,900
3 Cook
38,220
Cook 44,100
Skilled industrial worker
46,400
4 Bank credit clerk
37,070 Bank credit clerk
42,100
Bank credit clerk 44,200
5
Skilled industrial worker 30,690
Engineer 39,900
Engineer 43,500
6 Secretary
25,640 Personal assistant
38,600 Cook
39,600
7
Primary school teacher 23,950
Skilled industrial worker
37,800
Car mechanic 38,100
8
Bus driver 22,690
Primary school teacher 30,600
Personal assistant 36,500
9
Building labourer 21,670
Bus driver 25,500
Building labourer 33,000
10 Saleswoman
18,540 Building labourer
24,700
Bus driver 30,900
11
Car mechanic 18,480
Car mechanic 24,100
Call center agent 30,700
12
Female industrial worker
17,390
Female factory worker
22,500
Primary school teacher 29,100
13
Female sales assistant
17,600
Female factory worker
27,900
14
Female sales assistant
23,500
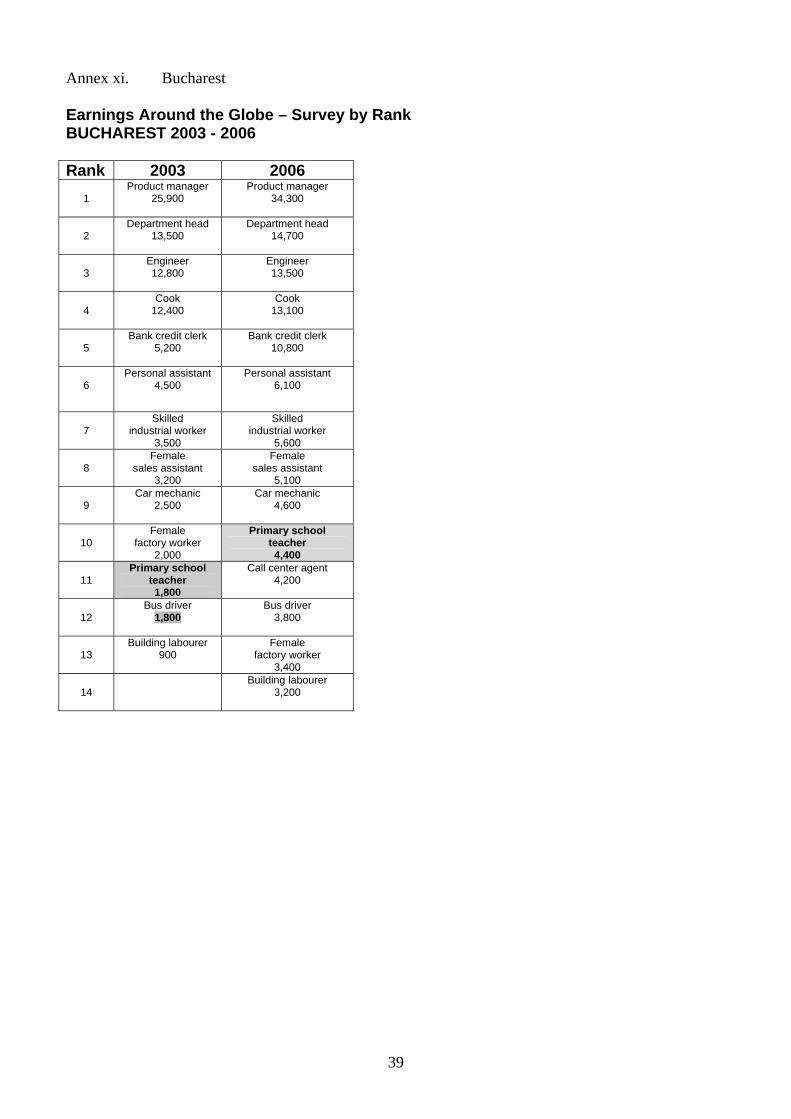
39
Annex xi. Bucharest Earnings Around the Globe – Survey by Rank BUCHAREST 2003 - 2006 Rank 2003 2006
1
Product manager 25,900
Product manager 34,300
2 Department head
13,500
Department head 14,700
3 Engineer 12,800
Engineer 13,500
4 Cook
12,400
Cook 13,100
5
Bank credit clerk 5,200
Bank credit clerk 10,800
6
Personal assistant 4,500
Personal assistant 6,100
7
Skilled industrial worker
3,500
Skilled industrial worker
5,600
8 Female
sales assistant 3,200
Female sales assistant
5,100
9 Car mechanic
2,500
Car mechanic 4,600
10 Female
factory worker 2,000
Primary school teacher 4,400
11
Primary school teacher 1,800
Call center agent 4,200
12
Bus driver 1,800
Bus driver 3,800
13
Building labourer 900
Female factory worker
3,400
14
Building labourer 3,200
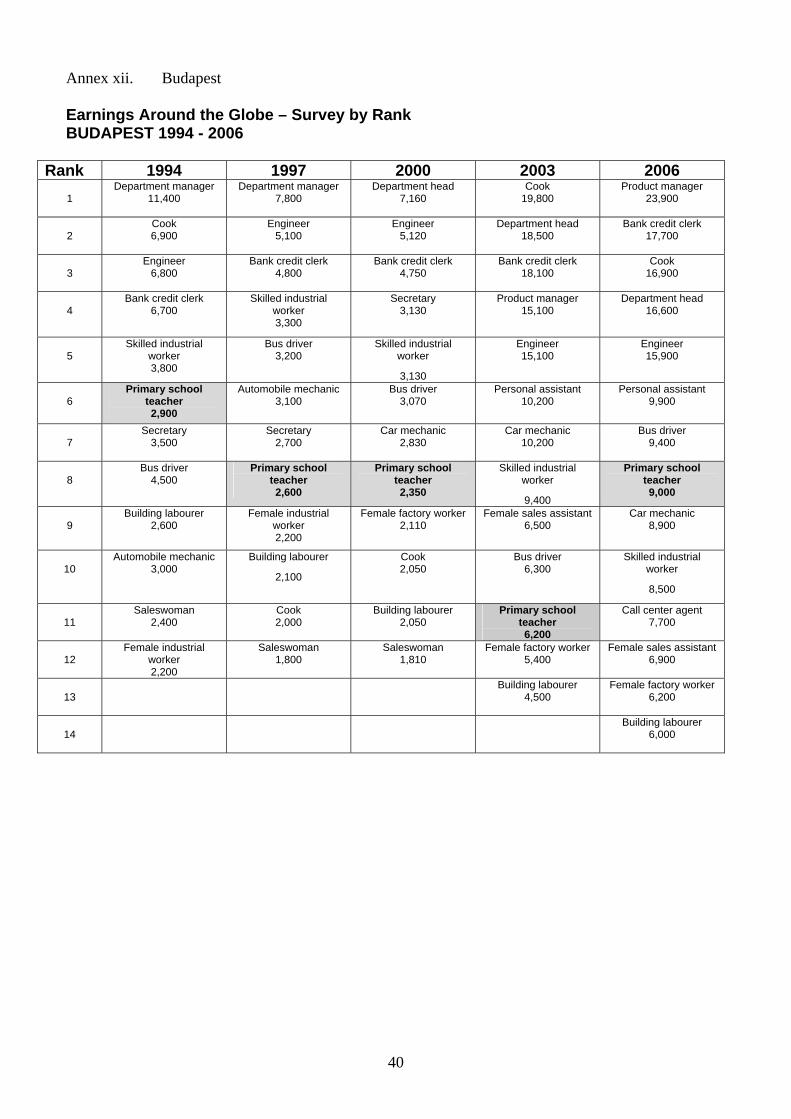
40
Annex xii. Budapest
Earnings Around the Globe – Survey by Rank BUDAPEST 1994 - 2006
Rank 1994 1997 2000 2003 2006
1
Department manager 11,400
Department manager 7,800
Department head 7,160
Cook 19,800
Product manager 23,900
2
Cook 6,900
Engineer 5,100
Engineer 5,120
Department head 18,500
Bank credit clerk 17,700
3 Engineer
6,800 Bank credit clerk
4,800
Bank credit clerk 4,750
Bank credit clerk 18,100
Cook 16,900
4
Bank credit clerk 6,700
Skilled industrial worker 3,300
Secretary 3,130
Product manager 15,100
Department head 16,600
5
Skilled industrial worker 3,800
Bus driver 3,200
Skilled industrial worker
3,130
Engineer 15,100
Engineer 15,900
6
Primary school teacher 2,900
Automobile mechanic 3,100
Bus driver 3,070
Personal assistant 10,200
Personal assistant 9,900
7
Secretary 3,500
Secretary 2,700
Car mechanic 2,830
Car mechanic 10,200
Bus driver 9,400
8
Bus driver 4,500
Primary school teacher 2,600
Primary school teacher 2,350
Skilled industrial worker
9,400
Primary school teacher 9,000
9
Building labourer 2,600
Female industrial worker 2,200
Female factory worker 2,110
Female sales assistant 6,500
Car mechanic 8,900
10
Automobile mechanic 3,000
Building labourer
2,100
Cook 2,050
Bus driver 6,300
Skilled industrial worker
8,500
11
Saleswoman 2,400
Cook 2,000
Building labourer 2,050
Primary school teacher 6,200
Call center agent 7,700
12
Female industrial worker 2,200
Saleswoman 1,800
Saleswoman 1,810
Female factory worker 5,400
Female sales assistant 6,900
13
Building labourer 4,500
Female factory worker 6,200
14
Building labourer 6,000
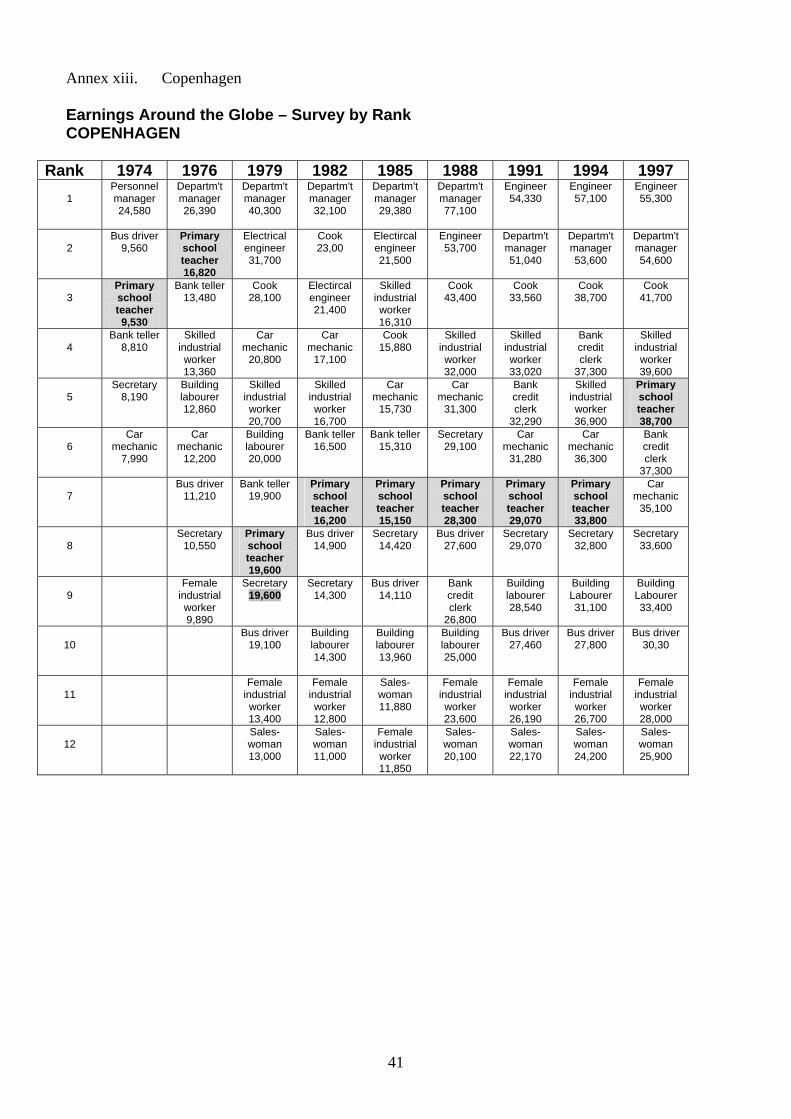
41
Annex xiii. Copenhagen Earnings Around the Globe – Survey by Rank COPENHAGEN
Rank 1974 1976 1979 1982 1985 1988 1991 1994 1997
1 Personnel manager 24,580
Departm't manager 26,390
Departm't manager 40,300
Departm't manager 32,100
Departm't manager 29,380
Departm't manager 77,100
Engineer 54,330
Engineer 57,100
Engineer 55,300
2
Bus driver 9,560
Primary school teacher 16,820
Electrical engineer 31,700
Cook 23,00
Electircal engineer 21,500
Engineer 53,700
Departm't manager 51,040
Departm't manager 53,600
Departm't manager 54,600
3
Primary school teacher 9,530
Bank teller 13,480
Cook 28,100
Electircal engineer 21,400
Skilled industrial worker 16,310
Cook 43,400
Cook 33,560
Cook 38,700
Cook 41,700
4
Bank teller 8,810
Skilled industrial worker 13,360
Car mechanic
20,800
Car mechanic
17,100
Cook 15,880
Skilled industrial worker 32,000
Skilled industrial worker 33,020
Bank credit clerk
37,300
Skilled industrial worker 39,600
5
Secretary 8,190
Building labourer 12,860
Skilled industrial worker 20,700
Skilled industrial worker 16,700
Car mechanic
15,730
Car mechanic
31,300
Bank credit clerk
32,290
Skilled industrial worker 36,900
Primary school teacher 38,700
6
Car mechanic
7,990
Car mechanic
12,200
Building labourer 20,000
Bank teller 16,500
Bank teller 15,310
Secretary 29,100
Car mechanic
31,280
Car mechanic
36,300
Bank credit clerk
37,300
7
Bus driver 11,210
Bank teller 19,900
Primary school teacher 16,200
Primary school teacher 15,150
Primary school teacher 28,300
Primary school teacher 29,070
Primary school teacher 33,800
Car mechanic
35,100
8
Secretary 10,550
Primary school teacher 19,600
Bus driver 14,900
Secretary 14,420
Bus driver 27,600
Secretary 29,070
Secretary 32,800
Secretary 33,600
9
Female industrial worker 9,890
Secretary 19,600
Secretary 14,300
Bus driver 14,110
Bank credit clerk
26,800
Building labourer 28,540
Building Labourer 31,100
Building Labourer 33,400
10
Bus driver 19,100
Building labourer 14,300
Building labourer 13,960
Building labourer 25,000
Bus driver 27,460
Bus driver 27,800
Bus driver 30,30
11
Female industrial worker 13,400
Female industrial worker 12,800
Sales-woman 11,880
Female industrial worker 23,600
Female industrial worker 26,190
Female industrial worker 26,700
Female industrial worker 28,000
12
Sales-woman 13,000
Sales-woman 11,000
Female industrial worker 11,850
Sales-woman 20,100
Sales-woman 22,170
Sales-woman 24,200
Sales-woman 25,900
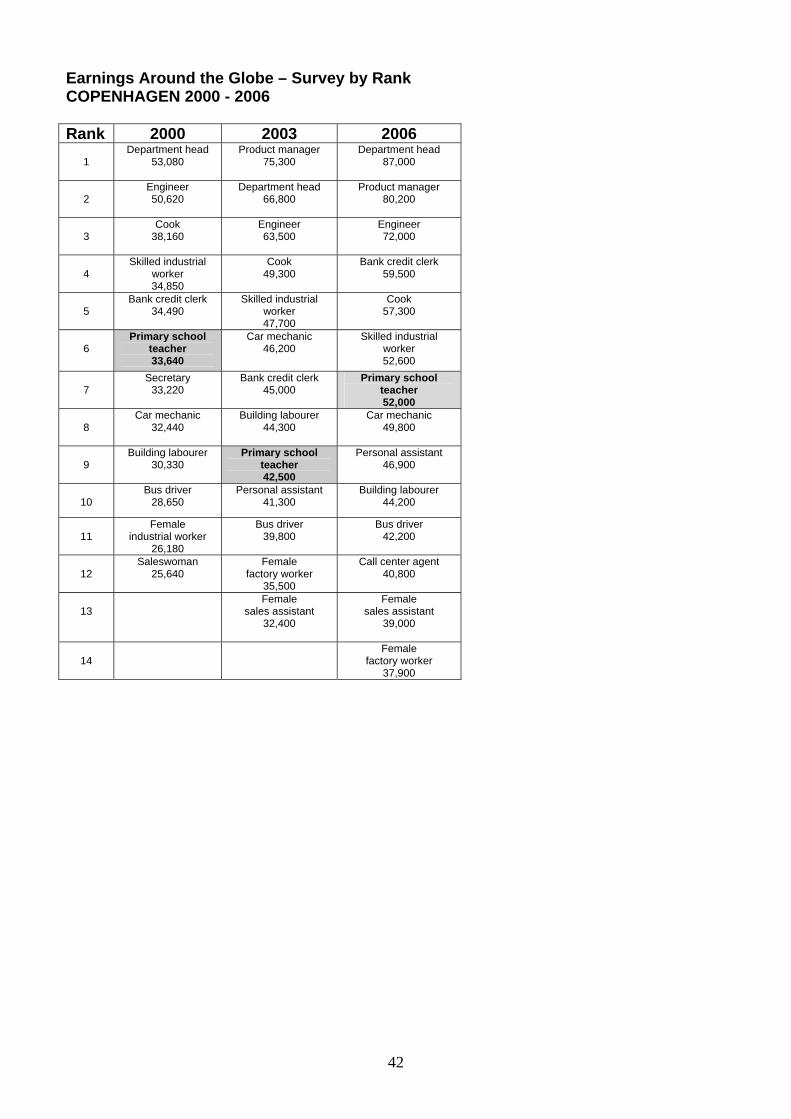
42
Earnings Around the Globe – Survey by Rank COPENHAGEN 2000 - 2006 Rank 2000 2003 2006
1
Department head 53,080
Product manager 75,300
Department head 87,000
2
Engineer 50,620
Department head 66,800
Product manager 80,200
3
Cook 38,160
Engineer 63,500
Engineer 72,000
4
Skilled industrial worker 34,850
Cook 49,300
Bank credit clerk 59,500
5
Bank credit clerk 34,490
Skilled industrial worker 47,700
Cook 57,300
6
Primary school teacher 33,640
Car mechanic 46,200
Skilled industrial worker 52,600
7
Secretary 33,220
Bank credit clerk 45,000
Primary school teacher 52,000
8
Car mechanic 32,440
Building labourer 44,300
Car mechanic 49,800
9 Building labourer
30,330 Primary school
teacher 42,500
Personal assistant 46,900
10
Bus driver 28,650
Personal assistant 41,300
Building labourer 44,200
11
Female industrial worker
26,180
Bus driver 39,800
Bus driver 42,200
12
Saleswoman 25,640
Female factory worker
35,500
Call center agent 40,800
13
Female sales assistant
32,400
Female sales assistant
39,000
14
Female factory worker
37,900
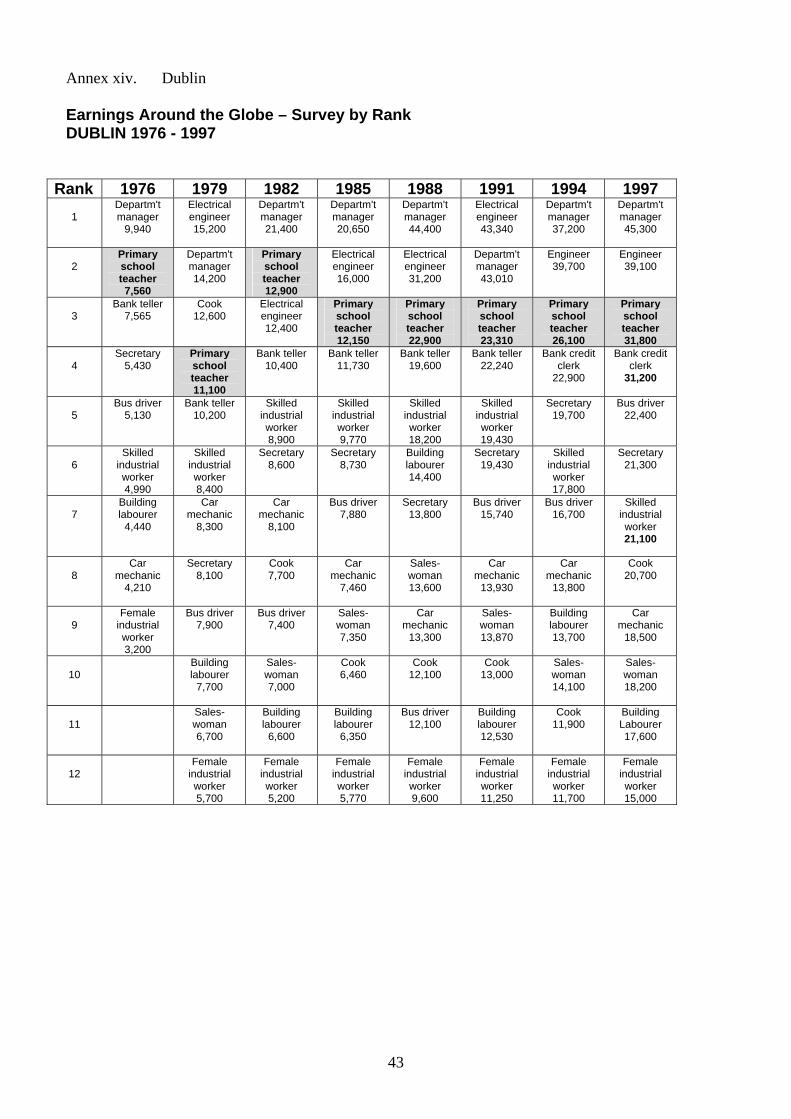
43
Annex xiv. Dublin Earnings Around the Globe – Survey by Rank DUBLIN 1976 - 1997
Rank 1976 1979 1982 1985 1988 1991 1994 1997
1
Departm't manager
9,940
Electrical engineer 15,200
Departm't manager 21,400
Departm't manager 20,650
Departm't manager 44,400
Electrical engineer 43,340
Departm't manager 37,200
Departm't manager 45,300
2
Primary school teacher 7,560
Departm't manager 14,200
Primary school teacher 12,900
Electrical engineer 16,000
Electrical engineer 31,200
Departm't manager 43,010
Engineer 39,700
Engineer 39,100
3
Bank teller 7,565
Cook 12,600
Electrical engineer 12,400
Primary school teacher 12,150
Primary school teacher 22,900
Primary school teacher 23,310
Primary school teacher 26,100
Primary school teacher 31,800
4
Secretary 5,430
Primary school teacher 11,100
Bank teller 10,400
Bank teller 11,730
Bank teller 19,600
Bank teller 22,240
Bank credit clerk
22,900
Bank credit clerk
31,200
5
Bus driver 5,130
Bank teller 10,200
Skilled industrial worker 8,900
Skilled industrial worker 9,770
Skilled industrial worker 18,200
Skilled industrial worker 19,430
Secretary 19,700
Bus driver 22,400
6
Skilled industrial worker 4,990
Skilled industrial worker 8,400
Secretary 8,600
Secretary 8,730
Building labourer 14,400
Secretary 19,430
Skilled industrial worker 17,800
Secretary 21,300
7
Building labourer
4,440
Car mechanic
8,300
Car mechanic
8,100
Bus driver 7,880
Secretary 13,800
Bus driver 15,740
Bus driver 16,700
Skilled industrial worker 21,100
8
Car mechanic
4,210
Secretary 8,100
Cook 7,700
Car mechanic
7,460
Sales-woman 13,600
Car mechanic
13,930
Car mechanic
13,800
Cook 20,700
9
Female industrial worker 3,200
Bus driver 7,900
Bus driver 7,400
Sales-woman 7,350
Car mechanic
13,300
Sales-woman 13,870
Building labourer 13,700
Car mechanic
18,500
10
Building labourer
7,700
Sales-woman 7,000
Cook 6,460
Cook 12,100
Cook 13,000
Sales-woman 14,100
Sales-woman 18,200
11
Sales-woman 6,700
Building labourer
6,600
Building labourer
6,350
Bus driver 12,100
Building labourer 12,530
Cook 11,900
Building Labourer 17,600
12
Female industrial worker 5,700
Female industrial worker 5,200
Female industrial worker 5,770
Female industrial worker 9,600
Female industrial worker 11,250
Female industrial worker 11,700
Female industrial worker 15,000
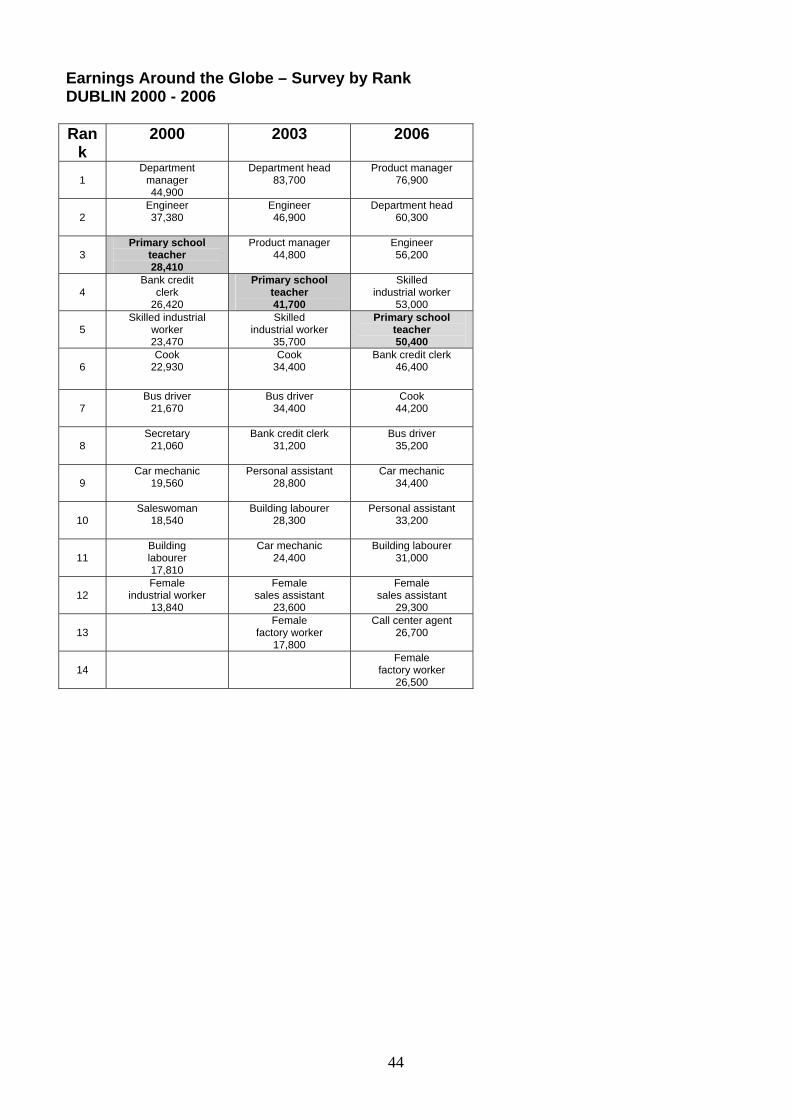
44
Earnings Around the Globe – Survey by Rank DUBLIN 2000 - 2006 Ran
k 2000 2003 2006
1
Department manager 44,900
Department head 83,700
Product manager 76,900
2
Engineer 37,380
Engineer 46,900
Department head 60,300
3
Primary school teacher 28,410
Product manager 44,800
Engineer 56,200
4
Bank credit clerk
26,420
Primary school teacher 41,700
Skilled industrial worker
53,000
5
Skilled industrial worker 23,470
Skilled industrial worker
35,700
Primary school teacher 50,400
6
Cook 22,930
Cook 34,400
Bank credit clerk 46,400
7 Bus driver
21,670 Bus driver
34,400
Cook 44,200
8
Secretary 21,060
Bank credit clerk 31,200
Bus driver 35,200
9 Car mechanic
19,560 Personal assistant
28,800
Car mechanic 34,400
10
Saleswoman 18,540
Building labourer 28,300
Personal assistant 33,200
11 Building labourer 17,810
Car mechanic 24,400
Building labourer 31,000
12
Female industrial worker
13,840
Female sales assistant
23,600
Female sales assistant
29,300
13
Female factory worker
17,800
Call center agent 26,700
14
Female factory worker
26,500
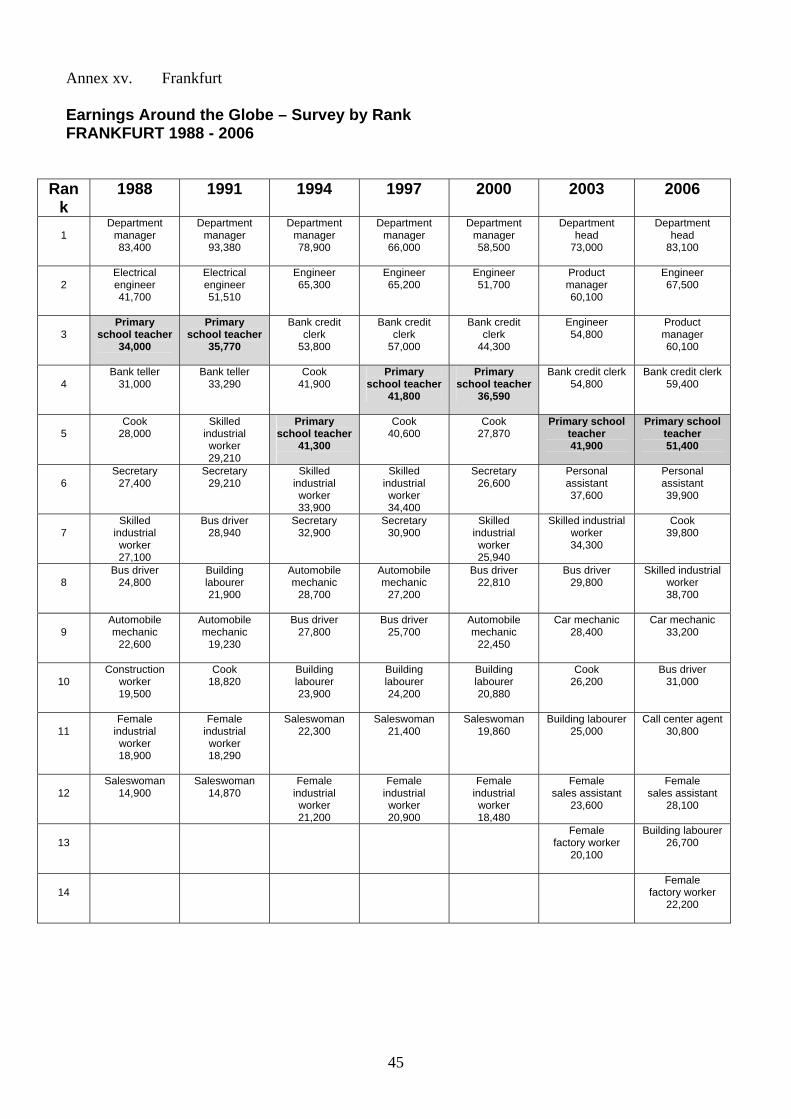
45
Annex xv. Frankfurt Earnings Around the Globe – Survey by Rank FRANKFURT 1988 - 2006
Rank
1988 1991 1994 1997 2000 2003 2006
1
Department manager 83,400
Department manager 93,380
Department manager 78,900
Department manager 66,000
Department manager 58,500
Department head
73,000
Department head
83,100
2
Electrical engineer 41,700
Electrical engineer 51,510
Engineer 65,300
Engineer 65,200
Engineer 51,700
Product manager 60,100
Engineer 67,500
3
Primary school teacher
34,000
Primary school teacher
35,770
Bank credit clerk
53,800
Bank credit clerk
57,000
Bank credit clerk
44,300
Engineer 54,800
Product manager 60,100
4
Bank teller 31,000
Bank teller 33,290
Cook 41,900
Primary school teacher
41,800
Primary school teacher
36,590
Bank credit clerk 54,800
Bank credit clerk 59,400
5
Cook 28,000
Skilled industrial worker 29,210
Primary school teacher
41,300
Cook 40,600
Cook 27,870
Primary school teacher 41,900
Primary school teacher 51,400
6
Secretary 27,400
Secretary 29,210
Skilled industrial worker 33,900
Skilled industrial worker 34,400
Secretary 26,600
Personal assistant 37,600
Personal assistant 39,900
7
Skilled industrial worker 27,100
Bus driver 28,940
Secretary 32,900
Secretary 30,900
Skilled industrial worker 25,940
Skilled industrial worker 34,300
Cook 39,800
8
Bus driver 24,800
Building labourer 21,900
Automobile mechanic
28,700
Automobile mechanic
27,200
Bus driver 22,810
Bus driver 29,800
Skilled industrial worker 38,700
9
Automobile mechanic
22,600
Automobile mechanic
19,230
Bus driver 27,800
Bus driver 25,700
Automobile mechanic
22,450
Car mechanic 28,400
Car mechanic 33,200
10
Construction worker 19,500
Cook 18,820
Building labourer 23,900
Building labourer 24,200
Building labourer 20,880
Cook 26,200
Bus driver 31,000
11
Female industrial worker 18,900
Female industrial worker 18,290
Saleswoman 22,300
Saleswoman 21,400
Saleswoman 19,860
Building labourer 25,000
Call center agent 30,800
12
Saleswoman 14,900
Saleswoman 14,870
Female industrial worker 21,200
Female industrial worker 20,900
Female industrial worker 18,480
Female sales assistant
23,600
Female sales assistant
28,100
13
Female factory worker
20,100
Building labourer 26,700
14
Female factory worker
22,200
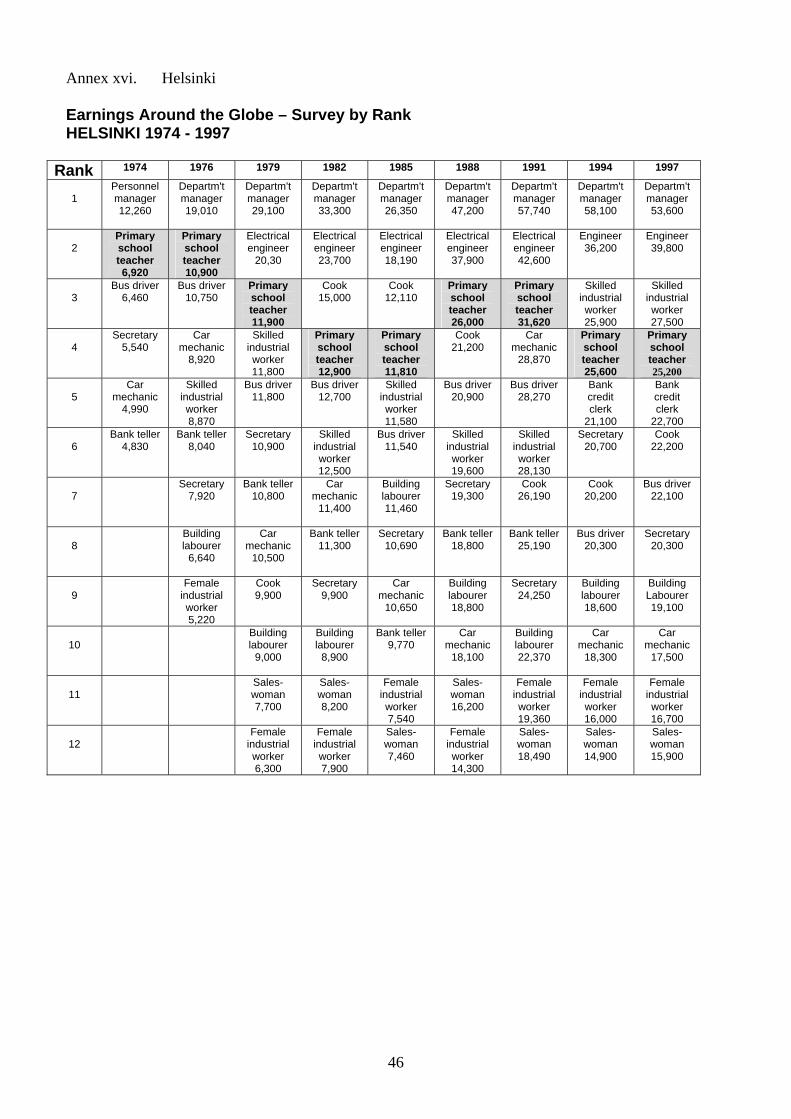
46
Annex xvi. Helsinki Earnings Around the Globe – Survey by Rank HELSINKI 1974 - 1997
Rank 1974 1976 1979 1982 1985 1988 1991 1994 1997
1
Personnel manager 12,260
Departm't manager 19,010
Departm't manager 29,100
Departm't manager 33,300
Departm't manager 26,350
Departm't manager 47,200
Departm't manager 57,740
Departm't manager 58,100
Departm't manager 53,600
2
Primary school teacher 6,920
Primary school teacher 10,900
Electrical engineer
20,30
Electrical engineer 23,700
Electrical engineer 18,190
Electrical engineer 37,900
Electrical engineer 42,600
Engineer 36,200
Engineer 39,800
3
Bus driver 6,460
Bus driver 10,750
Primary school teacher 11,900
Cook 15,000
Cook 12,110
Primary school teacher 26,000
Primary school teacher 31,620
Skilled industrial worker 25,900
Skilled industrial worker 27,500
4
Secretary 5,540
Car mechanic
8,920
Skilled industrial worker 11,800
Primary school teacher 12,900
Primary school teacher 11,810
Cook 21,200
Car mechanic
28,870
Primary school teacher 25,600
Primary school teacher 25,200
5
Car mechanic
4,990
Skilled industrial worker 8,870
Bus driver 11,800
Bus driver 12,700
Skilled industrial worker 11,580
Bus driver 20,900
Bus driver 28,270
Bank credit clerk
21,100
Bank credit clerk
22,700
6 Bank teller
4,830 Bank teller
8,040 Secretary
10,900 Skilled
industrial worker 12,500
Bus driver 11,540
Skilled industrial worker 19,600
Skilled industrial worker 28,130
Secretary 20,700
Cook 22,200
7
Secretary 7,920
Bank teller 10,800
Car mechanic
11,400
Building labourer 11,460
Secretary 19,300
Cook 26,190
Cook 20,200
Bus driver 22,100
8
Building labourer
6,640
Car mechanic
10,500
Bank teller 11,300
Secretary 10,690
Bank teller 18,800
Bank teller 25,190
Bus driver 20,300
Secretary 20,300
9
Female industrial worker 5,220
Cook 9,900
Secretary 9,900
Car mechanic
10,650
Building labourer 18,800
Secretary 24,250
Building labourer 18,600
Building Labourer 19,100
10
Building labourer
9,000
Building labourer
8,900
Bank teller 9,770
Car mechanic
18,100
Building labourer 22,370
Car mechanic
18,300
Car mechanic
17,500
11
Sales-woman 7,700
Sales-woman 8,200
Female industrial worker 7,540
Sales-woman 16,200
Female industrial worker 19,360
Female industrial worker 16,000
Female industrial worker 16,700
12
Female industrial worker 6,300
Female industrial worker 7,900
Sales-woman 7,460
Female industrial worker 14,300
Sales-woman 18,490
Sales-woman 14,900
Sales-woman 15,900
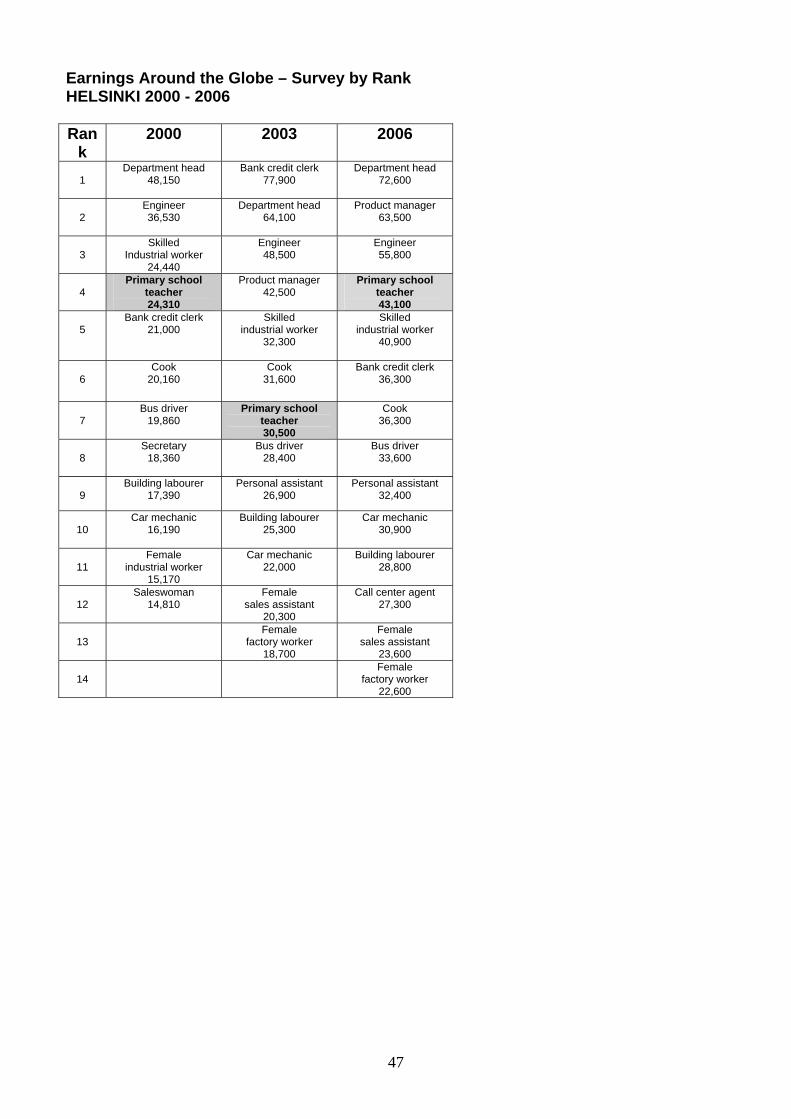
47
Earnings Around the Globe – Survey by Rank HELSINKI 2000 - 2006 Ran
k 2000 2003 2006
1
Department head 48,150
Bank credit clerk 77,900
Department head 72,600
2
Engineer 36,530
Department head 64,100
Product manager 63,500
3
Skilled Industrial worker
24,440
Engineer 48,500
Engineer 55,800
4
Primary school teacher 24,310
Product manager 42,500
Primary school teacher 43,100
5
Bank credit clerk 21,000
Skilled industrial worker
32,300
Skilled industrial worker
40,900
6
Cook 20,160
Cook 31,600
Bank credit clerk 36,300
7
Bus driver 19,860
Primary school teacher 30,500
Cook 36,300
8 Secretary
18,360 Bus driver
28,400
Bus driver 33,600
9 Building labourer
17,390 Personal assistant
26,900 Personal assistant
32,400
10
Car mechanic 16,190
Building labourer 25,300
Car mechanic 30,900
11
Female industrial worker
15,170
Car mechanic 22,000
Building labourer 28,800
12
Saleswoman 14,810
Female sales assistant
20,300
Call center agent 27,300
13
Female factory worker
18,700
Female sales assistant
23,600
14
Female factory worker
22,600
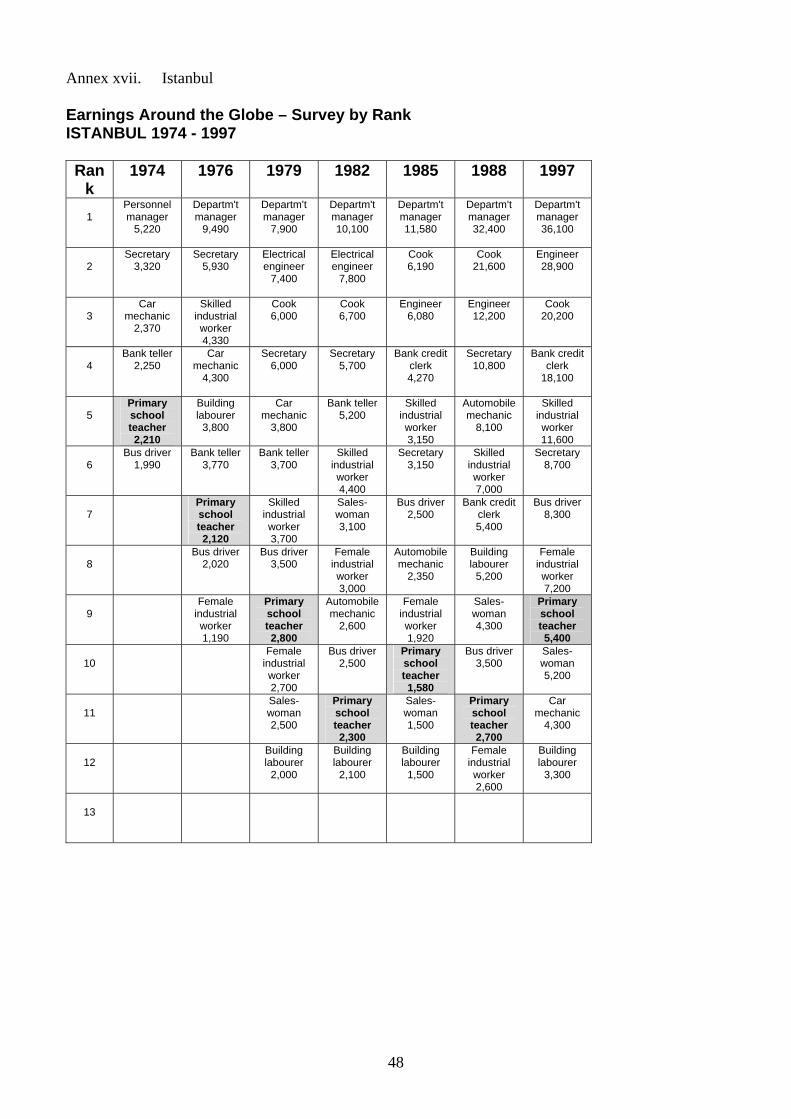
48
Annex xvii. Istanbul Earnings Around the Globe – Survey by Rank ISTANBUL 1974 - 1997 Ran
k 1974 1976 1979 1982 1985 1988 1997
1
Personnel manager
5,220
Departm't manager
9,490
Departm't manager
7,900
Departm't manager 10,100
Departm't manager 11,580
Departm't manager 32,400
Departm't manager 36,100
2
Secretary 3,320
Secretary 5,930
Electrical engineer
7,400
Electrical engineer
7,800
Cook 6,190
Cook 21,600
Engineer 28,900
3
Car mechanic
2,370
Skilled industrial worker 4,330
Cook 6,000
Cook 6,700
Engineer 6,080
Engineer 12,200
Cook 20,200
4
Bank teller 2,250
Car mechanic
4,300
Secretary 6,000
Secretary 5,700
Bank credit clerk 4,270
Secretary 10,800
Bank credit clerk
18,100
5
Primary school teacher 2,210
Building labourer
3,800
Car mechanic
3,800
Bank teller 5,200
Skilled industrial worker 3,150
Automobile mechanic
8,100
Skilled industrial worker 11,600
6
Bus driver 1,990
Bank teller 3,770
Bank teller 3,700
Skilled industrial worker 4,400
Secretary 3,150
Skilled industrial worker 7,000
Secretary 8,700
7
Primary school teacher 2,120
Skilled industrial worker 3,700
Sales-woman 3,100
Bus driver 2,500
Bank credit clerk 5,400
Bus driver 8,300
8
Bus driver 2,020
Bus driver 3,500
Female industrial worker 3,000
Automobile mechanic
2,350
Building labourer
5,200
Female industrial worker 7,200
9
Female industrial worker 1,190
Primary school teacher 2,800
Automobile mechanic
2,600
Female industrial worker 1,920
Sales-woman 4,300
Primary school teacher 5,400
10
Female industrial worker 2,700
Bus driver 2,500
Primary school teacher 1,580
Bus driver 3,500
Sales-woman 5,200
11
Sales-woman 2,500
Primary school teacher 2,300
Sales-woman 1,500
Primary school teacher 2,700
Car mechanic
4,300
12
Building labourer
2,000
Building labourer
2,100
Building labourer
1,500
Female industrial worker 2,600
Building labourer
3,300
13
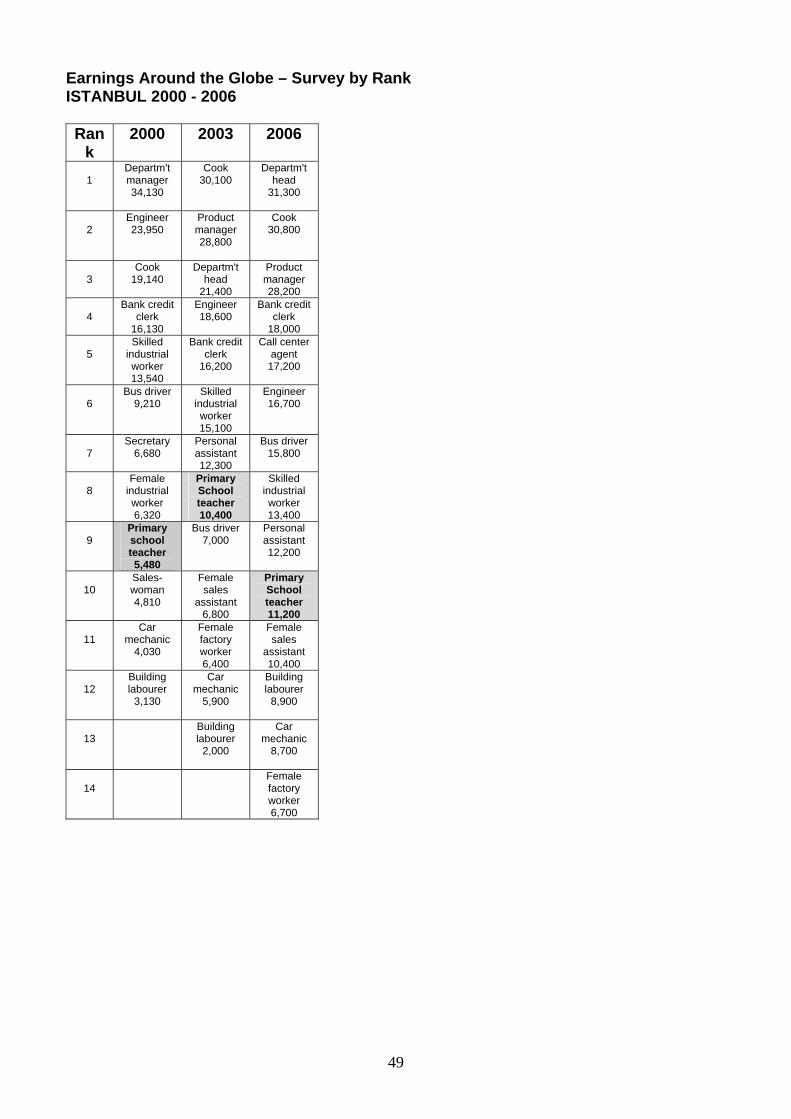
49
Earnings Around the Globe – Survey by Rank ISTANBUL 2000 - 2006 Ran
k 2000 2003 2006
1
Departm't manager 34,130
Cook 30,100
Departm't head
31,300
2
Engineer 23,950
Product manager 28,800
Cook 30,800
3
Cook 19,140
Departm't head
21,400
Product manager 28,200
4
Bank credit clerk
16,130
Engineer 18,600
Bank credit clerk
18,000
5
Skilled industrial worker 13,540
Bank credit clerk
16,200
Call center agent
17,200
6
Bus driver 9,210
Skilled industrial worker 15,100
Engineer 16,700
7
Secretary 6,680
Personal assistant 12,300
Bus driver 15,800
8
Female industrial worker 6,320
Primary School teacher 10,400
Skilled industrial worker 13,400
9
Primary school teacher 5,480
Bus driver 7,000
Personal assistant 12,200
10
Sales-woman 4,810
Female sales
assistant 6,800
Primary School teacher 11,200
11
Car mechanic
4,030
Female factory worker 6,400
Female sales
assistant 10,400
12
Building labourer
3,130
Car mechanic
5,900
Building labourer
8,900
13
Building labourer
2,000
Car mechanic
8,700
14
Female factory worker 6,700
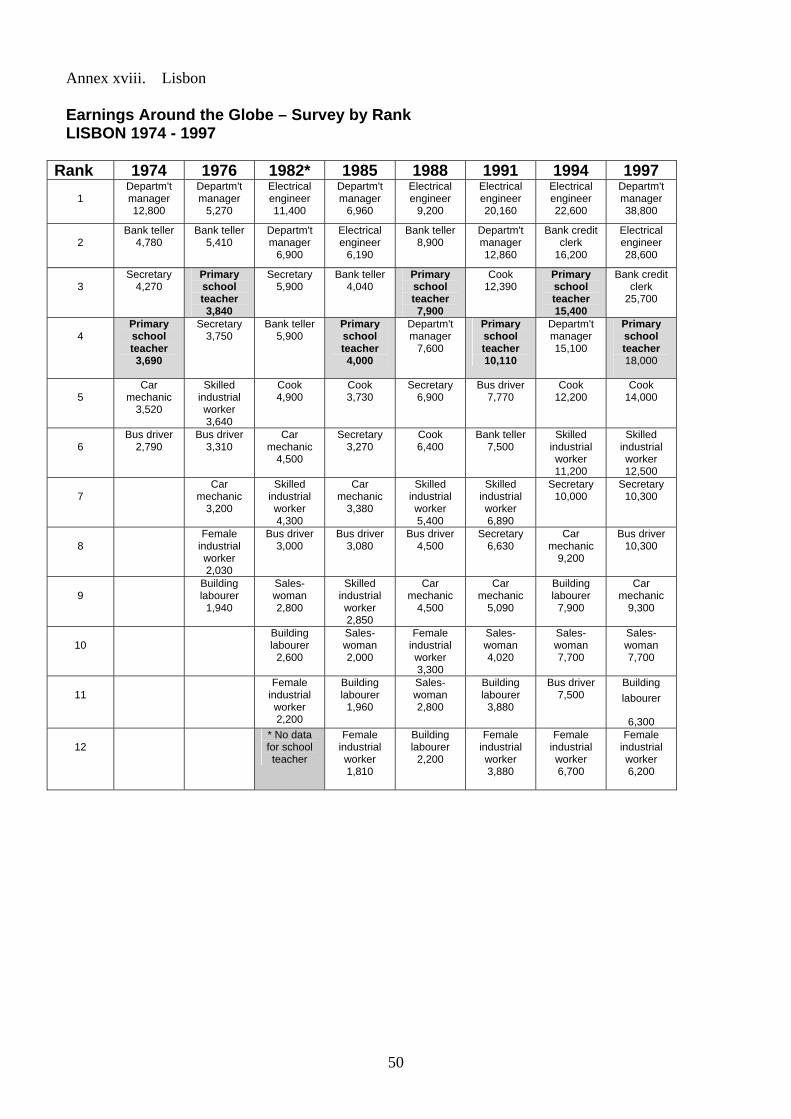
50
Annex xviii. Lisbon Earnings Around the Globe – Survey by Rank LISBON 1974 - 1997
Rank 1974 1976 1982* 1985 1988 1991 1994 1997
1
Departm't manager 12,800
Departm't manager
5,270
Electrical engineer 11,400
Departm't manager
6,960
Electrical engineer
9,200
Electrical engineer 20,160
Electrical engineer 22,600
Departm't manager 38,800
2
Bank teller 4,780
Bank teller 5,410
Departm't manager
6,900
Electrical engineer
6,190
Bank teller 8,900
Departm't manager 12,860
Bank credit clerk
16,200
Electrical engineer 28,600
3
Secretary 4,270
Primary school teacher 3,840
Secretary 5,900
Bank teller 4,040
Primary school teacher 7,900
Cook 12,390
Primary school teacher 15,400
Bank credit clerk
25,700
4
Primary school teacher 3,690
Secretary 3,750
Bank teller 5,900
Primary school teacher 4,000
Departm't manager
7,600
Primary school teacher 10,110
Departm't manager 15,100
Primary school teacher 18,000
5
Car mechanic
3,520
Skilled industrial worker 3,640
Cook 4,900
Cook 3,730
Secretary 6,900
Bus driver 7,770
Cook 12,200
Cook 14,000
6
Bus driver 2,790
Bus driver 3,310
Car mechanic
4,500
Secretary 3,270
Cook 6,400
Bank teller 7,500
Skilled industrial worker 11,200
Skilled industrial worker 12,500
7
Car mechanic
3,200
Skilled industrial worker 4,300
Car mechanic
3,380
Skilled industrial worker 5,400
Skilled industrial worker 6,890
Secretary 10,000
Secretary 10,300
8
Female industrial worker 2,030
Bus driver 3,000
Bus driver 3,080
Bus driver 4,500
Secretary 6,630
Car mechanic
9,200
Bus driver 10,300
9
Building labourer
1,940
Sales-woman 2,800
Skilled industrial worker 2,850
Car mechanic
4,500
Car mechanic
5,090
Building labourer
7,900
Car mechanic
9,300
10
Building labourer
2,600
Sales-woman 2,000
Female industrial worker 3,300
Sales-woman 4,020
Sales-woman 7,700
Sales-woman 7,700
11
Female industrial worker 2,200
Building labourer
1,960
Sales-woman 2,800
Building labourer
3,880
Bus driver 7,500
Building labourer
6,300
12
* No data for school teacher
Female industrial worker 1,810
Building labourer
2,200
Female industrial worker 3,880
Female industrial worker 6,700
Female industrial worker 6,200
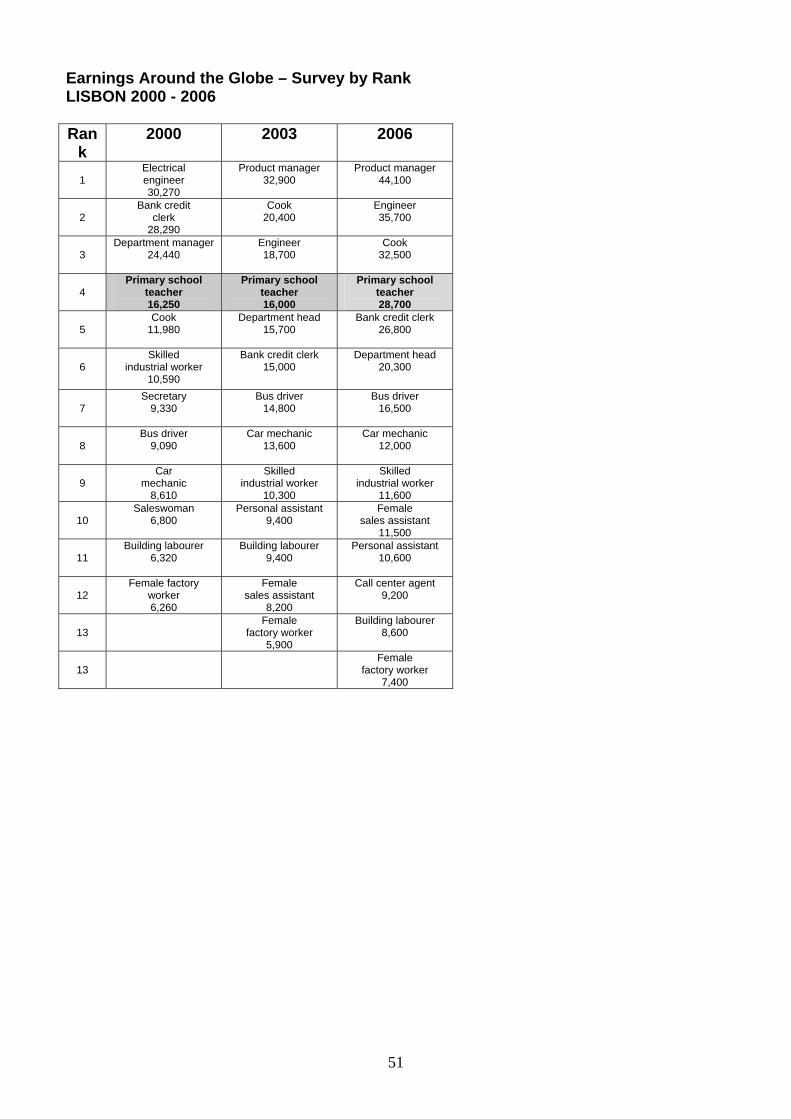
51
Earnings Around the Globe – Survey by Rank LISBON 2000 - 2006 Ran
k 2000 2003 2006
1
Electrical engineer 30,270
Product manager 32,900
Product manager 44,100
2 Bank credit
clerk 28,290
Cook 20,400
Engineer 35,700
3 Department manager
24,440
Engineer 18,700
Cook 32,500
4
Primary school teacher 16,250
Primary school teacher 16,000
Primary school teacher 28,700
5
Cook 11,980
Department head 15,700
Bank credit clerk 26,800
6 Skilled
industrial worker 10,590
Bank credit clerk 15,000
Department head 20,300
7
Secretary 9,330
Bus driver 14,800
Bus driver 16,500
8 Bus driver
9,090
Car mechanic 13,600
Car mechanic 12,000
9
Car mechanic
8,610
Skilled industrial worker
10,300
Skilled industrial worker
11,600
10 Saleswoman
6,800 Personal assistant
9,400 Female
sales assistant 11,500
11
Building labourer 6,320
Building labourer 9,400
Personal assistant 10,600
12
Female factory worker 6,260
Female sales assistant
8,200
Call center agent 9,200
13
Female factory worker
5,900
Building labourer 8,600
13
Female factory worker
7,400
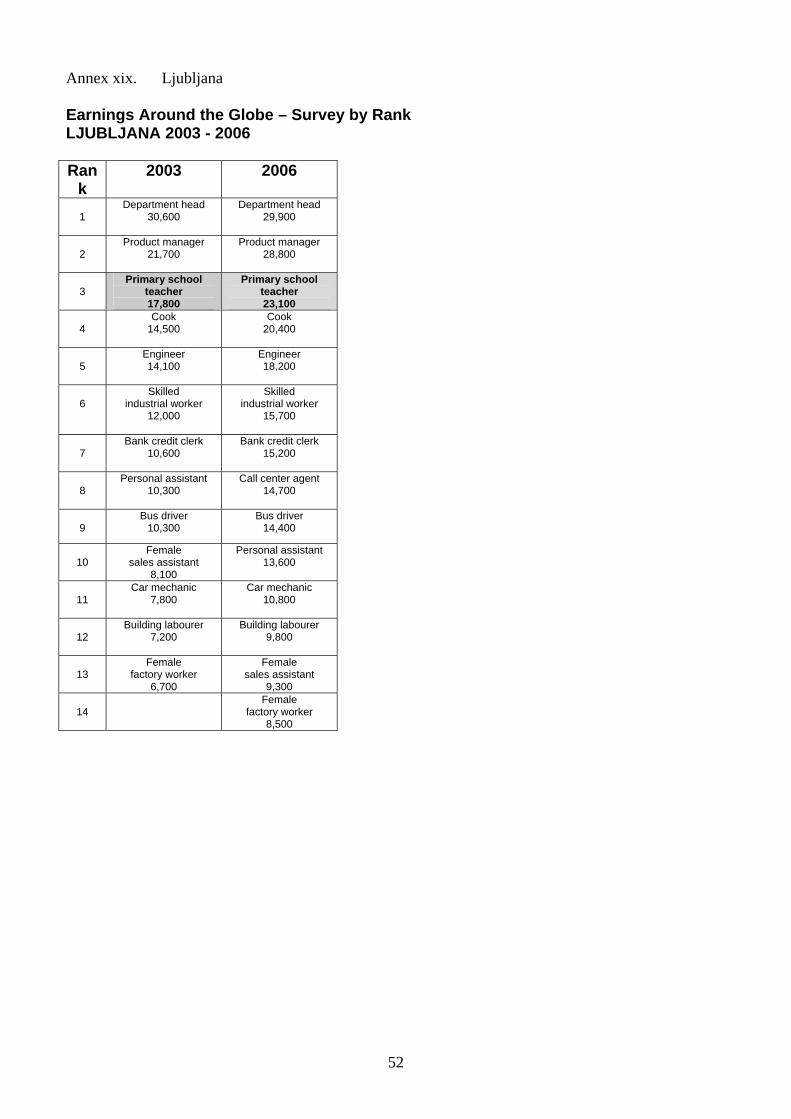
52
Annex xix. Ljubljana Earnings Around the Globe – Survey by Rank LJUBLJANA 2003 - 2006 Ran
k 2003 2006
1
Department head 30,600
Department head 29,900
2 Product manager
21,700
Product manager 28,800
3 Primary school
teacher 17,800
Primary school teacher 23,100
4
Cook 14,500
Cook 20,400
5
Engineer 14,100
Engineer 18,200
6 Skilled
industrial worker 12,000
Skilled industrial worker
15,700
7
Bank credit clerk 10,600
Bank credit clerk 15,200
8 Personal assistant
10,300
Call center agent 14,700
9
Bus driver 10,300
Bus driver 14,400
10
Female sales assistant
8,100
Personal assistant 13,600
11 Car mechanic
7,800
Car mechanic 10,800
12
Building labourer 7,200
Building labourer 9,800
13
Female factory worker
6,700
Female sales assistant
9,300
14
Female factory worker
8,500
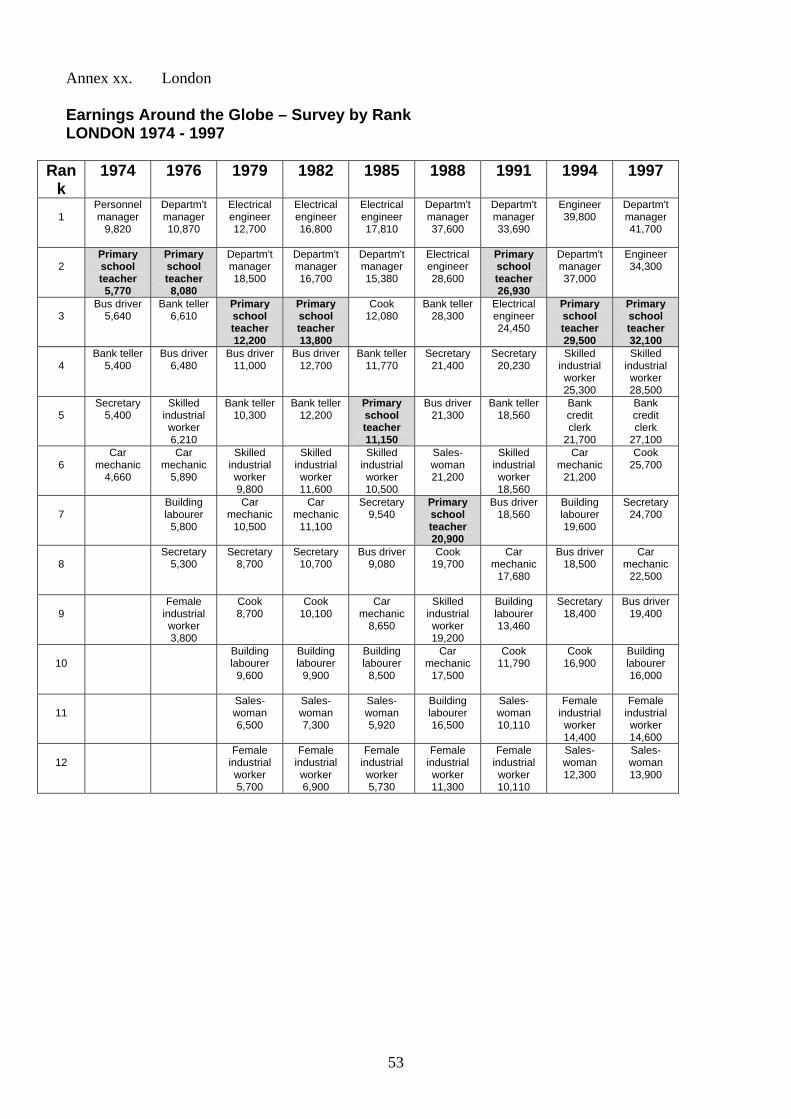
53
Annex xx. London Earnings Around the Globe – Survey by Rank LONDON 1974 - 1997
Rank
1974 1976 1979 1982 1985 1988 1991 1994 1997
1
Personnel manager
9,820
Departm't manager 10,870
Electrical engineer 12,700
Electrical engineer 16,800
Electrical engineer 17,810
Departm't manager 37,600
Departm't manager 33,690
Engineer 39,800
Departm't manager 41,700
2
Primary school teacher 5,770
Primary school teacher 8,080
Departm't manager 18,500
Departm't manager 16,700
Departm't manager 15,380
Electrical engineer 28,600
Primary school teacher 26,930
Departm't manager 37,000
Engineer 34,300
3
Bus driver 5,640
Bank teller 6,610
Primary school teacher 12,200
Primary school teacher 13,800
Cook 12,080
Bank teller 28,300
Electrical engineer 24,450
Primary school teacher 29,500
Primary school teacher 32,100
4
Bank teller 5,400
Bus driver 6,480
Bus driver 11,000
Bus driver 12,700
Bank teller 11,770
Secretary 21,400
Secretary 20,230
Skilled industrial worker 25,300
Skilled industrial worker 28,500
5
Secretary 5,400
Skilled industrial worker 6,210
Bank teller 10,300
Bank teller 12,200
Primary school teacher 11,150
Bus driver 21,300
Bank teller 18,560
Bank credit clerk
21,700
Bank credit clerk
27,100
6 Car
mechanic 4,660
Car mechanic
5,890
Skilled industrial worker 9,800
Skilled industrial worker 11,600
Skilled industrial worker 10,500
Sales-woman 21,200
Skilled industrial worker 18,560
Car mechanic
21,200
Cook 25,700
7
Building labourer
5,800
Car mechanic
10,500
Car mechanic
11,100
Secretary 9,540
Primary school teacher 20,900
Bus driver 18,560
Building labourer 19,600
Secretary 24,700
8
Secretary 5,300
Secretary 8,700
Secretary 10,700
Bus driver 9,080
Cook 19,700
Car mechanic
17,680
Bus driver 18,500
Car mechanic
22,500
9
Female industrial worker 3,800
Cook 8,700
Cook 10,100
Car mechanic
8,650
Skilled industrial worker 19,200
Building labourer 13,460
Secretary 18,400
Bus driver 19,400
10
Building labourer
9,600
Building labourer
9,900
Building labourer
8,500
Car mechanic
17,500
Cook 11,790
Cook 16,900
Building labourer 16,000
11
Sales-woman 6,500
Sales-woman 7,300
Sales-woman 5,920
Building labourer 16,500
Sales-woman 10,110
Female industrial worker 14,400
Female industrial worker 14,600
12
Female industrial worker 5,700
Female industrial worker 6,900
Female industrial worker 5,730
Female industrial worker 11,300
Female industrial worker 10,110
Sales-woman 12,300
Sales-woman 13,900
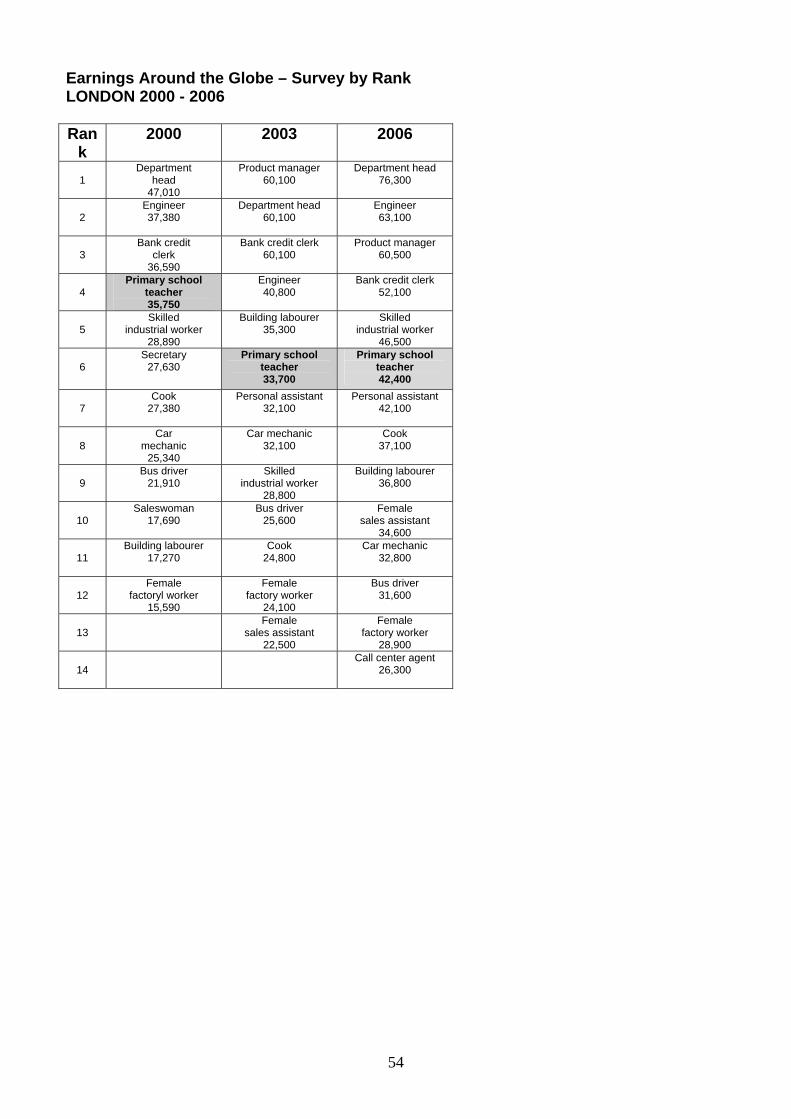
54
Earnings Around the Globe – Survey by Rank LONDON 2000 - 2006 Ran
k 2000 2003 2006
1
Department head
47,010
Product manager 60,100
Department head 76,300
2
Engineer 37,380
Department head 60,100
Engineer 63,100
3
Bank credit clerk
36,590
Bank credit clerk 60,100
Product manager 60,500
4
Primary school teacher 35,750
Engineer 40,800
Bank credit clerk 52,100
5
Skilled industrial worker
28,890
Building labourer 35,300
Skilled industrial worker
46,500
6 Secretary
27,630 Primary school
teacher 33,700
Primary school teacher 42,400
7
Cook 27,380
Personal assistant 32,100
Personal assistant 42,100
8
Car mechanic
25,340
Car mechanic 32,100
Cook 37,100
9
Bus driver 21,910
Skilled industrial worker
28,800
Building labourer 36,800
10
Saleswoman 17,690
Bus driver 25,600
Female sales assistant
34,600
11 Building labourer
17,270
Cook 24,800
Car mechanic 32,800
12
Female factoryl worker
15,590
Female factory worker
24,100
Bus driver 31,600
13
Female sales assistant
22,500
Female factory worker
28,900
14
Call center agent 26,300
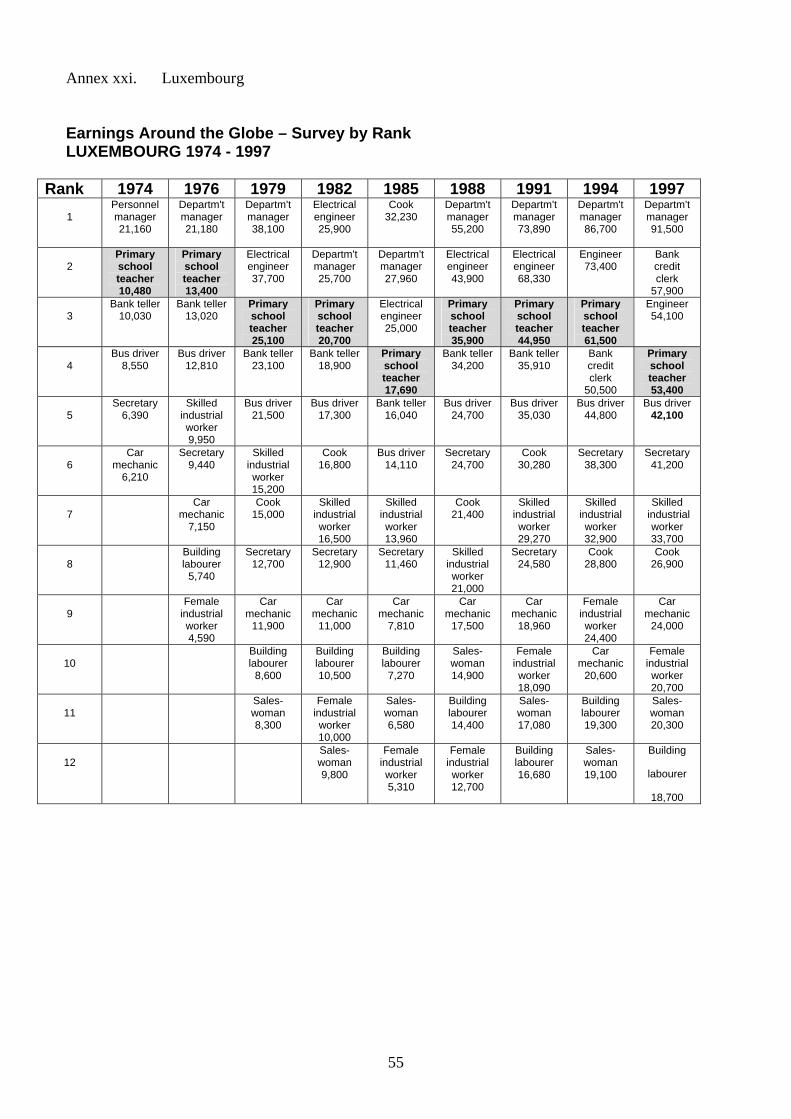
55
Annex xxi. Luxembourg Earnings Around the Globe – Survey by Rank LUXEMBOURG 1974 - 1997
Rank 1974 1976 1979 1982 1985 1988 1991 1994 1997
1
Personnel manager 21,160
Departm't manager 21,180
Departm't manager 38,100
Electrical engineer 25,900
Cook 32,230
Departm't manager 55,200
Departm't manager 73,890
Departm't manager 86,700
Departm't manager 91,500
2
Primary school teacher 10,480
Primary school teacher 13,400
Electrical engineer 37,700
Departm't manager 25,700
Departm't manager 27,960
Electrical engineer 43,900
Electrical engineer 68,330
Engineer 73,400
Bank credit clerk
57,900
3 Bank teller
10,030
Bank teller 13,020
Primary school teacher 25,100
Primary school teacher 20,700
Electrical engineer 25,000
Primary school teacher 35,900
Primary school teacher 44,950
Primary school teacher 61,500
Engineer 54,100
4
Bus driver 8,550
Bus driver 12,810
Bank teller 23,100
Bank teller 18,900
Primary school teacher 17,690
Bank teller 34,200
Bank teller 35,910
Bank credit clerk
50,500
Primary school teacher 53,400
5
Secretary 6,390
Skilled industrial worker 9,950
Bus driver 21,500
Bus driver 17,300
Bank teller 16,040
Bus driver 24,700
Bus driver 35,030
Bus driver 44,800
Bus driver 42,100
6
Car mechanic
6,210
Secretary 9,440
Skilled industrial worker 15,200
Cook 16,800
Bus driver 14,110
Secretary 24,700
Cook 30,280
Secretary 38,300
Secretary 41,200
7
Car mechanic
7,150
Cook 15,000
Skilled industrial worker 16,500
Skilled industrial worker 13,960
Cook 21,400
Skilled industrial worker 29,270
Skilled industrial worker 32,900
Skilled industrial
worker 33,700
8
Building labourer
5,740
Secretary 12,700
Secretary 12,900
Secretary 11,460
Skilled industrial worker 21,000
Secretary 24,580
Cook 28,800
Cook 26,900
9
Female industrial worker 4,590
Car mechanic
11,900
Car mechanic
11,000
Car mechanic
7,810
Car mechanic
17,500
Car mechanic
18,960
Female industrial worker 24,400
Car mechanic
24,000
10
Building labourer
8,600
Building labourer 10,500
Building labourer
7,270
Sales-woman 14,900
Female industrial worker 18,090
Car mechanic
20,600
Female industrial worker 20,700
11
Sales-woman 8,300
Female industrial worker 10,000
Sales-woman 6,580
Building labourer 14,400
Sales-woman 17,080
Building labourer 19,300
Sales-woman 20,300
12
Sales-woman 9,800
Female industrial worker 5,310
Female industrial worker 12,700
Building labourer 16,680
Sales-woman 19,100
Building
labourer
18,700
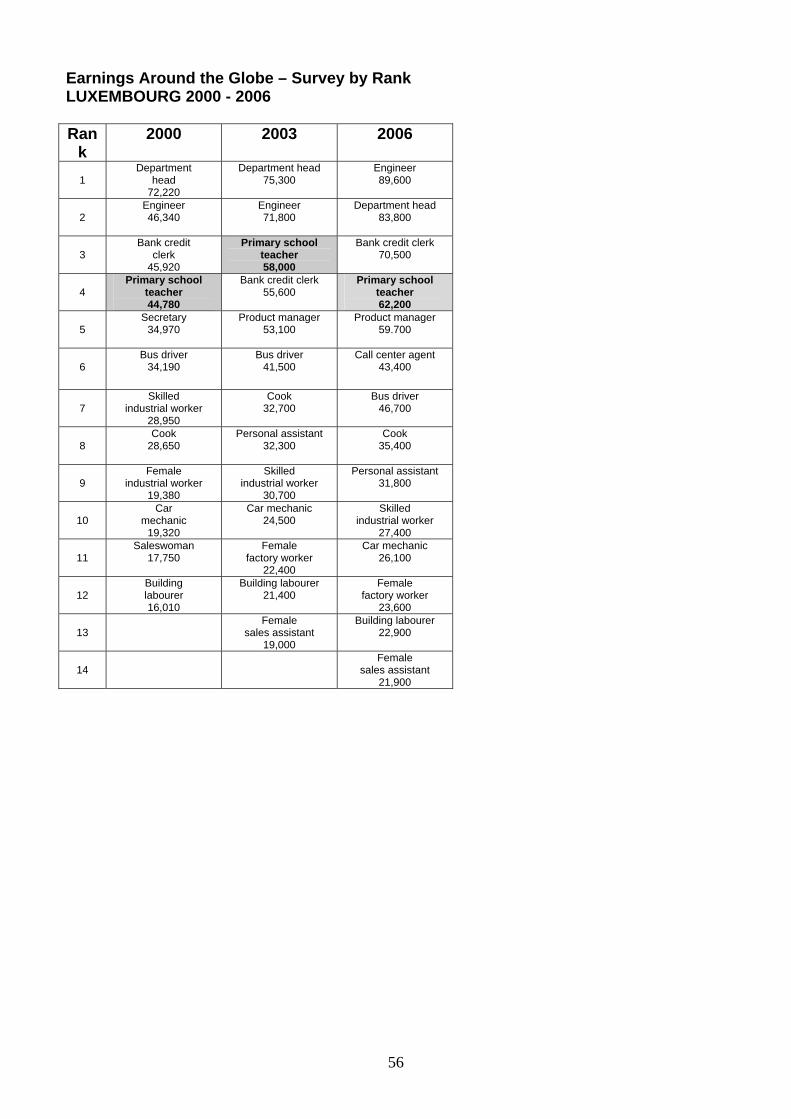
56
Earnings Around the Globe – Survey by Rank LUXEMBOURG 2000 - 2006 Ran
k 2000 2003 2006
1
Department head
72,220
Department head 75,300
Engineer 89,600
2 Engineer 46,340
Engineer 71,800
Department head 83,800
3 Bank credit
clerk 45,920
Primary school teacher 58,000
Bank credit clerk 70,500
4
Primary school teacher 44,780
Bank credit clerk 55,600
Primary school teacher 62,200
5
Secretary 34,970
Product manager 53,100
Product manager 59.700
6
Bus driver 34,190
Bus driver 41,500
Call center agent 43,400
7
Skilled industrial worker
28,950
Cook 32,700
Bus driver 46,700
8
Cook 28,650
Personal assistant 32,300
Cook 35,400
9 Female
industrial worker 19,380
Skilled industrial worker
30,700
Personal assistant 31,800
10 Car
mechanic 19,320
Car mechanic 24,500
Skilled industrial worker
27,400
11 Saleswoman
17,750 Female
factory worker 22,400
Car mechanic 26,100
12
Building labourer 16,010
Building labourer 21,400
Female factory worker
23,600
13
Female sales assistant
19,000
Building labourer 22,900
14
Female sales assistant
21,900
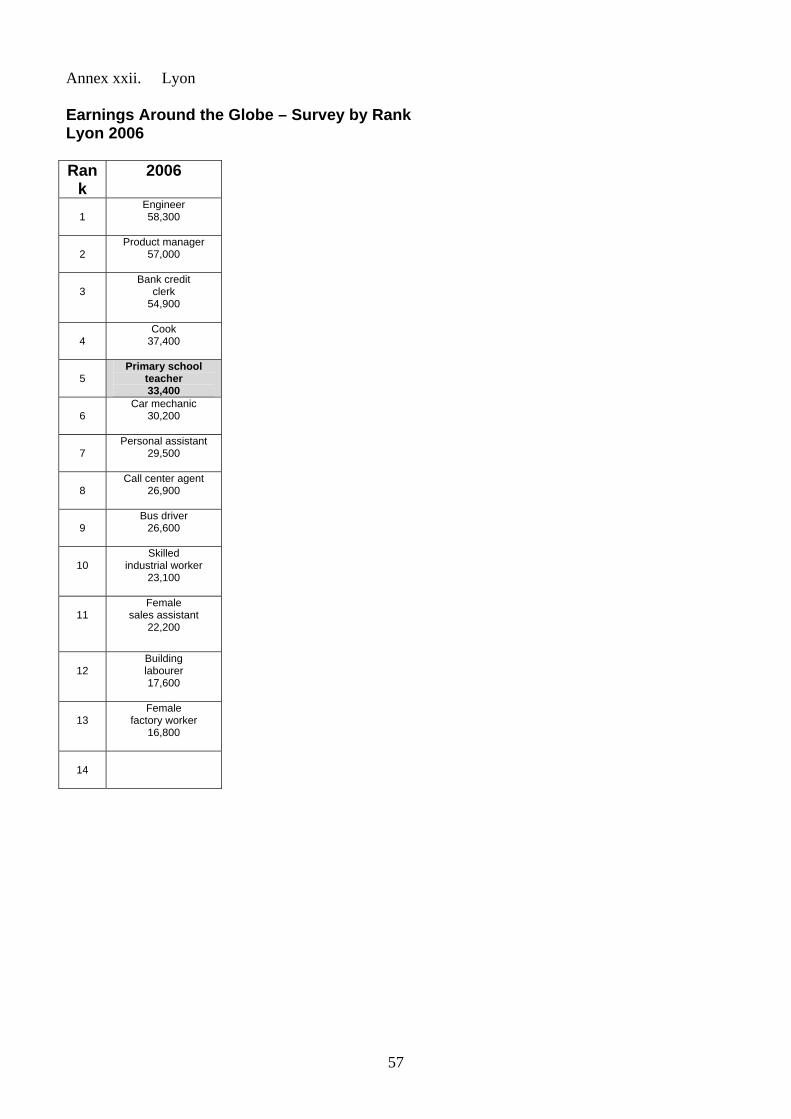
57
Annex xxii. Lyon Earnings Around the Globe – Survey by Rank Lyon 2006 Ran
k 2006
1
Engineer 58,300
2 Product manager
57,000
3
Bank credit clerk
54,900
4
Cook 37,400
5
Primary school teacher 33,400
6
Car mechanic 30,200
7 Personal assistant
29,500
8
Call center agent 26,900
9 Bus driver
26,600
10
Skilled industrial worker
23,100
11
Female sales assistant
22,200
12
Building labourer 17,600
13
Female factory worker
16,800
14
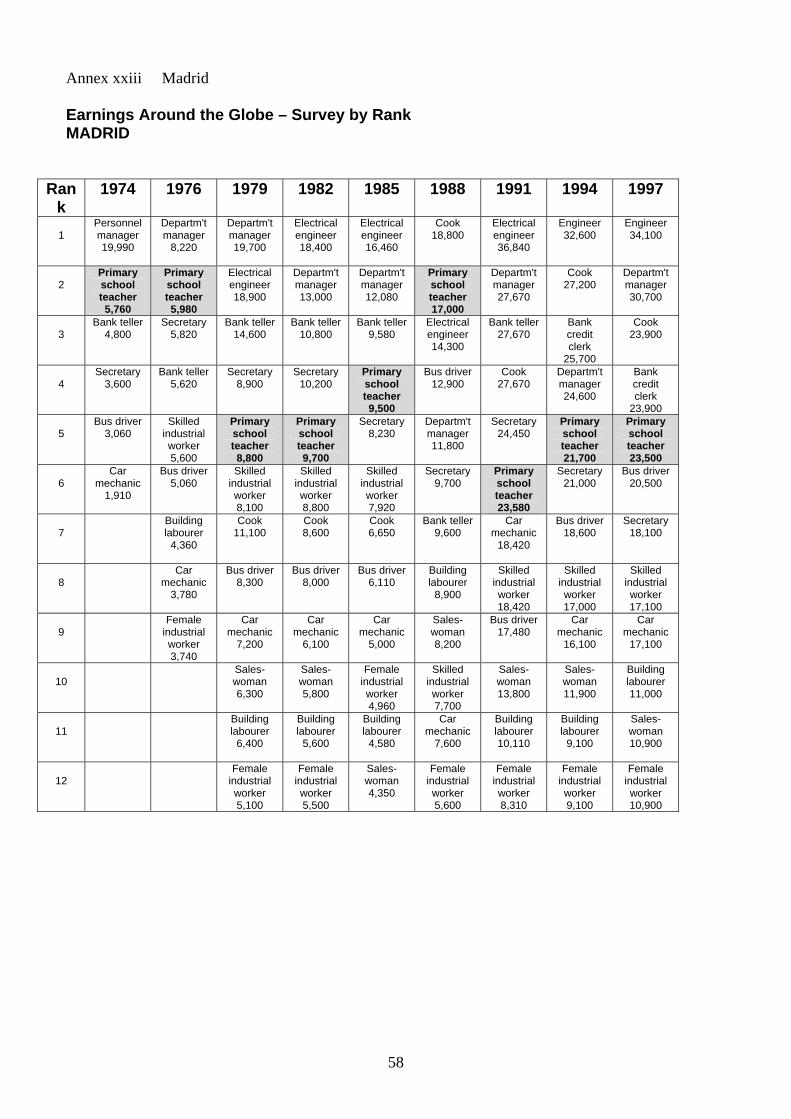
58
Annex xxiii Madrid Earnings Around the Globe – Survey by Rank MADRID
Rank
1974 1976 1979 1982 1985 1988 1991 1994 1997
1
Personnel manager 19,990
Departm't manager
8,220
Departm't manager 19,700
Electrical engineer 18,400
Electrical engineer 16,460
Cook 18,800
Electrical engineer 36,840
Engineer 32,600
Engineer 34,100
2
Primary school teacher 5,760
Primary school teacher 5,980
Electrical engineer 18,900
Departm't manager 13,000
Departm't manager 12,080
Primary school teacher 17,000
Departm't manager 27,670
Cook 27,200
Departm't manager 30,700
3
Bank teller 4,800
Secretary 5,820
Bank teller 14,600
Bank teller 10,800
Bank teller 9,580
Electrical engineer 14,300
Bank teller 27,670
Bank credit clerk
25,700
Cook 23,900
4
Secretary 3,600
Bank teller 5,620
Secretary 8,900
Secretary 10,200
Primary school teacher 9,500
Bus driver 12,900
Cook 27,670
Departm't manager 24,600
Bank credit clerk
23,900
5 Bus driver
3,060 Skilled
industrial worker 5,600
Primary school teacher 8,800
Primary school teacher 9,700
Secretary 8,230
Departm't manager 11,800
Secretary 24,450
Primary school teacher 21,700
Primary school teacher 23,500
6
Car mechanic
1,910
Bus driver 5,060
Skilled industrial worker 8,100
Skilled industrial worker 8,800
Skilled industrial worker 7,920
Secretary 9,700
Primary school teacher 23,580
Secretary 21,000
Bus driver 20,500
7
Building labourer
4,360
Cook 11,100
Cook 8,600
Cook 6,650
Bank teller 9,600
Car mechanic
18,420
Bus driver 18,600
Secretary 18,100
8
Car mechanic
3,780
Bus driver 8,300
Bus driver 8,000
Bus driver 6,110
Building labourer
8,900
Skilled industrial worker 18,420
Skilled industrial worker 17,000
Skilled industrial worker 17,100
9
Female industrial worker 3,740
Car mechanic
7,200
Car mechanic
6,100
Car mechanic
5,000
Sales-woman 8,200
Bus driver 17,480
Car mechanic
16,100
Car mechanic
17,100
10
Sales-woman 6,300
Sales-woman 5,800
Female industrial worker 4,960
Skilled industrial worker 7,700
Sales-woman 13,800
Sales-woman 11,900
Building labourer 11,000
11
Building labourer
6,400
Building labourer
5,600
Building labourer
4,580
Car mechanic
7,600
Building labourer 10,110
Building labourer
9,100
Sales-woman 10,900
12
Female industrial worker 5,100
Female industrial worker 5,500
Sales-woman 4,350
Female industrial worker 5,600
Female industrial worker 8,310
Female industrial worker 9,100
Female industrial worker 10,900
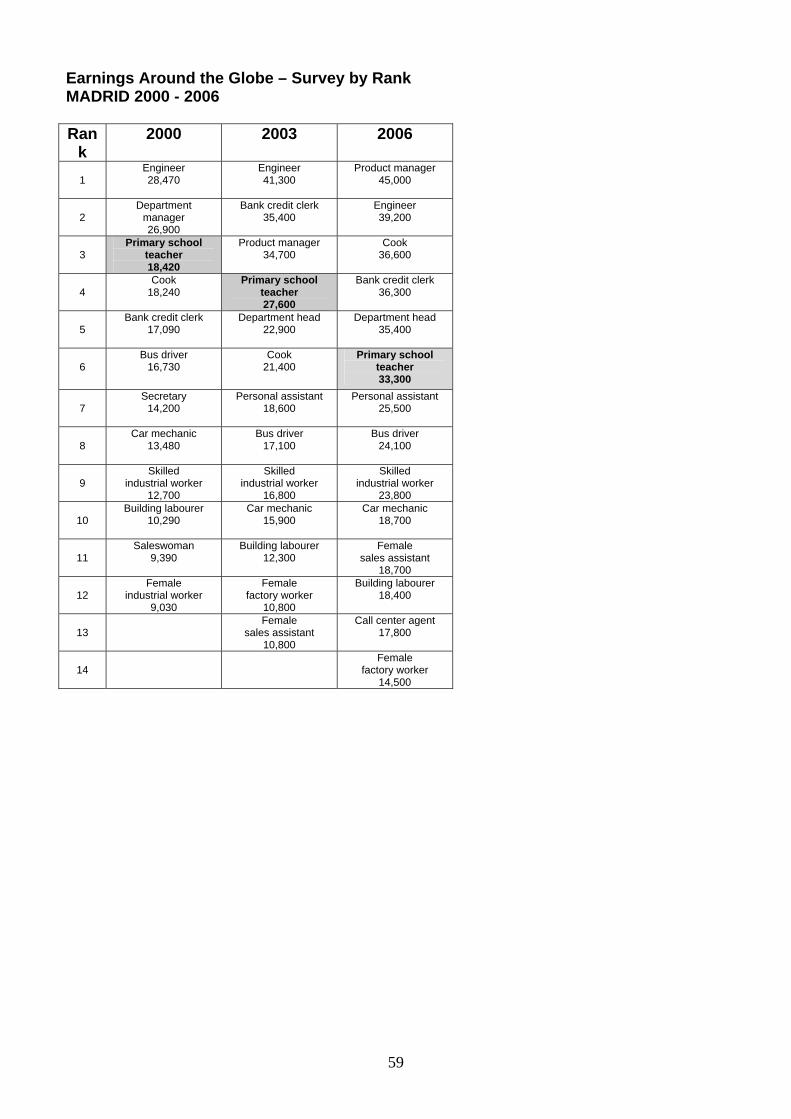
59
Earnings Around the Globe – Survey by Rank MADRID 2000 - 2006 Ran
k 2000 2003 2006
1
Engineer 28,470
Engineer 41,300
Product manager 45,000
2
Department manager 26,900
Bank credit clerk 35,400
Engineer 39,200
3 Primary school
teacher 18,420
Product manager 34,700
Cook 36,600
4
Cook 18,240
Primary school teacher 27,600
Bank credit clerk 36,300
5
Bank credit clerk 17,090
Department head 22,900
Department head 35,400
6 Bus driver
16,730 Cook
21,400 Primary school
teacher 33,300
7
Secretary 14,200
Personal assistant 18,600
Personal assistant 25,500
8 Car mechanic
13,480
Bus driver 17,100
Bus driver 24,100
9
Skilled industrial worker
12,700
Skilled industrial worker
16,800
Skilled industrial worker
23,800
10 Building labourer
10,290 Car mechanic
15,900
Car mechanic 18,700
11 Saleswoman
9,390 Building labourer
12,300
Female sales assistant
18,700
12
Female industrial worker
9,030
Female factory worker
10,800
Building labourer 18,400
13
Female sales assistant
10,800
Call center agent 17,800
14
Female factory worker
14,500
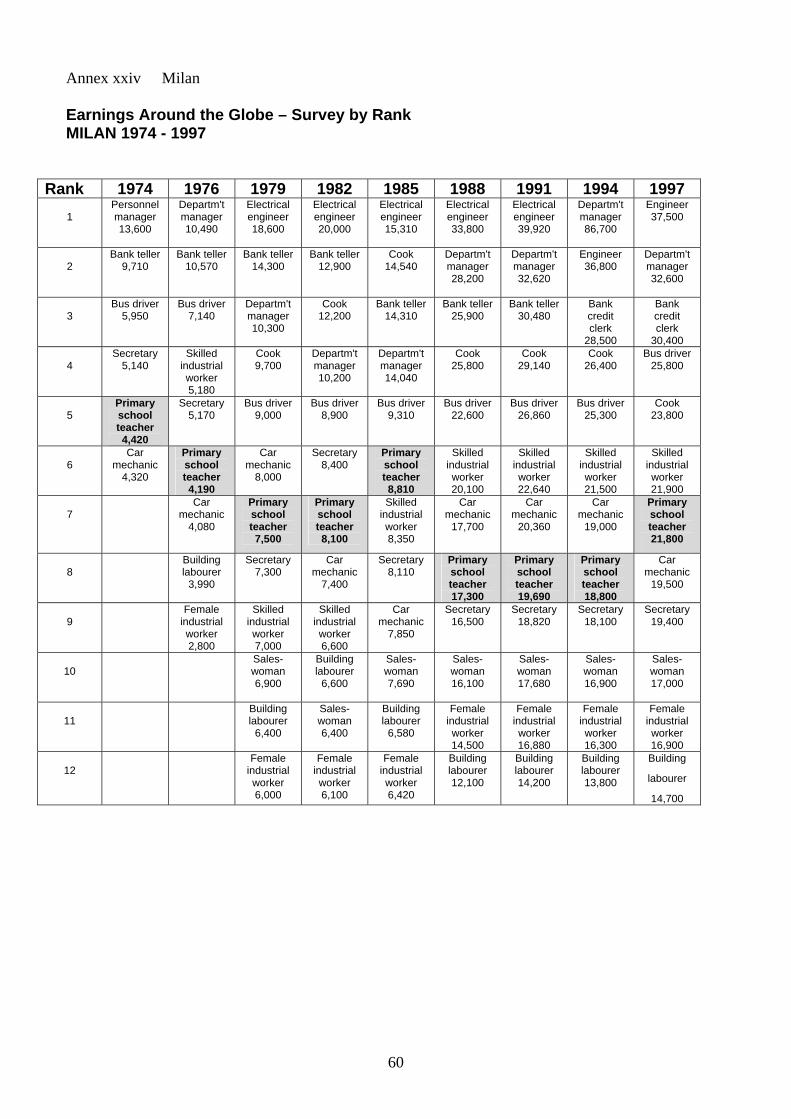
60
Annex xxiv Milan Earnings Around the Globe – Survey by Rank MILAN 1974 - 1997
Rank 1974 1976 1979 1982 1985 1988 1991 1994 1997
1
Personnel manager 13,600
Departm't manager 10,490
Electrical engineer 18,600
Electrical engineer 20,000
Electrical engineer 15,310
Electrical engineer 33,800
Electrical engineer 39,920
Departm't manager 86,700
Engineer 37,500
2
Bank teller 9,710
Bank teller 10,570
Bank teller 14,300
Bank teller 12,900
Cook 14,540
Departm't manager 28,200
Departm't manager 32,620
Engineer 36,800
Departm't manager 32,600
3
Bus driver 5,950
Bus driver 7,140
Departm't manager 10,300
Cook 12,200
Bank teller 14,310
Bank teller 25,900
Bank teller 30,480
Bank credit clerk
28,500
Bank credit clerk
30,400
4 Secretary
5,140
Skilled industrial worker 5,180
Cook 9,700
Departm't manager 10,200
Departm't manager 14,040
Cook 25,800
Cook 29,140
Cook 26,400
Bus driver 25,800
5
Primary school teacher 4,420
Secretary 5,170
Bus driver 9,000
Bus driver 8,900
Bus driver 9,310
Bus driver 22,600
Bus driver 26,860
Bus driver 25,300
Cook 23,800
6
Car mechanic
4,320
Primary school teacher 4,190
Car mechanic
8,000
Secretary 8,400
Primary school teacher 8,810
Skilled industrial worker 20,100
Skilled industrial worker 22,640
Skilled industrial worker 21,500
Skilled industrial worker 21,900
7
Car mechanic
4,080
Primary school teacher 7,500
Primary school teacher 8,100
Skilled industrial worker 8,350
Car mechanic
17,700
Car mechanic
20,360
Car mechanic
19,000
Primary school teacher 21,800
8
Building labourer
3,990
Secretary 7,300
Car mechanic
7,400
Secretary 8,110
Primary school teacher 17,300
Primary school teacher 19,690
Primary school teacher 18,800
Car mechanic
19,500
9
Female industrial worker 2,800
Skilled industrial worker 7,000
Skilled industrial worker 6,600
Car mechanic
7,850
Secretary 16,500
Secretary 18,820
Secretary 18,100
Secretary 19,400
10
Sales-woman 6,900
Building labourer
6,600
Sales-woman 7,690
Sales-woman 16,100
Sales-woman 17,680
Sales-woman 16,900
Sales-woman 17,000
11
Building labourer
6,400
Sales-woman 6,400
Building labourer
6,580
Female industrial worker 14,500
Female industrial worker 16,880
Female industrial worker 16,300
Female industrial worker 16,900
12
Female industrial worker 6,000
Female industrial worker 6,100
Female industrial worker 6,420
Building labourer 12,100
Building labourer 14,200
Building labourer 13,800
Building
labourer
14,700
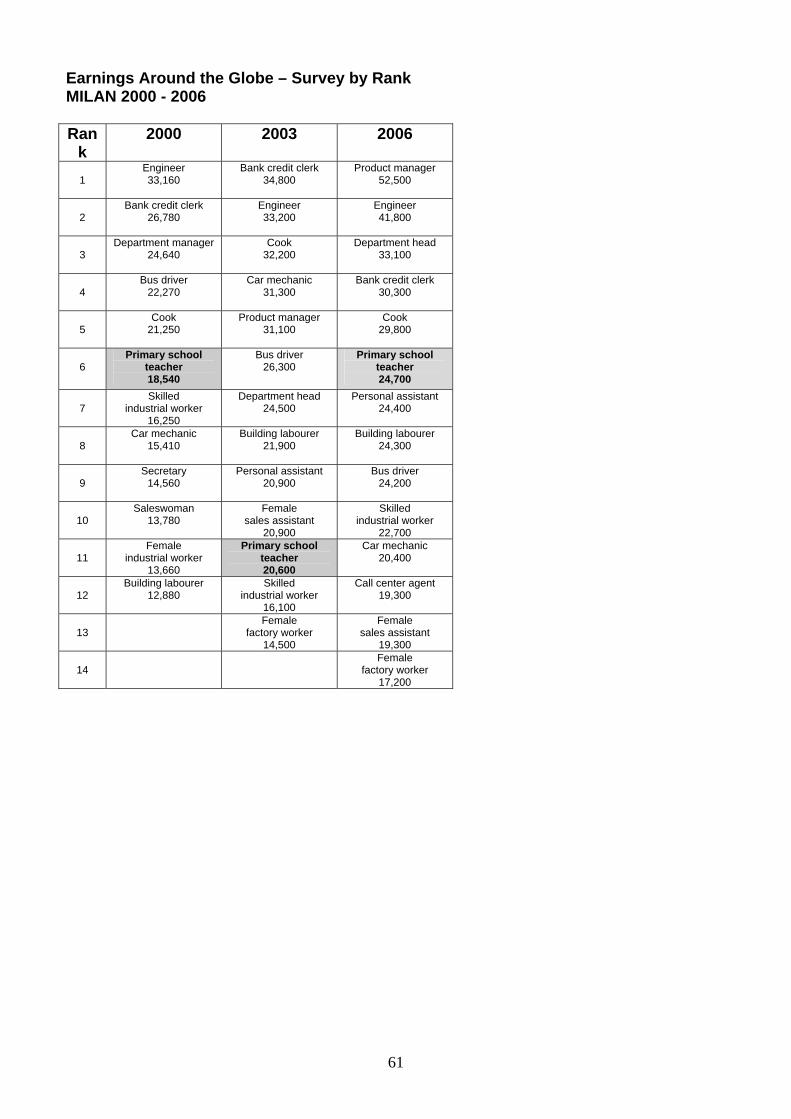
61
Earnings Around the Globe – Survey by Rank MILAN 2000 - 2006 Ran
k 2000 2003 2006
1
Engineer 33,160
Bank credit clerk 34,800
Product manager 52,500
2 Bank credit clerk
26,780
Engineer 33,200
Engineer 41,800
3
Department manager 24,640
Cook 32,200
Department head 33,100
4
Bus driver 22,270
Car mechanic 31,300
Bank credit clerk 30,300
5
Cook 21,250
Product manager 31,100
Cook 29,800
6
Primary school teacher 18,540
Bus driver 26,300
Primary school teacher 24,700
7
Skilled industrial worker
16,250
Department head 24,500
Personal assistant 24,400
8
Car mechanic 15,410
Building labourer 21,900
Building labourer 24,300
9
Secretary 14,560
Personal assistant 20,900
Bus driver 24,200
10
Saleswoman 13,780
Female sales assistant
20,900
Skilled industrial worker
22,700
11 Female
industrial worker 13,660
Primary school teacher 20,600
Car mechanic 20,400
12
Building labourer 12,880
Skilled industrial worker
16,100
Call center agent 19,300
13
Female factory worker
14,500
Female sales assistant
19,300
14
Female factory worker
17,200
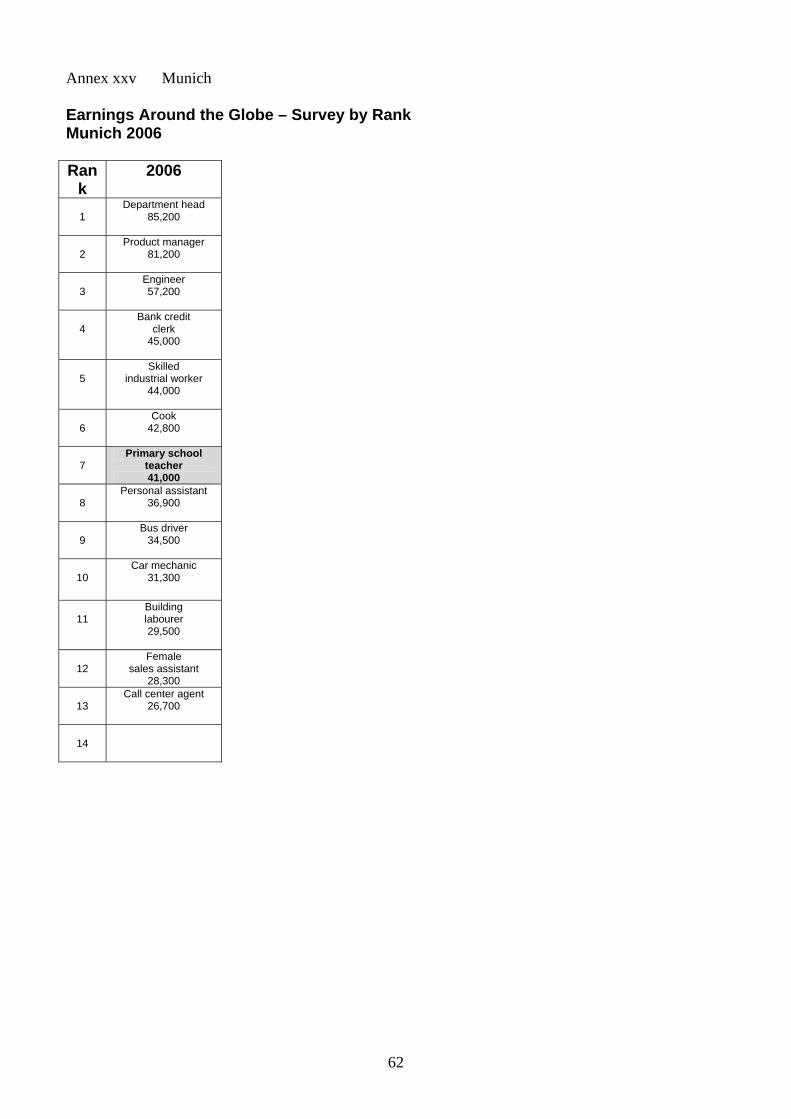
62
Annex xxv Munich Earnings Around the Globe – Survey by Rank Munich 2006 Ran
k 2006
1
Department head 85,200
2
Product manager 81,200
3 Engineer 57,200
4 Bank credit
clerk 45,000
5
Skilled industrial worker
44,000
6
Cook 42,800
7 Primary school
teacher 41,000
8
Personal assistant 36,900
9 Bus driver
34,500
10
Car mechanic 31,300
11 Building labourer 29,500
12
Female sales assistant
28,300
13
Call center agent 26,700
14
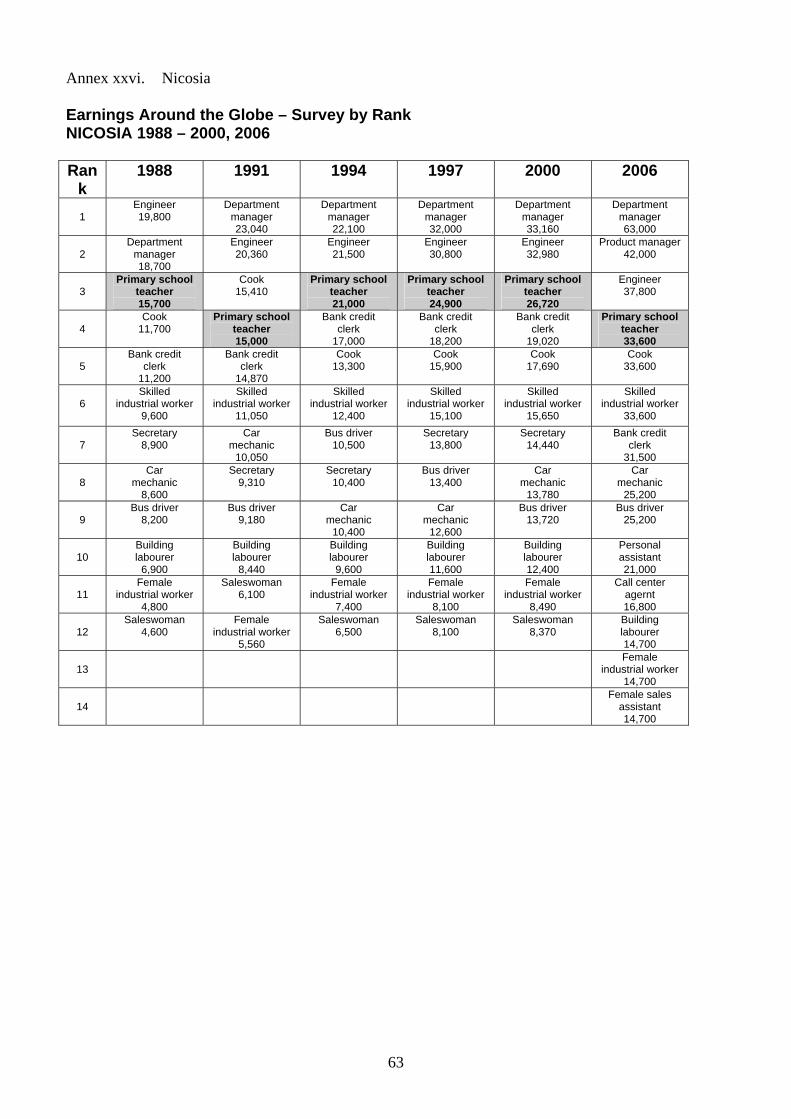
63
Annex xxvi. Nicosia Earnings Around the Globe – Survey by Rank NICOSIA 1988 – 2000, 2006 Ran
k 1988 1991 1994 1997 2000 2006
1
Engineer 19,800
Department manager 23,040
Department manager 22,100
Department manager 32,000
Department manager 33,160
Department manager 63,000
2
Department manager 18,700
Engineer 20,360
Engineer 21,500
Engineer 30,800
Engineer 32,980
Product manager 42,000
3
Primary school teacher 15,700
Cook 15,410
Primary school teacher 21,000
Primary school teacher 24,900
Primary school teacher 26,720
Engineer 37,800
4 Cook
11,700 Primary school
teacher 15,000
Bank credit clerk
17,000
Bank credit clerk
18,200
Bank credit clerk
19,020
Primary school teacher 33,600
5
Bank credit clerk
11,200
Bank credit clerk
14,870
Cook 13,300
Cook 15,900
Cook 17,690
Cook 33,600
6
Skilled industrial worker
9,600
Skilled industrial worker
11,050
Skilled industrial worker
12,400
Skilled industrial worker
15,100
Skilled industrial worker
15,650
Skilled industrial worker
33,600
7 Secretary
8,900
Car mechanic
10,050
Bus driver 10,500
Secretary 13,800
Secretary 14,440
Bank credit clerk
31,500
8 Car
mechanic 8,600
Secretary 9,310
Secretary 10,400
Bus driver 13,400
Car mechanic
13,780
Car mechanic
25,200
9 Bus driver
8,200 Bus driver
9,180 Car
mechanic 10,400
Car mechanic
12,600
Bus driver 13,720
Bus driver 25,200
10
Building labourer
6,900
Building labourer
8,440
Building labourer
9,600
Building labourer 11,600
Building labourer 12,400
Personal assistant 21,000
11
Female industrial worker
4,800
Saleswoman 6,100
Female industrial worker
7,400
Female industrial worker
8,100
Female industrial worker
8,490
Call center agernt 16,800
12
Saleswoman 4,600
Female industrial worker
5,560
Saleswoman 6,500
Saleswoman 8,100
Saleswoman 8,370
Building labourer 14,700
13
Female industrial worker
14,700
14
Female sales assistant 14,700
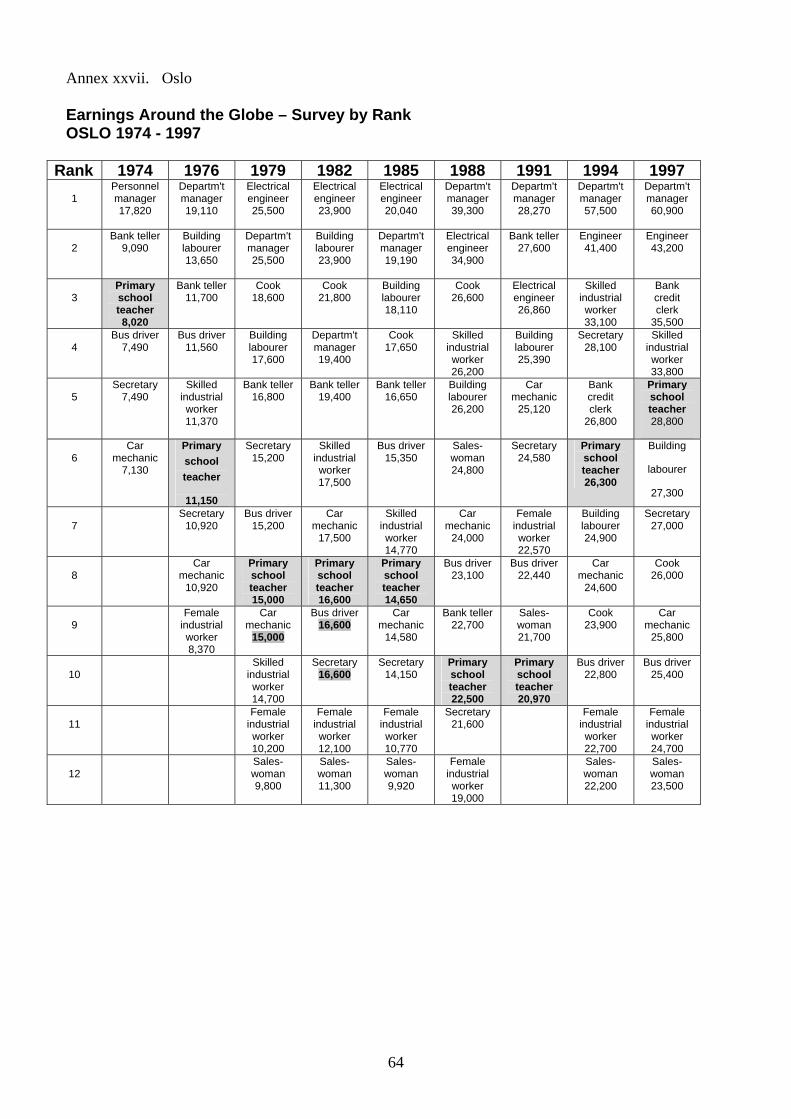
64
Annex xxvii. Oslo Earnings Around the Globe – Survey by Rank OSLO 1974 - 1997
Rank 1974 1976 1979 1982 1985 1988 1991 1994 1997
1
Personnel manager 17,820
Departm't manager 19,110
Electrical engineer 25,500
Electrical engineer 23,900
Electrical engineer 20,040
Departm't manager 39,300
Departm't manager 28,270
Departm't manager 57,500
Departm't manager 60,900
2
Bank teller 9,090
Building labourer 13,650
Departm't manager 25,500
Building labourer 23,900
Departm't manager 19,190
Electrical engineer 34,900
Bank teller 27,600
Engineer 41,400
Engineer 43,200
3
Primary school teacher 8,020
Bank teller 11,700
Cook 18,600
Cook 21,800
Building labourer 18,110
Cook 26,600
Electrical engineer 26,860
Skilled industrial worker 33,100
Bank credit clerk
35,500
4 Bus driver
7,490 Bus driver
11,560
Building labourer 17,600
Departm't manager 19,400
Cook 17,650
Skilled industrial worker 26,200
Building labourer 25,390
Secretary 28,100
Skilled industrial worker 33,800
5
Secretary 7,490
Skilled industrial worker 11,370
Bank teller 16,800
Bank teller 19,400
Bank teller 16,650
Building labourer 26,200
Car mechanic
25,120
Bank credit clerk
26,800
Primary school teacher 28,800
6
Car mechanic
7,130
Primary school teacher
11,150
Secretary 15,200
Skilled industrial worker 17,500
Bus driver 15,350
Sales-woman 24,800
Secretary 24,580
Primary school teacher 26,300
Building
labourer
27,300
7
Secretary 10,920
Bus driver 15,200
Car mechanic
17,500
Skilled industrial worker 14,770
Car mechanic
24,000
Female industrial worker 22,570
Building labourer 24,900
Secretary 27,000
8
Car mechanic
10,920
Primary school teacher 15,000
Primary school teacher 16,600
Primary school teacher 14,650
Bus driver 23,100
Bus driver 22,440
Car mechanic
24,600
Cook 26,000
9
Female industrial worker 8,370
Car mechanic
15,000
Bus driver 16,600
Car mechanic
14,580
Bank teller 22,700
Sales-woman 21,700
Cook 23,900
Car mechanic
25,800
10
Skilled industrial worker 14,700
Secretary 16,600
Secretary 14,150
Primary school teacher 22,500
Primary school teacher 20,970
Bus driver 22,800
Bus driver 25,400
11
Female industrial worker 10,200
Female industrial worker 12,100
Female industrial worker 10,770
Secretary 21,600
Female industrial worker 22,700
Female industrial worker 24,700
12
Sales-woman 9,800
Sales-woman 11,300
Sales-woman 9,920
Female industrial worker 19,000
Sales-woman 22,200
Sales-woman 23,500
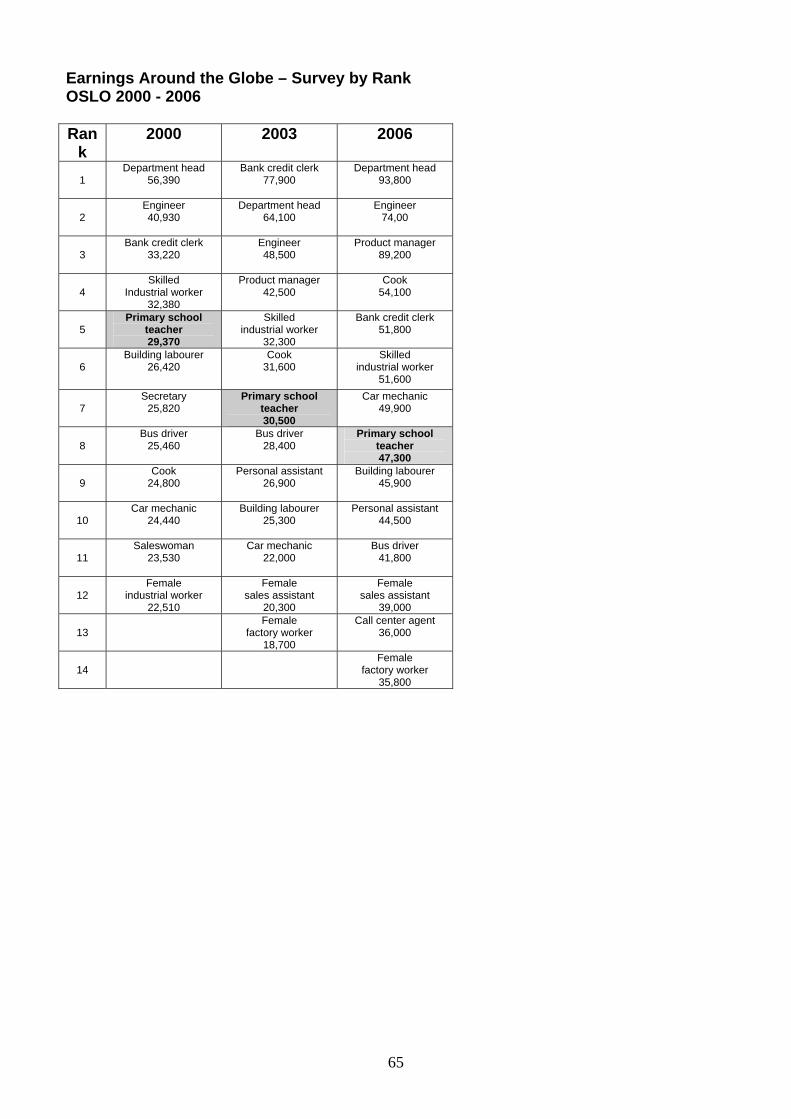
65
Earnings Around the Globe – Survey by Rank OSLO 2000 - 2006 Ran
k 2000 2003 2006
1
Department head 56,390
Bank credit clerk 77,900
Department head 93,800
2
Engineer 40,930
Department head 64,100
Engineer 74,00
3
Bank credit clerk 33,220
Engineer 48,500
Product manager 89,200
4
Skilled Industrial worker
32,380
Product manager 42,500
Cook 54,100
5
Primary school teacher 29,370
Skilled industrial worker
32,300
Bank credit clerk 51,800
6
Building labourer 26,420
Cook 31,600
Skilled industrial worker
51,600
7 Secretary
25,820 Primary school
teacher 30,500
Car mechanic 49,900
8
Bus driver 25,460
Bus driver 28,400
Primary school teacher 47,300
9
Cook 24,800
Personal assistant 26,900
Building labourer 45,900
10 Car mechanic
24,440 Building labourer
25,300
Personal assistant 44,500
11
Saleswoman 23,530
Car mechanic 22,000
Bus driver 41,800
12
Female industrial worker
22,510
Female sales assistant
20,300
Female sales assistant
39,000
13
Female factory worker
18,700
Call center agent 36,000
14
Female factory worker
35,800
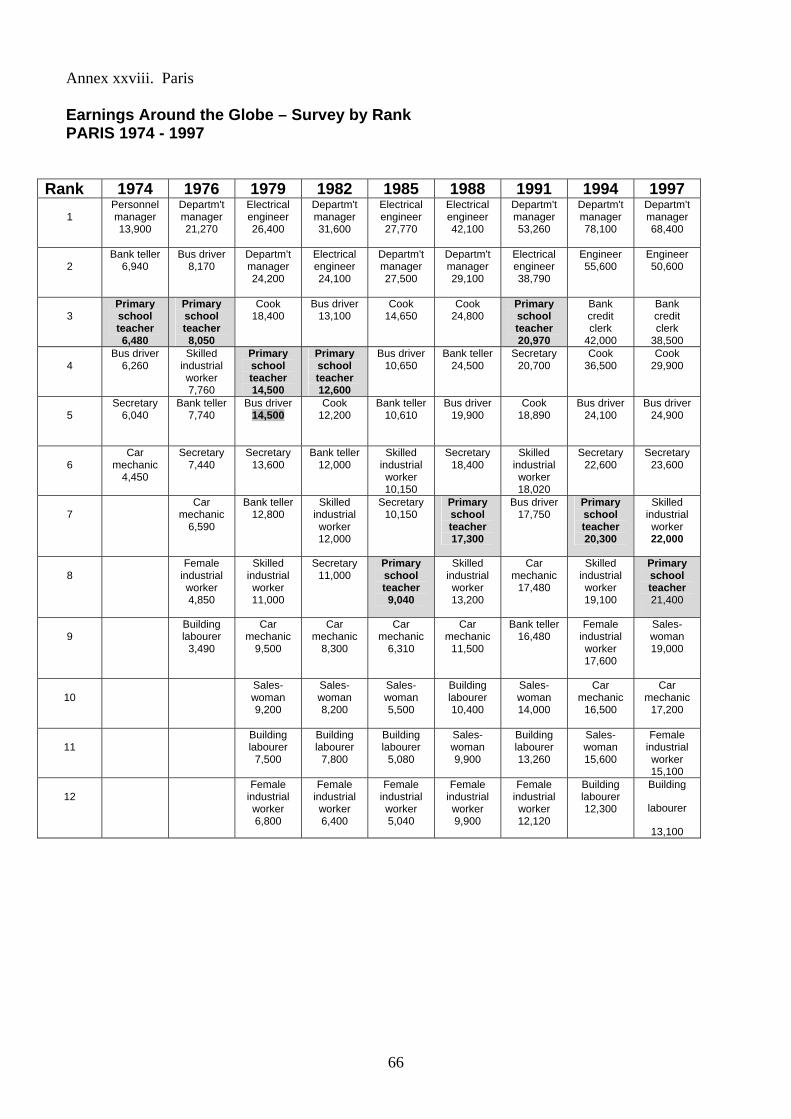
66
Annex xxviii. Paris Earnings Around the Globe – Survey by Rank PARIS 1974 - 1997
Rank 1974 1976 1979 1982 1985 1988 1991 1994 1997
1
Personnel manager 13,900
Departm't manager 21,270
Electrical engineer 26,400
Departm't manager 31,600
Electrical engineer 27,770
Electrical engineer 42,100
Departm't manager 53,260
Departm't manager 78,100
Departm't manager 68,400
2
Bank teller 6,940
Bus driver 8,170
Departm't manager 24,200
Electrical engineer 24,100
Departm't manager 27,500
Departm't manager 29,100
Electrical engineer 38,790
Engineer 55,600
Engineer 50,600
3
Primary school teacher 6,480
Primary school teacher 8,050
Cook 18,400
Bus driver 13,100
Cook 14,650
Cook 24,800
Primary school teacher 20,970
Bank credit clerk
42,000
Bank credit clerk
38,500
4 Bus driver
6,260 Skilled
industrial worker 7,760
Primary school teacher 14,500
Primary school teacher 12,600
Bus driver 10,650
Bank teller 24,500
Secretary 20,700
Cook 36,500
Cook 29,900
5
Secretary 6,040
Bank teller 7,740
Bus driver 14,500
Cook 12,200
Bank teller 10,610
Bus driver 19,900
Cook 18,890
Bus driver 24,100
Bus driver 24,900
6
Car mechanic
4,450
Secretary 7,440
Secretary 13,600
Bank teller 12,000
Skilled industrial worker 10,150
Secretary 18,400
Skilled industrial worker 18,020
Secretary 22,600
Secretary 23,600
7
Car mechanic
6,590
Bank teller 12,800
Skilled industrial worker 12,000
Secretary 10,150
Primary school teacher 17,300
Bus driver 17,750
Primary school teacher 20,300
Skilled industrial worker 22,000
8
Female industrial worker 4,850
Skilled industrial worker 11,000
Secretary 11,000
Primary school teacher 9,040
Skilled industrial worker 13,200
Car mechanic
17,480
Skilled industrial worker 19,100
Primary school teacher 21,400
9
Building labourer
3,490
Car mechanic
9,500
Car mechanic
8,300
Car mechanic
6,310
Car mechanic
11,500
Bank teller 16,480
Female industrial worker 17,600
Sales-woman 19,000
10 Sales-
woman 9,200
Sales-woman 8,200
Sales-woman 5,500
Building labourer 10,400
Sales-woman 14,000
Car mechanic
16,500
Car mechanic
17,200
11
Building labourer
7,500
Building labourer
7,800
Building labourer
5,080
Sales-woman 9,900
Building labourer 13,260
Sales-woman 15,600
Female industrial worker 15,100
12
Female industrial worker 6,800
Female industrial worker 6,400
Female industrial worker 5,040
Female industrial worker 9,900
Female industrial worker 12,120
Building labourer 12,300
Building
labourer
13,100
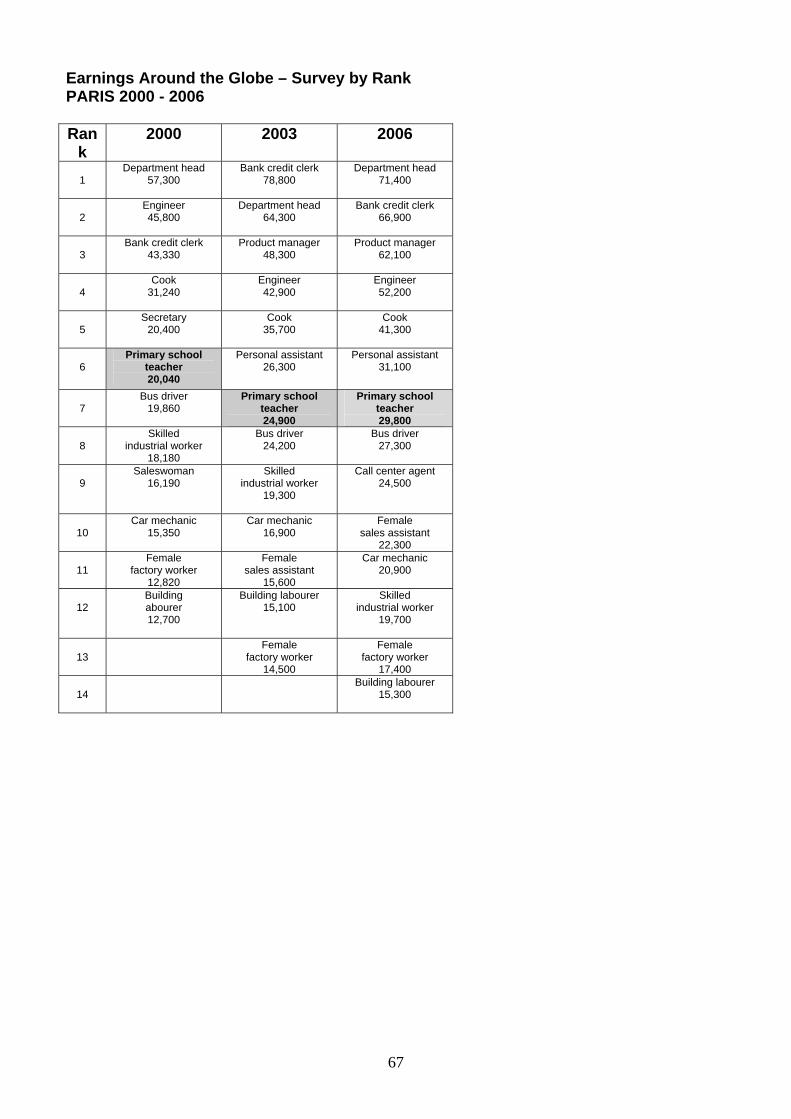
67
Earnings Around the Globe – Survey by Rank PARIS 2000 - 2006 Ran
k 2000 2003 2006
1
Department head 57,300
Bank credit clerk 78,800
Department head 71,400
2 Engineer 45,800
Department head 64,300
Bank credit clerk 66,900
3 Bank credit clerk
43,330
Product manager 48,300
Product manager 62,100
4 Cook
31,240
Engineer 42,900
Engineer 52,200
5
Secretary 20,400
Cook 35,700
Cook 41,300
6
Primary school teacher 20,040
Personal assistant 26,300
Personal assistant 31,100
7
Bus driver 19,860
Primary school teacher 24,900
Primary school teacher 29,800
8
Skilled industrial worker
18,180
Bus driver 24,200
Bus driver 27,300
9 Saleswoman
16,190 Skilled
industrial worker 19,300
Call center agent 24,500
10
Car mechanic 15,350
Car mechanic 16,900
Female sales assistant
22,300
11 Female
factory worker 12,820
Female sales assistant
15,600
Car mechanic 20,900
12
Building abourer 12,700
Building labourer 15,100
Skilled industrial worker
19,700
13
Female factory worker
14,500
Female factory worker
17,400
14
Building labourer 15,300
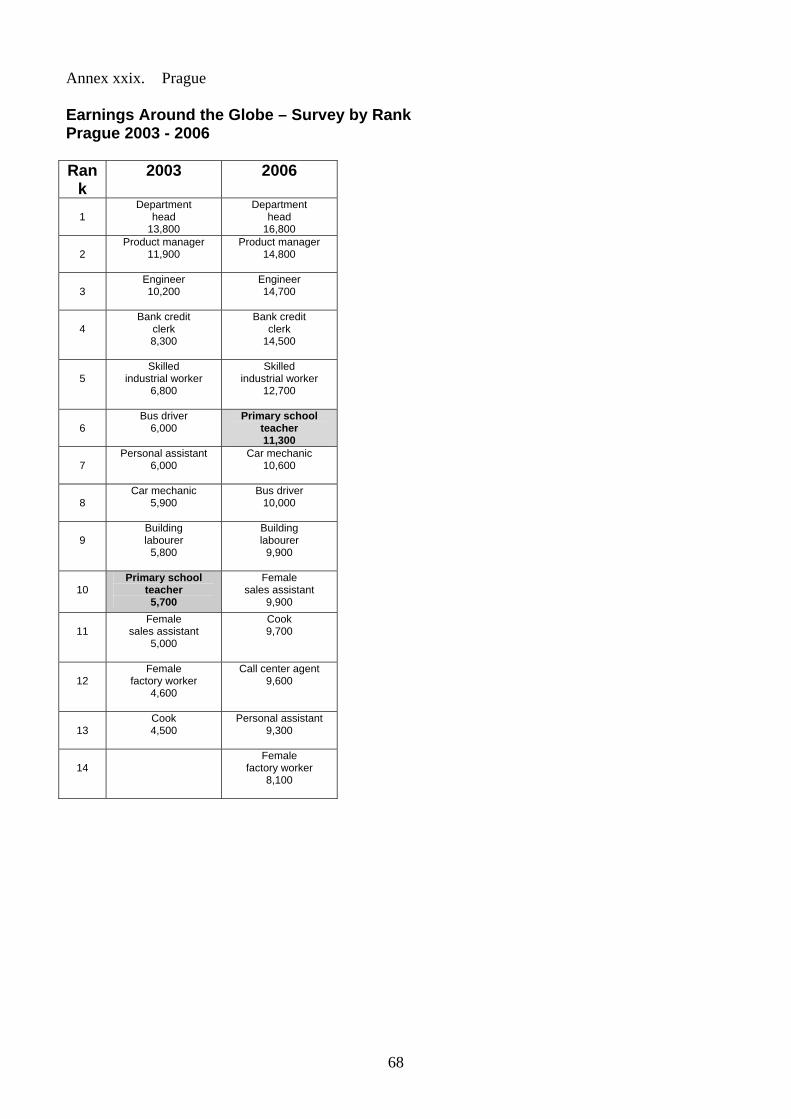
68
Annex xxix. Prague Earnings Around the Globe – Survey by Rank Prague 2003 - 2006 Ran
k 2003 2006
1
Department head
13,800
Department head
16,800
2 Product manager
11,900
Product manager 14,800
3 Engineer 10,200
Engineer 14,700
4 Bank credit
clerk 8,300
Bank credit clerk
14,500
5
Skilled industrial worker
6,800
Skilled industrial worker
12,700
6
Bus driver 6,000
Primary school teacher 11,300
7
Personal assistant 6,000
Car mechanic 10,600
8 Car mechanic
5,900
Bus driver 10,000
9 Building labourer
5,800
Building labourer
9,900
10
Primary school teacher 5,700
Female sales assistant
9,900
11 Female
sales assistant 5,000
Cook 9,700
12
Female factory worker
4,600
Call center agent 9,600
13
Cook 4,500
Personal assistant 9,300
14
Female factory worker
8,100
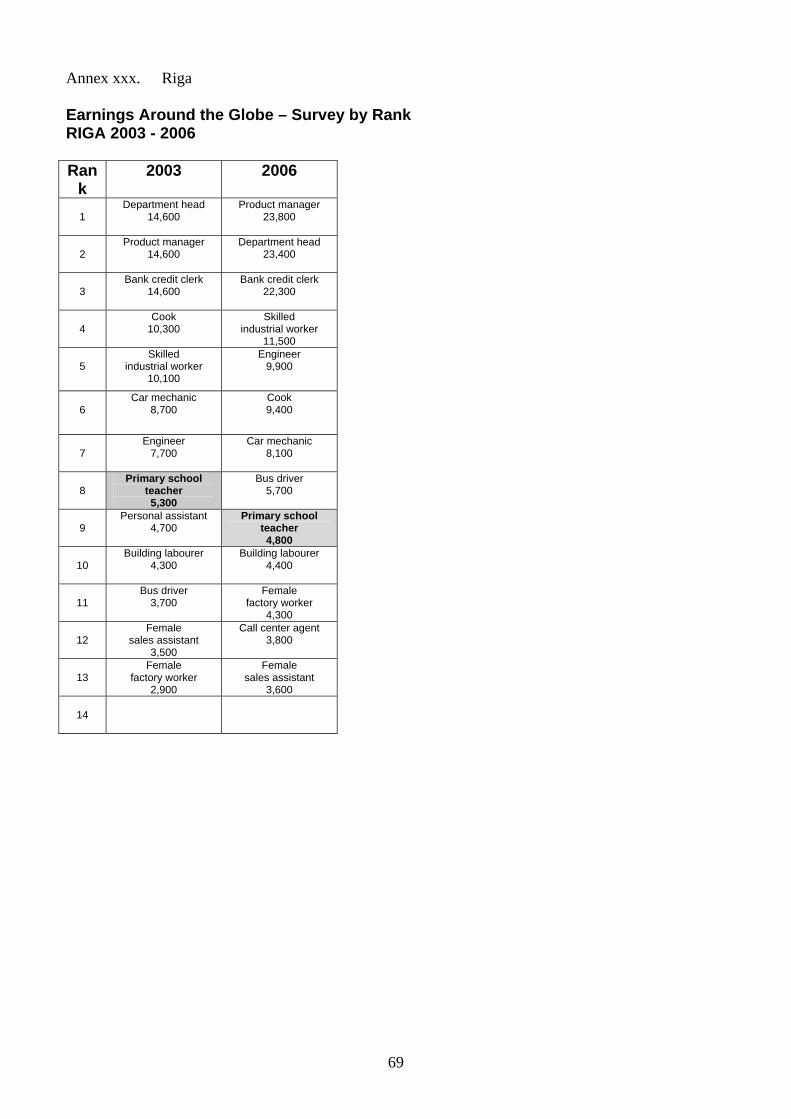
69
Annex xxx. Riga Earnings Around the Globe – Survey by Rank RIGA 2003 - 2006 Ran
k 2003 2006
1
Department head 14,600
Product manager 23,800
2 Product manager
14,600
Department head 23,400
3
Bank credit clerk 14,600
Bank credit clerk 22,300
4 Cook
10,300
Skilled industrial worker
11,500
5
Skilled industrial worker
10,100
Engineer 9,900
6 Car mechanic
8,700
Cook 9,400
7 Engineer
7,700
Car mechanic 8,100
8 Primary school
teacher 5,300
Bus driver 5,700
9 Personal assistant
4,700 Primary school
teacher 4,800
10
Building labourer 4,300
Building labourer 4,400
11 Bus driver
3,700
Female factory worker
4,300
12
Female sales assistant
3,500
Call center agent 3,800
13
Female factory worker
2,900
Female sales assistant
3,600
14
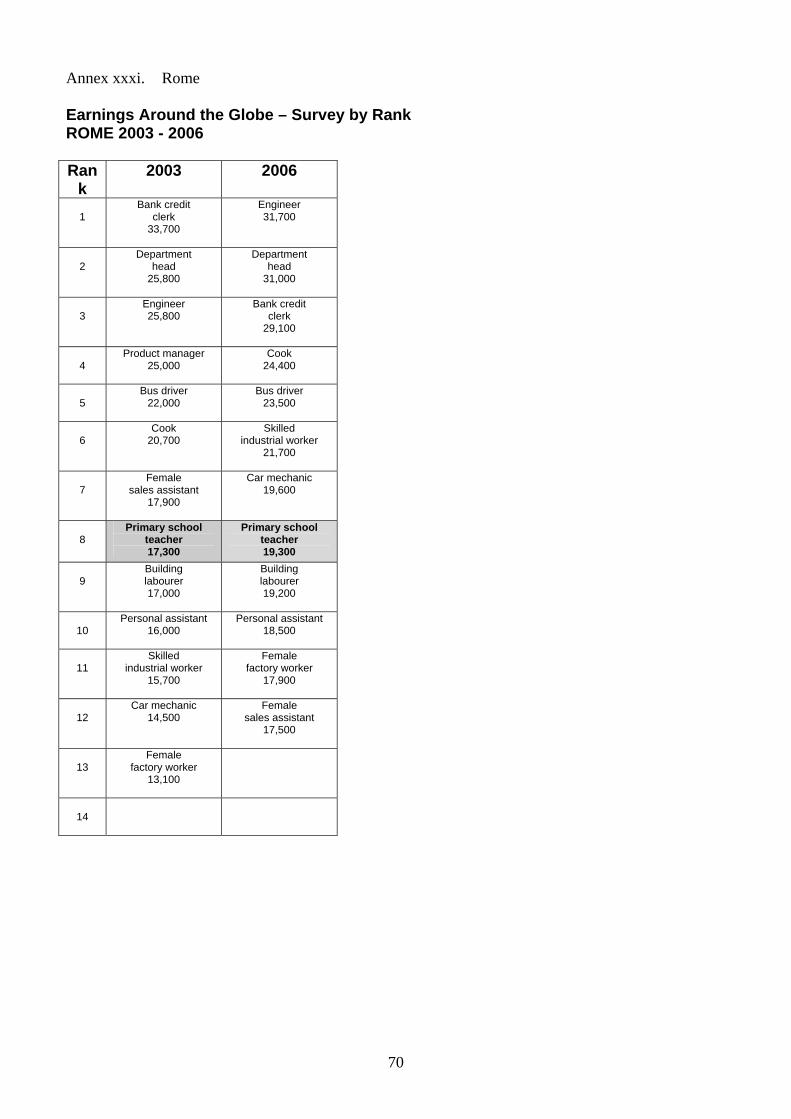
70
Annex xxxi. Rome Earnings Around the Globe – Survey by Rank ROME 2003 - 2006 Ran
k 2003 2006
1
Bank credit clerk
33,700
Engineer 31,700
2
Department head
25,800
Department head
31,000
3
Engineer 25,800
Bank credit clerk
29,100
4
Product manager 25,000
Cook 24,400
5 Bus driver
22,000
Bus driver 23,500
6
Cook 20,700
Skilled industrial worker
21,700
7
Female sales assistant
17,900
Car mechanic 19,600
8
Primary school teacher 17,300
Primary school teacher 19,300
9
Building labourer 17,000
Building labourer 19,200
10 Personal assistant
16,000
Personal assistant 18,500
11 Skilled
industrial worker 15,700
Female factory worker
17,900
12
Car mechanic 14,500
Female sales assistant
17,500
13
Female factory worker
13,100
14
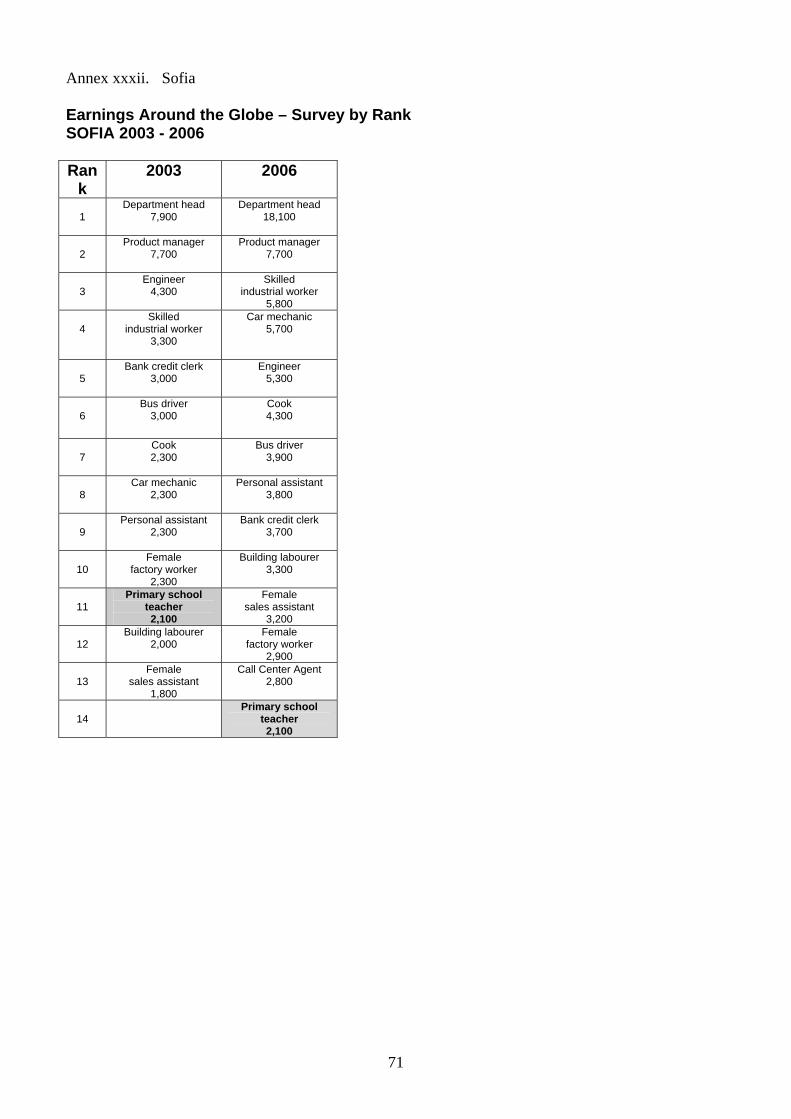
71
Annex xxxii. Sofia Earnings Around the Globe – Survey by Rank SOFIA 2003 - 2006 Ran
k 2003 2006
1
Department head 7,900
Department head 18,100
2
Product manager 7,700
Product manager 7,700
3 Engineer
4,300
Skilled industrial worker
5,800
4 Skilled
industrial worker 3,300
Car mechanic 5,700
5
Bank credit clerk 3,000
Engineer 5,300
6 Bus driver
3,000
Cook 4,300
7 Cook 2,300
Bus driver 3,900
8 Car mechanic
2,300
Personal assistant 3,800
9
Personal assistant 2,300
Bank credit clerk 3,700
10 Female
factory worker 2,300
Building labourer 3,300
11 Primary school
teacher 2,100
Female sales assistant
3,200
12
Building labourer 2,000
Female factory worker
2,900
13
Female sales assistant
1,800
Call Center Agent 2,800
14
Primary school teacher 2,100
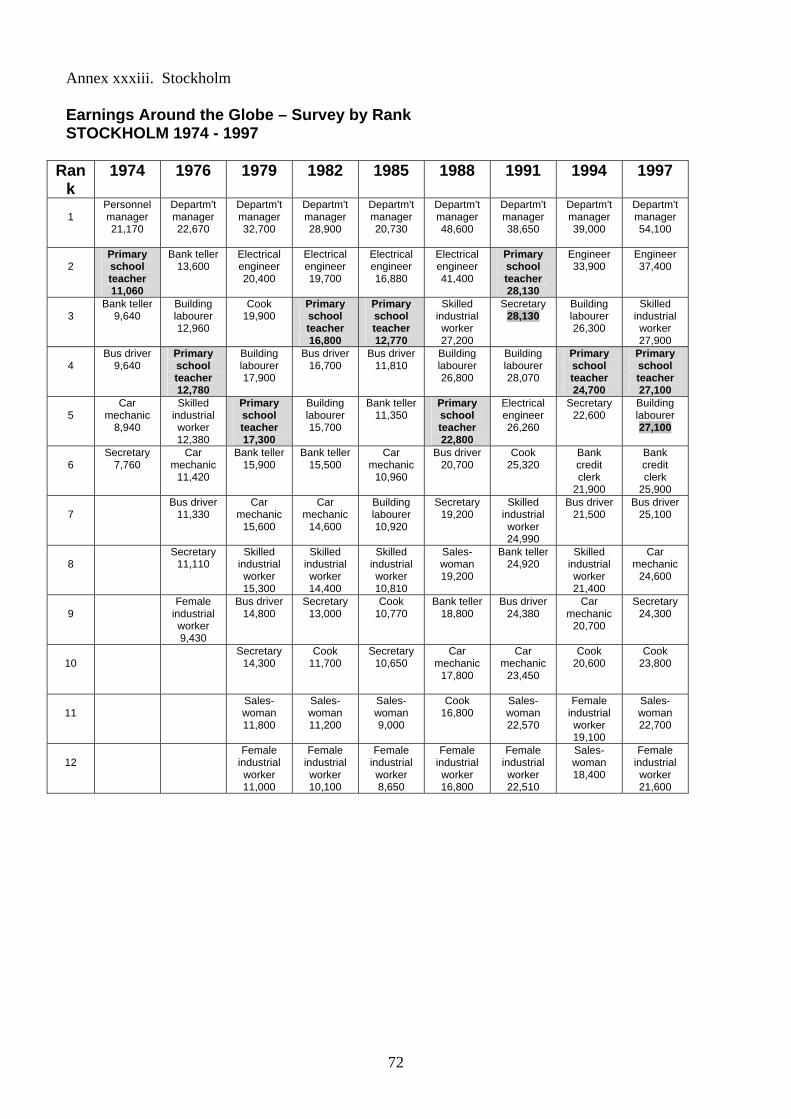
72
Annex xxxiii. Stockholm Earnings Around the Globe – Survey by Rank STOCKHOLM 1974 - 1997
Rank
1974 1976 1979 1982 1985 1988 1991 1994 1997
1
Personnel manager 21,170
Departm't manager 22,670
Departm't manager 32,700
Departm't manager 28,900
Departm't manager 20,730
Departm't manager 48,600
Departm't manager 38,650
Departm't manager 39,000
Departm't manager 54,100
2
Primary school teacher 11,060
Bank teller 13,600
Electrical engineer 20,400
Electrical engineer 19,700
Electrical engineer 16,880
Electrical engineer 41,400
Primary school teacher 28,130
Engineer 33,900
Engineer 37,400
3
Bank teller 9,640
Building labourer 12,960
Cook 19,900
Primary school teacher 16,800
Primary school teacher 12,770
Skilled industrial worker 27,200
Secretary 28,130
Building labourer 26,300
Skilled industrial worker 27,900
4
Bus driver 9,640
Primary school teacher 12,780
Building labourer 17,900
Bus driver 16,700
Bus driver 11,810
Building labourer 26,800
Building labourer 28,070
Primary school teacher 24,700
Primary school teacher 27,100
5
Car mechanic
8,940
Skilled industrial worker 12,380
Primary school teacher 17,300
Building labourer 15,700
Bank teller 11,350
Primary school teacher 22,800
Electrical engineer 26,260
Secretary 22,600
Building labourer 27,100
6
Secretary 7,760
Car mechanic
11,420
Bank teller 15,900
Bank teller 15,500
Car mechanic
10,960
Bus driver 20,700
Cook 25,320
Bank credit clerk
21,900
Bank credit clerk
25,900
7 Bus driver
11,330
Car mechanic
15,600
Car mechanic
14,600
Building labourer 10,920
Secretary 19,200
Skilled industrial worker 24,990
Bus driver 21,500
Bus driver 25,100
8
Secretary 11,110
Skilled industrial worker 15,300
Skilled industrial worker 14,400
Skilled industrial worker 10,810
Sales-woman 19,200
Bank teller 24,920
Skilled industrial worker 21,400
Car mechanic
24,600
9
Female industrial worker 9,430
Bus driver 14,800
Secretary 13,000
Cook 10,770
Bank teller 18,800
Bus driver 24,380
Car mechanic
20,700
Secretary 24,300
10
Secretary 14,300
Cook 11,700
Secretary 10,650
Car mechanic
17,800
Car mechanic
23,450
Cook 20,600
Cook 23,800
11
Sales-woman 11,800
Sales-woman 11,200
Sales-woman 9,000
Cook 16,800
Sales-woman 22,570
Female industrial worker 19,100
Sales-woman 22,700
12
Female industrial worker 11,000
Female industrial worker 10,100
Female industrial worker 8,650
Female industrial worker 16,800
Female industrial worker 22,510
Sales-woman 18,400
Female industrial worker 21,600
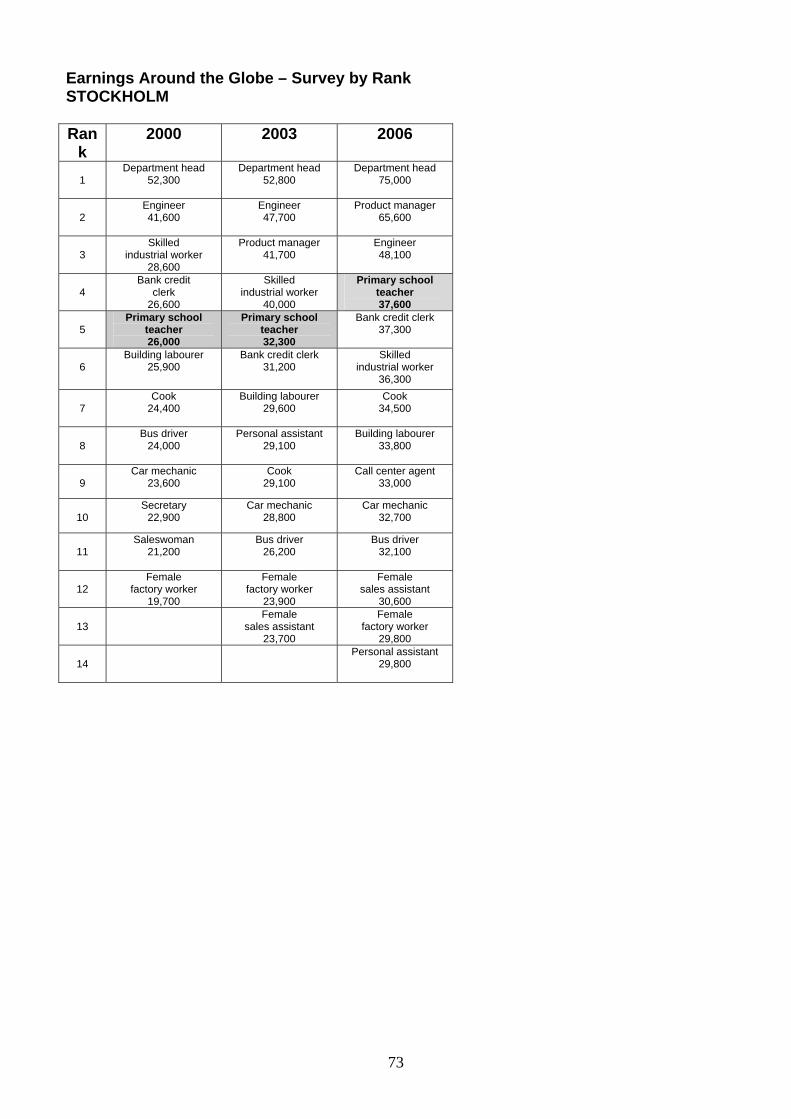
73
Earnings Around the Globe – Survey by Rank STOCKHOLM Ran
k 2000 2003 2006
1
Department head 52,300
Department head 52,800
Department head 75,000
2
Engineer 41,600
Engineer 47,700
Product manager 65,600
3 Skilled
industrial worker 28,600
Product manager 41,700
Engineer 48,100
4 Bank credit
clerk 26,600
Skilled industrial worker
40,000
Primary school teacher 37,600
5
Primary school teacher 26,000
Primary school teacher 32,300
Bank credit clerk 37,300
6
Building labourer 25,900
Bank credit clerk 31,200
Skilled industrial worker
36,300
7 Cook
24,400 Building labourer
29,600
Cook 34,500
8
Bus driver 24,000
Personal assistant 29,100
Building labourer 33,800
9 Car mechanic
23,600 Cook
29,100 Call center agent
33,000
10
Secretary 22,900
Car mechanic 28,800
Car mechanic 32,700
11
Saleswoman 21,200
Bus driver 26,200
Bus driver 32,100
12
Female factory worker
19,700
Female factory worker
23,900
Female sales assistant
30,600
13
Female sales assistant
23,700
Female factory worker
29,800
14
Personal assistant 29,800
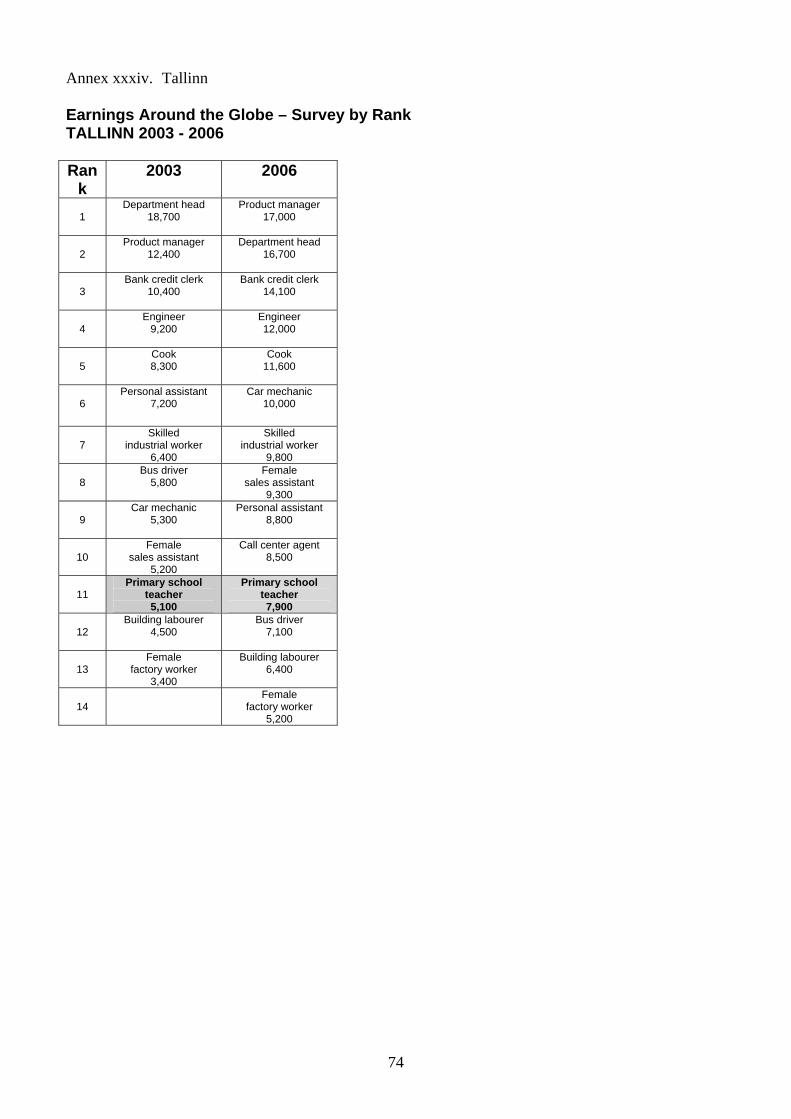
74
Annex xxxiv. Tallinn Earnings Around the Globe – Survey by Rank TALLINN 2003 - 2006 Ran
k 2003 2006
1
Department head 18,700
Product manager 17,000
2 Product manager
12,400
Department head 16,700
3
Bank credit clerk 10,400
Bank credit clerk 14,100
4 Engineer
9,200
Engineer 12,000
5
Cook 8,300
Cook 11,600
6
Personal assistant 7,200
Car mechanic 10,000
7 Skilled
industrial worker 6,400
Skilled industrial worker
9,800
8 Bus driver
5,800
Female sales assistant
9,300
9 Car mechanic
5,300
Personal assistant 8,800
10
Female sales assistant
5,200
Call center agent 8,500
11
Primary school teacher 5,100
Primary school teacher 7,900
12
Building labourer 4,500
Bus driver 7,100
13
Female factory worker
3,400
Building labourer 6,400
14
Female factory worker
5,200
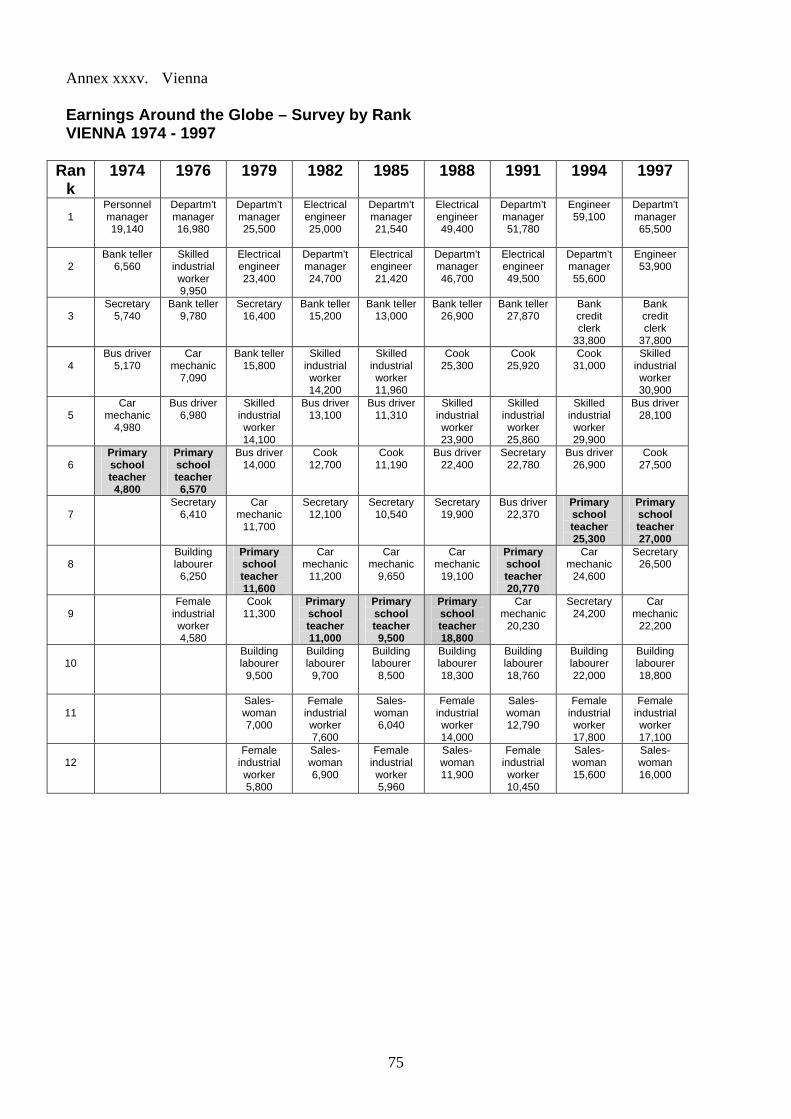
75
Annex xxxv. Vienna Earnings Around the Globe – Survey by Rank VIENNA 1974 - 1997
Rank
1974 1976 1979 1982 1985 1988 1991 1994 1997
1
Personnel manager 19,140
Departm't manager 16,980
Departm't manager 25,500
Electrical engineer 25,000
Departm't manager 21,540
Electrical engineer 49,400
Departm't manager 51,780
Engineer 59,100
Departm't manager 65,500
2
Bank teller 6,560
Skilled industrial worker 9,950
Electrical engineer 23,400
Departm't manager 24,700
Electrical engineer 21,420
Departm't manager 46,700
Electrical engineer 49,500
Departm't manager 55,600
Engineer 53,900
3
Secretary 5,740
Bank teller 9,780
Secretary 16,400
Bank teller 15,200
Bank teller 13,000
Bank teller 26,900
Bank teller 27,870
Bank credit clerk
33,800
Bank credit clerk
37,800
4 Bus driver
5,170 Car
mechanic 7,090
Bank teller 15,800
Skilled industrial worker 14,200
Skilled industrial worker 11,960
Cook 25,300
Cook 25,920
Cook 31,000
Skilled industrial worker 30,900
5
Car mechanic
4,980
Bus driver 6,980
Skilled industrial worker 14,100
Bus driver 13,100
Bus driver 11,310
Skilled industrial worker 23,900
Skilled industrial worker 25,860
Skilled industrial worker 29,900
Bus driver 28,100
6
Primary school teacher 4,800
Primary school teacher 6,570
Bus driver 14,000
Cook 12,700
Cook 11,190
Bus driver 22,400
Secretary 22,780
Bus driver 26,900
Cook 27,500
7
Secretary 6,410
Car mechanic
11,700
Secretary 12,100
Secretary 10,540
Secretary 19,900
Bus driver 22,370
Primary school teacher 25,300
Primary school teacher 27,000
8
Building labourer
6,250
Primary school teacher 11,600
Car mechanic
11,200
Car mechanic
9,650
Car mechanic
19,100
Primary school teacher 20,770
Car mechanic
24,600
Secretary 26,500
9
Female industrial worker 4,580
Cook 11,300
Primary school teacher 11,000
Primary school teacher 9,500
Primary school teacher 18,800
Car mechanic
20,230
Secretary 24,200
Car mechanic
22,200
10
Building labourer
9,500
Building labourer
9,700
Building labourer
8,500
Building labourer 18,300
Building labourer 18,760
Building labourer 22,000
Building labourer 18,800
11
Sales-woman 7,000
Female industrial worker 7,600
Sales-woman 6,040
Female industrial worker 14,000
Sales-woman 12,790
Female industrial worker 17,800
Female industrial worker 17,100
12
Female industrial worker 5,800
Sales-woman 6,900
Female industrial worker 5,960
Sales-woman 11,900
Female industrial worker 10,450
Sales-woman 15,600
Sales-woman 16,000
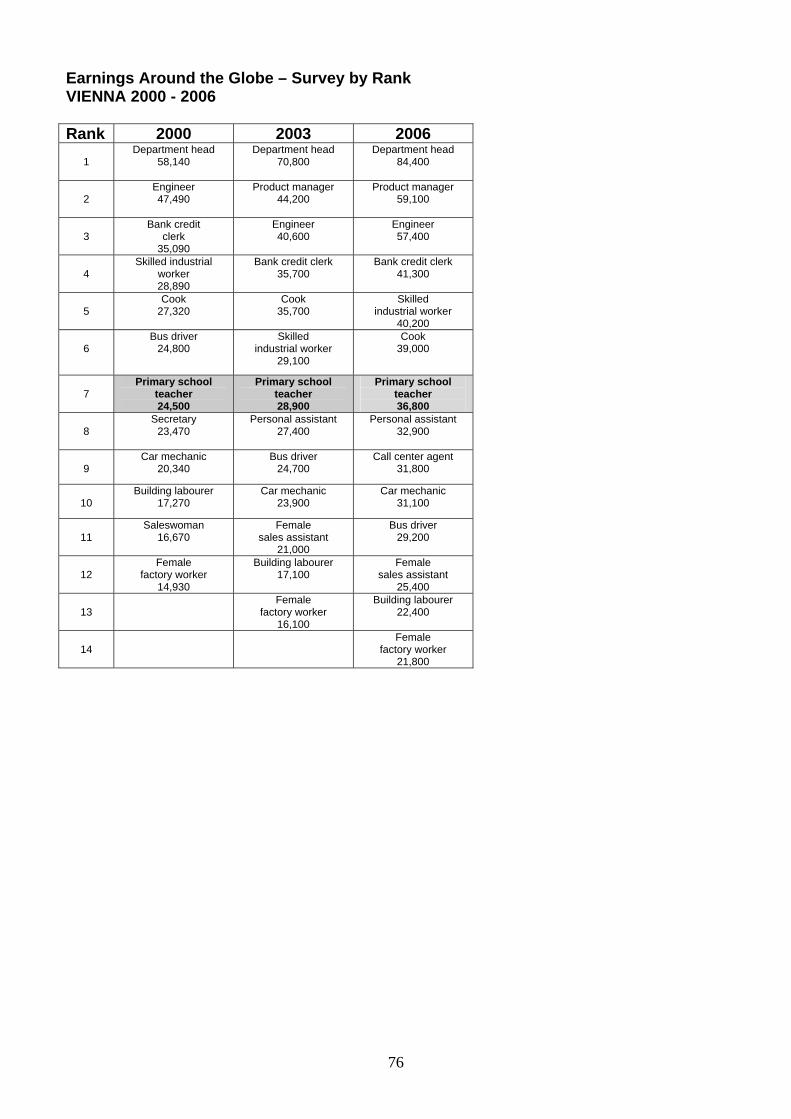
76
Earnings Around the Globe – Survey by Rank VIENNA 2000 - 2006 Rank 2000 2003 2006
1
Department head 58,140
Department head 70,800
Department head 84,400
2
Engineer 47,490
Product manager 44,200
Product manager 59,100
3 Bank credit
clerk 35,090
Engineer 40,600
Engineer 57,400
4 Skilled industrial
worker 28,890
Bank credit clerk 35,700
Bank credit clerk 41,300
5
Cook 27,320
Cook 35,700
Skilled industrial worker
40,200
6 Bus driver
24,800
Skilled industrial worker
29,100
Cook 39,000
7
Primary school teacher 24,500
Primary school teacher 28,900
Primary school teacher 36,800
8
Secretary 23,470
Personal assistant 27,400
Personal assistant 32,900
9 Car mechanic
20,340 Bus driver
24,700 Call center agent
31,800
10
Building labourer 17,270
Car mechanic 23,900
Car mechanic 31,100
11
Saleswoman 16,670
Female sales assistant
21,000
Bus driver 29,200
12
Female factory worker
14,930
Building labourer 17,100
Female sales assistant
25,400
13
Female factory worker
16,100
Building labourer 22,400
14
Female factory worker
21,800
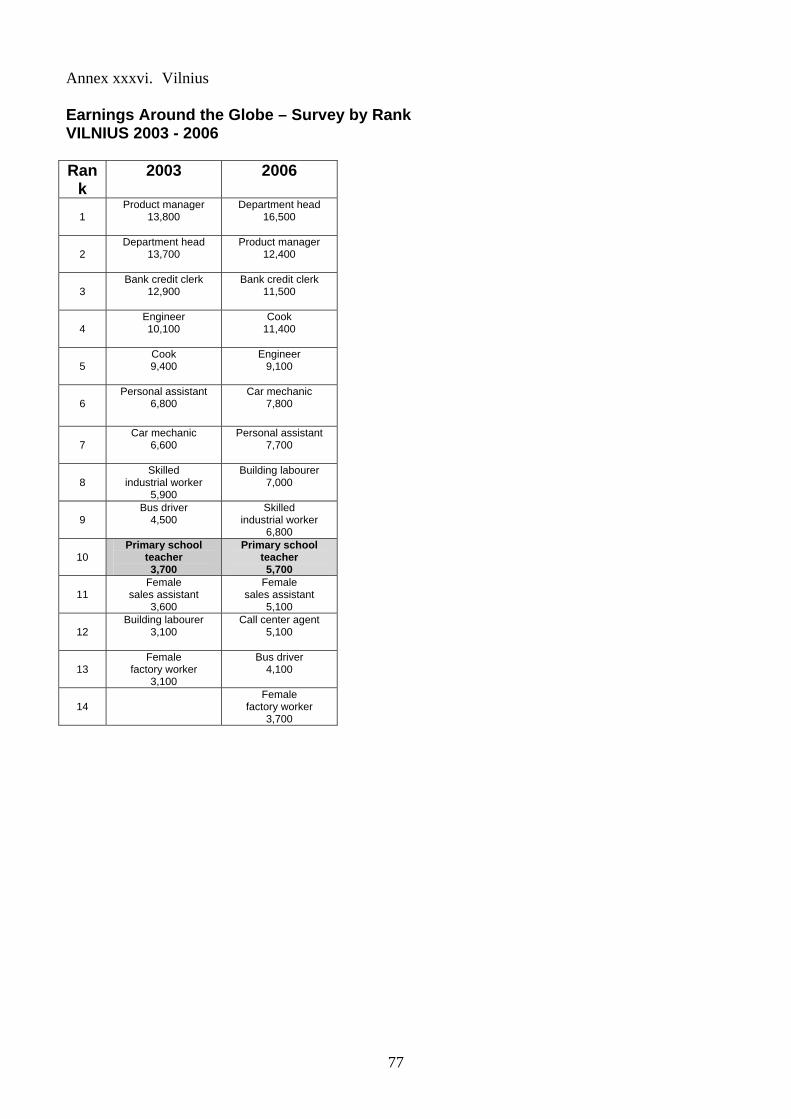
77
Annex xxxvi. Vilnius Earnings Around the Globe – Survey by Rank VILNIUS 2003 - 2006 Ran
k 2003 2006
1
Product manager 13,800
Department head 16,500
2 Department head
13,700
Product manager 12,400
3 Bank credit clerk
12,900
Bank credit clerk 11,500
4 Engineer 10,100
Cook 11,400
5
Cook 9,400
Engineer 9,100
6 Personal assistant
6,800
Car mechanic 7,800
7 Car mechanic
6,600
Personal assistant 7,700
8 Skilled
industrial worker 5,900
Building labourer 7,000
9 Bus driver
4,500
Skilled industrial worker
6,800
10 Primary school
teacher 3,700
Primary school teacher 5,700
11
Female sales assistant
3,600
Female sales assistant
5,100
12
Building labourer 3,100
Call center agent 5,100
13
Female factory worker
3,100
Bus driver 4,100
14
Female factory worker
3,700
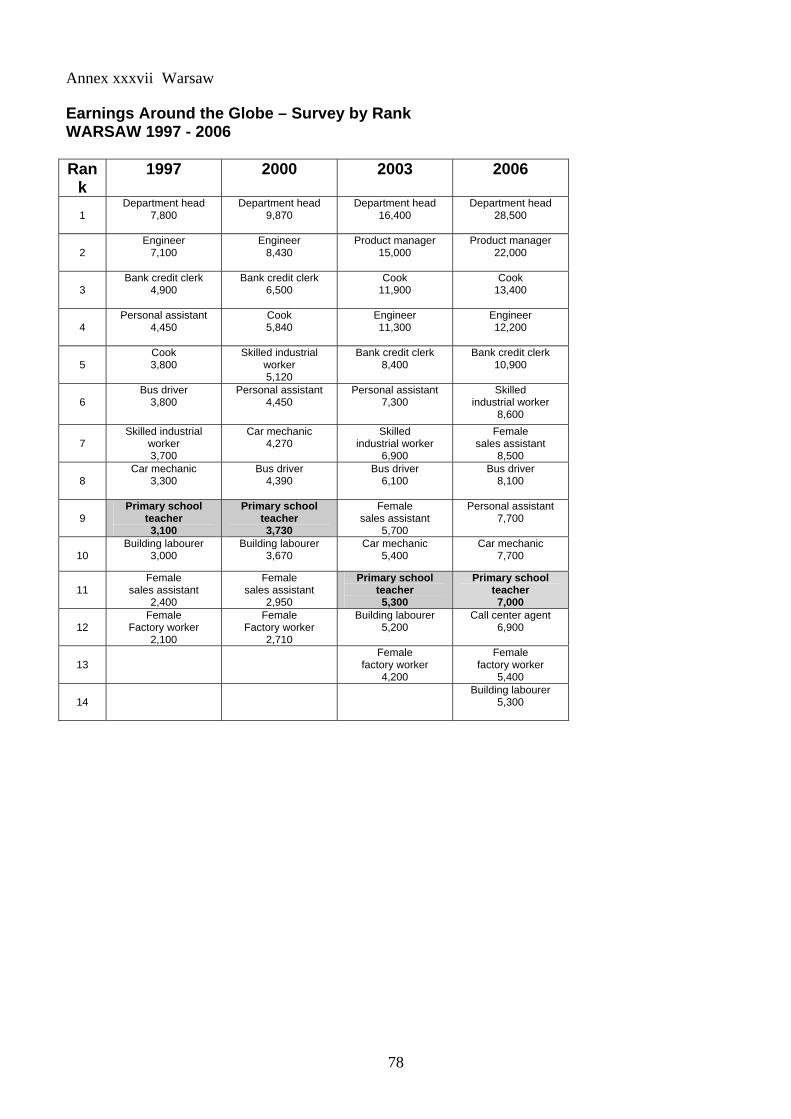
78
Annex xxxvii Warsaw Earnings Around the Globe – Survey by Rank WARSAW 1997 - 2006 Ran
k 1997 2000 2003 2006
1
Department head 7,800
Department head 9,870
Department head 16,400
Department head 28,500
2
Engineer 7,100
Engineer 8,430
Product manager 15,000
Product manager 22,000
3
Bank credit clerk 4,900
Bank credit clerk 6,500
Cook 11,900
Cook 13,400
4
Personal assistant 4,450
Cook 5,840
Engineer 11,300
Engineer 12,200
5
Cook 3,800
Skilled industrial worker 5,120
Bank credit clerk 8,400
Bank credit clerk 10,900
6
Bus driver 3,800
Personal assistant 4,450
Personal assistant 7,300
Skilled industrial worker
8,600
7 Skilled industrial
worker 3,700
Car mechanic 4,270
Skilled industrial worker
6,900
Female sales assistant
8,500
8 Car mechanic
3,300
Bus driver 4,390
Bus driver 6,100
Bus driver 8,100
9
Primary school teacher 3,100
Primary school teacher 3,730
Female sales assistant
5,700
Personal assistant 7,700
10
Building labourer 3,000
Building labourer 3,670
Car mechanic 5,400
Car mechanic 7,700
11
Female sales assistant
2,400
Female sales assistant
2,950
Primary school teacher 5,300
Primary school teacher 7,000
12
Female Factory worker
2,100
Female Factory worker
2,710
Building labourer 5,200
Call center agent 6,900
13
Female factory worker
4,200
Female factory worker
5,400
14
Building labourer 5,300
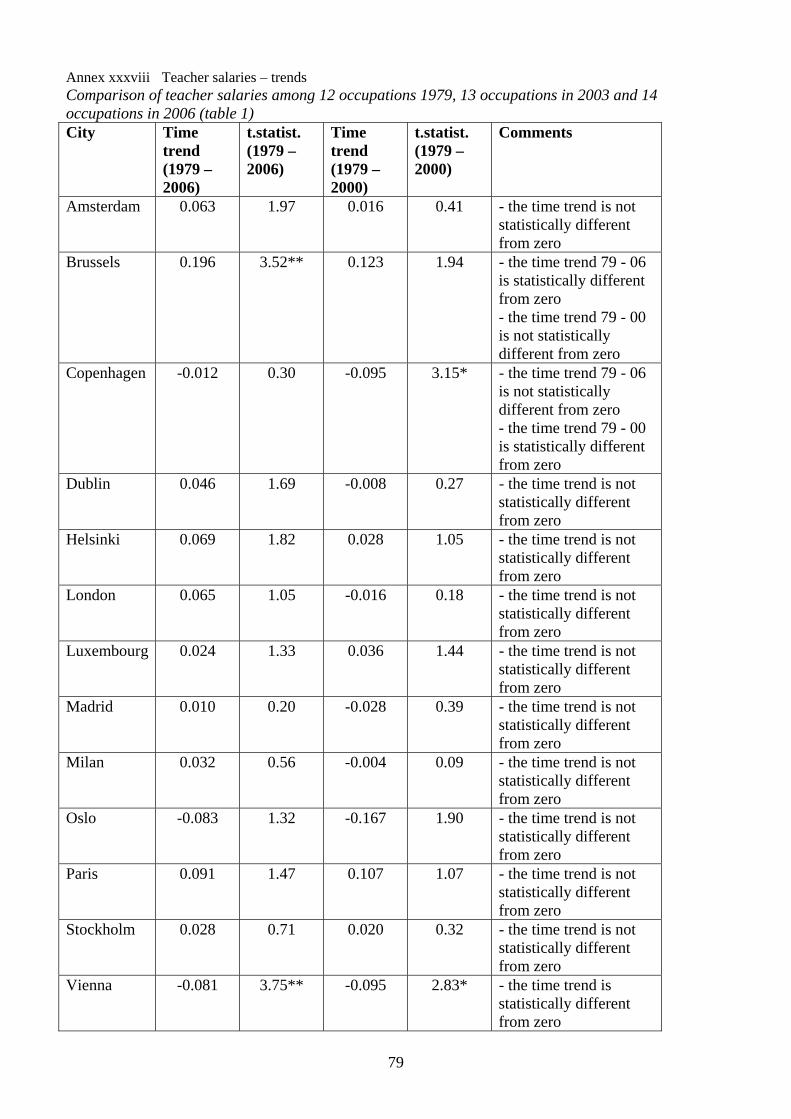
79
Annex xxxviii Teacher salaries – trends Comparison of teacher salaries among 12 occupations 1979, 13 occupations in 2003 and 14 occupations in 2006 (table 1) City Time
trend (1979 – 2006)
t.statist. (1979 – 2006)
Time trend (1979 – 2000)
t.statist. (1979 – 2000)
Comments
Amsterdam 0.063 1.97 0.016 0.41 - the time trend is not statistically different from zero
Brussels 0.196 3.52** 0.123 1.94 - the time trend 79 - 06 is statistically different from zero - the time trend 79 - 00 is not statistically different from zero
Copenhagen -0.012 0.30 -0.095 3.15* - the time trend 79 - 06 is not statistically different from zero - the time trend 79 - 00 is statistically different from zero
Dublin 0.046 1.69 -0.008 0.27 - the time trend is not statistically different from zero
Helsinki 0.069 1.82 0.028 1.05 - the time trend is not statistically different from zero
London 0.065 1.05 -0.016 0.18 - the time trend is not statistically different from zero
Luxembourg 0.024 1.33 0.036 1.44 - the time trend is not statistically different from zero
Madrid 0.010 0.20 -0.028 0.39 - the time trend is not statistically different from zero
Milan 0.032 0.56 -0.004 0.09 - the time trend is not statistically different from zero
Oslo -0.083 1.32 -0.167 1.90 - the time trend is not statistically different from zero
Paris 0.091 1.47 0.107 1.07 - the time trend is not statistically different from zero
Stockholm 0.028 0.71 0.020 0.32 - the time trend is not statistically different from zero
Vienna -0.081 3.75** -0.095 2.83* - the time trend is statistically different from zero
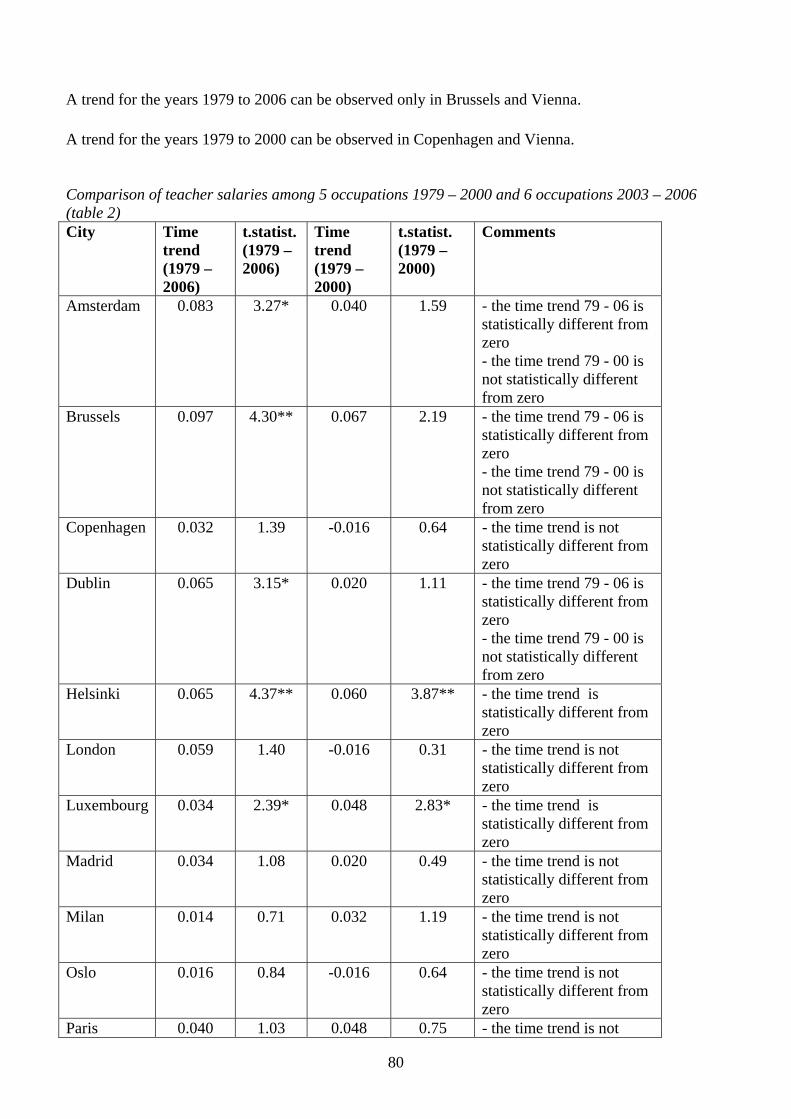
80
A trend for the years 1979 to 2006 can be observed only in Brussels and Vienna. A trend for the years 1979 to 2000 can be observed in Copenhagen and Vienna. Comparison of teacher salaries among 5 occupations 1979 – 2000 and 6 occupations 2003 – 2006 (table 2) City Time
trend (1979 – 2006)
t.statist. (1979 – 2006)
Time trend (1979 – 2000)
t.statist. (1979 – 2000)
Comments
Amsterdam 0.083 3.27* 0.040 1.59 - the time trend 79 - 06 is statistically different from zero - the time trend 79 - 00 is not statistically different from zero
Brussels 0.097 4.30** 0.067 2.19 - the time trend 79 - 06 is statistically different from zero - the time trend 79 - 00 is not statistically different from zero
Copenhagen 0.032 1.39 -0.016 0.64 - the time trend is not statistically different from zero
Dublin 0.065 3.15* 0.020 1.11 - the time trend 79 - 06 is statistically different from zero - the time trend 79 - 00 is not statistically different from zero
Helsinki 0.065 4.37** 0.060 3.87** - the time trend is statistically different from zero
London 0.059 1.40 -0.016 0.31 - the time trend is not statistically different from zero
Luxembourg 0.034 2.39* 0.048 2.83* - the time trend is statistically different from zero
Madrid 0.034 1.08 0.020 0.49 - the time trend is not statistically different from zero
Milan 0.014 0.71 0.032 1.19 - the time trend is not statistically different from zero
Oslo 0.016 0.84 -0.016 0.64 - the time trend is not statistically different from zero
Paris 0.040 1.03 0.048 0.75 - the time trend is not

81
statistically different from zero
Stockholm 0.069 2.39* 0.067 1.58 - the time trend is not statistically different from zero
Vienna 0.000 . 0.000 . - the time trend is not statistically different from zero
A trend for the years 1979 to 2006 can be observed in Amsterdam, Brussels, Dublin, Helsinki, Luxembourg and Stockholm. A trend for the years 1979 to 2000 can be observed in Helsinki and Luxembourg.
82
References American Federation of Teachers (1993) How U.S Teachers Measure Up Internationally. A Comparative Study of Teacher Pay, Training and Conditions of Service.Washington: American Federation of Teachers
Döbrich P. (1981) Employment and Conditions of Work of Teachers, Amsterdam: GEW /IFFTU 1981
Döbrich P., Kodron C., Kolbe M. (1976) Teachers’ salaries in international comparison. Frankfurt: Deutsches Institut für Internationale Pädagogische Forschung
EFA Global Monitoring Report Team (2002) EFA Global Monitoring Report 2002: Education for All – Is the World on Track? Paris: UNESCO Publishing
EFA Global Monitoring Report Team (2003) EFA Global Monitoring Report 2003/4: Gender and Education for All – The Leap to Equality. Paris: UNESCO Publishing
EFA Global Monitoring Report Team (2004) EFA Global Monitoring Report 2005: Education for All – The Quality Imperative. Paris: UNESCO Publishing
European Commission (2004) Commission Staff Working Paper Progress Towards the common objectives in Education and Training Indicators and Benchmarks. Brussels: European Commission
European Commission (2005) Commission Staff Working Paper: Progress Towards the common objectives in Education and Training Indicators and Benchmarks. Brussels: European Commission
European Commission (2006) Commission Staff Working Paper: Progress Towards the common objectives in Education and Training Indicators and Benchmarks. Brussels: European Commission
European Commission/Eurydice (1995) Key data on education in Europe. Brussels: European Commission/Eurydice
European Commission/Eurydice (2002) The teaching profession in Europe: Profile, trends and concerns. Report II: Supply and demand. General lower education. Key topics in education. Volume 3, Brussels: European Commission/Eurydice
European Commission/Eurydice/Eurostat (2000) Key data on education in Europe. Brussels: European Commission/Eurydice/Eurostat
European Commission/Eurydice/Eurostat (2005) Key data on education in Europe 2005. Brussels: European Commission/Eurydice/Eurostat
Fredriksson, U. & Edlund, U. (1993) Lärares löner i Sverige och några EG-länder ("Teacher salaries in Sweden and some EU-countries"). Lärarförbundet rapporterar om EG och Europa nr 1 april 1993, Stockholm: Lärarförbundet
GHK (in press) Mobility of Teachers and Trainers. London: GHK
Högskoleverket (2006) Arbetsmarknad och högskoleutbildning 2006. Rapport 2006:28 R, Stockholm: Högskoleverket
ILO/UNESCO (1966) ILO/UNESCO Recommendation concerning the Status of Teachers. Paris: ILO/UNESCO
OECD (1990) The teacher today. Paris: OECD
OECD (1995) Education at a glance. OECD Indicators. Paris: OECD/Centre for Educational Research and Innovation
OECD (2001) Education at a glance. OECD Indicators 2001. Paris: OECD/Centre for Educational Research and Innovation
OECD (2002) Education Policy Analysis. Paris: OECD.
OECD (2003). Education at a Glance, OECD Indicators. Paris: OECD.
OECD (2004) Completing the Foundation for Lifelong Learning. An OECD Survey of Upper Secondary Schools. Paris: OECD
OECD (2005a) Teachers Matter: Attracting, Developing and Retaining Effective Teachers. Paris: OECD
OECD (2005b) Education at a Glance, OECD Indicators. Paris: OECD.
83
OECD/UNESCO Institute for Statistics (2001) Teachers for Tomorrow's Schools: Analysis of the world education indicators. Paris: OECD/UNESCO Institute for Statistics/World Bank
Siniscalco, M. T. (2002) A statistical profile of the teaching profession. Paris: ILO/UNESCO
Union Bank of Switzerland (1974) Prices and Earnings Around the Globe., Zurich: Union Bank of Switzerland
Union Bank of Switzerland (1976) Prices and Earnings Around the Globe. Zurich: Union Bank of Switzerland
Union Bank of Switzerland (1979) Prices and Earnings Around the Globe. Zurich: Union Bank of Switzerland.
Union Bank of Switzerland (1982) Prices and Earnings Around the Globe. Zurich: Union Bank of Switzerland.
Union Bank of Switzerland (1985) Prices and Earnings Around the Globe. Zurich: Union Bank of Switzerland
Union Bank of Switzerland (1988) Prices and Earnings Around the Globe. Zurich: Union Bank of Switzerland
Union Bank of Switzerland (1991) Prices and Earnings Around the Globe. Zurich: Union Bank of Switzerland Union Bank of Switzerland (1994) Prices and Earnings Around the Globe. Zurich: Union Bank of Switzerland Union Bank of Switzerland (1997) Prices and Earnings Around the Globe. Zurich: Union Bank of Switzerland Union Bank of Switzerland (2000) Prices and Earnings Around the Globe. Zurich: Union Bank of Switzerland Union Bank of Switzerland (2003) A comparison of purchasing power around the globe: Prices and Earnings. Zurich: Union Bank of Switzerland
Union Bank of Switzerland (2006) A comparison of purchasing power around the globe: Prices and Earnings. Zurich: Union Bank of Switzerland
UIS (2005) information from UIS database website: http://stats.uis.unesco.org/ReportFolders/ReportFolders.aspx?CS_referer=&CS_ChosenLang=en accessed on 20-11-06
WCOTP (1978), Study on Teachers’ Working Conditions in Europe, Morges: WCOTP
WCOTP (1980), Study on Teachers Working Conditions in Europe, Morges: WCOTP
WCOTP (1986), Study on Teachers Working Conditions in Europe, Morges: WCOTP
WCOTP (1991), Teachers’ salaries, pensions, working time, negotiations, Morges: WCOTP
84
European Commission EUR 22891 – Joint Research Centre Title: Teachers’ salaries in comparison with other occupational groups Author(s): Ulf Fredriksson Luxembourg: Office for Official Publications of the European Communities 2008 – 84 pp. – 21 x 29.70 cm EUR – Scientific and Technical Research series - ISSN 1018-5593 Abstract The purpose of this study is to analyse whether UBS provides internationally comparable information on how teachers' salaries stand in relation to the salaries of other occupational groups. On the basis of an overview of existing international data, UBS is identified as the only source that provides comparable information on teachers' salaries in relations to other occupational groups. This information is contained in Prices and Earnings Around the Globe, a study published every three years by the Union Bank of Switzerland (UBS). This study has been conducted since 1971 and provides, among other things, information on the salaries of a number of professions, among them primary teachers. The data from UBS make it possible to compare teachers’ salaries with those of other occupational groups in twelve cities in the EU, EEA and Candidate Countries during the period 1979 to 2006. The data do not reveal any specific trends in the relationship of teachers’ salaries to the salaries of other occupations. In the comparison of various occupational groups in 29 cities across the EU, EEA and Candidate Countries, it is found that while teaching is one of the best-paid occupations in some cities, it is one of the worst paid in others. Generally teachers are paid less than engineers and product managers, but in most cities they are better paid than building labourers and female factory workers. This type of comparison opens up new angles in the debate on how to attract young people to the teaching profession. An example of the added value of this type of comparison is the case of teachers’ salaries in Turkey, which seem favourable when considered in relation to GDP. However, in Istanbul 9 out of 14 compared occupations in 2006 are better paid than teaching. The present data from UBS have at least three weaknesses: 1) the UBS data have not been collected with the purpose of making this type of comparison; 2) it may be of greater interest to compare teaching solely with professions which require a similar length of education; 3) the UBS data have not been collected from an appropriate, randomly selected number of workplaces. In spite of these problems it may be of general interest to collect this type of information on regular basis. If there were an interest in continuing to collect this type of data, it could be done in two ways: either by using the existing UBS data, with its advantages and disadvantages, or by employing more formal channels to obtain the necessary information. The purpose of this study is to analyse whether UBS provides internationally comparable information on how teachers' salaries stand in relation to the salaries of other occupational groups. On the basis of an overview of existing international data, UBS is identified as the only source that provides comparable information on teachers' salaries in relations to other occupational groups. This information is contained in Prices and Earnings Around the Globe, a study published every three years by the Union Bank of Switzerland (UBS). This study has been conducted since 1971 and provides, among other things, information on the salaries of a number of professions, among them primary teachers. The data from UBS make it possible to compare teachers; salaries with those of other occupational groups in twelve cities in the EU, EEA and Candidate Countries during the period 1979 to 2006. The data do not reveal any specific trends in the relationship of teachers; salaries to the salaries of other occupations. In the comparison of various occupational groups in 29 cities across the EU, EEA and Candidate Countries, it is found that while teaching is one of the best-paid occupations in some cities, it is one of the worst paid in others. Generally teachers are paid less than engineers and product managers, but in most cities they are better paid than building labourers and female factory workers. This type of comparison opens up new angles in the debate on how to attract young people to the teaching profession. An example of the added value of this type of comparison is the case of teachers; salaries in Turkey, which seem favourable when considered in relation to GDP. However, in Istanbul 9 out of 14 compared occupations in 2006 are better paid than teaching. The present data from UBS have at least three weaknesses: 1) the UBS data have not been collected with the purpose of making this type of comparison; 2) it may be of greater interest to compare teaching solely with professions which require a similar length of education; 3) the UBS data have not been collected from an appropriate, randomly selected number of workplaces. In spite of these problems it may be of general interest to collect this type of information on regular basis. If there were an interest in continuing to collect this type of data, it could be done in two ways: either by using the existing UBS data, with its advantages and disadvantages, or by employing more formal channels to obtain the necessary information.

How to obtain EU publications
Our priced publications are available from EU Bookshop (http://bookshop.europa.eu),where you can place an order with the sales agent of your choice.
The Publications Office has a worldwide network of sales agents. You can obtain theircontact details by sending a fax to (352) 29 29-42758.

The mission of the JRC is to provide customer-driven scientific and technical support for the conception, development, implementation and monitoring of EU policies. As a service of the European Commission, the JRC functions as a reference centre of science and technology for the Union. Close to the policy-making process, it serves the common interest of the Member States, while being independent of special interests, whether private or national.