Embed Size (px)
Citation preview


Technical Support Document for Calculating Carbon Pollution Goals for Existing Power Plants in Territories and Areas of Indian
Country
October 2014

TSD for Calculating Carbon Pollution Goals for Existing Power Plants in Territories and Areas of Indian Country
i
CONTENTS Acronyms and initialisms .............................................................................................................................. ii
Introduction .................................................................................................................................................. 1
Affected electricity generating units on tribal lands .................................................................................... 1
Overview ................................................................................................................................................... 1
Data ........................................................................................................................................................... 2
BSER factors informing tribal lands’ emission rate goals .......................................................................... 3
Building block 1 – heat rate improvement at coal-fired power plants ................................................. 3
Building block 2 – redispatch to lower-emitting NGCC EGUs ............................................................... 3
Building block 3 – renewables .............................................................................................................. 4
Building block 4 – energy efficiency ...................................................................................................... 4
Affected electricity generating units in U.S. territories ................................................................................ 4
Overview ................................................................................................................................................... 4
Data ........................................................................................................................................................... 7
BSER factors informing territories’ emission rate goals ......................................................................... 11
Building block 1 – heat rate improvement at coal-fired power plants ............................................... 11
Building block 2 – redispatch to lower-emitting NGCC EGUs ............................................................. 11
Building block 3 – renewables ............................................................................................................ 11
Building block 4 – energy efficiency .................................................................................................... 12
Appendix 1 – Tribal and Territory Unit-level Inventory .............................................................................. 13
Appendix 2 – Goal Data and Computation ................................................................................................. 13
Appendix 3 – Cost Calculations ................................................................................................................... 13
Appendix 4 – Summary of tribal and territory goals under the proposed Existing Source Performance
Standard ...................................................................................................................................................... 14
Proposed and alternate goals with approach A ...................................................................................... 14
Co-proposed and alternate goals with approach B ................................................................................ 14
Alternative goals ..................................................................................................................................... 14
Appendix 5 – 2012 emission rate and building block application .............................................................. 15
Proposed goals ........................................................................................................................................ 15

TSD for Calculating Carbon Pollution Goals for Existing Power Plants in Territories and Areas of Indian Country
ii
ACRONYMS AND INITIALISMS BSER best system of emission reduction
CC combined cycle
CO2 carbon dioxide
CT combustion turbine
EGU electric generating unit
GHG greenhouse gas
GPA Guam Power Authority
ICE internal combustion engine
LNG liquified natural gas
NGCC natural gas combined cycle
PREPA Puerto Rico Electric Power Authority
ST steam turbine
VIWAPA U.S. Virgin Islands Water and Power Authority
TSD for Calculating Carbon Pollution Goals for Existing Power Plants in Territories and Areas of Indian Country
1
INTRODUCTION In the June 2014 Carbon Pollution Emission Guidelines for Existing Stationary Sources: Electric Utility
Generating Units (hereafter referred to as “June 2014 proposed rule”), EPA proposed to establish carbon
dioxide (CO2) emission guidelines for existing electricity generating units (EGUs) in the 50 states of the U.S.
The Agency also indicated that it would propose a supplemental rule that included CO2 guidelines for
existing EGUs in the territories and areas of Indian country (hereafter referred to as “tribal lands”).
Based on the June 2014 proposed rule, the Agency identified the best system of emission reduction (BSER)
that, taking into account the cost of achieving emission reductions and non-air quality health and
environmental impact and energy requirements, the Administrator determines has been adequately
demonstrated. Based on its evaluation of adequately-demonstrated greenhouse gas (GHG) abatement
measures, the Agency listed four categories, or “building blocks,” that are technically viable and broadly
applicable, and can provide cost-effective reductions in CO2 emissions from existing EGUs. These “building
blocks” include:
1. Reducing the CO2 intensity of generation at individual affected EGUs through heat rate
improvements;
2. Reducing emissions from the most CO2-intensive affected EGUs in the amount that results from
substituting generation at those EGUs with generation from less CO2-intenstive affected EGUs
(e.g., natural gas combined cycle (NGCC) EGUs);
3. Reducing emissions from affected EGUs in the amount that results from substituting generation
at those EGUs with expanded generation at low- or zero-CO2 EGUs; and,
4. Reducing emissions from affected EGUs in the amount that results from the use of demand-side
energy efficiency that reduces the amount of generation required.
The Agency believes that for purposes of Clean Air Act section 111(d), as applied to the power sector, the
BSER encompasses all four “building blocks.”
This Technical Support Document (TSD) describes how the Agency applied the BSER from the June 2014
proposed rule to affected EGUs on tribal lands and in territories.
AFFECTED ELECTRICITY GENERATING UNITS ON TRIBAL LANDS
Overview There are four power plants with 12 affected EGUs on tribal lands (see Table 1). Three plants combust
coal and one plant has two NGCC EGUs. The EGUs on tribal lands operate as part of an integrated
electricity grid and supply the majority of their electricity generation to customers outside the tribal lands.
The Agency did not find any information about grid-connected renewable energy generation in 2012 on
tribal lands with affected EGUs and, therefore, assumed no existing renewable energy sources.

TSD for Calculating Carbon Pollution Goals for Existing Power Plants in Territories and Areas of Indian Country
2
Table 1: Potentially affected EGUs on tribal lands
Tribe ORIS Plant name Unit Fuel Unit type Capacity (MW)
Navajo 2442 Four Corners 1 coal steam turbine 190
Navajo 2442 Four Corners 2 coal steam turbine 190
Navajo 2442 Four Corners 3 coal steam turbine 253
Navajo 2442 Four Corners 4 coal steam turbine 818
Navajo 2442 Four Corners 5 coal steam turbine 818
Navajo 4941 Navajo Generating Station NAV1 coal steam turbine 803
Navajo 4941 Navajo Generating Station NAV2 coal steam turbine 803
Navajo 4941 Navajo Generating Station NAV3 coal steam turbine 803
Ute 7790 Bonanza 1 coal steam turbine 500
Fort Mojave 55177 South Point Energy Center A gas NGCC 236
Fort Mojave 55177 South Point Energy Center B gas NGCC 236
Fort Mojave 55177 South Point Energy Center ST1 gas NGCC 236
Data The 2012 CO2 emissions and electricity generation data for the EGUs listed in Table 1 are taken from the
document titled, 2012 Unit-level Data Using the eGRID Methodology.1 Information about the source of
these data and the methodologies used to compile the data set is described in Description of 2012 Unit-
Level Data Using the eGRID Methodology.2
The information available to the Agency indicates there was no generation from utility-scale, grid-
connected renewable energy in 2012 in the three tribal lands with affected EGUs. This was based on a
review of information from EIA, DOE’s Office of Indian Energy Policy and Programs, and tribal utility
authorities serving tribal lands with affected EGUs.
Data required for the calculation of building block 4 goals for tribal lands and their sources are:
2012 electricity sales (MWh): Form EIA-8613
2012 energy efficiency incremental effects – total (MWh): Form EIA-8614
Projected annual electricity sales by region (2012-2040): AEO2013 Reference Case5
These data are inputs to the supporting technical files to this TSD:
Option 1A: Building block 4 proposed goal based on each tribe/territory ramping up to 1.5%
incremental savings with costs calculated using a 3% discount rate;
Option 1B: Building block 4 proposed goal based on each tribe/territory ramping up to 1.5%
incremental savings with costs calculated using a 7% discount rate;
1 Available in the docket EPA-HQ-OAR-2013-0602 at http://www.regulations.gov/#!documentDetail;D=EPA-HQ-OAR-2013-0602-0254. 2 2 Available in the docket EPA-HQ-OAR-2013-0602 at http://www.regulations.gov/#!documentDetail;D=EPA-HQ-OAR-2013-0602-0257. 3 Available at http://www.eia.gov/electricity/data/eia861/ (see “retail sales” workbook). 4 Available at http://www.eia.gov/electricity/data/eia861/ (see “dsm” workbook). 5 Available at http://www.eia.gov/forecasts/archive/aeo13/.
TSD for Calculating Carbon Pollution Goals for Existing Power Plants in Territories and Areas of Indian Country
3
Option 2A: Building block 4 alternative goal based on each tribe/territory ramping up to 1.0%
incremental savings with costs calculated using a 3% discount rate; and
Option 2B: Building block 4 alternative goal based on each tribe/territory ramping up to 1.0%
incremental savings with costs calculated using a 7% discount rate.
Table 2 summarizes data on 2012 electricity sales for tribal lands by state and utility. None of the tribes
reported energy efficiency data on their Form EIA-861 submittals for 2012. Projected annual electricity
sales by region are included in the supporting technical files to this TSD.
Table 2: 2012 total electricity sales for tribal lands
Tribe Utility number Utility name State Total sales (MWh)
Ute 12866 Moon Lake Electric Assn Inc UT 470,007
Navajo 13314 Navajo Tribal Utility Authority AZ 548,934
Navajo 13314 Navajo Tribal Utility Authority NM 117,010
Navajo 13314 Navajo Tribal Utility Authority UT 10,070
Fort Mojave 58123 Aha Macav Power Service AZ 47,788
BSER factors informing tribal lands’ emission rate goals The methodology for calculating tribal lands’ emission rate goals generally applies the same approach to
determining BSER as described in the Goal Computation TSD from the June 2014 proposed rule.
Information about the BSER measures can be found in the GHG Abatement Measures TSD.6 The GHG
Abatement Measures TSD describes the categories of emission reduction measures (building blocks) used
in determining the emission rate goals.
Building block 1 – heat rate improvement at coal-fired power plants Using the data discussed above, the Agency applied a 6% heat rate improvement to the EGUs at the Four
Corners, Navajo Generating Station, and Bonanza coal-fired power plants. To calculate the alternative goal,
the Agency applied a 4% heat rate improvement to the EGUs. The results from building block 1 are
presented in Table 3.
Table 3: Adjusted average coal CO2 emission rate for coal-fired EGUs
Tribe 6% HRI Coal CO2 rate (lbs/MWh)
4% HRI Coal CO2 rate (lbs/MWh)
Navajo 1,993 2,036
Ute 2,016 2,059
Building block 2 – redispatch to lower-emitting NGCC EGUs Because none of the tribal lands have both coal-fired EGUs and NGCC EGUs, the analysis does not include
redispatch to less CO2-intenstive affected EGUs.
6 Available in the docket EPA-HQ-OAR-2013-0602 at http://www.regulations.gov/#!documentDetail;D=EPA-HQ-OAR-2013-0602-0437.
TSD for Calculating Carbon Pollution Goals for Existing Power Plants in Territories and Areas of Indian Country
4
Building block 3 – renewables The analysis of renewable energy for building block 3 used the proposed methodology from the June 2014
proposed rule. Because EPA did not find any information about utility-scale, grid-connected renewable
energy net generation on tribal lands with affected EGUs in 2012, the renewables targets are zero, and,
therefore, result in no change to the goals for these areas.
EPA did not propose renewable energy targets for goal calculations based on the co-proposed
methodology for the U.S. territories or the alternative approach used in the June 2014 proposed rule as
discussed in the preamble. However, EPA considered using the renewable energy technical potential
estimates for tribal lands7,8 as well as using the lowest renewable energy percentage target (as derived in
the alternative approach upon which EPA solicited comment for states) of any state in which that area of
Indian country is located. Because these co-proposed methodology and alternative approach are based
on a state or territory’s total net electricity generation and not retail sales (i.e., consumption), applying
these methodologies to tribal lands – where sales are only 2% - 16% of generation – yields large renewable
energy goals relative to retail sales.
Building block 4 – energy efficiency The analysis of energy efficiency for building block 4 used the proposed methodology from the June 2014
proposed rule.
AFFECTED ELECTRICITY GENERATING UNITS IN U.S. TERRITORIES
Overview The territories of Guam, Puerto Rico, and the US Virgin Islands have coal-, oil-, and/or gas-fired EGUs that
may be affected by this proposal. Data from these EGUs were analyzed to establish territorial goals using
the BSER described above.
The Guam Power Authority (GPA) owns and manages the territory’s electricity grid. The majority of
electricity on Guam is generated from No. 6 heavy fuel oil with a small amount from No. 2 distillate oil,
both of which are shipped to the territory by tanker. 9 There are nine fossil-fired EGUs in Guam equal to
or greater than 25 MW nameplate capacity (see Table 4). Excluding Guam’s internal combustion engines
(ICEs) and oil-fired combustion turbines (CTs),10 there are four EGU heavy fuel oil-fired steam turbine (STs)
EGUs that may be affected sources under the rule.
Guam is also pursuing renewable energy and energy efficiency. In 2008, Guam’s legislature established a
renewable energy goal of 8% of net electricity sales by December 31, 2020; 10% of net electricity sales by
December 31, 2025; and 15% of net electricity sales by December 31, 2030.11
7 Doris et al (DOE), 2013. Geospatial Analysis of Renewable Energy Technical Potential on Tribal Lands. Available at http://www.nrel.gov/docs/fy13osti/56641.pdf. 8 Lopez et al (NREL), 2012. U.S. Renewable Energy Technical Potentials: A GIS-Based Analysis. Available at http://www.nrel.gov/docs/fy12osti/51946.pdf. 9 EIA, 2013. Guam – Territory Energy Profile Analysis. Available at http://www.eia.gov/state/analysis.cfm?sid=gq. 10 The June 2014 proposed rule does not include ICEs as affected sources, and CTs must combust natural gas for more than 90% of the CT’s heat input. Since available data indicate Guam’s CT did not combust natural gas, it has been excluded from the list of potentially affected units for purposes of this goal-setting analysis. 11 NCSU, 2014. Guam – Renewable Energy Portfolio Goal. Available at http://www.dsireusa.org/incentives/incentive.cfm?Incentive_Code=GU03R&ee=1.
TSD for Calculating Carbon Pollution Goals for Existing Power Plants in Territories and Areas of Indian Country
5
Table 4: Guam fossil-fired EGUs equal to or greater than 25 MW capacity
Plant name (location) Unit Fuel Unit type Capacity (MW)
Cabras 1 No. 6 oil ST 60 *
Cabras 2 No. 6 oil ST 60 *
Cabras 3 No. 6 oil ICE 38
Cabras 4 No. 6 oil ICE 38
Tanguisson 1 No. 6 oil ST 25 *
Tanguisson 2 No. 6 oil ST 25 *
PITI 7 distillate oil CT 40
PITI 8 No. 6 oil ICE 40
PITI 9 No. 6 oil ICE 40
Note: EGUs with asterisks were included in the goal calculation for Guam
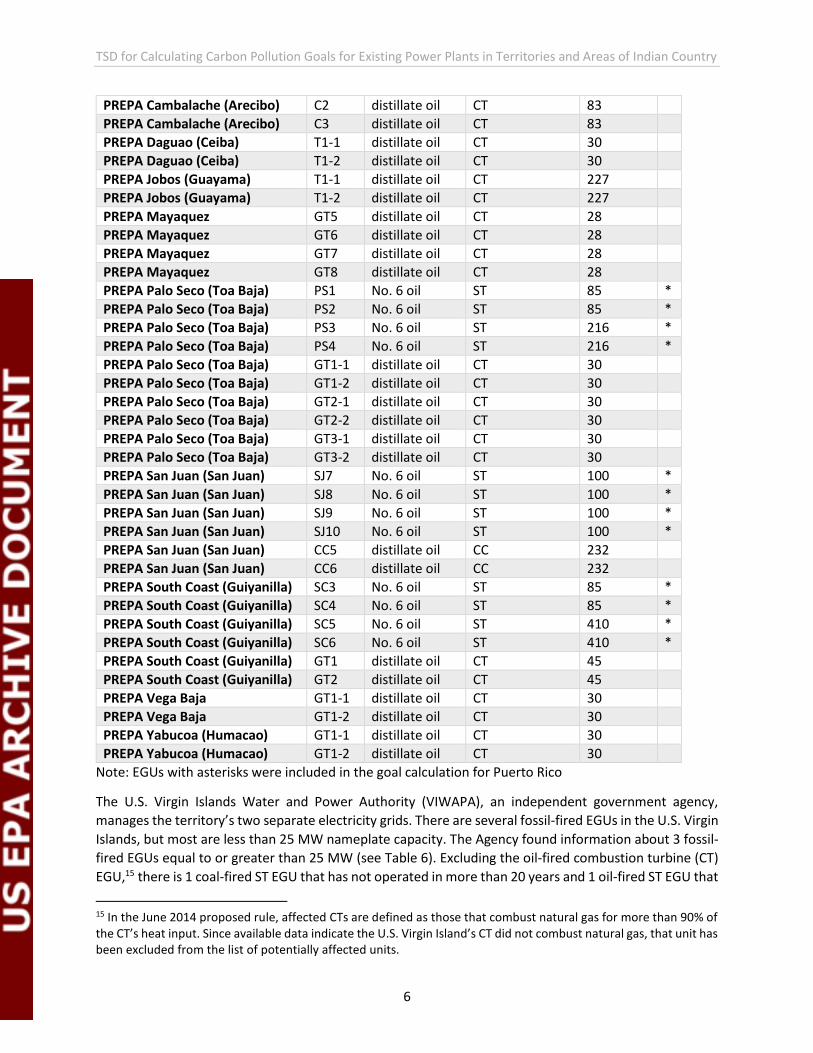
The Puerto Rico Electric Power Authority (PREPA) owns and manages the territory’s electricity grid. In
2012, approximately 65% of the electricity was generated from No. 6 heavy fuel oil and No. 2 distillate oil,
18% from liquified natural gas (LNG), 16% from coal, and 1% from hydro.12 There are several fossil-fired
EGUs in Puerto Rico equal to or greater than 25 MW nameplate capacity (see Table 5). Excluding oil-fired
CTs and combined cycles (CCs),13 there are 2 coal-fired ST EGUs, 2 NGCC EGUs, and 14 oil-fired ST EGUs
that may be affected sources under the rule.
Puerto Rico is also pursuing renewable energy and energy efficiency. In 2010, Puerto Rico enacted a
renewable energy portfolio standard of 15% of retail electricity sales in 2020, rising to 20% in 2035.14
Table 5: Puerto Rico fossil-fired EGUs equal to or greater than 25 MW capacity
Plant name (location) Unit Fuel Unit type Capacity (MW)
AES (Guayama) 1 Coal ST 227 *
AES (Guayama) 2 Coal ST 227 *
Eco-electrica (Penuelas) CT1 Gas NGCC 568 *
Eco-electrica (Penuelas) CT2 Gas NGCC 568 *
PREPA Aguirre (Aguirre) AG1 No. 6 oil ST 450 *
PREPA Aguirre (Aguirre) AG2 No. 6 oil ST 450 *
PREPA Aguirre (Aguirre) CC1 distillate oil CC 296
PREPA Aguirre (Aguirre) CC2 distillate oil CC 296
PREPA Aguirre (Aguirre) T1-1 distillate oil CT 30
PREPA Aguirre (Aguirre) T1-2 distillate oil CT 30
PREPA Cambalache (Arecibo) C1 distillate oil CT 83
12 EIA, 2014. Puerto Rico Territory Energy Profile. Available at http://www.eia.gov/state/print.cfm?sid=RQ 13 In the June 2014 proposed rule, affected CTs are defined as those that combust natural gas for more than 90% of the CT’s heat input. Since available data indicate Puerto Rico’s CTs did not combust natural gas, those units have been excluded from the list of potentially affected units. 14 NCSU, 2014. Puerto Rico – Renewable Energy Portfolio Standard. Available at http://www.dsireusa.org/incentives/incentive.cfm?Incentive_Code=PR07R&ee=1.
TSD for Calculating Carbon Pollution Goals for Existing Power Plants in Territories and Areas of Indian Country
6
PREPA Cambalache (Arecibo) C2 distillate oil CT 83
PREPA Cambalache (Arecibo) C3 distillate oil CT 83
PREPA Daguao (Ceiba) T1-1 distillate oil CT 30
PREPA Daguao (Ceiba) T1-2 distillate oil CT 30
PREPA Jobos (Guayama) T1-1 distillate oil CT 227
PREPA Jobos (Guayama) T1-2 distillate oil CT 227
PREPA Mayaquez GT5 distillate oil CT 28
PREPA Mayaquez GT6 distillate oil CT 28
PREPA Mayaquez GT7 distillate oil CT 28
PREPA Mayaquez GT8 distillate oil CT 28
PREPA Palo Seco (Toa Baja) PS1 No. 6 oil ST 85 *
PREPA Palo Seco (Toa Baja) PS2 No. 6 oil ST 85 *
PREPA Palo Seco (Toa Baja) PS3 No. 6 oil ST 216 *
PREPA Palo Seco (Toa Baja) PS4 No. 6 oil ST 216 *
PREPA Palo Seco (Toa Baja) GT1-1 distillate oil CT 30
PREPA Palo Seco (Toa Baja) GT1-2 distillate oil CT 30
PREPA Palo Seco (Toa Baja) GT2-1 distillate oil CT 30
PREPA Palo Seco (Toa Baja) GT2-2 distillate oil CT 30
PREPA Palo Seco (Toa Baja) GT3-1 distillate oil CT 30
PREPA Palo Seco (Toa Baja) GT3-2 distillate oil CT 30
PREPA San Juan (San Juan) SJ7 No. 6 oil ST 100 *
PREPA San Juan (San Juan) SJ8 No. 6 oil ST 100 *
PREPA San Juan (San Juan) SJ9 No. 6 oil ST 100 *
PREPA San Juan (San Juan) SJ10 No. 6 oil ST 100 *
PREPA San Juan (San Juan) CC5 distillate oil CC 232
PREPA San Juan (San Juan) CC6 distillate oil CC 232
PREPA South Coast (Guiyanilla) SC3 No. 6 oil ST 85 *
PREPA South Coast (Guiyanilla) SC4 No. 6 oil ST 85 *
PREPA South Coast (Guiyanilla) SC5 No. 6 oil ST 410 *
PREPA South Coast (Guiyanilla) SC6 No. 6 oil ST 410 *
PREPA South Coast (Guiyanilla) GT1 distillate oil CT 45
PREPA South Coast (Guiyanilla) GT2 distillate oil CT 45
PREPA Vega Baja GT1-1 distillate oil CT 30
PREPA Vega Baja GT1-2 distillate oil CT 30
PREPA Yabucoa (Humacao) GT1-1 distillate oil CT 30
PREPA Yabucoa (Humacao) GT1-2 distillate oil CT 30
Note: EGUs with asterisks were included in the goal calculation for Puerto Rico
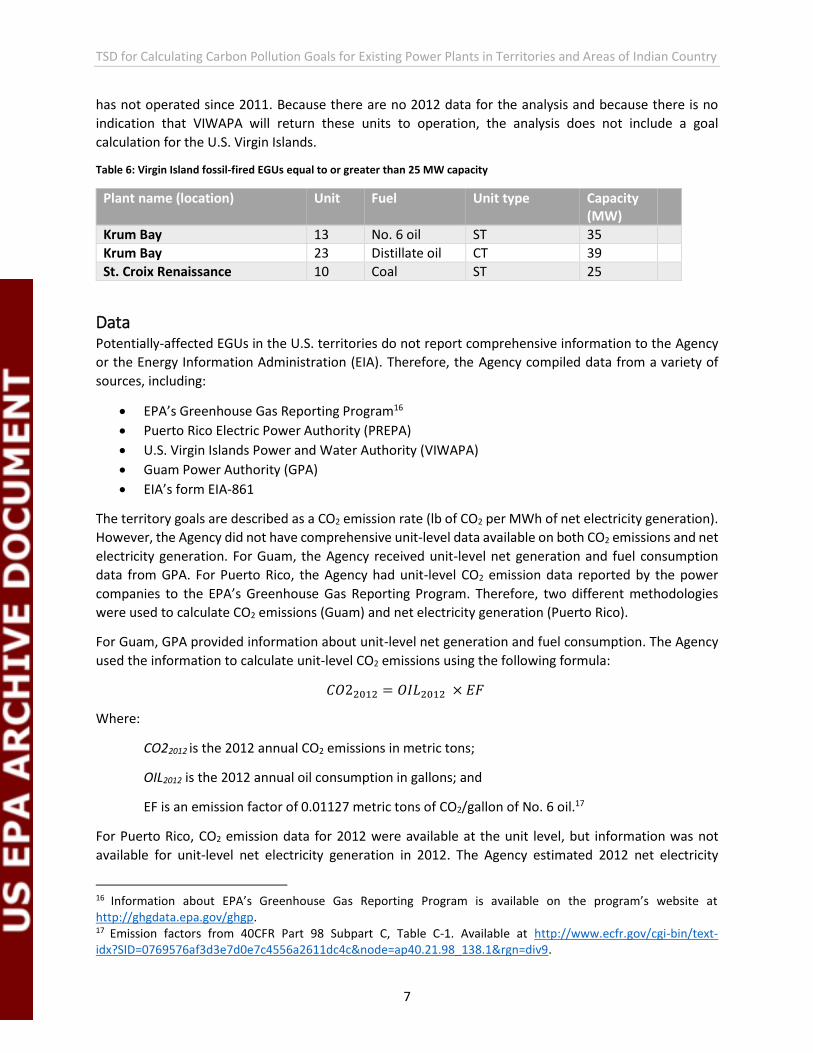
The U.S. Virgin Islands Water and Power Authority (VIWAPA), an independent government agency,
manages the territory’s two separate electricity grids. There are several fossil-fired EGUs in the U.S. Virgin
Islands, but most are less than 25 MW nameplate capacity. The Agency found information about 3 fossil-
fired EGUs equal to or greater than 25 MW (see Table 6). Excluding the oil-fired combustion turbine (CT)
EGU,15 there is 1 coal-fired ST EGU that has not operated in more than 20 years and 1 oil-fired ST EGU that
15 In the June 2014 proposed rule, affected CTs are defined as those that combust natural gas for more than 90% of the CT’s heat input. Since available data indicate the U.S. Virgin Island’s CT did not combust natural gas, that unit has been excluded from the list of potentially affected units.
TSD for Calculating Carbon Pollution Goals for Existing Power Plants in Territories and Areas of Indian Country
7
has not operated since 2011. Because there are no 2012 data for the analysis and because there is no
indication that VIWAPA will return these units to operation, the analysis does not include a goal
calculation for the U.S. Virgin Islands.
Table 6: Virgin Island fossil-fired EGUs equal to or greater than 25 MW capacity
Plant name (location) Unit Fuel Unit type Capacity (MW)
Krum Bay 13 No. 6 oil ST 35
Krum Bay 23 Distillate oil CT 39
St. Croix Renaissance 10 Coal ST 25
Data Potentially-affected EGUs in the U.S. territories do not report comprehensive information to the Agency
or the Energy Information Administration (EIA). Therefore, the Agency compiled data from a variety of
sources, including:
EPA’s Greenhouse Gas Reporting Program16
Puerto Rico Electric Power Authority (PREPA)
U.S. Virgin Islands Power and Water Authority (VIWAPA)
Guam Power Authority (GPA)
EIA’s form EIA-861
The territory goals are described as a CO2 emission rate (lb of CO2 per MWh of net electricity generation).
However, the Agency did not have comprehensive unit-level data available on both CO2 emissions and net
electricity generation. For Guam, the Agency received unit-level net generation and fuel consumption
data from GPA. For Puerto Rico, the Agency had unit-level CO2 emission data reported by the power
companies to the EPA’s Greenhouse Gas Reporting Program. Therefore, two different methodologies
were used to calculate CO2 emissions (Guam) and net electricity generation (Puerto Rico).
For Guam, GPA provided information about unit-level net generation and fuel consumption. The Agency
used the information to calculate unit-level CO2 emissions using the following formula:
𝐶𝑂22012 = 𝑂𝐼𝐿2012 × 𝐸𝐹
Where:
CO22012 is the 2012 annual CO2 emissions in metric tons;
OIL2012 is the 2012 annual oil consumption in gallons; and
EF is an emission factor of 0.01127 metric tons of CO2/gallon of No. 6 oil.17
For Puerto Rico, CO2 emission data for 2012 were available at the unit level, but information was not
available for unit-level net electricity generation in 2012. The Agency estimated 2012 net electricity
16 Information about EPA’s Greenhouse Gas Reporting Program is available on the program’s website at http://ghgdata.epa.gov/ghgp. 17 Emission factors from 40CFR Part 98 Subpart C, Table C-1. Available at http://www.ecfr.gov/cgi-bin/text-idx?SID=0769576af3d3e7d0e7c4556a2611dc4c&node=ap40.21.98_138.1&rgn=div9.
TSD for Calculating Carbon Pollution Goals for Existing Power Plants in Territories and Areas of Indian Country
8
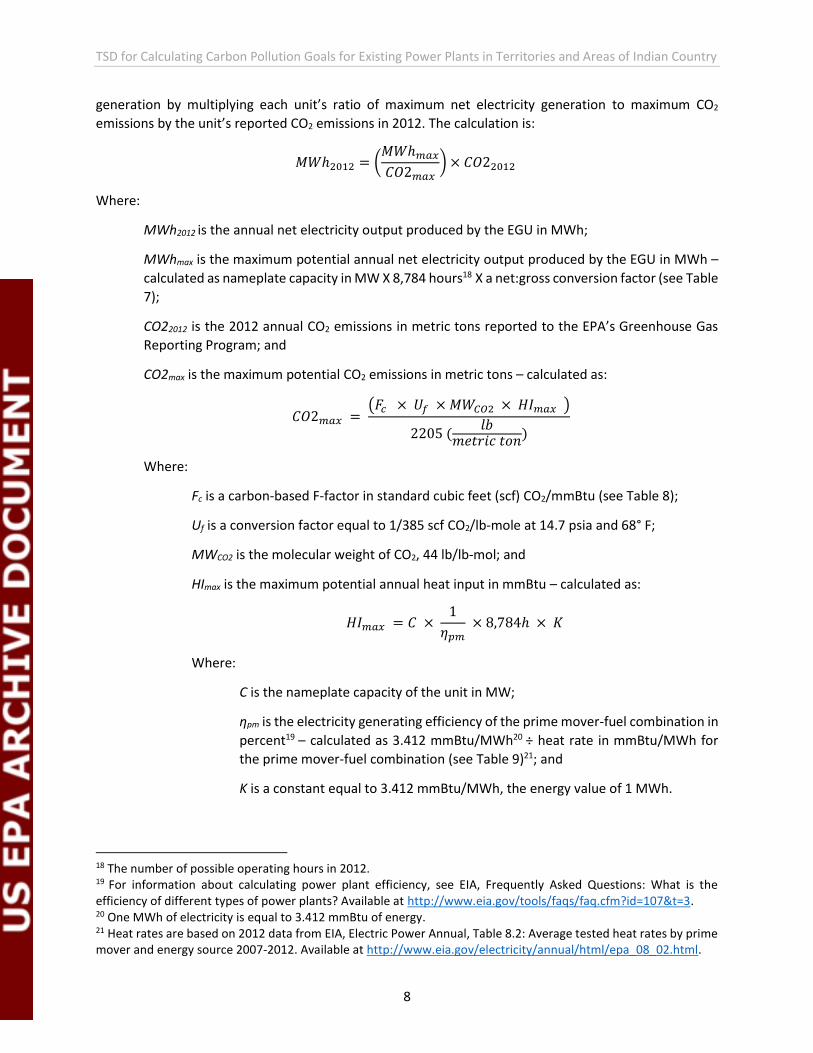
generation by multiplying each unit’s ratio of maximum net electricity generation to maximum CO2
emissions by the unit’s reported CO2 emissions in 2012. The calculation is:
𝑀𝑊ℎ2012 = (𝑀𝑊ℎ𝑚𝑎𝑥
𝐶𝑂2𝑚𝑎𝑥) × 𝐶𝑂22012
Where:
MWh2012 is the annual net electricity output produced by the EGU in MWh;
MWhmax is the maximum potential annual net electricity output produced by the EGU in MWh –
calculated as nameplate capacity in MW X 8,784 hours18 X a net:gross conversion factor (see Table
7);
CO22012 is the 2012 annual CO2 emissions in metric tons reported to the EPA’s Greenhouse Gas
Reporting Program; and
CO2max is the maximum potential CO2 emissions in metric tons – calculated as:
𝐶𝑂2𝑚𝑎𝑥 = (𝐹𝑐 × 𝑈𝑓 × 𝑀𝑊𝐶𝑂2 × 𝐻𝐼𝑚𝑎𝑥 )
2205 (𝑙𝑏
𝑚𝑒𝑡𝑟𝑖𝑐 𝑡𝑜𝑛)
Where:
Fc is a carbon-based F-factor in standard cubic feet (scf) CO2/mmBtu (see Table 8);
Uf is a conversion factor equal to 1/385 scf CO2/lb-mole at 14.7 psia and 68° F;
MWCO2 is the molecular weight of CO2, 44 lb/lb-mol; and
HImax is the maximum potential annual heat input in mmBtu – calculated as:
𝐻𝐼𝑚𝑎𝑥 = 𝐶 × 1
𝜂𝑝𝑚 × 8,784ℎ × 𝐾
Where:
C is the nameplate capacity of the unit in MW;
ηpm is the electricity generating efficiency of the prime mover-fuel combination in
percent19 – calculated as 3.412 mmBtu/MWh20 ÷ heat rate in mmBtu/MWh for
the prime mover-fuel combination (see Table 9)21; and
K is a constant equal to 3.412 mmBtu/MWh, the energy value of 1 MWh.
18 The number of possible operating hours in 2012. 19 For information about calculating power plant efficiency, see EIA, Frequently Asked Questions: What is the efficiency of different types of power plants? Available at http://www.eia.gov/tools/faqs/faq.cfm?id=107&t=3. 20 One MWh of electricity is equal to 3.412 mmBtu of energy. 21 Heat rates are based on 2012 data from EIA, Electric Power Annual, Table 8.2: Average tested heat rates by prime mover and energy source 2007-2012. Available at http://www.eia.gov/electricity/annual/html/epa_08_02.html.
TSD for Calculating Carbon Pollution Goals for Existing Power Plants in Territories and Areas of Indian Country
9
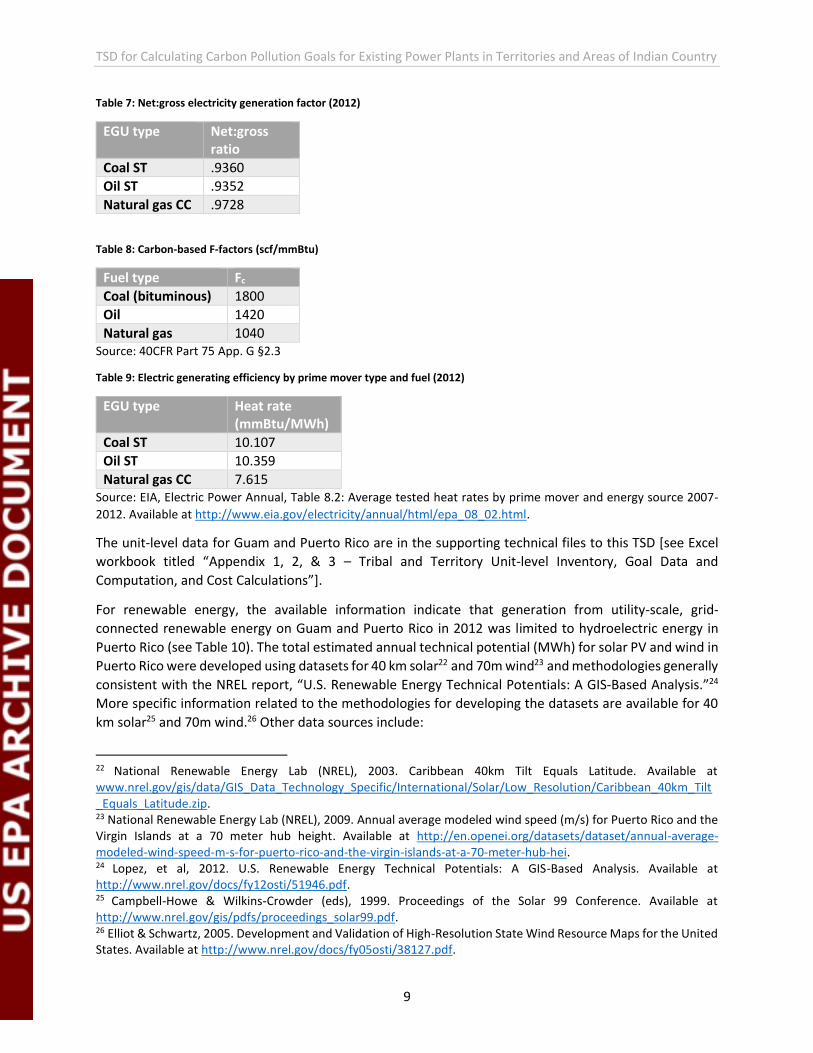
Table 7: Net:gross electricity generation factor (2012)
EGU type Net:gross ratio
Coal ST .9360
Oil ST .9352
Natural gas CC .9728
Table 8: Carbon-based F-factors (scf/mmBtu)
Fuel type Fc
Coal (bituminous) 1800
Oil 1420
Natural gas 1040 Source: 40CFR Part 75 App. G §2.3
Table 9: Electric generating efficiency by prime mover type and fuel (2012)
EGU type Heat rate (mmBtu/MWh)
Coal ST 10.107
Oil ST 10.359
Natural gas CC 7.615 Source: EIA, Electric Power Annual, Table 8.2: Average tested heat rates by prime mover and energy source 2007-
2012. Available at http://www.eia.gov/electricity/annual/html/epa_08_02.html.
The unit-level data for Guam and Puerto Rico are in the supporting technical files to this TSD [see Excel
workbook titled “Appendix 1, 2, & 3 – Tribal and Territory Unit-level Inventory, Goal Data and
Computation, and Cost Calculations”].
For renewable energy, the available information indicate that generation from utility-scale, grid-
connected renewable energy on Guam and Puerto Rico in 2012 was limited to hydroelectric energy in
Puerto Rico (see Table 10). The total estimated annual technical potential (MWh) for solar PV and wind in
Puerto Rico were developed using datasets for 40 km solar22 and 70m wind23 and methodologies generally
consistent with the NREL report, “U.S. Renewable Energy Technical Potentials: A GIS-Based Analysis.”24
More specific information related to the methodologies for developing the datasets are available for 40
km solar25 and 70m wind.26 Other data sources include:
22 National Renewable Energy Lab (NREL), 2003. Caribbean 40km Tilt Equals Latitude. Available at www.nrel.gov/gis/data/GIS_Data_Technology_Specific/International/Solar/Low_Resolution/Caribbean_40km_Tilt_Equals_Latitude.zip. 23 National Renewable Energy Lab (NREL), 2009. Annual average modeled wind speed (m/s) for Puerto Rico and the Virgin Islands at a 70 meter hub height. Available at http://en.openei.org/datasets/dataset/annual-average-modeled-wind-speed-m-s-for-puerto-rico-and-the-virgin-islands-at-a-70-meter-hub-hei. 24 Lopez, et al, 2012. U.S. Renewable Energy Technical Potentials: A GIS-Based Analysis. Available at http://www.nrel.gov/docs/fy12osti/51946.pdf. 25 Campbell-Howe & Wilkins-Crowder (eds), 1999. Proceedings of the Solar 99 Conference. Available at http://www.nrel.gov/gis/pdfs/proceedings_solar99.pdf. 26 Elliot & Schwartz, 2005. Development and Validation of High-Resolution State Wind Resource Maps for the United States. Available at http://www.nrel.gov/docs/fy05osti/38127.pdf.

TSD for Calculating Carbon Pollution Goals for Existing Power Plants in Territories and Areas of Indian Country
10
Net generation by utility: Form EIA-86127
Existing generation: EIA territorial profiles28
Table 10: Renewable energy net generation (MWh)
Territory Renewables 2011 (MWh)
2012 (MWh)
Guam Hydro 0 0
Non-hydro 0 NA
Puerto Rico Hydro 149,000 148,000
Non-hydro 0 NA Source: EIA, International Energy Statistics, Total Renewable Electricity Net Generation.
Data required for the calculation of building block 4 goals for territories and their sources are:
2012 electricity sales (MWh): Form EIA-86129
2012 energy efficiency incremental effects – total (MWh): Form EIA-86130
These data are inputs to the supporting technical files to this TSD:
Option 1A: Building block 4 proposed goal based on each tribe/territory ramping up to 1.5%
incremental savings with costs calculated using a 3% discount rate;
Option 1B: Building block 4 proposed goal based on each tribe/territory ramping up to 1.5%
incremental savings with costs calculated using a 7% discount rate;
Option 2A: Building block 4 alternative goal based on each tribe/territory ramping up to 1.0%
incremental savings with costs calculated using a 3% discount rate; and
Option 2B: Building block 4 alternative goal based on each tribe/territory ramping up to 1.0%
incremental savings with costs calculated using a 7% discount rate.
Table 11 summarizes data on 2012 electricity sales for the territories. None of the territories reported
energy efficiency data on their Form EIA-861 submittals for 2012. Unlike the tribes and states, electricity
sales projections are not available from the 2013 AEO reference case. EPA is not aware of another source
for this information and, thus, is holding sales constant at their 2012 levels through the analysis period.
Table 11: 2012 total electricity sales for territories
Territory Utility Number Utility Name Total Sales (MWh)
Guam 40428 Guam Power Authority 1,563,475
Puerto Rico 15497 Puerto Rico Electric Power Authority 18,150,330
27 Available at http://www.eia.gov/electricity/data/eia861/ (see "operational data" workbook) 28 Available at - http://www.eia.gov/state/analysis.cfm?sid=GQ and http://www.eia.gov/state/analysis.cfm?sid=RQ 29 Available at http://www.eia.gov/electricity/data/eia861/ (see “retail sales”). 30 Available at http://www.eia.gov/electricity/data/eia861/ (see “dsm”).

TSD for Calculating Carbon Pollution Goals for Existing Power Plants in Territories and Areas of Indian Country
11
BSER factors informing territories’ emission rate goals As discussed in the section on BSER factors informing tribal lands’ emission rate goals, the methodology
for calculating emission rate goals generally applies the same approach to determining BSER as described
in the Goal Computation TSD from the June 2014 proposed rule.
Building block 1 – heat rate improvement at coal-fired power plants Using the data discussed above, the Agency applied a 6% heat rate improvement to the coal-fired EGUs
in Puerto Rico. The Agency assumes that a 6% heat rate improvement at the facility with the coal-fired
EGUs will directly translate to a 6% reduction in the net CO2 emission rate. To calculate the alternative
goal, the Agency applied a 4% heat rate improvement to the EGUs. The results from building block 1 are
presented in Table 12.
Table 12: Adjusted average coal CO2 emission rate for coal-fired EGUs
Territory 6% HRI Coal CO2 rate (lbs/MWh)
4% HRI Coal CO2 rate (lbs/MWh)
Puerto Rico 2,083 2,127
Building block 2 – redispatch to lower-emitting NGCC EGUs In 2012, Puerto Rico had a one facility with two NGCC EGUs. Based on the Agency’s calculations described
above, the facility operated at approximately a 37% capacity factor. The GHG Abatement Measures TSD31,
suggests that the average availability of an NGCC is significantly greater than 70%. Because the NGCC EGUs
in Puerto Rico use imported LNG, the Agency reviewed the capacity of the existing LNG port and gasifiers
to ensure they would not constrain the ability of the EGUs to achieve a 70% capacity factor. Based on data
available to the Agency, we believe the port has sufficient importing and processing capacity to supply
LNG for the NGCCs to achieve a 70% capacity factor which offsets generation at both coal-fired ST EGUs
and oil-fired ST EGUs.
Building block 3 – renewables Because neither Guam nor Puerto Rico have utility-scale, grid-connected, non-hydroelectric renewable
energy generation for 2012, the analysis of renewable energy using the proposed methodology from the
June 2014 proposed rule resulted in no renewable energy targets, and, therefore, no change to the goals
for these areas.
The second co-proposal option includes an adjustment to the proposed methodology that changes the
amount of renewable energy in 2017 to be consistent with the lowest amount among the 50 states in
2012, which is 0.37% of the 2012 total electricity generation. EPA then applies the 9% annual growth
factor through 2029. The 9% annual growth factor is based on Hawaii’s historical growth in renewable
energy generation between 2002 and 2012.
For Puerto Rico’s renewable energy target based on the alternative approach, the Agency used estimates
provided by DOE for wind and utility-scale solar PV (urban and rural) from available wind and solar
resource data for the region. The wind resource data used are 70m hub height wind speed estimates
31 See footnote 6.

TSD for Calculating Carbon Pollution Goals for Existing Power Plants in Territories and Areas of Indian Country
12
modeled by AWS Truepower and NREL in 2008. The solar resource data used was produced by the NREL
Climatological Solar Radiation model in 2007.
Consistent with the June 2014 proposed rule, the Agency also includes renewable energy targets for
Puerto Rico with the inclusion of 2012 hydroelectric generation. These data are presented in the technical
files to this TSD:
Data file – Supplemental Proposed RE Method; and
Data file – Supplemental Alternative RE Approach.
Building block 4 – energy efficiency The analysis of energy efficiency for building block 4 used the proposed methodology from the June 2014
proposed rule.
TSD for Calculating Carbon Pollution Goals for Existing Power Plants in Territories and Areas of Indian Country
13
APPENDIX 1 – TRIBAL AND TERRITORY UNIT-LEVEL INVENTORY See “App 1 – Info”, “App 1 – Guam”, “App 1 – PR”, and “App 1 – Tribes” worksheets in Excel workbook
titled “Appendix 1, 2, & 3 – Tribal and Territory Unit-level Inventory, Goal Data and Computation, and Cost
Calculations”
APPENDIX 2 – GOAL DATA AND COMPUTATION See “App 2 – Goals option 1” and “App 2 – Goals option 2” worksheets in Excel workbook titled “Appendix
1, 2, & 3 – Tribal and Territory Unit-level Inventory, Goal Data and Computation, and Cost Calculations”
APPENDIX 3 – COST CALCULATIONS See “App 3 – Cost info” and “App 3 – Cost analysis” worksheets in Excel workbook titled “Appendix 1, 2,
& 3 – Tribal and Territory Unit-level Inventory, Goal Data and Computation, and Cost Calculations”

TSD for Calculating Carbon Pollution Goals for Existing Power Plants in Territories and Areas of Indian Country
14
APPENDIX 4 – SUMMARY OF TRIBAL AND TERRITORY GOALS UNDER THE PROPOSED
EXISTING SOURCE PERFORMANCE STANDARD
Proposed and alternate goals with approach A The proposed goals and alternative goals are based on no non-hydro, grid-connected renewable energy
in 2012.
Figure 4 - 1: Proposed goals (option 1) and alternate goals (option 2) with approach A for building block 3
Territory or tribal lands
Option 1 Interim goal (2020-2029)
Option 1 Final goal
(2030 and after)
Option 2 Interim goal (2020-2024)
Option 2 Final goal
(2025 and after)
Guam 1,733 1,586 1,854 1,794
Puerto Rico 1,470 1,413 1,542 1,521
Fort Mojave 856 855 857 857
Navajo 1,991 1,989 2,035 2,034
Ute 2,000 1,988 2,052 2,048
Co-proposed and alternate goals with approach B The co-proposed goals and alternate co-proposed goals are based on the lowest amount of renewable
energy among the 50 states in 2012 – 0.37%.
Figure 4 - 2: Co-proposed and alternate co-proposed goals with approach B for building block 3
Territory or tribal lands
Option 1 Interim goal (2020-2029)
Option 1 Final goal
(2030 and after)
Option 2 Interim goal (2020-2024)
Option 2 Final goal
(2025 and after)
Guam 1,708 1,556 1,831 1,768
Puerto Rico 1,459 1,399 1,533 1,510
Alternative goals The alternative goals are based on the renewable energy technical potential.
Figure 4 - 3: Alternative goals using technical potential for building block 3
Territory or tribal lands
Interim goal (2020-2029)
Final goal (2030 and after)
Guam 1,733 1,586
Puerto Rico 1,452 1,397
TSD for Calculating Carbon Pollution Goals for Existing Power Plants in Territories and Areas of Indian Country
15
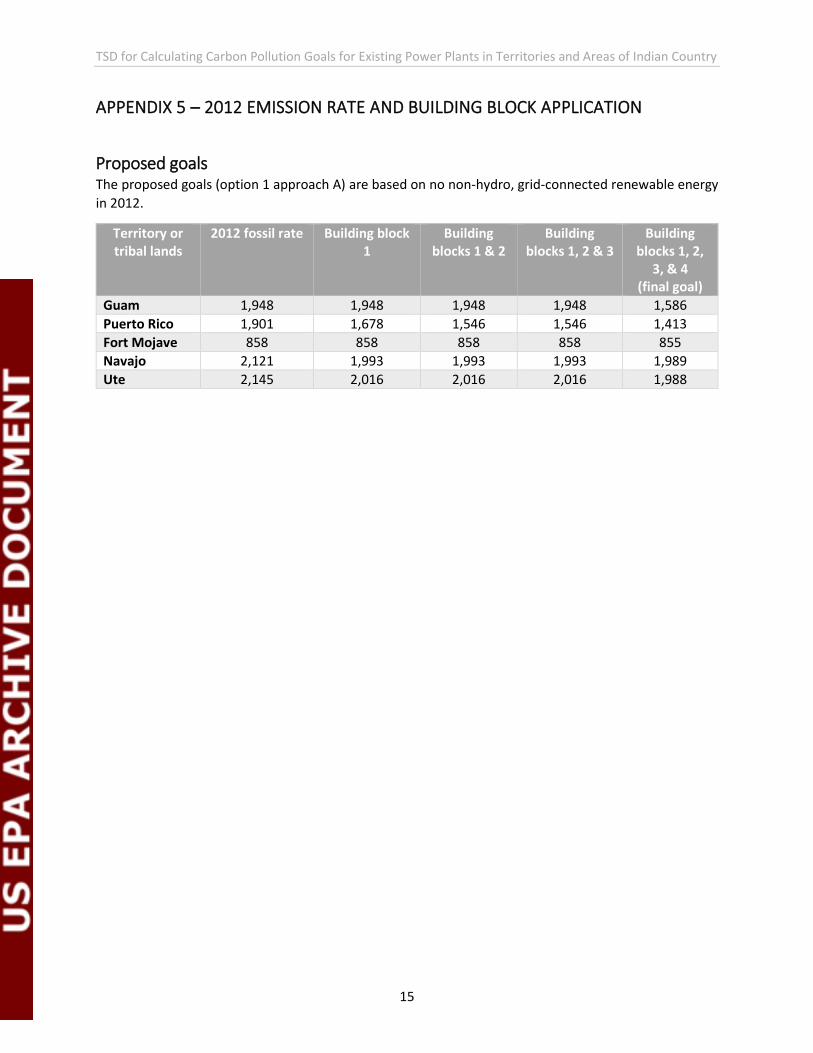
APPENDIX 5 – 2012 EMISSION RATE AND BUILDING BLOCK APPLICATION
Proposed goals The proposed goals (option 1 approach A) are based on no non-hydro, grid-connected renewable energy
in 2012.
Territory or tribal lands
2012 fossil rate Building block 1
Building blocks 1 & 2
Building blocks 1, 2 & 3
Building blocks 1, 2,
3, & 4 (final goal)
Guam 1,948 1,948 1,948 1,948 1,586
Puerto Rico 1,901 1,678 1,546 1,546 1,413
Fort Mojave 858 858 858 858 855
Navajo 2,121 1,993 1,993 1,993 1,989
Ute 2,145 2,016 2,016 2,016 1,988