Embed Size (px)
Citation preview
TECHNICAL SUPPORT DOCUMENT FOR THE PULP AND PAPER SECTOR: PROPOSED RULE
FOR MANDATORY REPORTING OF GREENHOUSE GASES
Office of Air and Radiation U.S. Environmental Protection Agency
February 11, 2009
ii
CONTENTS
Introduction ................................................................................................................................1 1. Source Description................................................................................................................1
2. Total Emissions.....................................................................................................................4 3. Types of Emissions to be Reported........................................................................................4
3.1 Process Emissions ........................................................................................................5 3.2 Combustion Emissions .................................................................................................6
4. Existing Relevant Reporting Programs/Methodologies..........................................................7 4.1 IPCC Guidelines...........................................................................................................8 4.2 ICFPA Guidance ..........................................................................................................9 4.3 WRI/WBCSD Calculation Procedure .........................................................................10 4.4 European Union (EU) Emissions Trading Scheme......................................................11 4.5 DOE Technical Guidelines .........................................................................................11 4.6 Environment Canada ..................................................................................................12 4.7 UK Emissions Trading Scheme ..................................................................................12 4.8 The Climate Registry..................................................................................................12 4.9 Japan ..........................................................................................................................13 4.10 Australia.....................................................................................................................13 4.11 California Air Resources Board (CARB) ....................................................................13
5. Options for Reporting Threshold .........................................................................................14 6. Options for Monitoring Methods .........................................................................................15
6.1 Boilers that Co-fire Biomass with Fossil Fuels ...........................................................15 6.2 Chemical Recovery Furnaces .....................................................................................22 6.3 Lime Kilns .................................................................................................................24 6.4 Makeup Chemicals .....................................................................................................25 6.5 Other Liquid Biofuels and Biogases ...........................................................................26
7. Procedures for Estimating Missing Data..............................................................................27
8. QA/QC Requirements .........................................................................................................28 9. Data to be Reported.............................................................................................................29
9.1 Additional Data for Verification .................................................................................29 9.2 Additional Data to be Retained Onsite ........................................................................30
10. References ..........................................................................................................................30
iii
LIST OF FIGURES
Figure 1. A Simplified Representation of the Kraft Pulping and Chemical Recovery System.......................................................................................................................3
LIST OF TABLES Table 3-1 GHG Emission Sources at Pulp, Paper, and Paperboard Facilities..............................5 Table 5-1 Reporting Thresholds for Pulp and Paper Sector ......................................................15 Table 6-1 GHG Monitoring Methods for Selected Pulp & Paper Sector Emission
Sources....................................................................................................................17 Table 6-2 CO2 Monitoring Options Considered for Biomass-fired Units..................................18 Table 6-3 Typical HHV values for Wood-based Biomass Fuels...............................................21 Table 6-4 Typical Boiler Efficiencies for Different Fuel Types................................................21 Table 6-5 Energy Required to Produce One Pound of Saturated Steam (Btu)...........................21 Table 6-6 Kraft Pulping Liquor Emissions Factors for Biomass-Based CO2, CH4, and
N2O .........................................................................................................................23 Table 6-7 Kraft Recovery Furnace Black Liquor and Fossil Fuel Firing in 2005 ......................24 Table 6-8 Kraft Lime Kiln and Calciner Emissions Factors for Fossil Fuel-Based CO2,
CH4, and N2O..........................................................................................................25 Table 6-9 CO2 Emissions from Calcium Carbonate and Sodium Carbonate Make-up in
the Pulp Mill............................................................................................................26
1
Introduction In December 2007, the United States (U.S.) Congress authorized the U.S Environmental Protection Agency (EPA) to develop mandatory greenhouse gas (GHG) reporting requirements as part of the enactment of the fiscal year 2008 Consolidated Appropriations Amendment. Specifically, EPA was authorized to:
“…develop and publish a draft rule not later than 9 months after the date of enactment of this Act [September 2008], and a final rule not later than 18 months after the date of enactment of this Act [June 2009], to require mandatory reporting of greenhouse gas emissions above appropriate thresholds in all sectors of the economy…”
The accompanying joint explanatory statement further directed EPA to “…include in its rule reporting of emissions resulting from upstream production and downstream sources, to the extent that the Administrator deems it appropriate. The Administrator shall determine appropriate thresholds of emissions above which reporting is required, and how frequently reports shall be submitted to EPA. The Administrator shall have discretion to use existing reporting requirements for electric generating units under Section 821 of the Clean Air Act....”
The purpose of this document is to present the background information used to support the development of the proposed mandatory GHG reporting requirements for the pulp and paper sector. Sections 1 and 2 provide an overview of the pulp and paper sector and total estimated quantity of GHGs emitted from the sector. Section 3 discussed the emissions sources that contribute to GHG emissions, and Section 4 provides a review of existing, relevant programs and methodologies for reporting GHG emissions. Section 5 discusses potential reporting thresholds for the pulp and paper sector, and Section 6 provides monitoring methods for measuring and estimating GHG emissions. Sections 7, 8, and 8 discuss procedures for estimating missing data, QA/QC, and reporting, respectively. References are provided in Section 10. 1. Source Description
The pulp and paper industry consists of approximately 5,520 facilities engaged in the manufacture of pulp, paper, and paperboard products from fibrous raw materials (e.g., primarily wood, but also some cotton and bagasse).1(U.S. Census Bureau 2008) The industry is grouped under the North American Industrial Classification System (NAICS) code 322 (Paper Manufacturing) and includes facilities that:
• produce market pulp (i.e., stand-alone pulp mills), • manufacture pulp and paper (integrated mills), • produce paper products from purchased pulp, • produce secondary fiber from recycled paper, and • convert paper into paperboard products (e.g., containers) and operate coating and
laminating processes.
1 Although related to the pulp and paper industry (through the common natural resource and often ownership and collocation of facilities), operations associated with the manufacture of wood products (e.g., lumber), grouped under NAICS code 321 (Wood Product Manufacturing), are not discussed in this document.
2
Less than 10 percent of the estimated 5,520 facilities included in NAICS code 322 are expected to be significant emitters of GHG’s. The subset of facilities that are expected to emit significant quantities of GHG’s are grouped under NAICS code 3221 (pulp, paper and paperboard mills). Facilities grouped under NAICS code 3221 operate fossil-fuel fired boilers and many also operate other sources of GHG emissions such as biomass boilers, lime kilns, onsite landfills, and onsite wastewater treatment systems. According to the U.S. Census, there are approximately 561 facilities included in NAICS code 3221.(U.S. Census Bureau 2008) Although some converting mills (NAICS code 3222) may operate onsite stationary combustion units (e.g., an oil or gas package boiler), these units are typically very small (e.g., <30 Million Btu/hr heat input capacity according to Pinkerton 2008), and thus few, if any, are expected to be significant emitters of GHG’s. Based on a survey of pulp and paper mills conducted by the National Council for Air and Stream Improvement (NCASI), there were approximately 425 pulp and paper mills that operated stationary combustion units (e.g., boilers, gas turbines, lime kilns, recovery furnaces, thermal oxidizers) in 2005 (NCASI 2006). All of these 425 mills fall under NAICS code 3221.
The production of paper or paperboard can be divided into three main process areas, which may or may not be co-located at the same facility: (1) pulp production; (2) pulp processing and chemical recovery (at chemical pulp mills); and (3) product forming. A fully-integrated chemical pulp and paper mill would include all three process areas. Some pulp and paper mills may also include converting operations (e.g., coating, box making, etc.); however, these operations are usually performed at separate facilities.
Different processes are used for pulp production. Chemical (i.e., kraft, soda, and sulfite)
pulping involves “cooking” of raw materials (e.g., wood chips) using aqueous chemical solutions and elevated temperature and pressure to extract pulp fibers. The kraft pulping process uses an alkaline cooking liquor of sodium hydroxide (NaOH) and sodium sulfide (Na2S) to digest wood, while the similar soda process uses only NaOH to digest the wood. Kraft pulping is by far the most common pulping process used by plants in the U.S. for virgin fiber.2 The cooking liquor in the sulfite pulping process is an acidic mixture of sulfurous acid (HSO3) and bisulfite ion (HSO3-). The bases used in cooking liquor preparation are typically calcium, magnesium, and sodium. Semi-chemical pulping uses a combination of chemical and mechanical (i.e., grinding) energy to extract pulp fibers. The chemical portion (e.g., cooking liquors, process equipment) of the pulping process and pulp washing steps are very similar to kraft and sulfite processes. In mechanical pulping, pulp fibers are separated from the raw materials (e.g., round wood, wood chips) by physical energy such as grinding or shredding, although some mechanical processes use thermal and/or chemical energy to pretreat raw materials. In the secondary fiber process, pulp fiber from previously manufactured products (e.g., cardboard, office paper) are recovered by hydration and agitation.
For economic and environmental reasons, chemical and semi-chemical pulp mills employ
chemical recovery processes to reclaim spent cooking chemicals. Typically, a combustion unit
2 As summarized in EPA/310-R-02-002, Profile of the Pulp and Paper Industry - 2nd edition (November 2002), kraft pulping processes produced approximately 83 percent of all US pulp tonnage during 2000 according to AF&PA. The AF&PA approximate percentages of U.S. pulp production for other processes (during 2000) were sulfite pulping (2 percent), semi-chemical pulping (6 percent), and mechanical pulping (9 percent).
3
(e.g., recovery furnace) is used to recover the cooking chemicals from spent cooking solutions (or liquors). Kraft and soda mills have an additional chemical recovery process in which a lime kiln is used to regenerate a portion of the chemical cooking solution.
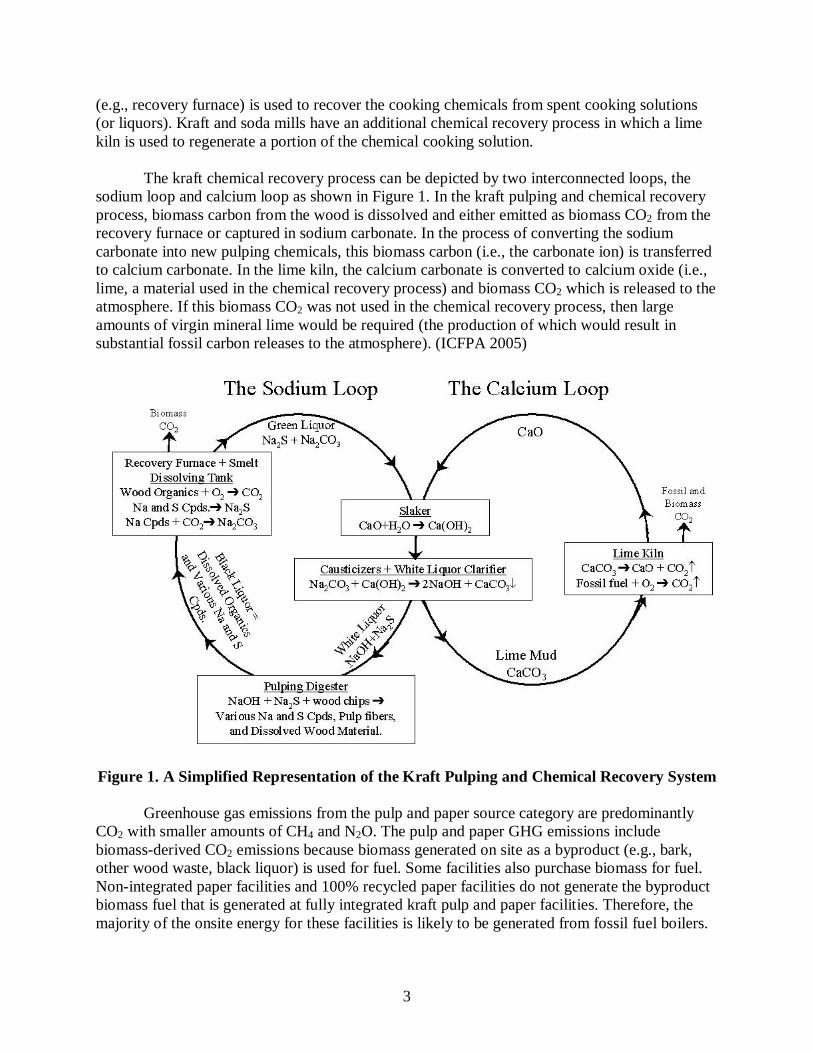
The kraft chemical recovery process can be depicted by two interconnected loops, the sodium loop and calcium loop as shown in Figure 1. In the kraft pulping and chemical recovery process, biomass carbon from the wood is dissolved and either emitted as biomass CO2 from the recovery furnace or captured in sodium carbonate. In the process of converting the sodium carbonate into new pulping chemicals, this biomass carbon (i.e., the carbonate ion) is transferred to calcium carbonate. In the lime kiln, the calcium carbonate is converted to calcium oxide (i.e., lime, a material used in the chemical recovery process) and biomass CO2 which is released to the atmosphere. If this biomass CO2 was not used in the chemical recovery process, then large amounts of virgin mineral lime would be required (the production of which would result in substantial fossil carbon releases to the atmosphere). (ICFPA 2005)
Figure 1. A Simplified Representation of the Kraft Pulping and Chemical Recovery System
Greenhouse gas emissions from the pulp and paper source category are predominantly CO2 with smaller amounts of CH4 and N2O. The pulp and paper GHG emissions include biomass-derived CO2 emissions because biomass generated on site as a byproduct (e.g., bark, other wood waste, black liquor) is used for fuel. Some facilities also purchase biomass for fuel. Non-integrated paper facilities and 100% recycled paper facilities do not generate the byproduct biomass fuel that is generated at fully integrated kraft pulp and paper facilities. Therefore, the majority of the onsite energy for these facilities is likely to be generated from fossil fuel boilers.
4
2. Total Emissions
Greenhouse gas emissions from the pulp and paper source category are not specified in the U.S. GHG Inventory (EPA 2008). However, the National Council for Air and Stream Improvement, Inc (NCASI) estimates that, in 2004, an estimated 57.7 million mtCO2e were directly emitted from the pulp and paper source category, excluding the biomass-derived GHG (NCASI 2008).
3. Types of Emissions to be Reported
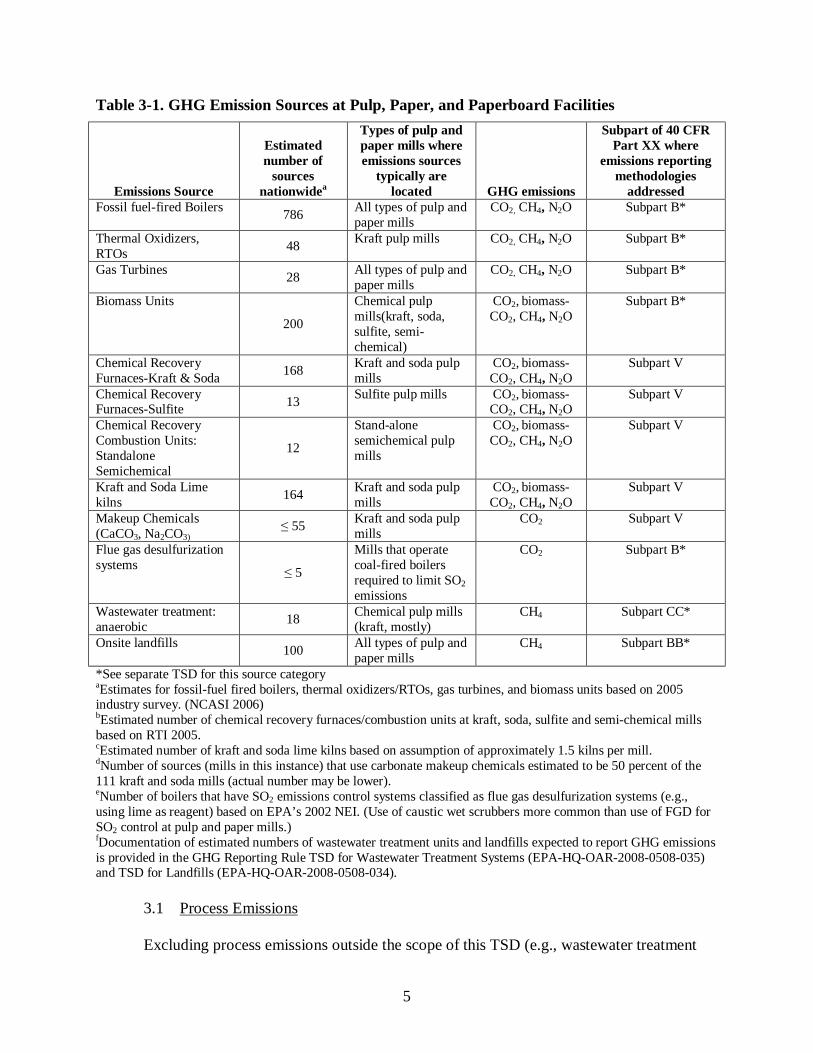
Table 3-1 lists the GHG emission sources that may be found at pulp and paper facilities and the GHG emissions that are required to be reported. Reporting of emissions from some GHG emission sources is addressed in separate subparts of the GHG reporting rule, and these types of emission sources are described in separate TSDs for the GHG reporting rule. This TSD discusses GHG emissions from: (1) Biomass units (also discussed in the TSD for Stationary Fuel Combustion Sources, EPA-HQ-OAR-2008-0508-004), (2) Chemical recovery furnaces/combustion units (kraft, soda, sulfite, and stand-alone semi-chemical), (3) Lime kilns, and (4) Makeup chemicals (CaCO3, Na2CO3).
Pulp and paper facilities would be required to report total purchased electricity and steam
in order to establish a total facility energy balance for verification purposes.
Many pulp and paper facilities generate over half of their energy needs from biomass fuels recovered from the pulp and paper production process. The AF&PA estimates that biomass comprises 64% of total fuel use by AF&PA members’ pulp and paper facilities. (AF&PA 2008) As discussed later in this TSD, many GHG estimation protocols consider biomass CO2 to be “carbon neutral” because the carbon in the biomass originates from the atmosphere and therefore have not required inclusion of biogenic emissions in their inventory totals. However, protocols such as the WRI/WBCSD GHG Protocol and U.S. EPA’s Climate Leaders program do require biomass derived CO2 emissions to be reported as additional information. Consistent with other GHG estimation protocols, the EPA is proposing to require reporting of both fossil- and biomass-derived GHG.
Biomass-derived fuels or biomass fuels means fuels derived from biomass which is
defined as “non-fossilized and biodegradable organic material originating from plants, animals and micro-organisms, including products, byproducts, residues and waste from agriculture, forestry and related industries as well as the non-fossilized and biodegradable organic fractions of industrial and municipal wastes, including gases and liquids recovered from the decomposition of non-fossilized and biodegradable organic material.” For the pulp and paper source category, this includes unadulterated wood, wood residue, and wood products (e.g., trees, tree stumps, tree limbs, bark, lumber, sawdust, sanderdust, chips, scraps, slabs, millings, wood shavings, paper pellets, and old corrugated container rejects); pulp and paper facility wastewater treatment system sludge, vegetative agricultural and silvicultural materials, such as logging residues (slash), nut and grain hulls and chaff (e.g., almond, walnut, peanut, rice, and wheat), bagasse, orchard prunings, corn stalks, coffee bean hulls and grounds.
5
Table 3-1. GHG Emission Sources at Pulp, Paper, and Paperboard Facilities
Emissions Source
Estimated number of
sources nationwidea
Types of pulp and paper mills where emissions sources
typically are located GHG emissions
Subpart of 40 CFR Part XX where
emissions reporting methodologies
addressed Fossil fuel-fired Boilers 786 All types of pulp and
paper mills CO2, CH4, N2O Subpart B*
Thermal Oxidizers, RTOs 48 Kraft pulp mills CO2, CH4, N2O Subpart B*
Gas Turbines 28 All types of pulp and paper mills
CO2, CH4, N2O Subpart B*
Biomass Units
200
Chemical pulp mills(kraft, soda, sulfite, semi-chemical)
CO2, biomass-CO2, CH4, N2O
Subpart B*
Chemical Recovery Furnaces-Kraft & Soda 168 Kraft and soda pulp
mills CO2, biomass-CO2, CH4, N2O
Subpart V
Chemical Recovery Furnaces-Sulfite 13 Sulfite pulp mills CO2, biomass-
CO2, CH4, N2O Subpart V
Chemical Recovery Combustion Units: Standalone Semichemical
12
Stand-alone semichemical pulp mills
CO2, biomass-CO2, CH4, N2O
Subpart V
Kraft and Soda Lime kilns 164 Kraft and soda pulp
mills CO2, biomass-CO2, CH4, N2O
Subpart V
Makeup Chemicals (CaCO3, Na2CO3)
≤ 55 Kraft and soda pulp mills
CO2 Subpart V
Flue gas desulfurization systems ≤ 5
Mills that operate coal-fired boilers required to limit SO2 emissions
CO2 Subpart B*
Wastewater treatment: anaerobic 18 Chemical pulp mills
(kraft, mostly) CH4 Subpart CC*
Onsite landfills 100 All types of pulp and paper mills
CH4 Subpart BB*
*See separate TSD for this source category aEstimates for fossil-fuel fired boilers, thermal oxidizers/RTOs, gas turbines, and biomass units based on 2005 industry survey. (NCASI 2006) bEstimated number of chemical recovery furnaces/combustion units at kraft, soda, sulfite and semi-chemical mills based on RTI 2005. cEstimated number of kraft and soda lime kilns based on assumption of approximately 1.5 kilns per mill. dNumber of sources (mills in this instance) that use carbonate makeup chemicals estimated to be 50 percent of the 111 kraft and soda mills (actual number may be lower). eNumber of boilers that have SO2 emissions control systems classified as flue gas desulfurization systems (e.g., using lime as reagent) based on EPA’s 2002 NEI. (Use of caustic wet scrubbers more common than use of FGD for SO2 control at pulp and paper mills.) fDocumentation of estimated numbers of wastewater treatment units and landfills expected to report GHG emissions is provided in the GHG Reporting Rule TSD for Wastewater Treatment Systems (EPA-HQ-OAR-2008-0508-035) and TSD for Landfills (EPA-HQ-OAR-2008-0508-034).
3.1 Process Emissions
Excluding process emissions outside the scope of this TSD (e.g., wastewater treatment
6
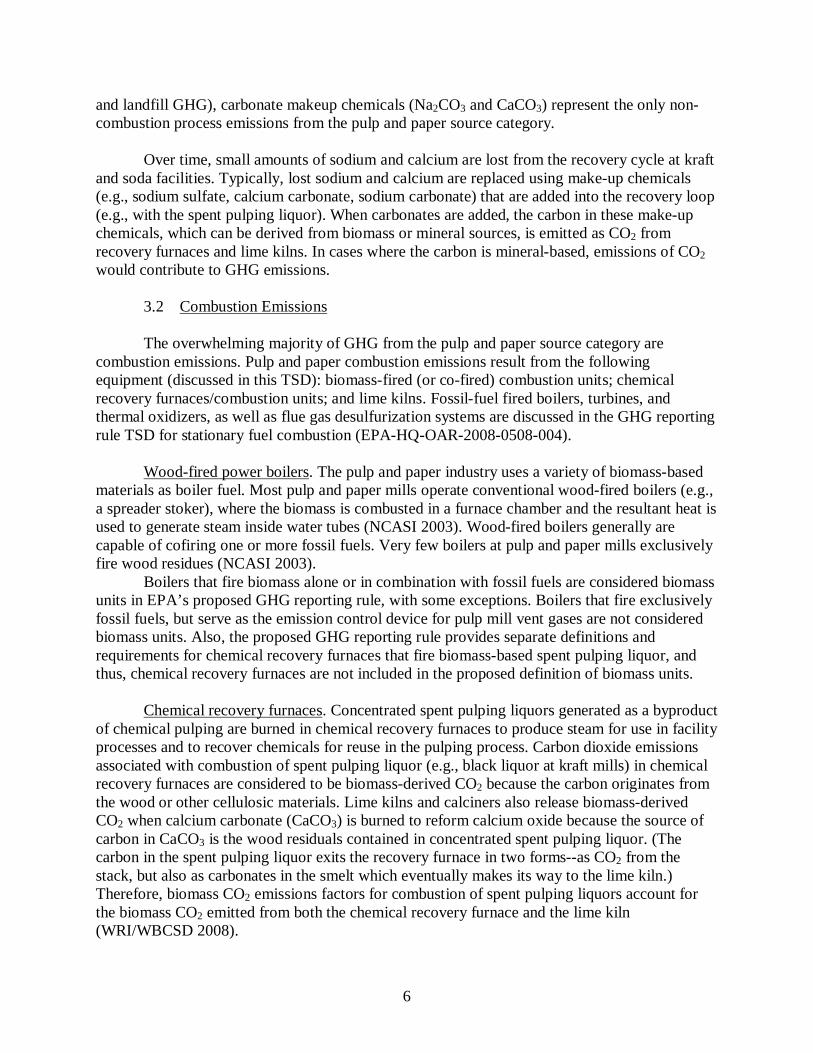
and landfill GHG), carbonate makeup chemicals (Na2CO3 and CaCO3) represent the only non-combustion process emissions from the pulp and paper source category.
Over time, small amounts of sodium and calcium are lost from the recovery cycle at kraft and soda facilities. Typically, lost sodium and calcium are replaced using make-up chemicals (e.g., sodium sulfate, calcium carbonate, sodium carbonate) that are added into the recovery loop (e.g., with the spent pulping liquor). When carbonates are added, the carbon in these make-up chemicals, which can be derived from biomass or mineral sources, is emitted as CO2 from recovery furnaces and lime kilns. In cases where the carbon is mineral-based, emissions of CO2 would contribute to GHG emissions.
3.2 Combustion Emissions The overwhelming majority of GHG from the pulp and paper source category are combustion emissions. Pulp and paper combustion emissions result from the following equipment (discussed in this TSD): biomass-fired (or co-fired) combustion units; chemical recovery furnaces/combustion units; and lime kilns. Fossil-fuel fired boilers, turbines, and thermal oxidizers, as well as flue gas desulfurization systems are discussed in the GHG reporting rule TSD for stationary fuel combustion (EPA-HQ-OAR-2008-0508-004). Wood-fired power boilers. The pulp and paper industry uses a variety of biomass-based materials as boiler fuel. Most pulp and paper mills operate conventional wood-fired boilers (e.g., a spreader stoker), where the biomass is combusted in a furnace chamber and the resultant heat is used to generate steam inside water tubes (NCASI 2003). Wood-fired boilers generally are capable of cofiring one or more fossil fuels. Very few boilers at pulp and paper mills exclusively fire wood residues (NCASI 2003).
Boilers that fire biomass alone or in combination with fossil fuels are considered biomass units in EPA’s proposed GHG reporting rule, with some exceptions. Boilers that fire exclusively fossil fuels, but serve as the emission control device for pulp mill vent gases are not considered biomass units. Also, the proposed GHG reporting rule provides separate definitions and requirements for chemical recovery furnaces that fire biomass-based spent pulping liquor, and thus, chemical recovery furnaces are not included in the proposed definition of biomass units. Chemical recovery furnaces. Concentrated spent pulping liquors generated as a byproduct of chemical pulping are burned in chemical recovery furnaces to produce steam for use in facility processes and to recover chemicals for reuse in the pulping process. Carbon dioxide emissions associated with combustion of spent pulping liquor (e.g., black liquor at kraft mills) in chemical recovery furnaces are considered to be biomass-derived CO2 because the carbon originates from the wood or other cellulosic materials. Lime kilns and calciners also release biomass-derived CO2 when calcium carbonate (CaCO3) is burned to reform calcium oxide because the source of carbon in CaCO3 is the wood residuals contained in concentrated spent pulping liquor. (The carbon in the spent pulping liquor exits the recovery furnace in two forms--as CO2 from the stack, but also as carbonates in the smelt which eventually makes its way to the lime kiln.) Therefore, biomass CO2 emissions factors for combustion of spent pulping liquors account for the biomass CO2 emitted from both the chemical recovery furnace and the lime kiln (WRI/WBCSD 2008).
7
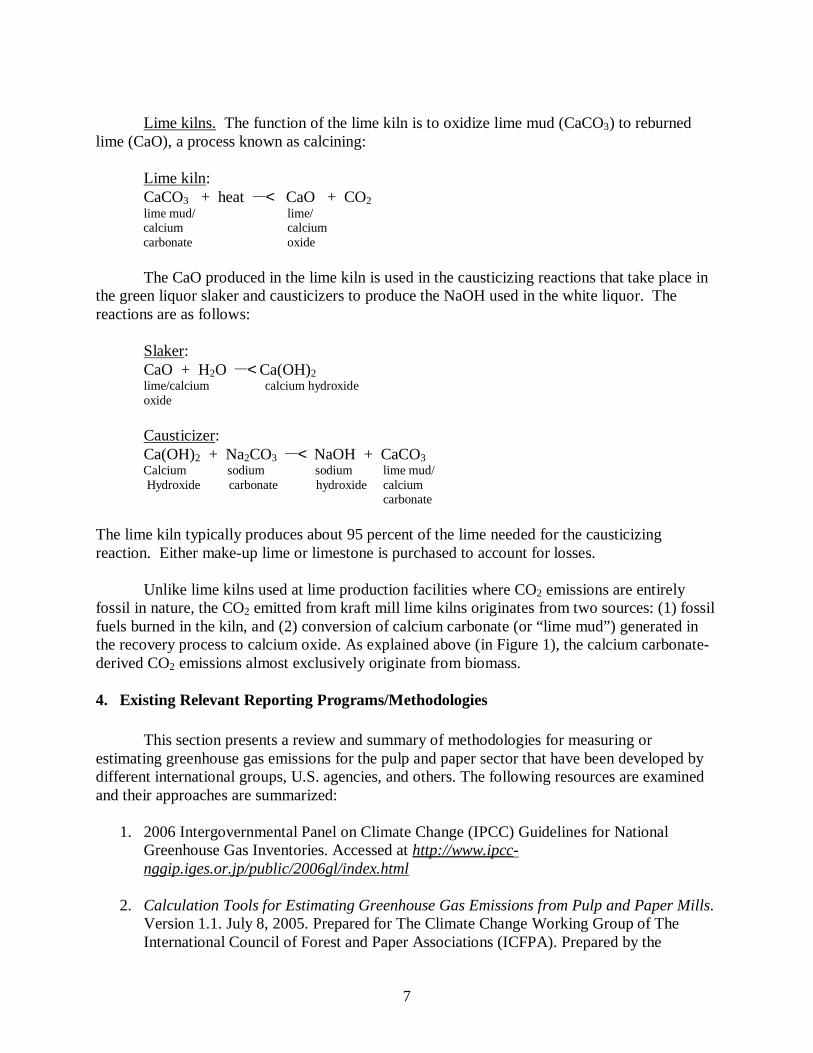
Lime kilns. The function of the lime kiln is to oxidize lime mud (CaCO3) to reburned
lime (CaO), a process known as calcining: Lime kiln: CaCO3 + heat < CaO + CO2
lime mud/ lime/ calcium calcium carbonate oxide
The CaO produced in the lime kiln is used in the causticizing reactions that take place in the green liquor slaker and causticizers to produce the NaOH used in the white liquor. The reactions are as follows:
Slaker: CaO + H2O < Ca(OH)2
lime/calcium calcium hydroxide oxide Causticizer: Ca(OH)2 + Na2CO3 < NaOH + CaCO3
Calcium sodium sodium lime mud/ Hydroxide carbonate hydroxide calcium carbonate The lime kiln typically produces about 95 percent of the lime needed for the causticizing reaction. Either make-up lime or limestone is purchased to account for losses.
Unlike lime kilns used at lime production facilities where CO2 emissions are entirely fossil in nature, the CO2 emitted from kraft mill lime kilns originates from two sources: (1) fossil fuels burned in the kiln, and (2) conversion of calcium carbonate (or “lime mud”) generated in the recovery process to calcium oxide. As explained above (in Figure 1), the calcium carbonate-derived CO2 emissions almost exclusively originate from biomass. 4. Existing Relevant Reporting Programs/Methodologies
This section presents a review and summary of methodologies for measuring or estimating greenhouse gas emissions for the pulp and paper sector that have been developed by different international groups, U.S. agencies, and others. The following resources are examined and their approaches are summarized:
1. 2006 Intergovernmental Panel on Climate Change (IPCC) Guidelines for National Greenhouse Gas Inventories. Accessed at http://www.ipcc-nggip.iges.or.jp/public/2006gl/index.html
2. Calculation Tools for Estimating Greenhouse Gas Emissions from Pulp and Paper Mills.
Version 1.1. July 8, 2005. Prepared for The Climate Change Working Group of The International Council of Forest and Paper Associations (ICFPA). Prepared by the
8
National Council for Air and Stream Improvement. Accessed at http://www.ghgprotocol.org/calculation-tools/pulp-and-paper
3. World Resources Institute (WRI) and World Business Council for Sustainable
Development (WBCSD). The greenhouse gas protocol: A corporate accounting and reporting standard, Revised edition. Accessed at http://www.ghgprotocol.org/files/ghg-protocol-revised.pdf
4. European Union’s Commission Decision of 18 July 2007 establishing guidelines for the
monitoring and reporting of greenhouse gas emissions pursuant to Directive 2003/87/EC of the European Parliament and of the Council. Accessed at http://eur-lex.europa.eu/LexUriServ/site/en/oj/2007/l_229/l_22920070831en00010085.pdf
5. U.S. Department of Energy (DOE). Technical Guidelines: Voluntary Reporting Of
Greenhouse Gases (1605(b)) Program. Accessed at http://www.eia.doe.gov/oiaf/1605/January2007_1605bTechnicalGuidelines.pdf
6. Canadian Environmental Protection Act, 1999. Notice with respect to reporting of
greenhouse gases (GHGs) for 2007. Accessed at http://canadagazette.gc.ca/partI/2007/20070303/html/notice-e.html#i3
7. United Kingdom’s Guidelines for the Measurement and Reporting of Emissions by Direct
Participants in the UK Emissions Trading Scheme. Accessed at http://www.defra.gov.uk/environment/climatechange/trading/uk/pdf/trading-reporting.pdf
8. The Climate Registry’s General Reporting Protocol for the Voluntary Reporting
Program. March 2008, Accessed at http://www.theclimateregistry.org/downloads/GRP.pdf
9. National Greenhouse Gas Inventory Report of Japan. 2008. Accessed at http://www-
gio.nies.go.jp/aboutghg/nir/2008/NIR_JPN_2008_v3.0E.pdf
10. Australia’s Technical Guidelines for the Estimation of Greenhouse Emissions and Energy at Facility Level: Energy, Industrial Process and Waste Sectors in Australia. Accessed at http://www-gio.nies.go.jp/aboutghg/nir/2008/NIR_JPN_2008_v3.0E.pdf
11. California Air Resources Board (CARB) Staff Report: Initial Statement of Reasons for
Rulemaking, Proposed Regulation for Mandatory Reporting of Greenhouse Emissions. October 19, 2007. Accessed at http://www.arb.ca.gov/regact/2007/ghg2007/ghg2007.htm
4.1 IPCC Guidelines
The 2006 IPCC Guidelines for National Greenhouse Gas Inventories were developed to
support the United Nations Framework Convention on Climate Change (UNFCCC) to assist countries in compiling national inventories of greenhouse gases. The IPCC guidelines do not
9
address process equipment or approaches specific to the pulp and paper sector for measuring or estimating GHG.
The IPCC guidelines do address treatment of biomass combustion. The IPCC guidelines require that CO2 emissions from combustion of biomass fuels be estimated based on emission factors and reported for informational purposes items but not included in the industry sector or national totals. The IPCC suggests that the biomass-derived CO2 information is useful for cross-checking purposes as well as to avoiding double counting. The emissions of biomass CH4 and N2O, however, are estimated and included in the sector and national totals according to the IPCC methodology because biomass-derived CH4 and N2O emissions are in addition to forest carbon stock changes. When biofuels are combusted jointly with fossil fuels, the IPCC indicates that the split between the fossil and non-fossil fraction of the fuel should be established and the emission factors applied to the appropriate fractions.(IPCC 2006, section 2.3.3.4) The IPCC refers to the Pulp and Paper Greenhouse Gas Calculation Tools available via the WRI/WBCSD (i.e., the ICFPA tools discussed below) for methods to convert from net calorific value (NCV) to gross calorific values (GCV) for bark, wood, and wood waste.(IPCC 2006, section 1.4.1.2)
The IPCC states that use of CEMS for stationary combustion sources (e.g., fossil or biomass) is generally not justified due to cost but could be undertaken when CEMS are used for other pollutants (e.g, NOx or SO2). The IPCC also notes that CEMS could be useful for solid fuels where it is more difficult to measure fuel flow rates, or when fuels are highly variable, or fuel analysis is otherwise expensive.(IPCC 2006, section 2.1.1.3)
4.2 ICFPA Guidance
The International Council of Forests and Paper Associations (ICFPA) guidance, Calculation Tools for Estimating Greenhouse Gas Emissions from Pulp and Paper Mills, Version 1.1. July 8, 2005, was developed by the National Council for Air and Stream Improvement (NCASI) for use in fulfilling the requirements of other GHG accounting protocols (i.e., WRI/WBCSD, U.S. EPA Climate Leaders, IPCC, and others). An Excel workbook is provided along with the ICFPA guidance to aid in calculating GHG from the pulp and paper sector. For purposes of estimating pulp and paper sector GHG emissions, the ICFPA guidance addresses:
• CO2, CH4 and N2O emissions from stationary fossil fuel combustion • CO2 emissions from biomass combustion* • CH4 and N2O emissions from recovery furnaces, biomass-fired boilers, and lime kilns* • CO2 emissions from make-up CaCO3 or Na2CO3 used in the pulp mill • CO2, CH4, and N2O emissions from transportation and mobile sources • CH4 emissions attributable to mill wastes in landfills and anaerobic waste treatment
operations • emissions from mobile sources (e.g., company-owned harvesting equipment and
company-owned truck fleets) • fossil fuel-derived CO2 exported to satellite precipitated calcium carbonate (PCC) plants* • imports of CO2 (e.g., for pH neutralization) • GHG emissions associated with power and steam that is imported and consumed • GHG emissions attributable to power and steam exports
10
Items marked with a “*” in the list above are specific to the pulp and paper source category and are discussed in this TSD. The GHG estimation methods discussed in this TSD are nearly identical to those in the ICFPA guidance.
Fossil-fuel combustion. The ICFPA guidance estimates CO2 emissions from fossil fuel combustion based on the carbon content of the fuel (or a comparable emission factor) and the amount burned. It is recommended in the ICFPA guidance that emission factors specific to fuels combusted at the facility be obtained from fuel vendors (if available). The ICFPA guidance refers to the IPCC emission factors for estimating CH4 and N2O emissions from fossil fuel combustion.
The ICFPA report indicates that combustion efficiencies of some natural gas-fired combustion devices (e.g., some types of gas-fired dryers) and emission control devices such as regenerative catalytic oxidizers (RCOs) and regenerative thermal oxidizers (RTOs) can sometimes be relatively low compared to power boilers, allowing a portion of the fuel to exit the combustion device as methane. The guidance suggests use of reliable data (e.g., CH4 emission test results), if available, to adjust emission-factor derived estimates to account for unburned fuel.
Biomass combustion. The ICFPA guidance provides tools for estimating GHG emissions from pulp and paper mills to allow companies to estimate CO2 releases derived from biomass, but, consistent with other protocols, the ICFPA protocol suggests that biomass carbon is not included in GHG emission totals (i.e., it is tracked separately for informational purposes) since biomass carbon is considered “carbon neutral.” The ICFPA guidelines suggest that CH4 and N2O emissions from combustion processes, both fossil fuel and biomass, may be estimated using fuel-based emission factors in the ICFPA guidelines and activity data. Available CH4 and N2O emission factors are provided in the ICFPA guidance for wood-fired boilers and for chemical recovery furnaces. For boilers co-fired with biomass and fossil fuels, the ICFPA guidance suggests using the most relevant emission factors for the boiler and fuel type and fuel consumption rates.
PCC exports. The ICFPA protocol explains that, at number of mills around the world,
stack gas from lime kilns or calciners is piped to adjacent precipitated calcium carbonate (PCC) plants for use as a raw material (PCC is sometimes used as an inorganic filler or coating material in paper and paperboard products). The ICFPA recommends that these exports of fossil fuel-derived CO2 not be included in the estimates of GHG emissions because they are not emitted by the mill. If the mill also wants to show the amounts of biomass-derived CO2 that are exported with lime kiln stack gas, it can include this as additional information.
4.3 WRI/WBCSD Calculation Procedure
The WRI/WBCSD GHG Protocol requires that biomass-derived carbon be estimated and reported separately as additional information (but not included in the total GHG emissions). The industry-specific guidance offered by the WRI for the pulp and paper sector is the ICFPA guidance discussed above.
11
4.4 European Union (EU) Emissions Trading Scheme
The EU guidance includes a tiered approach to determining GHG emissions with the
highest tier being the most stringent and most accurate. Tier 1 (for material flow activity data and emission factor) or no-tier (for composition data, conversion factor, net caloric value) is required for the pulp and paper sector.
De minimus. Source streams are defined as: (1) “de-minimus” sources that collectively contribute less than 1,000 MT CO2/yr or that contribute less than 2% of total emissions up to 20,000 MT/yr; (2) “minor” sources that collectively contribute less than 5,000 MT CO2/yr or that contribute less than 10% of total emissions up to 100,000 MT/yr; and (3) “major” sources that include all other streams. The highest tier must be used for major source streams unless it is not technically feasible. Tier 1 can be used for minor source streams, and a facility may use their own no-tier method for de-minimus streams.
Treatment of biomass. The EU guidance treats biomass as CO2-neutral and does not require separate reporting of biomass. Section 12 of the EU Guidance provides an extensive list of CO2-neutral biomass materials for which emissions are to be treated as zero. No-tier approaches may be applied for biomass fuel and materials qualifying as “pure” (i.e., fuels with no more than 3% non-biomass carbon in the total amount of carbon entering or leaving the process as determined by mass-balance). (EU sections 5.2, 13.4, and definitions).
Treatment of makeup chemicals. Annex XI of the EU guidance (Annex XI Activity-specific guidelines for pulp and paper producing installations as listed in Annex I to Directive 2003/87/EC) specifies two tiers for determining the mass of makeup chemicals CaCO3 and Na2CO3 consumed in the process:
Tier 1: Amounts [t] of CaCO3 and Na2CO3 consumed in the process as determined by the operator or his suppliers with a maximum uncertainty of less than ± 2.5 %.
Tier 2: Amounts [t] of CaCO3 and Na2CO3 consumed in the process as determined by the operator or his suppliers with a maximum uncertainty of less than ± 1.5 %.
Only one tier is specified for the makeup chemical emission factors which includes the same emission factors presented in this TSD (i.e., an emission factor of 0 for biomass and the factors presented in section 3.2.4 below for makeup CaCO3 and Na2CO3).
Treatment of exports. Like the ICFPA guidance, the EU guidance indicates that exported fossil fuel-derived CO2 (e.g., to an adjacent PCC installation) shall not be included in the reporting pulp and paper mill’s emissions.
4.5 DOE Technical Guidelines Unlike for some industrial sectors, the DOE Technical Guidelines do not address the pulp and paper sector specifically. However, the DOE technical guidelines do discuss treatment of biomass-derived emissions as follows:
12
• Reporters need not include CO2 released by the calcination of CaCO3 for the purpose of
lime manufacture in the Kraft pulping process in their emissions inventories because this CO2 is biogenic.
• CO2 emissions from biogenic fuels (e.g., wood, black liquor used in the pulp and paper industry) do not “count” as anthropogenic emissions under the UNFCCC because the carbon embedded in biogenic fuels is presumed to form part of the natural carbon cycle. Carbon dioxide emissions from the combustion of biomass fuel, including discarded forest products, should not be included in either direct or indirect emissions and their quantity should not be included in combination with any other emissions category nor appear in totals or net quantities.3 CO2 emissions from the non-combustion oxidation of biomass (e.g., forest floor litter, biomass products, or discarded forest products such as mill shavings) are similarly considered carbon neutral.
• CH4 and N2O emissions from biogenic fuels are considered anthropogenic. CH4 and N2O emissions are generally a product of low-temperature (incomplete) combustion. Reporters should consider methane and nitrous oxide emissions from combustion of biogenic fuels.
For industrial sector-specific emission estimation guidance, Part E of the DOE Technical
Guidelines lists references to the protocols offered by, among others, the WRI/WBCSD, U.S. EPA Climate Leaders Program, and IPCC. The hierarchy for determining emissions in the DOE technical guidelines for combustion is generally, in order or preference, direct measurement (e.g., with CEM), mass balance calculations (for CO2), and inference from activity data and sample emissions measurement (for CH4 and N2O). The DOE Technical Guidelines refer to EPA’s AP-42 for default CH4 and N2O emission factors for biogenic fuel sources.
4.6 Environment Canada
Unlike for some industries, Environment Canada does not provide a guidance manual specific to the pulp and paper industry for GHG reporting. Facilities may choose their reporting methodology provided that it is consistent with the guidelines adopted by the UNFCCC and developed by the IPCC. The reporting threshold for Canada’s mandatory reporting rule is 100,000 MtCO2e. Facilities are required to quantify CO2, CH4, and N2O associated with biomass combustion, but only the CH4 and N2O count towards the 100,000 MtCO2e threshold. Facilities must report biomass combustion CO2 separately (i.e., the biomass CO2 does not count towards 100,000 MtCO2e threshold).
4.7 UK Emissions Trading Scheme
For the UK emissions trading scheme, eligible renewable energy (including biomass) has a CO2 emission factor of zero. No guidance specific to the pulp and paper sector was found.
4.8 The Climate Registry
The Climate Registry report addresses makeup carbonates in Appendix E.10 by referring to the approaches in IPCC 2006, ICFPA 2005, and the EU Guidelines for
3 The DOE protocol does not require separate reporting of biomass-combustion CO2.
13
monitoring and reporting of greenhouse emissions, 2006, Annex XI (all discussed above). For biomass combustion, the report indicates that direct biomass-related CO2 emissions are to be reported separately. CH4 and N2O emissions related to biomass combustion are to be reported as any other GHG. The Climate Registry report indicates that the biomass-related CO2 emissions from co-fired biomass combustion units with CEMS should be back calculated using emission factors and subtracted from the CEMS results.
4.9 Japan In the National Greenhouse Gas Inventory Report of Japan (in accordance with the IPCC approach) biomass-related CO2 emissions are reported separately for information purposes but not included in total GHG emissions.
4.10 Australia
Australia’s Guidelines indicate that reporters must report consumption of biomass energy. In accordance with international guidelines, the CO2 emissions from the consumption of this biomass energy must be reported, but are recorded as a memo item and are not included in facility emission totals. Non-CO2 biomass emissions, however, are both reported and included in facility emission totals.
4.11 California Air Resources Board (CARB)
The CARB is developing a mandatory GHG reporting rule. A draft of the rule was published for public comment in May 2008. CARB’s reporting rule would require pulp and paper facilities with emissions of 25,000 MtCO2e/yr from stationary combustion to report (though the pulp and paper sector is not specifically named in the rule). Emissions of CO2, CH4, and N2O would be reported. CO2 emissions from biomass fuels would be reported separately, while CH4 and N2O from biomass fuels would be included in total emissions.
CO2 emissions from biomass combustion may be measured with a CO2 CEMS (where the
biomass portion of CO2 is subtracted out for co-fired units) or calculated. Source specific emission factors from CARB-approved emissions tests may also be used.
CARB proposed a de minimus of up to 3 percent of a facility’s CO2 equivalent emissions
(not to exceed an upper limit of 10,000 metric tonnes) in section 95103(6). The upper limit may be increased to 20,000 metric tonnes for this de minimus provision per modified regulatory language.
Similar to the EU, CARB defines “pure” as “consisting of at least 97 percent by mass of a specified substance. For facilities burning biomass fuels, this means the fraction of biomass carbon accounts for at least 97 percent of the total amount of carbon in the fuel burned at the facility.” Under the CARB rule, a boiler that fires 97 percent biomass is considered a “pure biomass boiler.”
14
5. Options for Reporting Threshold Many pulp and paper facilities emit hundreds of thousands of tons of GHG, including significant quantities of biomass-derived carbon. The majority of GHG emissions in pulp and paper sector are from combustion sources. The following options were considered for establishing a reporting threshold for the pulp and paper sector:
(1) Reporting by NAICS code (2) Production-based threshold (3) Reporting threshold based on total non-biogenic GHG emissions (4) Reporting threshold based on total GHG emissions (including biogenic sources)
As discussed in Section 1, those facilities in the pulp and paper sector that are most likely to emit significant quantities of GHG emissions are included in the “pulp, paper, and paperboard” category under NAICS code 3221. The U.S. Census reports that there are 561 mills in this category (U.S. Census Bureau 2008). Based on an industry survey, approximately 425 pulp, paper, and paperboard mills operate stationary combustion sources (e.g., boilers, gas turbines, recovery furnaces, lime kilns, thermal oxidizers).(NCASI 2006) Although the most significant emitters of GHGs are expected to be included under NAICS code 3221, it is possible that (1) some smaller, non-integrated mills included in NAICS code 3221 may not be significant emitters of GHGs, and that (2) some mills not classified under NAICS code 3221 may be significant emitters of GHG’s due to combustion of fossil fuels.
A process or production-based reporting threshold can also be problematic for several reasons. First, there are many types of paper grades and numerous ways production data are reported, and thus a single production-based threshold would not suffice. Second, production data do not always correlate to GHG emissions, particularly when considering biogenic vs. non-biogenic CO2 emissions. For example, two mills may produce the same amount of paper, but if one facility is a paper mill that purchases 100% of its pulp for papermaking and the other mill is a fully integrated pulp and paper mill, the GHG emission profiles would be very different. A third reason for not providing alternate production-based thresholds is that most mills consider actual production information to be confidential. A potential solution to that issue would be to use a capacity-based threshold; however this would not resolve the other issues associated with production-based thresholds described above. Finally, many pulp and paper companies and individual mills have already determined the quantity of green house gases emitted from their facility(ies) using the Calculation Tools for Estimating Greenhouse Gas Emissions from Pulp and Paper Mills (Version 1.1. July 8, 2005), and thus facilities in this sector should be able to readily determine if the mandatory reporting requirements apply to their facility. The Calculation Tools also provide guidance on estimating CO2 emissions from combustion of biomass even though these emissions are not currently “counted” in national and international GHG emissions inventories.
Reporting thresholds based on either total non-biogenic GHG emissions or total combined biogenic and non-biogenic emissions were also considered. As discussed previously in section 4, some existing GHG estimation protocols consider biomass CO2 to be “carbon neutral” because the carbon in the biomass originates from the atmosphere and therefore have not required inclusion of biogenic emissions in their inventory totals. However, protocols such as the
15
WRI/WBCSD GHG Protocol and U.S. EPA’s Climate Leaders program do require biomass derived CO2 emissions to be reported as additional information. Therefore, a reporting threshold for the pulp and paper source category based on non-biogenic GHG, along with separate quantification and reporting of the biomass-derived CO2 from pulp and paper facilities, would be consistent with existing relevant protocols. Separate reporting of biomass-derived CO2 would help ensure a complete GHG inventory (given that so many facilities co-fire biomass and fossil fuels in their onsite boilers). The baseline inventory would be the starting point for tracking changes in GHG emissions and in the proportions of those emissions that are fossil- or biomass-related.
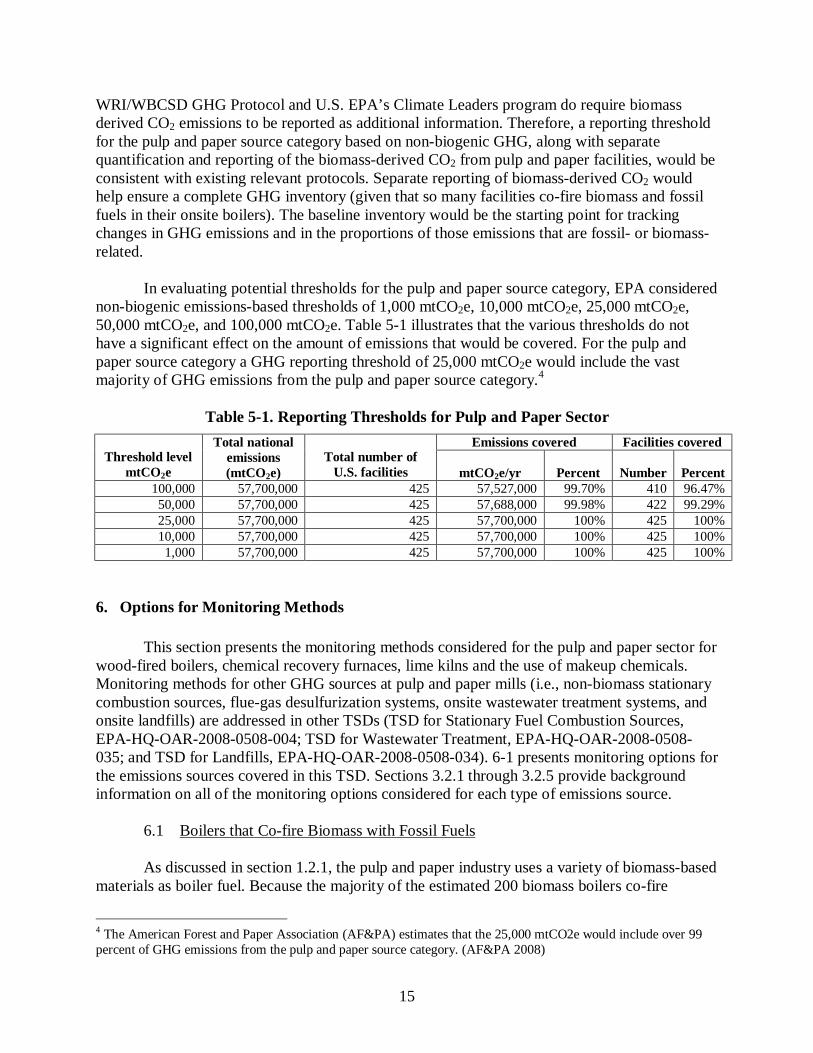
In evaluating potential thresholds for the pulp and paper source category, EPA considered non-biogenic emissions-based thresholds of 1,000 mtCO2e, 10,000 mtCO2e, 25,000 mtCO2e, 50,000 mtCO2e, and 100,000 mtCO2e. Table 5-1 illustrates that the various thresholds do not have a significant effect on the amount of emissions that would be covered. For the pulp and paper source category a GHG reporting threshold of 25,000 mtCO2e would include the vast majority of GHG emissions from the pulp and paper source category.4
Table 5-1. Reporting Thresholds for Pulp and Paper Sector
Emissions covered Facilities covered Threshold level
mtCO2e
Total national emissions (mtCO2e)
Total number of U.S. facilities mtCO2e/yr Percent Number Percent
100,000 57,700,000 425 57,527,000 99.70% 410 96.47% 50,000 57,700,000 425 57,688,000 99.98% 422 99.29% 25,000 57,700,000 425 57,700,000 100% 425 100% 10,000 57,700,000 425 57,700,000 100% 425 100% 1,000 57,700,000 425 57,700,000 100% 425 100%
6. Options for Monitoring Methods
This section presents the monitoring methods considered for the pulp and paper sector for wood-fired boilers, chemical recovery furnaces, lime kilns and the use of makeup chemicals. Monitoring methods for other GHG sources at pulp and paper mills (i.e., non-biomass stationary combustion sources, flue-gas desulfurization systems, onsite wastewater treatment systems, and onsite landfills) are addressed in other TSDs (TSD for Stationary Fuel Combustion Sources, EPA-HQ-OAR-2008-0508-004; TSD for Wastewater Treatment, EPA-HQ-OAR-2008-0508-035; and TSD for Landfills, EPA-HQ-OAR-2008-0508-034). 6-1 presents monitoring options for the emissions sources covered in this TSD. Sections 3.2.1 through 3.2.5 provide background information on all of the monitoring options considered for each type of emissions source.
6.1 Boilers that Co-fire Biomass with Fossil Fuels
As discussed in section 1.2.1, the pulp and paper industry uses a variety of biomass-based materials as boiler fuel. Because the majority of the estimated 200 biomass boilers co-fire
4 The American Forest and Paper Association (AF&PA) estimates that the 25,000 mtCO2e would include over 99 percent of GHG emissions from the pulp and paper source category. (AF&PA 2008)
16
biomass with fossil fuels, the GHG emissions from these boilers will include both biogenic and non-biogenic CO2 emissions. The proposed GHG reporting requirements specify that biogenic CO2 emissions must be reported separately from non-biogenic CO2 emissions, and therefore, the owner/operator of a biomass unit would be required to calculate the amount of CO2 released from each fuel fired in the boiler in order to apportion the total CO2 emissions between biogenic and non-biogenic emissions.
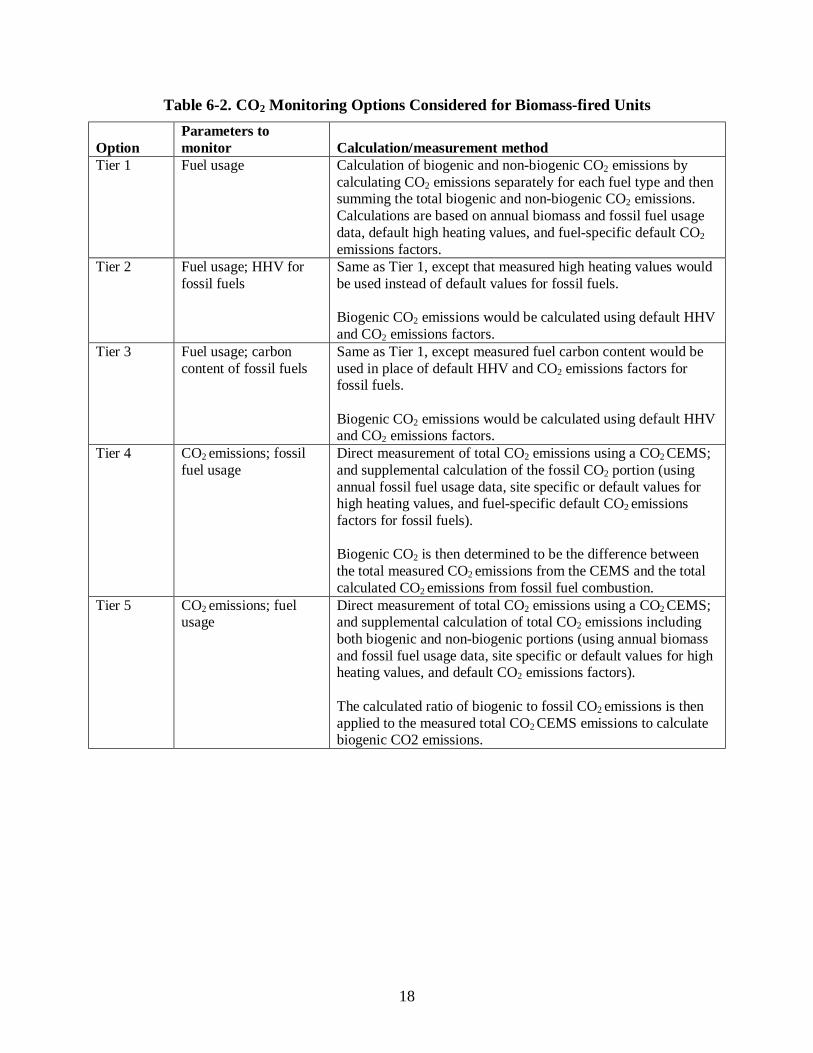
Five options were considered for determining biogenic vs. non-biogenic CO2 emissions from biomass units as shown in Table 6-2. Because biomass-fired units co-fire biomass with fossil fuels, the GHG emissions from these boilers will include both biogenic and non-biogenic CO2 emissions. In keeping with international and domestic GHG reporting protocols, biogenic and non-biogenic CO2 emissions are monitored and reported separately, and therefore, the GHG monitoring methods considered for biomass-fired units also include monitoring of biogenic CO2. The first four options (Tiers 1 through 4) shown in Table 6-2 are essentially the same as those developed for fossil-fuel fired stationary fuel combustion units. Tier 5 was included as an additional option.
17
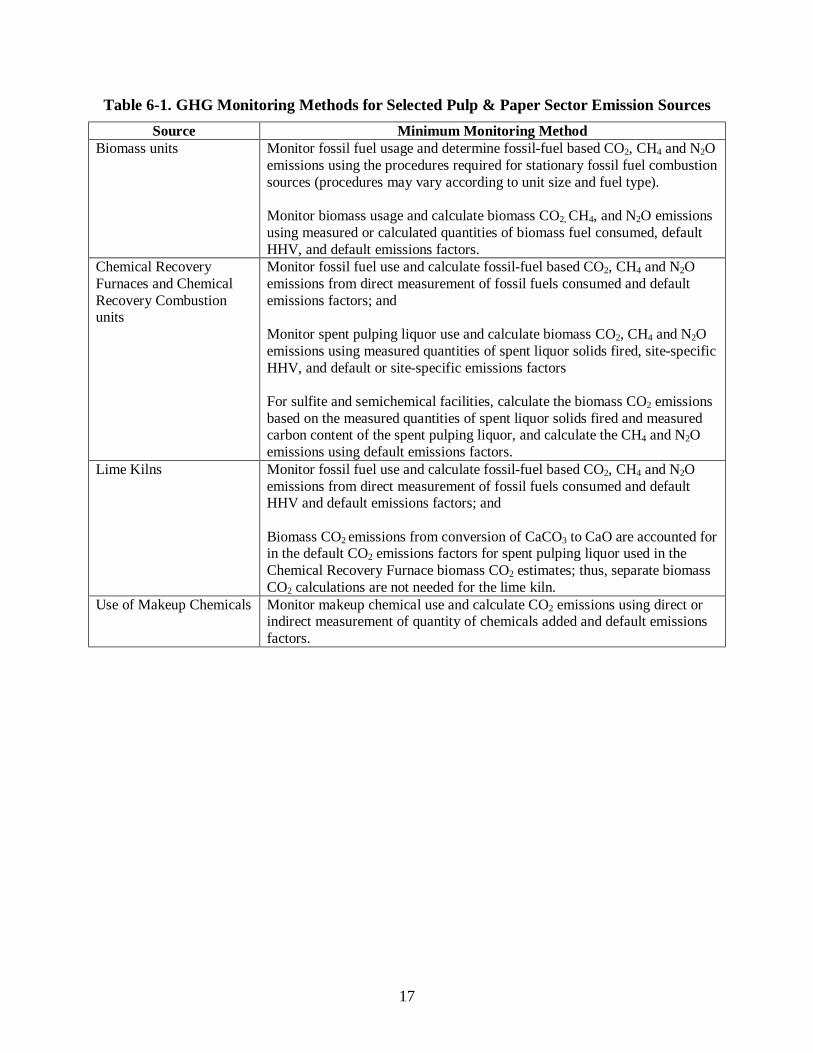
Table 6-1. GHG Monitoring Methods for Selected Pulp & Paper Sector Emission Sources Source Minimum Monitoring Method
Biomass units Monitor fossil fuel usage and determine fossil-fuel based CO2, CH4 and N2O emissions using the procedures required for stationary fossil fuel combustion sources (procedures may vary according to unit size and fuel type). Monitor biomass usage and calculate biomass CO2, CH4, and N2O emissions using measured or calculated quantities of biomass fuel consumed, default HHV, and default emissions factors.
Chemical Recovery Furnaces and Chemical Recovery Combustion units
Monitor fossil fuel use and calculate fossil-fuel based CO2, CH4 and N2O emissions from direct measurement of fossil fuels consumed and default emissions factors; and Monitor spent pulping liquor use and calculate biomass CO2, CH4 and N2O emissions using measured quantities of spent liquor solids fired, site-specific HHV, and default or site-specific emissions factors For sulfite and semichemical facilities, calculate the biomass CO2 emissions based on the measured quantities of spent liquor solids fired and measured carbon content of the spent pulping liquor, and calculate the CH4 and N2O emissions using default emissions factors.
Lime Kilns Monitor fossil fuel use and calculate fossil-fuel based CO2, CH4 and N2O emissions from direct measurement of fossil fuels consumed and default HHV and default emissions factors; and Biomass CO2 emissions from conversion of CaCO3 to CaO are accounted for in the default CO2 emissions factors for spent pulping liquor used in the Chemical Recovery Furnace biomass CO2 estimates; thus, separate biomass CO2 calculations are not needed for the lime kiln.
Use of Makeup Chemicals Monitor makeup chemical use and calculate CO2 emissions using direct or indirect measurement of quantity of chemicals added and default emissions factors.
18
Table 6-2. CO2 Monitoring Options Considered for Biomass-fired Units
Option Parameters to monitor Calculation/measurement method
Tier 1 Fuel usage Calculation of biogenic and non-biogenic CO2 emissions by calculating CO2 emissions separately for each fuel type and then summing the total biogenic and non-biogenic CO2 emissions. Calculations are based on annual biomass and fossil fuel usage data, default high heating values, and fuel-specific default CO2 emissions factors.
Tier 2 Fuel usage; HHV for fossil fuels
Same as Tier 1, except that measured high heating values would be used instead of default values for fossil fuels. Biogenic CO2 emissions would be calculated using default HHV and CO2 emissions factors.
Tier 3 Fuel usage; carbon content of fossil fuels
Same as Tier 1, except measured fuel carbon content would be used in place of default HHV and CO2 emissions factors for fossil fuels. Biogenic CO2 emissions would be calculated using default HHV and CO2 emissions factors.
Tier 4 CO2 emissions; fossil fuel usage
Direct measurement of total CO2 emissions using a CO2 CEMS; and supplemental calculation of the fossil CO2 portion (using annual fossil fuel usage data, site specific or default values for high heating values, and fuel-specific default CO2 emissions factors for fossil fuels). Biogenic CO2 is then determined to be the difference between the total measured CO2 emissions from the CEMS and the total calculated CO2 emissions from fossil fuel combustion.
Tier 5 CO2 emissions; fuel usage
Direct measurement of total CO2 emissions using a CO2 CEMS; and supplemental calculation of total CO2 emissions including both biogenic and non-biogenic portions (using annual biomass and fossil fuel usage data, site specific or default values for high heating values, and default CO2 emissions factors). The calculated ratio of biogenic to fossil CO2 emissions is then applied to the measured total CO2 CEMS emissions to calculate biogenic CO2 emissions.
19
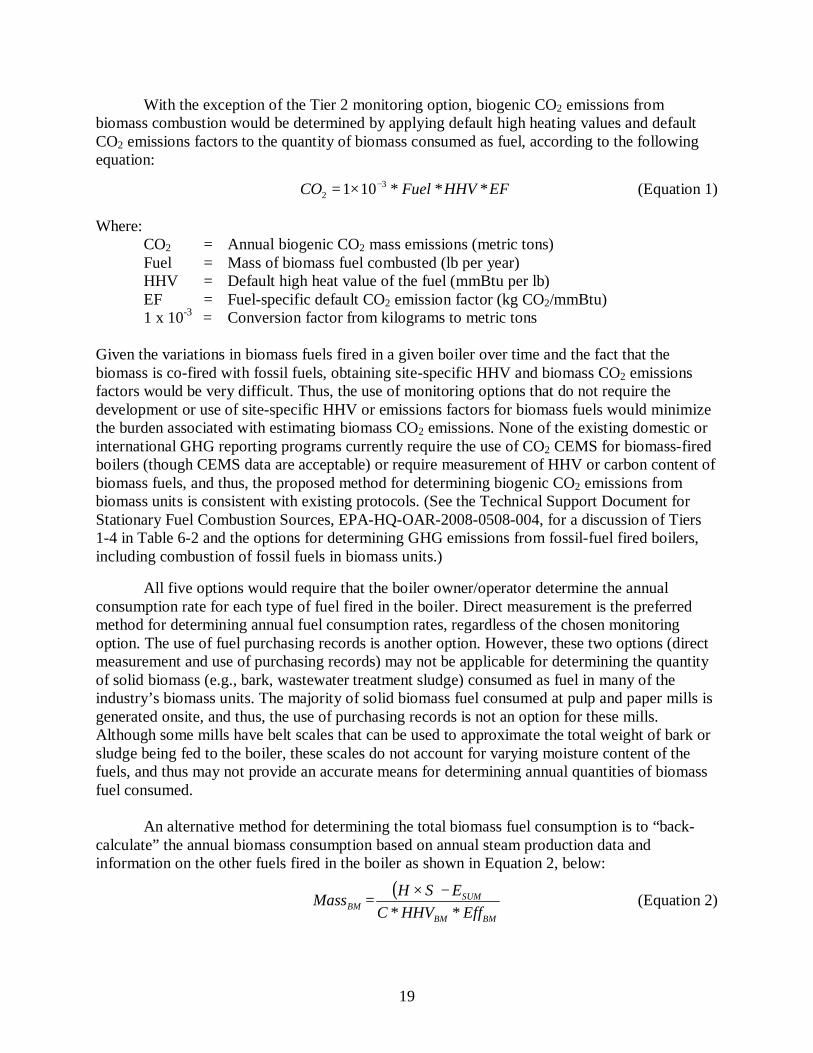
With the exception of the Tier 2 monitoring option, biogenic CO2 emissions from biomass combustion would be determined by applying default high heating values and default CO2 emissions factors to the quantity of biomass consumed as fuel, according to the following equation:
EFHHVFuelCO ***101 32
−×= (Equation 1)
Where: CO2 = Annual biogenic CO2 mass emissions (metric tons) Fuel = Mass of biomass fuel combusted (lb per year) HHV = Default high heat value of the fuel (mmBtu per lb) EF = Fuel-specific default CO2 emission factor (kg CO2/mmBtu) 1 x 10-3 = Conversion factor from kilograms to metric tons
Given the variations in biomass fuels fired in a given boiler over time and the fact that the biomass is co-fired with fossil fuels, obtaining site-specific HHV and biomass CO2 emissions factors would be very difficult. Thus, the use of monitoring options that do not require the development or use of site-specific HHV or emissions factors for biomass fuels would minimize the burden associated with estimating biomass CO2 emissions. None of the existing domestic or international GHG reporting programs currently require the use of CO2 CEMS for biomass-fired boilers (though CEMS data are acceptable) or require measurement of HHV or carbon content of biomass fuels, and thus, the proposed method for determining biogenic CO2 emissions from biomass units is consistent with existing protocols. (See the Technical Support Document for Stationary Fuel Combustion Sources, EPA-HQ-OAR-2008-0508-004, for a discussion of Tiers 1-4 in Table 6-2 and the options for determining GHG emissions from fossil-fuel fired boilers, including combustion of fossil fuels in biomass units.)
All five options would require that the boiler owner/operator determine the annual consumption rate for each type of fuel fired in the boiler. Direct measurement is the preferred method for determining annual fuel consumption rates, regardless of the chosen monitoring option. The use of fuel purchasing records is another option. However, these two options (direct measurement and use of purchasing records) may not be applicable for determining the quantity of solid biomass (e.g., bark, wastewater treatment sludge) consumed as fuel in many of the industry’s biomass units. The majority of solid biomass fuel consumed at pulp and paper mills is generated onsite, and thus, the use of purchasing records is not an option for these mills. Although some mills have belt scales that can be used to approximate the total weight of bark or sludge being fed to the boiler, these scales do not account for varying moisture content of the fuels, and thus may not provide an accurate means for determining annual quantities of biomass fuel consumed.
An alternative method for determining the total biomass fuel consumption is to “back-calculate” the annual biomass consumption based on annual steam production data and information on the other fuels fired in the boiler as shown in Equation 2, below:
( )BMBM
SUMBM EffHHVC
ESHMass**
−×= (Equation 2)
20
Where:
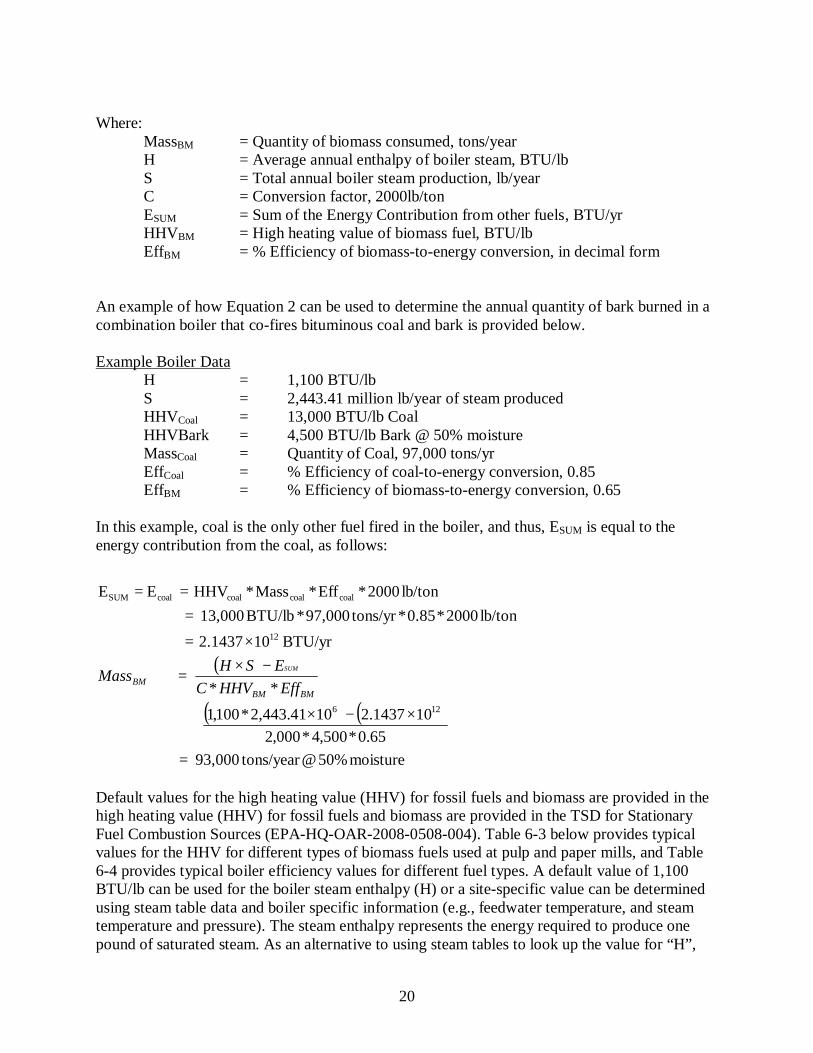
MassBM = Quantity of biomass consumed, tons/year H = Average annual enthalpy of boiler steam, BTU/lb S = Total annual boiler steam production, lb/year C = Conversion factor, 2000lb/ton ESUM = Sum of the Energy Contribution from other fuels, BTU/yr HHVBM = High heating value of biomass fuel, BTU/lb EffBM = % Efficiency of biomass-to-energy conversion, in decimal form
An example of how Equation 2 can be used to determine the annual quantity of bark burned in a combination boiler that co-fires bituminous coal and bark is provided below. Example Boiler Data
H = 1,100 BTU/lb S = 2,443.41 million lb/year of steam produced HHVCoal = 13,000 BTU/lb Coal HHVBark = 4,500 BTU/lb Bark @ 50% moisture MassCoal = Quantity of Coal, 97,000 tons/yr EffCoal = % Efficiency of coal-to-energy conversion, 0.85 EffBM = % Efficiency of biomass-to-energy conversion, 0.65
In this example, coal is the only other fuel fired in the boiler, and thus, ESUM is equal to the energy contribution from the coal, as follows:
( )
( ) ( )
moisture50%@tons/year93,00065.0*500,4*000,2
101437.21041.443,2*100,1**
BTU/yr102.1437lb/ton2000*0.85*tons/yr97,000*BTU/lb13,000
lb/ton2000*Eff*Mass*HHVEE
126
12
coalcoalcoalcoalSUM
=
×−×
−×=
×=
===
BMBMBM EffHHVC
ESHMass SUM
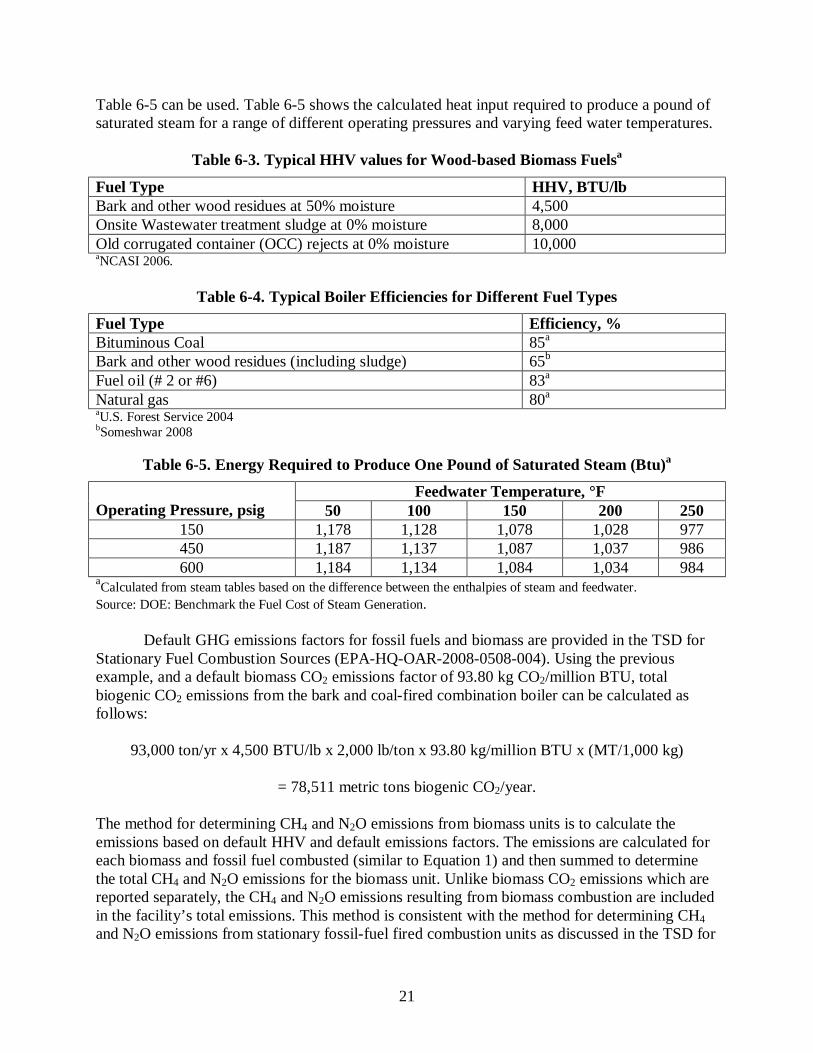
Default values for the high heating value (HHV) for fossil fuels and biomass are provided in the high heating value (HHV) for fossil fuels and biomass are provided in the TSD for Stationary Fuel Combustion Sources (EPA-HQ-OAR-2008-0508-004). Table 6-3 below provides typical values for the HHV for different types of biomass fuels used at pulp and paper mills, and Table 6-4 provides typical boiler efficiency values for different fuel types. A default value of 1,100 BTU/lb can be used for the boiler steam enthalpy (H) or a site-specific value can be determined using steam table data and boiler specific information (e.g., feedwater temperature, and steam temperature and pressure). The steam enthalpy represents the energy required to produce one pound of saturated steam. As an alternative to using steam tables to look up the value for “H”,
21
Table 6-5 can be used. Table 6-5 shows the calculated heat input required to produce a pound of saturated steam for a range of different operating pressures and varying feed water temperatures.
Table 6-3. Typical HHV values for Wood-based Biomass Fuelsa
Fuel Type HHV, BTU/lb Bark and other wood residues at 50% moisture 4,500 Onsite Wastewater treatment sludge at 0% moisture 8,000 Old corrugated container (OCC) rejects at 0% moisture 10,000 aNCASI 2006.
Table 6-4. Typical Boiler Efficiencies for Different Fuel Types
Fuel Type Efficiency, % Bituminous Coal 85a Bark and other wood residues (including sludge) 65b Fuel oil (# 2 or #6) 83a Natural gas 80a aU.S. Forest Service 2004 bSomeshwar 2008
Table 6-5. Energy Required to Produce One Pound of Saturated Steam (Btu)a
Feedwater Temperature, °F Operating Pressure, psig 50 100 150 200 250
150 1,178 1,128 1,078 1,028 977 450 1,187 1,137 1,087 1,037 986 600 1,184 1,134 1,084 1,034 984
aCalculated from steam tables based on the difference between the enthalpies of steam and feedwater. Source: DOE: Benchmark the Fuel Cost of Steam Generation.
Default GHG emissions factors for fossil fuels and biomass are provided in the TSD for Stationary Fuel Combustion Sources (EPA-HQ-OAR-2008-0508-004). Using the previous example, and a default biomass CO2 emissions factor of 93.80 kg CO2/million BTU, total biogenic CO2 emissions from the bark and coal-fired combination boiler can be calculated as follows:
93,000 ton/yr x 4,500 BTU/lb x 2,000 lb/ton x 93.80 kg/million BTU x (MT/1,000 kg)
= 78,511 metric tons biogenic CO2/year.
The method for determining CH4 and N2O emissions from biomass units is to calculate the emissions based on default HHV and default emissions factors. The emissions are calculated for each biomass and fossil fuel combusted (similar to Equation 1) and then summed to determine the total CH4 and N2O emissions for the biomass unit. Unlike biomass CO2 emissions which are reported separately, the CH4 and N2O emissions resulting from biomass combustion are included in the facility’s total emissions. This method is consistent with the method for determining CH4 and N2O emissions from stationary fossil-fuel fired combustion units as discussed in the TSD for
22
Stationary Fuel Combustion sources (EPA-HQ-OAR-2008-0508-004) and is also consistent with domestic and international GHG protocols.
6.2 Chemical Recovery Furnaces
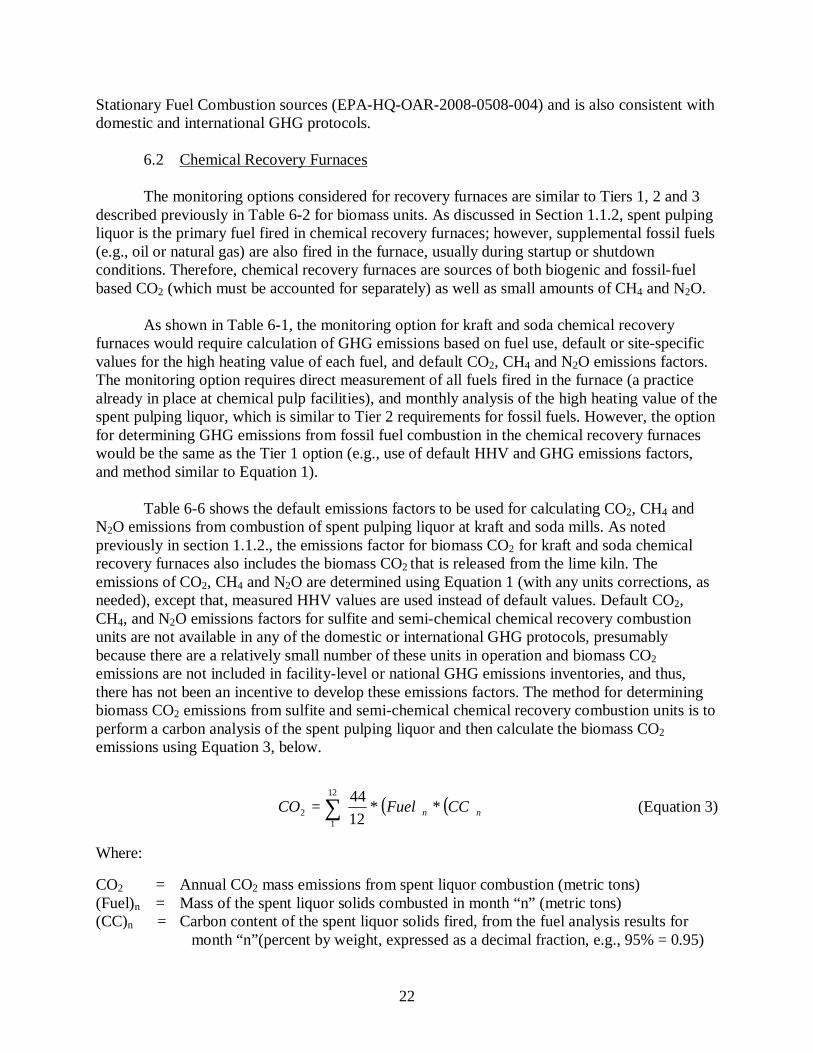
The monitoring options considered for recovery furnaces are similar to Tiers 1, 2 and 3 described previously in Table 6-2 for biomass units. As discussed in Section 1.1.2, spent pulping liquor is the primary fuel fired in chemical recovery furnaces; however, supplemental fossil fuels (e.g., oil or natural gas) are also fired in the furnace, usually during startup or shutdown conditions. Therefore, chemical recovery furnaces are sources of both biogenic and fossil-fuel based CO2 (which must be accounted for separately) as well as small amounts of CH4 and N2O. As shown in Table 6-1, the monitoring option for kraft and soda chemical recovery furnaces would require calculation of GHG emissions based on fuel use, default or site-specific values for the high heating value of each fuel, and default CO2, CH4 and N2O emissions factors. The monitoring option requires direct measurement of all fuels fired in the furnace (a practice already in place at chemical pulp facilities), and monthly analysis of the high heating value of the spent pulping liquor, which is similar to Tier 2 requirements for fossil fuels. However, the option for determining GHG emissions from fossil fuel combustion in the chemical recovery furnaces would be the same as the Tier 1 option (e.g., use of default HHV and GHG emissions factors, and method similar to Equation 1). Table 6-6 shows the default emissions factors to be used for calculating CO2, CH4 and N2O emissions from combustion of spent pulping liquor at kraft and soda mills. As noted previously in section 1.1.2., the emissions factor for biomass CO2 for kraft and soda chemical recovery furnaces also includes the biomass CO2 that is released from the lime kiln. The emissions of CO2, CH4 and N2O are determined using Equation 1 (with any units corrections, as needed), except that, measured HHV values are used instead of default values. Default CO2, CH4, and N2O emissions factors for sulfite and semi-chemical chemical recovery combustion units are not available in any of the domestic or international GHG protocols, presumably because there are a relatively small number of these units in operation and biomass CO2 emissions are not included in facility-level or national GHG emissions inventories, and thus, there has not been an incentive to develop these emissions factors. The method for determining biomass CO2 emissions from sulfite and semi-chemical chemical recovery combustion units is to perform a carbon analysis of the spent pulping liquor and then calculate the biomass CO2 emissions using Equation 3, below.
( ) ( )∑=12
12 **
1244
nn CCFuelCO (Equation 3)
Where:
CO2 = Annual CO2 mass emissions from spent liquor combustion (metric tons) (Fuel)n = Mass of the spent liquor solids combusted in month “n” (metric tons) (CC)n = Carbon content of the spent liquor solids fired, from the fuel analysis results for
month “n”(percent by weight, expressed as a decimal fraction, e.g., 95% = 0.95)
23
44/12 = Ratio of molecular weights, CO2 to carbon
Table 6-6. Kraft Pulping Liquor Emissions Factors for Biomass-Based CO2, CH4, and N2Oa
Biomass-Based Emissions Factors (kg / mmBtu HHV) Wood Furnish CO2 CH4 N2O
North American Softwood 94.4 North American Hardwood 93.7 Bagasse 95.5 Bamboo 93.7 Straw 95.1
0.030 0.005
a Includes CO2 emissions from both the recovery furnace and lime kiln.
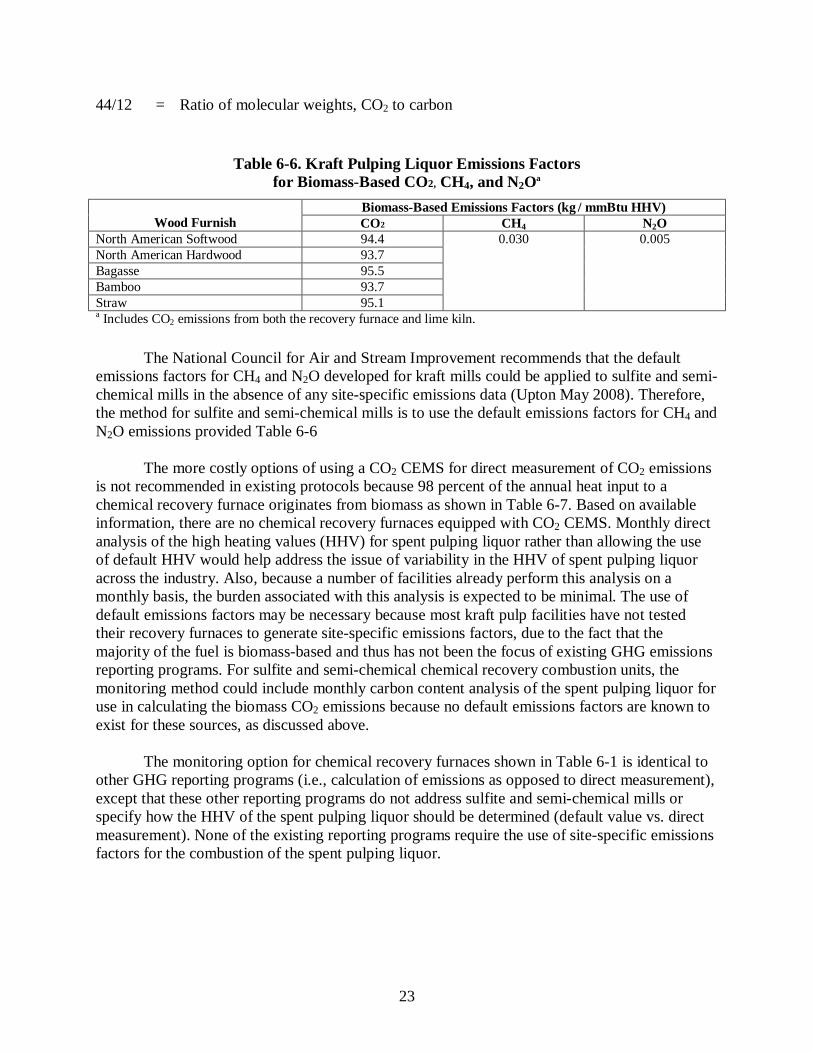
The National Council for Air and Stream Improvement recommends that the default emissions factors for CH4 and N2O developed for kraft mills could be applied to sulfite and semi-chemical mills in the absence of any site-specific emissions data (Upton May 2008). Therefore, the method for sulfite and semi-chemical mills is to use the default emissions factors for CH4 and N2O emissions provided Table 6-6 The more costly options of using a CO2 CEMS for direct measurement of CO2 emissions is not recommended in existing protocols because 98 percent of the annual heat input to a chemical recovery furnace originates from biomass as shown in Table 6-7. Based on available information, there are no chemical recovery furnaces equipped with CO2 CEMS. Monthly direct analysis of the high heating values (HHV) for spent pulping liquor rather than allowing the use of default HHV would help address the issue of variability in the HHV of spent pulping liquor across the industry. Also, because a number of facilities already perform this analysis on a monthly basis, the burden associated with this analysis is expected to be minimal. The use of default emissions factors may be necessary because most kraft pulp facilities have not tested their recovery furnaces to generate site-specific emissions factors, due to the fact that the majority of the fuel is biomass-based and thus has not been the focus of existing GHG emissions reporting programs. For sulfite and semi-chemical chemical recovery combustion units, the monitoring method could include monthly carbon content analysis of the spent pulping liquor for use in calculating the biomass CO2 emissions because no default emissions factors are known to exist for these sources, as discussed above.
The monitoring option for chemical recovery furnaces shown in Table 6-1 is identical to
other GHG reporting programs (i.e., calculation of emissions as opposed to direct measurement), except that these other reporting programs do not address sulfite and semi-chemical mills or specify how the HHV of the spent pulping liquor should be determined (default value vs. direct measurement). None of the existing reporting programs require the use of site-specific emissions factors for the combustion of the spent pulping liquor.
24
Table 6-7. Kraft Recovery Furnace Black Liquor and Fossil Fuel Firing in 2005a
Fuel Amount Fired Units BTU % of total Black Liquor Solids 79.6 million Tons 955 98.0 Fuel Oil 1.94 million Barrels 12 1.2 Natural gas 6,600 million Cubic feet 7 0.7 aNCASI 2006
6.3 Lime Kilns
Lime kilns and calciners used in the pulp and paper source category are unique and should be defined and considered separately from lime kilns used in the commercial lime manufacturing industry because the source of the carbon in the calcium carbonate entering the kraft lime kiln is biomass. As discussed previously in section 1.1.2, the CO2 emitted from lime kilns at kraft pulp facilities originates from two sources: (1) fossil fuels burned in the kiln, and (2) conversion of calcium carbonate (or “lime mud”) generated in the chemical recovery process to calcium oxide.
The CO2 that is liberated from the CaCO3 burned in the kiln or calciner is already accounted for in the biomass CO2 emissions calculation for the chemical recovery furnaces, and therefore, no separate calculation of biomass CO2 associated with the lime kiln is needed. Also, treating CO2 emissions associated with the conversion of the calcium carbonate to lime as biomass CO2 is consistent with the reporting requirements in other accepted protocols (e.g., DOE technical guidelines). The IPCC does not directly state how CO2 emissions from kraft facility lime kilns should be addressed. However the methods for determining biomass-based CO2 emissions discussed here are consistent with guidance developed for the ICFPA, which has been widely accepted by the domestic and international community, including the WRI. The monitoring method for fossil fuel-based CO2 emissions from kraft lime kilns shown in Table 6-1 is the same as the “Tier 1” method for stationary fossil fuel combustion devices as described in previous sections (see also Equation 1). Fossil fuel consumption in kraft lime kilns and calciners is continuously measured and tracked as part of the process control systems in place at the facility. Therefore, direct measurement of fossil fuel consumption is the typical method for determining annual quantities of fuel consumed in the kiln. Very few data are available regarding CH4 and N2O emissions from kraft mill lime kilns and calciners. Lime kilns sampled in the early 1980s (NCASI 1981 as reported in ICFPA 2005) suggest an emission factor of 2.7 kg CH4/TJ LHV (0.0027 kg CH4/mmBtu HHV). For commercial lime kilns, IPCC suggests emission factors of 1.0 and 1.1 kg CH4/TJ LHV) for oil-fired and gas-fired lime kilns, respectively. The IPCC factors are for commercial lime kilns, however, and may not be appropriate for kraft mill lime kilns. Therefore, the kraft lime kiln emissions factor in units of 0.0027 kg CH4/mmBtu HHV is generally used for kraft mill lime kilns in the absence of direct measurement of methane emissions, which is consistent with the ICFPA guidance. (ICFPA 2005) The ICFPA report indicated that no data were found regarding N2O emissions from lime kilns or calciners, but also noted that the operating temperatures in rotary lime kilns appear to be too high to allow significant generation of N2O. Therefore, the ICFPA report concludes that it is
25
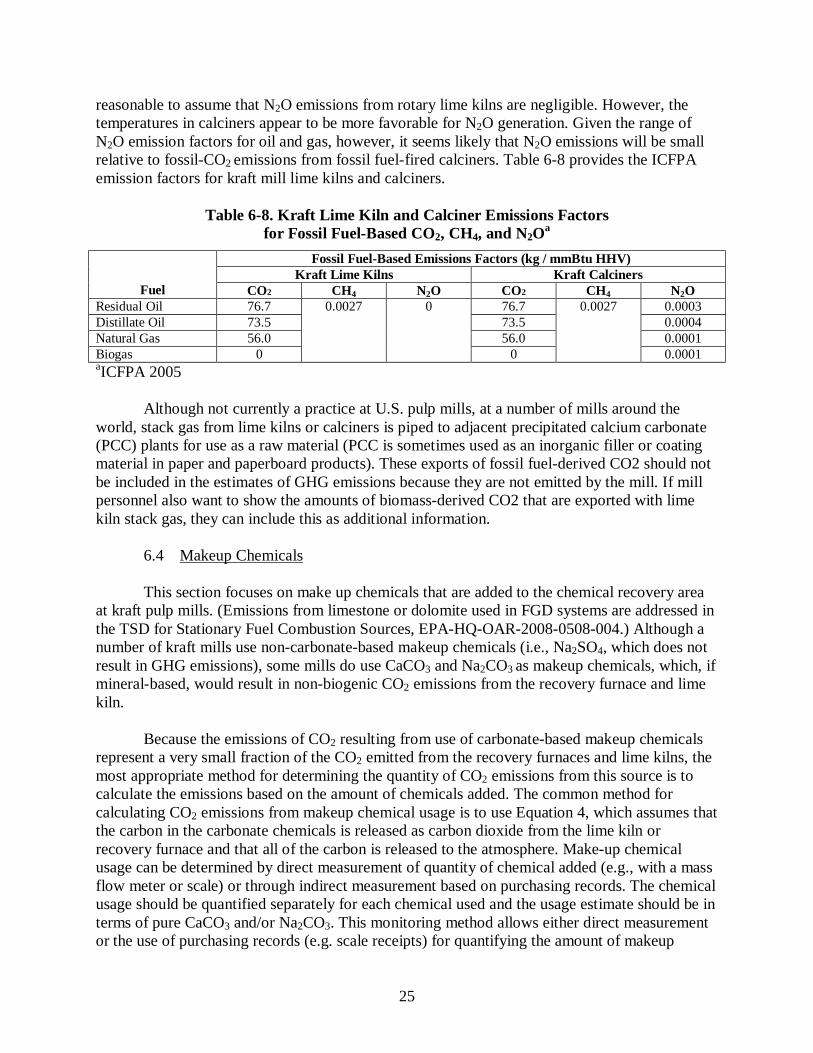
reasonable to assume that N2O emissions from rotary lime kilns are negligible. However, the temperatures in calciners appear to be more favorable for N2O generation. Given the range of N2O emission factors for oil and gas, however, it seems likely that N2O emissions will be small relative to fossil-CO2 emissions from fossil fuel-fired calciners. Table 6-8 provides the ICFPA emission factors for kraft mill lime kilns and calciners.
Table 6-8. Kraft Lime Kiln and Calciner Emissions Factors for Fossil Fuel-Based CO2, CH4, and N2Oa
Fossil Fuel-Based Emissions Factors (kg / mmBtu HHV) Kraft Lime Kilns Kraft Calciners
Fuel CO2 CH4 N2O CO2 CH4 N2O Residual Oil 76.7 76.7 0.0003 Distillate Oil 73.5 73.5 0.0004 Natural Gas 56.0 56.0 0.0001 Biogas 0
0.0027 0
0
0.0027
0.0001 aICFPA 2005
Although not currently a practice at U.S. pulp mills, at a number of mills around the world, stack gas from lime kilns or calciners is piped to adjacent precipitated calcium carbonate (PCC) plants for use as a raw material (PCC is sometimes used as an inorganic filler or coating material in paper and paperboard products). These exports of fossil fuel-derived CO2 should not be included in the estimates of GHG emissions because they are not emitted by the mill. If mill personnel also want to show the amounts of biomass-derived CO2 that are exported with lime kiln stack gas, they can include this as additional information.
6.4 Makeup Chemicals This section focuses on make up chemicals that are added to the chemical recovery area at kraft pulp mills. (Emissions from limestone or dolomite used in FGD systems are addressed in the TSD for Stationary Fuel Combustion Sources, EPA-HQ-OAR-2008-0508-004.) Although a number of kraft mills use non-carbonate-based makeup chemicals (i.e., Na2SO4, which does not result in GHG emissions), some mills do use CaCO3 and Na2CO3 as makeup chemicals, which, if mineral-based, would result in non-biogenic CO2 emissions from the recovery furnace and lime kiln. Because the emissions of CO2 resulting from use of carbonate-based makeup chemicals represent a very small fraction of the CO2 emitted from the recovery furnaces and lime kilns, the most appropriate method for determining the quantity of CO2 emissions from this source is to calculate the emissions based on the amount of chemicals added. The common method for calculating CO2 emissions from makeup chemical usage is to use Equation 4, which assumes that the carbon in the carbonate chemicals is released as carbon dioxide from the lime kiln or recovery furnace and that all of the carbon is released to the atmosphere. Make-up chemical usage can be determined by direct measurement of quantity of chemical added (e.g., with a mass flow meter or scale) or through indirect measurement based on purchasing records. The chemical usage should be quantified separately for each chemical used and the usage estimate should be in terms of pure CaCO3 and/or Na2CO3. This monitoring method allows either direct measurement or the use of purchasing records (e.g. scale receipts) for quantifying the amount of makeup
26
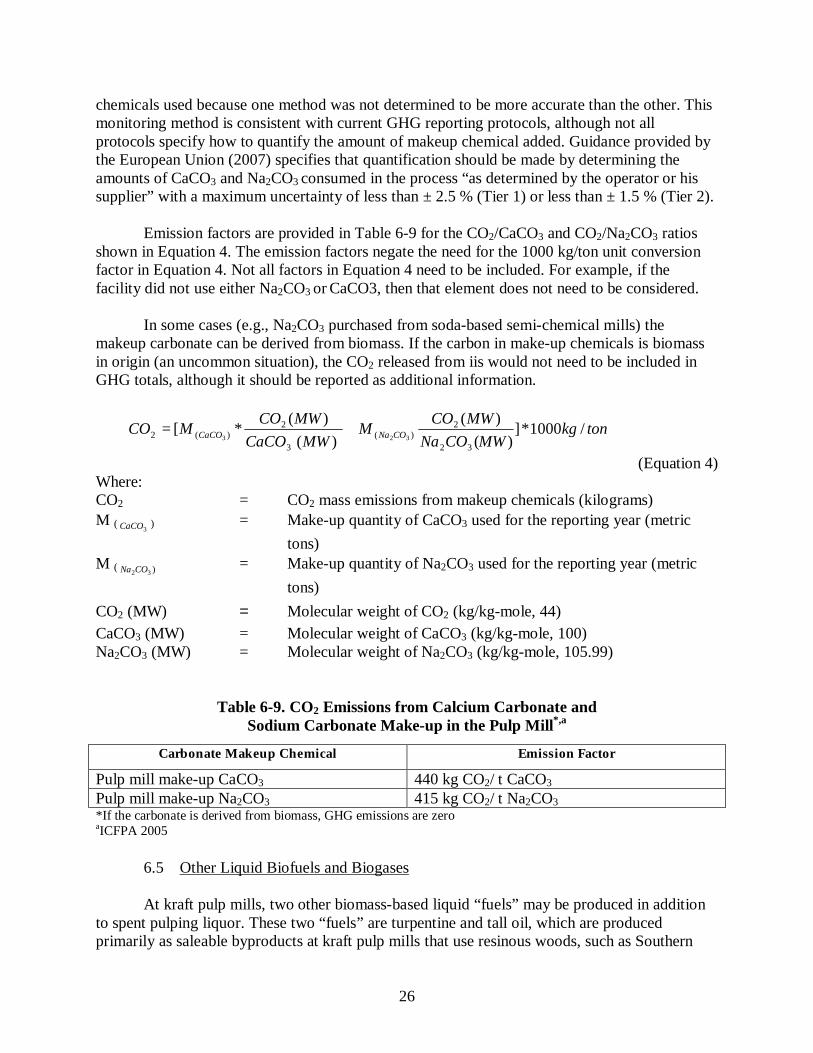
chemicals used because one method was not determined to be more accurate than the other. This monitoring method is consistent with current GHG reporting protocols, although not all protocols specify how to quantify the amount of makeup chemical added. Guidance provided by the European Union (2007) specifies that quantification should be made by determining the amounts of CaCO3 and Na2CO3 consumed in the process “as determined by the operator or his supplier” with a maximum uncertainty of less than ± 2.5 % (Tier 1) or less than ± 1.5 % (Tier 2). Emission factors are provided in Table 6-9 for the CO2/CaCO3 and CO2/Na2CO3 ratios shown in Equation 4. The emission factors negate the need for the 1000 kg/ton unit conversion factor in Equation 4. Not all factors in Equation 4 need to be included. For example, if the facility did not use either Na2CO3 or CaCO3, then that element does not need to be considered. In some cases (e.g., Na2CO3 purchased from soda-based semi-chemical mills) the makeup carbonate can be derived from biomass. If the carbon in make-up chemicals is biomass in origin (an uncommon situation), the CO2 released from iis would not need to be included in GHG totals, although it should be reported as additional information.
tonkgMWCONa
MWCOMMWCaCO
MWCOMCO CONaCaCO /1000*])(
)()(
)(*[32
2)(
3
2)(2 323
+=
(Equation 4) Where: CO2 = CO2 mass emissions from makeup chemicals (kilograms) M (
3CaCO ) = Make-up quantity of CaCO3 used for the reporting year (metric tons)
M ( )32CONa = Make-up quantity of Na2CO3 used for the reporting year (metric tons)
CO2 (MW) = Molecular weight of CO2 (kg/kg-mole, 44) CaCO3 (MW) = Molecular weight of CaCO3 (kg/kg-mole, 100) Na2CO3 (MW) = Molecular weight of Na2CO3 (kg/kg-mole, 105.99)
Table 6-9. CO2 Emissions from Calcium Carbonate and Sodium Carbonate Make-up in the Pulp Mill*,a
6.5 Other Liquid Biofuels and Biogases
At kraft pulp mills, two other biomass-based liquid “fuels” may be produced in addition to spent pulping liquor. These two “fuels” are turpentine and tall oil, which are produced primarily as saleable byproducts at kraft pulp mills that use resinous woods, such as Southern
Carbonate Makeup Chemical Emission Factor
Pulp mill make-up CaCO3 440 kg CO2/ t CaCO3 Pulp mill make-up Na2CO3 415 kg CO2/ t Na2CO3 *If the carbonate is derived from biomass, GHG emissions are zero aICFPA 2005
27
yellow pine. The turpentine is recovered primarily from the digester relief gases and is comprised mostly of pinenes and terpenes. The tall oil is produced from fatty and resin acids present in the spent cooking liquor that are recovered during the evaporation stage. Both the turpentine and tall oil are derived from wood, and thus are considered to be biomass-based products. During periods of lower market prices for these products, some facilities may choose to use these products as fuels rather than sell them. The CO2 emissions produced from burning of these fuels in onsite combustion units (e.g., lime kilns, boilers) would be counted as biomass-based carbon. None of the domestic or international GHG protocols provide default HHV or default CO2 emissions factors for tall oil or turpentine, primarily because their use as fuel is not routine and the CO2 emissions that would result from their combustion would not be counted in facility totals or national GHG emissions inventories. Therefore, calculation of the biomass CO2 emissions from use of these products as fuels would require measurement of the carbon content of these products and a calculation method similar to Equation 3 (shown previously). The quantity of GHG emissions resulting from combustion of these biomass-based byproducts is expected to be relatively small because of their infrequent use as fuel. Another source of biomass-based CO2 emissions at kraft pulp mills is the combustion of process vent gases, generally referred to as noncondensable gases (NCGs). To comply with federal air emissions standards, NCGs are collected and routed to onsite combustion devices for incineration. Emission sources that contribute to the NCG stream include digesters, evaporators, turpentine systems, steam strippers, brownstock washers and spent liquor storage tanks. The composition of the NCG steam varies, but typically includes total reduced sulfur compounds such as hydrogen sulfide (H2S), methyl mercaptan (CH3SH), dimethyl sulfide (CH3SCH3), and dimethyl disulfide (CH3SSCH3), turpentine, methanol, acetone, and alpha pinene, along with air and water vapor.(Boniface 1992) Because none of the NCG constituents are GHG, no GHG emissions would result during periods when the NCG are vented directly to the atmosphere. When these gases are combusted in lime kilns, boilers or thermal oxidizers at the pulp mill, emissions of biomass CO2, CH4 and N2O would result; however the emissions associated with NCG combustion are very small relative to the fossil-fuel based GHG emissions. Based on an analysis conducted by NCASI, the NCG-related GHG emissions from a typical kraft pulp mill producing 1179 metric tons of pulp/day would be approximately 2 tons/day, representing less than 0.005 percent of the mill’s total GHG emissions (Upton April 2008). 7. Procedures for Estimating Missing Data Procedures for estimating missing data provide reporting facilities methods to use substitute data that are close to the actual values. These procedures differ by the type of monitoring method adopted. Appropriate missing data procedures are described below for the parameters to be monitored under the various options described in section 3. Missing data procedures for fossil fuel combustion (i.e., fossil fuel usage measurements, HHV or carbon content of fossil fuels) are described in the TSD for Stationary Fuel Combustion Sources, EPA-HQ-OAR-2008-0508-004]. Because pulp and paper mills already continuously monitor the operation (inputs, outputs and performance) of the chemical boilers, recovery furnaces and lime kilns, missing data is not expected to be an issue.
28
Fossil Fuel usage data. Procedures for filling in missing fuel use data are described in the
TSD for Stationary Fuel Combustion Sources, EPA-HQ-OAR-2008-0508-004.
High heating value or carbon content data. For missing high heating values or carbon analyses, the substitute data value could be the arithmetic average of the quality-assured values of that parameter immediately preceding and immediately following the missing data incident. If, for a particular parameter, no quality-assured data are available prior to the missing data incident, the substitute data value could be the first quality-assured value obtained after the missing data period.
CO2 CEMS data. Part 75 establishes procedures for management of missing data for options involving direct measurement of CO2 flow rates or direct measurement of CO2 emissions using CEMS. Procedures for management of missing data are described in Part 75.35(a), (b), and (d). In general, missing data from operation of the CEMS may be replaced with substitute data to determine the CO2 flow rates or CO2 emissions during the period in which CEMS data are missing.
Spent pulping liquor flow rate. The following could be substituted for missing spent pulping liquor flow rates:
• The maximum fuel flow rate that the unit is capable of combusting, or • The maximum flow rate that the fuel flow meter can measure, or • The average value corresponding to the duration of the missing data based on recorded
data for the same time period immediately prior to and following the missing data episode (e.g., if June data are missing, use the average of the May and July data).
Make-up chemical usage. Makeup chemical usage can be determined through direct
measurement of the quantity of chemical added or through company purchasing records. The missing data could be estimated depending on the data source. The plant owner or operator could estimate missing makeup chemical usage based on available data (e.g., past accounting records, production rates). 8. QA/QC Requirements
Facilities should conduct quality assurance and quality control of data used in calculating GHG and the emission estimates reported. Facilities are encouraged to prepare an in-depth quality assurance and quality control plan which would include checks on relevant data (e.g., measurements made or information received from the supplier), data accuracy (e.g., checking of the data against prior data or for internal consistency within the data set), and calculations performed to estimate GHG emissions (e.g., to ensure computational errors are avoided). The QA/QC plan and records generated as a result of the plan could be made available for inspection upon request. Examples of QA/QC procedures specific to the pulp and paper source category are listed below. Other applicable procedures may be found in the TSD for stationary fuel combustion (EPA-HQ-OAR-2008-0508-004) (e.g., QA/QC of HHV or carbon content data).
29
Spent pulping liquor parameters. Methods published by a consensus standards organization (e.g., ASTM, ASME, TAPPI, or others) could be used for determining the high heat values and carbon analyses for spent pulping liquor. These methods are likely to contain QA/QC procedures. Also, the procedures used to convert spent liquor flow rates to units of mass (i.e., spent liquor solids firing rates) should be documented by the facility.
Monitoring of fuel or makeup chemical usage. The owner or operator could document procedures used to ensure the accuracy of the measurements made by weighing equipment, fuel flow meters, and other measurement devices, such as:
• Calibration of equipment within a scheduled time frame, and • Documentation of accuracy of measurement devices, and • Documentation of equipment maintenance activities.
CO2 CEMS. For CEMS, the applicable QA/QC procedures prescribed under Part 75 that are
related to ensuring the accuracy of the CO2 concentration monitor, the flow meters that measure the flue gas flow rate, and the data acquisition system that record the CEMS measurements and compute the emissions, heat rate and other relevant information could be adopted. 9. Data to Be Reported
The annual data reporting requirements could be the same as those for general stationary fuel combustion sources (discussed in a separate TSD). Reporting requirements would apply to all affected units at a contiguous facility. The following are also items that could be reported: Annual GHG emissions estimates presented by calendar quarters (including separate estimates of biogenic CO2) for each emissions source
• Annual GHG emissions estimates presented by calendar quarters (including separate estimates of biogenic CO2) for each emissions source (reporting would be annual, but would contain quarterly as well as annual data);
• Total consumption of all biomass fuels by calendar quarter; • Total annual quantity of spent liquor solids fired at the facility by calendar quarter; • Total annual steam and electricity purchases; and • Total annual quantities of makeup chemicals (carbonates) used.
9.1 Additional Data for Verification
For the pulp and paper source category, additional data for verification could include:
• Annual emission estimates presented by calendar quarters (including biogenic CO2); • Total for consumption of all biomass fuels and spent pulping liquor by calendar
quarters; • Total annual quantities of makeup chemicals (carbonates) used; and • Total annual electricity and steam purchases.
These data could be used by EPA to check for reasonableness of the reported emissions and for other data quality considerations. The data could also be checked against activity-data-based emission factors for the process. The annual electricity and steam purchase data could be used to determine the facility-wide energy balance.
30
9.2 Additional Data to be Retained Onsite
Facilities could be required to retain data concerning monitoring of GHG emissions
onsite for a period of at least three years from the reporting year. For CEMS, these data would include CEMS monitoring system data including continuous-monitored GHG concentrations and stack gas flow rates, calibration and quality assurance records. Process or fuel usage data should also be retained on site for a period of at least three years from the reporting year. EPA could use such data for QA/QC and/to conduct trend analyses and potentially to develop process or activity-specific emission factors. Records could include:
• GHG emission estimates (including separate estimates of biogenic CO2) by calendar quarter by unit an and facility;
• Monthly total for consumption of all biomass fuels and spent pulping liquor for each unit and facility;
• Monthly analyses of HHV or carbon content; • Monthly and annual electricity and steam purchases; • Monthly and annual steam production for each biomass unit; • Monthly quantities of makeup chemicals (carbonates) used; and • The QA/QC plan that describes all measurement methods used and includes a full list
of records that would be retained onsite. 10. References AF&PA 2008. Memo from Rhea Hale, AF&PA, to Reid Harvey, U.S. EPA Climate Change
Division. May 22, 2008.
Australia’s Technical Guidelines for the Estimation of Greenhouse Emissions and Energy at Facility Level: Energy, Industrial Process and Waste Sectors in Australia. Accessed at http://www-gio.nies.go.jp/aboutghg/nir/2008/NIR_JPN_2008_v3.0E.pdf
BLRBAC 2008. Black Liquor Recovery Boiler Advisory Committee. Recovery Boilers in Service – U.S., March 2008. Website: http://www.blrbac.org/RecoveryBoilersinService.html. Accessed May 2008.
BLS 2007. U.S. Department of Labor, Bureau of Labor Statistics. May 2007 National Industry-Specific Occupational Employment and Wage Estimates, NAICS 322100 – Pulp, Paper, and Paperboard Mills. Website: http://www.bls.gov/oes/current/naics4_322100.htm. Accessed June 2, 2008.
Boniface, A. 1992. “Introduction and Principals of Chemical Recovery.” In Chemical Recovery in the Alkaline Pulping Processes, 3rd Edition, Robert P. Green and Gerald Hough, eds. Atlanta, GA: TAPPI Press.
California Air Resources Board (CARB) Staff Report: Initial Statement of Reasons for Rulemaking, Proposed Regulation for Mandatory Reporting of Greenhouse Emissions. October 19, 2007. Accessed at http://www.arb.ca.gov/regact/2007/ghg2007/ghg2007.htm
31
Canadian Environmental Protection Act, 1999. Notice with respect to reporting of greenhouse gases (GHGs) for 2007. Accessed at http://canadagazette.gc.ca/partI/2007/20070303/html/notice-e.html#i3
The Climate Registry’s General Reporting Protocol for the Voluntary Reporting Program. March 2008, Accessed at http://www.theclimateregistry.org/downloads/GRP.pdf
European Union’s Commission Decision of 18 July 2007 establishing guidelines for the monitoring and reporting of greenhouse gas emissions pursuant to Directive 2003/87/EC of the European Parliament and of the Council. Accessed at http://eur-lex.europa.eu/LexUriServ/site/en/oj/2007/l_229/l_22920070831en00010085.pdf
ICFPA 2005. Calculation Tools for Estimating Greenhouse Gas Emissions from Pulp and Paper Mills. Version 1.1. July 8, 2005. Prepared by the National Council for Air and Stream Improvement for The Climate Change Working Group of The International Council of Forest and Paper Associations (ICFPA). Accessed at http://www.ghgprotocol.org/calculation-tools/pulp-and-paper
IPCC 2006. 2006 Intergovernmental Panel on Climate Change (IPCC) Guidelines for National Greenhouse Gas Inventories. Intergovernmental Panel on Climate Change. National Greenhouse Gas Inventory Report of Japan. 2008. Accessed at http://www-
gio.nies.go.jp/aboutghg/nir/2008/NIR_JPN_2008_v3.0E.pdf
NCASI 2003. Compilation of ‘Air Toxic’ and Total Hydrocarbon Emissions Data for Sources at Kraft, Sulfite, and Non-Chemical Pulp Mills—An Update. Technical Bulletin No. 858. Research Triangle Park, NC: NCASI. February 2003.
NCASI 2006. Pulp and Paper Mill Emissions of SO2, NOX, and Particulate Matter in 2005. NCASI Special Report No. 06-07. December 2006.
NCASI 2008. Calculations documenting the greenhouse gas emissions from the pulp and paper industry. Memo prepared by Reid Miner. May 2008.
Pinkerton 2008. Personal communication of RTI staff with John Pinkerton of NCASI. May 5, 2008
RTI 2005. RTI International (RTI). Pulp & Paper Recovery Furnace Database. 2005.
Someshwar 2008. Personal communication of RTI staff with Arun Someshwar of NCASI, May 2, 2008.
Technical Support Document for GHG Reporting for Stationary Fuel Combustion Sources, EPA-HQ-OAR-2008-0508-004 (January 2009)
Technical Support Document for GHG Reporting for Process Emissions from Wastewater Treatment, EPA-HQ-OAR-2008-0508-035 (February 2009)
32
Technical Support Document for GHG Reporting for Landfills, EPA-HQ-OAR-2008-0508-034 (February 2009)
United Kingdom’s Guidelines for the Measurement and Reporting of Emissions by Direct Participants in the UK Emissions Trading Scheme. Accessed at http://www.defra.gov.uk/environment/climatechange/trading/uk/pdf/trading-reporting.pdf
U.S. Census Bureau 2008. Industry Statistics Sampler. Data for NAICS code 322110 (pulp mills). Accessed June 2008 at http://www.census.gov/econ/census02/data/industry/E322110.HTM.
U.S. Department of Commerce 2008. National Economic Accounts, Table 1.1.9: Implicit Price Deflators for Gross Domestic Product, 1998-2007. U.S. Department of Commerce, Bureau of Economic Analysis. Website: http://www.bea.gov/bea/dn/nipaweb/SelectTable.asp?Selected=Y. Accessed June 3, 2008.
U.S. Department of Energy (DOE) 2008. Benchmark the Fuel Cost of Steam Generation. Website: http://www1.eere.energy.gov/industry/bestpractices/pdfs/steam15_benchmark.pdf Accessed May 21, 2008.
U.S. DOE. Technical Guidelines: Voluntary Reporting Of Greenhouse Gases (1605(b)) Program. Accessed at http://www.eia.doe.gov/oiaf/1605/January2007_1605bTechnicalGuidelines.pdf
U.S. Environmental Protection Agency (EPA). 2002. National Emissions Inventory Database.
U.S. EPA 1996. U.S. Environmental Protection Agency. Technical Support Document: Chemical Recovery Combustion Sources at Kraft and Soda Pulp Mills. EPA-453/R-96-012. October 1996.
U.S. EPA 2002. Profile of the Pulp and Paper Industry 2nd Edition. EPA Office of Compliance Sector Notebook Project. Office of Enforcement and Compliance Assurance Washington, DC. EPA/310-R-02-002. November 2002.
U.S. EPA 2007. CEMS Cost Model – 3/07/07. Website: http://www.epa.gov/ttn/emc/cem.html. Accessed May 8, 2008.
U.S. EPA 2008. Inventory of U.S. Greenhouse Gas Emissions and Sinks: 1990-2006, Final. U.S. Environmental Protection Agency, Washington, DC. April 15, 2008. EPA-430-R-08-005.
U.S. Forest Service 2004. Fuel Value Calculator. U.S. Forest Service, Forest products Laboratory. Madison, WI. Accessed 2008 at: http://www.fpl.fs.fed.us/documnts/techline/fuel-value-calculator.pdf
Upton April 2008. Email communication from Brad Upton of NCASI to Rebecca Nicholson, RTI. April 30, 2008.
33
Upton May 2008. Email communication from Brad Upton of NCASI to Rebecca Nicholson, RTI. May 19, 2008.
WRI/WBCSD 2008. World Resources Institute (WRI) and World Business Council for Sustainable Development (WBCSD). The greenhouse gas protocol: A corporate accounting and reporting standard, Revised edition. Accessed at http://www.ghgprotocol.org/files/ghg-protocol-revised.pdf