Embed Size (px)
Citation preview
Technical Support Document:
Preparation of Emissions Inventories
for the Version 4.1, 2005-based Platform
March 2011
U.S. Environmental Protection Agency
Office of Air Quality Planning and Standards
Air Quality Assessment Division
Contacts:
Madeleine Strum, Rich Mason, Alison Eyth, Marc Houyoux,
ii
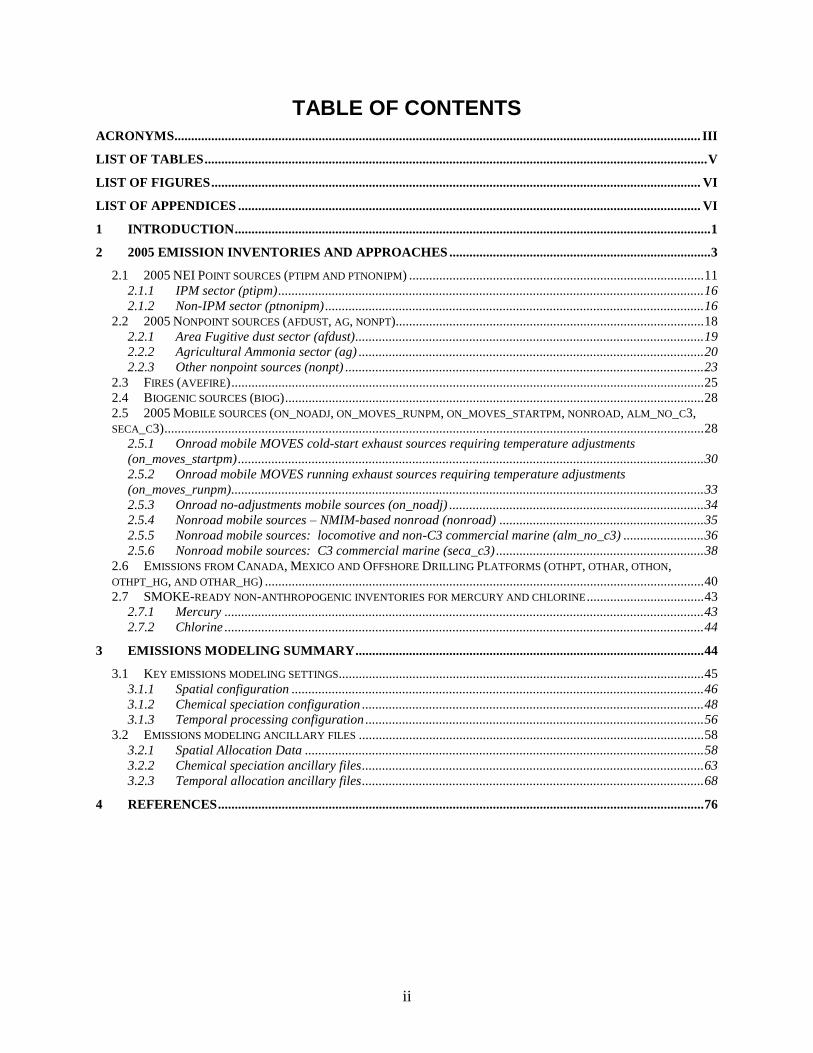
TABLE OF CONTENTS
ACRONYMS ............................................................................................................................................................. III
LIST OF TABLES ...................................................................................................................................................... V
LIST OF FIGURES .................................................................................................................................................. VI
LIST OF APPENDICES .......................................................................................................................................... VI
1 INTRODUCTION .............................................................................................................................................. 1
2 2005 EMISSION INVENTORIES AND APPROACHES .............................................................................. 3
2.1 2005 NEI POINT SOURCES (PTIPM AND PTNONIPM) ........................................................................................ 11 2.1.1 IPM sector (ptipm) ............................................................................................................................... 16 2.1.2 Non-IPM sector (ptnonipm) ................................................................................................................. 16
2.2 2005 NONPOINT SOURCES (AFDUST, AG, NONPT)............................................................................................ 18 2.2.1 Area Fugitive dust sector (afdust) ........................................................................................................ 19 2.2.2 Agricultural Ammonia sector (ag) ....................................................................................................... 20 2.2.3 Other nonpoint sources (nonpt) ........................................................................................................... 23
2.3 FIRES (AVEFIRE) ............................................................................................................................................. 25 2.4 BIOGENIC SOURCES (BIOG) ............................................................................................................................. 28 2.5 2005 MOBILE SOURCES (ON_NOADJ, ON_MOVES_RUNPM, ON_MOVES_STARTPM, NONROAD, ALM_NO_C3,
SECA_C3) ................................................................................................................................................................. 28 2.5.1 Onroad mobile MOVES cold-start exhaust sources requiring temperature adjustments
(on_moves_startpm) ........................................................................................................................................... 30 2.5.2 Onroad mobile MOVES running exhaust sources requiring temperature adjustments
(on_moves_runpm) ............................................................................................................................................. 33 2.5.3 Onroad no-adjustments mobile sources (on_noadj) ............................................................................ 34 2.5.4 Nonroad mobile sources – NMIM-based nonroad (nonroad) ............................................................. 35 2.5.5 Nonroad mobile sources: locomotive and non-C3 commercial marine (alm_no_c3) ........................ 36 2.5.6 Nonroad mobile sources: C3 commercial marine (seca_c3) .............................................................. 38
2.6 EMISSIONS FROM CANADA, MEXICO AND OFFSHORE DRILLING PLATFORMS (OTHPT, OTHAR, OTHON,
OTHPT_HG, AND OTHAR_HG) ................................................................................................................................... 40 2.7 SMOKE-READY NON-ANTHROPOGENIC INVENTORIES FOR MERCURY AND CHLORINE ................................... 43
2.7.1 Mercury ............................................................................................................................................... 43 2.7.2 Chlorine ............................................................................................................................................... 44
3 EMISSIONS MODELING SUMMARY ........................................................................................................ 44
3.1 KEY EMISSIONS MODELING SETTINGS............................................................................................................. 45 3.1.1 Spatial configuration ........................................................................................................................... 46 3.1.2 Chemical speciation configuration ...................................................................................................... 48 3.1.3 Temporal processing configuration ..................................................................................................... 56
3.2 EMISSIONS MODELING ANCILLARY FILES ....................................................................................................... 58 3.2.1 Spatial Allocation Data ....................................................................................................................... 58 3.2.2 Chemical speciation ancillary files ...................................................................................................... 63 3.2.3 Temporal allocation ancillary files ...................................................................................................... 68
4 REFERENCES ................................................................................................................................................. 76
iii
Acronyms BAFM Benzene, Acetaldehyde, Formaldehyde and Methanol
BEIS Biogenic Emissions Inventory System
C3 Category 3 (commercial marine vessels)
CAIR Clean Air Interstate Rule
CAMD EPA‘s Clean Air Markets Division
CAMX Comprehensive Air Quality Model with Extensions
CAP Criteria Air Pollutant
CARB California Air Resources Board
CEM Continuous Emissions Monitoring
CHIEF Clearinghouse for Inventories and Emissions Factors
Cl Chlorine
CMAQ Community Multiscale Air Quality
CMV Commercial marine vessel
CO Carbon monoxide
EGU Electric generating units
EPA Environmental Protection Agency
EMFAC Emission Factor (California‘s onroad mobile model)
EEZ Exclusive Economic Zone
FAA Federal Aviation Administration
FCCS Fuel Characteristic Classification System
FIPS Federal Information Processing Standards
HAP Hazardous Air Pollutant
HCL Hydrochloric acid
Hg Mercury
HGNRVA Natural recycled, volcanic and anthropogenic Hg
HMS Hazard Mapping System
ICR Information Collection Request
IMO International Marine Organization
IPM Integrated Planning Model
ITN Itinerant
MACT Maximum Achievable Control Technology
MOBILE OTAQ‘s model for estimation of onroad mobile emissions factors
MOVES Motor Vehicle Emissions Simulator -- OTAQ‘s model for estimation of onroad mobile
emissions – replaces the use of the MOBILE model
NEEDS National Electric Energy Database System
NEI National Emission Inventory
NESHAP National Emission Standards for Hazardous Air Pollutants
NH3 Ammonia
nm nautical mile
NMIM National Mobile Inventory Model
NOAA National Oceanic and Atmospheric Administration
NONROAD OTAQ‘s model for estimation of nonroad mobile emissions
NOX Nitrogen oxides
OAQPS EPA‘s Office of Air Quality Planning and Standards
OTAQ EPA‘s Office of Transportation and Air Quality
ORD EPA‘s Office of Research and Development
ORL One Record per Line
PF Projection Factor, can account for growth and/or controls
PFC Portable Fuel Container
iv
PM2.5 Particulate matter less than or equal to 2.5 microns
PM10 Particulate matter less than or equal to 10 microns
RIA Regulatory Impact Analysis
RFS2 Revised Annual Renewable Fuel Standard
RRF Relative Response Factor
RWC Residential Wood Combustion
RPO Regional Planning Organization
SCC Source Classification Code
SMARTFIRE Satellite Mapping Automated Reanalysis Tool for Fire Incident Reconciliation
SMOKE Sparse Matrix Operator Kernel Emissions
SO2 Sulfur dioxide
SOA Secondary Organic Aerosol
SPPD Sector Policies and Programs Division
TAF Terminal Area Forecast
TCEQ Texas Commission on Environmental Quality
TSD Technical support document
VOC Volatile organic compounds
VMT Vehicle miles traveled
WRAP Western Regional Air Partnership
v
List of Tables
Table 2-1. Platform sectors used in emissions modeling for the 2005 platform, version 4.1........ 4 Table 2-2. Summary of significant changes between v4 and v4.1 platforms by sector ................ 7
Table 2-3. 2005 Emissions by Sector: VOC, NOX, CO, SO2, NH3, PM10, PM2.5 ................. 10 Table 2-4. Summaries of Hg (speciated), HCL and CL2* .......................................................... 11 Table 2-5. Summaries of the non-anthropogenic mercury across the modeling domain ............ 11 Table 2-6. Hg changes made to the 2005 NATA Hg inventory (June 18, 2010 version) for the
2005 ptnonipm, ptipm, and nonpt sectors. ............................................................................ 14
Table 2-7. SCCs in the afdust platform sector ............................................................................. 20 Table 2-8. Livestock SCCs extracted from the 2002 NEI to create the ag sector ....................... 21 Table 2-9. Fertilizer SCCs extracted from the 2002 NEI for inclusion in the ―ag‖ sector .......... 23 Table 2-10. Additional TCEQ oil and gas emissions added to the 2005v2 NEI ......................... 24 Table 2-11. SCCs provided with Oklahoma oil and gas sector emissions .................................. 25
Table 2-12. Changes to Oklahoma oil and gas emissions ........................................................... 25 Table 2-13. Average fire VOC changes from 2002 to 2005 platform. ........................................ 26
Table 2-14. HAP emission factors applied to avefire PM2.5 emissions ....................................... 27 Table 2-15. Pollutants covered by MOVES2010 as used in the 2005v4.1 platform
1 .................. 29
Table 2-16. SCCs in the 2005 alm_no_c3 inventory compared to the 2002 platform alm sector 37 Table 2-17. Adjustment factors to update the 2005 seca_c3 sector emissions for the v4.1
platform. ................................................................................................................................ 39
Table 2-18. Contiguous U.S. C3 CMV emissions in 2002 and 2005 platforms .......................... 40 Table 2-19. Summary of the othpt, othpt_hg, othar, othar_hg, and othon sectors changes from
the 2002 platform .................................................................................................................. 42 Table 3-1. Key emissions modeling steps by sector. ................................................................... 46 Table 3-2. Descriptions of the 2005-based platform grids .......................................................... 47
Table 3-3. Model species produced by SMOKE for CB05 with SOA for CMAQ4.7 and CAMX*
............................................................................................................................................... 49 Table 3-4. Integration status of benzene, acetaldehyde, formaldehyde and methanol (BAFM) for
each platform sector .............................................................................................................. 53
Table 3-5. Source-category specific criteria for integrating nonpt SCCs for categories
comprising 80% of the nonpoint VOC emissions................................................................. 54 Table 3-6. Temporal settings used for the platform sectors in SMOKE, v4.1 platform .............. 57
Table 3-7. U.S. Surrogates available for the 2005v4.1 platform. ................................................ 59 Table 3-8. Surrogate assignments to new mobile categories in the 2005v4 platform ................. 61 Table 3-9. Canadian Spatial Surrogates for 2005-based platform Canadian Emissions (v4.1
unchanged from v4) .............................................................................................................. 62 Table 3-10. Differences between two profiles used for commercial marine residual oil ............ 65
Table 3-11. Differences between two profiles used for coal combustion .................................... 66
Table 3-12: PM2.5 speciation profile updates assignments for the v4 platform ............................ 66
Table 3-13. Summary of VOC speciation profile approach by sector for 2005 ........................... 67 Table 3-14. Speciation of Mercury .............................................................................................. 67 Table 3-15. Summary of spatial surrogates, temporal profiles, and speciation profiles used by
gasoline vehicle types for the onroad parking area-related SCCs. ....................................... 71 Table 3-16. Summary of spatial surrogates, temporal profiles, and speciation profiles used by
diesel vehicle types for the onroad parking area-related SCCs from MOVES2010............. 73
vi
List of Figures
Figure 2-1. MOVES exhaust temperature adjustment functions. ................................................ 32 Figure 3-1. CMAQ modeling domains ......................................................................................... 47 Figure 3-2. Process of integrating BAFM with VOC for use in VOC Speciation....................... 52 Figure 3-3. Diurnal Profiles based on road type (use local for ―start‖) and whether the road is
urban versus rural .................................................................................................................. 69
Figure 3-4. Diurnal temporal profile for HDDV 2B through 8B at Parking areas ...................... 70
List of Appendices
Appendix A: Revisions to PTIPM Sector SO2 and NOX emissions from V4 to V4.1
Appendix B: Creation of the modeling file (―ORL point file‖) parameters from the Boiler
MACT ICR unit level emissions
Appendix C: Pollutants in the onroad emission sectors generated from NMIM or MOVES2010
Appendix D: Approach to develop CMAQ PM2.5 species from Partially-speciated MOVES2010
EXHAUST PM2.5 for the 2005 Platform, version 4.1
1
1 Introduction The U.S. Environmental Protection Agency (EPA), hereafter referred to as ―we,‖ has developed
an updated version of the 2005-based air quality modeling platform, version 4.1. This document
describes the emissions inventory and emissions modeling for this version, focusing on the
changes made from version 4. The version 4 platform is documented at the emissions modeling
clearinghouse website, http://www.epa.gov/ttn/chief/emch/, under the section entitled ―2005-
Based Modeling Platform‖ and the subsection entitled ―CAP-Hg-BAFM 2005-Based Platform
Version 4.1‖.
The platform consists of Criteria Air Pollutants (CAPs) and the following select Hazardous Air
Pollutants (HAPs): mercury (Hg), chlorine (CL2), hydrochloric acid or hydrogen chloride (HCL)
and benzene, acetaldehyde, formaldehyde and methanol. The latter four are also denoted BAFM.
This platform is called the ―CAP-Hg-BAFM 2005-Based Platform, Version 4.1‖ platform (we
will use the shortened name ―2005v4.1‖ in this documentation). This platform supports the
Regulatory Impact Analysis for National Emission Standards for Hazardous Air Pollutants
(NESHAP) for Industrial, Commercial, and Institutional Boilers and Process Heaters (a.k.a.
―Boiler MACT‖) and the proposal for the Toxics rule.
The underlying 2005 inventories used are: 1) the 2005 National Emission Inventory (NEI),
version 2 (http://www.epa.gov/ttn/chief/net/2005inventory.html), 2) the 2005 National Air
Toxics Assessment (NATA) mercury inventory from June 2010, and 3) an inventory of Hg
developed from the Boiler MACT Information Collection Request (ICR) for the National
Emission Standards for Major Sources: Industrial/Commercial/Institutional Boilers and Process
Heaters (http://www.epa.gov/ttn/atw/boiler/boilerpg.html). This document describes the
approach and data used to produce the emission inputs to the air quality model used in the
2005v4.1 platform.
Emissions preparation for the 2005v4.1 platform supports the Community Multiscale Air Quality
(CMAQ) model (http://www.epa.gov/AMD/CMAQ/) and (2) the Comprehensive Air Quality
Model, with extensions (CAMX) (http://www.camx.com/). Both models support modeling ozone
(O3), particulate matter (PM) and mercury (Hg), and require hourly and gridded emissions of
chemical species from the following inventory pollutants: carbon monoxide (CO), nitrogen
oxides (NOX), volatile organic compounds (VOC), sulfur dioxide (SO2), ammonia (NH3),
particulate matter less than or equal to 10 microns (PM10), individual component species for
particulate matter less than or equal to 2.5 microns (PM2.5) and individual component species of
gaseous and particulate mercury (Hg). In addition, the CMAQ Carbon Bond 05 (CB05)
chemical mechanism with chlorine chemistry, which is part of the ―base‖ version of CMAQ,
allows explicit treatment of BAFM and includes HAP emissions of HCL and CL2. The platform
BAFM emissions come from either the NEI values for benzene, formaldehyde, acetaldehyde and
methanol (BAFM) or via speciation of NEI VOC into the component species.
The effort to create the emission inputs for the 2005v4.1 platform included:
(1) modification of emission inventories used for the 2005v4 base case,
(2) updates to the emissions modeling ancillary files used with the emissions modeling tools,
and
2
(3) application of the emissions modeling tools.
The primary emissions modeling tool used to create the CMAQ model-ready emissions was the
Sparse Matrix Operator Kernel Emissions (SMOKE) modeling system (http://www.smoke-
model.org/index.cfm). We used SMOKE version 2.6 to create emissions files for a 36-km
national grid, a 12-km Eastern grid and a 12-km Western grid for a 2005 base case (also known
as the ―2005cr_hg_05b‖ case for purposes of our directory structure). The purpose of this case is
to provide a 2005 case that is consistent with the methods used in the future-year base case and
control cases. For regulatory applications, this case is included in the relative response factor
(RRF) calculations.
Unlike the version 4 (v4) platform, this platform includes only a base case; it does not include a
model evaluation case. The evaluation case in the 2005v4 platform uses 2005-specific fire
emissions and 2005 hour-specific continuous emission monitoring (CEM) data for electric
generating units (EGUs) whereas the 2005 base case includes an ―average year‖ scenario for
fires and a illustrative (rather than year-specific) temporal allocation approach for EGUs to
allocate annual 2005 emissions to days and hours. This approach to temporal allocation was
used for all base and control cases modeled to provide a temporal consistency that is intended to
be a conceivable temporal allocation without tying the approach to a single year.
The 2005v4.1 platform was developed using the concepts, tools and emissions modeling data
from EPA‘s 2005v4 platform, documented by:
ftp://ftp.epa.gov/EmisInventory/2005v4/2005_emissions_tsd_07jul2010.pdf (main document) ,
ftp://ftp.epa.gov/EmisInventory/2005v4/2005_emissions_tsd_appendices_11may2010.pdf
(appendices to the main document), and
http://www.epa.gov/ttn/chief/emch/transport/tr_proposal_emissions_tsd.pdf (future year).
Section 2 provides a summary of the key differences between the two versions of the emissions
platform.
This document contains five sections and four appendices. Section 2 describes the 2005
inventories input to SMOKE. Section 3 describes the emissions modeling and the ancillary files
used with the emission inventories. The development of the 2016 inventory (projected from
2005) is provided through technical support documents for the specific modeling applications.
Section 4 provides references. Appendices A through D provide additional details about specific
technical methods.
Electronic copies of the data used with SMOKE for the 2005 platform are available at the
emissions modeling clearinghouse, http://www.epa.gov/ttn/chief/emch/, under the section
entitled ―2005-Based Modeling Platform‖ and the subsection entitled ―CAP-Hg-BAFM 2005-
Based Platform, Version 4.1‖. This is referred to as the ―2005v4.1 website‖ throughout this
document. In addition, this data is provided to the electronic docket in support of the Toxics
Rule.
3
2 2005 emission inventories and approaches This section describes the 2005 emissions data created for input to SMOKE. As with the 2005v4
platform, the primary basis for the 2005 stationary source emission inputs is the 2005 National
Emission Inventory (NEI), version 2, which includes emissions of CO, NOX, VOC, SO2, NH3,
PM10, PM2.5 and hazardous air pollutants (HAPs). The HAPs we used from this inventory are
mercury, chlorine (CL2), hydrogen chloride (HCL), benzene, acetaldehyde, formaldehyde, and
methanol. We began with the same SMOKE-formatted inventory inputs as the 2005v4 platform
(case name: 2005ck_05b) and made changes described here.
For mercury, the 2005v4.1 platform uses a later version of the 2005v2 NEI inventory prepared
for the 2005 National Air Toxics Assessment (NATA). It uses the June 18, 2010 version of the
2005 NATA inventory, with the exception of emissions from commercial, institutional and
industrial boilers from the major source information collection request (ICR) database and other
changes described later. The NATA inventory started with the 2005v2 NEI, and was updated
with data collected for some source categories, which resulted in major updates to mercury
emissions for Portland cement and hazardous waste combustion. The NATA inventory was also
revised as a result of comments received as part of the state, local and tribal review.
Documentation for the 2005 NEI can be found at:
http://www.epa.gov/ttn/chief/net/2005inventory.html#documentation. For inventories outside of
the United States, which include Canada and Mexico, we used the latest available base-year
inventories as discussed in Section 2.6.
The 2005 NEI includes five sectors: nonpoint (formerly called ―stationary area‖) sources, point
sources, nonroad mobile sources, onroad mobile sources, and fires. Because the 2005v4.1
platform includes just a base case, the available day-specific wildfires and prescribed burning
data from the 2005 NEI was not used; rather an average fire inventory that is used for both base
and future years was used.
For purposes of preparing the air quality model-ready emissions, we used the same split of the
2005 emissions inventory into ―platform‖ sectors for use in emissions modeling as was used in
the 2005v4 platform. The significance of an emissions modeling or ―platform‖ sector is that it is
run through all of the SMOKE programs except the final merge (Mrggrid) independently from
the other sectors. The final merge program combines the sector-specific gridded, speciated and
hourly emissions together to create the CMAQ-ready emission inputs, which can be converted to
emissions that can be used by CAMX when needed.
Similarly to 2005v4, we added sectors for biogenic emissions, emissions from the Canadian and
Mexican inventories, and augmented with other emissions data to be explained below.
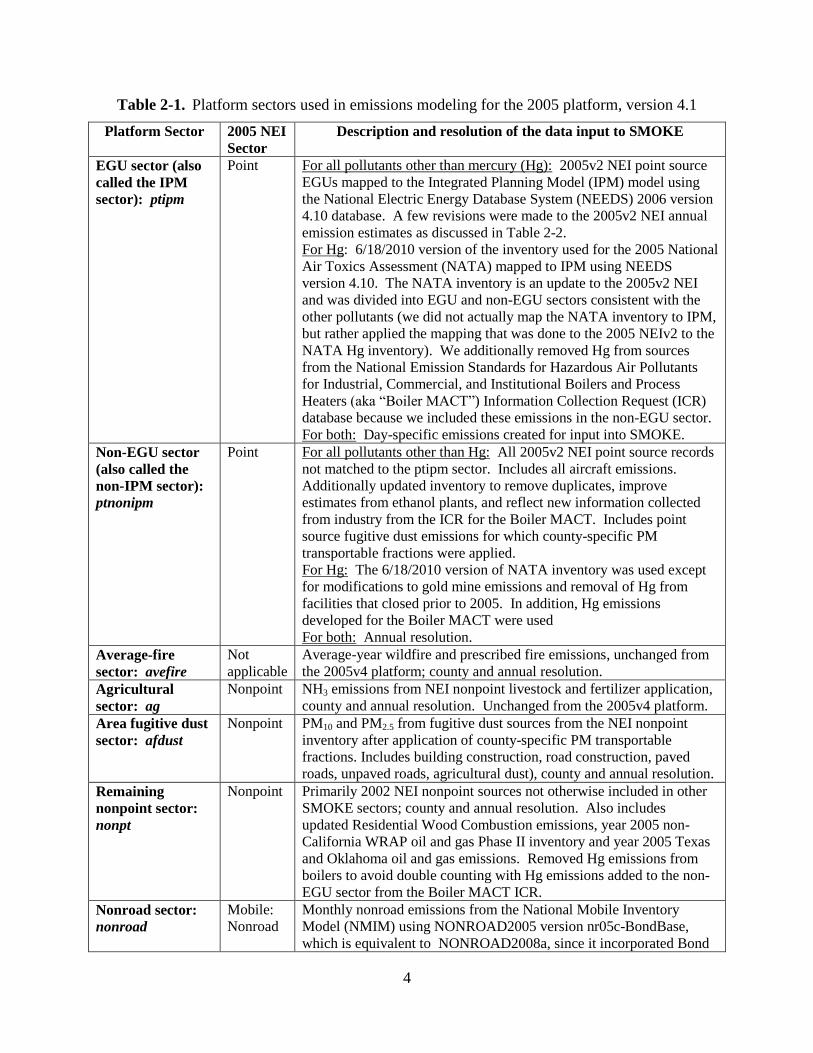
Table 2-1 presents the sectors in the 2005 platform. The sector abbreviations are provided in
italics; these abbreviations are used in the SMOKE modeling scripts and inventory file names,
and throughout the remainder of this document. Updates from the 2005v4 platform are
discussed in Table 2-2.
4
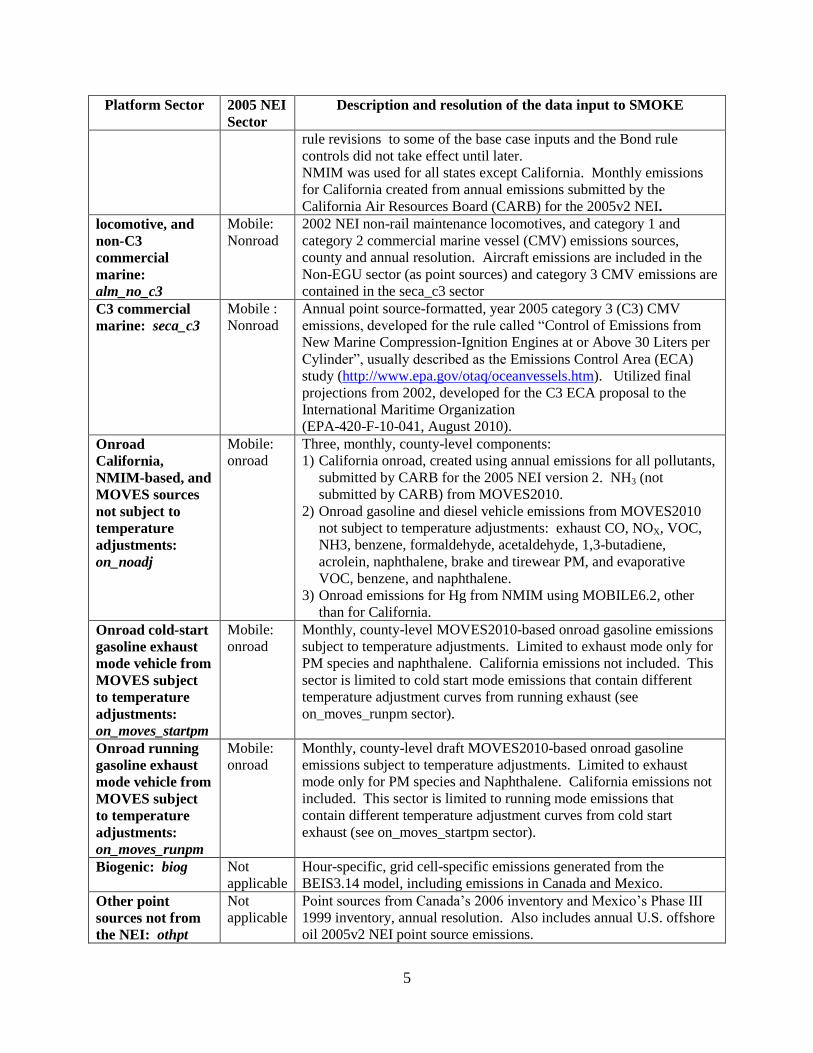
Table 2-1. Platform sectors used in emissions modeling for the 2005 platform, version 4.1
Platform Sector 2005 NEI
Sector
Description and resolution of the data input to SMOKE
EGU sector (also
called the IPM
sector): ptipm
Point For all pollutants other than mercury (Hg): 2005v2 NEI point source
EGUs mapped to the Integrated Planning Model (IPM) model using
the National Electric Energy Database System (NEEDS) 2006 version
4.10 database. A few revisions were made to the 2005v2 NEI annual
emission estimates as discussed in Table 2-2.
For Hg: 6/18/2010 version of the inventory used for the 2005 National
Air Toxics Assessment (NATA) mapped to IPM using NEEDS
version 4.10. The NATA inventory is an update to the 2005v2 NEI
and was divided into EGU and non-EGU sectors consistent with the
other pollutants (we did not actually map the NATA inventory to IPM,
but rather applied the mapping that was done to the 2005 NEIv2 to the
NATA Hg inventory). We additionally removed Hg from sources
from the National Emission Standards for Hazardous Air Pollutants
for Industrial, Commercial, and Institutional Boilers and Process
Heaters (aka ―Boiler MACT‖) Information Collection Request (ICR)
database because we included these emissions in the non-EGU sector.
For both: Day-specific emissions created for input into SMOKE.
Non-EGU sector
(also called the
non-IPM sector):
ptnonipm
Point For all pollutants other than Hg: All 2005v2 NEI point source records
not matched to the ptipm sector. Includes all aircraft emissions.
Additionally updated inventory to remove duplicates, improve
estimates from ethanol plants, and reflect new information collected
from industry from the ICR for the Boiler MACT. Includes point
source fugitive dust emissions for which county-specific PM
transportable fractions were applied.
For Hg: The 6/18/2010 version of NATA inventory was used except
for modifications to gold mine emissions and removal of Hg from
facilities that closed prior to 2005. In addition, Hg emissions
developed for the Boiler MACT were used
For both: Annual resolution.
Average-fire
sector: avefire
Not
applicable
Average-year wildfire and prescribed fire emissions, unchanged from
the 2005v4 platform; county and annual resolution.
Agricultural
sector: ag
Nonpoint NH3 emissions from NEI nonpoint livestock and fertilizer application,
county and annual resolution. Unchanged from the 2005v4 platform.
Area fugitive dust
sector: afdust
Nonpoint PM10 and PM2.5 from fugitive dust sources from the NEI nonpoint
inventory after application of county-specific PM transportable
fractions. Includes building construction, road construction, paved
roads, unpaved roads, agricultural dust), county and annual resolution.
Remaining
nonpoint sector:
nonpt
Nonpoint Primarily 2002 NEI nonpoint sources not otherwise included in other
SMOKE sectors; county and annual resolution. Also includes
updated Residential Wood Combustion emissions, year 2005 non-
California WRAP oil and gas Phase II inventory and year 2005 Texas
and Oklahoma oil and gas emissions. Removed Hg emissions from
boilers to avoid double counting with Hg emissions added to the non-
EGU sector from the Boiler MACT ICR.
Nonroad sector:
nonroad
Mobile:
Nonroad
Monthly nonroad emissions from the National Mobile Inventory
Model (NMIM) using NONROAD2005 version nr05c-BondBase,
which is equivalent to NONROAD2008a, since it incorporated Bond
5
Platform Sector 2005 NEI
Sector
Description and resolution of the data input to SMOKE
rule revisions to some of the base case inputs and the Bond rule
controls did not take effect until later.
NMIM was used for all states except California. Monthly emissions
for California created from annual emissions submitted by the
California Air Resources Board (CARB) for the 2005v2 NEI.
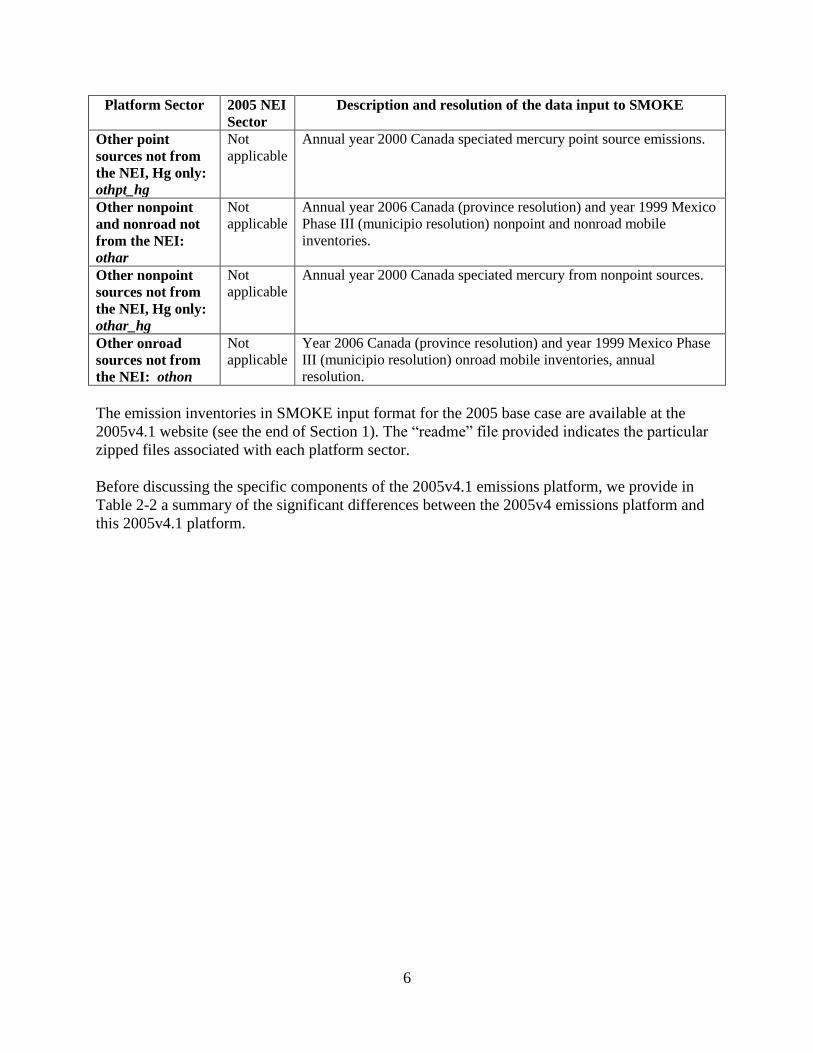
locomotive, and
non-C3
commercial
marine:
alm_no_c3
Mobile:
Nonroad
2002 NEI non-rail maintenance locomotives, and category 1 and
category 2 commercial marine vessel (CMV) emissions sources,
county and annual resolution. Aircraft emissions are included in the
Non-EGU sector (as point sources) and category 3 CMV emissions are
contained in the seca_c3 sector
C3 commercial
marine: seca_c3
Mobile :
Nonroad
Annual point source-formatted, year 2005 category 3 (C3) CMV
emissions, developed for the rule called ―Control of Emissions from
New Marine Compression-Ignition Engines at or Above 30 Liters per
Cylinder‖, usually described as the Emissions Control Area (ECA)
study (http://www.epa.gov/otaq/oceanvessels.htm). Utilized final
projections from 2002, developed for the C3 ECA proposal to the
International Maritime Organization
(EPA-420-F-10-041, August 2010).
Onroad
California,
NMIM-based, and
MOVES sources
not subject to
temperature
adjustments:
on_noadj
Mobile:
onroad
Three, monthly, county-level components:
1) California onroad, created using annual emissions for all pollutants,
submitted by CARB for the 2005 NEI version 2. NH3 (not
submitted by CARB) from MOVES2010.
2) Onroad gasoline and diesel vehicle emissions from MOVES2010
not subject to temperature adjustments: exhaust CO, NOX, VOC,
NH3, benzene, formaldehyde, acetaldehyde, 1,3-butadiene,
acrolein, naphthalene, brake and tirewear PM, and evaporative
VOC, benzene, and naphthalene.
3) Onroad emissions for Hg from NMIM using MOBILE6.2, other
than for California.
Onroad cold-start
gasoline exhaust
mode vehicle from
MOVES subject
to temperature
adjustments:
on_moves_startpm
Mobile:
onroad
Monthly, county-level MOVES2010-based onroad gasoline emissions
subject to temperature adjustments. Limited to exhaust mode only for
PM species and naphthalene. California emissions not included. This
sector is limited to cold start mode emissions that contain different
temperature adjustment curves from running exhaust (see
on_moves_runpm sector).
Onroad running
gasoline exhaust
mode vehicle from
MOVES subject
to temperature
adjustments:
on_moves_runpm
Mobile:
onroad
Monthly, county-level draft MOVES2010-based onroad gasoline
emissions subject to temperature adjustments. Limited to exhaust
mode only for PM species and Naphthalene. California emissions not
included. This sector is limited to running mode emissions that
contain different temperature adjustment curves from cold start
exhaust (see on_moves_startpm sector).
Biogenic: biog Not
applicable
Hour-specific, grid cell-specific emissions generated from the
BEIS3.14 model, including emissions in Canada and Mexico.
Other point
sources not from
the NEI: othpt
Not
applicable
Point sources from Canada‘s 2006 inventory and Mexico‘s Phase III
1999 inventory, annual resolution. Also includes annual U.S. offshore
oil 2005v2 NEI point source emissions.
6
Platform Sector 2005 NEI
Sector
Description and resolution of the data input to SMOKE
Other point
sources not from
the NEI, Hg only:
othpt_hg
Not
applicable
Annual year 2000 Canada speciated mercury point source emissions.
Other nonpoint
and nonroad not
from the NEI:
othar
Not
applicable
Annual year 2006 Canada (province resolution) and year 1999 Mexico
Phase III (municipio resolution) nonpoint and nonroad mobile
inventories.
Other nonpoint
sources not from
the NEI, Hg only:
othar_hg
Not
applicable
Annual year 2000 Canada speciated mercury from nonpoint sources.
Other onroad
sources not from
the NEI: othon
Not
applicable
Year 2006 Canada (province resolution) and year 1999 Mexico Phase
III (municipio resolution) onroad mobile inventories, annual
resolution.
The emission inventories in SMOKE input format for the 2005 base case are available at the
2005v4.1 website (see the end of Section 1). The ―readme‖ file provided indicates the particular
zipped files associated with each platform sector.
Before discussing the specific components of the 2005v4.1 emissions platform, we provide in
Table 2-2 a summary of the significant differences between the 2005v4 emissions platform and
this 2005v4.1 platform.
7
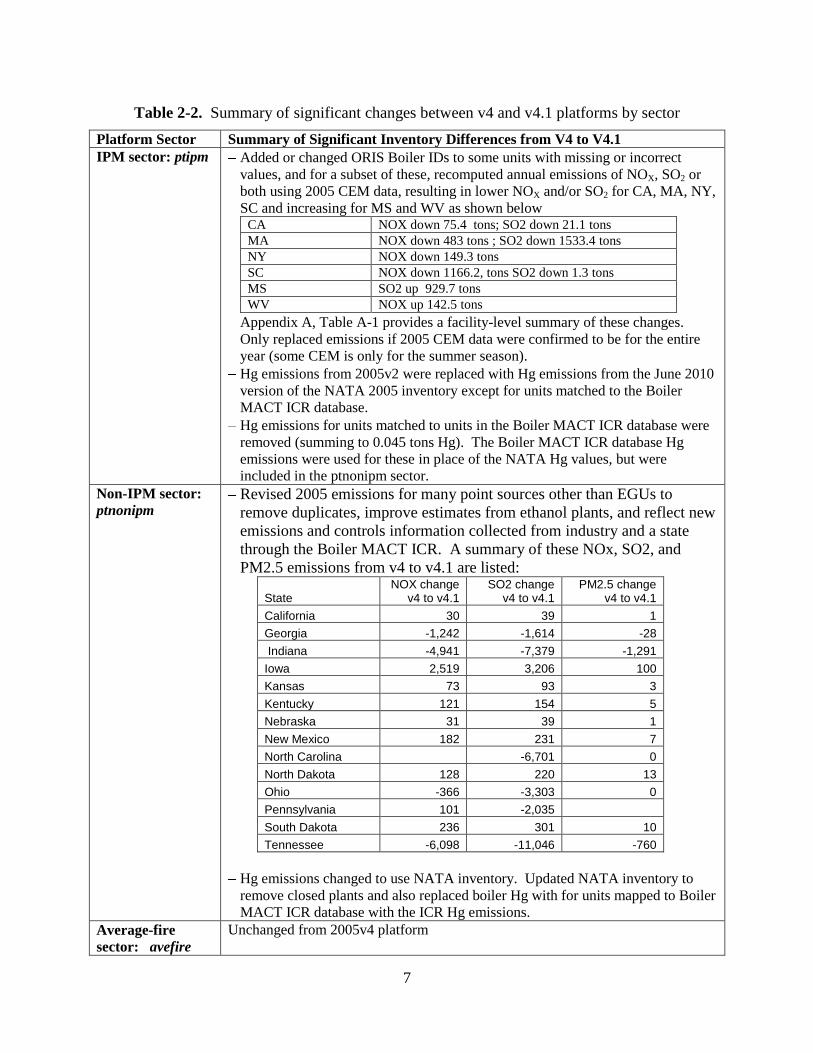
Table 2-2. Summary of significant changes between v4 and v4.1 platforms by sector
Platform Sector Summary of Significant Inventory Differences from V4 to V4.1
IPM sector: ptipm Added or changed ORIS Boiler IDs to some units with missing or incorrect
values, and for a subset of these, recomputed annual emissions of NOX, SO2 or
both using 2005 CEM data, resulting in lower NOX and/or SO2 for CA, MA, NY,
SC and increasing for MS and WV as shown below CA NOX down 75.4 tons; SO2 down 21.1 tons
MA NOX down 483 tons ; SO2 down 1533.4 tons
NY NOX down 149.3 tons
SC NOX down 1166.2, tons SO2 down 1.3 tons
MS SO2 up 929.7 tons
WV NOX up 142.5 tons
Appendix A, Table A-1 provides a facility-level summary of these changes.
Only replaced emissions if 2005 CEM data were confirmed to be for the entire
year (some CEM is only for the summer season).
Hg emissions from 2005v2 were replaced with Hg emissions from the June 2010
version of the NATA 2005 inventory except for units matched to the Boiler
MACT ICR database.
Hg emissions for units matched to units in the Boiler MACT ICR database were
removed (summing to 0.045 tons Hg). The Boiler MACT ICR database Hg
emissions were used for these in place of the NATA Hg values, but were
included in the ptnonipm sector.
Non-IPM sector:
ptnonipm Revised 2005 emissions for many point sources other than EGUs to
remove duplicates, improve estimates from ethanol plants, and reflect new
emissions and controls information collected from industry and a state
through the Boiler MACT ICR. A summary of these NOx, SO2, and
PM2.5 emissions from v4 to v4.1 are listed:
State NOX change
v4 to v4.1 SO2 change
v4 to v4.1 PM2.5 change
v4 to v4.1
California 30 39 1
Georgia -1,242 -1,614 -28
Indiana -4,941 -7,379 -1,291
Iowa 2,519 3,206 100
Kansas 73 93 3
Kentucky 121 154 5
Nebraska 31 39 1
New Mexico 182 231 7
North Carolina -6,701 0
North Dakota 128 220 13
Ohio -366 -3,303 0
Pennsylvania 101 -2,035
South Dakota 236 301 10
Tennessee -6,098 -11,046 -760
Hg emissions changed to use NATA inventory. Updated NATA inventory to
remove closed plants and also replaced boiler Hg with for units mapped to Boiler
MACT ICR database with the ICR Hg emissions.
Average-fire
sector: avefire
Unchanged from 2005v4 platform
8
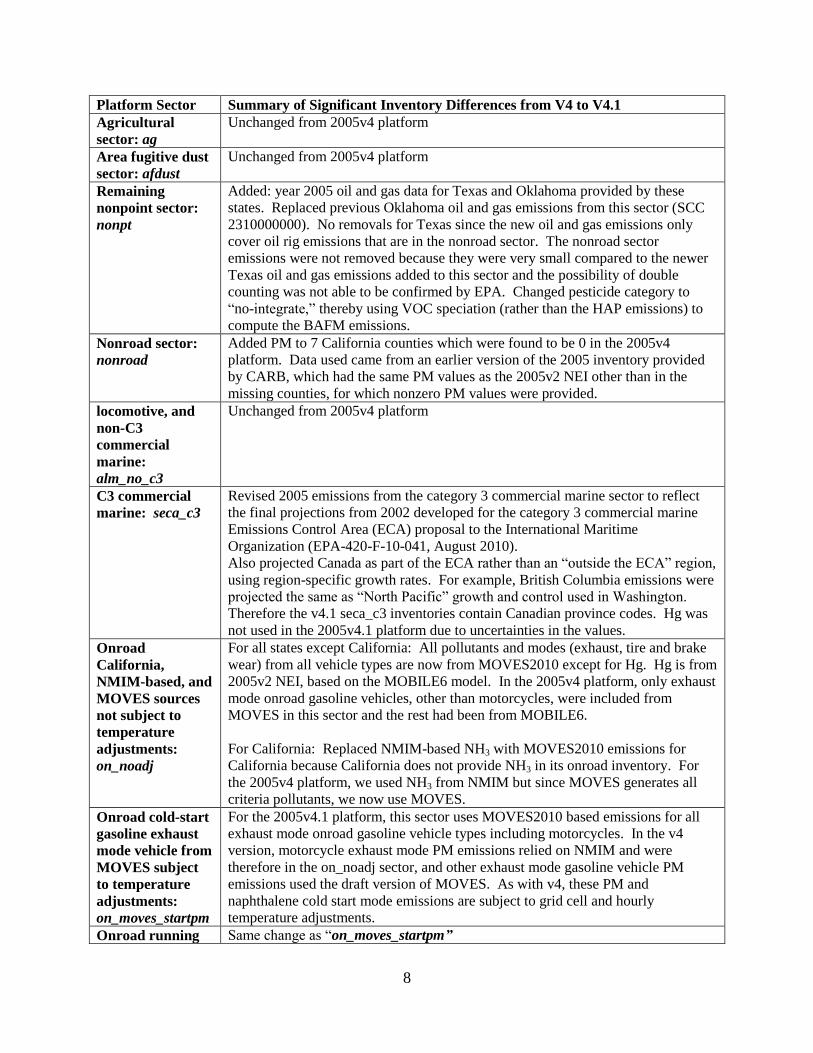
Platform Sector Summary of Significant Inventory Differences from V4 to V4.1
Agricultural
sector: ag
Unchanged from 2005v4 platform
Area fugitive dust
sector: afdust
Unchanged from 2005v4 platform
Remaining
nonpoint sector:
nonpt
Added: year 2005 oil and gas data for Texas and Oklahoma provided by these
states. Replaced previous Oklahoma oil and gas emissions from this sector (SCC
2310000000). No removals for Texas since the new oil and gas emissions only
cover oil rig emissions that are in the nonroad sector. The nonroad sector
emissions were not removed because they were very small compared to the newer
Texas oil and gas emissions added to this sector and the possibility of double
counting was not able to be confirmed by EPA. Changed pesticide category to
―no-integrate,‖ thereby using VOC speciation (rather than the HAP emissions) to
compute the BAFM emissions.
Nonroad sector:
nonroad
Added PM to 7 California counties which were found to be 0 in the 2005v4
platform. Data used came from an earlier version of the 2005 inventory provided
by CARB, which had the same PM values as the 2005v2 NEI other than in the
missing counties, for which nonzero PM values were provided.
locomotive, and
non-C3
commercial
marine:
alm_no_c3
Unchanged from 2005v4 platform
C3 commercial
marine: seca_c3
Revised 2005 emissions from the category 3 commercial marine sector to reflect
the final projections from 2002 developed for the category 3 commercial marine
Emissions Control Area (ECA) proposal to the International Maritime
Organization (EPA-420-F-10-041, August 2010).
Also projected Canada as part of the ECA rather than an ―outside the ECA‖ region,
using region-specific growth rates. For example, British Columbia emissions were
projected the same as ―North Pacific‖ growth and control used in Washington.
Therefore the v4.1 seca_c3 inventories contain Canadian province codes. Hg was
not used in the 2005v4.1 platform due to uncertainties in the values.
Onroad
California,
NMIM-based, and
MOVES sources
not subject to
temperature
adjustments:
on_noadj
For all states except California: All pollutants and modes (exhaust, tire and brake
wear) from all vehicle types are now from MOVES2010 except for Hg. Hg is from
2005v2 NEI, based on the MOBILE6 model. In the 2005v4 platform, only exhaust
mode onroad gasoline vehicles, other than motorcycles, were included from
MOVES in this sector and the rest had been from MOBILE6.
For California: Replaced NMIM-based NH3 with MOVES2010 emissions for
California because California does not provide NH3 in its onroad inventory. For
the 2005v4 platform, we used NH3 from NMIM but since MOVES generates all
criteria pollutants, we now use MOVES.
Onroad cold-start
gasoline exhaust
mode vehicle from
MOVES subject
to temperature
adjustments:
on_moves_startpm
For the 2005v4.1 platform, this sector uses MOVES2010 based emissions for all
exhaust mode onroad gasoline vehicle types including motorcycles. In the v4
version, motorcycle exhaust mode PM emissions relied on NMIM and were
therefore in the on_noadj sector, and other exhaust mode gasoline vehicle PM
emissions used the draft version of MOVES. As with v4, these PM and
naphthalene cold start mode emissions are subject to grid cell and hourly
temperature adjustments.
Onroad running Same change as ―on_moves_startpm”
9
Platform Sector Summary of Significant Inventory Differences from V4 to V4.1
gasoline exhaust
mode vehicle from
MOVES subject
to temperature
adjustments:
on_moves_runpm
Biogenic: biog Unchanged from 2005v4 platform
Other point
sources not from
the NEI: othpt
Unchanged from 2005v4 platform
Other point
sources not from
the NEI, Hg only:
othpt_hg
Unchanged from 2005v4 platform
Other nonpoint
and nonroad not
from the NEI:
othar
Unchanged from 2005v4 platform
Other nonpoint
sources not from
the NEI, Hg only:
othar_hg
Unchanged from 2005v4 platform
Other onroad
sources not from
the NEI: othon
Unchanged from 2005v4 platform
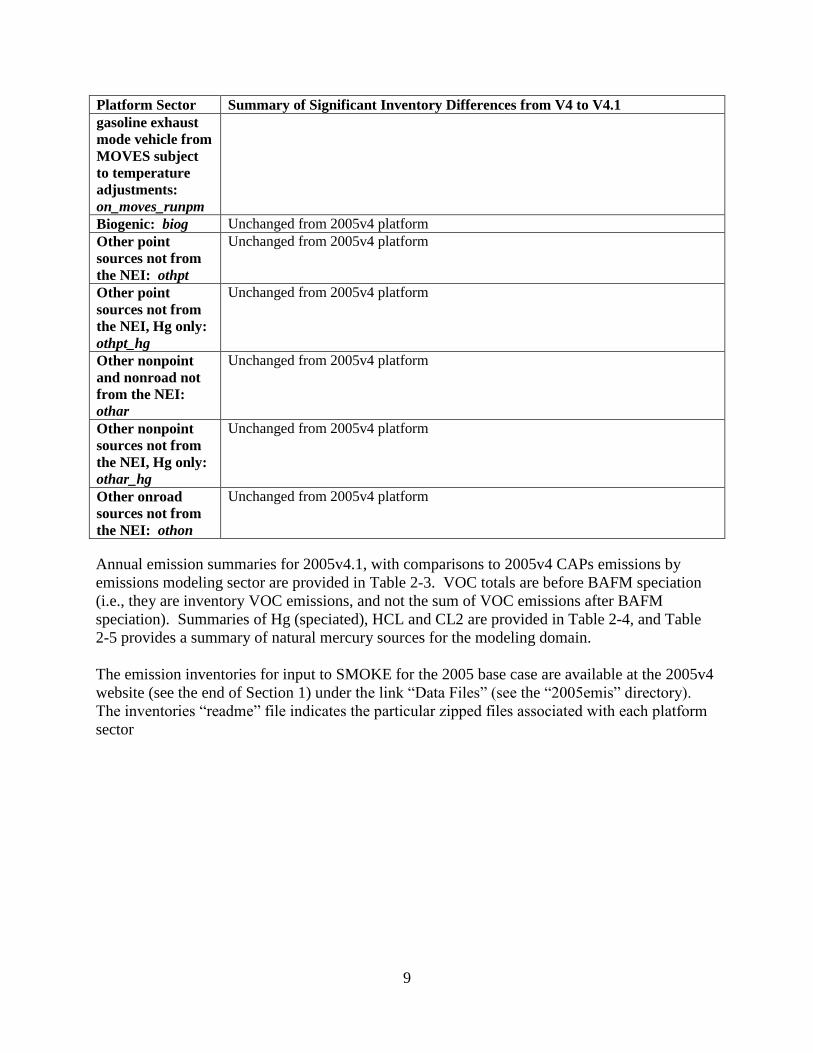
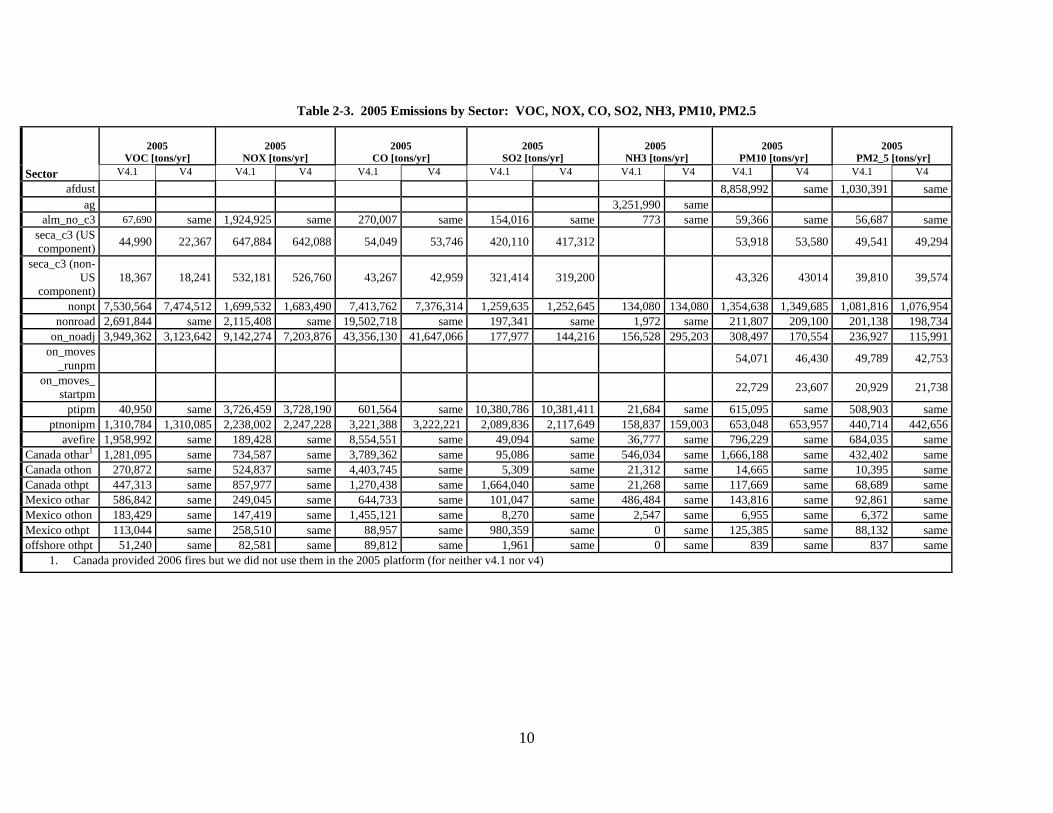
Annual emission summaries for 2005v4.1, with comparisons to 2005v4 CAPs emissions by
emissions modeling sector are provided in Table 2-3. VOC totals are before BAFM speciation
(i.e., they are inventory VOC emissions, and not the sum of VOC emissions after BAFM
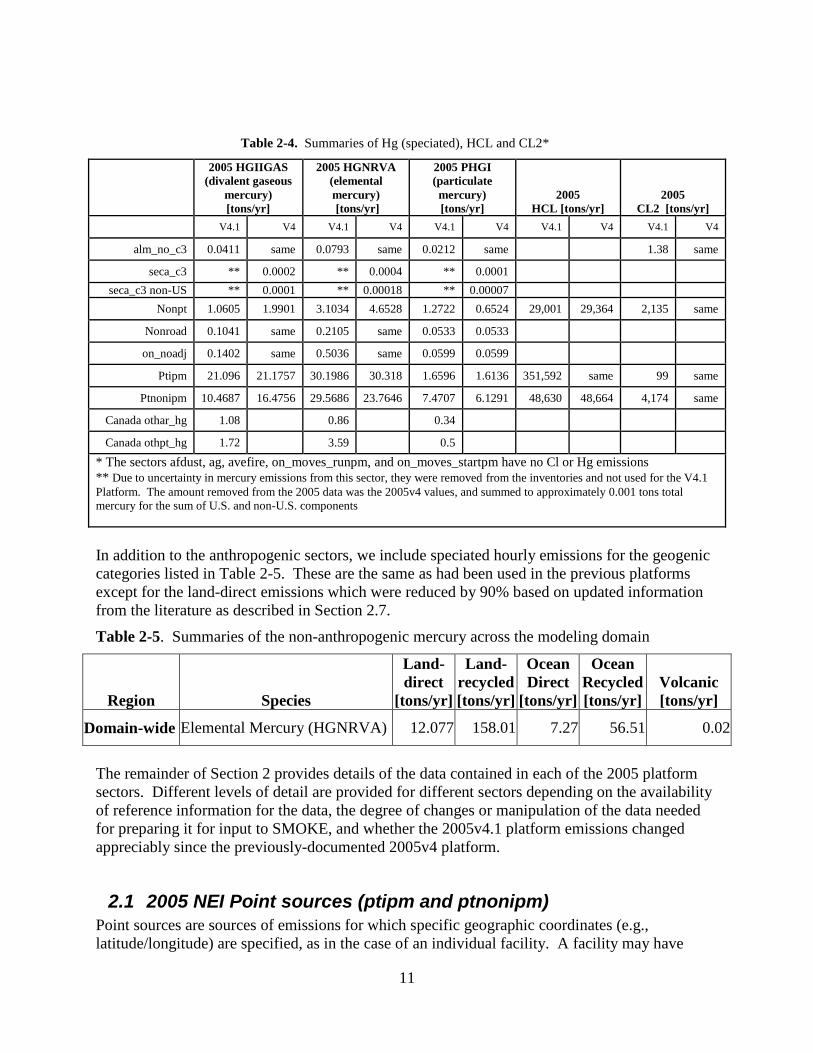
speciation). Summaries of Hg (speciated), HCL and CL2 are provided in Table 2-4, and Table
2-5 provides a summary of natural mercury sources for the modeling domain.
The emission inventories for input to SMOKE for the 2005 base case are available at the 2005v4
website (see the end of Section 1) under the link ―Data Files‖ (see the ―2005emis‖ directory).
The inventories ―readme‖ file indicates the particular zipped files associated with each platform
sector
10
Table 2-3. 2005 Emissions by Sector: VOC, NOX, CO, SO2, NH3, PM10, PM2.5
Sector
2005
VOC [tons/yr]
2005
NOX [tons/yr]
2005
CO [tons/yr]
2005
SO2 [tons/yr]
2005
NH3 [tons/yr]
2005
PM10 [tons/yr]
2005
PM2_5 [tons/yr]
V4.1 V4 V4.1 V4 V4.1 V4 V4.1 V4 V4.1 V4 V4.1 V4 V4.1 V4
afdust 8,858,992 same 1,030,391 same
ag 3,251,990 same
alm_no_c3 67,690 same 1,924,925 same 270,007 same 154,016 same 773 same 59,366 same 56,687 same
seca_c3 (US
component) 44,990 22,367 647,884 642,088 54,049 53,746 420,110 417,312 53,918 53,580 49,541 49,294
seca_c3 (non-
US
component)
18,367 18,241 532,181 526,760 43,267 42,959 321,414 319,200 43,326 43014 39,810 39,574
nonpt 7,530,564 7,474,512 1,699,532 1,683,490 7,413,762 7,376,314 1,259,635 1,252,645 134,080 134,080 1,354,638 1,349,685 1,081,816 1,076,954
nonroad 2,691,844 same 2,115,408 same 19,502,718 same 197,341 same 1,972 same 211,807 209,100 201,138 198,734
on_noadj 3,949,362 3,123,642 9,142,274 7,203,876 43,356,130 41,647,066 177,977 144,216 156,528 295,203 308,497 170,554 236,927 115,991
on_moves
_runpm 54,071 46,430 49,789 42,753
on_moves_
startpm 22,729 23,607 20,929 21,738
ptipm 40,950 same 3,726,459 3,728,190 601,564 same 10,380,786 10,381,411 21,684 same 615,095 same 508,903 same
ptnonipm 1,310,784 1,310,085 2,238,002 2,247,228 3,221,388 3,222,221 2,089,836 2,117,649 158,837 159,003 653,048 653,957 440,714 442,656
avefire 1,958,992 same 189,428 same 8,554,551 same 49,094 same 36,777 same 796,229 same 684,035 same
Canada othar1 1,281,095 same 734,587 same 3,789,362 same 95,086 same 546,034 same 1,666,188 same 432,402 same Canada othon 270,872 same 524,837 same 4,403,745 same 5,309 same 21,312 same 14,665 same 10,395 same Canada othpt 447,313 same 857,977 same 1,270,438 same 1,664,040 same 21,268 same 117,669 same 68,689 same Mexico othar 586,842 same 249,045 same 644,733 same 101,047 same 486,484 same 143,816 same 92,861 same Mexico othon 183,429 same 147,419 same 1,455,121 same 8,270 same 2,547 same 6,955 same 6,372 same Mexico othpt 113,044 same 258,510 same 88,957 same 980,359 same 0 same 125,385 same 88,132 same offshore othpt 51,240 same 82,581 same 89,812 same 1,961 same 0 same 839 same 837 same
1. Canada provided 2006 fires but we did not use them in the 2005 platform (for neither v4.1 nor v4)
11
Table 2-4. Summaries of Hg (speciated), HCL and CL2*
2005 HGIIGAS
(divalent gaseous
mercury)
[tons/yr]
2005 HGNRVA
(elemental
mercury)
[tons/yr]
2005 PHGI
(particulate
mercury)
[tons/yr]
2005
HCL [tons/yr]
2005
CL2 [tons/yr]
V4.1 V4 V4.1 V4 V4.1 V4 V4.1 V4 V4.1 V4
alm_no_c3 0.0411 same 0.0793 same 0.0212 same 1.38 same
seca_c3 ** 0.0002 ** 0.0004 ** 0.0001
seca_c3 non-US ** 0.0001 ** 0.00018 ** 0.00007
Nonpt 1.0605 1.9901 3.1034 4.6528 1.2722 0.6524 29,001 29,364 2,135 same
Nonroad 0.1041 same 0.2105 same 0.0533 0.0533
on_noadj 0.1402 same 0.5036 same 0.0599 0.0599
Ptipm 21.096 21.1757 30.1986 30.318 1.6596 1.6136 351,592 same 99 same
Ptnonipm 10.4687 16.4756 29.5686 23.7646 7.4707 6.1291 48,630 48,664 4,174 same
Canada othar_hg 1.08
0.86
0.34
Canada othpt_hg 1.72
3.59
0.5
* The sectors afdust, ag, avefire, on_moves_runpm, and on_moves_startpm have no Cl or Hg emissions
** Due to uncertainty in mercury emissions from this sector, they were removed from the inventories and not used for the V4.1
Platform. The amount removed from the 2005 data was the 2005v4 values, and summed to approximately 0.001 tons total
mercury for the sum of U.S. and non-U.S. components
In addition to the anthropogenic sectors, we include speciated hourly emissions for the geogenic
categories listed in Table 2-5. These are the same as had been used in the previous platforms
except for the land-direct emissions which were reduced by 90% based on updated information
from the literature as described in Section 2.7.
Table 2-5. Summaries of the non-anthropogenic mercury across the modeling domain
Region Species
Land-
direct
[tons/yr]
Land-
recycled
[tons/yr]
Ocean
Direct
[tons/yr]
Ocean
Recycled
[tons/yr]
Volcanic
[tons/yr]
Domain-wide Elemental Mercury (HGNRVA) 12.077 158.01 7.27 56.51 0.02
The remainder of Section 2 provides details of the data contained in each of the 2005 platform
sectors. Different levels of detail are provided for different sectors depending on the availability
of reference information for the data, the degree of changes or manipulation of the data needed
for preparing it for input to SMOKE, and whether the 2005v4.1 platform emissions changed
appreciably since the previously-documented 2005v4 platform.
2.1 2005 NEI Point sources (ptipm and ptnonipm)
Point sources are sources of emissions for which specific geographic coordinates (e.g.,
latitude/longitude) are specified, as in the case of an individual facility. A facility may have
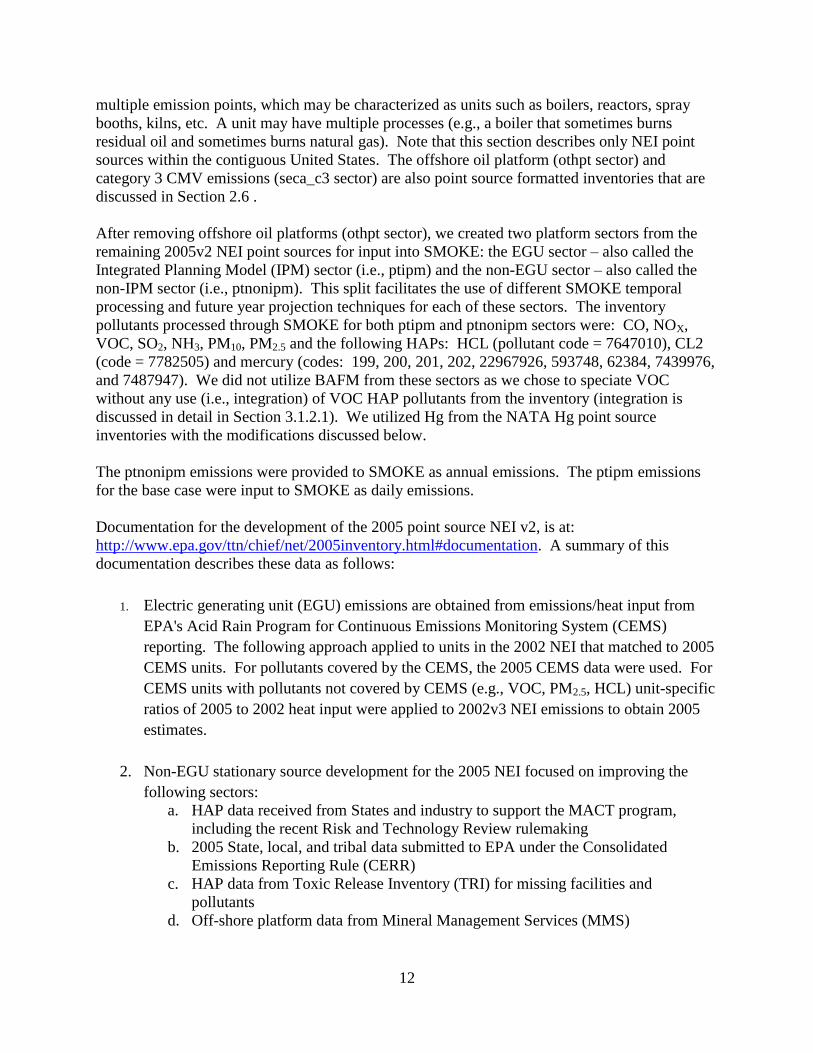
12
multiple emission points, which may be characterized as units such as boilers, reactors, spray
booths, kilns, etc. A unit may have multiple processes (e.g., a boiler that sometimes burns
residual oil and sometimes burns natural gas). Note that this section describes only NEI point
sources within the contiguous United States. The offshore oil platform (othpt sector) and
category 3 CMV emissions (seca_c3 sector) are also point source formatted inventories that are
discussed in Section 2.6 .
After removing offshore oil platforms (othpt sector), we created two platform sectors from the
remaining 2005v2 NEI point sources for input into SMOKE: the EGU sector – also called the
Integrated Planning Model (IPM) sector (i.e., ptipm) and the non-EGU sector – also called the
non-IPM sector (i.e., ptnonipm). This split facilitates the use of different SMOKE temporal
processing and future year projection techniques for each of these sectors. The inventory
pollutants processed through SMOKE for both ptipm and ptnonipm sectors were: CO, NOX,
VOC, SO2, NH3, PM10, PM2.5 and the following HAPs: HCL (pollutant code = 7647010), CL2
(code = 7782505) and mercury (codes: 199, 200, 201, 202, 22967926, 593748, 62384, 7439976,
and 7487947). We did not utilize BAFM from these sectors as we chose to speciate VOC
without any use (i.e., integration) of VOC HAP pollutants from the inventory (integration is
discussed in detail in Section 3.1.2.1). We utilized Hg from the NATA Hg point source
inventories with the modifications discussed below.
The ptnonipm emissions were provided to SMOKE as annual emissions. The ptipm emissions
for the base case were input to SMOKE as daily emissions.
Documentation for the development of the 2005 point source NEI v2, is at:
http://www.epa.gov/ttn/chief/net/2005inventory.html#documentation. A summary of this
documentation describes these data as follows:
1. Electric generating unit (EGU) emissions are obtained from emissions/heat input from
EPA's Acid Rain Program for Continuous Emissions Monitoring System (CEMS)
reporting. The following approach applied to units in the 2002 NEI that matched to 2005
CEMS units. For pollutants covered by the CEMS, the 2005 CEMS data were used. For
CEMS units with pollutants not covered by CEMS (e.g., VOC, PM2.5, HCL) unit-specific
ratios of 2005 to 2002 heat input were applied to 2002v3 NEI emissions to obtain 2005
estimates.
2. Non-EGU stationary source development for the 2005 NEI focused on improving the
following sectors:
a. HAP data received from States and industry to support the MACT program,
including the recent Risk and Technology Review rulemaking
b. 2005 State, local, and tribal data submitted to EPA under the Consolidated
Emissions Reporting Rule (CERR)
c. HAP data from Toxic Release Inventory (TRI) for missing facilities and
pollutants
d. Off-shore platform data from Mineral Management Services (MMS)
13
The changes made to the 2005v2 NEI non-EGU point inventory prior to modeling are as follows:
The tribal data, which do not use state/county Federal Information Processing Standards
(FIPS) codes in the NEI, but rather use the tribal code, were assigned a state/county FIPS
code of 88XXX, where XXX is the 3-digit tribal code in the NEI. We made this change
because SMOKE requires the 5-digit state/county FIPS code.
We defaulted stack parameters for some point sources when modeling in SMOKE.
SMOKE uses an ancillary file, called the PSTK file, which provides default stack
parameters by SCC code to either gap fill stack parameters if they are missing in the NEI
or to correct stack parameters if they are outside the ranges specified in SMOKE as
acceptable values. The SMOKE PSTK file is contained in the ancillary file directory of
the 2005v4 website (see the end of Section 1).
We applied a transport fraction to all SCCs that we identified as PM fugitive dust, to
prevent the overestimation of fugitive dust impacts in the grid modeling as described in
Section 2.2.1.
We also made a changes to the 2005 NATA Hg inventory (June 18, 2010 version) prior to its use
in modeling. We removed sources that were discovered to have closed prior to 2005. We
modified gold mine emissions based on information collected as part of the data gathering for the
proposed gold mine rule. We replaced Hg emissions with values in the Boiler MACT ICR
database. Of the 1607 facilities in the Boiler MACT ICR database, all except for 184 facilities
(0.177 tons Hg) were matched to inventory (NATA inventory, NEI v2 inventory or both)
facilities based on the NEI_UNIQUE_ID code. The 184 facilities without NEI_UNIQUE_IDs
were not used in our 2005 Hg inventory for the platform. Since the ICR database contained only
emissions by unit and the fuel type, we needed to assign the geographic coordinates and stack
parameters needed to transform the Boiler MACT ICR database into a modeling file. We used
geographic coordinates and stack parameters from the NATA Hg inventory (or NEI v2 if not in
the NATA inventory) by matching the facility and then choosing the parameters from the
process/unit that matched the fuel type in the ICR. If more than one unit matched, we used the
stack parameters from the unit with the highest emissions. Where there were no fuel matches,
we used default parameters. Additional information on these changes is provided in Table 2-6
below. Further details of this procedure, and the other fields we populated to construct the
modeling file are provided in Appendix B.
Because the NATA Hg point source emissions were not separated into ptnonipm and ptipm, we
applied the same point splits (via the field IPM_YN) to the NATA Hg inventory as were applied
to the 2005v2 NEI.
14
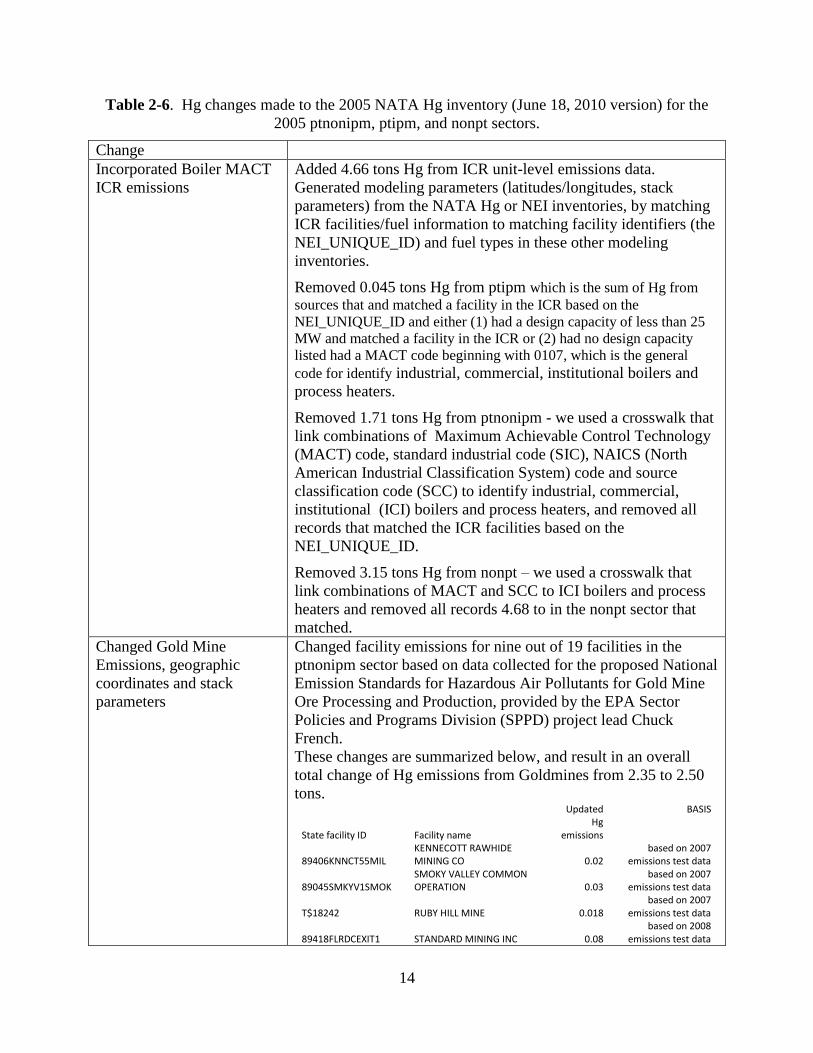
Table 2-6. Hg changes made to the 2005 NATA Hg inventory (June 18, 2010 version) for the
2005 ptnonipm, ptipm, and nonpt sectors.
Change
Incorporated Boiler MACT
ICR emissions
Added 4.66 tons Hg from ICR unit-level emissions data.
Generated modeling parameters (latitudes/longitudes, stack
parameters) from the NATA Hg or NEI inventories, by matching
ICR facilities/fuel information to matching facility identifiers (the
NEI_UNIQUE_ID) and fuel types in these other modeling
inventories.
Removed 0.045 tons Hg from ptipm which is the sum of Hg from
sources that and matched a facility in the ICR based on the
NEI_UNIQUE_ID and either (1) had a design capacity of less than 25
MW and matched a facility in the ICR or (2) had no design capacity
listed had a MACT code beginning with 0107, which is the general
code for identify industrial, commercial, institutional boilers and
process heaters.
Removed 1.71 tons Hg from ptnonipm - we used a crosswalk that
link combinations of Maximum Achievable Control Technology
(MACT) code, standard industrial code (SIC), NAICS (North
American Industrial Classification System) code and source
classification code (SCC) to identify industrial, commercial,
institutional (ICI) boilers and process heaters, and removed all
records that matched the ICR facilities based on the
NEI_UNIQUE_ID.
Removed 3.15 tons Hg from nonpt – we used a crosswalk that
link combinations of MACT and SCC to ICI boilers and process
heaters and removed all records 4.68 to in the nonpt sector that
matched.
Changed Gold Mine
Emissions, geographic
coordinates and stack
parameters
Changed facility emissions for nine out of 19 facilities in the
ptnonipm sector based on data collected for the proposed National
Emission Standards for Hazardous Air Pollutants for Gold Mine
Ore Processing and Production, provided by the EPA Sector
Policies and Programs Division (SPPD) project lead Chuck
French.
These changes are summarized below, and result in an overall
total change of Hg emissions from Goldmines from 2.35 to 2.50
tons.
State facility ID Facility name
Updated Hg
emissions
BASIS
89406KNNCT55MIL KENNECOTT RAWHIDE MINING CO 0.02
based on 2007 emissions test data
89045SMKYV1SMOK SMOKY VALLEY COMMON OPERATION 0.03
based on 2007 emissions test data
T$18242 RUBY HILL MINE 0.018 based on 2007
emissions test data
89418FLRDCEXIT1 STANDARD MINING INC 0.08 based on 2008
emissions test data
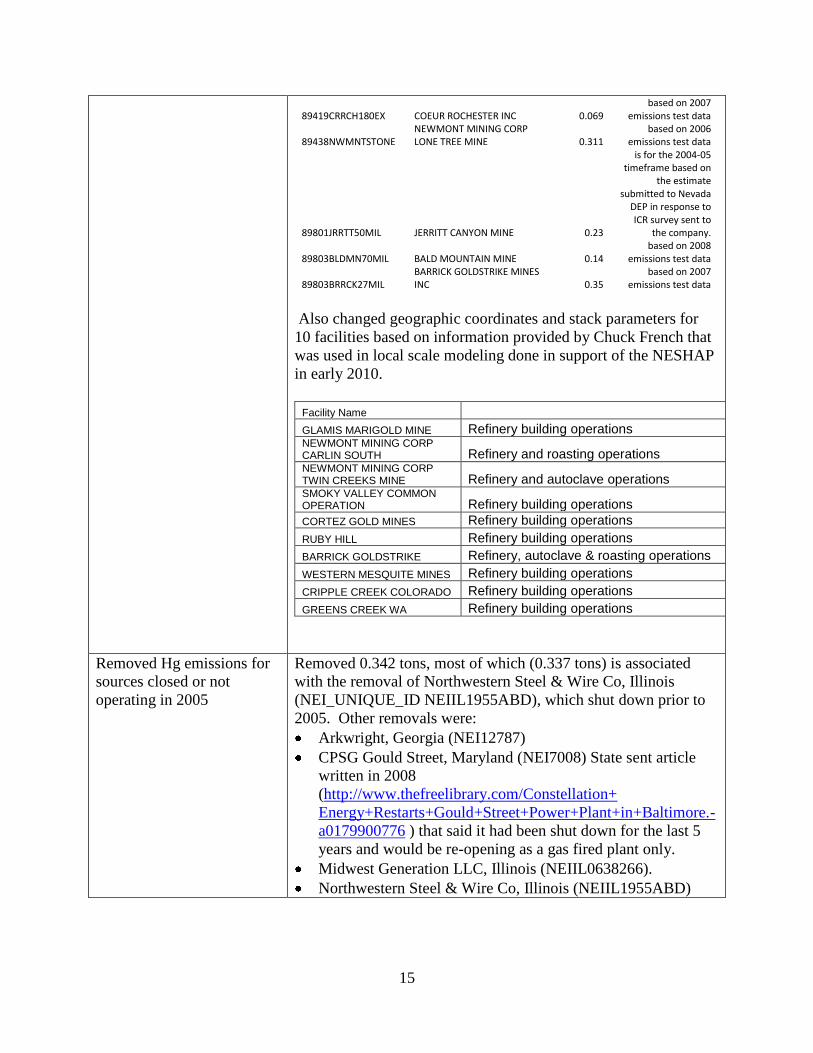
15
89419CRRCH180EX COEUR ROCHESTER INC 0.069 based on 2007
emissions test data
89438NWMNTSTONE NEWMONT MINING CORP LONE TREE MINE 0.311
based on 2006 emissions test data
89801JRRTT50MIL JERRITT CANYON MINE 0.23
is for the 2004-05 timeframe based on
the estimate submitted to Nevada
DEP in response to ICR survey sent to
the company.
89803BLDMN70MIL BALD MOUNTAIN MINE 0.14 based on 2008
emissions test data
89803BRRCK27MIL BARRICK GOLDSTRIKE MINES INC 0.35
based on 2007 emissions test data
Also changed geographic coordinates and stack parameters for
10 facilities based on information provided by Chuck French that
was used in local scale modeling done in support of the NESHAP
in early 2010.
Facility Name
GLAMIS MARIGOLD MINE Refinery building operations NEWMONT MINING CORP CARLIN SOUTH Refinery and roasting operations NEWMONT MINING CORP TWIN CREEKS MINE Refinery and autoclave operations SMOKY VALLEY COMMON OPERATION Refinery building operations
CORTEZ GOLD MINES Refinery building operations
RUBY HILL Refinery building operations
BARRICK GOLDSTRIKE Refinery, autoclave & roasting operations
WESTERN MESQUITE MINES Refinery building operations
CRIPPLE CREEK COLORADO Refinery building operations
GREENS CREEK WA Refinery building operations
Removed Hg emissions for
sources closed or not
operating in 2005
Removed 0.342 tons, most of which (0.337 tons) is associated
with the removal of Northwestern Steel & Wire Co, Illinois
(NEI_UNIQUE_ID NEIIL1955ABD), which shut down prior to
2005. Other removals were:
Arkwright, Georgia (NEI12787)
CPSG Gould Street, Maryland (NEI7008) State sent article
written in 2008
(http://www.thefreelibrary.com/Constellation+
Energy+Restarts+Gould+Street+Power+Plant+in+Baltimore.-
a0179900776 ) that said it had been shut down for the last 5
years and would be re-opening as a gas fired plant only.
Midwest Generation LLC, Illinois (NEIIL0638266).
Northwestern Steel & Wire Co, Illinois (NEIIL1955ABD)
16
2.1.1 IPM sector (ptipm)
The ptipm sector contains emissions from EGUs in the 2005v2 NEI point inventory that we were
able match to the units found in the NEEDS database. While we originally used version 3.02 of
NEEDS to split out the ptipm sector for v4 of the platform, there were no changes to the
mapping when we moved to NEEDs version 4.10
(http://www.epa.gov/airmarkets/progsregs/epa-ipm/index.html). The IPM model provides
future-year emission inventories for the universe of EGUs contained in the NEEDS database. As
described below, this matching was done to (1) provide consistency between the 2005 EGU
sources and future year EGU emissions for sources which are forecasted by IPM and (2) avoid
double counting in projecting point source emissions.
The 2005v4 platform document provides additional details on how the 2005 NEI point source
inventory was split into the ptipm and ptnonipm sectors.
Although we used the same ptipm split as was used for the v4 platform, we changed some
emissions values based on updates we made to some ORIS identifiers in the ptipm file. For a
subset of the units for which we added or changed ORIS identifiers, we recomputed annual
emissions for SO2, NOX or both using the CEMS data available at the EPA‘s data and maps
website.2 The impact of these changes is summarized in Table 2-2 and detailed changes are
provided in Appendix A.
Creation of temporally resolved emissions for the ptipm sector
Another reason we separated the ptipm sources from the other sources was due to the difference
in the temporal resolution of the data input to SMOKE. For the base case 2005 run, the ptipm
sector uses daily emissions input into SMOKE. The daily emissions are computed from the
annual emissions. First, we allocate annual emissions to each month (this process occurs outside
of SMOKE). To do this, we created state-specific, three-year averages of 2004-2006 CEM data.
These average annual-to-month factors were assigned to sources by state. To allocate the
monthly emissions to each day, we used the 2005 CEM data to compute state-specific month-to-
day factors, averaged across all units in each state. The resulting daily emissions were input into
SMOKE. The daily-to-hourly allocation was performed with SMOKE using diurnal profiles.
The development of these diurnal ptipm-specific profiles, which are considered ancillary data for
SMOKE, is described in Section 3.2.3.
2.1.2 Non-IPM sector (ptnonipm)
The non-IPM (ptnonipm) sector contains all 2005v2 NEI point sources that we did not include in
the IPM (ptipm) sector.3 The ptnonipm sector contains fugitive dust PM emissions from
vehicular traffic on paved or unpaved roads at industrial facilities or coal handling at coal mines.4
Prior to input to SMOKE, we reduced the fugitive dust PM emissions to estimate the emissions
2 http://camddataandmaps.epa.gov/gdm/index.cfm?fuseaction=emissions.wizard
3 Except for the offshore oil and day-specific point source fire emissions data which are included in separate sectors,
as discussed in sections 2.6 and 2.3.1, respectively. 4Point source fugitive dust emissions, which represent a very small amount of PM, were treated the same way in the
2002 platform but were treated as a separate sector in the 2001 Platform.
17
that remain aloft by applying county-specific fugitive dust transportable fraction factors. This is
discussed further in Section 2.2.1.
For some geographic areas, some of the sources in the ptnonipm sector belong to source
categories that are contained in other sectors. This occurs in the inventory when states, tribes or
local programs report certain inventory emissions as point sources because they have specific
geographic coordinates for these sources. They may use point source SCCs (8-digit) or non-
point, onroad or nonroad (10-digit) SCCs. In the 2005 NEI, examples of these types of sources
include: aircraft emissions in all states, waste disposal emissions in several states, firefighting
training in New Mexico, several industrial processes and solvent utilization sources in North
Carolina and Tennessee, livestock (i.e., animal husbandry) in primarily Kansas and Minnesota,
and petroleum product working losses.
The modifications between the published 2005v2 NEI and the 2005 inventory we used for
modeling are summarized here:
Ptnonipm changes from the original 2005v2 inventory for the v4 platform development
Removed duplicate annual records. We did not delete some apparent duplicates because
they were in fact covering different parts of the year (i.e., the emissions in the inventory
file were sub-annual).
Removed a source with a state/county FIPS code of 30777; the ―777‖ county FIPS
represents portable facilities that move across counties, but is not currently a valid
state/county FIPS code in the SMOKE ancillary file ―COSTCY‖. This Montana FIPS
code was located in northern Wyoming and contained very small emissions.
Dropped sources with coordinates located well into the oceans or lakes.
Fixed the coordinates for several larger sources that had a state/county FIPS code
mismatch with their inventory coordinates greater than 10 km and emissions greater than
10 tons per year of either NOX, VOC, SO2, or 5 tons/yr of PM2.5. These corrections
were limited to a small number of plants in Arizona, Indiana, Kentucky, Ohio, and
Virginia.
Ptnonipm updates from 2005v4 platform used in creating the 2005v4.1 platform
Found and removed additional duplicate records. These records were duplicates caused by
records from both 2002 and 2005 being in the inventory. These were caught after ignoring
leading zeroes in the plant IDs, point IDs, etc. that were present for only one of the years of data.
There were a total of 175 records removed. A summary of the emissions removed is provided
below. Due to the small mass of duplicate HAP records and the fact that most were not being
used in the platform, no HAP records were removed.
CO 3,520 tons
NH3 166 tons
NOX 13,421 tons
PM10 3,858 tons
PM2.5 3,444 tons
SO2 21,061 tons
VOC 1,504 tons
18
Removed duplicate emissions for Blue Ridge Paper (FIPS=37087). For the same unitid,
stackid and SCC there were two records for the same pollutant with different data source
codes but similar emissions values. They appeared to be duplicates so they were removed.
Updated boiler emissions at Domtar Paper/Johnsonburg Mill (FIPS code =42047), which
included 2002 emissions values to 2005 emissions values based on information provided
by the Department of Environmental Protection in Pennsylvania. They had put on
scrubbers between 2002 and 2005 and that was not reflected in the platform 2002-based
emissions. Rather than apply the reductions, we updated the emissions to better reflect
2005. Note: We only changed NOX , SO2 and HCL even though the facility representative
send information for all pollutants plant because of the effort involved with converting the
information provided into a form usable for modeling.
Removed unit-level emissions from plants for units determined to have shut down
between 2002 and 2005. In all situations, the state inventory representative was contacted
to confirm that the unit actually shut down. Plants impacted were: LaFarge Cement Plant
in Atlanta Georgia, Domtar Paper, Tennessee, FIPS=47163 and P. H. Glatfelter Company
in Chillicothe, Ohio.
Added North Dakota ADM facility (FIPS code = 38067) that was in the 2005v1 NEI but
was missing from the 2005v2 NEI and was not determined to have shut down. Added the
2002-based emissions to the ptnonipm file, since 2005 data were not available.
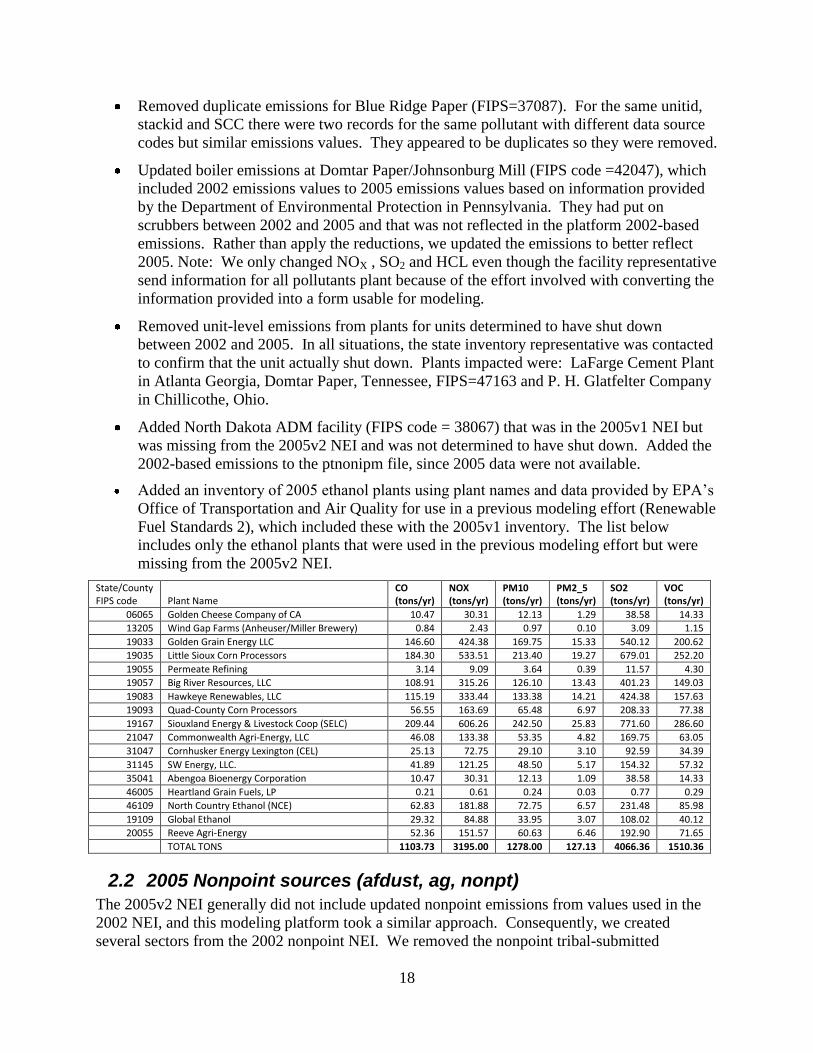
Added an inventory of 2005 ethanol plants using plant names and data provided by EPA‘s
Office of Transportation and Air Quality for use in a previous modeling effort (Renewable
Fuel Standards 2), which included these with the 2005v1 inventory. The list below
includes only the ethanol plants that were used in the previous modeling effort but were
missing from the 2005v2 NEI.
State/County FIPS code Plant Name
CO (tons/yr)
NOX (tons/yr)
PM10 (tons/yr)
PM2_5 (tons/yr)
SO2 (tons/yr)
VOC (tons/yr)
06065 Golden Cheese Company of CA 10.47 30.31 12.13 1.29 38.58 14.33
13205 Wind Gap Farms (Anheuser/Miller Brewery) 0.84 2.43 0.97 0.10 3.09 1.15
19033 Golden Grain Energy LLC 146.60 424.38 169.75 15.33 540.12 200.62
19035 Little Sioux Corn Processors 184.30 533.51 213.40 19.27 679.01 252.20
19055 Permeate Refining 3.14 9.09 3.64 0.39 11.57 4.30
19057 Big River Resources, LLC 108.91 315.26 126.10 13.43 401.23 149.03
19083 Hawkeye Renewables, LLC 115.19 333.44 133.38 14.21 424.38 157.63
19093 Quad-County Corn Processors 56.55 163.69 65.48 6.97 208.33 77.38
19167 Siouxland Energy & Livestock Coop (SELC) 209.44 606.26 242.50 25.83 771.60 286.60
21047 Commonwealth Agri-Energy, LLC 46.08 133.38 53.35 4.82 169.75 63.05
31047 Cornhusker Energy Lexington (CEL) 25.13 72.75 29.10 3.10 92.59 34.39
31145 SW Energy, LLC. 41.89 121.25 48.50 5.17 154.32 57.32
35041 Abengoa Bioenergy Corporation 10.47 30.31 12.13 1.09 38.58 14.33
46005 Heartland Grain Fuels, LP 0.21 0.61 0.24 0.03 0.77 0.29
46109 North Country Ethanol (NCE) 62.83 181.88 72.75 6.57 231.48 85.98
19109 Global Ethanol 29.32 84.88 33.95 3.07 108.02 40.12
20055 Reeve Agri-Energy 52.36 151.57 60.63 6.46 192.90 71.65
TOTAL TONS 1103.73 3195.00 1278.00 127.13 4066.36 1510.36
2.2 2005 Nonpoint sources (afdust, ag, nonpt)
The 2005v2 NEI generally did not include updated nonpoint emissions from values used in the
2002 NEI, and this modeling platform took a similar approach. Consequently, we created
several sectors from the 2002 nonpoint NEI. We removed the nonpoint tribal-submitted
19
emissions to prevent possible double counting with the county-level emissions. Because the
tribal nonpoint emissions are small, we do not anticipate these omissions having an impact on the
results at the 36-km and 12-km scales used for modeling. This omission also eliminated the need
for us to develop spatial surrogate data for allocation of tribal data to grid cells during the
SMOKE processing, with little expected impact.
The documentation for the nonpoint sector of the 2005 NEI is available at:
http://www.epa.gov/ttn/chief/net/2005inventory.html
In the rest of this section, we describe in more detail each of the platform sectors into which we
separated the 2005 nonpoint NEI, and the changes we made to these data. We will refer to the
2002 platform documentation for sectors that did not change.
2.2.1 Area Fugitive dust sector (afdust)
The emissions for this sector are unchanged from the 2005v4 platform, and the documentation is
repeated here for convenience. However, we changed the temporal allocation of the emissions to
account for day-of-week variation. In particular, we used updated dust profiles that are
consistent with the activity related to non-dust profiles for similar processes. The processes and
profiles updated are provided in Pouliot, et. al., 2010. Previously, all days within the same
month had the same emissions.
The area-source fugitive dust (afdust) sector contains PM10 and PM2.5 emission estimates for
2002 NEI nonpoint SCCs identified by EPA staff as dust sources. This sector is separated from
other nonpoint sectors to make it easier to apply a ―transport fraction,‖ which reduces emissions
to reflect observed diminished transport from these sources at the scale of our modeling.
Application of the transport fraction prevents the overestimation of fugitive dust impacts in the
grid modeling as compared to ambient samples. Categories included in this sector are paved
roads, unpaved roads and airstrips, construction (residential, industrial, road and total),
agriculture production and all of the mining 10-digit SCCs beginning with the digits ―2325.‖ It
does not include fugitive dust from grain elevators because these are elevated point sources.
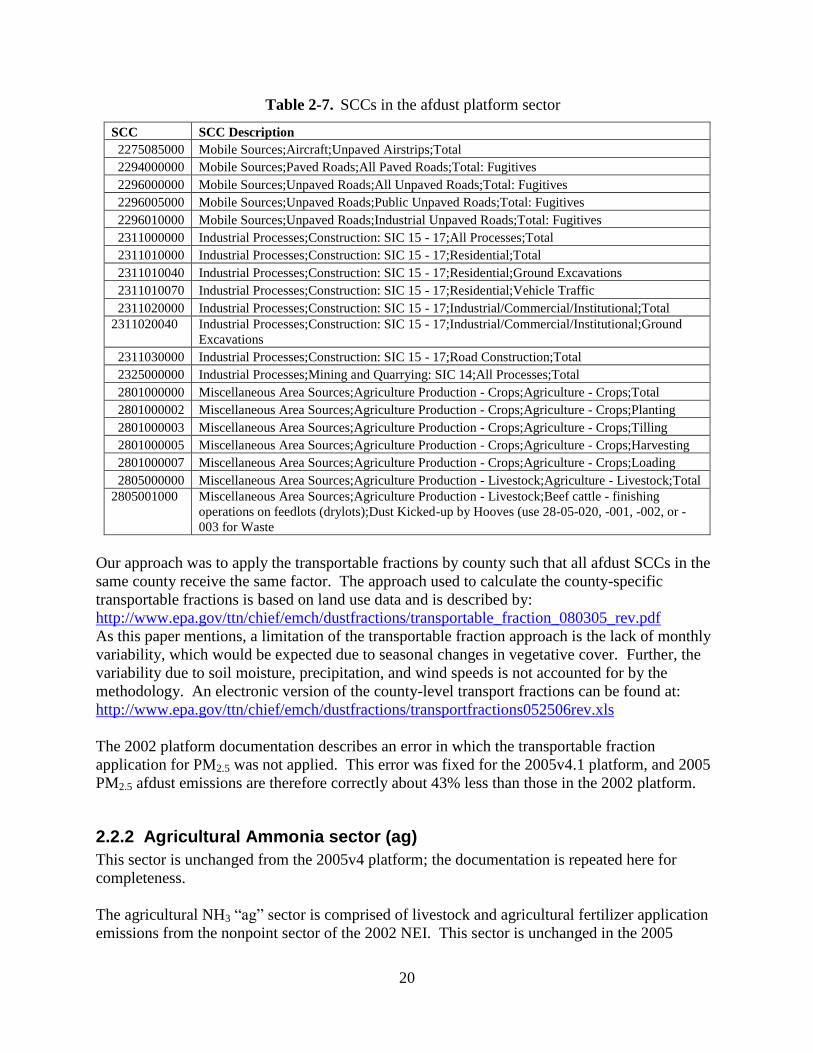
We created the afdust sector from the 2002 NEI based on SCCs and pollutant codes (i.e., PM10
and PM2.5) that are considered ―fugitive‖. A complete list of all possible fugitive dust SCCs
(including both 8-digit point source SCCs and 10-digit nonpoint SCCs) is provided at:
http://www.epa.gov/ttn/chief/emch/dustfractions/tf_scc_list2002nei_v2.xls. However, not all of
the SCCs in this file are present in the 2002 NEI. The SCCs included in the 2002 NEI that
comprise the 2005 (and 2002) platform afdust sector (which are a subset of the SCCs in the web
link) are provided in Table 2-7.
20
Table 2-7. SCCs in the afdust platform sector
SCC SCC Description
2275085000 Mobile Sources;Aircraft;Unpaved Airstrips;Total
2294000000 Mobile Sources;Paved Roads;All Paved Roads;Total: Fugitives
2296000000 Mobile Sources;Unpaved Roads;All Unpaved Roads;Total: Fugitives
2296005000 Mobile Sources;Unpaved Roads;Public Unpaved Roads;Total: Fugitives
2296010000 Mobile Sources;Unpaved Roads;Industrial Unpaved Roads;Total: Fugitives
2311000000 Industrial Processes;Construction: SIC 15 - 17;All Processes;Total
2311010000 Industrial Processes;Construction: SIC 15 - 17;Residential;Total
2311010040 Industrial Processes;Construction: SIC 15 - 17;Residential;Ground Excavations
2311010070 Industrial Processes;Construction: SIC 15 - 17;Residential;Vehicle Traffic
2311020000 Industrial Processes;Construction: SIC 15 - 17;Industrial/Commercial/Institutional;Total
2311020040 Industrial Processes;Construction: SIC 15 - 17;Industrial/Commercial/Institutional;Ground
Excavations
2311030000 Industrial Processes;Construction: SIC 15 - 17;Road Construction;Total
2325000000 Industrial Processes;Mining and Quarrying: SIC 14;All Processes;Total
2801000000 Miscellaneous Area Sources;Agriculture Production - Crops;Agriculture - Crops;Total
2801000002 Miscellaneous Area Sources;Agriculture Production - Crops;Agriculture - Crops;Planting
2801000003 Miscellaneous Area Sources;Agriculture Production - Crops;Agriculture - Crops;Tilling
2801000005 Miscellaneous Area Sources;Agriculture Production - Crops;Agriculture - Crops;Harvesting
2801000007 Miscellaneous Area Sources;Agriculture Production - Crops;Agriculture - Crops;Loading
2805000000 Miscellaneous Area Sources;Agriculture Production - Livestock;Agriculture - Livestock;Total
2805001000 Miscellaneous Area Sources;Agriculture Production - Livestock;Beef cattle - finishing
operations on feedlots (drylots);Dust Kicked-up by Hooves (use 28-05-020, -001, -002, or -
003 for Waste
Our approach was to apply the transportable fractions by county such that all afdust SCCs in the
same county receive the same factor. The approach used to calculate the county-specific
transportable fractions is based on land use data and is described by:
http://www.epa.gov/ttn/chief/emch/dustfractions/transportable_fraction_080305_rev.pdf
As this paper mentions, a limitation of the transportable fraction approach is the lack of monthly
variability, which would be expected due to seasonal changes in vegetative cover. Further, the
variability due to soil moisture, precipitation, and wind speeds is not accounted for by the
methodology. An electronic version of the county-level transport fractions can be found at:
http://www.epa.gov/ttn/chief/emch/dustfractions/transportfractions052506rev.xls
The 2002 platform documentation describes an error in which the transportable fraction
application for PM2.5 was not applied. This error was fixed for the 2005v4.1 platform, and 2005
PM2.5 afdust emissions are therefore correctly about 43% less than those in the 2002 platform.
2.2.2 Agricultural Ammonia sector (ag)
This sector is unchanged from the 2005v4 platform; the documentation is repeated here for
completeness.
The agricultural NH3 ―ag‖ sector is comprised of livestock and agricultural fertilizer application
emissions from the nonpoint sector of the 2002 NEI. This sector is unchanged in the 2005
21
platform. The rest of this section documentation is therefore very similar to that in the 2002
documentation.
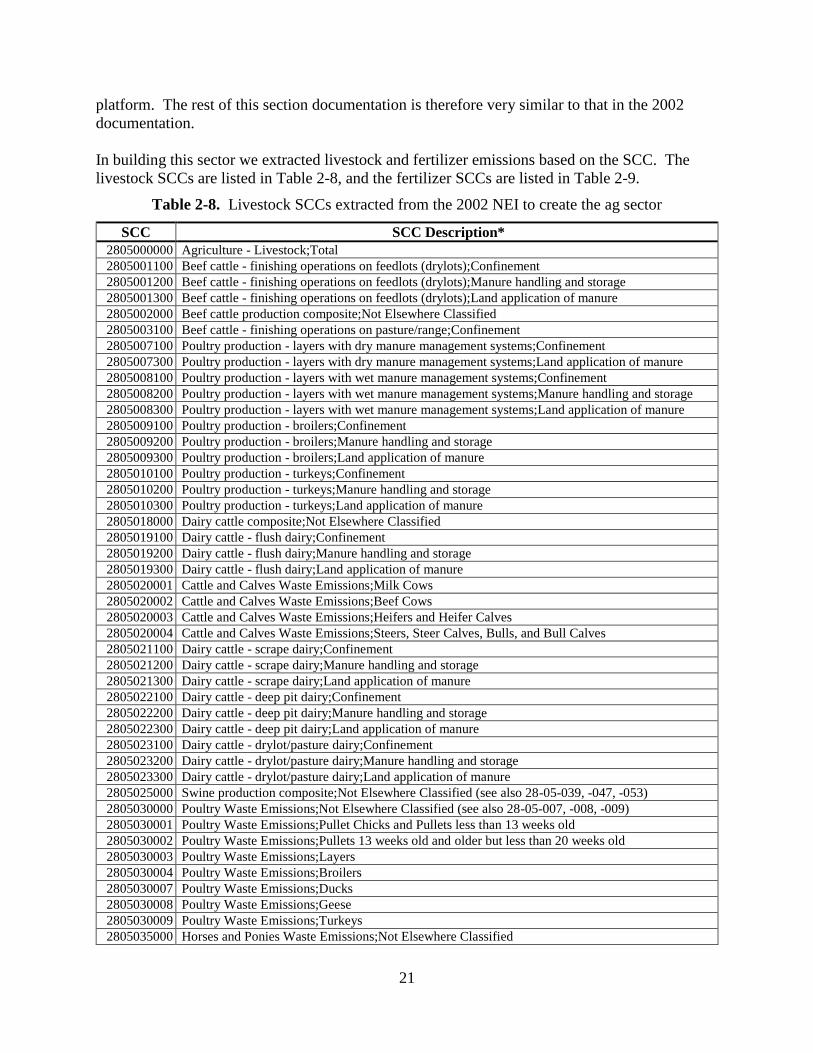
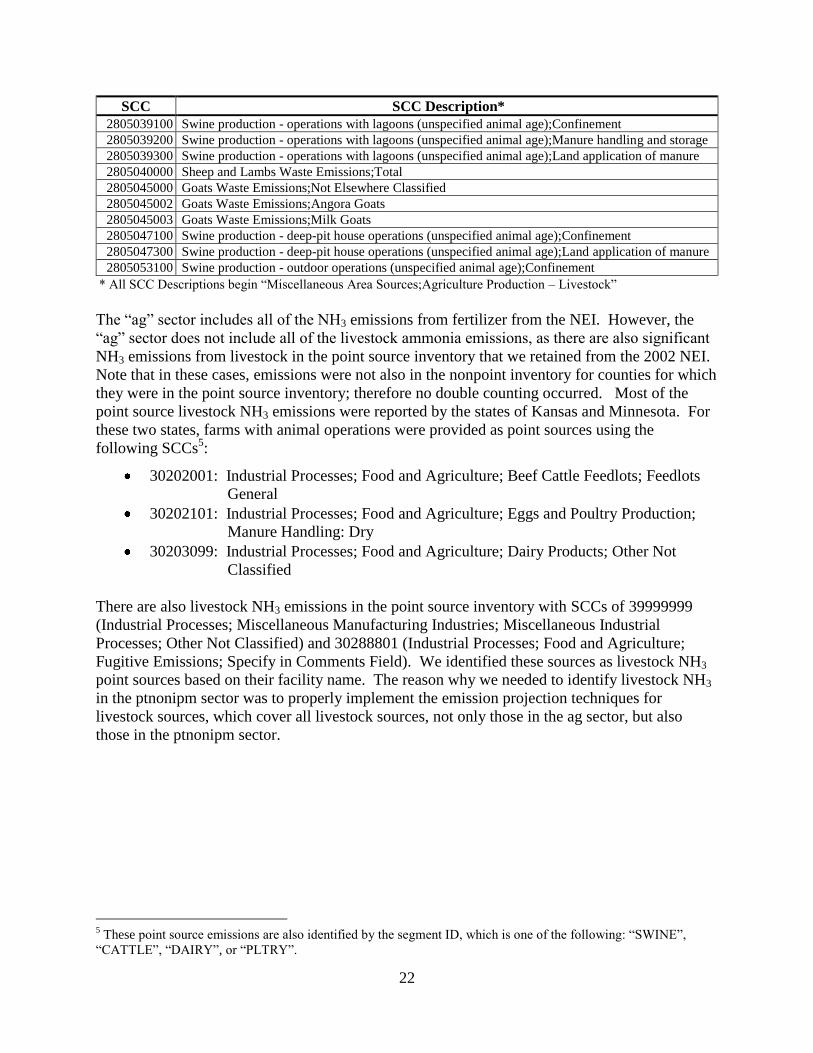
In building this sector we extracted livestock and fertilizer emissions based on the SCC. The
livestock SCCs are listed in Table 2-8, and the fertilizer SCCs are listed in Table 2-9.
Table 2-8. Livestock SCCs extracted from the 2002 NEI to create the ag sector
SCC SCC Description*
2805000000 Agriculture - Livestock;Total
2805001100 Beef cattle - finishing operations on feedlots (drylots);Confinement
2805001200 Beef cattle - finishing operations on feedlots (drylots);Manure handling and storage
2805001300 Beef cattle - finishing operations on feedlots (drylots);Land application of manure
2805002000 Beef cattle production composite;Not Elsewhere Classified
2805003100 Beef cattle - finishing operations on pasture/range;Confinement
2805007100 Poultry production - layers with dry manure management systems;Confinement
2805007300 Poultry production - layers with dry manure management systems;Land application of manure
2805008100 Poultry production - layers with wet manure management systems;Confinement
2805008200 Poultry production - layers with wet manure management systems;Manure handling and storage
2805008300 Poultry production - layers with wet manure management systems;Land application of manure
2805009100 Poultry production - broilers;Confinement
2805009200 Poultry production - broilers;Manure handling and storage
2805009300 Poultry production - broilers;Land application of manure
2805010100 Poultry production - turkeys;Confinement
2805010200 Poultry production - turkeys;Manure handling and storage
2805010300 Poultry production - turkeys;Land application of manure
2805018000 Dairy cattle composite;Not Elsewhere Classified
2805019100 Dairy cattle - flush dairy;Confinement
2805019200 Dairy cattle - flush dairy;Manure handling and storage
2805019300 Dairy cattle - flush dairy;Land application of manure
2805020001 Cattle and Calves Waste Emissions;Milk Cows
2805020002 Cattle and Calves Waste Emissions;Beef Cows
2805020003 Cattle and Calves Waste Emissions;Heifers and Heifer Calves
2805020004 Cattle and Calves Waste Emissions;Steers, Steer Calves, Bulls, and Bull Calves
2805021100 Dairy cattle - scrape dairy;Confinement
2805021200 Dairy cattle - scrape dairy;Manure handling and storage
2805021300 Dairy cattle - scrape dairy;Land application of manure
2805022100 Dairy cattle - deep pit dairy;Confinement
2805022200 Dairy cattle - deep pit dairy;Manure handling and storage
2805022300 Dairy cattle - deep pit dairy;Land application of manure
2805023100 Dairy cattle - drylot/pasture dairy;Confinement
2805023200 Dairy cattle - drylot/pasture dairy;Manure handling and storage
2805023300 Dairy cattle - drylot/pasture dairy;Land application of manure
2805025000 Swine production composite;Not Elsewhere Classified (see also 28-05-039, -047, -053)
2805030000 Poultry Waste Emissions;Not Elsewhere Classified (see also 28-05-007, -008, -009)
2805030001 Poultry Waste Emissions;Pullet Chicks and Pullets less than 13 weeks old
2805030002 Poultry Waste Emissions;Pullets 13 weeks old and older but less than 20 weeks old
2805030003 Poultry Waste Emissions;Layers
2805030004 Poultry Waste Emissions;Broilers
2805030007 Poultry Waste Emissions;Ducks
2805030008 Poultry Waste Emissions;Geese
2805030009 Poultry Waste Emissions;Turkeys
2805035000 Horses and Ponies Waste Emissions;Not Elsewhere Classified
22
SCC SCC Description*
2805039100 Swine production - operations with lagoons (unspecified animal age);Confinement
2805039200 Swine production - operations with lagoons (unspecified animal age);Manure handling and storage
2805039300 Swine production - operations with lagoons (unspecified animal age);Land application of manure
2805040000 Sheep and Lambs Waste Emissions;Total
2805045000 Goats Waste Emissions;Not Elsewhere Classified
2805045002 Goats Waste Emissions;Angora Goats
2805045003 Goats Waste Emissions;Milk Goats
2805047100 Swine production - deep-pit house operations (unspecified animal age);Confinement
2805047300 Swine production - deep-pit house operations (unspecified animal age);Land application of manure
2805053100 Swine production - outdoor operations (unspecified animal age);Confinement
* All SCC Descriptions begin ―Miscellaneous Area Sources;Agriculture Production – Livestock‖
The ―ag‖ sector includes all of the NH3 emissions from fertilizer from the NEI. However, the
―ag‖ sector does not include all of the livestock ammonia emissions, as there are also significant
NH3 emissions from livestock in the point source inventory that we retained from the 2002 NEI.
Note that in these cases, emissions were not also in the nonpoint inventory for counties for which
they were in the point source inventory; therefore no double counting occurred. Most of the
point source livestock NH3 emissions were reported by the states of Kansas and Minnesota. For
these two states, farms with animal operations were provided as point sources using the
following SCCs5:
30202001: Industrial Processes; Food and Agriculture; Beef Cattle Feedlots; Feedlots
General
30202101: Industrial Processes; Food and Agriculture; Eggs and Poultry Production;
Manure Handling: Dry
30203099: Industrial Processes; Food and Agriculture; Dairy Products; Other Not
Classified
There are also livestock NH3 emissions in the point source inventory with SCCs of 39999999
(Industrial Processes; Miscellaneous Manufacturing Industries; Miscellaneous Industrial
Processes; Other Not Classified) and 30288801 (Industrial Processes; Food and Agriculture;
Fugitive Emissions; Specify in Comments Field). We identified these sources as livestock NH3
point sources based on their facility name. The reason why we needed to identify livestock NH3
in the ptnonipm sector was to properly implement the emission projection techniques for
livestock sources, which cover all livestock sources, not only those in the ag sector, but also
those in the ptnonipm sector.
5 These point source emissions are also identified by the segment ID, which is one of the following: ―SWINE‖,
―CATTLE‖, ―DAIRY‖, or ―PLTRY‖.
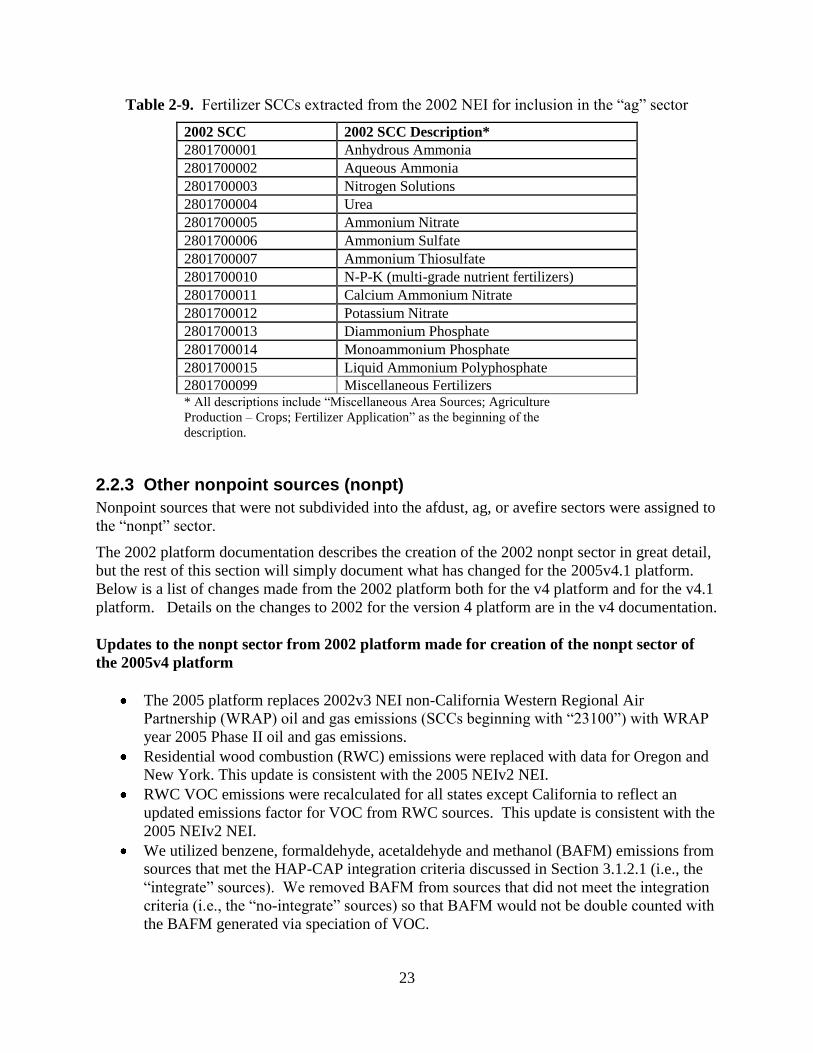
23
Table 2-9. Fertilizer SCCs extracted from the 2002 NEI for inclusion in the ―ag‖ sector
2002 SCC 2002 SCC Description*
2801700001 Anhydrous Ammonia
2801700002 Aqueous Ammonia
2801700003 Nitrogen Solutions
2801700004 Urea
2801700005 Ammonium Nitrate
2801700006 Ammonium Sulfate
2801700007 Ammonium Thiosulfate
2801700010 N-P-K (multi-grade nutrient fertilizers)
2801700011 Calcium Ammonium Nitrate
2801700012 Potassium Nitrate
2801700013 Diammonium Phosphate
2801700014 Monoammonium Phosphate
2801700015 Liquid Ammonium Polyphosphate
2801700099 Miscellaneous Fertilizers * All descriptions include ―Miscellaneous Area Sources; Agriculture
Production – Crops; Fertilizer Application‖ as the beginning of the
description.
2.2.3 Other nonpoint sources (nonpt)
Nonpoint sources that were not subdivided into the afdust, ag, or avefire sectors were assigned to
the ―nonpt‖ sector.
The 2002 platform documentation describes the creation of the 2002 nonpt sector in great detail,
but the rest of this section will simply document what has changed for the 2005v4.1 platform.
Below is a list of changes made from the 2002 platform both for the v4 platform and for the v4.1
platform. Details on the changes to 2002 for the version 4 platform are in the v4 documentation.
Updates to the nonpt sector from 2002 platform made for creation of the nonpt sector of
the 2005v4 platform
The 2005 platform replaces 2002v3 NEI non-California Western Regional Air
Partnership (WRAP) oil and gas emissions (SCCs beginning with ―23100‖) with WRAP
year 2005 Phase II oil and gas emissions.
Residential wood combustion (RWC) emissions were replaced with data for Oregon and
New York. This update is consistent with the 2005 NEIv2 NEI.
RWC VOC emissions were recalculated for all states except California to reflect an
updated emissions factor for VOC from RWC sources. This update is consistent with the
2005 NEIv2 NEI.
We utilized benzene, formaldehyde, acetaldehyde and methanol (BAFM) emissions from
sources that met the HAP-CAP integration criteria discussed in Section 3.1.2.1 (i.e., the
―integrate‖ sources). We removed BAFM from sources that did not meet the integration
criteria (i.e., the ―no-integrate‖ sources) so that BAFM would not be double counted with
the BAFM generated via speciation of VOC.
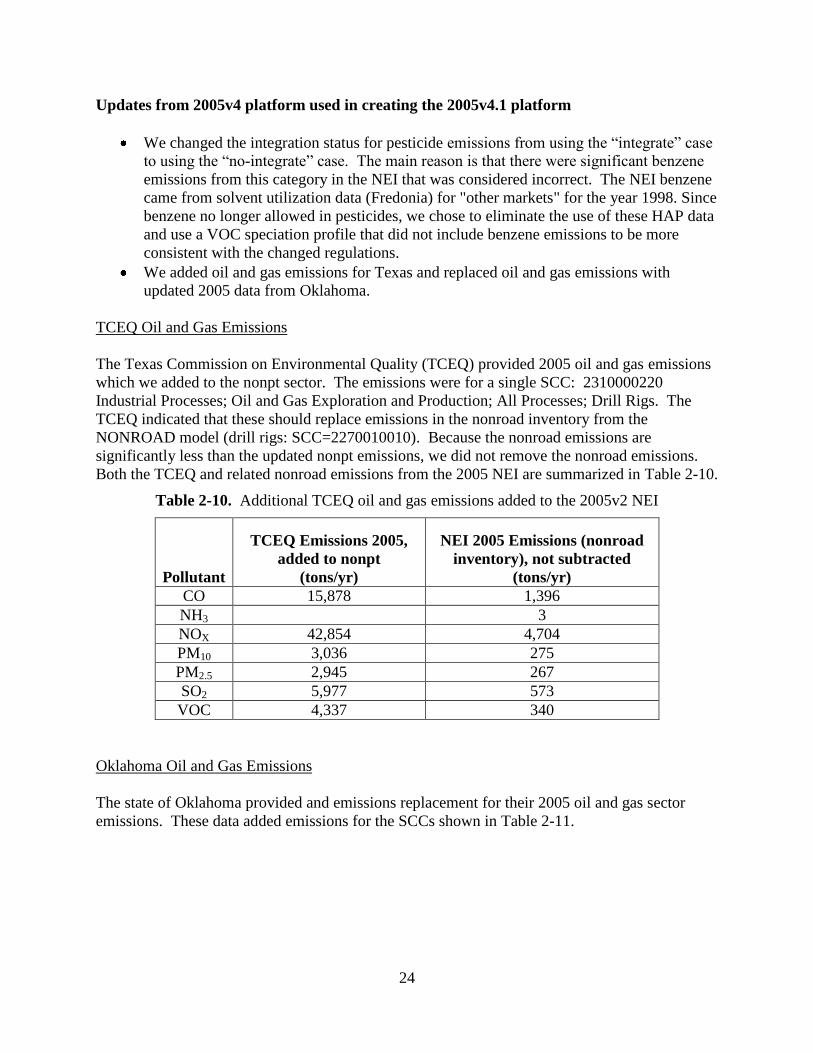
24
Updates from 2005v4 platform used in creating the 2005v4.1 platform
We changed the integration status for pesticide emissions from using the ―integrate‖ case
to using the ―no-integrate‖ case. The main reason is that there were significant benzene
emissions from this category in the NEI that was considered incorrect. The NEI benzene
came from solvent utilization data (Fredonia) for "other markets" for the year 1998. Since
benzene no longer allowed in pesticides, we chose to eliminate the use of these HAP data
and use a VOC speciation profile that did not include benzene emissions to be more
consistent with the changed regulations.
We added oil and gas emissions for Texas and replaced oil and gas emissions with
updated 2005 data from Oklahoma.
TCEQ Oil and Gas Emissions
The Texas Commission on Environmental Quality (TCEQ) provided 2005 oil and gas emissions
which we added to the nonpt sector. The emissions were for a single SCC: 2310000220
Industrial Processes; Oil and Gas Exploration and Production; All Processes; Drill Rigs. The
TCEQ indicated that these should replace emissions in the nonroad inventory from the
NONROAD model (drill rigs: SCC=2270010010). Because the nonroad emissions are
significantly less than the updated nonpt emissions, we did not remove the nonroad emissions.
Both the TCEQ and related nonroad emissions from the 2005 NEI are summarized in Table 2-10.
Table 2-10. Additional TCEQ oil and gas emissions added to the 2005v2 NEI
Pollutant
TCEQ Emissions 2005,
added to nonpt
(tons/yr)
NEI 2005 Emissions (nonroad
inventory), not subtracted
(tons/yr)
CO 15,878 1,396
NH3
3
NOX 42,854 4,704
PM10 3,036 275
PM2.5 2,945 267
SO2 5,977 573
VOC 4,337 340
Oklahoma Oil and Gas Emissions
The state of Oklahoma provided and emissions replacement for their 2005 oil and gas sector
emissions. These data added emissions for the SCCs shown in Table 2-11.
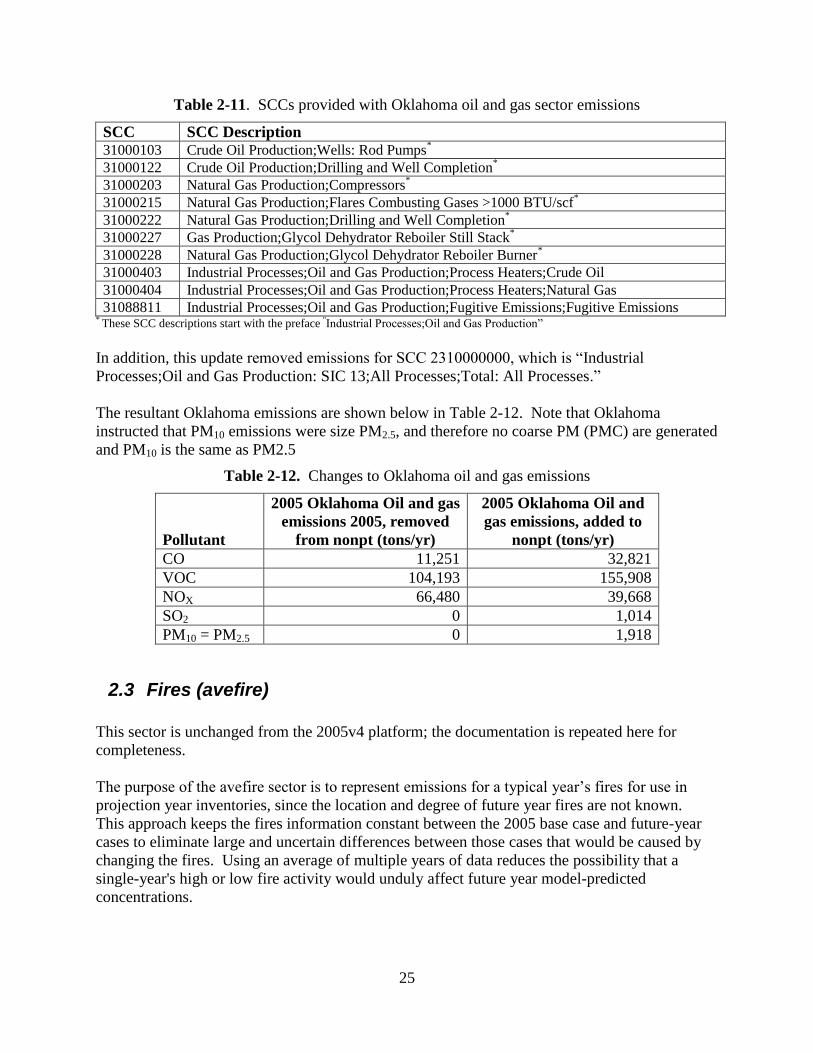
25
Table 2-11. SCCs provided with Oklahoma oil and gas sector emissions
SCC SCC Description 31000103 Crude Oil Production;Wells: Rod Pumps
*
31000122 Crude Oil Production;Drilling and Well Completion*
31000203 Natural Gas Production;Compressors*
31000215 Natural Gas Production;Flares Combusting Gases >1000 BTU/scf*
31000222 Natural Gas Production;Drilling and Well Completion*
31000227 Gas Production;Glycol Dehydrator Reboiler Still Stack*
31000228 Natural Gas Production;Glycol Dehydrator Reboiler Burner*
31000403 Industrial Processes;Oil and Gas Production;Process Heaters;Crude Oil
31000404 Industrial Processes;Oil and Gas Production;Process Heaters;Natural Gas
31088811 Industrial Processes;Oil and Gas Production;Fugitive Emissions;Fugitive Emissions * These SCC descriptions start with the preface ―Industrial Processes;Oil and Gas Production‖
In addition, this update removed emissions for SCC 2310000000, which is ―Industrial
Processes;Oil and Gas Production: SIC 13;All Processes;Total: All Processes.‖
The resultant Oklahoma emissions are shown below in Table 2-12. Note that Oklahoma
instructed that PM10 emissions were size PM2.5, and therefore no coarse PM (PMC) are generated
and PM10 is the same as PM2.5
Table 2-12. Changes to Oklahoma oil and gas emissions
Pollutant
2005 Oklahoma Oil and gas
emissions 2005, removed
from nonpt (tons/yr)
2005 Oklahoma Oil and
gas emissions, added to
nonpt (tons/yr)
CO 11,251 32,821
VOC 104,193 155,908
NOX 66,480 39,668
SO2 0 1,014
PM10 = PM2.5 0 1,918
2.3 Fires (avefire)
This sector is unchanged from the 2005v4 platform; the documentation is repeated here for
completeness.
The purpose of the avefire sector is to represent emissions for a typical year‘s fires for use in
projection year inventories, since the location and degree of future year fires are not known.
This approach keeps the fires information constant between the 2005 base case and future-year
cases to eliminate large and uncertain differences between those cases that would be caused by
changing the fires. Using an average of multiple years of data reduces the possibility that a
single-year's high or low fire activity would unduly affect future year model-predicted
concentrations.
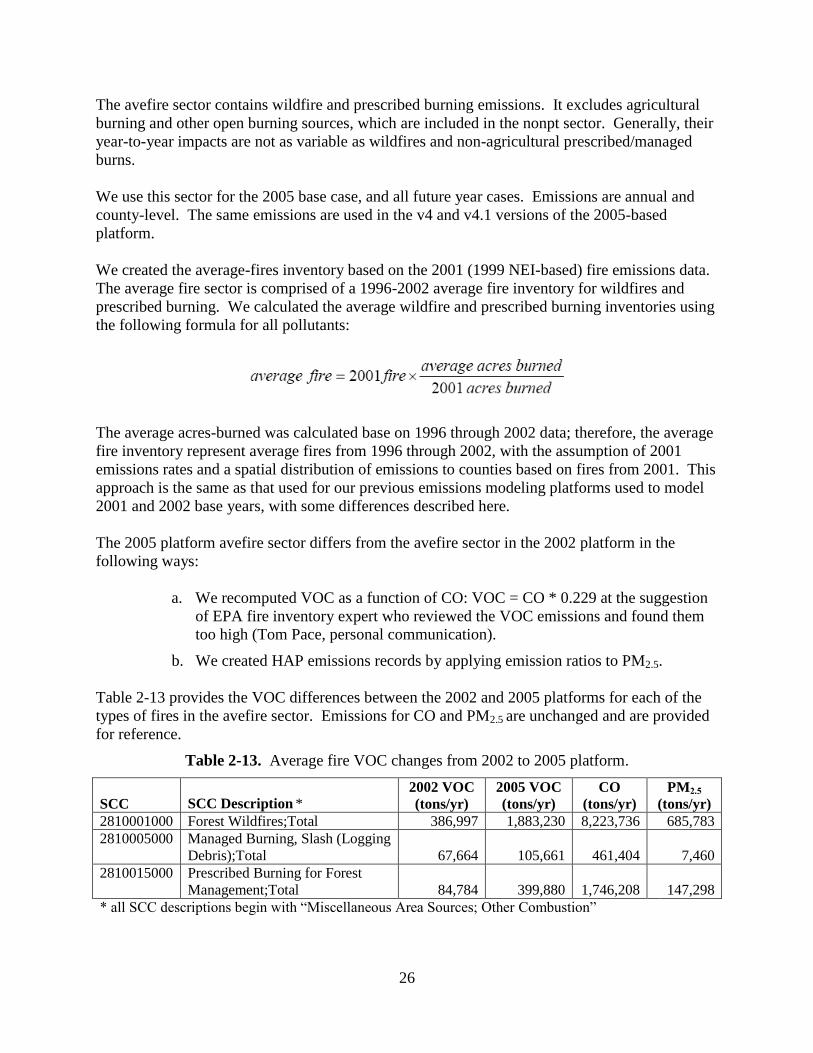
26
The avefire sector contains wildfire and prescribed burning emissions. It excludes agricultural
burning and other open burning sources, which are included in the nonpt sector. Generally, their
year-to-year impacts are not as variable as wildfires and non-agricultural prescribed/managed
burns.
We use this sector for the 2005 base case, and all future year cases. Emissions are annual and
county-level. The same emissions are used in the v4 and v4.1 versions of the 2005-based
platform.
We created the average-fires inventory based on the 2001 (1999 NEI-based) fire emissions data.
The average fire sector is comprised of a 1996-2002 average fire inventory for wildfires and
prescribed burning. We calculated the average wildfire and prescribed burning inventories using
the following formula for all pollutants:
The average acres-burned was calculated base on 1996 through 2002 data; therefore, the average
fire inventory represent average fires from 1996 through 2002, with the assumption of 2001
emissions rates and a spatial distribution of emissions to counties based on fires from 2001. This
approach is the same as that used for our previous emissions modeling platforms used to model
2001 and 2002 base years, with some differences described here.
The 2005 platform avefire sector differs from the avefire sector in the 2002 platform in the
following ways:
a. We recomputed VOC as a function of CO: VOC = CO * 0.229 at the suggestion
of EPA fire inventory expert who reviewed the VOC emissions and found them
too high (Tom Pace, personal communication).
b. We created HAP emissions records by applying emission ratios to PM2.5.
Table 2-13 provides the VOC differences between the 2002 and 2005 platforms for each of the
types of fires in the avefire sector. Emissions for CO and PM2.5 are unchanged and are provided
for reference.
Table 2-13. Average fire VOC changes from 2002 to 2005 platform.
SCC SCC Description *
2002 VOC
(tons/yr)
2005 VOC
(tons/yr)
CO
(tons/yr)
PM2.5
(tons/yr)
2810001000 Forest Wildfires;Total 386,997 1,883,230 8,223,736 685,783
2810005000 Managed Burning, Slash (Logging
Debris);Total 67,664 105,661 461,404 7,460
2810015000 Prescribed Burning for Forest
Management;Total 84,784 399,880 1,746,208 147,298
* all SCC descriptions begin with ―Miscellaneous Area Sources; Other Combustion‖
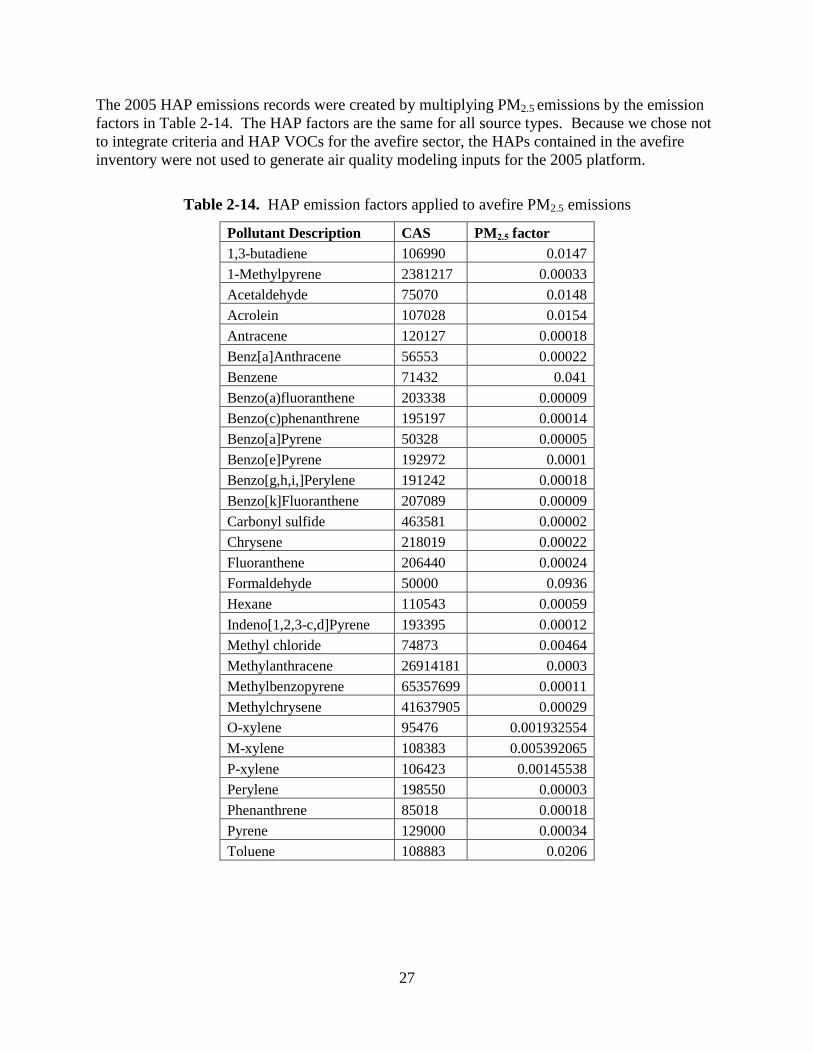
27
The 2005 HAP emissions records were created by multiplying PM2.5 emissions by the emission
factors in Table 2-14. The HAP factors are the same for all source types. Because we chose not
to integrate criteria and HAP VOCs for the avefire sector, the HAPs contained in the avefire
inventory were not used to generate air quality modeling inputs for the 2005 platform.
Table 2-14. HAP emission factors applied to avefire PM2.5 emissions
Pollutant Description CAS PM2.5 factor
1,3-butadiene 106990 0.0147
1-Methylpyrene 2381217 0.00033
Acetaldehyde 75070 0.0148
Acrolein 107028 0.0154
Antracene 120127 0.00018
Benz[a]Anthracene 56553 0.00022
Benzene 71432 0.041
Benzo(a)fluoranthene 203338 0.00009
Benzo(c)phenanthrene 195197 0.00014
Benzo[a]Pyrene 50328 0.00005
Benzo[e]Pyrene 192972 0.0001
Benzo[g,h,i,]Perylene 191242 0.00018
Benzo[k]Fluoranthene 207089 0.00009
Carbonyl sulfide 463581 0.00002
Chrysene 218019 0.00022
Fluoranthene 206440 0.00024
Formaldehyde 50000 0.0936
Hexane 110543 0.00059
Indeno[1,2,3-c,d]Pyrene 193395 0.00012
Methyl chloride 74873 0.00464
Methylanthracene 26914181 0.0003
Methylbenzopyrene 65357699 0.00011
Methylchrysene 41637905 0.00029
O-xylene 95476 0.001932554
M-xylene 108383 0.005392065
P-xylene 106423 0.00145538
Perylene 198550 0.00003
Phenanthrene 85018 0.00018
Pyrene 129000 0.00034
Toluene 108883 0.0206
28
2.4 Biogenic sources (biog)
This sector is unchanged from the 2005v4 platform; the documentation is repeated here for
completeness.
The biogenic emissions were computed based on 2005 meteorology data using the BEIS3.14
model within SMOKE. The 2002 platform used the BEIS3.13 model; otherwise, all underlying
land use data and parameters are unchanged for the 2005 platform.
The BEIS3.14 model creates gridded, hourly, model-species emissions from vegetation and soils.
It estimates CO, VOC, and NOX emissions for the U.S., Mexico, and Canada. The BEIS3.14
model is described further in:
http://www.cmascenter.org/conference/2008/slides/pouliot_tale_two_cmas08.ppt
The inputs to BEIS include:
Temperature data at 2 meters which were obtained from the CMAQ meteorological input
files,
Land-use data from the Biogenic Emissions Landuse Database, version 3 (BELD3).
BELD3 data provides data on the 230 vegetation classes at 1-km resolution over most of
North America, which is the same land-use data were used for the 2002 platform.
2.5 2005 Mobile sources (on_noadj, on_moves_runpm, on_moves_startpm, nonroad, alm_no_c3, seca_c3)
For the 2005 platform, as indicated in Table 2-2, we separated the 2005 onroad emissions into
three sectors: (1) ―on_moves_startpm‖; (2) ―on_moves_runpm‖; and (3) ―on_noadj‖. The
aircraft, locomotive, and commercial marine emissions are divided into two nonroad sectors:
―alm_no_c3‖ and ―seca_c3‖, and as previously mentioned, the aircraft emissions are in the non-
EGU (ptnonipm) point inventory.
The major changes between v4.1 and v4 versions of the 2005-based platform are that (1) we
used a final version of MOVES, MOVES2010, rather than a draft version of MOVES; (2) we
used the MOVES emissions for all vehicle types and modes (as opposed to non-motorcycle
gasoline exhaust vehicles only); (3) MOVES2010 emissions cover all criteria pollutants and
criteria pollutant precursors (as opposed to only exhaust mode PM2.5, VOC, NOX and CO); (4)
we used NH3 from MOVES for California (as opposed to NH3 from NMIM) since California-
supplied emissions in the 2005v2 NEI do not include NH3. It should also be noted that the
exhaust PM2.5 from diesel vehicles, which had previously come from NMIM but in v4.1 come
from MOVES, are not impacted by cold temperatures. In addition, PM brake wear and tire wear
mode emissions are now provided in MOVES in v4.1; these emissions for both gasoline and
diesel vehicles are also not impacted by cold temperatures.
The onroad emissions were primarily based on the 12/21/2009 version of the Motor Vehicle
Emissions Simulator (MOVES2010) (http://www.epa.gov/otaq/models/moves/). MOVES was
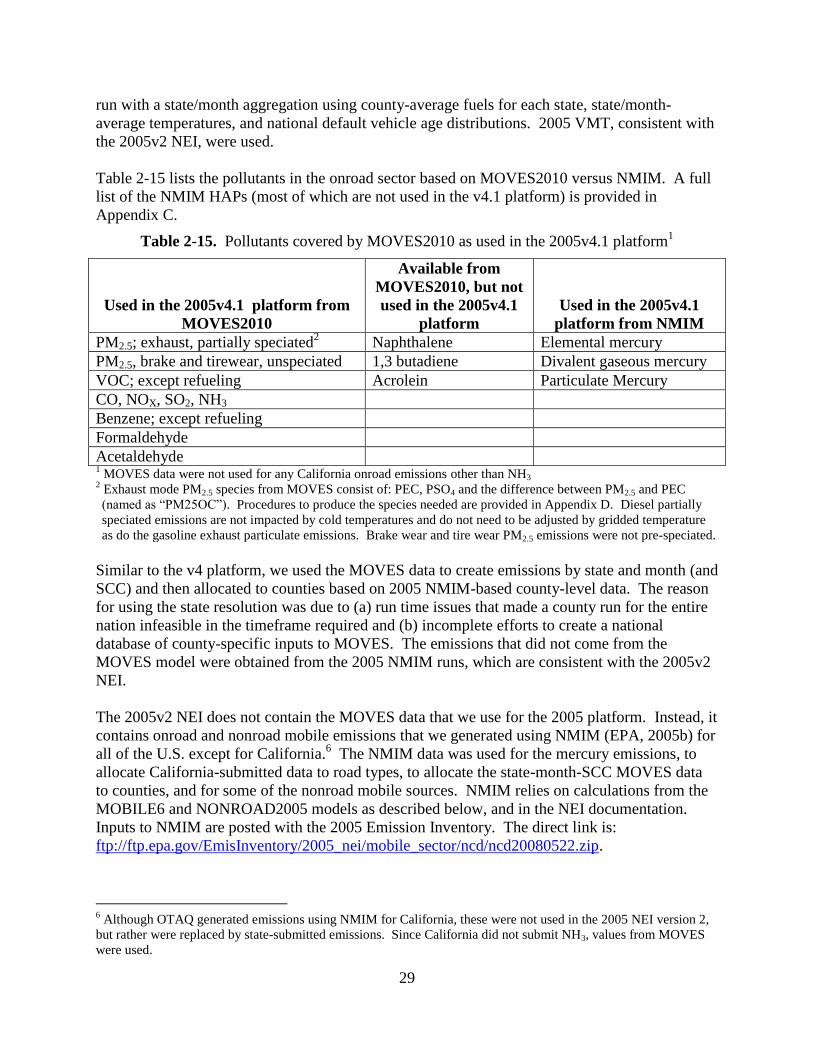
29
run with a state/month aggregation using county-average fuels for each state, state/month-
average temperatures, and national default vehicle age distributions. 2005 VMT, consistent with
the 2005v2 NEI, were used.
Table 2-15 lists the pollutants in the onroad sector based on MOVES2010 versus NMIM. A full
list of the NMIM HAPs (most of which are not used in the v4.1 platform) is provided in
Appendix C.
Table 2-15. Pollutants covered by MOVES2010 as used in the 2005v4.1 platform1
Used in the 2005v4.1 platform from
MOVES2010
Available from
MOVES2010, but not
used in the 2005v4.1
platform
Used in the 2005v4.1
platform from NMIM
PM2.5; exhaust, partially speciated2 Naphthalene
Elemental mercury
PM2.5, brake and tirewear, unspeciated 1,3 butadiene
Divalent gaseous mercury
VOC; except refueling Acrolein
Particulate Mercury
CO, NOX, SO2, NH3
Benzene; except refueling
Formaldehyde
Acetaldehyde 1 MOVES data were not used for any California onroad emissions other than NH3
2 Exhaust mode PM2.5 species from MOVES consist of: PEC, PSO4 and the difference between PM2.5 and PEC
(named as ―PM25OC‖). Procedures to produce the species needed are provided in Appendix D. Diesel partially
speciated emissions are not impacted by cold temperatures and do not need to be adjusted by gridded temperature
as do the gasoline exhaust particulate emissions. Brake wear and tire wear PM2.5 emissions were not pre-speciated.
Similar to the v4 platform, we used the MOVES data to create emissions by state and month (and
SCC) and then allocated to counties based on 2005 NMIM-based county-level data. The reason
for using the state resolution was due to (a) run time issues that made a county run for the entire
nation infeasible in the timeframe required and (b) incomplete efforts to create a national
database of county-specific inputs to MOVES. The emissions that did not come from the
MOVES model were obtained from the 2005 NMIM runs, which are consistent with the 2005v2
NEI.
The 2005v2 NEI does not contain the MOVES data that we use for the 2005 platform. Instead, it
contains onroad and nonroad mobile emissions that we generated using NMIM (EPA, 2005b) for
all of the U.S. except for California.6 The NMIM data was used for the mercury emissions, to
allocate California-submitted data to road types, to allocate the state-month-SCC MOVES data
to counties, and for some of the nonroad mobile sources. NMIM relies on calculations from the
MOBILE6 and NONROAD2005 models as described below, and in the NEI documentation.
Inputs to NMIM are posted with the 2005 Emission Inventory. The direct link is:
ftp://ftp.epa.gov/EmisInventory/2005_nei/mobile_sector/ncd/ncd20080522.zip.
6 Although OTAQ generated emissions using NMIM for California, these were not used in the 2005 NEI version 2,
but rather were replaced by state-submitted emissions. Since California did not submit NH3, values from MOVES
were used.
30
NMIM creates the onroad and nonroad emissions on a month-specific basis that accounts for
temperature, fuel types, and other variables that vary by month. Inventory documentation for the
2005v2 NEI onroad and nonroad sectors is also posted with other 2005 NEI documentation; the
direct link is:
ftp://ftp.epa.gov/EmisInventory/2005_nei/mobile/2005_mobile_nei_version_2_report.pdf
The residual fuel commercial marine vessel (CMV), also referred to as Category 3 (C3) from the
2002 platform have been replaced with a new set of approximately 4-km resolution point source
format emissions; these were modeled separately as point sources in the ―seca_c3‖ sector for the
2005 platform. They were updated for v4.1 by using revised 2005 emissions from the category 3
commercial marine sector to reflect the final projections from 2002 developed for the category 3
commercial marine Emissions Control Area (ECA) proposal to the International Maritime
Organization (EPA-420-F-10-041, August 2010). Unlike for the v4 platform, we projected
Canada as part of the ECA, using region-specific growth rates; thus the v4.1 seca_c3 inventories
contain Canadian province codes for near shore emissions.
The nonroad sector, based on NMIM did not change for the v4.1 platform other than for
California, for which missing PM2.5 emissions for 7 counties was discovered. We corrected
these PM2.5 emissions by using an earlier version of the 2005 submittal which California had
provided values for the 7 counties.
The mobile sectors are compiled at a county and SCC resolution, with the exception of the
seca_c3 sector that uses point sources to map the pre-gridded data to the modeling domain.
Similar to v4, in v4.1, tribal data from the alm_no_c3 sector have been dropped because we do
not have spatial surrogate data, and the emissions are small; these data were removed from the
SMOKE input inventories for 2005.
Most mobile sectors use the HAP portion on the inventory to provide benzene, acetaldehyde,
formaldehyde and/or methanol to the modeling inputs through HAP VOC ―integration‖, as
described in Section 3.1.2.1. A few categories of nonroad sources (CNG and LPG-fueled
equipment) do not have the BAFM pollutants in the inventory and therefore utilize the ―no-
integrate‖, ―no-hap-use‖ case, which means VOC from these sources is speciated to provide
BAFM.
2.5.1 Onroad mobile MOVES cold-start exhaust sources requiring temperature adjustments (on_moves_startpm)
This sector contains MOVES2010 emissions for PM and naphthalene7 for non-California onroad
gasoline cold-start exhaust. These emissions (and the on_moves_runpm sector discussed in the
next section) are processed separately from the remainder of the onroad mobile emissions
because they are subject to hourly temperature adjustments, and these temperature adjustments
are different for cold-start and running exhaust modes.
7 Naphthalene is not used in the 2005v4 CAP-BAFM platform, but it is contained in the MOVES emissions.
31
Temperature adjustments were applied to account for the strong sensitivity of PM and
naphthalene exhaust emissions to temperatures below 72ºF. Because it was not feasible to run
MOVES directly for all of the gridded, hourly temperatures needed for modeling, we created
emissions of PM and naphthalene exhaust at 72ºF and applied temperature adjustments after the
emissions were spatially and temporally allocated. The PM2.5 (and naphthalene) adjustment
factors were different for starting and running exhaust because these two processes respond
differently to temperature as shown in Figure 2-1 which shows how these emissions increase
with colder temperatures. The temperature adjustment factor in this figure is defined in terms of
primary elemental carbon (PEC) as follows:
PEC = Adjustment Factor x PEC_72
Where:
PEC = PEC at Temperatures below 72ºF
PEC_72 = PEC at 72ºF or higher
As seen in the figure, start exhaust emissions increase more than running exhaust emissions as
temperatures decrease from 72ºF.
Figure 2-1 also shows that the actual adjustments are different for start exhaust and running
exhaust emissions. The method for applying these adjustments was the same for both start and
running exhaust sectors: They were applied to SMOKE gridded, hourly intermediate files, based
upon the gridded hourly temperature data (these same data are also input to the air quality
model). One result of this approach is that inventory summaries based on the raw SMOKE
inputs for the on_moves_startpm and on_moves_runpm sectors will not be valid because they
will not include the temperature adjustments. As a result, the post-processing for temperature
adjustments included computing the emissions totals at state, county, and month resolution to use
for summaries.
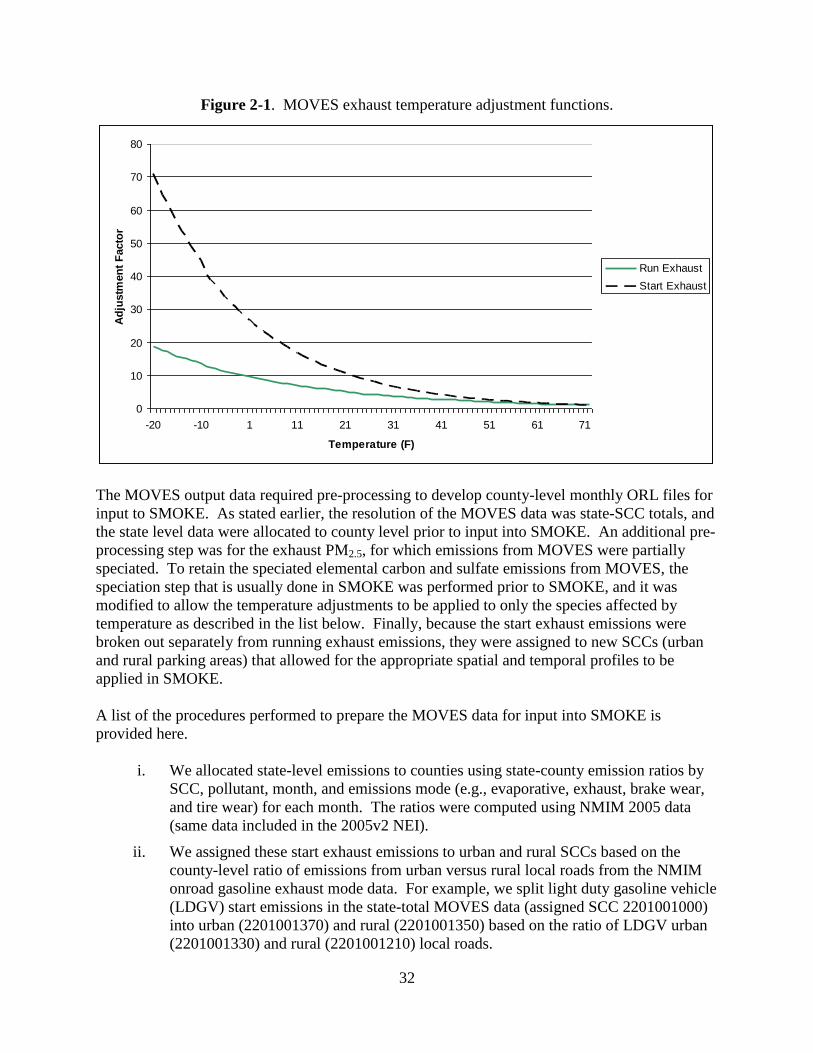
32
Figure 2-1. MOVES exhaust temperature adjustment functions.
The MOVES output data required pre-processing to develop county-level monthly ORL files for
input to SMOKE. As stated earlier, the resolution of the MOVES data was state-SCC totals, and
the state level data were allocated to county level prior to input into SMOKE. An additional pre-
processing step was for the exhaust PM2.5, for which emissions from MOVES were partially
speciated. To retain the speciated elemental carbon and sulfate emissions from MOVES, the
speciation step that is usually done in SMOKE was performed prior to SMOKE, and it was
modified to allow the temperature adjustments to be applied to only the species affected by
temperature as described in the list below. Finally, because the start exhaust emissions were
broken out separately from running exhaust emissions, they were assigned to new SCCs (urban
and rural parking areas) that allowed for the appropriate spatial and temporal profiles to be
applied in SMOKE.
A list of the procedures performed to prepare the MOVES data for input into SMOKE is
provided here.
i. We allocated state-level emissions to counties using state-county emission ratios by
SCC, pollutant, month, and emissions mode (e.g., evaporative, exhaust, brake wear,
and tire wear) for each month. The ratios were computed using NMIM 2005 data
(same data included in the 2005v2 NEI).
ii. We assigned these start exhaust emissions to urban and rural SCCs based on the
county-level ratio of emissions from urban versus rural local roads from the NMIM
onroad gasoline exhaust mode data. For example, we split light duty gasoline vehicle
(LDGV) start emissions in the state-total MOVES data (assigned SCC 2201001000)
into urban (2201001370) and rural (2201001350) based on the ratio of LDGV urban
(2201001330) and rural (2201001210) local roads.
0
10
20
30
40
50
60
70
80
-20 -10 1 11 21 31 41 51 61 71
Temperature (F)
Ad
justm
en
t F
acto
r
Run Exhaust
Start Exhaust
33
iii. We converted MOVES-based PM2.5 species at 72ºF to SMOKE-ready PM species.
The SMOKE-ready species are listed below and the speciation technique used to
obtain the SMOKE-ready species is further discussed in Appendix D.
NAPHTH_72: unchanged from MOVES-based file, subject to temperature
adjustment below 72ºF.
PEC_72: unchanged from MOVES-based PM25EC, subject to temperature
adjustment below 72ºF.
POC_72: modified MOVES-based PM25OC to remove metals, PNO3 (computed
from MOVES-based PM25EC), NH4 (computed from MOVES-based PM25SO4
and PNO3), and MOVES-based PM25SO4. Subject to temperature adjustment
below 72ºF.
PSO4: unchanged from MOVES-based PM25SO4, not subject to temperature
adjustment.
PNO3: computed from MOVES-based PM25EC, not subject to temperature
adjustment.
OTHER: sum of computed metals (fraction of MOVES-based PM25EC) and
NH4 (computed from PNO3 and PSO4), not subject to temperature adjustment.
PMFINE_72: Computed from OTHER and fraction of POC_72. Subject to
temperature adjustment below 72 ºF.
PMC_72: Computed as fraction of sum of PMFINE_72, PEC_72, POC_72,
PSO4, and PNO3 –described in Appendix D. Subject to temperature adjustment
below 72 ºF.
The result of these preprocessing steps is SMOKE-ready PM emissions that do not exactly match
what MOVES provides. The emissions are conserved during allocation from the state to county
and from the generic total ―start‖ SCCs to the two new parking SCCs that end in ―350‖ and
―370‖. PEC and PSO4 components of PM2.5 emissions are also conserved as they are simply
renamed from the MOVES species ―PM25EC‖ and ―PM25SO4‖. However, as seen above,
POC, PNO3, and PMFINE components involve multiplying the MOVES PM species by
components of an onroad gasoline exhaust speciation profile described in Appendix D.
2.5.2 Onroad mobile MOVES running exhaust sources requiring temperature adjustments (on_moves_runpm)
This sector is identical to the on_moves_startpm sector discussed in Section 2.5.1, but contains
running exhaust emissions instead of cold-start exhaust emissions. The same pollutants are in
this sector, and allocation from the MOVES state-level to county-level inventory is a simple
match by SCC and month to NMIM state-county ratios. The only reason this sector is separated
from on_moves_startpm is because the temperature adjustments are less extreme for these
running emissions at colder temperatures when compared to the curve for cold-start emissions
(Figure 2-1).
34
2.5.3 Onroad no-adjustments mobile sources (on_noadj)
This sector consists of the bulk of the onroad mobile emissions, which are not covered by the
on_moves_startpm and on_moves_runpm sectors. These emissions did not receive any
temperature adjustments in our processing. There are four sources of data that are pre-processed
to create three sets of monthly inventories for this sector.
1. MOVES-based onroad gasoline and diesel: These are the monthly (does not include
gasoline exhaust mode PM and naphthalene) MOVES-based emissions from three
MOVES inventories:
a. Gasoline Exhaust: VOC, NOX, CO, SO2, NH3, 1,3-butadiene (106990),
acetaldehyde (75070), acrolein (107028), benzene (71432), formaldehyde
(50000), and brake and tire wear PM2.5;
b. Diesel Exhaust: Partially-speciated PM2.5 (that were fully speciated prior to input
into SMOKE (via Appendix D), VOC, NOX, CO, SO2, NH3, 1,3-butadiene
(106990), acetaldehyde (75070), acrolein (107028), benzene (71432),
formaldehyde (50000), and brake and tire wear PM2.5. Because diesel exhaust
PM does not require the same intermediate temperature adjustments as gasoline
exhaust PM, diesel exhaust PM can therefore be processed with the remaining
onroad mobile emissions.
c. Evaporative: Non-refueling VOC, benzene, and naphthalene (91203).
For the pollutants listed, these non-California MOVES emissions encompass the same
sources as the on_moves_startpm and on_moves_runpm sectors: light duty gasoline
vehicles, light duty gasoline trucks (1 & 2), and heavy duty gasoline vehicles, but they do
not require the same intermediate temperature adjustments and can therefore be
processed with the remaining onroad mobile emissions. These emissions contain both
running and parking sources and are pre-processed from state-level to county-level much
like the on_moves_startpm and on_moves_runpm sectors already discussed. The
preprocessing for the non-PM emissions did not require species calculations because the
raw MOVES emissions translated directly to SMOKE inventory species.
2. California onroad inventory: California 2005v2 NEI complete CAP/HAP onroad
inventory. California monthly onroad emissions are year 2005 and are based on
September 2007 California Air Resources Board (CARB) data from Chris Nguyen. NH3
emissions are from MOVES2010 runs for California. We retained only those HAPs that
are also estimated by NMIM for onroad mobile sources; all other HAPs provided by
California were dropped. The California onroad inventory does not use the SCCs for
Heavy Duty Diesel Vehicles (HDDV) class 6 & 7 (2230073XXX) emissions. California
does not specify road types, so we used NMIM-based California ratios to break out
vehicle emissions to the match the more detailed NMIM level.
3. Remaining NMIM-based onroad inventory: The remainder of the non-California onroad
inventory that was not replaced by MOVES. This includes monthly emissions the three
species of mercury (divalent gas, elemental and particulate) as well as a number of other
HAPs not used by the platform. The NMIM county database is NCD20080522; this is an
update of NCD20070912 in which state/local and tribal inputs replace EPA default inputs
35
where provided. These emissions are identical to those in the v4 platform and are not
described further here.
2.5.4 Nonroad mobile sources – NMIM-based nonroad (nonroad)
This sector includes monthly exhaust, evaporative and refueling emissions from nonroad engines
(not including commercial marine, aircraft, and locomotives) derived from NMIM for all states
except California, which were corrected due to an inadvertent omission of PM2.5 from 7 counties.
Thus, except for California, emissions from this sector did not change between the v4 and v4.1
platform versions, and we repeat the documentation here for completeness.
The NMIM relied on the version of the NONROAD2005 model (NR05c-BondBase) used for the
marine spark ignited (SI) and small SI engine proposed rule, published May 18, 2007 (EPA,
2007c). For 2005, the NONROAD2005 model (NR05c-BondBase) is equivalent to
NONROAD2008a, since it incorporated Bond rule revisions to some of the base case inputs and
the Bond rule controls did not take effect until future years. As with the onroad emissions,
NMIM provides nonroad emissions for VOC by three emission modes: exhaust, evaporative and
refueling. Unlike the onroad sector, refueling emissions nonroad sources are not dropped from
processing for this sector.
Similar to the on_noadj pre-processing for evaporative emissions, we also reassigned NMIM
evaporative and refueling xylene to the various isomers of xylene. We use the same percentages
for refueling as for evaporative emissions as follows: we converted compound XYL or
CAS=EVP__1330207, RFL__1330207) into MXYL (CAS=EVP__108383, RFL__108383) and
OXYL (CAS=EVP__95476, RFL__95476) using a 68% and32% ratio to both evaporative and
refueling XYL, respectively. We also split NMIM exhaust xylene (CAS=EXH__1330207) into
MXYL (CAS=EXH__108383) and OXYL (CAS=EXH__95476) using a 74% and 26% ratio to
XYL, respectively.
EPA/OTAQ ran NMIM to create county-SCC emissions for the NEI 2005v2 nonroad mobile
CAP/HAP inventory, and similar to on_noadj, we removed California NMIM emissions that
were submitted separately by California. Emissions were converted from monthly totals to
monthly average-day based on the number of days in each month. Similar to onroad NMIM
emissions, EPA default inputs were replaced by state inputs where provided. The NMIM
inventory documentation describes this and all other details of the NMIM nonroad emissions
development:
ftp://ftp.epa.gov/EmisInventory/2005_nei/mobile/2005_mobile_nei_version_2_report.pdf
California nonroad
California monthly nonroad emissions are year 2005 and are based on September 2007
California Air Resources Board (CARB) data from Chris Nguyen, other than for the PM2.5
missing from 7 counties, which used the March 2007 version. In addition, NH3 emissions are
from NMIM runs for California because these were not included in the California NEI submittal.
HAP emissions were estimated by applying HAP-to-CAP ratios computed from California data
in the NEI 2005 v2 submittal. We retained only those HAPs that are also estimated by NMIM
for nonroad mobile sources; all other HAPs were dropped.
36
The CARB-based nonroad data did not have mode-specific data for VOC (exhaust, evaporative,
and refueling). To address this inconsistency with other states, we split the annual total
California data into monthly, mode-specific nonroad emissions for California using the NMIM
results. Details on this process are documented separately (Strum, 2007). Nonroad refueling
emissions for California were computed as Gasoline Transport (SCC=2505000120) emissions
multiplied by a factor of 0.46 (to avoid double counting with portable fuel container (PFC)
emissions in the nonpt sector) and were allocated to the gasoline equipment types based on ratios
of evaporative-mode VOC. The factor of 0.46 was computed by dividing the NMIM-derived
California refueling for 2005 by the sum of portable fuel container emissions and NMIM-derived
refueling for 2005.
2.5.5 Nonroad mobile sources: locomotive and non-C3 commercial marine (alm_no_c3)
The alm_no_c3 sector contains CAP and HAP emissions from locomotive and commercial
marine sources, except for category 3/residual-fuel (C3) commercial marine vessels and railway
maintenance. In modeling platforms prior to the 2005v4 platform, this sector also contained
aircraft emissions. Point-source airports were included in the non-EGU point sector (ptnonipm)
through the 2005v2 NEI point source inventory. The C3 commercial marine vessel emissions
are in the seca_c3 sector. We note that the ―a‖ in the ―alm_no_c3‖ sector name is now
misleading because aircraft are no longer in this sector. This sector is unchanged from the v4
platform; we repeat the documentation for completeness.
The remaining emissions in the alm_no_c3 sector are year 2002 emissions unchanged from the
2002 platform. The SCCs in the alm_no_c3 sector are listed in Table 2-16.
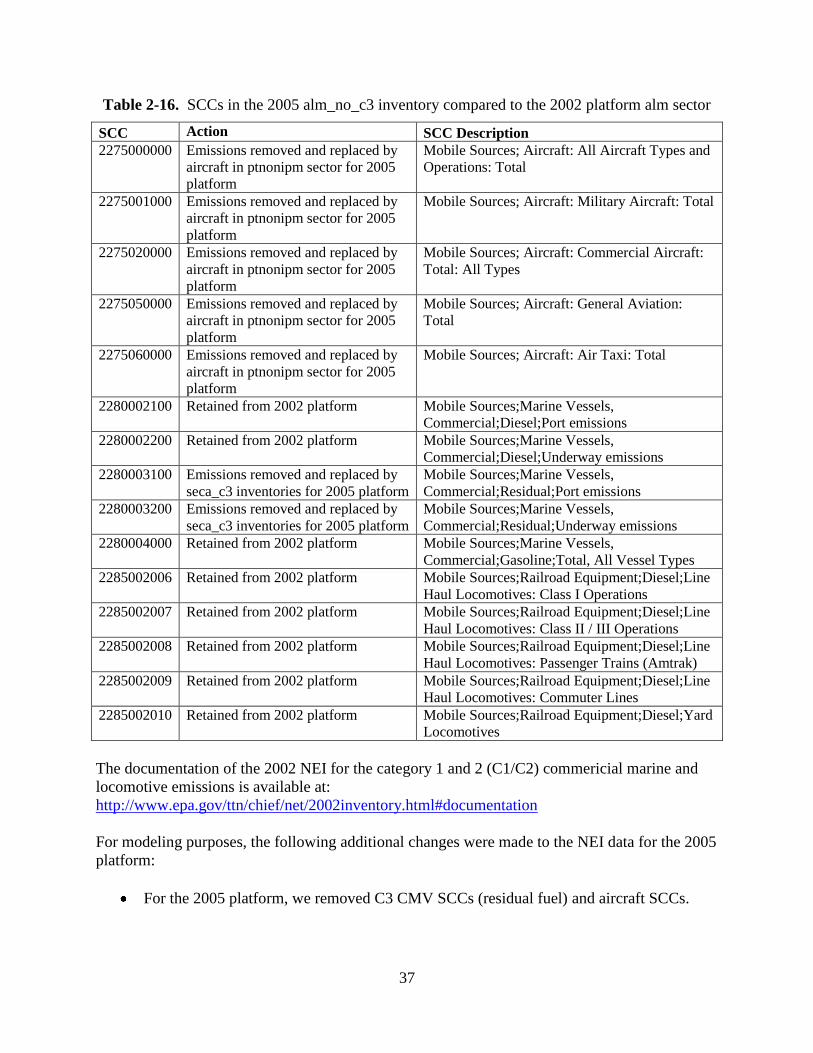
37
Table 2-16. SCCs in the 2005 alm_no_c3 inventory compared to the 2002 platform alm sector
SCC Action SCC Description
2275000000 Emissions removed and replaced by
aircraft in ptnonipm sector for 2005
platform
Mobile Sources; Aircraft: All Aircraft Types and
Operations: Total
2275001000 Emissions removed and replaced by
aircraft in ptnonipm sector for 2005
platform
Mobile Sources; Aircraft: Military Aircraft: Total
2275020000 Emissions removed and replaced by
aircraft in ptnonipm sector for 2005
platform
Mobile Sources; Aircraft: Commercial Aircraft:
Total: All Types
2275050000 Emissions removed and replaced by
aircraft in ptnonipm sector for 2005
platform
Mobile Sources; Aircraft: General Aviation:
Total
2275060000 Emissions removed and replaced by
aircraft in ptnonipm sector for 2005
platform
Mobile Sources; Aircraft: Air Taxi: Total
2280002100 Retained from 2002 platform Mobile Sources;Marine Vessels,
Commercial;Diesel;Port emissions
2280002200 Retained from 2002 platform Mobile Sources;Marine Vessels,
Commercial;Diesel;Underway emissions
2280003100 Emissions removed and replaced by
seca_c3 inventories for 2005 platform
Mobile Sources;Marine Vessels,
Commercial;Residual;Port emissions
2280003200 Emissions removed and replaced by
seca_c3 inventories for 2005 platform
Mobile Sources;Marine Vessels,
Commercial;Residual;Underway emissions
2280004000 Retained from 2002 platform Mobile Sources;Marine Vessels,
Commercial;Gasoline;Total, All Vessel Types
2285002006 Retained from 2002 platform Mobile Sources;Railroad Equipment;Diesel;Line
Haul Locomotives: Class I Operations
2285002007 Retained from 2002 platform Mobile Sources;Railroad Equipment;Diesel;Line
Haul Locomotives: Class II / III Operations
2285002008 Retained from 2002 platform Mobile Sources;Railroad Equipment;Diesel;Line
Haul Locomotives: Passenger Trains (Amtrak)
2285002009 Retained from 2002 platform Mobile Sources;Railroad Equipment;Diesel;Line
Haul Locomotives: Commuter Lines
2285002010 Retained from 2002 platform Mobile Sources;Railroad Equipment;Diesel;Yard
Locomotives
The documentation of the 2002 NEI for the category 1 and 2 (C1/C2) commericial marine and
locomotive emissions is available at:
http://www.epa.gov/ttn/chief/net/2002inventory.html#documentation
For modeling purposes, the following additional changes were made to the NEI data for the 2005
platform:
For the 2005 platform, we removed C3 CMV SCCs (residual fuel) and aircraft SCCs.
38
Removed railway maintenance emissions (SCCs 2285002015, 2285004015, and
2285006015) because these are included in the nonroad NMIM monthly inventories.
This change was made for the 2002 platform and is retained here in the 2005 platform.
For the purpose of CAP-HAP VOC integration as discussed in Section 3.1.2.1, we
removed benzene, formaldehyde, and acetaldehyde for all sources that we did not
integrate these HAPs with VOC. As discussed in Section 3.1.2.1, sources are considered
no-integrate when the source of data between VOC and VOC HAPs is inconsistent or
VOC analysis of VOC and VOC HAPs indicates the source is not integrated. Although
our CAP-HAP integration approach also required the removal of methanol for no-
integrate sources, the only sources in this sector that included methanol were in
California, where we used the integrate approach for all sources and therefore did not
need to remove it.
The 2002 platform documentation goes into greater detail on the locomotives and C1/C2 CMV
emissions in this sector.
2.5.6 Nonroad mobile sources: C3 commercial marine (seca_c3)
The raw seca_c3 sector emissions data were developed in an ASCII raster format used since the
Emissions Control Area-International Marine Organization (ECA-IMO) project began in 2005,
then known as the Sulfur Emissions Control Area (SECA). These emissions consist of large
marine diesel engines (at or above 30 liters/cylinder) that until very recently, were allowed to
meet relatively modest emission requirements, often burning residual fuel. The emissions in this
sector are comprised of primarily foreign-flagged ocean-going vessels, referred to as Category 3
(C3) ships. The seca_c3 (ECA) inventory includes these ships in several intra-port modes
(cruising, hoteling, reduced speed zone, maneuvering, and idling) and underway mode and
includes near-port auxiliary engines. An overview of the ECA-IMO project and future year
goals for reduction of NOX, SO2, and PM C3 emissions can be found at:
http://www.epa.gov/oms/regs/nonroad/marine/ci/420f09015.htm
The resulting coordinated strategy, including emission standards under the Clean Air Act for new
marine diesel engines with per-cylinder displacement at or above 30 liters, and the establishment
of Emission Control Areas is at: http://www.epa.gov/oms/oceanvessels.htm
The base year ECA inventory is 2002 and consists of these CAPs: PM10, CO, CO2, NH3, NOX,
SOX (assumed to be SO2), and Hydrocarbons (assumed to be VOC). EPA developed regional
growth (activity-based) factors that we applied to create the v4.1 platform 2005 inventory from
the 2002 data.
These region-specific and pollutant-specific growth factors were updated for the v4.1 platform as
compared to the v4 platform to be consistent with the final projections from 2002, developed for
the C3 ECA proposal to the International Maritime Organization (EPA-420-F-10-041, August
2010).
The updated factors that we used to project from 2002 to 2005 are presented in Table 2-17.
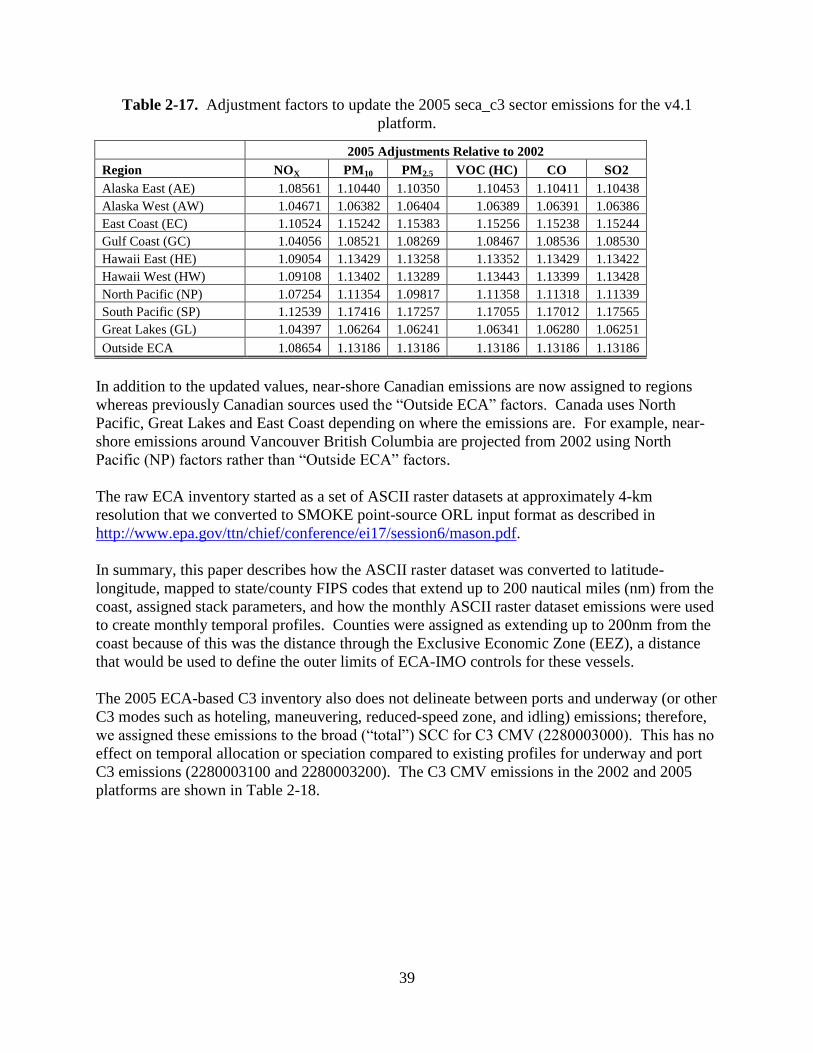
39
Table 2-17. Adjustment factors to update the 2005 seca_c3 sector emissions for the v4.1
platform.
2005 Adjustments Relative to 2002
Region NOX PM10 PM2.5 VOC (HC) CO SO2
Alaska East (AE) 1.08561 1.10440 1.10350 1.10453 1.10411 1.10438
Alaska West (AW) 1.04671 1.06382 1.06404 1.06389 1.06391 1.06386
East Coast (EC) 1.10524 1.15242 1.15383 1.15256 1.15238 1.15244
Gulf Coast (GC) 1.04056 1.08521 1.08269 1.08467 1.08536 1.08530
Hawaii East (HE) 1.09054 1.13429 1.13258 1.13352 1.13429 1.13422
Hawaii West (HW) 1.09108 1.13402 1.13289 1.13443 1.13399 1.13428
North Pacific (NP) 1.07254 1.11354 1.09817 1.11358 1.11318 1.11339
South Pacific (SP) 1.12539 1.17416 1.17257 1.17055 1.17012 1.17565
Great Lakes (GL) 1.04397 1.06264 1.06241 1.06341 1.06280 1.06251
Outside ECA 1.08654 1.13186 1.13186 1.13186 1.13186 1.13186
In addition to the updated values, near-shore Canadian emissions are now assigned to regions
whereas previously Canadian sources used the ―Outside ECA‖ factors. Canada uses North
Pacific, Great Lakes and East Coast depending on where the emissions are. For example, near-
shore emissions around Vancouver British Columbia are projected from 2002 using North
Pacific (NP) factors rather than ―Outside ECA‖ factors.
The raw ECA inventory started as a set of ASCII raster datasets at approximately 4-km
resolution that we converted to SMOKE point-source ORL input format as described in
http://www.epa.gov/ttn/chief/conference/ei17/session6/mason.pdf.
In summary, this paper describes how the ASCII raster dataset was converted to latitude-
longitude, mapped to state/county FIPS codes that extend up to 200 nautical miles (nm) from the
coast, assigned stack parameters, and how the monthly ASCII raster dataset emissions were used
to create monthly temporal profiles. Counties were assigned as extending up to 200nm from the
coast because of this was the distance through the Exclusive Economic Zone (EEZ), a distance
that would be used to define the outer limits of ECA-IMO controls for these vessels.
The 2005 ECA-based C3 inventory also does not delineate between ports and underway (or other
C3 modes such as hoteling, maneuvering, reduced-speed zone, and idling) emissions; therefore,
we assigned these emissions to the broad (―total‖) SCC for C3 CMV (2280003000). This has no
effect on temporal allocation or speciation compared to existing profiles for underway and port
C3 emissions (2280003100 and 2280003200). The C3 CMV emissions in the 2002 and 2005
platforms are shown in Table 2-18.
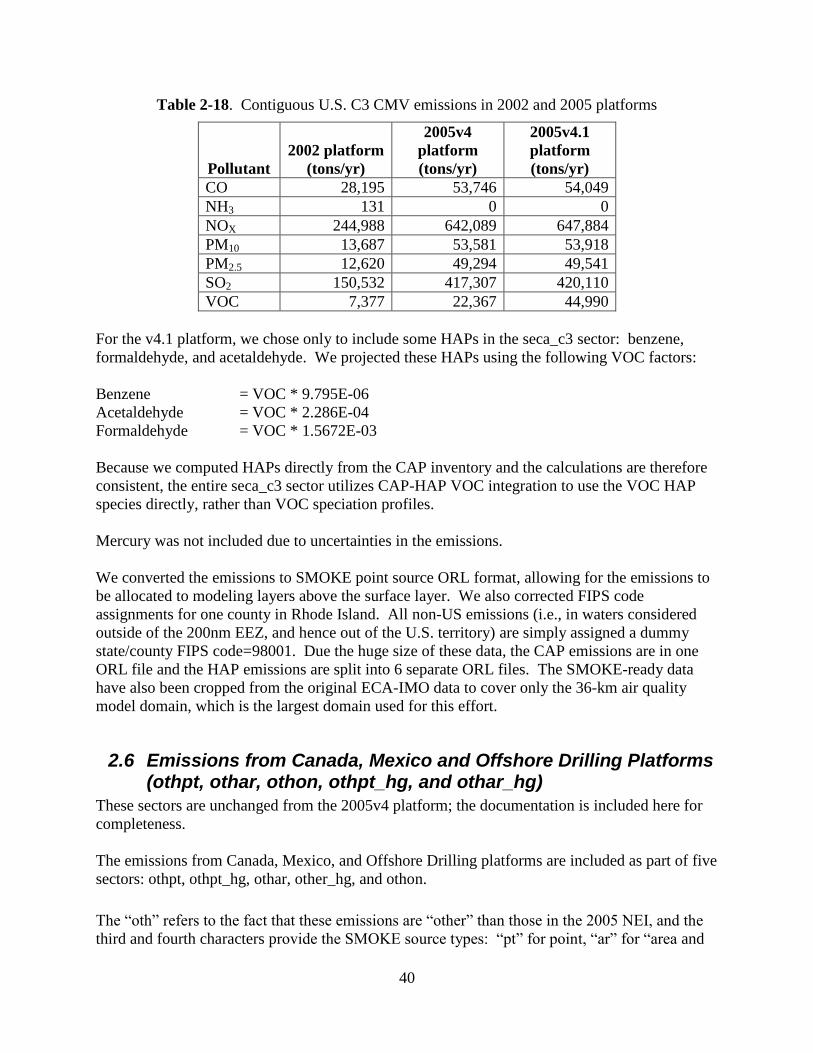
40
Table 2-18. Contiguous U.S. C3 CMV emissions in 2002 and 2005 platforms
Pollutant
2002 platform
(tons/yr)
2005v4
platform
(tons/yr)
2005v4.1
platform
(tons/yr)
CO 28,195 53,746 54,049
NH3 131 0 0
NOX 244,988 642,089 647,884
PM10 13,687 53,581 53,918
PM2.5 12,620 49,294 49,541
SO2 150,532 417,307 420,110
VOC 7,377 22,367 44,990
For the v4.1 platform, we chose only to include some HAPs in the seca_c3 sector: benzene,
formaldehyde, and acetaldehyde. We projected these HAPs using the following VOC factors:
Benzene = VOC * 9.795E-06
Acetaldehyde = VOC * 2.286E-04
Formaldehyde = VOC * 1.5672E-03
Because we computed HAPs directly from the CAP inventory and the calculations are therefore
consistent, the entire seca_c3 sector utilizes CAP-HAP VOC integration to use the VOC HAP
species directly, rather than VOC speciation profiles.
Mercury was not included due to uncertainties in the emissions.
We converted the emissions to SMOKE point source ORL format, allowing for the emissions to
be allocated to modeling layers above the surface layer. We also corrected FIPS code
assignments for one county in Rhode Island. All non-US emissions (i.e., in waters considered
outside of the 200nm EEZ, and hence out of the U.S. territory) are simply assigned a dummy
state/county FIPS code=98001. Due the huge size of these data, the CAP emissions are in one
ORL file and the HAP emissions are split into 6 separate ORL files. The SMOKE-ready data
have also been cropped from the original ECA-IMO data to cover only the 36-km air quality
model domain, which is the largest domain used for this effort.
2.6 Emissions from Canada, Mexico and Offshore Drilling Platforms (othpt, othar, othon, othpt_hg, and othar_hg)
These sectors are unchanged from the 2005v4 platform; the documentation is included here for
completeness.
The emissions from Canada, Mexico, and Offshore Drilling platforms are included as part of five
sectors: othpt, othpt_hg, othar, other_hg, and othon.
The ―oth‖ refers to the fact that these emissions are ―other‖ than those in the 2005 NEI, and the
third and fourth characters provide the SMOKE source types: ―pt‖ for point, ―ar‖ for ―area and
41
nonroad mobile‖, and ―on‖ for onroad mobile. The othpt_hg and othar_hg sectors contain year
2000 Canadian speciated mercury emissions for point and area inventories. They were used with
the EPA‘s 2002v3 multi-pollutant platform posted at
http://www.epa.gov/ttn/chief/emch/index.html#2002 (see ―CAP and HAP 2002-Based Platform,
Version 3‖). All other ―oth‖ emissions are CAP-only inventories. Mexico‘s emissions are
unchanged from the 2002 platform with one exception –one stack diameter was updated
(recomputed from stack velocity and flowrate) in the Mexico border states point inventory.
For Canada we updated the emissions from the 2002 platform, migrating the non-Hg data from
year 2000 inventories to year 2006 inventories for the 2005 platform. We migrated to these 2006
Canadian emissions despite not receiving future year emissions, as we were advised by Canada
that the improvement in the 2006 inventory over the 2000 inventory was more significant than
the undesirable effect of retaining these 2006 emissions for all future year modeling. We applied
several modifications to the 2006 Canadian inventories:
i. We did not include wildfires, or prescribed burning because Canada does not include
these inventory data in their modeling.
ii. We did not include in-flight aircraft emissions because we do not include these for the
U.S. and we do not have an appropriate approach to include in our modeling.
iii. We applied a 75% reduction (―transport fraction‖) to PM for the road dust, agricultural,
and construction emissions in the Canadian ―afdust‖ inventory. This approach is more
simplistic than the county-specific approach used for the U.S., but a comparable approach
was not available for Canada.
iv. We did not include speciated VOC emissions from the ADOM chemical mechanism.
v. Residual fuel CMV (C3) SCCs (22800030X0) were removed because these emissions are
included in the seca_c3 sector, which covers not only emissions close to Canada but also
emissions far at sea. Canada was involved in the inventory development of the seca_c3
sector emissions.
vi. Wind erosion (SCC=2730100000) and cigarette smoke (SCC=2810060000) emissions
were removed from the nonpoint (nonpt) inventory; these emissions are also absent from
our U.S. inventory.
vii. Quebec PM2.5 emissions (2,000 tons/yr) were removed for one SCC (2305070000) for
Industrial Processes, Mineral Processes, Gypsum, Plaster Products due to corrupt fields
after conversion to SMOKE input format. This error should be corrected in a future
inventory.
viii. Excessively high CO emissions were removed from Babine Forest Products Ltd (British
Columbia SMOKE plantid=‘5188‘) in the point inventory. This change was made at our
discretion because the value of the emissions was impossibly large.
ix. The county part of the state/county FIPS code field in the SMOKE inputs were modified
in the point inventory from ―000‖ to ―001‖ to enable matching to existing temporal
profiles.
x. Fixed coordinates for facility ―ON105803‖ in the othpt_hg inventory to match those in
the National Pollutant Release Inventory (NPRI) othpt sector.
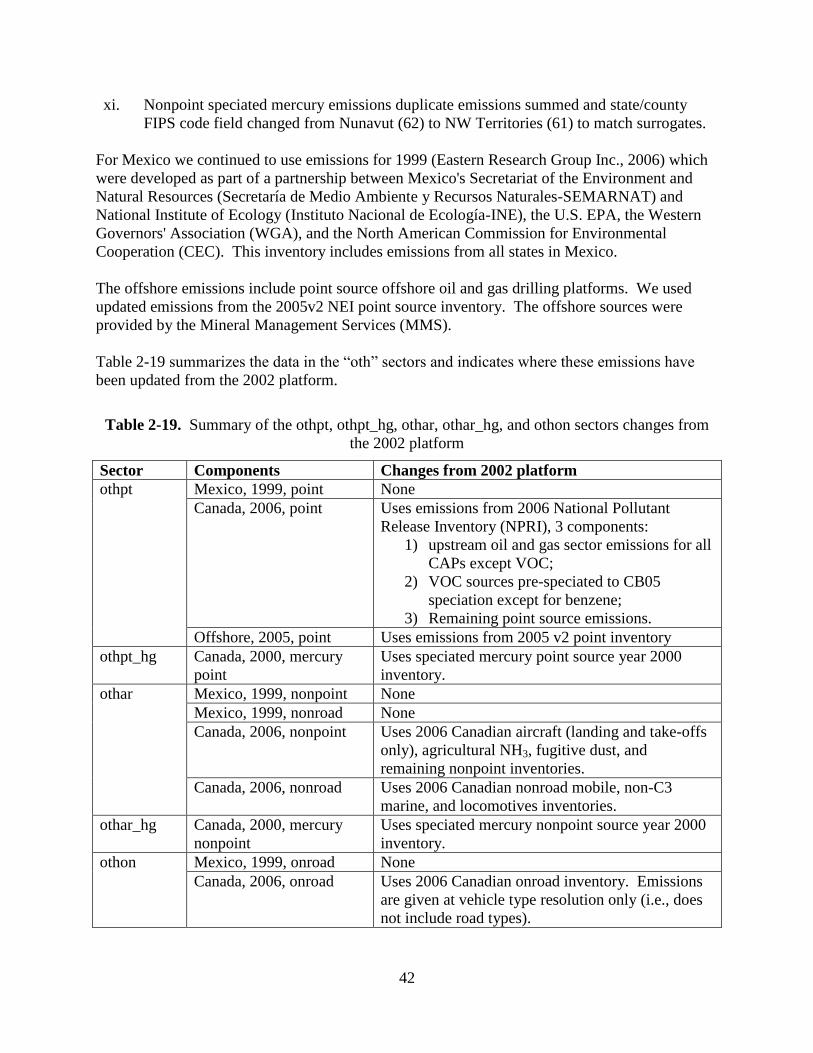
42
xi. Nonpoint speciated mercury emissions duplicate emissions summed and state/county
FIPS code field changed from Nunavut (62) to NW Territories (61) to match surrogates.
For Mexico we continued to use emissions for 1999 (Eastern Research Group Inc., 2006) which
were developed as part of a partnership between Mexico's Secretariat of the Environment and
Natural Resources (Secretaría de Medio Ambiente y Recursos Naturales-SEMARNAT) and
National Institute of Ecology (Instituto Nacional de Ecología-INE), the U.S. EPA, the Western
Governors' Association (WGA), and the North American Commission for Environmental
Cooperation (CEC). This inventory includes emissions from all states in Mexico.
The offshore emissions include point source offshore oil and gas drilling platforms. We used
updated emissions from the 2005v2 NEI point source inventory. The offshore sources were
provided by the Mineral Management Services (MMS).
Table 2-19 summarizes the data in the ―oth‖ sectors and indicates where these emissions have
been updated from the 2002 platform.
Table 2-19. Summary of the othpt, othpt_hg, othar, othar_hg, and othon sectors changes from
the 2002 platform
Sector Components Changes from 2002 platform
othpt Mexico, 1999, point None
Canada, 2006, point Uses emissions from 2006 National Pollutant
Release Inventory (NPRI), 3 components:
1) upstream oil and gas sector emissions for all
CAPs except VOC;
2) VOC sources pre-speciated to CB05
speciation except for benzene;
3) Remaining point source emissions.
Offshore, 2005, point Uses emissions from 2005 v2 point inventory
othpt_hg Canada, 2000, mercury
point
Uses speciated mercury point source year 2000
inventory.
othar Mexico, 1999, nonpoint None
Mexico, 1999, nonroad None
Canada, 2006, nonpoint Uses 2006 Canadian aircraft (landing and take-offs
only), agricultural NH3, fugitive dust, and
remaining nonpoint inventories.
Canada, 2006, nonroad Uses 2006 Canadian nonroad mobile, non-C3
marine, and locomotives inventories.
othar_hg Canada, 2000, mercury
nonpoint
Uses speciated mercury nonpoint source year 2000
inventory.
othon Mexico, 1999, onroad None
Canada, 2006, onroad Uses 2006 Canadian onroad inventory. Emissions
are given at vehicle type resolution only (i.e., does
not include road types).
43
2.7 SMOKE-ready non-anthropogenic inventories for mercury and chlorine
We generated elemental mercury from natural (N), recycled (R) and volcanic (V) emissions,
which we added to anthropogenic (A) elemental mercury processed from the inventories
discussed above, to provide the elemental mercury species ―HGNRVA‖ required by the multi-
pollutant version of CMAQ. This model species is intended to include the sum of elemental
mercury emissions from these sources. For the ocean chlorine, we used the same data as in the
CAP and HAP 2002-based platform. See
ftp://ftp.epa.gov/EmisInventory/2002v3CAPHAP/documentation for details.
A new recycled mercury file was developed for 2005 since the scaling factors applied to
temporally allocate the annual natural and recycled emissions from oceans and land are based on
solar radiation and skin temperature from the 2005 meteorology files. The annual files (prior to
temporal allocation) differed from those of the 2002 platform only in that we reduced emissions
of the natural emissions from land by 90% based on literature (Gustin, et. al., 2008), which
indicated that the emissions are 10-12 tons per year as opposed to the 120 tons we had been
using previously.
2.7.1 Mercury
As discussed in the CAP and HAP 2002v3-based platform documentation
(ftp://ftp.epa.gov/EmisInventory/2002v3CAPHAP/documentation), the initial data for natural
mercury, provided by Atmospheric and Environmental Research, Incorporated (AER), consisted
of three existing global inventories containing annual flux rates of elemental mercury, gridded to
1 degree by 1 degree resolution:
mercury emissions from oceans—direct + recycled
mercury emissions from land—direct + recycled
mercury emissions from volcanoes – direct
As indicated earlier, we reduced the direct land mercury emissions by 90%, based on literature
(Gustin, et. all, 2008) indicating that the emissions are 10-12 tons per year as opposed to the 120
tons we had been using previously.
Annual fluxes of recycled elemental mercury for 2001 were created using the deposition results
from a CMAQ 4.5.1 run. The approaches assumed that all recycled mercury emissions are in the
form of elemental mercury gas. It is necessary to treat these recycled emissions whenever a
version of CMAQ is used that also treats dry deposition of elemental mercury gas. The total
deposition (wet plus dry) of all forms of mercury was used as the basis for the recycled emission
estimates. A fraction equal to one-half the total deposition flux was used as the estimate for
recycled emissions based on previous model calibrations done by AER.
Natural and recycled emissions from oceans and land (but not volcanic emissions) were allocated
to hourly values based on the meteorological variables of solar radiation and temperature, which
are shown to be positively correlated with the evasion of elemental mercury from water surfaces
soils and vegetation. While the correlation is widely variable for each of these surfaces, simple
44
scaling functions for land and ocean developed for the 2001 applications were used for the 2002
and were repeated again for the 2005v4 and v4.1 platforms, but using 2005-specific factors:
Ocean:
allhrs
hrhr
SFCTMPSOLRAD
SFCTMPSOLRAD
)]273([
)273( or exactly zero for SFCTMP < 273 K
Land:
allhrs
hrhr
SFCTMPSOLRAD
SFCTMPSOLRAD
)]253([
)253( or exactly zero for SFCTMP < 253K
where SOLRAD is the solar radiation in W/m2 and SFCTMP is the skin temperature (Kelvin),
both from the 2-dimensional meteorology file from the Meteorology Chemistry Interface
Processor (MCIP) output.
The same sequence of steps were performed apply the hourly gridded scaling factors to create
hourly gridded files for recycled and natural mercury based on 2005 meteorological data. No
changes were made to the 2002 volcano mercury data
2.7.2 Chlorine
The oceanic chlorine gas emission estimates were the same as those used in the CAP and HAP
2002 platform.
3 Emissions modeling summary The CMAQ and CAMX models require hourly emissions of specific gas and particle species for
the horizontal and vertical grid cells contained within the modeled region (i.e., modeling
domain). To provide emissions in the form and format required by the model, it is necessary to
―pre-process‖ the ―raw‖ emissions (i.e., emissions input to SMOKE) for the sectors described
above in Section 2. In brief, this processing step transforms these emissions from their original
temporal resolution, pollutant resolution, and spatial resolution into the data required by the air
quality model. As seen in Section 2, the temporal resolution of the emissions input to SMOKE
for the 2005 platform varies across sectors, and may be hourly, monthly, or annual total
emissions. The spatial resolution, which also can be different for different sectors, may be
individual point sources or county totals (province totals for Canada, municipio totals for
Mexico). The pre-processing steps involving temporal allocation, spatial allocation, pollutant
speciation, and vertical allocation of point sources are referred to as emissions modeling. This
section provides some basic information about the tools and data files used for emissions
modeling as part of the 2005 platform. Since we devoted Section 2 to describing the emissions
inventories, we have limited this section‘s descriptions of data to the ancillary data SMOKE uses
to perform the emissions modeling steps
All SMOKE inputs for the 2005v4.1 platform emissions are available at the 2005v4.1 website
(see the end of Section 1).
We used SMOKE version 2.6 to pre-process the raw emissions to create the emissions inputs for
CMAQ and CAMX. The emissions processing steps and ancillary data for v4.1 were very
45
similar to those done for v4. A summary of the revisions is as follows:
We updated the ancillary files to handle additional MOVES SCCs related to parking area
emissions and to make some changes to the temporal and spatial approaches that were
originally assigned to parking area SCCs.
We changed speciation profiles for headspace vapor (VOC).
We changed the PM2.5 speciation profile for category 3 commercial marine vessels
burning residual oil.
We used an updated county-to-cell spatial surrogate for U.S. oil and gas emissions.
We changed the temporal allocation approach to use profiles that vary by day of week
and to use new temporal profiles for the afdust sector.
We also utilized the feature in SMOKE (updated in version 2.5) to create combination speciation
profiles that could vary by state/county FIPS code and by month; we used this approach for some
mobile sources as described in Section 3.1.2. As with the v4 platform, we used the CMAQ and
CAMX in-line emissions capability to create source-based emissions files rather than the 3-
dimensional files for sectors that have plume rise. When CAMX was used, the emissions were
first created in a form appropriate for CMAQ, and were converted to a form usable by CMAQ
using a Fortran convertor called ‗inline2camx‘. In addition to generating the gridded surface
level 2-dimensional emissions and elevated point source files necessary for CAMX, the program
renames certain emissions species to the names needed by CAMX. Emissions totals by specie for
the entire model domain are output as reports that are then compared to reports generated by
SMOKE to ensure mass is not lost or gained during this conversion process.
3.1 Key emissions modeling settings
Each sector is processed separately through SMOKE, up until the final merge program
(Mrggrid), which combines the model-ready, sector-specific emissions across sectors. The
SMOKE settings in the run scripts and the data in the SMOKE ancillary files control the
approaches used for the individual SMOKE programs for each sector. Table 3-1 summarizes the
major processing steps of each platform sector. The ―Spatial‖ column shows the spatial
approach: ―point‖ indicates that SMOKE maps the source from a point (i.e., latitude and
longitude) location to a grid cell, ―surrogates‖ indicates that some or all of the sources use spatial
surrogates to allocate county emissions to grid cells, and ―area-to-point‖ indicates that some of
the sources use the SMOKE area-to-point feature to grid the emissions (further described in
Section3.2.1.2 The ―Speciation‖ column indicates that all sectors use the SMOKE speciation
step, though biogenics speciation is done within BEIS3 and not as a separate SMOKE step. The
―Inventory resolution‖ column shows the inventory temporal resolution from which SMOKE
needs to calculate hourly emissions.
Finally, the ―plume rise‖ column indicates the sectors for which the in-line approach is used.
These sectors are the only ones which will have emissions in aloft layers, based on plume rise.
For the 2005v4 and v4.1 platforms, we did not have SMOKE compute vertical plume rise; this
was done in the air quality model using stack data found in the SMOKE output files for each
model-ready sector. The one sector with ―in-line‖ only, seca_c3, was processed so that the entire
emissions would be in aloft layers. Thus, there were no seca_c3 emissions in the 2-dimensional,
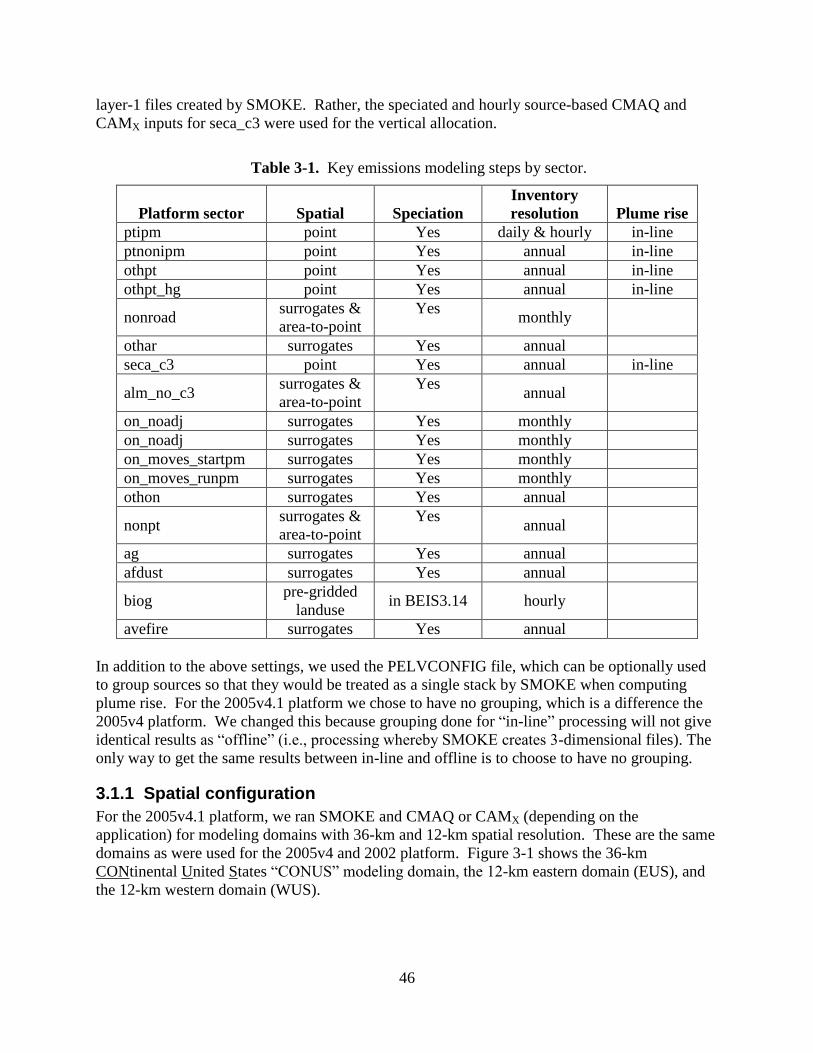
46
layer-1 files created by SMOKE. Rather, the speciated and hourly source-based CMAQ and
CAMX inputs for seca_c3 were used for the vertical allocation.
Table 3-1. Key emissions modeling steps by sector.
Platform sector Spatial Speciation
Inventory
resolution Plume rise
ptipm point Yes daily & hourly in-line
ptnonipm point Yes annual in-line
othpt point Yes annual in-line
othpt_hg point Yes annual in-line
nonroad surrogates &
area-to-point
Yes monthly
othar surrogates Yes annual
seca_c3 point Yes annual in-line
alm_no_c3 surrogates &
area-to-point
Yes annual
on_noadj surrogates Yes monthly
on_noadj surrogates Yes monthly
on_moves_startpm surrogates Yes monthly
on_moves_runpm surrogates Yes monthly
othon surrogates Yes annual
nonpt surrogates &
area-to-point
Yes annual
ag surrogates Yes annual
afdust surrogates Yes annual
biog pre-gridded
landuse in BEIS3.14 hourly
avefire surrogates Yes annual
In addition to the above settings, we used the PELVCONFIG file, which can be optionally used
to group sources so that they would be treated as a single stack by SMOKE when computing
plume rise. For the 2005v4.1 platform we chose to have no grouping, which is a difference the
2005v4 platform. We changed this because grouping done for ―in-line‖ processing will not give
identical results as ―offline‖ (i.e., processing whereby SMOKE creates 3-dimensional files). The
only way to get the same results between in-line and offline is to choose to have no grouping.
3.1.1 Spatial configuration
For the 2005v4.1 platform, we ran SMOKE and CMAQ or CAMX (depending on the
application) for modeling domains with 36-km and 12-km spatial resolution. These are the same
domains as were used for the 2005v4 and 2002 platform. Figure 3-1 shows the 36-km
CONtinental United States ―CONUS‖ modeling domain, the 12-km eastern domain (EUS), and
the 12-km western domain (WUS).
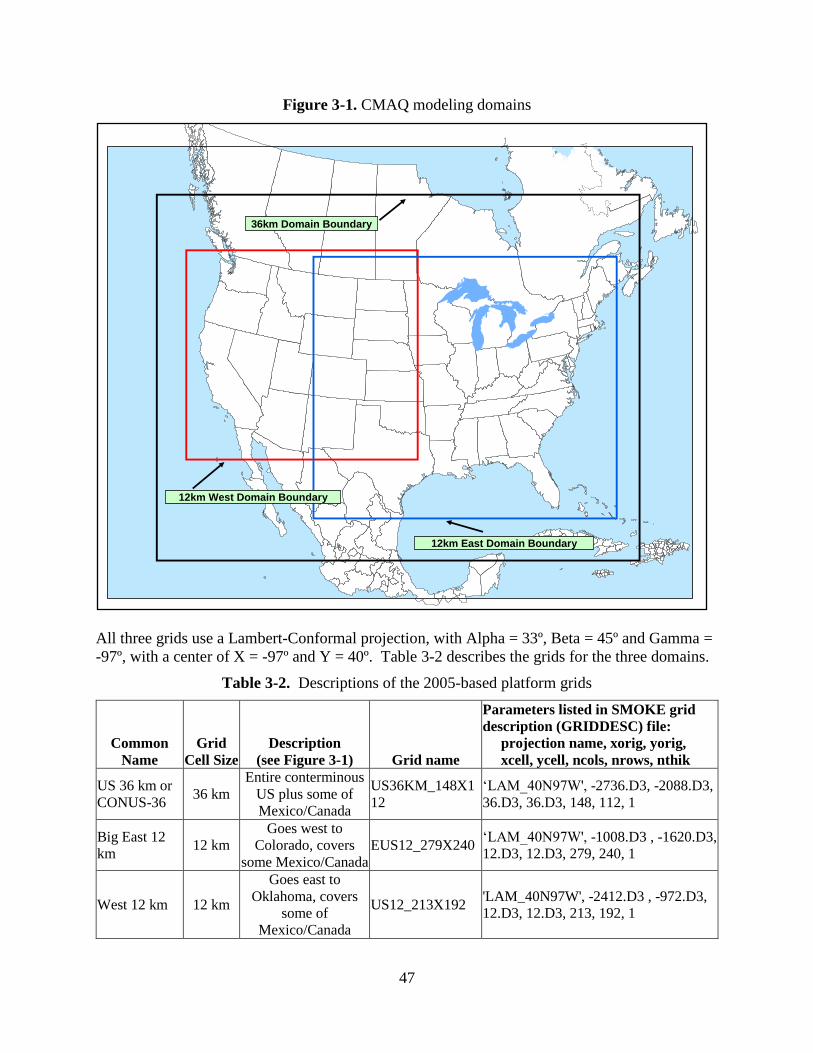
47
Figure 3-1. CMAQ modeling domains
All three grids use a Lambert-Conformal projection, with Alpha = 33º, Beta = 45º and Gamma =
-97º, with a center of X = -97º and Y = 40º. Table 3-2 describes the grids for the three domains.
Table 3-2. Descriptions of the 2005-based platform grids
Common
Name
Grid
Cell Size
Description
(see Figure 3-1) Grid name
Parameters listed in SMOKE grid
description (GRIDDESC) file:
projection name, xorig, yorig,
xcell, ycell, ncols, nrows, nthik
US 36 km or
CONUS-36 36 km
Entire conterminous
US plus some of
Mexico/Canada
US36KM_148X1
12
‗LAM_40N97W', -2736.D3, -2088.D3,
36.D3, 36.D3, 148, 112, 1
Big East 12
km 12 km
Goes west to
Colorado, covers
some Mexico/Canada
EUS12_279X240 ‗LAM_40N97W', -1008.D3 , -1620.D3,
12.D3, 12.D3, 279, 240, 1
West 12 km 12 km
Goes east to
Oklahoma, covers
some of
Mexico/Canada
US12_213X192 'LAM_40N97W', -2412.D3 , -972.D3,
12.D3, 12.D3, 213, 192, 1
36km Domain Boundary
12km East Domain Boundary
12km West Domain Boundary
48
Section 3.2.1 provides the details on the spatial surrogates and area-to-point data used to
accomplish spatial allocation with SMOKE.
3.1.2 Chemical speciation configuration
The emissions modeling step for chemical speciation creates ―model species‖ needed by the air
quality model for a specific chemical mechanism. These model species are either individual
chemical compounds or groups of species, called ―model species.‖ The chemical mechanism
used for the 2005 platform is the CB05 mechanism (Yarwood, 2005). The same base chemical
mechanism is used with CMAQ and CAMX, but the implementation differs slightly between the
two models. For details of the chemical mechanism as it is implemented in CAMX, see the
CAMx 5.2 user‘s guide available from http://www.camx.com. The specific version of CMAQ
used included secondary organic aerosol (SOA) and HONO enhancements as described in
http://www.cmascenter.org/help/model_docs/cmaq/4.7/RELEASE_NOTES.txt. This is
unchanged from the CMAQ applications of the v4 platform.
From the perspective of emissions preparation, the CMAQ CB05 mechanism is the same as was
used in the 2002 platform except that additional input model species are needed to support the
nitrous acid (HONO) chemistry enhancements and additional input model species are needed to
support SOA. Table 3-3 lists the model species produced by SMOKE for use in CMAQ and
CAMX; the only three input species that were not in the CAP 2002-Based platform described in
2002 ―CAP-only‖ platform
(http://www.epa.gov/scram001/reports/Emissions%20TSD%20Vol1_02-28-08.pdf) are nitrous
acid (HONO), BENZENE and sesquiterpenes (SESQ). It should be noted that the BENZENE
model species is not part of CB05 in that the concentrations of BENZENE do not provide any
feedback into the chemical reactions (i.e., it is not ―inside‖ the chemical mechanism). Rather,
benzene is used as a reactive tracer and as such is impacted by the CB05 chemistry. BENZENE,
along with several reactive CBO5 species (such as TOL and XYL) plays a role in SOA
formation in CMAQ4.7.
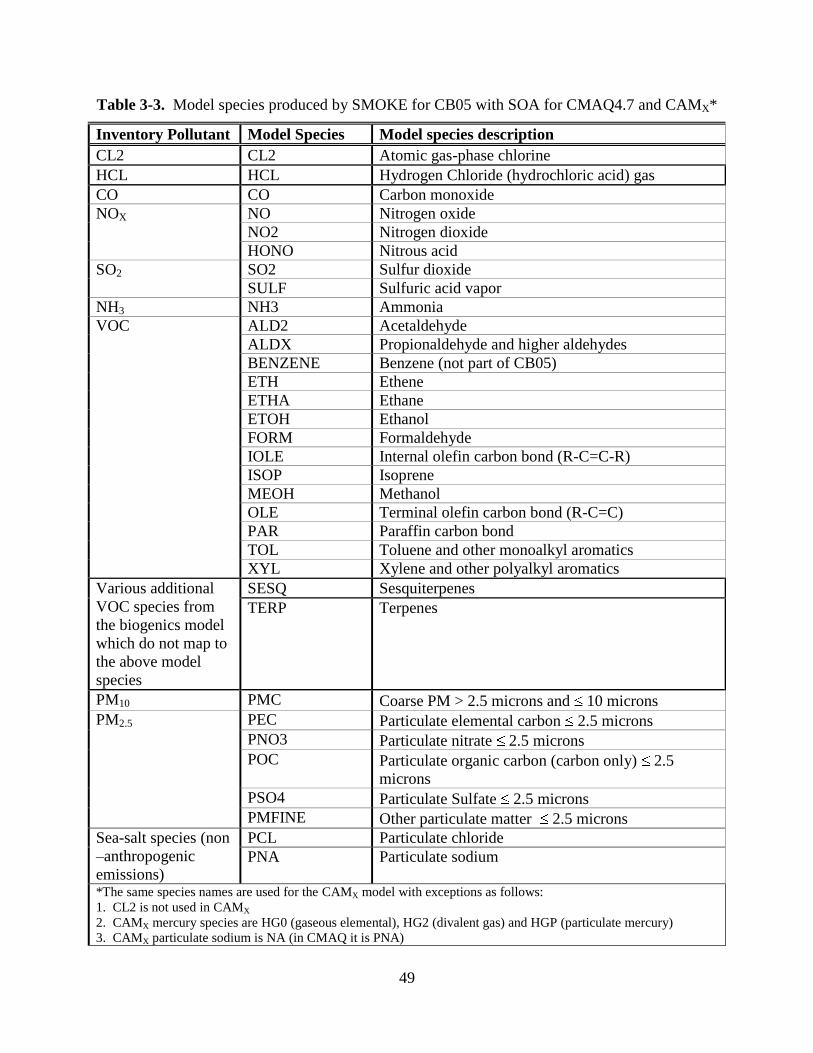
49
Table 3-3. Model species produced by SMOKE for CB05 with SOA for CMAQ4.7 and CAMX*
Inventory Pollutant Model Species Model species description
CL2 CL2 Atomic gas-phase chlorine
HCL HCL Hydrogen Chloride (hydrochloric acid) gas
CO CO Carbon monoxide
NOX NO Nitrogen oxide
NO2 Nitrogen dioxide
HONO Nitrous acid
SO2 SO2 Sulfur dioxide
SULF Sulfuric acid vapor
NH3 NH3 Ammonia
VOC ALD2 Acetaldehyde
ALDX Propionaldehyde and higher aldehydes
BENZENE Benzene (not part of CB05)
ETH Ethene
ETHA Ethane
ETOH Ethanol
FORM Formaldehyde
IOLE Internal olefin carbon bond (R-C=C-R)
ISOP Isoprene
MEOH Methanol
OLE Terminal olefin carbon bond (R-C=C)
PAR Paraffin carbon bond
TOL Toluene and other monoalkyl aromatics
XYL Xylene and other polyalkyl aromatics
Various additional
VOC species from
the biogenics model
which do not map to
the above model
species
SESQ Sesquiterpenes
TERP Terpenes
PM10 PMC Coarse PM > 2.5 microns and 10 microns
PM2.5 PEC Particulate elemental carbon 2.5 microns
PNO3 Particulate nitrate 2.5 microns
POC Particulate organic carbon (carbon only) 2.5
microns
PSO4 Particulate Sulfate 2.5 microns
PMFINE Other particulate matter 2.5 microns
Sea-salt species (non
–anthropogenic
emissions)
PCL Particulate chloride
PNA Particulate sodium
*The same species names are used for the CAMX model with exceptions as follows:
1. CL2 is not used in CAMX
2. CAMX mercury species are HG0 (gaseous elemental), HG2 (divalent gas) and HGP (particulate mercury)
3. CAMX particulate sodium is NA (in CMAQ it is PNA)
50
4. CAMX uses different names for species that are both in CBO5 and SOA for the following: TOLA=TOL,
XYLA=XYL, ISP=ISOP, TRP=TERP. They are duplicate species in CAMX that are used in the SOA chemistry.
CMAQ uses the same names in CB05 and SOA for these species.
5. CAMX uses a different name for sesquiterpenes: CMAQ SESQ = CAMX SQT
6. CAMX uses particulate species uses different names for organic carbon, coarse particulate matter and other
particulate mass as follows: CMAQ POC = CAMX POA, CMAQ PMC = CAMX CPRM, and CMAQ PMFINE=
CAMX FPRM
The approach for speciating PM2.5 emissions in v4.1 is the same as v4 except that in addition to
the on_moves_startpm and on_moves_runpm sectors, exhaust PM from diesel is provided to
SMOKE as speciated emissions. Thus, the only PM species requiring speciation in SMOKE
from the onroad sector are the brake and tirewear PM2.5. Canada point sources have an SCC of
3999999999 and all use the Speciation profile ‗92037‘ which is the ―Industry Manufacturing
Avge profile.‖ While this had not changed between v4 and v4.1, the documentation for v4
incorrectly stated that the Canadian point inventory (othpt sector) was pre-speciated. The
Canadian point source inventory is pre-speciated for VOC but not for PM2.5. One other
difference in PM2.5 speciation is that we used a new profile (‗92200‘) called ―simplified profile -
Marine Vessel – Main Boiler - Heavy Fuel Oil – Simplified.‖ At the time that this profile was
used, we anticipated its release with SPECIATE4.3.
The approach for speciating VOC emissions from non-biogenic sources is the same for the v4.1
platform as for the v4 platform, though there are some differences in the data files used. The
approach is that:
1. For some sources, HAP emissions are used in the speciation process to allow integration
of VOC and HAP emissions in the NEI. This has the result of modifying the speciation
profiles based on the HAP emission estimates which are presumed to be more accurate
than the speciated VOC results for the HAPs; and,
2. For some mobile sources, ―combination‖ profiles are specified by county and month and
emission mode (e.g., exhaust, evaporative). SMOKE computes the resultant profile using
the fraction of each specific profile assigned by county, month and emission mode. A
new feature and new profile file in SMOKE (the GSPRO_COMBO file) allowed the use
of this approach for the 2005v4 platform, and its use continues here.
The VOC speciation data files are different because we added another part of the nonpt sector to
exclude from HAP VOC integration: the category of pesticide application. Additionally, the
v4.1 platform used a new headspace profile representative of E0 gasoline, profile code 8762:
―Gasoline Headspace Vapor using 0% Ethanol - Composite Profile―. This profile is part of
SPECIATE4.3 and was used in place of the SPECIATE4.0 profile 8737 (Composite Profile -
Non-oxygenated Gasoline Headspace Vapor), which was used in the v4 platform. The new
headspace profile was used for the same sources as was the previous headspace profile: year
2005 refueling and other ambient temperature evaporative gasoline processes (portable fuel
containers and any evaporation of gasoline associated with gasoline storage and distribution
sources).
The below subsections provide a further description of the HAP/CAP integration and use of
combination profiles. Section 3.2.2 provides the details about the data files used to accomplish
these speciation processing steps.
51
3.1.2.1 The Combination of HAP BAFM (benzene, acetaldehyde, formaldehyde and methanol) and VOC for VOC Speciation
The VOC speciation approach for the 2005v4.1 platform differed from the 2002 platform in that
we included, for some of the U.S. platform sectors, HAP emissions from the NEI in the
speciation process. That is, instead of speciating VOC to generate all of the species listed in
Table 3-3 as we did for the 2002 platform, we integrated emissions of the 4 HAPs, benzene,
acetaldehyde, formaldehyde and methanol (BAFM) from the NEI with the NEI VOC. The
integration process (described in more detail below) combines the BAFM HAPs with the VOC in
a way that does not double count emissions and uses the BAFM directly in the speciation
process. We believe that generally, the HAP emissions from the NEI are more representative of
emissions of these compounds than their generation via VOC speciation.
We chose these HAPs because, with the exception of BENZENE, they are the only explicit VOC
HAPs in the base version of CMAQ 4.7 (CAPs only with chlorine chemistry) model. By
―explicit VOC HAPs,‖ we mean model species that participate in the modeled chemistry using
the CB05 chemical mechanism. We denote the use of these HAP emission estimates along with
VOC as ―HAP-CAP integration‖. BENZENE was chosen because it was added as a model
species in the base version of CMAQ 4.7, and there was a desire to keep its emissions consistent
between multi-pollutant and base versions of CMAQ.
The integration of HAP VOC with VOC is a feature available in SMOKE for all inventory
formats other than PTDAY (the format used for the ptfire sector). SMOKE allows the user to
specify the particular HAPs to integrate and the particular sources to integrate. The particular
HAPs to integrate are specified in the INVTABLE file, and the particular sources to integrate are
based on the NHAPEXCLUDE file (which actually provides the sources that are excluded from
integration8). For the ―integrate‖ sources, SMOKE subtracts the ―integrate‖ HAPs from the
VOC (at the source level) to compute emissions for the new pollutant ―NONHAPVOC.‖ The
user provides NONHAPVOC-to-NONHAPTOG factors and NONHAPTOG speciation profiles.
SMOKE computes NONHAPTOG and then applies the speciation profiles to allocate the
NONHAPTOG to the other air quality model VOC species not including the integrated HAPs.
This process is illustrated in Figure 3-2. Note that we did not need to remove BAFM from
no-integrate sources in a sector where all sources are no-integrate because this is accomplished
by through use of a SMOKE ancillary ―INVTABLE‖ which essentially drops all BAFM in that
sector.
8 In SMOKE version 2.6 the options to specify sources for integration are expanded so that a user can specify the
particular sources to include or exclude from integration, and there are settings to include or exclude all sources
within a sector. We did not take advantage of this new flexibility in processing v4.1 emissions or v4 emissions, but
the user will now have the ability for easier inclusion of specific sources to get the same result.
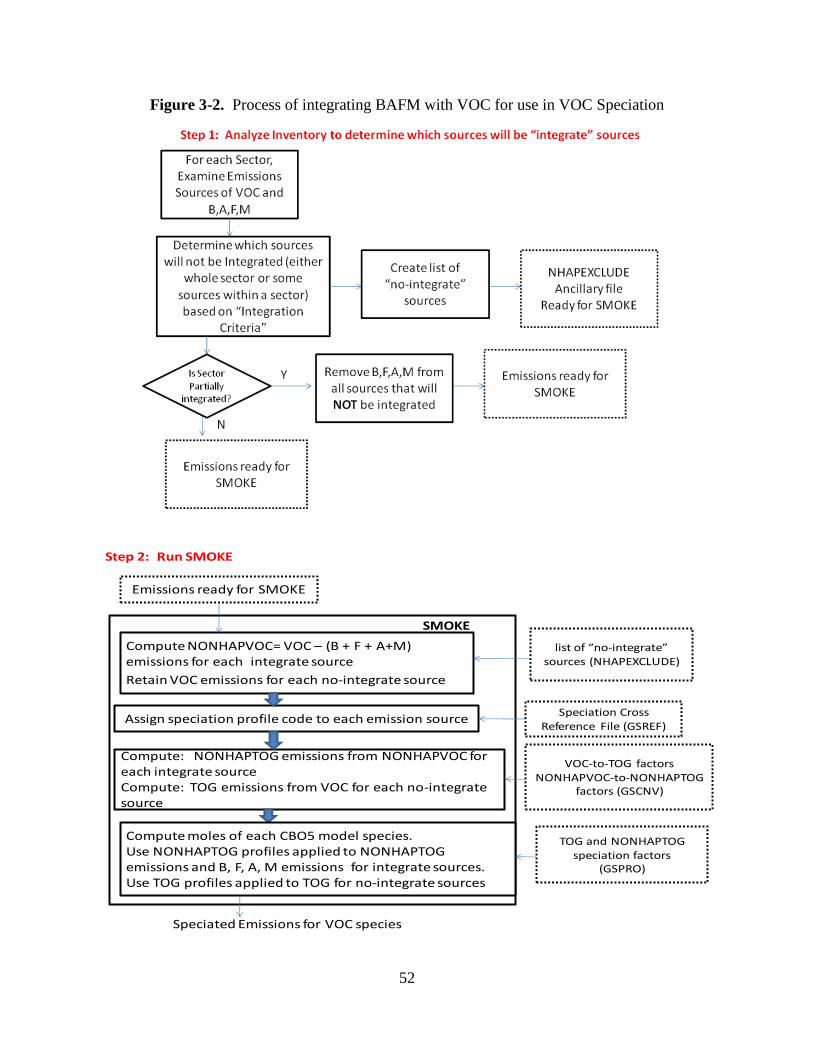
52
Figure 3-2. Process of integrating BAFM with VOC for use in VOC Speciation
Emissions ready for SMOKE
list of “no-integrate” sources (NHAPEXCLUDE)
Compute NONHAPVOC= VOC – (B + F + A+M) emissions for each integrate source
Retain VOC emissions for each no-integrate source
Assign speciation profile code to each emission source
Compute: NONHAPTOG emissions from NONHAPVOC for each integrate source Compute: TOG emissions from VOC for each no-integrate source
TOG and NONHAPTOG speciation factors
(GSPRO)
Speciation Cross Reference File (GSREF)
SMOKE
Compute moles of each CBO5 model species. Use NONHAPTOG profiles applied to NONHAPTOG emissions and B, F, A, M emissions for integrate sources.Use TOG profiles applied to TOG for no-integrate sources
Speciated Emissions for VOC species
VOC-to-TOG factorsNONHAPVOC-to-NONHAPTOG
factors (GSCNV)
Step 2: Run SMOKE
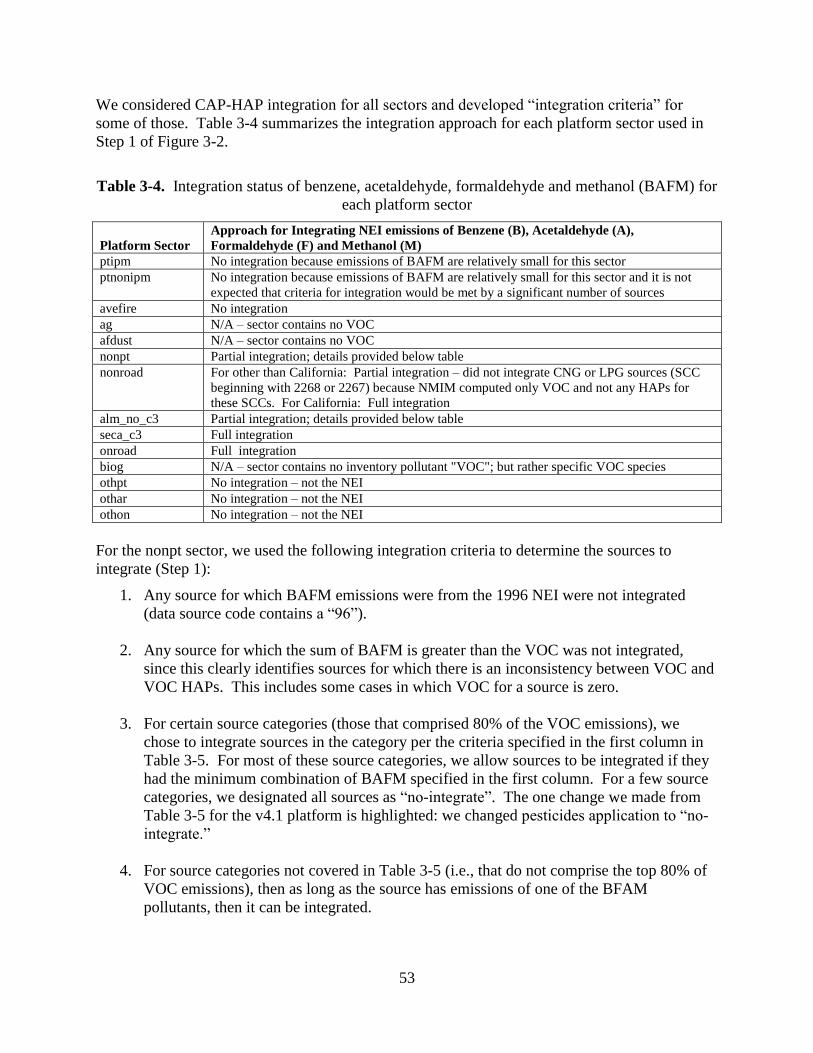
53
We considered CAP-HAP integration for all sectors and developed ―integration criteria‖ for
some of those. Table 3-4 summarizes the integration approach for each platform sector used in
Step 1 of Figure 3-2.
Table 3-4. Integration status of benzene, acetaldehyde, formaldehyde and methanol (BAFM) for
each platform sector
Platform Sector
Approach for Integrating NEI emissions of Benzene (B), Acetaldehyde (A),
Formaldehyde (F) and Methanol (M)
ptipm No integration because emissions of BAFM are relatively small for this sector
ptnonipm No integration because emissions of BAFM are relatively small for this sector and it is not
expected that criteria for integration would be met by a significant number of sources
avefire No integration
ag N/A – sector contains no VOC
afdust N/A – sector contains no VOC
nonpt Partial integration; details provided below table
nonroad For other than California: Partial integration – did not integrate CNG or LPG sources (SCC
beginning with 2268 or 2267) because NMIM computed only VOC and not any HAPs for
these SCCs. For California: Full integration
alm_no_c3 Partial integration; details provided below table
seca_c3 Full integration
onroad Full integration
biog N/A – sector contains no inventory pollutant "VOC"; but rather specific VOC species
othpt No integration – not the NEI
othar No integration – not the NEI
othon No integration – not the NEI
For the nonpt sector, we used the following integration criteria to determine the sources to
integrate (Step 1):
1. Any source for which BAFM emissions were from the 1996 NEI were not integrated
(data source code contains a ―96‖).
2. Any source for which the sum of BAFM is greater than the VOC was not integrated,
since this clearly identifies sources for which there is an inconsistency between VOC and
VOC HAPs. This includes some cases in which VOC for a source is zero.
3. For certain source categories (those that comprised 80% of the VOC emissions), we
chose to integrate sources in the category per the criteria specified in the first column in
Table 3-5. For most of these source categories, we allow sources to be integrated if they
had the minimum combination of BAFM specified in the first column. For a few source
categories, we designated all sources as ―no-integrate‖. The one change we made from
Table 3-5 for the v4.1 platform is highlighted: we changed pesticides application to ―no-
integrate.‖
4. For source categories not covered in Table 3-5 (i.e., that do not comprise the top 80% of
VOC emissions), then as long as the source has emissions of one of the BFAM
pollutants, then it can be integrated.
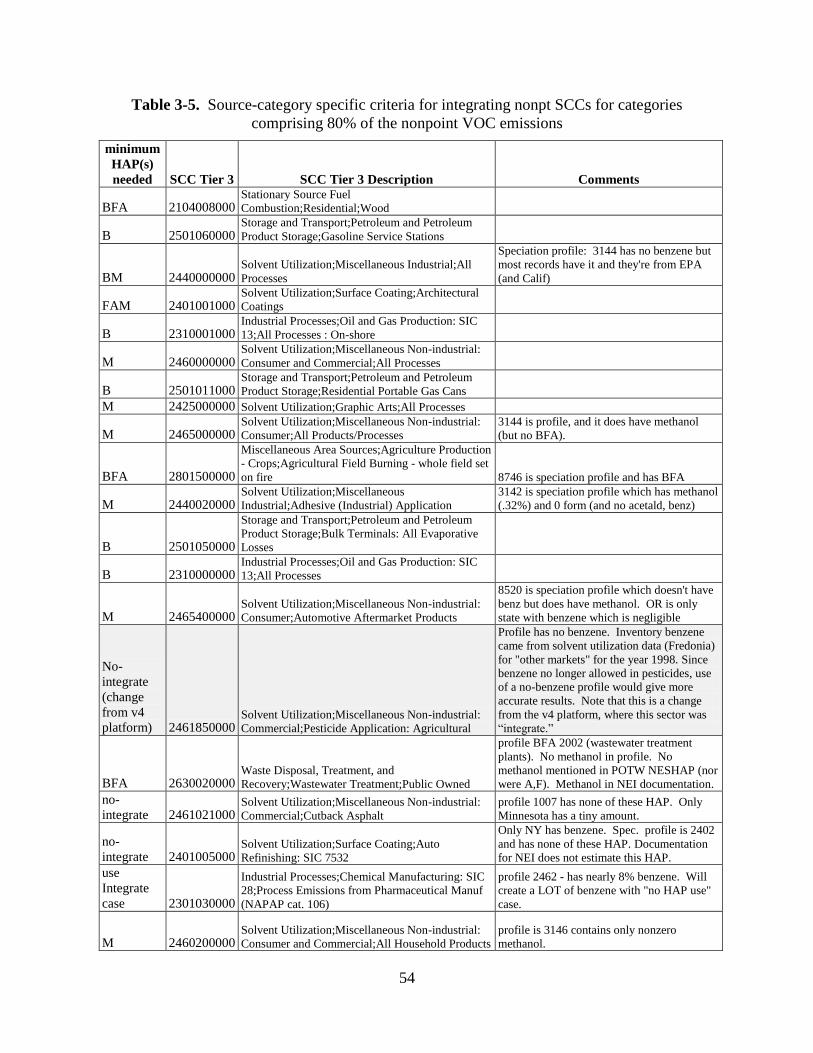
54
Table 3-5. Source-category specific criteria for integrating nonpt SCCs for categories
comprising 80% of the nonpoint VOC emissions
minimum
HAP(s)
needed SCC Tier 3 SCC Tier 3 Description Comments
BFA 2104008000 Stationary Source Fuel
Combustion;Residential;Wood
B 2501060000 Storage and Transport;Petroleum and Petroleum
Product Storage;Gasoline Service Stations
BM 2440000000 Solvent Utilization;Miscellaneous Industrial;All
Processes
Speciation profile: 3144 has no benzene but
most records have it and they're from EPA
(and Calif)
FAM 2401001000 Solvent Utilization;Surface Coating;Architectural
Coatings
B 2310001000 Industrial Processes;Oil and Gas Production: SIC
13;All Processes : On-shore
M 2460000000 Solvent Utilization;Miscellaneous Non-industrial:
Consumer and Commercial;All Processes
B 2501011000 Storage and Transport;Petroleum and Petroleum
Product Storage;Residential Portable Gas Cans
M 2425000000 Solvent Utilization;Graphic Arts;All Processes
M 2465000000 Solvent Utilization;Miscellaneous Non-industrial:
Consumer;All Products/Processes
3144 is profile, and it does have methanol
(but no BFA).
BFA 2801500000
Miscellaneous Area Sources;Agriculture Production
- Crops;Agricultural Field Burning - whole field set
on fire 8746 is speciation profile and has BFA
M 2440020000 Solvent Utilization;Miscellaneous
Industrial;Adhesive (Industrial) Application
3142 is speciation profile which has methanol
(.32%) and 0 form (and no acetald, benz)
B 2501050000
Storage and Transport;Petroleum and Petroleum
Product Storage;Bulk Terminals: All Evaporative
Losses
B 2310000000 Industrial Processes;Oil and Gas Production: SIC
13;All Processes
M 2465400000 Solvent Utilization;Miscellaneous Non-industrial:
Consumer;Automotive Aftermarket Products
8520 is speciation profile which doesn't have
benz but does have methanol. OR is only
state with benzene which is negligible
No-
integrate
(change
from v4
platform) 2461850000 Solvent Utilization;Miscellaneous Non-industrial:
Commercial;Pesticide Application: Agricultural
Profile has no benzene. Inventory benzene
came from solvent utilization data (Fredonia)
for "other markets" for the year 1998. Since
benzene no longer allowed in pesticides, use
of a no-benzene profile would give more
accurate results. Note that this is a change
from the v4 platform, where this sector was
―integrate.‖
BFA 2630020000 Waste Disposal, Treatment, and
Recovery;Wastewater Treatment;Public Owned
profile BFA 2002 (wastewater treatment
plants). No methanol in profile. No
methanol mentioned in POTW NESHAP (nor
were A,F). Methanol in NEI documentation.
no-
integrate 2461021000 Solvent Utilization;Miscellaneous Non-industrial:
Commercial;Cutback Asphalt
profile 1007 has none of these HAP. Only
Minnesota has a tiny amount.
no-
integrate 2401005000 Solvent Utilization;Surface Coating;Auto
Refinishing: SIC 7532
Only NY has benzene. Spec. profile is 2402
and has none of these HAP. Documentation
for NEI does not estimate this HAP.
use
Integrate
case 2301030000
Industrial Processes;Chemical Manufacturing: SIC
28;Process Emissions from Pharmaceutical Manuf
(NAPAP cat. 106)
profile 2462 - has nearly 8% benzene. Will
create a LOT of benzene with "no HAP use"
case.
M 2460200000 Solvent Utilization;Miscellaneous Non-industrial:
Consumer and Commercial;All Household Products
profile is 3146 contains only nonzero
methanol.
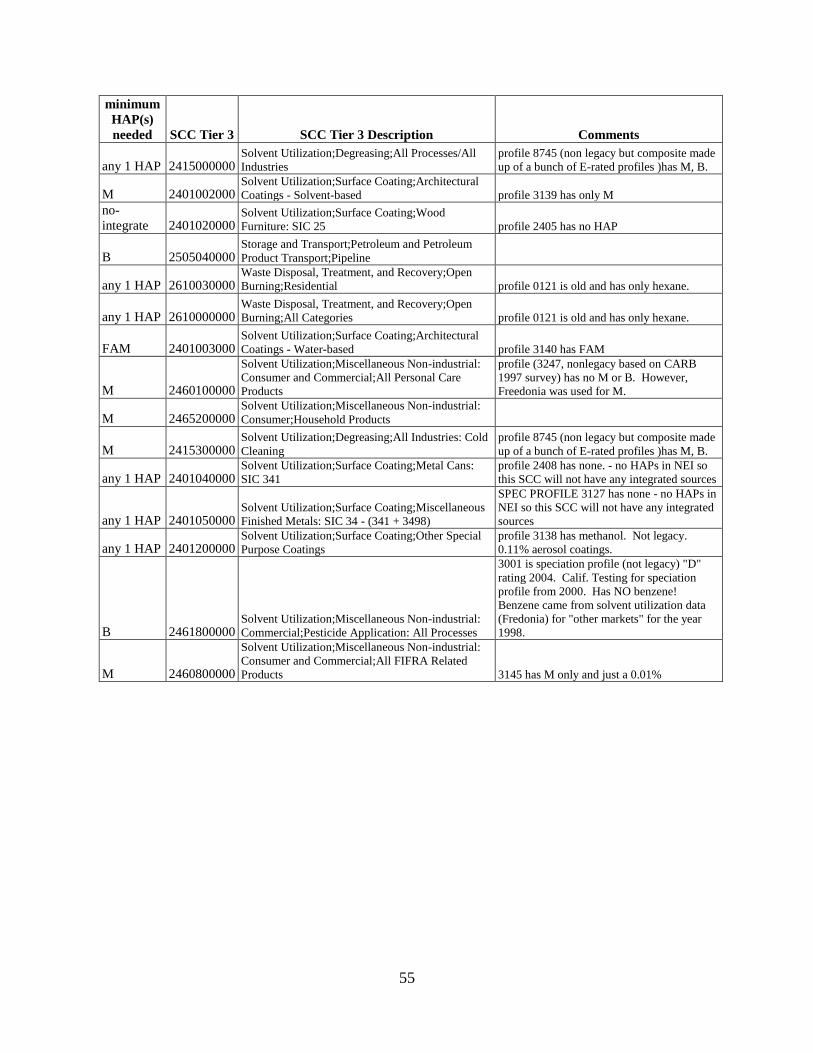
55
minimum
HAP(s)
needed SCC Tier 3 SCC Tier 3 Description Comments
any 1 HAP 2415000000 Solvent Utilization;Degreasing;All Processes/All
Industries
profile 8745 (non legacy but composite made
up of a bunch of E-rated profiles )has M, B.
M 2401002000 Solvent Utilization;Surface Coating;Architectural
Coatings - Solvent-based profile 3139 has only M
no-
integrate 2401020000 Solvent Utilization;Surface Coating;Wood
Furniture: SIC 25 profile 2405 has no HAP
B 2505040000 Storage and Transport;Petroleum and Petroleum
Product Transport;Pipeline
any 1 HAP 2610030000 Waste Disposal, Treatment, and Recovery;Open
Burning;Residential profile 0121 is old and has only hexane.
any 1 HAP 2610000000 Waste Disposal, Treatment, and Recovery;Open
Burning;All Categories profile 0121 is old and has only hexane.
FAM 2401003000 Solvent Utilization;Surface Coating;Architectural
Coatings - Water-based profile 3140 has FAM
M 2460100000
Solvent Utilization;Miscellaneous Non-industrial:
Consumer and Commercial;All Personal Care
Products
profile (3247, nonlegacy based on CARB
1997 survey) has no M or B. However,
Freedonia was used for M.
M 2465200000 Solvent Utilization;Miscellaneous Non-industrial:
Consumer;Household Products
M 2415300000 Solvent Utilization;Degreasing;All Industries: Cold
Cleaning
profile 8745 (non legacy but composite made
up of a bunch of E-rated profiles )has M, B.
any 1 HAP 2401040000 Solvent Utilization;Surface Coating;Metal Cans:
SIC 341
profile 2408 has none. - no HAPs in NEI so
this SCC will not have any integrated sources
any 1 HAP 2401050000 Solvent Utilization;Surface Coating;Miscellaneous
Finished Metals: SIC 34 - (341 + 3498)
SPEC PROFILE 3127 has none - no HAPs in
NEI so this SCC will not have any integrated
sources
any 1 HAP 2401200000 Solvent Utilization;Surface Coating;Other Special
Purpose Coatings
profile 3138 has methanol. Not legacy.
0.11% aerosol coatings.
B 2461800000 Solvent Utilization;Miscellaneous Non-industrial:
Commercial;Pesticide Application: All Processes
3001 is speciation profile (not legacy) "D"
rating 2004. Calif. Testing for speciation
profile from 2000. Has NO benzene!
Benzene came from solvent utilization data
(Fredonia) for "other markets" for the year
1998.
M 2460800000
Solvent Utilization;Miscellaneous Non-industrial:
Consumer and Commercial;All FIFRA Related
Products 3145 has M only and just a 0.01%
56
For the alm_no_c3 sector, the integration criteria were (1) that the source had to have at least one
of the 4 HAPs and (2) that the sum of BAFM could not exceed the VOC emissions. The criteria
for this sector were less complex than the nonpt sector because it has much fewer source
categories.
We used the SMOKE feature to compute speciation profiles from mixtures of other profiles in
user-specified proportions. The combinations are specified in the GSPRO_COMBO ancillary
file by pollutant (including pollutant mode, e.g., EXH__VOC), state and county (i.e.,
state/county FIPS code) and time period (i.e., month).
We used this feature for onroad and nonroad mobile and gasoline-related related stationary
sources whereby the emission sources use fuels with varying ethanol content, and therefore the
speciation profiles require different combinations of gasoline, E10 an E85 profiles. Since the
ethanol content varies spatially (e.g., by state or county), temporally (e.g., by month) and by
modeling year (future years have more ethanol) the feature allows combinations to be specified
at various levels for different years.
3.1.2.2 Creation of model-ready mercury species
As part of 2005 platform, we created model-ready mercury species by speciating any of the
mercury in the NEI that was not provided as divalent gaseous, elemental or divalent particulate
mercury. The same speciation approach was used in the CAP and HAP 2002v3 platform.
For the EGU sector (ptipm), all emissions except for 0.97 tons of the 52.9 tons of total 2005 Hg
was provided in the inventory as speciated emissions. The unspeciated Hg are primarily
associated with oil-fired units. The speciation of the coal units was retained from the 2002
inventory, since 2005 EGU emissions were based on applying a 2005-to-2002 heat input ratio to
the 2002 EGU emissions.
3.1.3 Temporal processing configuration
Table 3-6 summarizes the temporal aspect of the emissions processing configuration. It
compares the key approaches we used for temporal processing across the sectors. We control the
temporal aspect of SMOKE processing through (a) the scripts L_TYPE (temporal type) and
M_TYPE (merge type) settings and (b) the ancillary data files described in Section 3.2.3. The
one change made from the v4 to the v4.1 platform is the treatment of the afdust sector. In the v4
platform we used ―aveday‖ settings and no use of holidays such that every day in a specific
month had the same emissions. In the v4.1 platform, we used ―week‖ settings and holidays and
used profiles which were day-of-week dependent for some categories, such as road dust and
tilling, where non-uniform profiles were being used for other pollutants associated with these
processes.
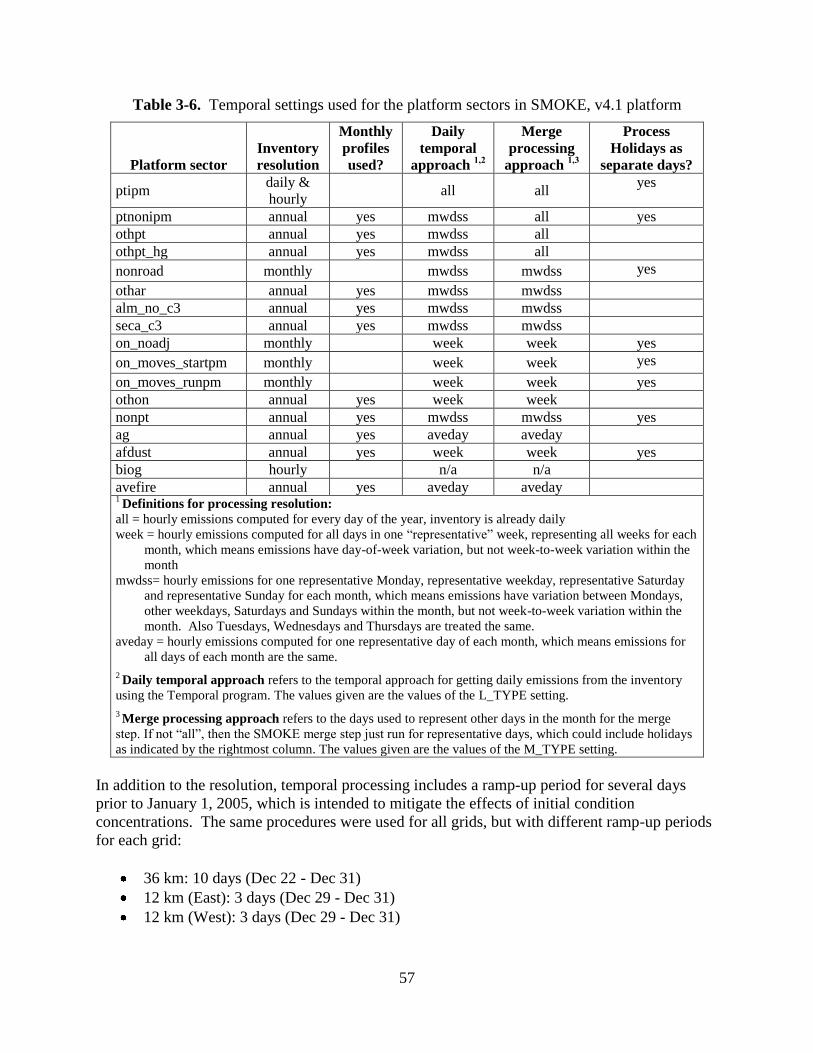
57
Table 3-6. Temporal settings used for the platform sectors in SMOKE, v4.1 platform
Platform sector
Inventory
resolution
Monthly
profiles
used?
Daily
temporal
approach 1,2
Merge
processing
approach 1,3
Process
Holidays as
separate days?
ptipm daily &
hourly all all
yes
ptnonipm annual yes mwdss all yes
othpt annual yes mwdss all
othpt_hg annual yes mwdss all
nonroad monthly mwdss mwdss yes
othar annual yes mwdss mwdss
alm_no_c3 annual yes mwdss mwdss
seca_c3 annual yes mwdss mwdss
on_noadj monthly week week yes
on_moves_startpm monthly week week yes
on_moves_runpm monthly week week yes
othon annual yes week week
nonpt annual yes mwdss mwdss yes
ag annual yes aveday aveday
afdust annual yes week week yes
biog hourly n/a n/a
avefire annual yes aveday aveday 1 Definitions for processing resolution:
all = hourly emissions computed for every day of the year, inventory is already daily
week = hourly emissions computed for all days in one ―representative‖ week, representing all weeks for each
month, which means emissions have day-of-week variation, but not week-to-week variation within the
month
mwdss= hourly emissions for one representative Monday, representative weekday, representative Saturday
and representative Sunday for each month, which means emissions have variation between Mondays,
other weekdays, Saturdays and Sundays within the month, but not week-to-week variation within the
month. Also Tuesdays, Wednesdays and Thursdays are treated the same.
aveday = hourly emissions computed for one representative day of each month, which means emissions for
all days of each month are the same.
2 Daily temporal approach refers to the temporal approach for getting daily emissions from the inventory
using the Temporal program. The values given are the values of the L_TYPE setting.
3 Merge processing approach refers to the days used to represent other days in the month for the merge
step. If not ―all‖, then the SMOKE merge step just run for representative days, which could include holidays
as indicated by the rightmost column. The values given are the values of the M_TYPE setting.
In addition to the resolution, temporal processing includes a ramp-up period for several days
prior to January 1, 2005, which is intended to mitigate the effects of initial condition
concentrations. The same procedures were used for all grids, but with different ramp-up periods
for each grid:
36 km: 10 days (Dec 22 - Dec 31)
12 km (East): 3 days (Dec 29 - Dec 31)
12 km (West): 3 days (Dec 29 - Dec 31)
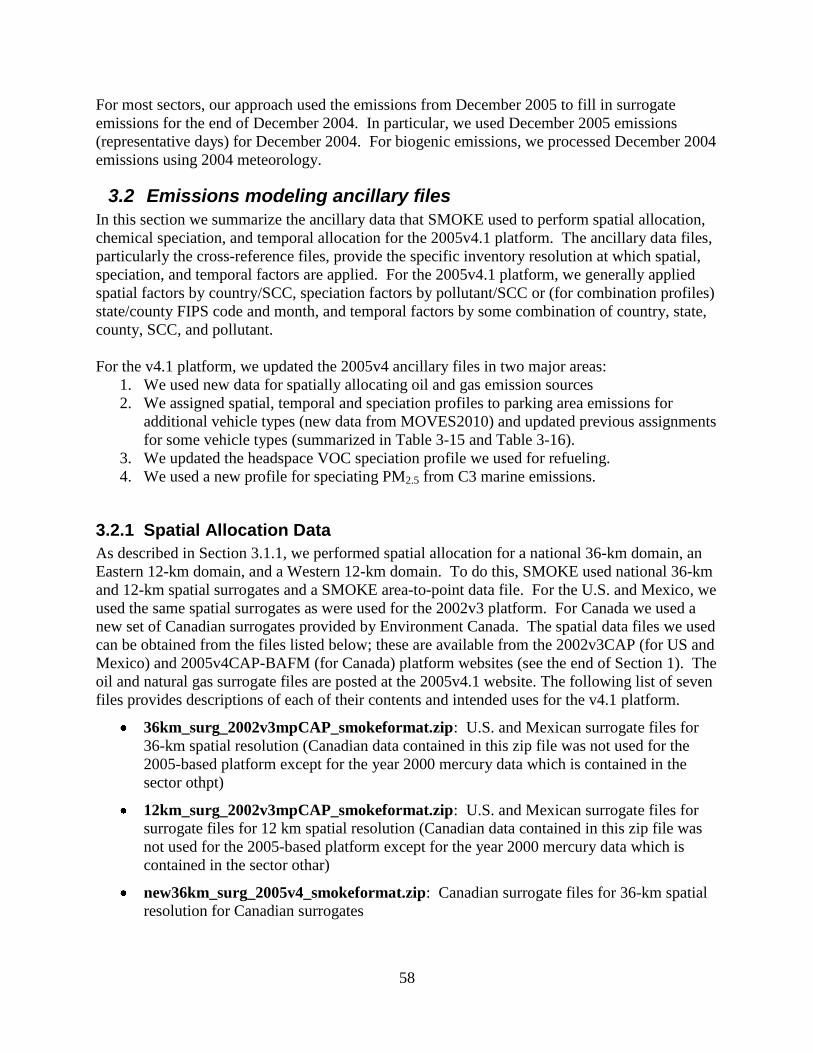
58
For most sectors, our approach used the emissions from December 2005 to fill in surrogate
emissions for the end of December 2004. In particular, we used December 2005 emissions
(representative days) for December 2004. For biogenic emissions, we processed December 2004
emissions using 2004 meteorology.
3.2 Emissions modeling ancillary files
In this section we summarize the ancillary data that SMOKE used to perform spatial allocation,
chemical speciation, and temporal allocation for the 2005v4.1 platform. The ancillary data files,
particularly the cross-reference files, provide the specific inventory resolution at which spatial,
speciation, and temporal factors are applied. For the 2005v4.1 platform, we generally applied
spatial factors by country/SCC, speciation factors by pollutant/SCC or (for combination profiles)
state/county FIPS code and month, and temporal factors by some combination of country, state,
county, SCC, and pollutant.
For the v4.1 platform, we updated the 2005v4 ancillary files in two major areas:
1. We used new data for spatially allocating oil and gas emission sources
2. We assigned spatial, temporal and speciation profiles to parking area emissions for
additional vehicle types (new data from MOVES2010) and updated previous assignments
for some vehicle types (summarized in Table 3-15 and Table 3-16).
3. We updated the headspace VOC speciation profile we used for refueling.
4. We used a new profile for speciating PM2.5 from C3 marine emissions.
3.2.1 Spatial Allocation Data
As described in Section 3.1.1, we performed spatial allocation for a national 36-km domain, an
Eastern 12-km domain, and a Western 12-km domain. To do this, SMOKE used national 36-km
and 12-km spatial surrogates and a SMOKE area-to-point data file. For the U.S. and Mexico, we
used the same spatial surrogates as were used for the 2002v3 platform. For Canada we used a
new set of Canadian surrogates provided by Environment Canada. The spatial data files we used
can be obtained from the files listed below; these are available from the 2002v3CAP (for US and
Mexico) and 2005v4CAP-BAFM (for Canada) platform websites (see the end of Section 1). The
oil and natural gas surrogate files are posted at the 2005v4.1 website. The following list of seven
files provides descriptions of each of their contents and intended uses for the v4.1 platform.
36km_surg_2002v3mpCAP_smokeformat.zip: U.S. and Mexican surrogate files for
36-km spatial resolution (Canadian data contained in this zip file was not used for the
2005-based platform except for the year 2000 mercury data which is contained in the
sector othpt)
12km_surg_2002v3mpCAP_smokeformat.zip: U.S. and Mexican surrogate files for
surrogate files for 12 km spatial resolution (Canadian data contained in this zip file was
not used for the 2005-based platform except for the year 2000 mercury data which is
contained in the sector othar)
new36km_surg_2005v4_smokeformat.zip: Canadian surrogate files for 36-km spatial
resolution for Canadian surrogates
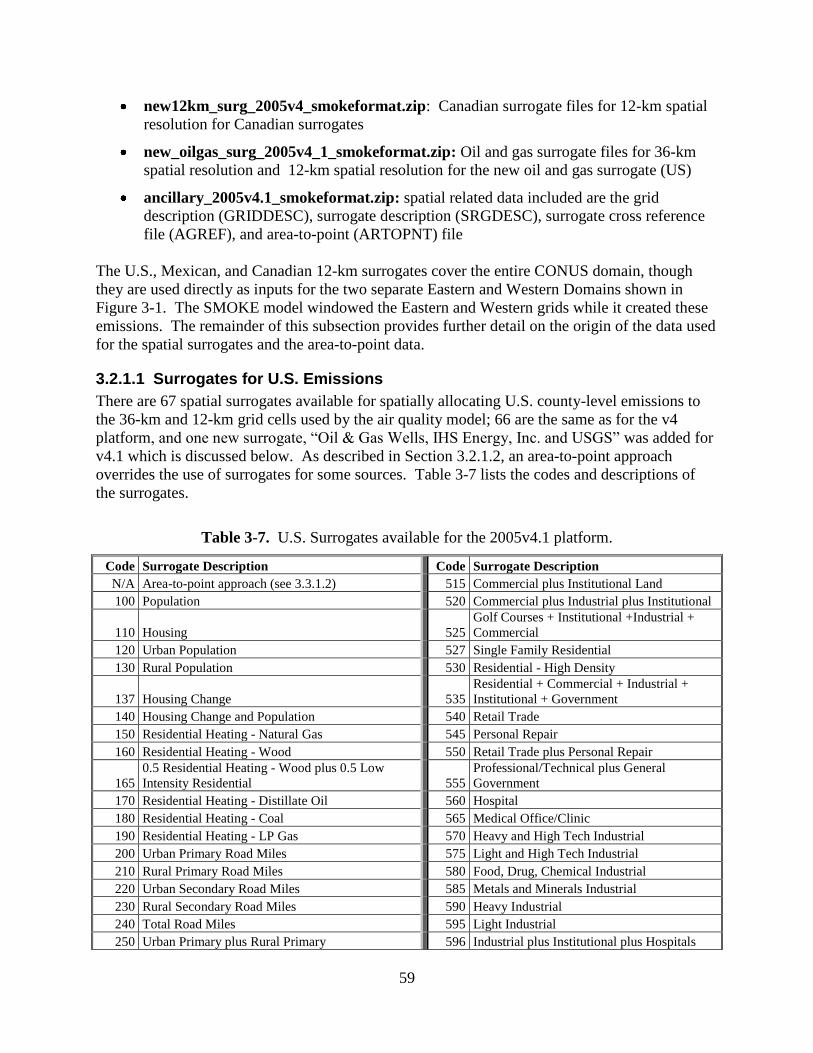
59
new12km_surg_2005v4_smokeformat.zip: Canadian surrogate files for 12-km spatial
resolution for Canadian surrogates
new_oilgas_surg_2005v4_1_smokeformat.zip: Oil and gas surrogate files for 36-km
spatial resolution and 12-km spatial resolution for the new oil and gas surrogate (US)
ancillary_2005v4.1_smokeformat.zip: spatial related data included are the grid
description (GRIDDESC), surrogate description (SRGDESC), surrogate cross reference
file (AGREF), and area-to-point (ARTOPNT) file
The U.S., Mexican, and Canadian 12-km surrogates cover the entire CONUS domain, though
they are used directly as inputs for the two separate Eastern and Western Domains shown in
Figure 3-1. The SMOKE model windowed the Eastern and Western grids while it created these
emissions. The remainder of this subsection provides further detail on the origin of the data used
for the spatial surrogates and the area-to-point data.
3.2.1.1 Surrogates for U.S. Emissions
There are 67 spatial surrogates available for spatially allocating U.S. county-level emissions to
the 36-km and 12-km grid cells used by the air quality model; 66 are the same as for the v4
platform, and one new surrogate, ―Oil & Gas Wells, IHS Energy, Inc. and USGS‖ was added for
v4.1 which is discussed below. As described in Section 3.2.1.2, an area-to-point approach
overrides the use of surrogates for some sources. Table 3-7 lists the codes and descriptions of
the surrogates.
Table 3-7. U.S. Surrogates available for the 2005v4.1 platform.
Code Surrogate Description Code Surrogate Description
N/A Area-to-point approach (see 3.3.1.2) 515 Commercial plus Institutional Land
100 Population 520 Commercial plus Industrial plus Institutional
110 Housing 525
Golf Courses + Institutional +Industrial +
Commercial
120 Urban Population 527 Single Family Residential
130 Rural Population 530 Residential - High Density
137 Housing Change 535
Residential + Commercial + Industrial +
Institutional + Government
140 Housing Change and Population 540 Retail Trade
150 Residential Heating - Natural Gas 545 Personal Repair
160 Residential Heating - Wood 550 Retail Trade plus Personal Repair
165
0.5 Residential Heating - Wood plus 0.5 Low
Intensity Residential 555
Professional/Technical plus General
Government
170 Residential Heating - Distillate Oil 560 Hospital
180 Residential Heating - Coal 565 Medical Office/Clinic
190 Residential Heating - LP Gas 570 Heavy and High Tech Industrial
200 Urban Primary Road Miles 575 Light and High Tech Industrial
210 Rural Primary Road Miles 580 Food, Drug, Chemical Industrial
220 Urban Secondary Road Miles 585 Metals and Minerals Industrial
230 Rural Secondary Road Miles 590 Heavy Industrial
240 Total Road Miles 595 Light Industrial
250 Urban Primary plus Rural Primary 596 Industrial plus Institutional plus Hospitals
60
Code Surrogate Description Code Surrogate Description
255 0.75 Total Roadway Miles plus 0.25 Population 600 Gas Stations
260 Total Railroad Miles 650 Refineries and Tank Farms
270 Class 1 Railroad Miles 675 Refineries and Tank Farms and Gas Stations
280 Class 2 and 3 Railroad Miles 680
Oil & Gas Wells, IHS Energy, Inc. and
USGS
300 Low Intensity Residential 700 Airport Areas
310 Total Agriculture 710 Airport Points
312 Orchards/Vineyards 720 Military Airports
320 Forest Land 800 Marine Ports
330 Strip Mines/Quarries 807 Navigable Waterway Miles
340 Land 810 Navigable Waterway Activity
350 Water 850 Golf Courses
400 Rural Land Area 860 Mines
500 Commercial Land 870 Wastewater Treatment Facilities
505 Industrial Land 880 Drycleaners
510 Commercial plus Industrial 890 Commercial Timber
We did not use all of the available surrogates to spatially allocate sources in the v4.1 platform;
that is, some surrogates in Table 3-7 were not assigned to any SCCs.
The creation of surrogates and shapefiles for the U.S. via the Surrogate Tool was discussed in the
2002v3 platform documentation and is not repeated here. The tool and updated documentation
for it is available at http://www.ie.unc.edu/cempd/projects/mims/spatial/ and
http://www.cmascenter.org/help/documentation.cfm?MODEL=spatial_allocator&VERSION=3.
6&temp_id=99999. This same tool was used for the new surrogate 680, ―Oil & Gas Wells, IHS
Energy, Inc. and USGS‖
The new surrogate ―Oil & Gas Wells, IHS Energy, Inc. and USGS‖ was developed for oil and
gas SCCs, which had previously (in the v4 platform) used surrogate 585. The data reflect data
through 10/1/2005. The underlying data for this surrogate is a grid of one-quarter square mile
cells containing an attribute to indicate whether the wells within the cell are predominantly oil-
producing, gas-producing, both oil- and gas-producing, or the wells are dry or their production
status is unknown. The well information was initially retrieved from IHS Inc.'s PI/Dwights
PLUS Well Data on CD-ROM, which is a proprietary commercial database containing
information for most oil and gas wells in the U.S. Cells were developed as a graphic solution to
overcome the problem of displaying proprietary well data. No proprietary data are displayed or
included in the cell maps. More information can be obtained from http://pubs.usgs.gov/dds/dds-
069/dds-069-q/text/layer.htm and
http://certmapper.cr.usgs.gov/rooms/utilities/layer_info.jsp?docId={A90AF432-612F-41F9-
A315-
7329FD933FB3}&type=download&docURL=http://certmapper.cr.usgs.gov/data/noga00/natl/sp
atial/doc/uscells05g.htm
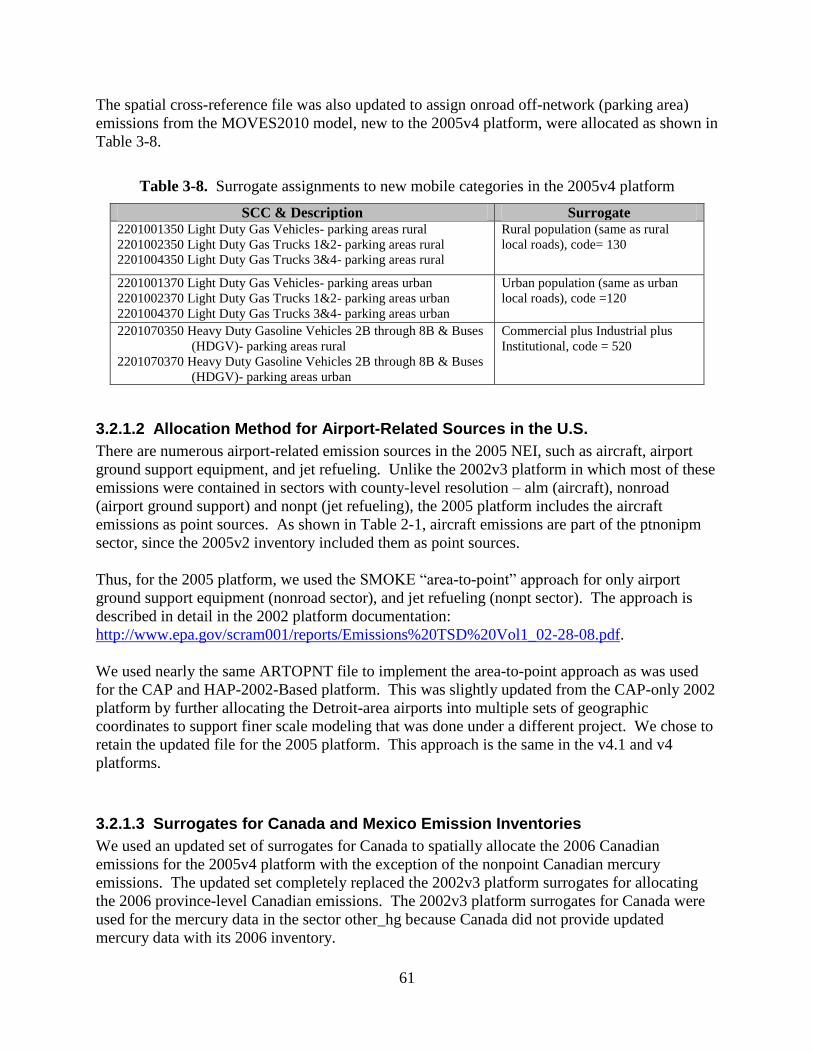
61
The spatial cross-reference file was also updated to assign onroad off-network (parking area)
emissions from the MOVES2010 model, new to the 2005v4 platform, were allocated as shown in
Table 3-8.
Table 3-8. Surrogate assignments to new mobile categories in the 2005v4 platform
SCC & Description Surrogate 2201001350 Light Duty Gas Vehicles- parking areas rural
2201002350 Light Duty Gas Trucks 1&2- parking areas rural
2201004350 Light Duty Gas Trucks 3&4- parking areas rural
Rural population (same as rural
local roads), code= 130
2201001370 Light Duty Gas Vehicles- parking areas urban
2201002370 Light Duty Gas Trucks 1&2- parking areas urban
2201004370 Light Duty Gas Trucks 3&4- parking areas urban
Urban population (same as urban
local roads), code =120
2201070350 Heavy Duty Gasoline Vehicles 2B through 8B & Buses
(HDGV)- parking areas rural
2201070370 Heavy Duty Gasoline Vehicles 2B through 8B & Buses
(HDGV)- parking areas urban
Commercial plus Industrial plus
Institutional, code = 520
3.2.1.2 Allocation Method for Airport-Related Sources in the U.S.
There are numerous airport-related emission sources in the 2005 NEI, such as aircraft, airport
ground support equipment, and jet refueling. Unlike the 2002v3 platform in which most of these
emissions were contained in sectors with county-level resolution – alm (aircraft), nonroad
(airport ground support) and nonpt (jet refueling), the 2005 platform includes the aircraft
emissions as point sources. As shown in Table 2-1, aircraft emissions are part of the ptnonipm
sector, since the 2005v2 inventory included them as point sources.
Thus, for the 2005 platform, we used the SMOKE ―area-to-point‖ approach for only airport
ground support equipment (nonroad sector), and jet refueling (nonpt sector). The approach is
described in detail in the 2002 platform documentation:
http://www.epa.gov/scram001/reports/Emissions%20TSD%20Vol1_02-28-08.pdf.
We used nearly the same ARTOPNT file to implement the area-to-point approach as was used
for the CAP and HAP-2002-Based platform. This was slightly updated from the CAP-only 2002
platform by further allocating the Detroit-area airports into multiple sets of geographic
coordinates to support finer scale modeling that was done under a different project. We chose to
retain the updated file for the 2005 platform. This approach is the same in the v4.1 and v4
platforms.
3.2.1.3 Surrogates for Canada and Mexico Emission Inventories
We used an updated set of surrogates for Canada to spatially allocate the 2006 Canadian
emissions for the 2005v4 platform with the exception of the nonpoint Canadian mercury
emissions. The updated set completely replaced the 2002v3 platform surrogates for allocating
the 2006 province-level Canadian emissions. The 2002v3 platform surrogates for Canada were
used for the mercury data in the sector other_hg because Canada did not provide updated
mercury data with its 2006 inventory.
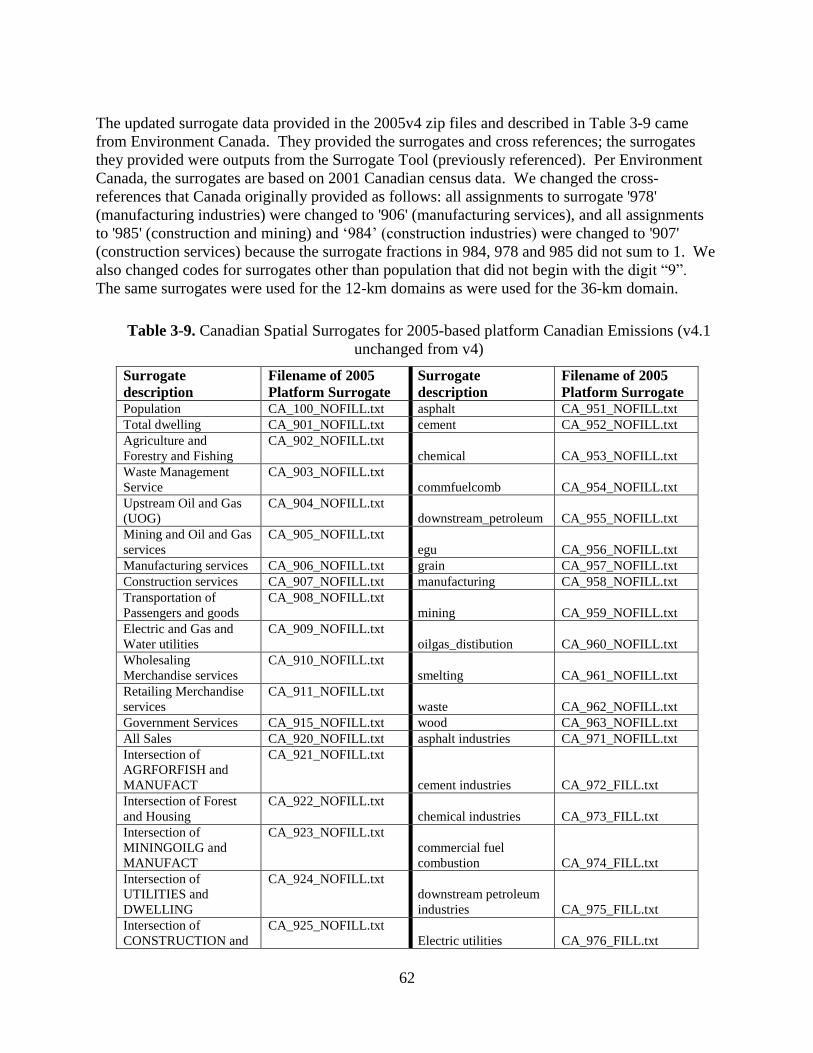
62
The updated surrogate data provided in the 2005v4 zip files and described in Table 3-9 came
from Environment Canada. They provided the surrogates and cross references; the surrogates
they provided were outputs from the Surrogate Tool (previously referenced). Per Environment
Canada, the surrogates are based on 2001 Canadian census data. We changed the cross-
references that Canada originally provided as follows: all assignments to surrogate '978'
(manufacturing industries) were changed to '906' (manufacturing services), and all assignments
to '985' (construction and mining) and ‗984‘ (construction industries) were changed to '907'
(construction services) because the surrogate fractions in 984, 978 and 985 did not sum to 1. We
also changed codes for surrogates other than population that did not begin with the digit ―9‖.
The same surrogates were used for the 12-km domains as were used for the 36-km domain.
Table 3-9. Canadian Spatial Surrogates for 2005-based platform Canadian Emissions (v4.1
unchanged from v4)
Surrogate
description
Filename of 2005
Platform Surrogate
Surrogate
description
Filename of 2005
Platform Surrogate Population CA_100_NOFILL.txt asphalt CA_951_NOFILL.txt
Total dwelling CA_901_NOFILL.txt cement CA_952_NOFILL.txt
Agriculture and
Forestry and Fishing
CA_902_NOFILL.txt
chemical CA_953_NOFILL.txt
Waste Management
Service
CA_903_NOFILL.txt
commfuelcomb CA_954_NOFILL.txt
Upstream Oil and Gas
(UOG)
CA_904_NOFILL.txt
downstream_petroleum CA_955_NOFILL.txt
Mining and Oil and Gas
services
CA_905_NOFILL.txt
egu CA_956_NOFILL.txt
Manufacturing services CA_906_NOFILL.txt grain CA_957_NOFILL.txt
Construction services CA_907_NOFILL.txt manufacturing CA_958_NOFILL.txt
Transportation of
Passengers and goods
CA_908_NOFILL.txt
mining CA_959_NOFILL.txt
Electric and Gas and
Water utilities
CA_909_NOFILL.txt
oilgas_distibution CA_960_NOFILL.txt
Wholesaling
Merchandise services
CA_910_NOFILL.txt
smelting CA_961_NOFILL.txt
Retailing Merchandise
services
CA_911_NOFILL.txt
waste CA_962_NOFILL.txt
Government Services CA_915_NOFILL.txt wood CA_963_NOFILL.txt
All Sales CA_920_NOFILL.txt asphalt industries CA_971_NOFILL.txt
Intersection of
AGRFORFISH and
MANUFACT
CA_921_NOFILL.txt
cement industries CA_972_FILL.txt
Intersection of Forest
and Housing
CA_922_NOFILL.txt
chemical industries CA_973_FILL.txt
Intersection of
MININGOILG and
MANUFACT
CA_923_NOFILL.txt
commercial fuel
combustion CA_974_FILL.txt
Intersection of
UTILITIES and
DWELLING
CA_924_NOFILL.txt
downstream petroleum
industries CA_975_FILL.txt
Intersection of
CONSTRUCTION and
CA_925_NOFILL.txt
Electric utilities CA_976_FILL.txt
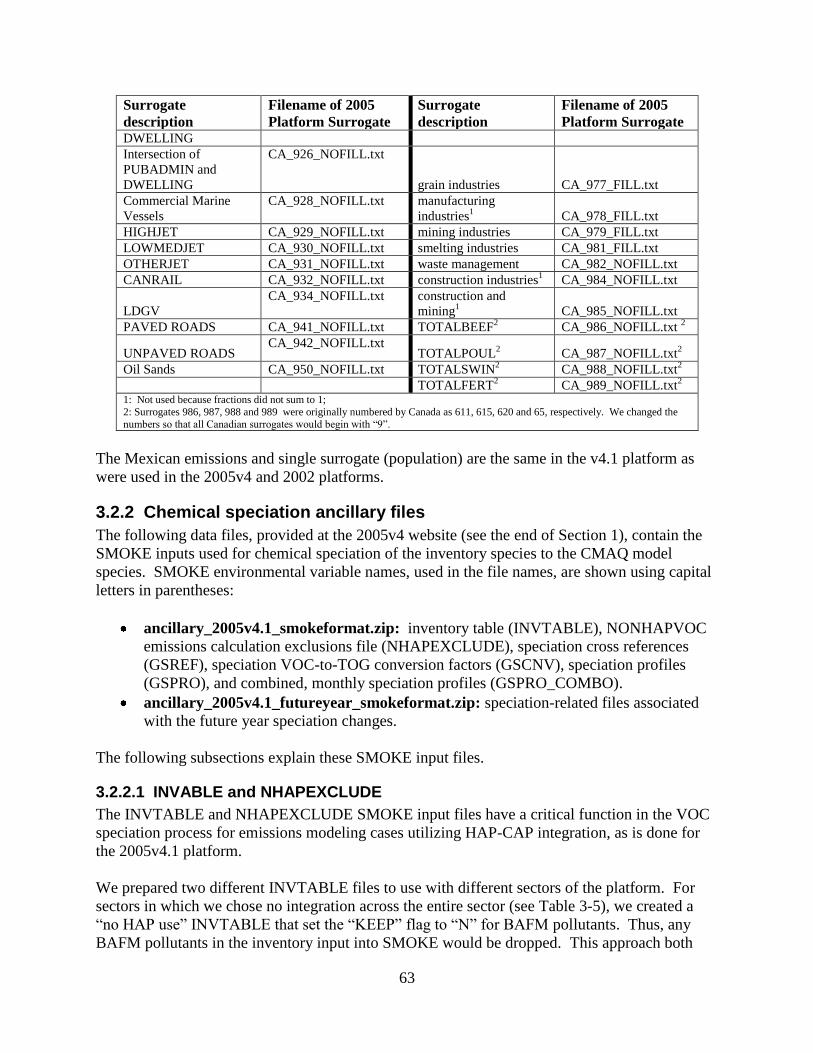
63
Surrogate
description
Filename of 2005
Platform Surrogate
Surrogate
description
Filename of 2005
Platform Surrogate DWELLING
Intersection of
PUBADMIN and
DWELLING
CA_926_NOFILL.txt
grain industries CA_977_FILL.txt
Commercial Marine
Vessels
CA_928_NOFILL.txt manufacturing
industries1
CA_978_FILL.txt
HIGHJET CA_929_NOFILL.txt mining industries CA_979_FILL.txt
LOWMEDJET CA_930_NOFILL.txt smelting industries CA_981_FILL.txt
OTHERJET CA_931_NOFILL.txt waste management CA_982_NOFILL.txt
CANRAIL CA_932_NOFILL.txt construction industries1
CA_984_NOFILL.txt
LDGV
CA_934_NOFILL.txt construction and
mining1
CA_985_NOFILL.txt
PAVED ROADS CA_941_NOFILL.txt TOTALBEEF2 CA_986_NOFILL.txt
2
UNPAVED ROADS CA_942_NOFILL.txt
TOTALPOUL2 CA_987_NOFILL.txt
2
Oil Sands CA_950_NOFILL.txt TOTALSWIN2 CA_988_NOFILL.txt
2
TOTALFERT2 CA_989_NOFILL.txt
2
1: Not used because fractions did not sum to 1;
2: Surrogates 986, 987, 988 and 989 were originally numbered by Canada as 611, 615, 620 and 65, respectively. We changed the
numbers so that all Canadian surrogates would begin with ―9‖.
The Mexican emissions and single surrogate (population) are the same in the v4.1 platform as
were used in the 2005v4 and 2002 platforms.
3.2.2 Chemical speciation ancillary files
The following data files, provided at the 2005v4 website (see the end of Section 1), contain the
SMOKE inputs used for chemical speciation of the inventory species to the CMAQ model
species. SMOKE environmental variable names, used in the file names, are shown using capital
letters in parentheses:
ancillary_2005v4.1_smokeformat.zip: inventory table (INVTABLE), NONHAPVOC
emissions calculation exclusions file (NHAPEXCLUDE), speciation cross references
(GSREF), speciation VOC-to-TOG conversion factors (GSCNV), speciation profiles
(GSPRO), and combined, monthly speciation profiles (GSPRO_COMBO).
ancillary_2005v4.1_futureyear_smokeformat.zip: speciation-related files associated
with the future year speciation changes.
The following subsections explain these SMOKE input files.
3.2.2.1 INVABLE and NHAPEXCLUDE
The INVTABLE and NHAPEXCLUDE SMOKE input files have a critical function in the VOC
speciation process for emissions modeling cases utilizing HAP-CAP integration, as is done for
the 2005v4.1 platform.
We prepared two different INVTABLE files to use with different sectors of the platform. For
sectors in which we chose no integration across the entire sector (see Table 3-5), we created a
―no HAP use‖ INVTABLE that set the ―KEEP‖ flag to ―N‖ for BAFM pollutants. Thus, any
BAFM pollutants in the inventory input into SMOKE would be dropped. This approach both
64
avoids double-counting of these species and assumes that the VOC speciation is the best
available approach for these species for the sectors using the approach. The second INVTABLE,
used for sectors in which one or more sources are integrated, causes SMOKE to keep the BAFM
pollutants and indicates that they are to be integrated with VOC (by setting the ―VOC or TOG
component‖ field to ―V‖ for all four HAP pollutants.
We also prepared sector-specific NHAPEXCLUDE files that provide the specific sources that
are excluded from integration (see Table 3-5).
3.2.2.2 GSPRO, GSPRO_COMBO, GSREF and GSCNV,
For VOC speciation, we generated the following SMOKE-ready profiles for the CB05 chemical
mechanism using the Speciation Tool (Eyth, 2006):
TOG-to-model species (used only for no-integrate sources)
NONHAPTOG-to-model species (used only for the integrate sources)
TOG-to-BENZENE (used only for no-integrate sources)
We added speciation profile entries that simply map NEI emissions of benzene, acetaldehyde,
formaldehyde and methanol to the model species BENZENE, ALD2, FORM and METHANOL,
respectively. These profiles were used only for the integrate sources. Note that we process the
integrate and no-integrate sources using the same GSREF and GSPRO files. Thus, to avoid
double counting of these HAP species, we removed BAFM pollutants for all no-integrate sources
in the inventory. If the entire sector was no-integrate, then we were able to remove these in
SMOKE (by using ―N‖ in the INVTABLE) but if a sector was partially integrated, then we
needed to remove these HAPS from the actual inventory input to SMOKE, but only for the no
HAP use, no-integrate sources.
In addition to the speciation profiles, the Speciation Tool generates the SMOKE-ready speciation
conversion files (GSCNV). We generated two of these: one containing profile-specific VOC-to-
TOG conversion factors and the other containing profile-specific NONHAPVOC-to-
NONHAPTOG conversion factors.
The TOG and PM2.5 speciation factors that are the basis of the chemical speciation approach
were developed from the SPECIATE4.2 database
(http://www.epa.gov/ttn/chief/software/speciate/index.html) which is EPA's repository of TOG
and PM speciation profiles of air pollution sources. However, a few of the profiles we used in
the v4.1 platform will be published in SPECIATE4.3 after the release of this documentation.
The SPECIATE database development and maintenance is a collaboration involving EPA‘s
ORD, OTAQ, and EPA‘s Office of Air Quality Planning and Standards (OAQPS), and
Environment Canada (EPA, 2006c). The SPECIATE database contains speciation profiles for
TOG, speciated into individual chemical compounds, VOC-to-TOG conversion factors
associated with the TOG profiles, and speciation profiles for PM2.5. The database also contains
the PM2.5 speciated into both individual chemical compounds (e.g., zinc, potassium, manganese,
lead), and into the ―simplified‖ PM2.5 components used in the air quality model. These
simplified components are:
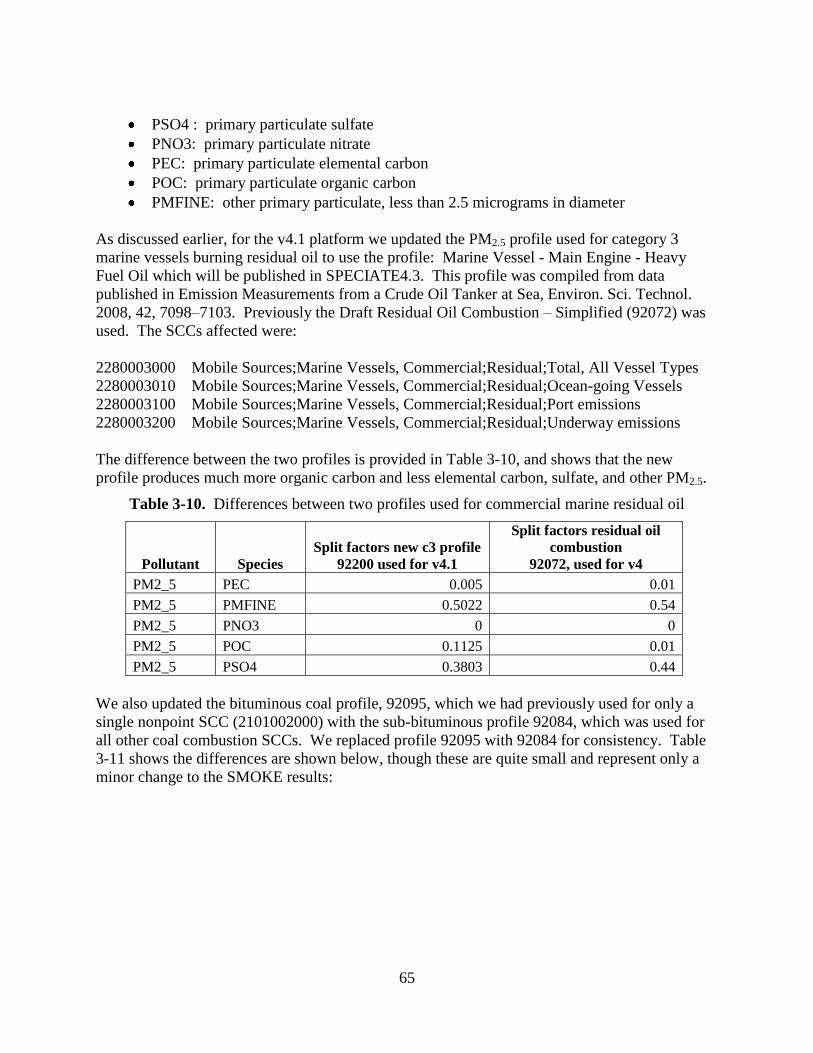
65
PSO4 : primary particulate sulfate
PNO3: primary particulate nitrate
PEC: primary particulate elemental carbon
POC: primary particulate organic carbon
PMFINE: other primary particulate, less than 2.5 micrograms in diameter
As discussed earlier, for the v4.1 platform we updated the PM2.5 profile used for category 3
marine vessels burning residual oil to use the profile: Marine Vessel - Main Engine - Heavy
Fuel Oil which will be published in SPECIATE4.3. This profile was compiled from data
published in Emission Measurements from a Crude Oil Tanker at Sea, Environ. Sci. Technol.
2008, 42, 7098–7103. Previously the Draft Residual Oil Combustion – Simplified (92072) was
used. The SCCs affected were:
2280003000 Mobile Sources;Marine Vessels, Commercial;Residual;Total, All Vessel Types
2280003010 Mobile Sources;Marine Vessels, Commercial;Residual;Ocean-going Vessels
2280003100 Mobile Sources;Marine Vessels, Commercial;Residual;Port emissions
2280003200 Mobile Sources;Marine Vessels, Commercial;Residual;Underway emissions
The difference between the two profiles is provided in Table 3-10, and shows that the new
profile produces much more organic carbon and less elemental carbon, sulfate, and other PM2.5.
Table 3-10. Differences between two profiles used for commercial marine residual oil
Pollutant Species
Split factors new c3 profile
92200 used for v4.1
Split factors residual oil
combustion
92072, used for v4
PM2_5 PEC 0.005 0.01
PM2_5 PMFINE 0.5022 0.54
PM2_5 PNO3 0 0
PM2_5 POC 0.1125 0.01
PM2_5 PSO4 0.3803 0.44
We also updated the bituminous coal profile, 92095, which we had previously used for only a
single nonpoint SCC (2101002000) with the sub-bituminous profile 92084, which was used for
all other coal combustion SCCs. We replaced profile 92095 with 92084 for consistency. Table
3-11 shows the differences are shown below, though these are quite small and represent only a
minor change to the SMOKE results:
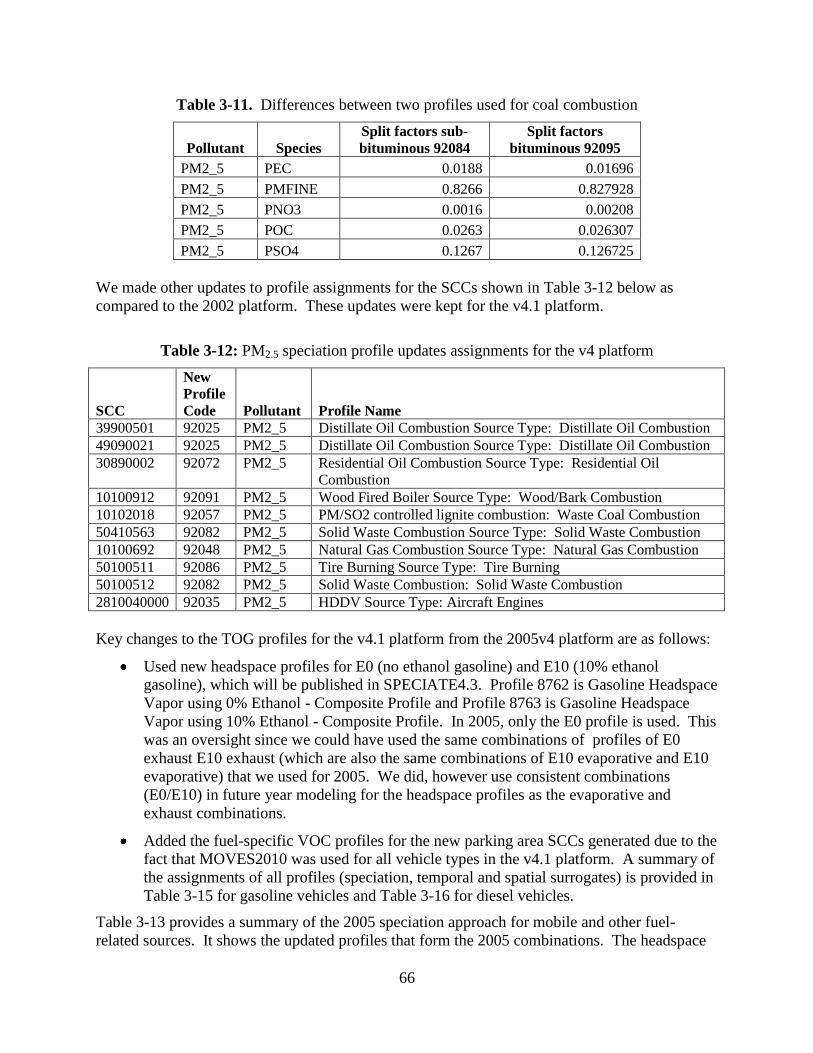
66
Table 3-11. Differences between two profiles used for coal combustion
Pollutant Species
Split factors sub-
bituminous 92084
Split factors
bituminous 92095
PM2_5 PEC 0.0188 0.01696
PM2_5 PMFINE 0.8266 0.827928
PM2_5 PNO3 0.0016 0.00208
PM2_5 POC 0.0263 0.026307
PM2_5 PSO4 0.1267 0.126725
We made other updates to profile assignments for the SCCs shown in Table 3-12 below as
compared to the 2002 platform. These updates were kept for the v4.1 platform.
Table 3-12: PM2.5 speciation profile updates assignments for the v4 platform
SCC
New
Profile
Code Pollutant Profile Name
39900501 92025 PM2_5 Distillate Oil Combustion Source Type: Distillate Oil Combustion
49090021 92025 PM2_5 Distillate Oil Combustion Source Type: Distillate Oil Combustion
30890002 92072 PM2_5 Residential Oil Combustion Source Type: Residential Oil
Combustion
10100912 92091 PM2_5 Wood Fired Boiler Source Type: Wood/Bark Combustion
10102018 92057 PM2_5 PM/SO2 controlled lignite combustion: Waste Coal Combustion
50410563 92082 PM2_5 Solid Waste Combustion Source Type: Solid Waste Combustion
10100692 92048 PM2_5 Natural Gas Combustion Source Type: Natural Gas Combustion
50100511 92086 PM2_5 Tire Burning Source Type: Tire Burning
50100512 92082 PM2_5 Solid Waste Combustion: Solid Waste Combustion
2810040000 92035 PM2_5 HDDV Source Type: Aircraft Engines
Key changes to the TOG profiles for the v4.1 platform from the 2005v4 platform are as follows:
Used new headspace profiles for E0 (no ethanol gasoline) and E10 (10% ethanol
gasoline), which will be published in SPECIATE4.3. Profile 8762 is Gasoline Headspace
Vapor using 0% Ethanol - Composite Profile and Profile 8763 is Gasoline Headspace
Vapor using 10% Ethanol - Composite Profile. In 2005, only the E0 profile is used. This
was an oversight since we could have used the same combinations of profiles of E0
exhaust E10 exhaust (which are also the same combinations of E10 evaporative and E10
evaporative) that we used for 2005. We did, however use consistent combinations
(E0/E10) in future year modeling for the headspace profiles as the evaporative and
exhaust combinations.
Added the fuel-specific VOC profiles for the new parking area SCCs generated due to the
fact that MOVES2010 was used for all vehicle types in the v4.1 platform. A summary of
the assignments of all profiles (speciation, temporal and spatial surrogates) is provided in
Table 3-15 for gasoline vehicles and Table 3-16 for diesel vehicles.
Table 3-13 provides a summary of the 2005 speciation approach for mobile and other fuel-
related sources. It shows the updated profiles that form the 2005 combinations. The headspace
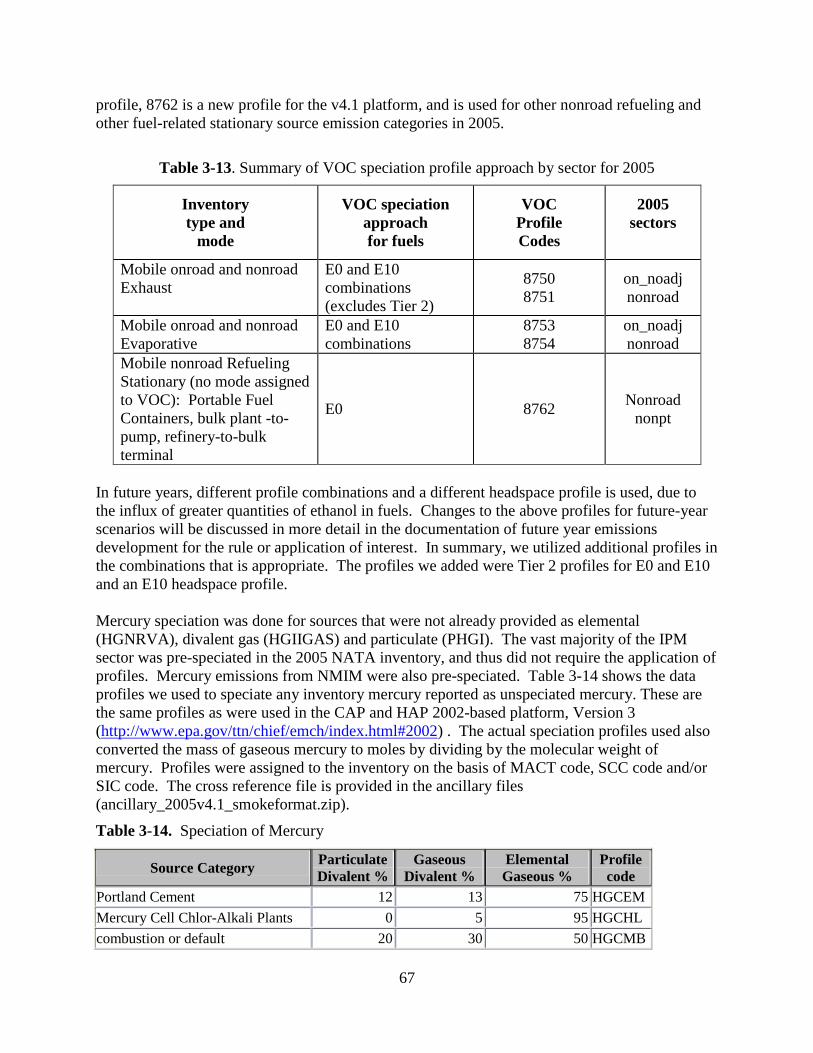
67
profile, 8762 is a new profile for the v4.1 platform, and is used for other nonroad refueling and
other fuel-related stationary source emission categories in 2005.
Table 3-13. Summary of VOC speciation profile approach by sector for 2005
Inventory
type and
mode
VOC speciation
approach
for fuels
VOC
Profile
Codes
2005
sectors
Mobile onroad and nonroad
Exhaust
E0 and E10
combinations
(excludes Tier 2)
8750
8751
on_noadj
nonroad
Mobile onroad and nonroad
Evaporative
E0 and E10
combinations
8753
8754
on_noadj
nonroad
Mobile nonroad Refueling
Stationary (no mode assigned
to VOC): Portable Fuel
Containers, bulk plant -to-
pump, refinery-to-bulk
terminal
E0 8762 Nonroad
nonpt
In future years, different profile combinations and a different headspace profile is used, due to
the influx of greater quantities of ethanol in fuels. Changes to the above profiles for future-year
scenarios will be discussed in more detail in the documentation of future year emissions
development for the rule or application of interest. In summary, we utilized additional profiles in
the combinations that is appropriate. The profiles we added were Tier 2 profiles for E0 and E10
and an E10 headspace profile.
Mercury speciation was done for sources that were not already provided as elemental
(HGNRVA), divalent gas (HGIIGAS) and particulate (PHGI). The vast majority of the IPM
sector was pre-speciated in the 2005 NATA inventory, and thus did not require the application of
profiles. Mercury emissions from NMIM were also pre-speciated. Table 3-14 shows the data
profiles we used to speciate any inventory mercury reported as unspeciated mercury. These are
the same profiles as were used in the CAP and HAP 2002-based platform, Version 3
(http://www.epa.gov/ttn/chief/emch/index.html#2002) . The actual speciation profiles used also
converted the mass of gaseous mercury to moles by dividing by the molecular weight of
mercury. Profiles were assigned to the inventory on the basis of MACT code, SCC code and/or
SIC code. The cross reference file is provided in the ancillary files
(ancillary_2005v4.1_smokeformat.zip).
Table 3-14. Speciation of Mercury
Source Category Particulate
Divalent % Gaseous
Divalent % Elemental
Gaseous % Profile
code
Portland Cement 12 13 75 HGCEM
Mercury Cell Chlor-Alkali Plants 0 5 95 HGCHL
combustion or default 20 30 50 HGCMB
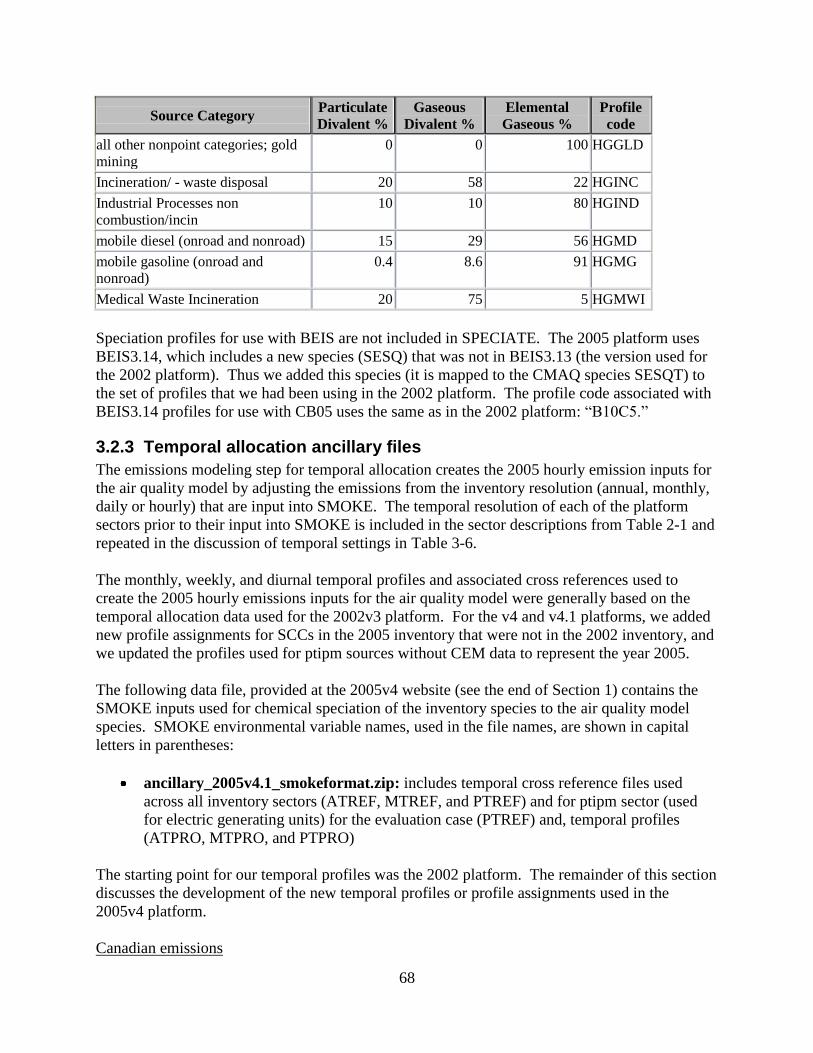
68
Source Category Particulate
Divalent % Gaseous
Divalent % Elemental
Gaseous % Profile
code
all other nonpoint categories; gold
mining 0 0 100 HGGLD
Incineration/ - waste disposal 20 58 22 HGINC
Industrial Processes non
combustion/incin 10 10 80 HGIND
mobile diesel (onroad and nonroad) 15 29 56 HGMD
mobile gasoline (onroad and
nonroad) 0.4 8.6 91 HGMG
Medical Waste Incineration 20 75 5 HGMWI
Speciation profiles for use with BEIS are not included in SPECIATE. The 2005 platform uses
BEIS3.14, which includes a new species (SESQ) that was not in BEIS3.13 (the version used for
the 2002 platform). Thus we added this species (it is mapped to the CMAQ species SESQT) to
the set of profiles that we had been using in the 2002 platform. The profile code associated with
BEIS3.14 profiles for use with CB05 uses the same as in the 2002 platform: ―B10C5.‖
3.2.3 Temporal allocation ancillary files
The emissions modeling step for temporal allocation creates the 2005 hourly emission inputs for
the air quality model by adjusting the emissions from the inventory resolution (annual, monthly,
daily or hourly) that are input into SMOKE. The temporal resolution of each of the platform
sectors prior to their input into SMOKE is included in the sector descriptions from Table 2-1 and
repeated in the discussion of temporal settings in Table 3-6.
The monthly, weekly, and diurnal temporal profiles and associated cross references used to
create the 2005 hourly emissions inputs for the air quality model were generally based on the
temporal allocation data used for the 2002v3 platform. For the v4 and v4.1 platforms, we added
new profile assignments for SCCs in the 2005 inventory that were not in the 2002 inventory, and
we updated the profiles used for ptipm sources without CEM data to represent the year 2005.
The following data file, provided at the 2005v4 website (see the end of Section 1) contains the
SMOKE inputs used for chemical speciation of the inventory species to the air quality model
species. SMOKE environmental variable names, used in the file names, are shown in capital
letters in parentheses:
ancillary_2005v4.1_smokeformat.zip: includes temporal cross reference files used
across all inventory sectors (ATREF, MTREF, and PTREF) and for ptipm sector (used
for electric generating units) for the evaluation case (PTREF) and, temporal profiles
(ATPRO, MTPRO, and PTPRO)
The starting point for our temporal profiles was the 2002 platform. The remainder of this section
discusses the development of the new temporal profiles or profile assignments used in the
2005v4 platform.
Canadian emissions
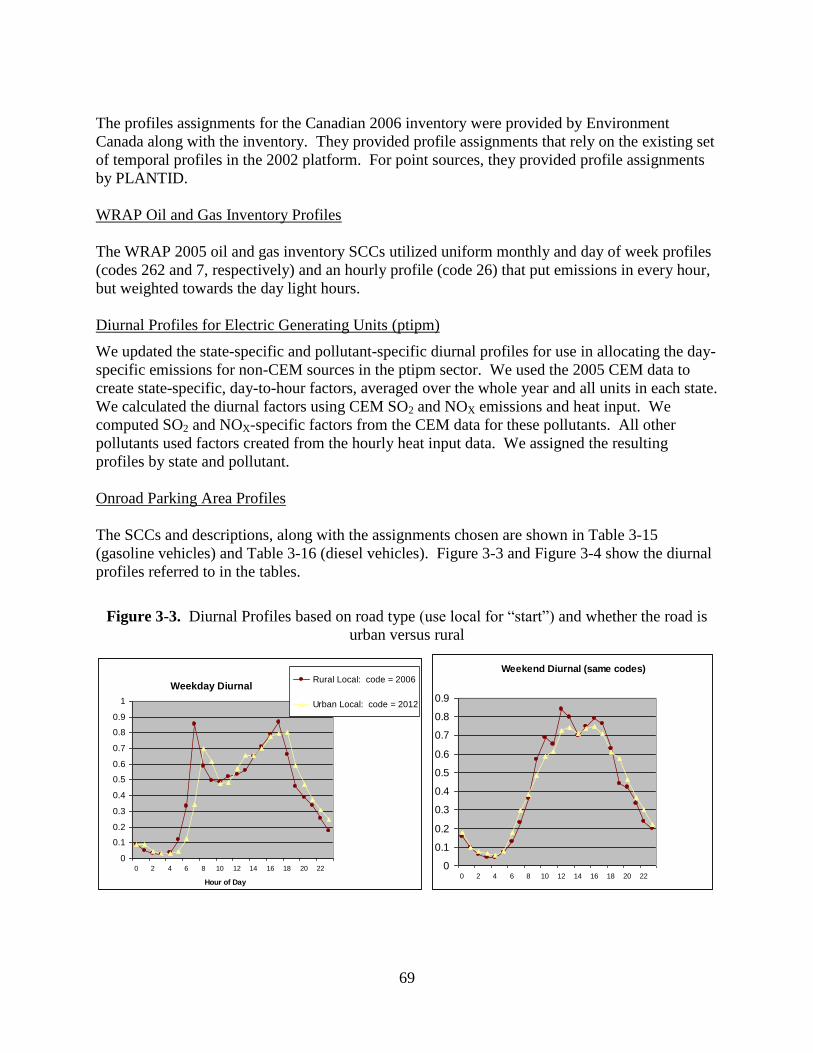
69
The profiles assignments for the Canadian 2006 inventory were provided by Environment
Canada along with the inventory. They provided profile assignments that rely on the existing set
of temporal profiles in the 2002 platform. For point sources, they provided profile assignments
by PLANTID.
WRAP Oil and Gas Inventory Profiles
The WRAP 2005 oil and gas inventory SCCs utilized uniform monthly and day of week profiles
(codes 262 and 7, respectively) and an hourly profile (code 26) that put emissions in every hour,
but weighted towards the day light hours.
Diurnal Profiles for Electric Generating Units (ptipm)
We updated the state-specific and pollutant-specific diurnal profiles for use in allocating the day-
specific emissions for non-CEM sources in the ptipm sector. We used the 2005 CEM data to
create state-specific, day-to-hour factors, averaged over the whole year and all units in each state.
We calculated the diurnal factors using CEM SO2 and NOX emissions and heat input. We
computed SO2 and NOX-specific factors from the CEM data for these pollutants. All other
pollutants used factors created from the hourly heat input data. We assigned the resulting
profiles by state and pollutant.
Onroad Parking Area Profiles
The SCCs and descriptions, along with the assignments chosen are shown in Table 3-15
(gasoline vehicles) and Table 3-16 (diesel vehicles). Figure 3-3 and Figure 3-4 show the diurnal
profiles referred to in the tables.
Figure 3-3. Diurnal Profiles based on road type (use local for ―start‖) and whether the road is
urban versus rural
Weekday Diurnal
0
0.1
0.2
0.3
0.4
0.5
0.6
0.7
0.8
0.9
1
0 2 4 6 8 10 12 14 16 18 20 22
Hour of Day
Rural Local: code = 2006
Urban Local: code = 2012
Weekend Diurnal (same codes)
0
0.1
0.2
0.3
0.4
0.5
0.6
0.7
0.8
0.9
0 2 4 6 8 10 12 14 16 18 20 22
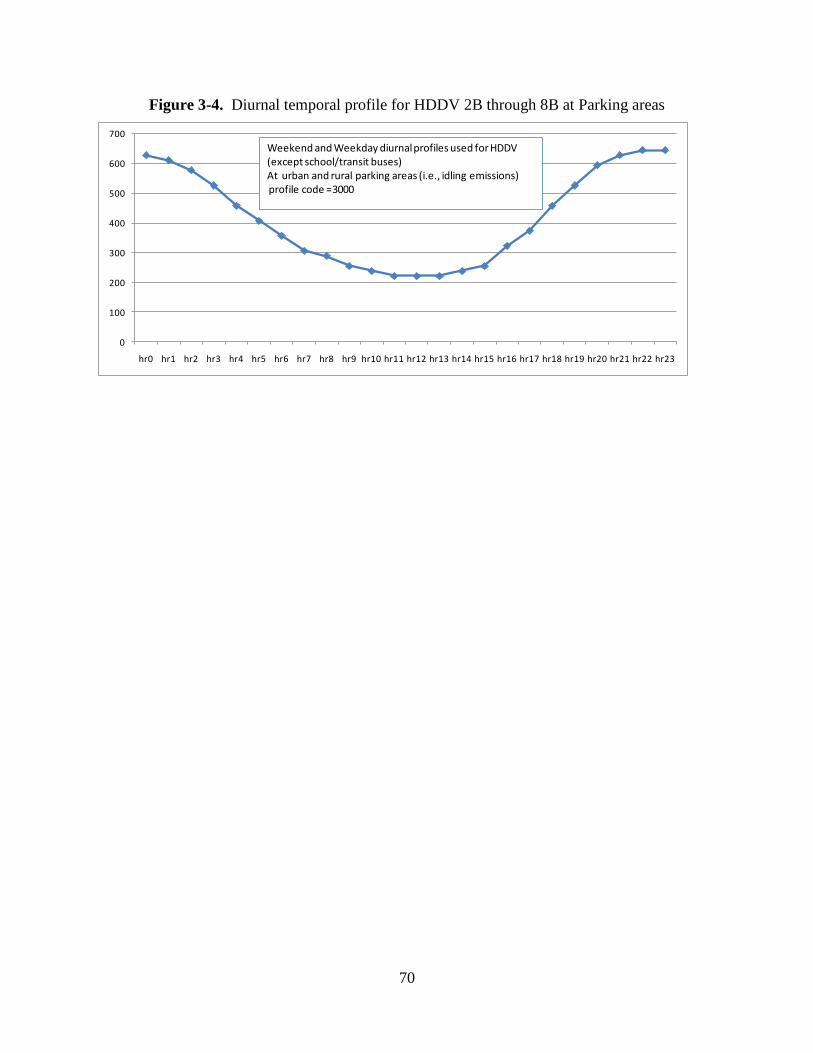
70
Figure 3-4. Diurnal temporal profile for HDDV 2B through 8B at Parking areas
0
100
200
300
400
500
600
700
hr0 hr1 hr2 hr3 hr4 hr5 hr6 hr7 hr8 hr9 hr10 hr11 hr12 hr13 hr14 hr15 hr16 hr17 hr18 hr19 hr20 hr21 hr22 hr23
Weekend and Weekday diurnal profiles used for HDDV (except school/transit buses)At urban and rural parking areas (i.e., idling emissions)profile code =3000
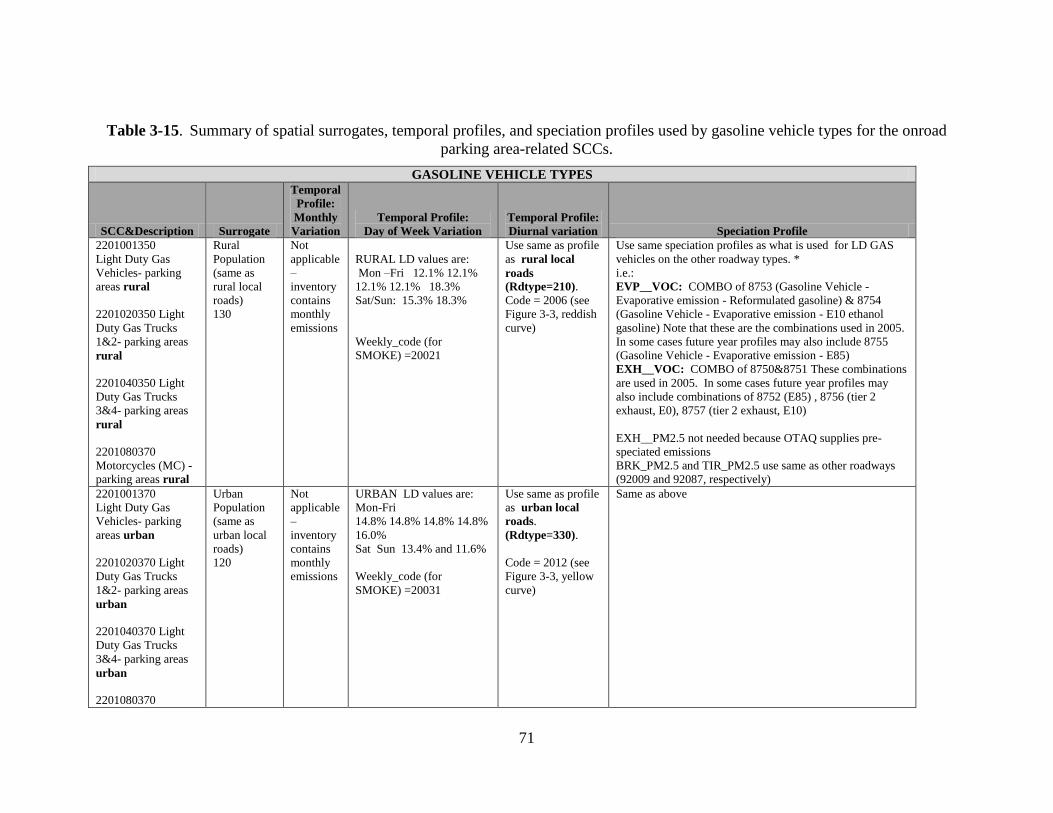
71
Table 3-15. Summary of spatial surrogates, temporal profiles, and speciation profiles used by gasoline vehicle types for the onroad
parking area-related SCCs.
GASOLINE VEHICLE TYPES
SCC&Description Surrogate
Temporal
Profile:
Monthly
Variation
Temporal Profile:
Day of Week Variation
Temporal Profile:
Diurnal variation Speciation Profile
2201001350
Light Duty Gas
Vehicles- parking
areas rural
2201020350 Light
Duty Gas Trucks
1&2- parking areas
rural
2201040350 Light
Duty Gas Trucks
3&4- parking areas
rural
2201080370
Motorcycles (MC) -
parking areas rural
Rural
Population
(same as
rural local
roads)
130
Not
applicable
–
inventory
contains
monthly
emissions
RURAL LD values are:
Mon –Fri 12.1% 12.1%
12.1% 12.1% 18.3%
Sat/Sun: 15.3% 18.3%
Weekly_code (for
SMOKE) =20021
Use same as profile
as rural local
roads
(Rdtype=210).
Code = 2006 (see
Figure 3-3, reddish
curve)
Use same speciation profiles as what is used for LD GAS
vehicles on the other roadway types. *
i.e.:
EVP__VOC: COMBO of 8753 (Gasoline Vehicle -
Evaporative emission - Reformulated gasoline) & 8754
(Gasoline Vehicle - Evaporative emission - E10 ethanol
gasoline) Note that these are the combinations used in 2005.
In some cases future year profiles may also include 8755
(Gasoline Vehicle - Evaporative emission - E85)
EXH__VOC: COMBO of 8750&8751 These combinations
are used in 2005. In some cases future year profiles may
also include combinations of 8752 (E85) , 8756 (tier 2
exhaust, E0), 8757 (tier 2 exhaust, E10)
EXH__PM2.5 not needed because OTAQ supplies pre-
speciated emissions
BRK_PM2.5 and TIR_PM2.5 use same as other roadways
(92009 and 92087, respectively)
2201001370
Light Duty Gas
Vehicles- parking
areas urban
2201020370 Light
Duty Gas Trucks
1&2- parking areas
urban
2201040370 Light
Duty Gas Trucks
3&4- parking areas
urban
2201080370
Urban
Population
(same as
urban local
roads)
120
Not
applicable
–
inventory
contains
monthly
emissions
URBAN LD values are:
Mon-Fri
14.8% 14.8% 14.8% 14.8%
16.0%
Sat Sun 13.4% and 11.6%
Weekly_code (for
SMOKE) =20031
Use same as profile
as urban local
roads.
(Rdtype=330).
Code = 2012 (see
Figure 3-3, yellow
curve)
Same as above
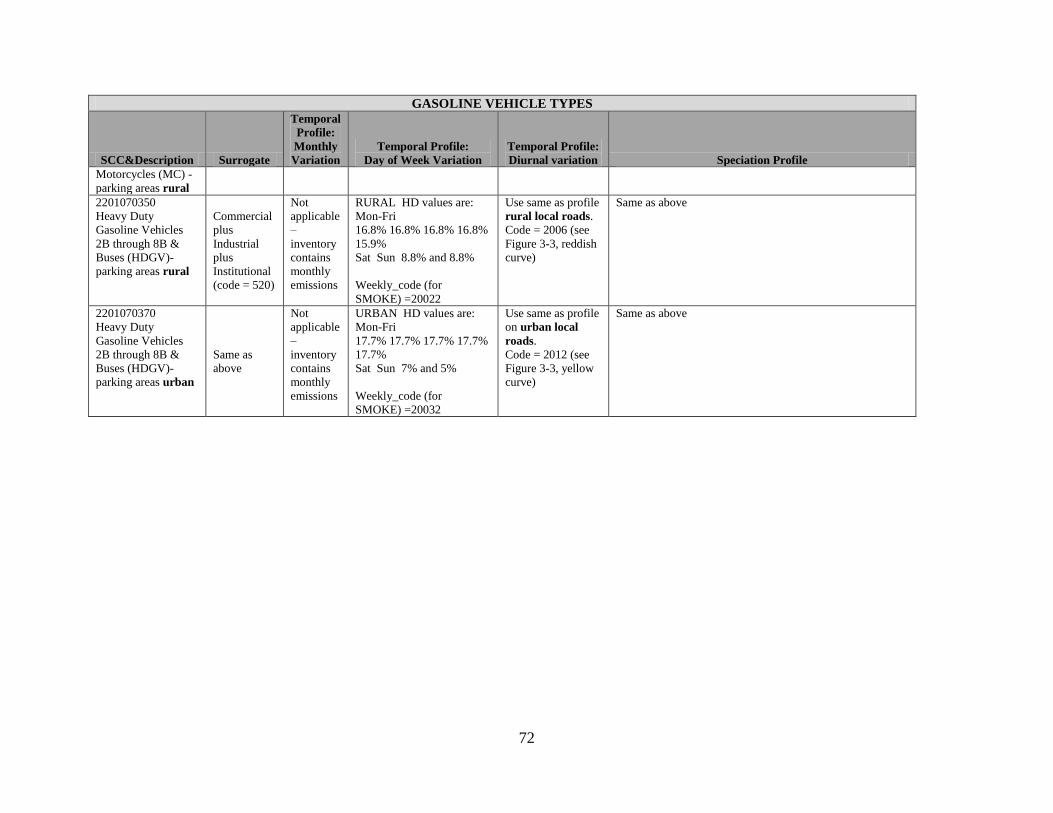
72
GASOLINE VEHICLE TYPES
SCC&Description Surrogate
Temporal
Profile:
Monthly
Variation
Temporal Profile:
Day of Week Variation
Temporal Profile:
Diurnal variation Speciation Profile
Motorcycles (MC) -
parking areas rural
2201070350
Heavy Duty
Gasoline Vehicles
2B through 8B &
Buses (HDGV)-
parking areas rural
Commercial
plus
Industrial
plus
Institutional
(code = 520)
Not
applicable
–
inventory
contains
monthly
emissions
RURAL HD values are:
Mon-Fri
16.8% 16.8% 16.8% 16.8%
15.9%
Sat Sun 8.8% and 8.8%
Weekly_code (for
SMOKE) =20022
Use same as profile
rural local roads.
Code = 2006 (see
Figure 3-3, reddish
curve)
Same as above
2201070370
Heavy Duty
Gasoline Vehicles
2B through 8B &
Buses (HDGV)-
parking areas urban
Same as
above
Not
applicable
–
inventory
contains
monthly
emissions
URBAN HD values are:
Mon-Fri
17.7% 17.7% 17.7% 17.7%
17.7%
Sat Sun 7% and 5%
Weekly_code (for
SMOKE) =20032
Use same as profile
on urban local
roads.
Code = 2012 (see
Figure 3-3, yellow
curve)
Same as above
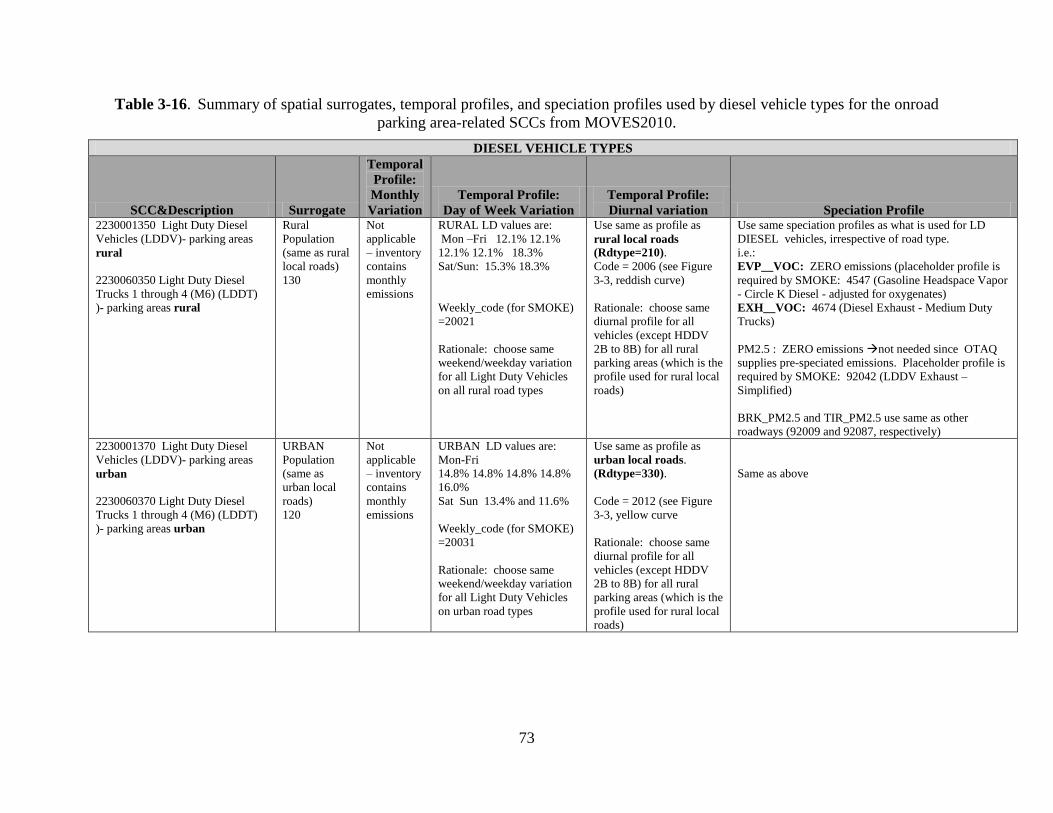
73
Table 3-16. Summary of spatial surrogates, temporal profiles, and speciation profiles used by diesel vehicle types for the onroad
parking area-related SCCs from MOVES2010.
DIESEL VEHICLE TYPES
SCC&Description Surrogate
Temporal
Profile:
Monthly
Variation
Temporal Profile:
Day of Week Variation
Temporal Profile:
Diurnal variation Speciation Profile 2230001350 Light Duty Diesel
Vehicles (LDDV)- parking areas
rural
2230060350 Light Duty Diesel
Trucks 1 through 4 (M6) (LDDT)
)- parking areas rural
Rural
Population
(same as rural
local roads)
130
Not
applicable
– inventory
contains
monthly
emissions
RURAL LD values are:
Mon –Fri 12.1% 12.1%
12.1% 12.1% 18.3%
Sat/Sun: 15.3% 18.3%
Weekly_code (for SMOKE)
=20021
Rationale: choose same
weekend/weekday variation
for all Light Duty Vehicles
on all rural road types
Use same as profile as
rural local roads
(Rdtype=210).
Code = 2006 (see Figure
3-3, reddish curve)
Rationale: choose same
diurnal profile for all
vehicles (except HDDV
2B to 8B) for all rural
parking areas (which is the
profile used for rural local
roads)
Use same speciation profiles as what is used for LD
DIESEL vehicles, irrespective of road type.
i.e.:
EVP__VOC: ZERO emissions (placeholder profile is
required by SMOKE: 4547 (Gasoline Headspace Vapor
- Circle K Diesel - adjusted for oxygenates)
EXH__VOC: 4674 (Diesel Exhaust - Medium Duty
Trucks)
PM2.5 : ZERO emissions not needed since OTAQ
supplies pre-speciated emissions. Placeholder profile is
required by SMOKE: 92042 (LDDV Exhaust –
Simplified)
BRK_PM2.5 and TIR_PM2.5 use same as other
roadways (92009 and 92087, respectively)
2230001370 Light Duty Diesel
Vehicles (LDDV)- parking areas
urban
2230060370 Light Duty Diesel
Trucks 1 through 4 (M6) (LDDT)
)- parking areas urban
URBAN
Population
(same as
urban local
roads)
120
Not
applicable
– inventory
contains
monthly
emissions
URBAN LD values are:
Mon-Fri
14.8% 14.8% 14.8% 14.8%
16.0%
Sat Sun 13.4% and 11.6%
Weekly_code (for SMOKE)
=20031
Rationale: choose same
weekend/weekday variation
for all Light Duty Vehicles
on urban road types
Use same as profile as
urban local roads.
(Rdtype=330).
Code = 2012 (see Figure
3-3, yellow curve
Rationale: choose same
diurnal profile for all
vehicles (except HDDV
2B to 8B) for all rural
parking areas (which is the
profile used for rural local
roads)
Same as above
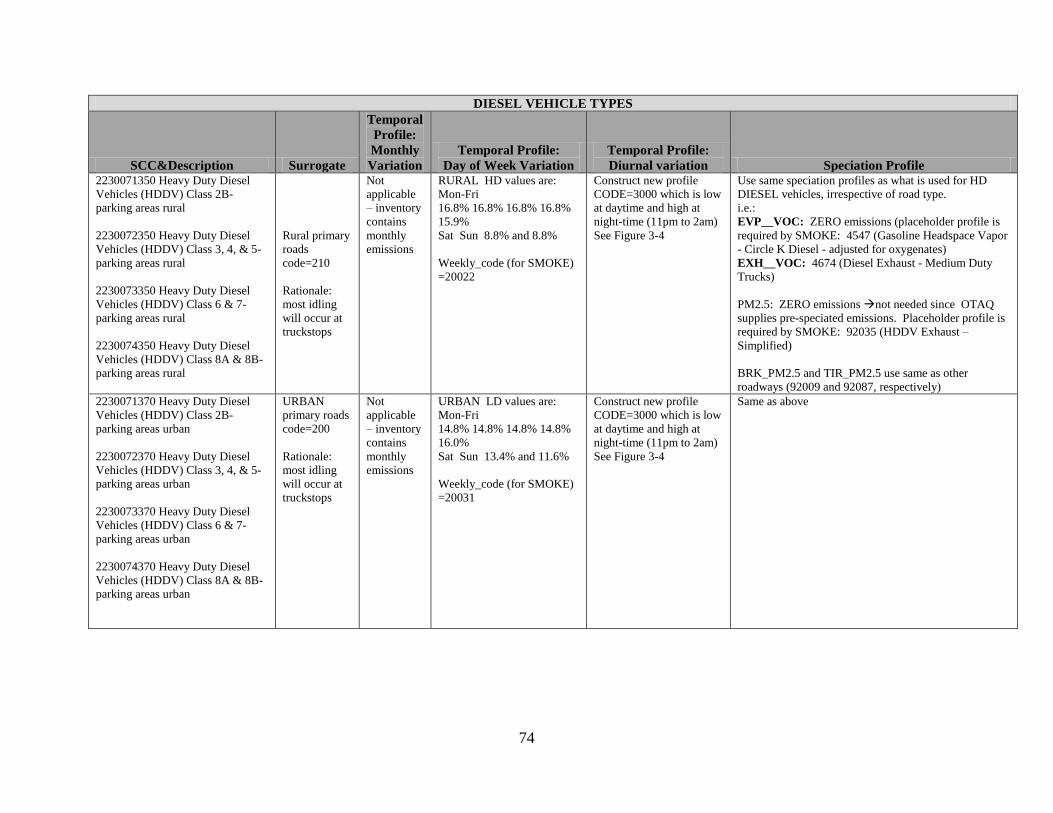
74
DIESEL VEHICLE TYPES
SCC&Description Surrogate
Temporal
Profile:
Monthly
Variation
Temporal Profile:
Day of Week Variation
Temporal Profile:
Diurnal variation Speciation Profile 2230071350 Heavy Duty Diesel
Vehicles (HDDV) Class 2B-
parking areas rural
2230072350 Heavy Duty Diesel
Vehicles (HDDV) Class 3, 4, & 5-
parking areas rural
2230073350 Heavy Duty Diesel
Vehicles (HDDV) Class 6 & 7-
parking areas rural
2230074350 Heavy Duty Diesel
Vehicles (HDDV) Class 8A & 8B-
parking areas rural
Rural primary
roads
code=210
Rationale:
most idling
will occur at
truckstops
Not
applicable
– inventory
contains
monthly
emissions
RURAL HD values are:
Mon-Fri
16.8% 16.8% 16.8% 16.8%
15.9%
Sat Sun 8.8% and 8.8%
Weekly_code (for SMOKE)
=20022
Construct new profile
CODE=3000 which is low
at daytime and high at
night-time (11pm to 2am)
See Figure 3-4
Use same speciation profiles as what is used for HD
DIESEL vehicles, irrespective of road type.
i.e.:
EVP__VOC: ZERO emissions (placeholder profile is
required by SMOKE: 4547 (Gasoline Headspace Vapor
- Circle K Diesel - adjusted for oxygenates)
EXH__VOC: 4674 (Diesel Exhaust - Medium Duty
Trucks)
PM2.5: ZERO emissions not needed since OTAQ
supplies pre-speciated emissions. Placeholder profile is
required by SMOKE: 92035 (HDDV Exhaust –
Simplified)
BRK_PM2.5 and TIR_PM2.5 use same as other
roadways (92009 and 92087, respectively)
2230071370 Heavy Duty Diesel
Vehicles (HDDV) Class 2B-
parking areas urban
2230072370 Heavy Duty Diesel
Vehicles (HDDV) Class 3, 4, & 5-
parking areas urban
2230073370 Heavy Duty Diesel
Vehicles (HDDV) Class 6 & 7-
parking areas urban
2230074370 Heavy Duty Diesel
Vehicles (HDDV) Class 8A & 8B-
parking areas urban
URBAN
primary roads
code=200
Rationale:
most idling
will occur at
truckstops
Not
applicable
– inventory
contains
monthly
emissions
URBAN LD values are:
Mon-Fri
14.8% 14.8% 14.8% 14.8%
16.0%
Sat Sun 13.4% and 11.6%
Weekly_code (for SMOKE)
=20031
Construct new profile
CODE=3000 which is low
at daytime and high at
night-time (11pm to 2am)
See Figure 3-4
Same as above
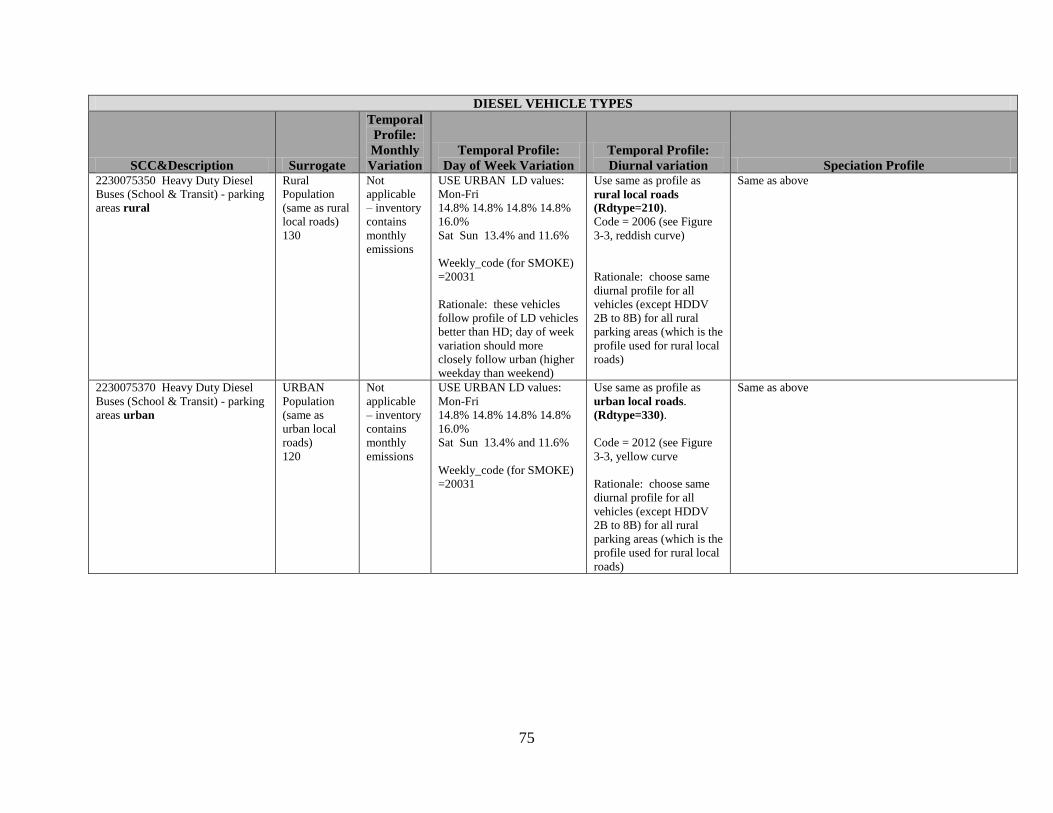
75
DIESEL VEHICLE TYPES
SCC&Description Surrogate
Temporal
Profile:
Monthly
Variation
Temporal Profile:
Day of Week Variation
Temporal Profile:
Diurnal variation Speciation Profile 2230075350 Heavy Duty Diesel
Buses (School & Transit) - parking
areas rural
Rural
Population
(same as rural
local roads)
130
Not
applicable
– inventory
contains
monthly
emissions
USE URBAN LD values:
Mon-Fri
14.8% 14.8% 14.8% 14.8%
16.0%
Sat Sun 13.4% and 11.6%
Weekly_code (for SMOKE)
=20031
Rationale: these vehicles
follow profile of LD vehicles
better than HD; day of week
variation should more
closely follow urban (higher
weekday than weekend)
Use same as profile as
rural local roads
(Rdtype=210).
Code = 2006 (see Figure
3-3, reddish curve)
Rationale: choose same
diurnal profile for all
vehicles (except HDDV
2B to 8B) for all rural
parking areas (which is the
profile used for rural local
roads)
Same as above
2230075370 Heavy Duty Diesel
Buses (School & Transit) - parking
areas urban
URBAN
Population
(same as
urban local
roads)
120
Not
applicable
– inventory
contains
monthly
emissions
USE URBAN LD values:
Mon-Fri
14.8% 14.8% 14.8% 14.8%
16.0%
Sat Sun 13.4% and 11.6%
Weekly_code (for SMOKE)
=20031
Use same as profile as
urban local roads.
(Rdtype=330).
Code = 2012 (see Figure
3-3, yellow curve
Rationale: choose same
diurnal profile for all
vehicles (except HDDV
2B to 8B) for all rural
parking areas (which is the
profile used for rural local
roads)
Same as above
76
4 References
Eastern Research Group, Mexico National Emissions Inventory, 1999: Final, prepared for
Secratariat of the Environment and Natural Resources and the National Institute of
Ecology, Mexico, October 11, 2006. Available at:
http://www.epa.gov/ttn/chief/net/mexico/1999_mexico_nei_final_report.pdf
EPA, 2005b. EPA’s National Inventory Model (NMIM), A Consolidated Emissions Modeling
System for MOBILE6 and NONROAD, U.S. Environmental Protection Agency, Office of
Transportation and Air Quality, Assessment and Standards Division. Ann Arbor, MI
48105, EPA420-R-05-024, December 2005. Available at
http://www.epa.gov/otaq/models/nmim/420r05024.pdf.
EPA 2006c. SPECIATE 4.0, Speciation Database Development Document, Final Report, U.S.
Environmental Protection Agency, Office of Research and Development, National Risk
Management Research Laboratory, Research Triangle Park, NC 27711, EPA600-R-06-
161, February 2006. Available at
http://www.epa.gov/ttn/chief/software/speciate/speciate4/documentation/speciatedoc_120
6.pdf.
EPA, 2007c. Draft Regulatory Impact Analysis: Control of Emissions from Marine SI and Small
SI Engines, Vessels, and Equipment , U.S. Environmental Protection Agency, Office of
Transportation and Air Quality, Office of Transportation and Air Quality, Assessment and
Standards Division, Ann Arbor, MI 48105, EPA420-D-07-004, April 2007. Available at
http://www.epa.gov/otaq/regs/nonroad/marinesi-equipld/420d07004-chapters.htm.
Eyth, A., L. Ran, R. Partheepan, G. Yarwood, M. Jimenez, S. Rao. (2006) ―New Tools to
Generate Spatial Surrogate and Speciation Profile Inputs to SMOKE.‖ International
Emission Inventory Conference, New Orleans, LA. Available at
http://www.epa.gov/ttn/chief/conference/ei15/session9/eyth.pdf.
Gustin, M.S.; Lindberg, S.E, and Weisberg, P.J. (2008). An update on the natural sources and
sinks of atmospheric mercury. Applied Geochemistry, 23(3), 482-493.
Pouliot, G., H. Simon, P. Bhave, D. Tong, D. Mobley, T. Pace, and T. Pierce . (2010) ―Assessing
the Anthropogenic Fugitive Dust Emission Inventory and Temporal Allocation Using an
Updated Speciation of Particulate Matter.‖ International Emission Inventory Conference,
San Antonio, TX. Available at
http://www.epa.gov/ttn/chief/conference/ei19/session9/pouliot.pdf .
Strum, M., D. Mintz, L. Driver, C. Harvey, H. Michaels, R. Mason. (2007) ―Estimating the
Monthly Variation in California's Nonroad Equipment Emissions for the 2002 Emissions
and Air Quality Modeling Platform.‖ International Emission Inventory Conference,
Raleigh, NC. Available at
http://www.epa.gov/ttn/chief/conference/ei16/session4/strum.pdf.
Yarwood, G., S. Rao, M. Yocke, and G. Whitten, 2005: Updates to the Carbon Bond Chemical
Mechanism: CB05. Final Report to the US EPA, RT-0400675. Available at
http://www.camx.com/publ/pdfs/CB05_Final_Report_120805.pdf.