Embed Size (px)
Citation preview
Agricultural Systems 41 (1993) 53-76
Techniques of Representing Knowledge in Knowledge-Based Systems*
Peter Wagner
Institut fi~r landwirtschaftliche Betriebslehre, Justus-Liebig-Universit,~tt, Senckenbergstr. 3, W-6300 Giessen, Germany
(Received 30 May 1991; accepted 18 March 1992)
A BS TRA C T
Increasingly complex decision-making situations increase the probability that wrong choices will be made. Knowledge-based systems can help increase the success rate, thereby improving farm performance.
Knowledge-based systems differ according to their construction, the way in which they are programmed, and the mode of representing knowledge that is employed. The representation of knowledge in the form of production rules has established itself as a viable method alongside those models that are based on production functions. The nature of the problem to be solved determines which of the two techniques of representation should be selected.
Two concrete examples have been employed to illustrate the methods and techniques involved in the two approaches; the various advantages and disadvantages have been discussed, and it has been shown in conclusion where the pitfalls are and how the advantages of both procedures can be utilized by creating hybrid systems.
1 I N T R O D U C T I O N
Successful farmers can be distinguished from less successful ones by virtue of the fact that they make bad decisions less frequently and do the right thing more often. However, going about things the right way has
* This paper is based in parts upon a presentation of Prof. Dr Dr h. c. F. Kuhlmann together with the author.
53 Agricultural Systems 0308-521X/92/$05.00 © 1992 Elsevier Science Publishers Ltd, England. Printed in Great Britain
54 Peter Wagner
become more and more difficult in an age of ever more complex processes and general uncertainty. The farmer often does not have the time to acquire the proficiency in such areas as production technology, marketing or management that can help him steer clear of the wrong choices.
It would thus seem appropriate to offer the farmer the knowledge required for good production and management in a different form than has been customary so far. One way of doing this is by means of 'knowledge-based systems'. The concept of knowledge-based systems involves the use of computer programs which compile widely-scattered existing domain knowledge to help the individual user in reaching decisions within clearly demarcated problem areas. Models of this kind are conceived and programmed chiefly on the basis of production functions and/or production rules. For examples, see Section 3.
This paper is aimed at explaining why knowledge-based systems are needed, and to illustrate what they are. Two concrete examples are employed to demonstrate how systems based on production functions can be differentiated from those based on production rules, how such models work in practice, and what the conditions are that affect the choice of a particular mode (or the selection of a hybrid form) in presenting specialized domain knowledge.
2 THE NECESSITY FOR KNOWLEDGE-BASED SYSTEMS
2.1 Necessity dictated by progress
Biological, technological and organizational progress in recent years has resulted in a tremendous increase in the intensiveness of agricultural land-use and livestock farming. The initial advantages in terms of economizing on scarce land and manpower are, however, increasingly offset by disadvantages.
One chief result of these new developments has been that farm producers are now confronted with a very broad and rapidly expanding range of farming techniques designed to increase and ensure production and to optimize productivity. This variety sooner or later becomes so complex that it may get out of hand and necessarily begins to encourage miscalculations; and miscalculations--the too-extensive over-application of the means of production at the wrong time and in the wrong way--mean waste. The most immediate negative effect is the economic disadvantage incurred by the individual farmer. Over and above this, such miscalculations can cause ecological damage resulting from increased pressure on natural resources.
Representing knowledge in knowledge-based systems 55
There are two main ways of limiting these negative economic and ecological effects. First, methods and processes can be developed to bring about structural improvement; this, however, is not the object of enquiry in the present paper.
Second, an attempt can be made to optimize processes, i.e. to improve and/or to lower the range and level of application of production factors, with due regard for the farm and field specific conditions. The state of electronic data processing now permits the development of knowledge- based, computerized operational and regulative procedures which allow biological production systems to be run in close accordance with precise aims and objectives.
2.2 Necessity dictated by the nature of decisions
The decision-making situation in farm processes is generally characterized by incomplete information or uncertainty (and it should not be forgotten that the models that are constructed themselves often simplify or exclude these very factors). There are two causal areas that are responsible for uncertainty in decision-making processes. The first arises from the complexity of the decision-making domain, i.e. from the sheer range of possible alternatives. This can be called the 'structural component of uncertainty'. The second causal area arises from the lack of predictability of certain input variables of biological production systems that are beyond our control and not accessible to proper quantification. This can be called the 'dynamic component of uncertainty'.
2.2.1 The structural component of decision making under uncertainty A reduction of the uncertainty resulting from the structural component can be achieved with the aid of quantitative and qualitative models. As well as including a system of equations for calculating the relative economic advantages of alternative courses of action, these models contain complete systems of production functions and/or production rules for showing the quantitative and/or behavioral framework of the various strategies that are to be implemented. These concepts will be elaborated by means of the examples that follow.
It is always difficult to estimate such functions or to formulate the rules underlying the models. In some cases, systems of equations can be worked out on the basis of previously documented experimental results involving appropriate procedures for approximation. As data-bases are not available for many areas, experiments must first be conducted. A second avenue of approach is to have recourse to existing expert knowl- edge (scientists, farmers, production advisers).
56 Peter Wagner
A number of problems whose structure cannot be described in formal mathematical terms are associated with uncertain knowledge or un- certain relationships which themselves can no longer be described in terms of interval or ordinal scales. Particular problems of this kind relate to diagnostic or therapeutic measures, or to dichotomous decision areas. The solution of diagnostic or therapeutic problems forms the basis of many decisions in the realm of plant protection, for example. Problems relating to dichotomous decision areas are generally characterized by the occurrence of one of two possible events (for example, a herbicide may be harmful to bees, or can be viewed as not harmful). It is also advisable here to draw on the knowledge and experience of experts in determining production rules (or, more simply, rules) and the courses of action relevant to these.
The circumstances here described make it clear that such projects lead themselves to new ideas and new experiments in agricultural research. This is true whether or not the construction of a rule-based or a functional model is involved. Existing research deficiencies are often discovered only during the developmental stages of such systems. Also, it is unfortunately all too common that the ways in which model-builders communicate with those who could help in removing such deficiencies often leave much to be desired, i.e. interdisciplinary cooperation is absolutely necessary.
2.2.2 The dynamic component of decisions made under conditions of uncertainty The goal of constructing decision-making models is, however, accompanied by the aim of reducing the second (dynamic) component of uncertainty. To understand the underlying ideas it is necessary to differentiate within the totality of decision problems by classifying these (in accordance with cybernetics and control theory) into groups relating to open loop and closed loop control. The dynamic dimension of uncertainty is to be reduced by applying models based on the concept of closed loop control (for more details, see Kuhlmann & Wagner, 1986; Wagner & Kuhlmann, 1991, p. 290).
2.3 Necessity arising from intensification
Apart from the general reasons for the necessity of knowledge-based systems, of whatever kind, pressure in the direction of legitimizing the use of decision-supporting models increases according to the level of capital-intensive operation in farm enterprises. A capital-intensive mode of operation is characterized by high turnover compared to the profits gained (for example, with laying hens or feeder pigs). This is also true for intensive plant production. Such production processes have a low
Representing knowledge in knowledge-based systems 57
turnover-to-profit ratio, with the result that operational mistakes are much more likely to reduce profits than in less capital-intensive modes of production such as single suckler cows. This trend will increase in the future, if the increasing complexity of capital-intensive production systems is anything to go by. The more complex the operation of bio- logical production systems, the higher the rate of error. A higher rate of error in determining alternative courses of action obviously has a negative effect on farm profitability.
Models of real systems---and models based on production functions or rules are precisely this---can serve to help the farmer to reduce the level of uncertainty involved in making decisions.
Before going on to discuss two examples of the difference between rule-based and function-based systems, a few examples of knowledge- based systems shall be noted briefly, so that the reader may gain a better idea of what is meant.
3 EXAMPLES OF KNOWLEDGE-BASED SYSTEMS
Knowledge-based systems may be distinguished by different criteria, for example by the kind of representing knowledge. Besides other forms, knowledge can be represented by means of production functions or production rules or a mixture of both (so-called hybrid models).
Examples of function-based systems are Simplan, a model for the simulation of a farm unit for teaching purposes (Mtihe, 1989) or a model designed to simulate the nitrogen regime in arable soils (Kersebaum, 1989).
In a simulation of farm operations by Lal et al. (1987), the allocation of machinery resources are made to fields on a farm-specific priority basis.
The models Genis (variety choice) and Herby (weed control) are intended to support the farmer in decision making related to variety choice and weed management in winter wheat (Kuhlmann & Mtihe, 1990). The models provide decision-oriented information on the expected economic benefits for various relevant actions. Genis and Herby, both function-based models, are commercially available.
An example of a rule-based system is the Grain Marketing Advisor (GMA) developed by Thieme et al. (1987). In operation, the GMA asks the user about time within the crop season, and if on-farm or commercial storage is available. He is also asked for assumptions concerning risk, cash flow, flexibility in delivery and knowledge of the futures market. Finally, the GMA comes up with the most preferable marketing recommendation. The GMA is commercially available.
58 Peter Wagner
Soybug, another rule-based model, is described by Jones et al. (1986). The program Soybug gives advice on the control of soybean insects.
Farmexpert (Wagner, 1992), also a rule-based system, analyses profitability of farms by means of comparing the farm in question with a successful group of similar farms. Furthermore, the model is able to give hints about improving the situation of farms that are in a poor position.
Three out of many examples of hybrid systems are reported by McClendon et ai. (1987), Yost et al. (1988) and Huirne (1990). McClendon et al. designed a soybean pest management expert system that uses scout- ing data and expert knowledge to project insect populations for the next week in a crop of soybeans. Estimates of the expert system are given to a crop growth model to estimate the expected yield loss that would occur in the next week if control action is not taken. Depending on the yield loss and the grower's sensitivity to risk, recommendations are made on the type of insecticide to apply. Yost et al. (1988) developed a program for recommending lime applications for crop production on tropical soils. Appropriate equations compute lime requirements and relative yield loss without lime application, based upon responses from the user. Evaluating the complex preconditions to use the equations properly is done by the expert system. Huime's program, CHESS (Computerized Herd Evaluation _~ystem for Sows), is primarily intended to support farm managers and other livestock specialists in analyzing the economic situa- tion of individual sow-herds.
Further examples may be found in the following work:
--Barret and Jones (1989) draw interesting conclusions on Simulation and Artificial Intelligence. Furthermore, they deliver a comprehensive description of expert systems that have been developed in the USA.
--Dent and Jones (1989) edited a special issue of Agricultural Sys tems on expert system applications in agriculture. Most of the presented expert systems originate in the USA, one is from the UK and another is from The Netherlands.
--The Deutsche Landwirtschafts Gesellschaft (1988) published the proceedings of their 2nd Congress for Computer Technology in Agriculture where a huge collection of knowledge-based systems from many countries and very different domains is presented. This source is also available in French and German translations.
--The proceedings of the 3rd Congress for Computer Technology "in Agriculture (Kuhlmann, 1990) contain a number of decision support expert systems from almost all European countries. Some interesting models developed in countries of Eastern Europe are also described. This source is also available in French and German translations.
Representing knowledge in knowledge-based systems 59
--Learned Information (1986) presented the most comprehensive (not limited to agriculture) listing of expert systems so far. Unfortunately this publication is no longer up to date.
--Schiefer (1989) gives an overview of a part of the expert systems developed in Germany.
--Whittaker and Thieme (1990) edited a special issue of Computers and Electronics in Agriculture on knowledge systems.
All in all, the sources cited above sketch more than 100 expert systems relating to agriculture.
Sections 3.1 and 3.2 discuss in more detail the characteristics of the respective models. It should be stressed that both of the following examples have been specially constructed for purposes of demonstration and do not constitute a complete or perfect system.
3.1 Systems based on production functions
3.1.1 Structure of the model The first example describes the use of production functions to determine the optimal variety of sugar-beet seed. The model itself was programmed by means of Multiplan, but could just as easily have been implemented in a procedural language such as Fortran, Basic or Pascal.
Six different inputs are expected from the program user:
-----expected average sum of temperature during the growth period -----expected average April temperature -----expected average precipitation during the growth period -----expected basic price for beets
These four input variables can be derived from well-documented past values. In addition, the user is asked for the
--beet-leaf price (i.e. the beet-leaf value rate if this is an internal price) --plant variety
forming the basis of a given set of calculations. If the first five input variables remain constant, the expected production
value of the varieties in question can be estimated. The best variety to sow will thus be the one that produces the highest production value under otherwise identical conditions.
The ranking of a given variety--which, as will be shown later, plays an important part as a parameter of production functions---can ideally be elicited from a data bank or, in this simple Multiplan model, provided
(~/,~)
~ N
)~Il
lAI.
RA~ OF
~ CON~T
I ~U
/dt}
I
SUGAR CONIENT
~]10
1 O
F
I I
SUG
AR C
ON
TI~T
C~NTDdT
~
Fig.
1.
Blo
ck d
iagr
am o
f th
e su
gar
beet
mod
el.
Representing knowledge in knowledge-based systems 61
~(o)
~AW
BP
AT MIN
LeQend:
BP
AT
AT MIN
AT A~
AT MAX
ol
P AT AT AW AT MAX
= PROPOR'IION OF BOL'IERS
= ~ ~RATURE
= MINIIJUN APRIL "IEHPE]~TURE
= ^~ERAG£ APRIL ~ A l U R E
= HA)ONt,IM APRIL TI~II:'ERA'11,111E
= SLOPE
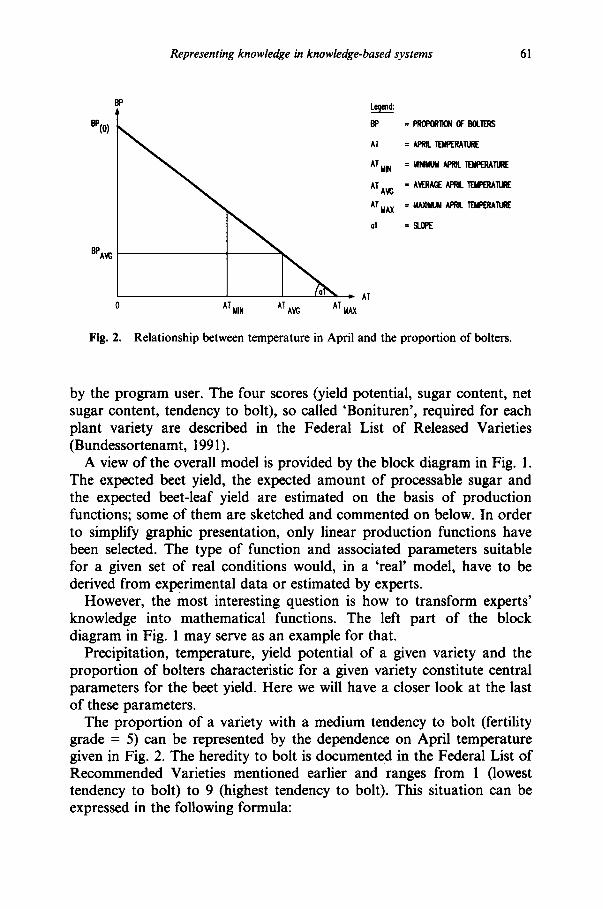
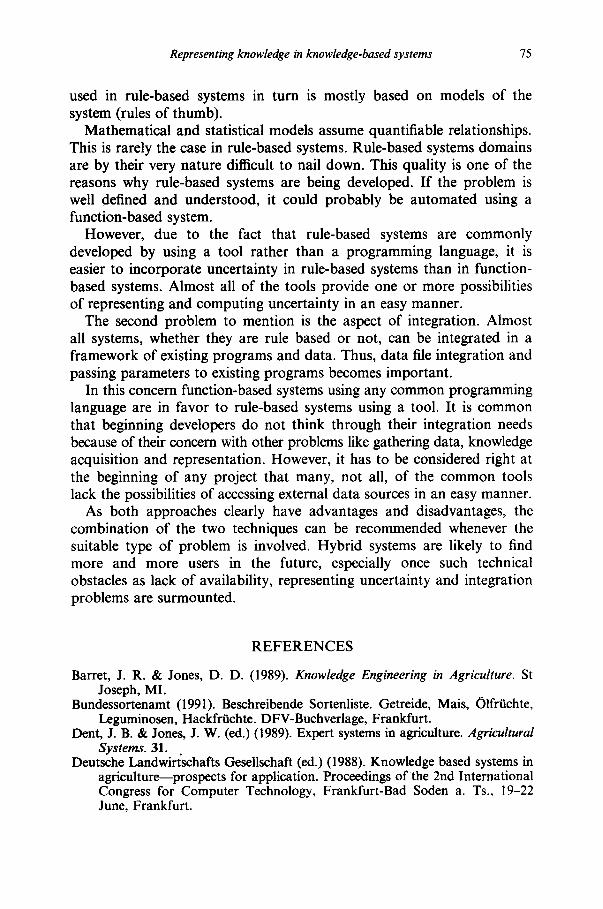
Fig. 2. Relationship between temperature in April and the proportion of bolters.
by the program user. The four scores (yield potential, sugar content, net sugar content, tendency to bolt), so called 'Bonituren', required for each plant variety are described in the Federal List of Released Varieties (Bundessortenamt, 1991).
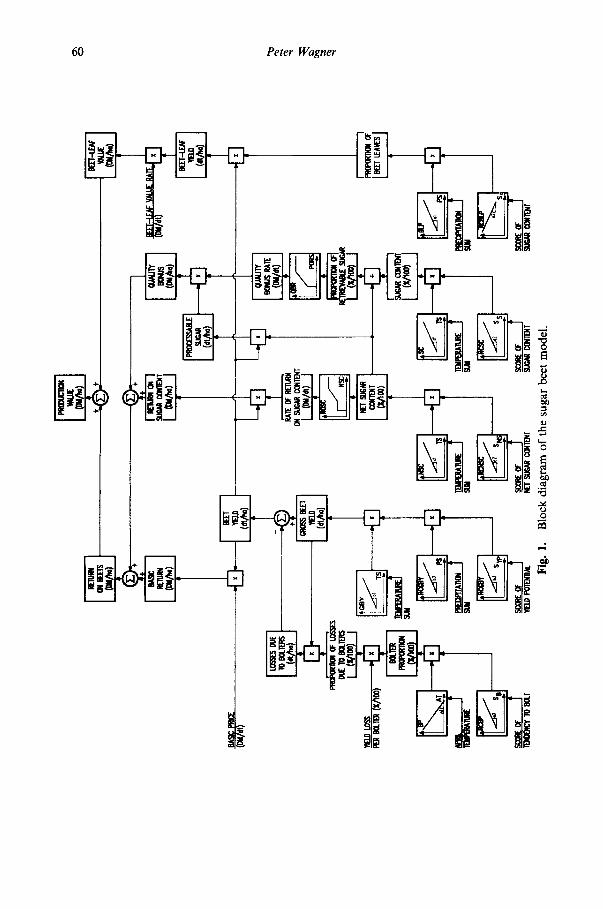
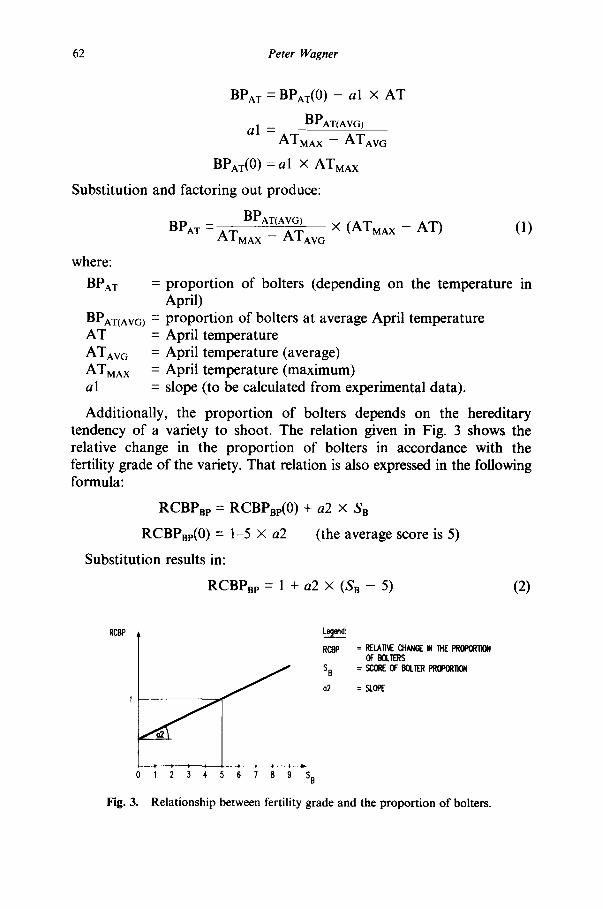
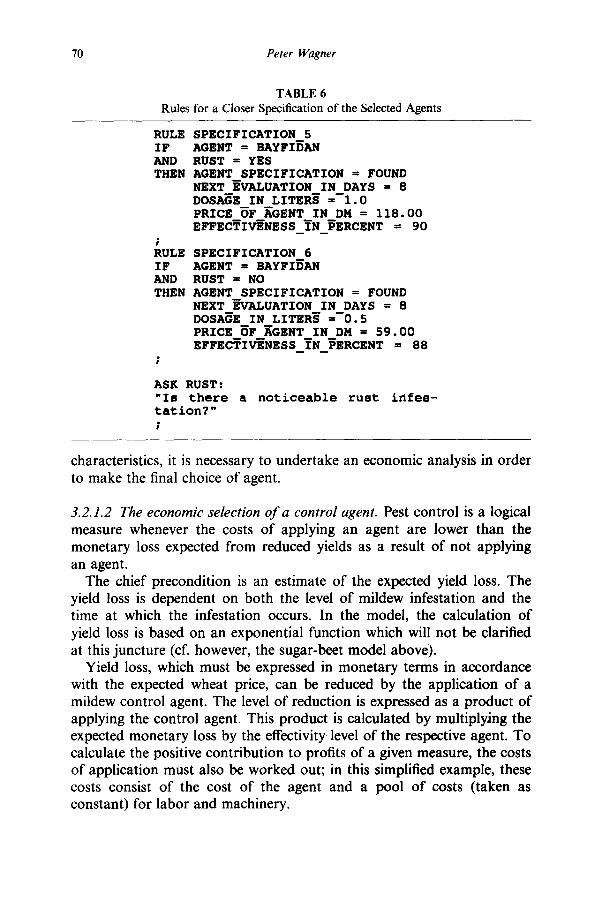
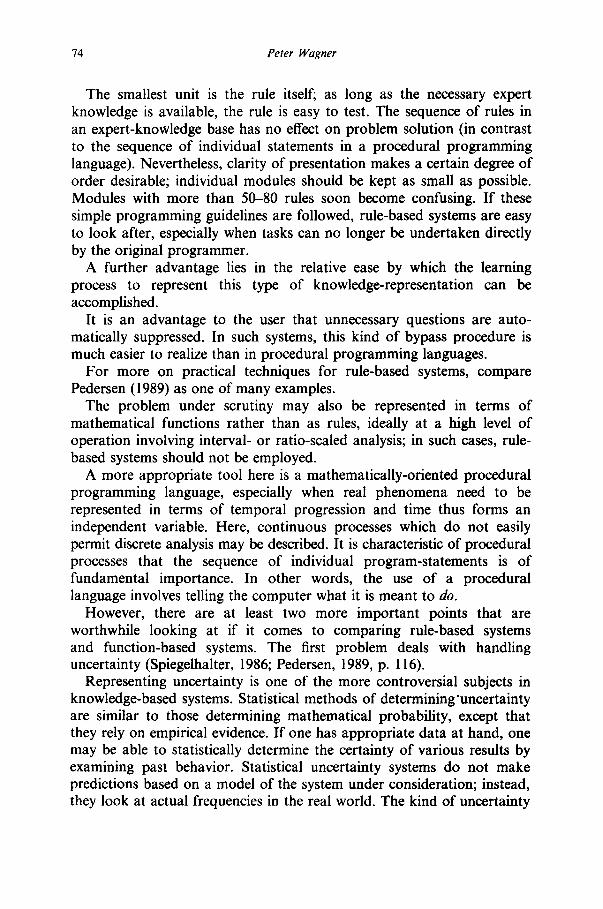
A view of the overall model is provided by the block diagram in Fig. 1. The expected beet yield, the expected amount of processable sugar and the expected beet-leaf yield are estimated on the basis of production functions; some of them are sketched and commented on below. In order to simplify graphic presentation, only linear production functions have been selected. The type of function and associated parameters suitable for a given set of real conditions would, in a 'real' model, have to be derived from experimental data or estimated by experts.
However, the most interesting question is how to transform experts' knowledge into mathematical functions. The left part of the block diagram in Fig. 1 may serve as an example for that.
Precipitation, temperature, yield potential of a given variety and the proportion of bolters characteristic for a given variety constitute central parameters for the beet yield. Here we will have a closer look at the last of these parameters.
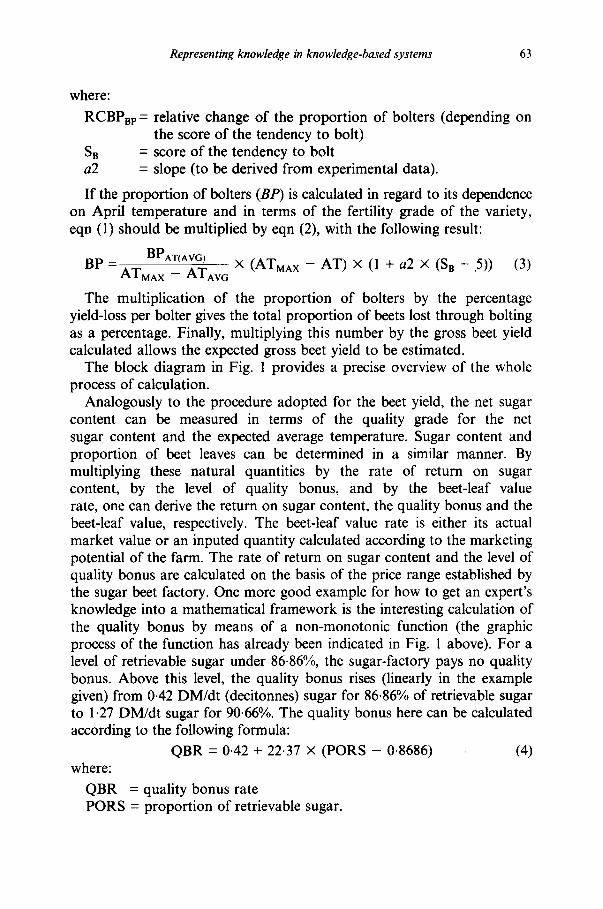
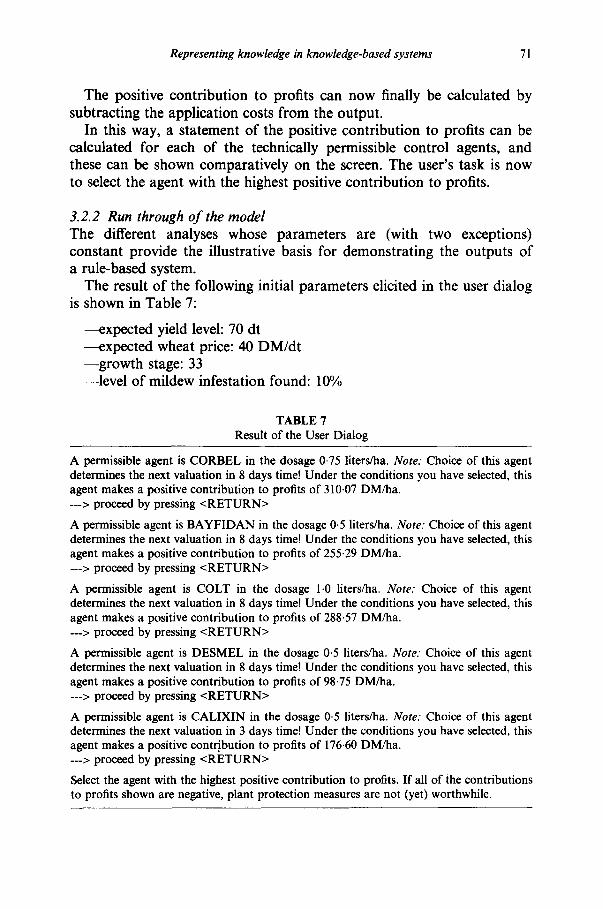
The proportion of a variety with a medium tendency to bolt (fertility grade = 5) can be represented by the dependence on April temperature given in Fig. 2. The heredity to bolt is documented in the Federal List of Recommended Varieties mentioned earlier and ranges from 1 (lowest tendency to bolt) to 9 (highest tendency to bolt). This situation can be expressed in the following formula:
62 Peter Wagner
BPAT = BPAT(0 ) -- a l × A T
al = BPAT(AVG) ATMA x -- ATAv G
BPAT(0 ) = al X ATMA x
Substitution and factoring out produce:
BPAT(AVG) BPAT = A T M A x _ ATAv C × ( A T M A x -- AT) (1)
where:
BPAT = proportion of bolters (depending on the temperature in April)
BPAT(AVG ) = proportion of bolters at average April temperature AT = April temperature ATAvG = April temperature (average) ATMA x = April temperature (maximum) a l = slope (to be calculated from experimental data).
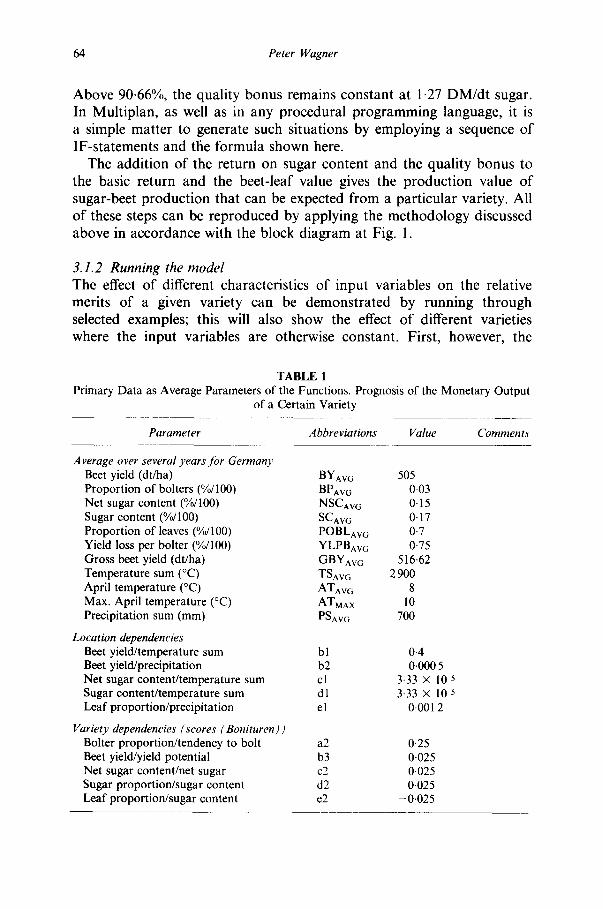
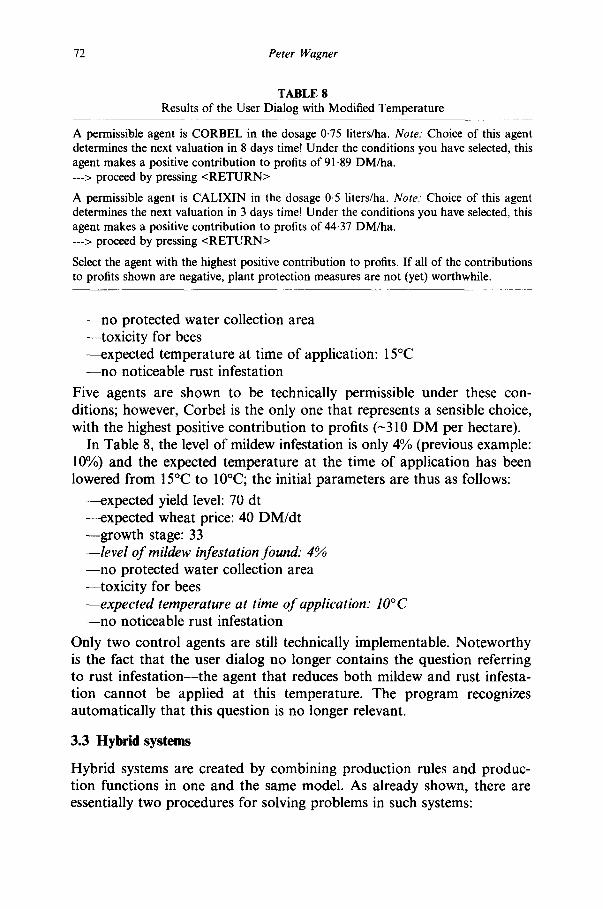
Additionally, the proportion of borers depends on the hereditary tendency of a variety to shoot. The relation given in Fig. 3 shows the relative change in the proportion of bolters in accordance with the fertility grade of the variety. That relation is also expressed in the following formula:
RCBPBp = RCBPBp(0) + a2 × SB
RCBPBp(0) = 1-5 x a2 (the average score is 5)
Substitution results in:
R C B P B p = 1 + a2 x (SB - 5) (2)
RCBP
p
1 2 3 4 5 6 7 8 9 S 8
Legend:
RCBP = RELATI~E CHANG[ IN "IHE PROPOR'flOfl OF BOLTERS
S B = SCORE OF BOL1ER PROPOR110g
a2 = ROPE
Fig. 3. Relat ionship between fertility grade and the propor t ion of bolters.
Representing knowledge in knowledge-based systems 63
where:
RCBPBp-- relative change of the proportion of bolters (depending on the score of the tendency to bolt)
SB = score of the tendency to bolt a2 -- slope (to be derived from experimental data).
If the proportion of bolters (BP) is calculated in regard to its dependence on April temperature and in terms of the fertility grade of the variety, eqn (1) should be multiplied by eqn (2), with the following result:
BP - BPAT(AVG) X (ATMA x -- AT) × (1 + a2 × (SB --5)) (3) ATMA x -- ATAv G
The multiplication of the proportion of bolters by the percentage yield-loss per bolter gives the total proportion of beets lost through bolting as a percentage. Finally, multiplying this number by the gross beet yield calculated allows the expected gross beet yield to be estimated.
The block diagram in Fig. 1 provides a precise overview of the whole process of calculation.
Analogously to the procedure adopted for the beet yield, the net sugar content can be measured in terms of the quality grade for the net sugar content and the expected average temperature. Sugar content and proportion of beet leaves can be determined in a similar manner. By multiplying these natural quantities by the rate of return on sugar content, by the level of quality bonus, and by the beet-leaf value rate, one can derive the return on sugar content, the quality bonus and the beet-leaf value, respectively. The beet-leaf value rate is either its actual market value or an inputed quantity calculated according to the marketing potential of the farm. The rate of return on sugar content and the level of quality bonus are calculated on the basis of the price range established by the sugar beet factory. One more good example for how to get an expert's knowledge into a mathematical framework is the interesting calculation of the quality bonus by means of a non-monotonic function (the graphic process of the function has already been indicated in Fig. 1 above). For a level of retrievable sugar under 86.86%, the sugar-factory pays no quality bonus. Above this level, the quality bonus rises (linearly in the example given) from 0.42 DM/dt (decitonnes) sugar for 86.86% of retrievable sugar to 1.27 DM/dt sugar for 90.66%. The quality bonus here can be calculated according to the following formula:
QBR = 0.42 + 22.37 × (PORS - 0-8686) (4) where:
QBR -- quality bonus rate PORS = proportion of retrievable sugar.
64 Peter Wagner
Above 90.66%, the quality bonus remains constant at 1.27 DM/dt sugar. In Multiplan, as well as in any procedural programming language, it is a simple matter to generate such situations by employing a sequence of IF-statements and the formula shown here.
The addition of the return on sugar content and the quality bonus to the basic return and the beet-leaf value gives the production value of sugar-beet production that can be expected from a particular variety. All of these steps can be reproduced by applying the methodology discussed above in accordance with the block diagram at Fig. 1.
3.1.2 Running the model The effect of different characteristics of input variables on the relative merits of a given variety can be demonstrated by running through selected examples; this will also show the effect of different varieties where the input variables are otherwise constant. First, however, the
TABLE 1 Primary Data as Average Parameters of the Functions. Prognosis of the Monetary Output
of a Certain Variety
Parameter Abbreviations Value Comments
Average over several years for German)' Beet yield (dt/ha) Proportion of bolters (%/100) Net sugar content (%/100) Sugar content (%/100) Proportion of leaves (%/100) Yield loss per bolter (%/100) Gross beet yield (dt/ha) Temperature sum (°C) April temperature (°C) Max. April temperature (°C) Precipitation sum (mm)
Location dependencies Beet yield/temperature sum Beet yield/precipitation Net sugar content/temperature sum Sugar content/temperature sum Leaf proportion/precipitation
Variety dependencies (scores ( Bonituren ) ) Bolter proportion/tendency to bolt Beet yield/yield potential Net sugar content/net sugar Sugar proportion/sugar content Leaf proportion/sugar content
BYAv G 505 BPAv G 0,03 NSCAv G 0.15 SCAv G 0.17 POBLAv G 0.7 YLPBAv G 0.75 GBYAv G 516.62 TSAv G 2 900 ATAv G 8 ATMA x 10 PSAv G 700
bl 0.4 b2 0-000 5 cl 3.33 × l(k5 dl 3.33 × 1(~ 5 el 0.001 2
a2 0-25 b3 0.025 c2 0.025 d2 0.025 e2 -0.025
Representing knowledge in knowledge-based systems 65
M u l t i p l a n w o r k s h e e t shou ld be brief ly c o m m e n t e d on; this is m a d e u p o f two par t s , a sect ion fo r p r i m a r y d a t a a n d a user section.
T h e p a r a m e t e r s for p r o d u c t i o n func t ions a re def ined in the sect ion a l loca ted to p r i m a r y d a t a ( shown in T a b l e 1). These include s o m e basic p a r a m e t e r s in the f o r m o f ave r age va lues fo r the Fede ra l Repub l i c o f
G e r m a n y ove r several years , as well as the g r a d u a t e d values o f the pre-
TABLE 2 User Section With User Inputs and Results
Parameter Abbreviation Value Range
User Inputs Parameters of the specific plot:
Temperature sum (°C) TS Temperature in April (°C) AT Precipitation (mm) PS
Fertility grades (Bonituren) of the variety in question:
2 600 ~- 2 600-3 200 7 =6--12
900 ~- 400-900
Yield potential FGyp 8 Tendency to bolt FGa 4 Net sugar content FGNc 3 Sugar content FG s 3
Results Expectations of prices:
Basic price of beets (DM/dt) BP 9.5 Beet leaf value rate (DM/dt) BLVR 1.5
Expectations of natural variables Gross beet yield (dr/ha) GBY 469.01 Proportion of bolters (%/100) BP 0.03 Fresh mass (dt/ha) FM 457-14 Net sugar content (%/100) NSC 0.13 Sugar content (%/100) SC 0.15 Proportion of retrievable sugar (% /100) PORS 0.875 0 Retrievable sugar (dt/ha) RS 60.80 Proportion of beet leaves (%/100) POBL 0.99 Beet leaf yield (dt/ha) BLY 451.19
Monetary outputs to be expected: Basic price of beets (DM/dt) BPB 9.50 Rate of return on sugar content (DM/dt) ROROSC 0.10 Quality bonus rate (DM/dt) QBR 0-56 Beet leaf value rate BLVR 1.50 Basic return (DM/ha) BR 4 342-79 Return on sugar content (DM/ha) ROSC 45-71 Quality bonus (DM/ha) QB 34.25 Return on beets (DM/ha) ROB 4422.76 Beet leaf value (DM/ha) BLV 676-79
Monetary output (DM/ha) ZRL 5 099.55
1-9 1-9 1-9 1-9
66 Peter Wagner
viously-mentioned equations, which are divided here into 'location depen- dencies' and 'variety dependencies' (the latter corresponding to the grades of fertility). These values are merely approximated for the present purpose.
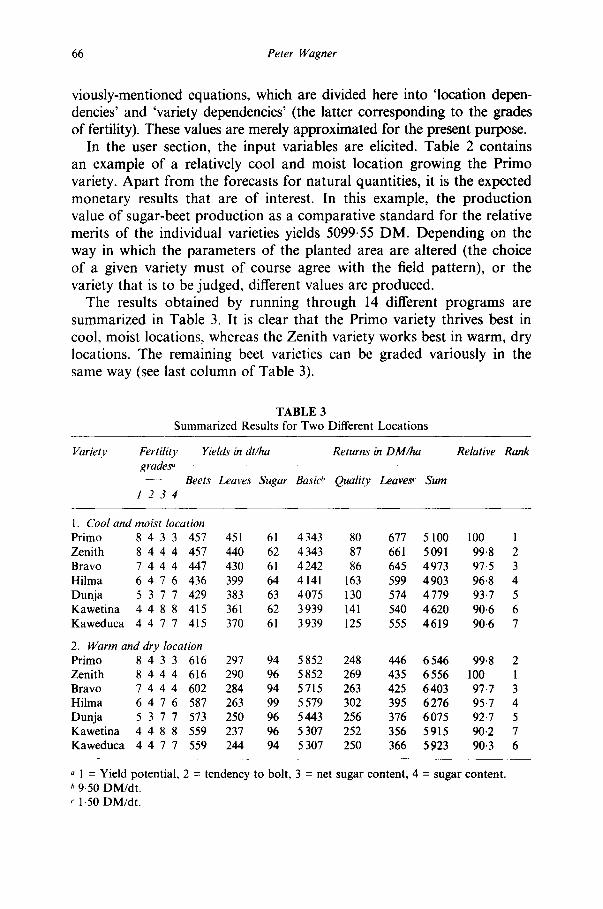
In the user section, the input variables are elicited. Table 2 contains an example of a relatively cool and moist location growing the Primo variety. Apart from the forecasts for natural quantities, it is the expected monetary results that are of interest. In this example, the production value of sugar-beet production as a comparative standard for the relative merits of the individual varieties yields 5099.55 DM. Depending on the way in which the parameters of the planted area are altered (the choice of a given variety must of course agree with the field pattern), or the variety that is to be judged, different values are produced.
The results obtained by running through 14 different programs are summarized in Table 3. It is clear that the Primo variety thrives best in cool, moist locations, whereas the Zenith variety works best in warm, dry locations. The remaining beet varieties can be graded variously in the same way (see last column of Table 3).
TABLE3 Summarized Results ~ r T w o DifferentLocations
Variety Fertility Yields' in dr/ha Returns in DM/ha Relative Rank grades~
1 2 3 4 . . . . Beets Leaves Sugar Basic~ Quality Leaves, Sum
1. Cool and moist location Primo 8 4 3 3 457 451 61 4343 80 677 5100 100 1 Zenith 8 4 4 4 457 440 62 4343 87 661 5091 99.8 2 Bravo 7 4 4 4 447 430 61 4242 86 645 4973 97.5 3 Hilma 6 4 7 6 436 399 64 4 141 163 599 4903 96.8 4 Dunja 5 3 7 7 429 383 63 4075 130 574 4779 93.7 5 Kawetina 4 4 8 8 415 361 62 3939 141 540 4620 90.6 6 Kaweduca 4 4 7 7 415 370 61 3939 125 555 4619 90.6 7
2. Warm and dry location Primo 8 4 3 3 616 297 94 5852 248 446 6546 99.8 2 Zenith 8 4 4 4 616 290 96 5852 269 435 6556 100 1 Bravo 7 4 4 4 602 284 94 5715 263 425 6403 97.7 3 Hilma 6 4 7 6 587 263 99 5579 302 395 6276 95.7 4 Dunja 5 3 7 7 573 250 96 5443 256 376 6075 92.7 5 Kawetina 4 4 8 8 559 237 96 5307 252 356 5915 90.2 7 Kaweduca 4 4 7 7 559 244 94 5307 250 366 5923 90.3 6
1 = Yield potential, b 9.50 DM/dt. , 1.50 DM/dt.
2 = tendency to bolt, 3 = net sugar content, 4 = sugar content.
Representing knowledge in knowledge-based systems 67
This model produces results on the basis of production functions; in the following section, a model based on production rules will be introduced.
3.2 Systems based on production rules
The purpose for which this model is applied is the control of mildew in wheat. The program itself is written with the help of the expert system shell VP-Expert from Paperback Software. This system, like those already discussed, makes no claim to being complete, and serves purely as demonstration. Nevertheless, a complete 'adult' model would function according to the same principles.
By applying a few criteria, the model locates suitable agents for the control of mildew in wheat (technical selection). The evaluation of the cost of the measure taken provides the user with a means of judging the most efficient method in regard to the cost : performance ratio (economic selection). The positive contribution to profits is calculated according to the expected yield, the price, and loss from mildew, as well as according to the costs of control and the degree of effectiveness of the agent applied. The detailed mathematical operation can be found in Section 3.2.1.2 below.
The program makes use of the 'knowledge' of seven pest-control agents (the plant-protection adviser Hartmut Glenz kindly offered his services for the interviews on knowledge acquisition).
TABLE 4 Decision Table for the Technical Selection of Fungicides ( x -- Application Possible)
Conditions that should be fulfilled for the
application of the fungicides
Calixin Desmel Colt Afugan Bayfidan Bayfidan Corbel (1 liter) (0.5 liter)
Mildew infestation >0 x
Growth stage >25 Growth stage >29 x
Growth stage >31 Temperature >4 and <21°C x
Temperature >7°C Temperature > 14°C Consideration for bees x
No consideration for bees x
Water protected area x
Not a water protected area x
Rust attack No rust attack x
X X X X X
X X X X
X
X
X X X X
X X X X
X X X X X
X X X X X
X X X X X
X
X X X X
X
X
X
X
X
X
X
TA
BL
E5
S~
cim
en R
ules
~rt
heT
ech
nic
alS
elec
tio
no
fa F
ungi
cide
0%
RULE AGENT 4
IF
MILDEW
INFESTATION
> 0
AND
GROWTH--STAGE >= 31
AND
CONSIDERATION
FOR BEES = NO
AND
WATER PROTECTED
AREA = NO
OR
WATER--PROTECTED--AREA = YES
AND
TEMPERATURE
>=
THEN AGENT - AFUGAN
RULE AGENT 7
IF
MILDEW
INFESTATION
> 0
AND
GROWTH STAGE >= 25
AND
CONSIDERATION
FOR BEES = NO
OR
CONSIDERATION--FOR--BEES
= YES
AND
WATER PROTECTED
AREA = NO
AND
TEMPERATURE
>= E
AND
TEMPERATURE
<= 20
THEN AGENT = CORBEL
ASK MILDEW
INFESTATION:
"How high Ts the level of mildew
infestation
on your field in %?"
ASK GROWTH STAGE:
"In what g~owth
stage is the wheat?"
ASK WATER PROTECTED
AREA:
"Is your field
situated
in a protected
water
collection
area?"
ASK CONSIDERATION
FOR BEES:
"Will you have to-make
consideration
for bees?"
ASK TEMPERATURE:
"How high will the temperature
be at the time of application?"
OC
Representing knowledge in knowledge-based systems 69
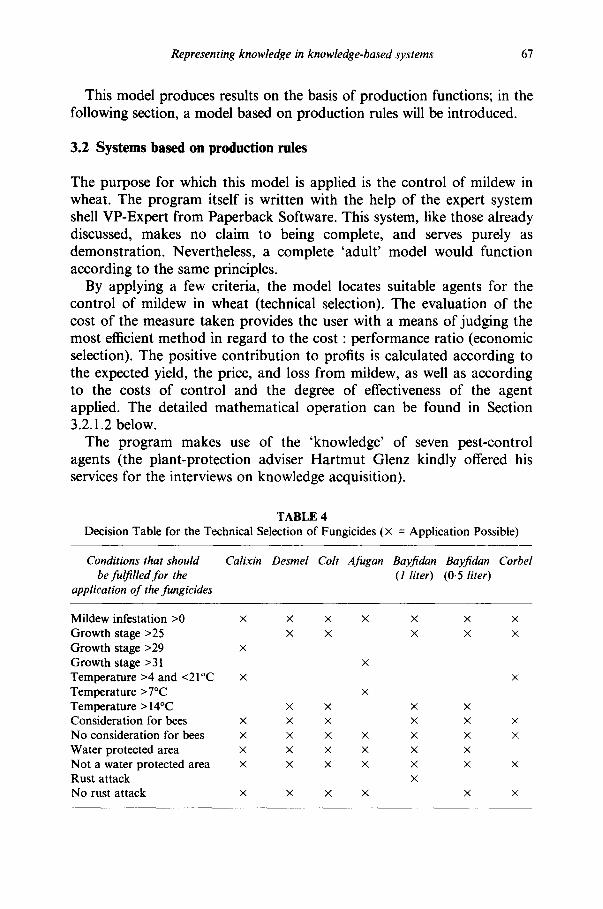
3.2. I Structure of the model 3.2.1.1 Technical selection of fungicides. The technical selection of control agents can best be represented by means of a decision matrix. The decision matrix which forms the basis of the program is shown in Table 4. The individual rows of this matrix describe the conditions that must be fulfilled in the application of the control agent. These agents are listed in the columns of the matrix. An ' x ' entered in a given field of the matrix means that the application of the control agent is possible under the relevant condition.
All in all, five conditions are shown in this decision matrix:
1. the growth stage; 2. the temperature; 3. the level of toxicity, if any, for bees; 4. the application of the agent in a protected water collection area; 5. the additional level of rust attack.
Depending on these various characteristics, the application of a control agent will be permissible or not.
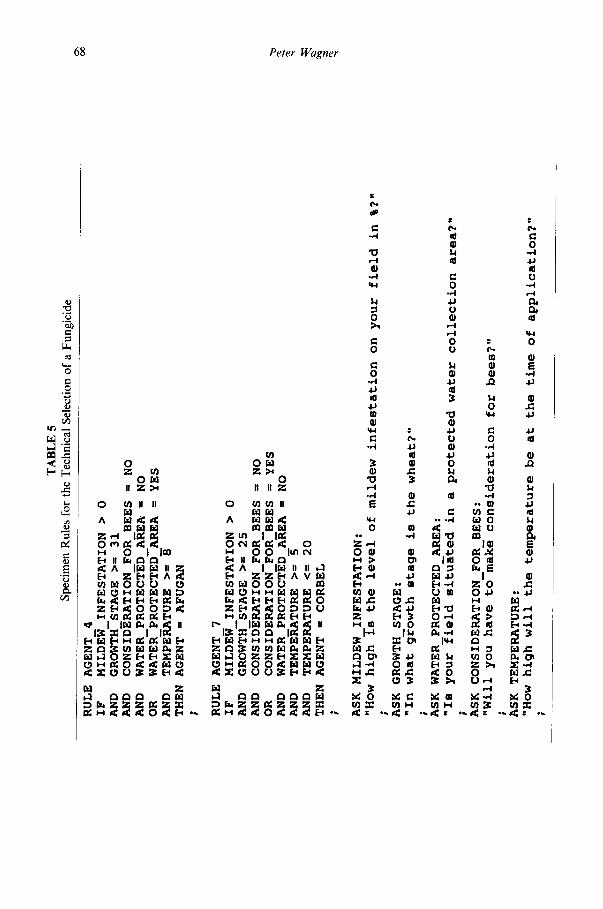
This decision matrix must now be converted into computer-readable form, i.e. rules that are capable of representing the content of the decision matrix must be formulated for a rule-based system. Two examples of rules for the technical selection of possible control agents are shown in Table 5.
The rule 'Rule Agent_7' (Corbel) provides an example of how this rule can be formulated verbally. The rule that appears here has selected the agent Corbel as being permissible, and indicates that the use of this agent is possible whenever a mildew infestation greater than 0 is present, the growth stage of the wheat-plant is equal to or greater than 25, and the field is not situated in a protected water collection area (it does not depend on whether considerations for bees have to be made or not; in other words, Corbel is not toxic for bees). Finally, the temperature at the time of application must be between 5 and 20°C. If the conditions listed are met, then Corbel is a technically applicable control agent. The rules for the other six agents can be represented in a similar fashion. In the lower portion of Table 5, the questions that are to be asked in the user-dialog for the individual conditions are formulated.
If all of the technically permissible agents are selected in this way, they must be specified more closely; this occurs in Table 6, which covers the allocation of quantities, the level of effectivity, and the cost of each control agent. The two rules shown in Table 6 also distinguish between various dosages in the presence of rust infestation.
After selecting the technically permissible agents and determining their
70 Peter Wagner
TABLE 6 Rules for a Closer Specification of the Selected Agents
RULE IF AND THEN
RULE IF AND THEN
SPECIFICATION 5 AGENT ~ EAYFIDAN RUST = YES AGENT SPECIFICATION = FOUND NEXT EVALUATION IN DAYS = 8 DOSAGE IN LITERS = 1.0 PRICE OF AGENT IN DM = 118.00 EFFECTIVENESS I--N P--ERCENT = 90
SPECIFICATION 6 AGENT = BAYFIDAN RUST = NO AGENT SPECIFICATION = FOUND NEXT EVALUATION IN DAYS = 8 DOSAG--E IN LITERS =--0.5 PRICE OF XGENT IN DM = 59.00 EFFECTIVENESS IN PERCENT = 88
ASK RUST: "Is there a tation?"
noticeable rust infes-
characteristics, it is necessary to undertake an economic analysis in order to make the final choice of agent.
3.2.1.2 The economic selection of a control agent. Pest control is a logical measure whenever the costs of applying an agent are lower than the monetary loss expected from reduced yields as a result of not applying an agent.
The chief precondition is an estimate of the expected yield loss. The yield loss is dependent on both the level of mildew infestation and the time at which the infestation occurs. In the model, the calculation of yield loss is based on an exponential function which will not be clarified at this juncture (cf. however, the sugar-beet model above).
Yield loss, which must be expressed in monetary terms in accordance with the expected wheat price, can be reduced by the application of a mildew control agent. The level of reduction is expressed as a product of applying the control agent. This product is calculated by multiplying the expected monetary loss by the effectivity level of the respective agent. To calculate the positive contribution to profits of a given measure, the costs of application must also be worked out; in this simplified example, these costs consist of the cost of the agent and a pool of costs (taken as constant) for labor and machinery.
Representing knowledge in knowledge-based systems 71
T h e posi t ive con t r i bu t i on to profi ts can n o w finally be ca lcula ted by sub t rac t ing the appl ica t ion costs f r o m the ou tpu t .
In this way, a s t a t emen t o f the posi t ive co n t r i b u t i o n to prof i ts can be ca lcula ted for each o f the technical ly permissible con t ro l agents, and these can be shown compara t i ve ly on the screen. Th e user 's task is n o w to select the agent wi th the highest posi t ive co n t r i b u t i o n to profits.
3.2.2 Run through o f the model T h e different analyses whose pa rame te r s are (with two except ions) cons t an t p rov ide the i l lustrat ive basis fo r d em o n s t r a t i n g the ou tpu t s o f a ru le-based system.
T h e result o f the fo l lowing initial pa rame te r s elicited in the user d ia log is shown in Tab le 7:
----expected yield level: 70 dt -----expected whea t price: 40 D M / d t - - g r o w t h stage: 33 - - l e v e l o f mi ldew infes ta t ion found: 10%
TABLE 7 Result of the User Dialog
A permissible agent is CORBEL in the dosage 0.75 liters/ha. Note: Choice of this agent determines the next valuation in 8 days time! Under the conditions you have selected, this agent makes a positive contribution to profits of 310.07 DM/ha. ---> proceed by pressing <RETURN>
A permissible agent is BAYFIDAN in the dosage 0.5 liters/ha. Note: Choice of this agent determines the next valuation in 8 days time! Under the conditions you have selected, this agent makes a positive contribution to profits of 255.29 DM/ha. ---> proceed by pressing <RETURN>
A permissible agent is COLT in the dosage 1.0 liters/ha. Note: Choice of this agent determines the next valuation in 8 days time! Under the conditions you have selected, this agent makes a positive contribution to profits of 288.57 DM/ha. ---> proceed by pressing <RETURN>
A permissible agent is DESMEL in the dosage 0.5 liters/ha. Note: Choice of this agent determines the next valuation in 8 days time! Under the conditions you have selected, this agent makes a positive contribution to profits of 98.75 DM/ha. ---> proceed by pressing <RETURN>
A permissible agent is CALIXIN in the dosage 0-5 liters/ha. Note: Choice of this agent determines the next valuation in 3 days time! Under the conditions you have selected, this agent makes a positive contn~bution to profits of 176.60 DM/ha. ---> proceed by pressing <RETURN>
Select the agent with the highest positive contribution to profits. If all of the contributions to profits shown are negative, plant protection measures are not (yet) worthwhile.
72 Peter Wagner
TABLE 8 Results of the User Dialog with Modified Temperature
A permissible agent is CORBEL in the dosage 0.75 liters/ha. Note: Choice of this agent determines the next valuation in 8 days time! Under the conditions you have selected, this agent makes a positive contribution to profits of 91.89 DM/ha. ---> proceed by pressing <RETURN>
A permissible agent is CALIXIN in the dosage 0.5 liters/ha. Note: Choice of this agent determines the next valuation in 3 days time! Under the conditions you have selected, this agent makes a positive contribution to profits of 44.37 DM/ha. ---> proceed by pressing <RETURN>
Select the agent with the highest positive contribution to profits. If all of the contributions to profits shown are negative, plant protection measures are not (yet) worthwhile.
- - n o protected water collection area -- toxici ty for bees ---expected temperature at time of application: 15°C - - n o noticeable rust infestation
Five agents are shown to be technically permissible under these con- ditions; however, Corbel is the only one that represents a sensible choice, with the highest positive contribution to profits (~310 DM per hectare).
In Table 8, the level of mildew infestation is only 4% (previous example: 10%) and the expected temperature at the time of application has been lowered from 15°C to 10°C; the initial parameters are thus as follows:
----expected yield level: 70 dt ---expected wheat price: 40 DM/dt - -g rowth stage: 33 --level of mildew infestation found: 4% - - n o protected water collection area -- toxici ty for bees --expected temperature at time of application: IO°C - - n o noticeable rust infestation
Only two control agents are still technically implementable. Noteworthy is the fact that the user dialog no longer contains the question referring to rust infestat ion--the agent that reduces both mildew and rust infesta- tion cannot be applied at this temperature. The program recognizes automatically that this question is no longer relevant.
3.3 Hybrid systems
Hybrid systems are created by combining production rules and produc- tion functions in one and the same model. As already shown, there are essentially two procedures for solving problems in such systems:
Representing knowledge in knowledge-based systems 73
--formulation of a sufficient number of rules reflecting the context in question;
----estimation of a function that describes the situation to be represented.
For problems of a continuously recurring nature, e.g. if time is the independent variable, it is more elegant to describe the context mathe- matically than to formulate rules. A necessary precondition is that the situation to be represented permits arithmetical-algorithmic description. Rules can only describe discrete circumstances; representing relationships of a continuous nature by rules leads to loss of information.
There is no reason why production rules and production functions should not be combined within the same model.
Hybrid models typically make use of the advantages of rule-based systems without having to sacrifice the advantages of function-based systems. Such models are particularly useful in situations requiring economic judgements, where problems may be solvable by diagnosis and therapy but also demand monetary evaluation. In this respect, the mildew-control example could be classified as a hybrid model. At the present time, problems of a technical rather than material nature are proving to be an obstacle to the programming involved in the construction of hybrid models, as many of the expert system shells on the market cannot deal satisfactorily with mathematical operations. There are a few exceptions, such as shells which permit the calculation of trigonometric or exponential functions.
4 COMPARATIVE VIEW OF PRODUCTION-RULE AND PRODUCTION-FUNCTION APPROACHES
Where the knowledge at hand does not lend itself to exact mathematical formulation, rule-based systems make it much easier to represent real phenomena in computer models. Experiences can, as it were, be formulated as heuristic rules of thumb and rendered computer-readable.
The acquisition of the relevant domain knowledge is still often a problem; competent experts are not always available, or are not able to describe what they know in the required rule format.
The use of rule-based systems can be considered whenever it is possible to formulate rules which are able to reflect the relevant state of affairs. In other words: in the application of a rule-based tool, the computer must be told what it is supposed to know.
The rules formulated make a system of this kind relatively easy to comprehend, as a given situation is represented in a form that human beings are familiar with.
74 Peter Wagner
The smallest unit is the rule itself; as long as the necessary expert knowledge is available, the rule is easy to test. The sequence of rules in an expert-knowledge base has no effect on problem solution (in contrast to the sequence of individual statements in a procedural programming language). Nevertheless, clarity of presentation makes a certain degree of order desirable; individual modules should be kept as small as possible. Modules with more than 50-80 rules soon become confusing. If these simple programming guidelines are followed, rule-based systems are easy to look after, especially when tasks can no longer be undertaken directly by the original programmer.
A further advantage lies in the relative ease by which the learning process to represent this type of knowledge-representation can be accomplished.
It is an advantage to the user that unnecessary questions are auto- matically suppressed. In such systems, this kind of bypass procedure is much easier to realize than in procedural programming languages.
For more on practical techniques for rule-based systems, compare Pedersen (1989) as one of many examples.
The problem under scrutiny may also be represented in terms of mathematical functions rather than as rules, ideally at a high level of operation involving interval- or ratio-scaled analysis; in such cases, rule- based systems should not be employed.
A more appropriate tool here is a mathematically-oriented procedural programming language, especially when real phenomena need to be represented in terms of temporal progression and time thus forms an independent variable. Here, continuous processes which do not easily permit discrete analysis may be described. It is characteristic of procedural processes that the sequence of individual program-statements is of fundamental importance. In other words, the use of a procedural language involves telling the computer what it is meant to do.
However, there are at least two more important points that are worthwhile looking at if it comes to comparing rule-based systems and function-based systems. The first problem deals with handling uncertainty (Spiegelhalter, 1986; Pedersen, 1989, p. 116).
Representing uncertainty is one of the more controversial subjects in knowledge-based systems. Statistical methods of determining'uncertainty are similar to those determining mathematical probability, except that they rely on empirical evidence. If one has appropriate data at hand, one may be able to statistically determine the certainty of various results by examining past behavior. Statistical uncertainty systems do not make predictions based on a model of the system under consideration; instead, they look at actual frequencies in the real world. The kind of uncertainty
Representing knowledge in knowledge-based systems 75
used in rule-based systems in turn is mostly based on models of the system (rules of thumb).
Mathematical and statistical models assume quantifiable relationships. This is rarely the case in rule-based systems. Rule-based systems domains are by their very nature difficult to nail down. This quality is one of the reasons why rule-based systems are being developed. If the problem is well defined and understood, it could probably be automated using a function-based system.
However, due to the fact that rule-based systems are commonly developed by using a tool rather than a programming language, it is easier to incorporate uncertainty in rule-based systems than in function- based systems. Almost all of the tools provide one or more possibilities of representing and computing uncertainty in an easy manner.
The second problem to mention is the aspect of integration. Almost all systems, whether they are rule based or not, can be integrated in a framework of existing programs and data. Thus, data file integration and passing parameters to existing programs becomes important.
In this concern function-based systems using any common programming language are in favor to rule-based systems using a tool. It is common that beginning developers do not think through their integration needs because of their concern with other problems like gathering data, knowledge acquisition and representation. However, it has to be considered right at the beginning of any project that many, not all, of the common tools lack the possibilities of accessing external data sources in an easy manner.
As both approaches clearly have advantages and disadvantages, the combination of the two techniques can be recommended whenever the suitable type of problem is involved. Hybrid systems are likely to find more and more users in the future, especially once such technical obstacles as lack of availability, representing uncertainty and integration problems are surmounted.
REFERENCES
Barret, J. R. & Jones, D. D. (1989). Knowledge Engineering in Agriculture. St Joseph, MI.
Bundessortenamt (1991). Beschreibende Sortenliste. Getreide, Mais, Olfrtichte, Leguminosen, Hackfriichte. DFV-Buchverlage, Frankfurt.
Dent, J. B. & Jones, J. W. (ed.) (1989). Expert systems in agriculture. Agricultural Systems. 31.
Deutsche Landwirt'schafts Gesellschaft (ed.) (1988). Knowledge based systems in agriculture--prospects for application. Proceedings ofthe 2nd International Congress for Computer Technology, Frankfurt-Bad Soden a. Ts., 19-22 June, Frankfurt.
76 Peter Wagner
Huirne, R. B. M. (1990). Computerized management support for swine breeding farms. PhD Thesis, Wageningen.
Jones, P., Jones, J. W., Everet, P. A. & Beck, H. Knowledge acquisition: A case history of an insect control expert system. ASAE Paper No. 86-5041, ASAE, St Joseph, MI.
Kersebaum, K. C. (1989). Die Simulation der Stickstoff-Dynamik von Ackerb~den. PhD Thesis, Hannover.
Kuhlmann, F. (ed.) (1990). Integrated decision support systems in agriculture-- successful practical applications. Proceedings of the 3rd International Congress for Computer Technology, Frankfurt-Bad Soden a. Ts., 27-30 May, Frankfurt.
Kuhlmann, F. & Mfihe, C. (1990). Computergestiitzte Entscheidungsmodelle zur Bestandsffihrung im Winterweizen. In Integrierte Pflanzenproduktion, ed. R. Heitefuss. VCH Verlagsgesellschaft, Weinheim, pp. 249-62.
Kuhlmann, F. & Wagner, P. (1986). Zur Nutzung der Informationselektronik in der Landwirtschaft. In: Berichte iiber Landwirtschaft, Bd. 64, H. 3. Paul Parey, Hamburg und Berlin, pp. 408-40.
Lal, H., Peart, R. M. & Jones, J. W. (1987). Expert systems for technology transfer. ASAE Paper No. 87-5028, ASAE, St Joseph, MI.
Learned Information (Europe) Ltd (1986). The CRI Directory of Expert Systems. Oxford.
McClendon, R. W., Batchelor, W. D. & Jones, J. W. (1987). Insect pest manage- ment with an expert system coupled crop model. ASAE Paper No. 87-4501, ASAE, St Joseph, MI.
Mflhe, C. (1989). Micro-Simplan--ein computergestiitzter Simulator ftir land- wirtschaftliche Unternehmen. PhD Thesis, GieBen.
Pedersen, K. (1989). Expert Systems Programming--Practical Techniques for Rule Based Systems. Wiley, New York.
Schiefer, G. (ed.) (1989). Expertensysteme in der Agrarwirtschaft." Entwicklung, Erfahrung, Perspektiven. Vauk, Kiel.
Spiegelhalter, D. J. (1986). A statistical view of uncertainty in expert systems. In Artificial Intelligence & Statistics, ed. W. A. Gale. Addison-Wesley, Reading, pp. 17-55.
Thieme, R. H. et al. (1987). Expert system technique applied to grain marketing analysis. Computers and Electronics in Agriculture, 1(4), 299-308.
Wagner, P. (1992). Methodische Grundlagen und praktische Entwicklung eines Expertensystems fiir die Wirtschaftlichkeitsanalyse landwirtschaftlicher Betriebe. In Agarwirtschaft, 132. Frankfurt, 1992.
Wagner, P. & Kuhlmann, F. (1991). Concept and implementation of an integrated decision support system (IDSS) for capital intensive farming. Agricultural Economics, 5(3), 287-310.
Yost, R. S. et al. (1988). Expert systems in agriculture: determining the lime recommendation for soils in the humid tropics. Research Extension Series 089-03.88. College of Tropical Agriculture and Human Resources, University of Hawaii, Honolulu.
Whittaker, A. D. & Thieme, R. H. (ed.) (1990). Integration of knowledge systems in agricultural problem solving. In Computers and Electronics in Agriculture, 4.