Embed Size (px)
Citation preview
PNNL-18244
Techniques to Access Databases and Integrate Data for Hydrologic Modeling Gene Whelan Nathan D. Tenney Mitchell A. Pelton André M. Coleman Duane L. Ward James G. Droppo Jr. Philip D. Meyer Kevin E. Dorow Randal Y. Taira February 2009
PNNL-18244
Techniques to Access Databases and Integrate Data for Hydrologic Modeling Gene Whelan* Nathan D. Tenney Mitchell A. Pelton André M. Coleman Duane L. Ward James G. Droppo Jr. Philip D. Meyer Kevin E. Dorow Randal Y. Taira February 2009 Prepared for The U.S. Nuclear Regulatory Commission Office of Nuclear Regulatory Research Washington, DC 20555-0001 under a Related Services Agreement with the U.S. Department of Energy Contract DE-AC05-76RL01830 Pacific Northwest National Laboratory Richland, Washington 99352 *now at U.S Environmental Protection Agency Athens, Georgia 30605
iii
Summary
This document addresses techniques to access and integrate data for defining site-specific conditions and behaviors associated with ground-water and surface-water radionuclide transport applicable to U.S. Nuclear Regulatory Commission reviews. Environmental models typically require input data from multiple internal and external sources that may include, but are not limited to, stream and rainfall gage data, meteorological data, hydrogeological data, habitat data, and biological data. These data may be retrieved from a variety of organizations (e.g., federal, state, and regional) and source types (e.g., HTTP, FTP, and databases). Available data sources relevant to hydrologic analyses for reactor licensing are identified and reviewed. The data sources described can be useful to define model inputs and parameters, including site features (e.g., watershed boundaries, stream locations, reservoirs, site topography), site properties (e.g., surface conditions, subsurface hydraulic properties, water quality), and site boundary conditions, input forcings, and extreme events (e.g., stream discharge, lake levels, precipitation, recharge, flood and drought characteristics). Available software tools for accessing established databases, retrieving the data, and integrating it with models were identified and reviewed. The emphasis in this review was on existing software products with minimal required modifications to enable their use with the FRAMES modeling framework. The ability of four of these tools to access and retrieve the identified data sources was reviewed. These four software tools were the Hydrologic Data Acquisition and Processing System (HDAPS), Integrated Water Resources Modeling System (IWRMS) External Data Harvester, Data for Environmental Modeling Environmental Data Download Tool (D4EM EDDT), and the FRAMES Internet Database Tools. The IWRMS External Data Harvester and the D4EM EDDT were identified as the most promising tools based on their ability to access and retrieve the required data, and their ability to integrate the data into environmental models using the FRAMES environment.

v
Acronyms, Initialisms, and Abbreviations
3MRA Multimedia Multi-pathway Multi-receptor Risk Assessment
ACOE U.S. Army Corps of Engineers
AIRS Atmospheric Infrared Sounder
ALI Advanced Land Imager
ARAMS Department of Defense’s Advanced Risk Assessment Modeling System
ARS Agricultural Research Service
AS2GT AMSR-E Swath to Grid Toolkit
ASTER Advanced Spaceborne Thermal Emission and Reflection Radiometer
AVHRR Advanced Very High Resolution Radiometers
BASINS Better Assessment Science Integrating point and Non-point Sources
CLIMAPS Climate Maps
CLIMVIS Climate Visualization
COL Combined Operating License
CUAHSI Consortium of Universities for the Advancement of Hydrologic Science Inc.
CUAHSI-HIS "Consortium of Universities for the Advancement of Hydrologic Science, Inc. Hydrologic Information System"
D4EM Data for Environmental Modeling
DCE Database Client Editor
DEM digital elevation model
DET Data Extraction Tool
DICs DICtionary files
DLG digital line graph
DOE U.S. Department of Energy
DOQ Digital Orthophoto Quadrangles
DOQQ Digital Orthophoto Quarter Quadrangles
DOT Database Owner’s Tool
DRG Digital Raster Graphics
EDDT Environmental Data Download Tool
eFOTGs Electronic Field Office Technical Guides
EIS Environmental impact statement
EOS IT EOS Imaging Tool
EPA U.S. Environmental Protection Agency
EROS USGS Center for Earth Resources Observation and Science
vi
FRAMES Framework for Risk Analysis in Multimedia Environmental Systems
GALE Computer code for estimating Gaseous and Liquid Effluents from Nuclear Electrical Power Generation Reactors
GPM Global Precipitation Measurement
GRACE Gravity Recovery and Climate Experiment
HDAPS Hydrologic Data Acquisition and Processing System
HDF-EOS Hierarchical Data Format - Earth Observing System
HIS Hydrologic Information System
HSI Hyperspectral Imaging Instrument
HydroGET Hydrologic GIS Extraction Tool
HYDROS HYDROSphere
IWRMS Integrated Water Resources Modeling System
JFD Joint Frequency Data
LDC Legacy Data Center
LULC Land Use Land Cover
MISR Multi-Angle Imaging SpectroRadiometer
MODIS Moderate Resolution Imaging Spectroradiometer
MS2GT MODIS Swath-to-Grid Toolbox
NASA National Aeronautics and Space Administration
NCDC National Climatic Data Center
NCEP National Center for Environmental Prediction
NCGC National Cartography and Geospatial Center
NDFD National Digital Forecast Database
NED National Elevation Dataset
NESDIS National Environmental Satellite Data and Information Service
NHD National Hydrography Dataset
NLCD National Land Cover Data
NOAA National Oceanic and Atmospheric Administration
NOHRSC National Operational Hydrologic Remote Sensing Center
NRC U.S. Nuclear Regulatory Commission
NRCS Natural Resources Conservation Service
NSIDC National Snow and Ice Data Center
NSSC National Soil Survey Center
NWIS National Water Information System
NWS National Weather Service
vii
OSD Official Soil Series Descriptions
PNNL Pacific Northwest National Laboratory
PRISM Parameter-elevation Regressions on Independent Slopes Model
PTF pedotransfer function
SCA Snow Covered Area
SCAN Soil Climate Analysis Network
SCRAM Support Center for Regulatory Atmospheric Modeling
SNODAS Snow Data Assimilation System
SSL Soil Survey Laboratory
SSURGO Soil Survey Geographic
STAR Stability Array
STATSGO State Soil Geographic
STORET Storage and Retrieval
SVN Subversion
SWCD Soil and Water Conservation Districts
TIMED Thermosphere Ionosphere Mesosphere Energetics and Dynamics
USCRN U.S. Climate Reference Network
USGS U.S. Geological Survey
VBA Visual Basic for Applications
WBD Watershed Boundary Data
WSS Web Soil Survey

ix
Contents
Summary ........................................................................................................................................... iii Acronyms, Initialisms, and Abbreviations .......................................................................................... v
1.0 INTRODUCTION ................................................................................................................... 1.1
2.0 TYPICAL DATA CONSUMED AND PRODUCED BY DIFFERENT MODEL TYPES ... 2.1
3.0 AVAILABLE DATA SOURCES RELEVANT TO HYDROLOGIC ANALYSES FOR REACTOR LICENSING ........................................................................................................ 3.1
3.1 U.S. Geological Survey (USGS) ..................................................................................... 3.1
3.2 Agricultural Research Service (ARS) ............................................................................. 3.2
3.3 Natural Resources Conservation Service (NRCS) .......................................................... 3.3
3.4 U.S. Army Corps of Engineers (ACOE) ......................................................................... 3.7
3.5 National Oceanic and Atmospheric Administration (NOAA) ........................................ 3.8
3.6 U.S. Environmental Protection Agency (EPA) ............................................................... 3.9
3.7 National Aeronautics and Space Administration (NASA) ............................................ 3.10
4.0 READILY AVAILABLE SOFTWARE FOR RETRIEVING DATA FOR INTEGRATION WITH MODELS ..................................................................................................................... 4.1
4.1 Data Retrieval Function Overview .................................................................................. 4.1
4.2 Summary of Data Acquisition Systems........................................................................... 4.2
4.2.1 Hydrologic Data Acquisition and Processing System .......................................... 4.2
4.2.2 Integrated Water Resources Modeling System External Data Harvester ............. 4.2
4.2.3 Data for Environmental Modeling Environmental Data Download Tool ............ 4.3
4.2.4 FRAMES Data Client Editor, Data Owner Tool, Data Extraction Tool .............. 4.3
4.2.5 FRAMES Joint Frequency Distribution Generator .............................................. 4.3
4.2.6 National Snow and Ice Data Center ..................................................................... 4.4
4.2.7 CUAHSI Hydrologic Information System ........................................................... 4.5
4.3 Evaluation of Web-Based Data Sources ......................................................................... 4.5
5.0 Conclusion ............................................................................................................................... 5.1
6.0 REFERENCES ........................................................................................................................ 6.1
APPENDIX A. FRAMES 2.0 System Input Dictionaries .............................................................. A.1
APPENDIX B. Selected FRAMES 2.0 Dictionaries ...................................................................... B.1
APPENDIX C. Hydrologic Data Acquisition and Processing System ........................................... C.1
APPENDIX D. Data for Environmental Modeling......................................................................... D.1
x
Tables
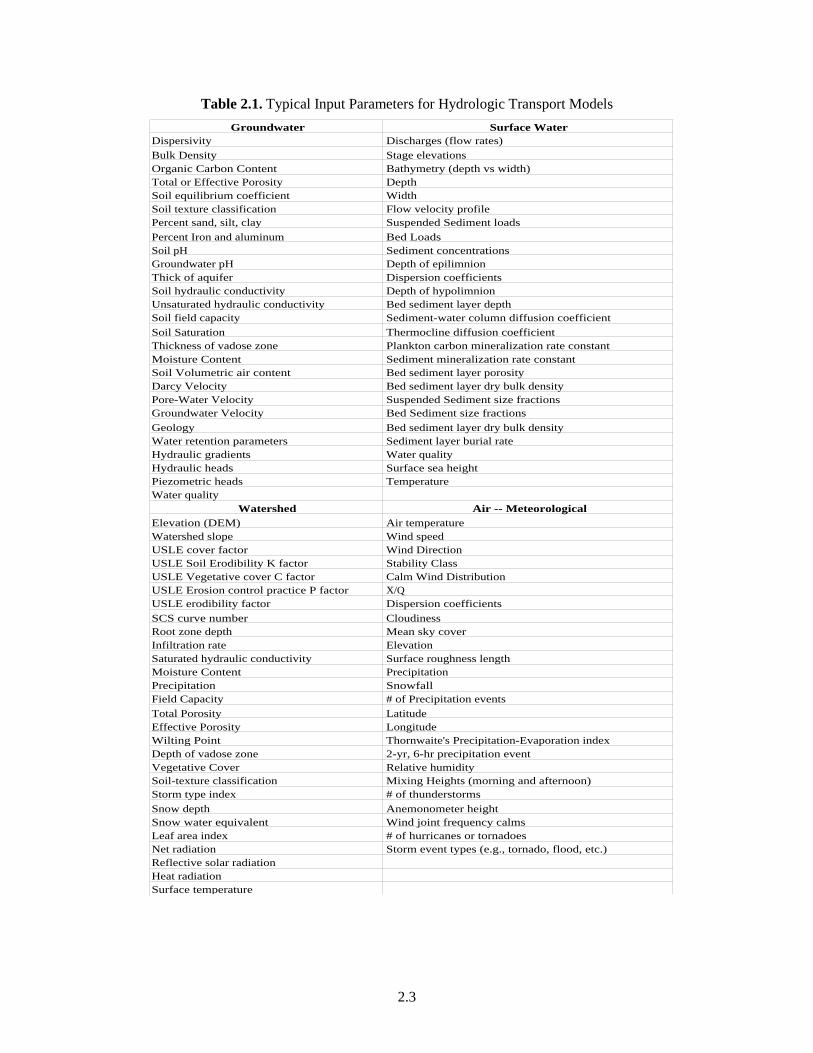
Table 2.1. Typical Input Parameters for Hydrologic Transport Models .......................................... 2.3
Table 4.1. Data Access Table......................................................................................................... 4.11
1.1
1.0 INTRODUCTION
The U.S. Nuclear Regulatory Commission (NRC) staff members have the role of reviewing Early Site Permit (ESP) and Combined License (COL) applications for new nuclear power plants. Using site-specific information from the ESP and COL applications, NRC staff will draft environmental impact statements (EIS) and perform confirmatory safety-related analyses for these proposed new plants. In assessing the potential consequence of licensing actions, the NRC must evaluate the potential for human exposure to radioactive contaminants. The work described here is aimed at improving the analysis tools available to NRC staff. This document addresses techniques to access and integrate data for defining site-specific conditions and behaviors associated with ground-water and surface-water radionuclide transport. The overall project effort includes streamlining the uncertainty methodology previously developed for the NRC (Meyer et al. 2007) for assessing surface-water and ground-water conceptual models including parameters and scenarios that control site performance related to radionuclide transport. This effort is a step toward merging this uncertainty methodology broadly within the FRAMES1 technology to create a resource for NRC staff. Reviews of ESP and COL applications require an ability to regularly collect data from a variety of data sources. Environmental models typically require input data from multiple internal and external sources that may include, but are not limited to, stream and rainfall gage data, meteorological data, hydrogeological data, habitat data, and biological data. These data may be retrieved from a variety of organizations (e.g., federal, state, and regional) and source types (e.g., HTTP, FTP, and databases). The two objectives of this report are to: 1. Identify and review available data sources relevant to hydrologic analyses for reactor licensing,
including available sources for data and information that are useful in assigning values to the parameters of models used in reactor licensing analyses and in assessing uncertainty in parameter values.
2. Identify and review available software tools for accessing established field databases (e.g., USGS, EPA, and State Web sites), retrieving data, and integrating it with models. The emphasis in this review was on existing software products with minimal required modifications to enable their use with FRAMES.
This report addresses improving the process of accessing data for hydrological modeling analyses. Section 2 provides illustrative examples of environmental modeling data needs and typical parameters used in environmental assessments. Potential sources of data meeting input needs for various environmental models are identified and described in Section 3. Currently available automated data retrieval and manipulation software packages are identified and described in Section 4. Where possible, the data harvesting tools that might be used to retrieve data from the sources described in Section 3 are identified. Section 5 provides a few concluding remarks. More detailed information on some of the software tools is provided in appendices.
1 FRAMES is a PC-based computerized modeling environment for insertion and sequential linking of models with a suite of tools for input/output data access, input, processing, and viewing. The FRAMES modeling environment includes tools for defining analysis scenarios and the uncertainties associated with applying these scenarios in applications.
2.1
2.0 TYPICAL DATA CONSUMED AND PRODUCED BY DIFFERENT MODEL TYPES
The data that a given hydrological transport model consumes are highly dependent on the specific implementation of that model. In general, such models require definition of data parameters that fully characterize the spatial, temporal, physical, and chemical aspects of an application. These data are needed to define the different but often-interdependent aspects of an application: environmental release (i.e., source term), transport, and receptor. These data inputs for models are defined as either primary inputs or secondary inputs; primary inputs are values that directly define an environmental parameter that is used in the hydrological transport modeling; secondary inputs are values that are used to estimate an application-specific primary input value. The emphasis in this review will be on the model input parameters that are typically required -- and as a result will include both primary and secondary data parameters. Therefore, the lists will not necessarily contain mutually exclusive parameters. For the hydrologic models (groundwater, surface water, and watershed), these parameters can be loosely grouped as source-term, vadose zone, aquifer, surface water body, watershed, and atmospheric parameters. The definition of the input data parameters required by hydrological transport models can be accomplished as 1) implicit in the model formulation, 2) as a single embedded value fixed in the model code, 3) as a generic value based on pertinent aspects of the application, 4) as a primary model input parameter, and 5) as a value computed based on secondary model input parameters. Approaches 2 and 3 are normally embedded in the model coding and are often referred to as “hard-wired” values. Approaches 4 and 5 typically define the data that a model requires as input (i.e., that the model consumes). Many model implementations provide options for using the latter two approaches as a means of overriding “hard-wired” values. The parameters are output by a hydrological transport code for two main purposes. The first purpose is to document sufficient details in the modeling to allow critical evaluations of the release, transport, and exposure results. The second purpose is to provide the results in a format that meets the needs of an environmental analysis. For some analysis, these results are the final product of the analysis. But for many analyses these results are intermediate data that become input to another model – and change from parameters that are produced to parameters that are consumed. Although the specific input and output data parameters used in model application are a function of the model’s formulation and the implementation of that formulation, it is possible to use our general knowledge of the formulations and their applications to generate a list of typical data parameters. Table 2.1 provides an overview of input parameters that can be expected to be consumed by the various types of hydrological transport models. The typical output parameters for use in environmental analyses provide concentrations expressed in several possible forms (peak value, average value, an integrated exposure, time series, and spatial array). For linkages of hydrologic models, the concentrations by a producer model need to match (or be matched to) the input required by the consumer model. For linkages to health and damage assessment models, output parameters define environmental exposures, intake/uptake rates, doses, hazard levels, and health risk. For ecological impact analyses, output parameters define the habitat and biological stresses. The data that a given hydrological transport model consumes are highly dependent on the specific implementation of that model – and the data parameters need to fully characterize the spatial, temporal,
2.2
physical, and chemical aspects of an application. The result is the need to define a complex set of parameters that serve documentation, logical, and computational aspects of a modeling application. Over its decade-plus of development, a series of emission, transport, and impact analysis models have been incorporated in FRAMES. The FRAMES implementation details provide a basis for understanding the parameters that are needed for defining a single model application and providing a linkage of parameters between models. In FRAMES, parameters and their properties are defined in a series of metadata files referred to as dictionaries. These FRAMES parameters provide a means of viewing lists of variables that are typically associated with assessments. Appendix A contains a list of the various “System Input Dictionaries” that have been implemented in the FRAMES systems as of the time of preparation of this report. The list shows the dictionaries that were needed both for specific models (surface water, aquifer, exposures, etc.) as well as supporting databases (constituent properties, organisms, toxicity values, etc.). These dictionaries are extensive and too long to be included here. To provide the reader with an appreciation of their contents, Appendix B contains tables with portions of the contents of selected FRAMES dictionaries related to source term, transport, and impact analyses. This report is mainly concerned with the defining values of the parameters with variable types of float and integer – although text and logical types variables may be needed as secondary inputs to implicitly define primary inputs. The breath of content in the FRAMES dictionaries illustrate that the relatively short list of typical input values expands during implementation to wide ranges of parameter values associated with each step in a modeling analysis. The use of a modeling framework such as FRAMES provides an efficient means of defining, storing, and using values for the input parameters required by hydrologic transport models. The parameters in the FRAMES dictionaries were used as a guide to defining the types of databases that will be useful in conducting NRC modeling applications.
2.3
Table 2.1. Typical Input Parameters for Hydrologic Transport Models Groundwater Surface Water
Dispersivity Discharges (flow rates)Bulk Density Stage elevationsOrganic Carbon Content Bathymetry (depth vs width)Total or Effective Porosity DepthSoil equilibrium coefficient WidthSoil texture classification Flow velocity profilePercent sand, silt, clay Suspended Sediment loadsPercent Iron and aluminum Bed LoadsSoil pH Sediment concentrationsGroundwater pH Depth of epilimnionThick of aquifer Dispersion coefficientsSoil hydraulic conductivity Depth of hypolimnionUnsaturated hydraulic conductivity Bed sediment layer depthSoil field capacity Sediment-water column diffusion coefficientSoil Saturation Thermocline diffusion coefficientThickness of vadose zone Plankton carbon mineralization rate constantMoisture Content Sediment mineralization rate constantSoil Volumetric air content Bed sediment layer porosityDarcy Velocity Bed sediment layer dry bulk densityPore-Water Velocity Suspended Sediment size fractionsGroundwater Velocity Bed Sediment size fractionsGeology Bed sediment layer dry bulk densityWater retention parameters Sediment layer burial rateHydraulic gradients Water qualityHydraulic heads Surface sea heightPiezometric heads TemperatureWater quality
Watershed Air -- MeteorologicalElevation (DEM) Air temperatureWatershed slope Wind speedUSLE cover factor Wind DirectionUSLE Soil Erodibility K factor Stability ClassUSLE Vegetative cover C factor Calm Wind DistributionUSLE Erosion control practice P factor X/QUSLE erodibility factor Dispersion coefficientsSCS curve number CloudinessRoot zone depth Mean sky coverInfiltration rate ElevationSaturated hydraulic conductivity Surface roughness lengthMoisture Content PrecipitationPrecipitation SnowfallField Capacity # of Precipitation eventsTotal Porosity LatitudeEffective Porosity LongitudeWilting Point Thornwaite's Precipitation-Evaporation indexDepth of vadose zone 2-yr, 6-hr precipitation eventVegetative Cover Relative humiditySoil-texture classification Mixing Heights (morning and afternoon)Storm type index # of thunderstormsSnow depth Anemonometer heightSnow water equivalent Wind joint frequency calmsLeaf area index # of hurricanes or tornadoesNet radiation Storm event types (e.g., tornado, flood, etc.)Reflective solar radiationHeat radiationSurface temperature
3.1
3.0 AVAILABLE DATA SOURCES RELEVANT TO HYDROLOGIC ANALYSES FOR REACTOR LICENSING1
Data sources relevant to defining input parameters for hydrologic analyses for reactor licensing are identified and reviewed in this section. The databases that can provide the environmental data consumed by different model types are available from a number of agencies.
3.1 U.S. Geological Survey (USGS) The USGS provides web links to a number of databases applicable to hydrologic modeling: http://waterdata.usgs.gov/nwis – National Water Information System contains data transmitted from selected surface-water, ground-water, and water-quality sites, including water flow and levels in streams, lakes, and springs, water levels in wells, and chemical and physical data for streams, lakes, springs, and wells. http://terraserver-usa.com/ – TerraServer-USA Web Service is a programmable interface to the popular TerraServer-USA on-line database of high-resolution USGS aerial imagery (DOQs) and scanned USGS topographical maps (DRGs). Using Microsoft .NET technologies, developers can easily query the Microsoft TerraServer SQL Server 2000 database and access all the important functions for the system. Thus, users of the TerraServer .NET Web Service can enhance the functionality of their web site or .NET WinForm application by directly incorporating TerraServer-USA USGS imagery and tabular information. http://nhd.usgs.gov/index.html – The National Hydrography Dataset (NHD) is a comprehensive set of digital spatial data that contains information about surface water features such as lakes, ponds, streams, rivers, springs, and wells. Within the NHD, surface water features are combined to form "reaches," which provide the framework for linking water-related data to the NHD surface water drainage network. These linkages enable the analysis and display of these water-related data in upstream and downstream order. The NHD is based upon the content of USGS Digital Line Graph (DLG) hydrography data integrated with reach-related information from the EPA Reach File Version 3 (RF3). The NHD supersedes DLG and RF3 by incorporating them, not by replacing them. Users of DLG or RF3 will find the National Hydrography Dataset both familiar and greatly expanded and refined. While initially based on 1:100,000-scale data, the NHD is designed to incorporate and encourage the development of higher resolution data required by many users. http://edc2.usgs.gov/geodata/index.php – Digital Elevation Model (DEM) data that includes: • 1:250,000 Scale Digital Elevation Models (DEM) • 1:24,000 Scale Digital Elevation Models (DEM), SDTS format only • http://www.ncgc.nrcs.usda.gov/products/datasets/elevation/ned.html – The USGS National Elevation
Dataset (NED) was developed by merging the highest resolution, best quality Digital Elevation Model (DEM) data available across the United States into a seamless raster format. As of the fall of 2003, 30-meter digital elevation data exist for the conterminous United States, with various scales for Alaska, Hawaii, and the U.S. Territories. NED are being improved to include 10-meter resolution data.
• 1:2,000,000 Digital Line Graphs (DLG) SDTS format only • 1:100,000 Scale Digital Line Graphs (DLG) 1 In many instances, the text to describe the web site is taken directly from the web site itself.
3.2
• 1:24,000 Scale Digital Line Graphs (DLG) SDTS Format Only • 1:250,000 & 1:100,000 Scale Land Use Land Cover (LULC) http://edc.usgs.gov/products/elevation/gtopo30/gtopo30.html – GTOPO30 is a global digital elevation model (DEM); therefore, it is a global data set covering the full extent of latitude from 90 degrees south to 90 degrees north, and the full extent of longitude from 180 degrees west to 180 degrees east. The horizontal grid spacing is 30-arc seconds (0.008333333333333 degrees), resulting in a DEM having dimensions of 21,600 rows and 43,200 columns. The horizontal coordinate system is decimal degrees of latitude and longitude referenced to WGS84. The vertical units represent elevation in meters above mean sea level. The elevation values range from -407 to 8,752 meters. In the DEM, ocean areas have been masked as "no data" and have been assigned a value of -9999. Lowland coastal areas have an elevation of at least 1 meter, so in the event that a user reassigns the ocean value from -9999 to 0 the land boundary portrayal will be maintained. Due to the nature of the raster structure of the DEM, small islands in the ocean less than approximately 1 square kilometer will not be represented. http://edc.usgs.gov/products/elevation/gtopo30/hydro/ – HYDRO1k is a geographic database developed to provide comprehensive and consistent global coverage of topographically derived data sets, including streams, drainage basins and ancillary layers derived from the USGS' 30 arc-second digital elevation model of the world (GTOPO30). HYDRO1k provides a suite of geo-referenced data sets, both raster and vector, which will be of value for all users who need to organize, evaluate, or process hydrologic information on a continental scale. Developed at the U.S. Geological Survey's Center for Earth Resources Observation and Science (EROS), the HYDRO1k project's goal is to provide to users, on a continent-by-continent basis, hydrologically correct DEMs along with ancillary data sets for use in continental and regional-scale modeling and analyses.
3.2 Agricultural Research Service (ARS) The datasets provided by the Agricultural Research Service primarily service experimental watersheds and are not specific to user-defined locations. The ARS natural resources datasets include the following: http://www.tucson.ars.ag.gov/dap/ – Experimental Watersheds include soils, vegetation, land use, hydrology, topography, climate, and other data from the Walnut Gulch Experimental Watershed and Santa Rita Experimental Range, both in Arizona. http://ars.usda.gov/Main/docs.htm?docid=9696 – The ARS Water Database is a collection of precipitation and streamflow data from small agricultural watersheds in the United States. This national archive of variable time-series readings for precipitation and runoff contains sufficient detail to reconstruct storm hydrographs and hyetographs. There are currently about 16,600 station years of data stored in the data base. Watersheds used as study areas range from 0.2 hectare (0.5 acres) to 12,400 square kilometers (4,786 square miles). Raingage networks range from one station per watershed to over 200 stations. The periods of record for individual watersheds vary from 1 to 50 years. Some watersheds have been in continuous operation since the mid 1930's. Various types of ancillary data are also maintained along with the precipitation and streamflow. These include air temperature, land management practices, topography and soils information. http://www.ars.usda.gov/services/docs.htm?docid=14011 – Soil Climate Analysis Network (SCAN) is a soil moisture research program at the Hydrology and Remote Sensing Lab (USDA-ARS). Validation efforts have been conducted on a growing number of SCAN locations throughout the U.S. As part of this effort, a plotter has been developed to more easily retrieve and examine the time series of these locations.
3.3
The graph is dynamic and the submission form is interactive, but in all research aspects, it refers back to the original NRCS-SCAN data set (http://www.wcc.nrcs.usda.gov/scan/).
3.3 Natural Resources Conservation Service (NRCS) The NRCS provides access to a number of water and soil resources databases. ftp://ftp.wcc.nrcs.usda.gov/ – ftp server for Natural Resources Conservation Service data; this source appears to contain incomplete data http://www.wcc.nrcs.usda.gov/gis/index.html – Natural Resources Conservation Service GIS products: • Water Supply Forecasts (Maps of the 50% exceedance forecasts for the western United States) • http://www.wcc.nrcs.usda.gov/snow/ – SNOTEL – snow water equivalent and accumulated
precipitation – snow depth. surface water equivalent, precipitation, temperature, snow depth, soil moisture/temperature data, precipitation, snow water equivalent – snow (maps of snow water equivalent, snow density, and snow depth derived from SNOTEL and manual snow course data)
• Precipitation (maps of month-to-date and year-to-date precipitation) • Temperature (maps of maximum, minimum, and average temperatures displayed as percentiles,
records, anomalies, and more). http://soils.usda.gov/ – This is the main USDA soils web site location. From this location a number of useful web sites can be accessed. http://websoilsurvey.nrcs.usda.gov/app/ – Web Soil Survey (WSS) provides soil data and information produced by the National Cooperative Soil Survey. It is operated by the USDA Natural Resources Conservation Service (NRCS) and provides access to the largest natural resource information system in the world. NRCS has soil maps and data available online for more than 95% of the nation’s counties and anticipates having 100% in the near future. The site is updated and maintained online as the single authoritative source of soil survey information. http://soildatamart.nrcs.usda.gov/ – The Soil Data Mart contains only the “current” version of official data and allows you to: • Determine where soil tabular and spatial data are available. • Download data for one soil survey area at a time. • http://datagateway.nrcs.usda.gov/ – Download requests for more than one survey area at a time can be
submitted through the Geospatial Data Gateway. The Geospatial Data Gateway provides one-stop shopping for natural resources or environmental data at anytime, from anywhere, to anyone. The gateway allows you to choose your area of interest, browse and select data from a catalog, customize the format, and have it downloaded or shipped on CD or DVD.
• Download a template Microsoft Access® database for working with downloaded data. • Download SSURGO data • Generate a variety of reports for one soil survey area at a time. • http://www.nrcs.usda.gov/technical/efotg/ – Electronic Field Office Technical Guides (eFOTGs)
contain technical information about the conservation of soil, water, air, and related plant and animal resources. Technical guides used in each field office are localized so that they apply specifically to the geographic area for which they are prepared. General state maps, descriptions of Major Land Resource Areas, watershed information, links to NRCS reference manuals and

3.4
handbooks, and detailed information about soil, water, air, plant, and animal resources are provided.
http://soils.usda.gov/survey/nscd/description.html – The database of the Soil Survey Laboratory (SSL), National Soil Survey Center (NSSC), currently contains analytical data for more than 20,000 pedons of U.S. soils and about 1,100 pedons from other countries. Standard morphological pedon descriptions are available for about 15,000 of these pedons. Partial data for pedons currently being analyzed may be unavailable. Soil fertility measurements, such as those made by agricultural experiment stations, were not made. Most of the data were obtained over the last 40 years. About three-fourths of the data are less than 20 years old. Analytical data for most of the pedons are fairly complete, according to the prevailing view of the research and characterization needs when the pedon was sampled. Generally, the kinds of analyses have increased over time. Coverage is for all 50 states, Puerto Rico, Virgin Islands, Trust Territories, and some foreign nations. Sample site selection, preparation of morphological pedon descriptions, and sample collection were performed by experienced soil scientists. Sample preparation and analytical procedures are described in Soil Survey Investigations Report No. 42, Natural Resources Conservation Service 1992. Analytical determinations were either made by soil scientists or by analysts supervised by soil scientists. Computer data handling techniques and calculations of primary and derived data were developed by experienced SSL soil scientists, competent in laboratory operations and computer programming. The National Soil Characterization Database is composed of the SSL working computer files. It includes data that may or may not represent the central concept of a soil series or map unit and pedons sampled to bracket a range of soil properties within a series or a landscape. For research purposes, all such data are retained in the database. Users unfamiliar with a given soil may want to consult a knowledgeable soil scientist to determine how well the data represents a soil series. Furthermore, the database has not been edited to remove all of the erroneous or sometimes misleading data. Users are responsible for the assessment of the accuracy and applicability of the data. The characterization data are stored in a fixed length, column positional, tab-delimited file structure, with a two-record freeform header, in master and state data sets, in ASCII format. The data are available on one standard CD-ROM disk. The data are also available on-line at http://ssldata.nrcs.usda.gov/. http://ssldata.nrcs.usda.gov/ – The National Soil Survey Center (NSSC) Soil Survey Laboratory Research Database allows users to generate, print, and download reports containing soil characterization data stored and maintained by the NSSC Soil Survey Laboratory (SSL). Data can also be downloaded in comma delimited text files for use in other applications. Under the query page (http://ssldata.nrcs.usda.gov/querypage.asp), soil data associated with the surface layers of any county in the United States can be queried, including • sand, silt, clay fractions by depth • sieve analyses (size categorization) by depth • bulk density by depth • water content by depth • carbon, nitrogen, sulfur, and organic carbon by depth • cation exchange capacity (CEC) and bases by depth • pH and carbonates by depth • sand, silt, clay mineralogy • pedon description • estimated soil water retention curves (water content versus soil matric potential) from which total and
effective porosities, field capacity, and saturate hydraulic conductivities can be estimated.
3.5
http://www.ars.usda.gov/Services/docs.htm?docid=8953 – Rosetta V1.0 is a Windows 95/98 program to estimate unsaturated hydraulic properties from surrogate soil data such as soil texture data and bulk density. Models of this type are called pedotransfer functions (PTFs) since they translate basic soil data into hydraulic properties. Rosetta can be used to estimate the following properties: • water retention parameters according to van Genuchten (1980) • saturated hydraulic conductivity • unsaturated hydraulic conductivity parameters according to van Genuchten (1980) and Mualem
(1976). Rosetta offers five PTFs that allow prediction of the hydraulic properties with limited or more extended sets of input data. This hierarchical approach is of great practical value because it permits optimal use of available input data. The models use the following hierarchical sequence of input data: • soil textural class • sand, silt and clay percentages • sand, silt and clay percentages and bulk density • sand, silt and clay percentages, bulk density • water retention point at 330 cm (33 kPa). • sand, silt and clay percentages, bulk density, and water retention points at 330 and 15000 cm (33 and
1500 kPa). The first model is based on a lookup table that provides class average hydraulic parameters for each USDA soil textural class. The other four models are based on neural network analyses and provide more accurate predictions when more input variables are used. In addition to the hierarchical approach, USDA also offers a model that allows prediction of the unsaturated hydraulic conductivity parameters from fitted van Genuchten (1980) retention parameters (Schaap and Leij 2000). This model is also used in the hierarchical approach such that it automatically uses the predicted retention parameters as input, instead of measured (fitted) retention parameters. All estimated hydraulic parameters are accompanied by uncertainty estimates that permit an assessment of the reliability of Rosetta's predictions. These uncertainty estimates were generated by combining the neural networks with the bootstrap method (see Schaap and Leij 2000 and Schaap et al. 1998 for more information). http://datagateway.nrcs.usda.gov/; http://www.ncgc.nrcs.usda.gov/products/datasets/index.html – The NRCS Geospatial Data Gateway provides one-stop shopping for natural resources or environmental data anytime, from anywhere, to anyone. The Gateway was developed and implemented in February 2001 to automate the ordering and delivery of geospatial data to the field offices. Over 40 data layers are now available through the Gateway. The staff continually acquires, integrates, and refreshes data warehoused for the Gateway. Users of GIS data often need custom datasets created, integrated, or transformed to meet specialized needs. As resources allow, NCGC will assist the NRCS state and county offices in meeting these needs. • http://www.ncgc.nrcs.usda.gov/products/datasets/elevation/index.html – Digital Elevation Data
(DEM, NED, LIDAR, & IFSAR) – Information on digital elevation data collection methods, data types, applications, and ordering.
N http://www.ncgc.nrcs.usda.gov/products/datasets/elevation/dem.html – Traditional Digital
Elevation Model (DEM) datasets correspond to 1:24,000 to 1:250,000 map scale. Multiple source data, including USGS topographic sheets, and various methods were employed to create the integer values in the raster files. The data are produced in UTM projection, NAD27 or NAD83 datum.
3.6
N http://www.ncgc.nrcs.usda.gov/products/datasets/elevation/ned.html – The USGS National Elevation Dataset (NED) was developed by merging the highest resolution, best quality Digital Elevation Model (DEM) data available across the United States into a seamless raster format. As of the fall of 2003, 30-meter digital elevation data exist for the conterminous United States, with various scales for Alaska, Hawaii, and U.S. Territories. NED are being improved to include 10-meter resolution data.
N http://lidar.cr.usgs.gov/ – Light Detection and Ranging (LIDAR) has resulted in faster, cheaper, and higher accuracy data, representing a technical advance in elevation data collection methods. With the agency-wide availability of GIS software and more accurate digital elevation data, the potential application to detailed conservation planning and resource inventory work throughout the agency is considerable.
• http://www.ncgc.nrcs.usda.gov/products/datasets/drg/index.html – Digital Raster Graphics (DRG) –
Information about Digital Raster Graphics (DRGs) and Enhanced DRGEs, a non-proprietary product of a USGS DRG in which the map collar information has been removed, and the various scales are available for ordering.
• http://www.soils.usda.gov/survey/geography/ssurgo/ – Soil Survey Geographic (SSURGO) Database – Soil Survey Geographic (SSURGO) Database access, ordering, and download.
• http://www.soils.usda.gov/survey/geography/statsgo/ – U.S. General Soil Map (STATSGO2) Database – State general soil maps made by generalizing the detailed soil survey data. The NRCS National Cartography and Geospatial Center (NCGC) previously archived and distributed the State Soil Geographic (STATSGO) Database. The STATSGO spatial and tabular data have been revised and updated. STATSGO has been renamed the U.S. General Soil Map (STATSGO2). It is available for download from the Soil Data Mart and the Geospatial Data Gateway. Currently, the Soil Data Mart only has file download capability for data delivery.
• http://www.ncgc.nrcs.usda.gov/products/datasets/watershed/ – Watershed Boundary Data (WBD) – Information about watershed boundary GIS coverages, their completion status, availability, and usage.
• Parameter-elevation Regressions on Independent Slopes Model (PRISM) Climate Data (precipitation and temperature), metadata, and maps.
• Digital Orthophoto Quadrangles and Quarter Quadrangles and Mosaics (DOQ & DOQQ). http://soils.usda.gov/survey/geochemistry/gen_description.html – The USDA-NRCS Soil Geochemistry Spatial Database contains data collectively produced by the National Cooperative Soil Survey Program. Sites were generally selected and sampled by soil survey personnel in respective states. Laboratory data were produced by the USDA-NRCS Soil Survey Laboratory, located in the National Soil Survey Center, Lincoln, NE. The geographic display consists of two major sets of geochemistry data: • Current Geochemistry Project— This project is ongoing, and the website is updated periodically to
reflect additional available data. Pedons were sampled and analyzed by horizons. Pedons represent either the central concept of a soil series, the central concept of a map unit, or unspecified sites on a project specific basis. These data include both sites that are contaminated and non-contaminated. Currently the database contains data for over 800 pedons and 3000 samples. These data are displayed in four geographic layers: Site Info, Major Elements, Trace Elements, and Selected Characterization Data. Data in Major Element and Trace Element tiers are defined by specific digestion methods rather than soil concentration. Digestion method for elements in the “Major Elements” tier consists of an acid combination of HF+HNO3+HCl. Elements in the “Trace Element” tier are recovered from soil with a HNO3+HCl digestion. Elemental data are incomplete on certain samples. Additional elements to the analytical suite have been added over time and certain data are absent on earlier projects. Also, certain projects were specific for only major or trace elements. Summary and analysis of these data are documented in Burt et al. (2003). For detailed information on SSL methods (e.g., procedures,

3.7
interferences), refer to web site: Soil Survey Investigation Report 42. Information on the applications of laboratory data, reference: Soil Survey Investigation Report 45. For additional qualifications and limitations regarding characterization data, refer to the SSL laboratory data website http://soils.usda.gov/survey/nscd/index.html. Locations in the past were recorded only as latitude and longitude in the Soil Survey Laboratory Characterization Database. Therefore, georeference locations for sites can be considered only approximate unless the map datum (NAD27, WGS84) can be identified for each point. It can be assumed that data prior to 1990 were recorded from maps with a NAD27 basis, and with a WGS84 basis after 1995.
• Holmgren Dataset--A second group of data was produced by the Soil Survey Laboratory during the 1970s and 1980s for a project documenting the content of selected trace elements in agricultural soils of the U.S. This dataset contains over 3,400 sites in the conterminous U.S. These data are available as a separate spatial layer on a county centroid basis. These data are discussed in Holmgren et al. (1993).
http://sdmdataaccess.nrcs.usda.gov/ – Soil Data Access is the name of a suite of web services and applications whose purpose is to meet requirements for requesting and delivering soil survey spatial and tabular data that are not being met by the current Soil Data Mart and Geospatial Data Gateway websites. These requirements include providing a way to • request data for an ad hoc area of interest of any size. • obtain data in real time. • request selected tabular attributes. • return tabular data where the organization of that data doesn’t have to mirror that of the underlying
source database. • bundle results by request, rather than by survey area. Unlike the Soil Data Mart and the Geospatial Data Gateway, the Soil Data Access suite is not currently capable of returning both spatial and tabular data for an area of interest, based on a single request. For the Soil Data Access suite, returning both spatial and tabular data for an area of interest can only be done by first defining an area of interest and submitting a request for spatial data, and then by using the distinct set of map unit keys returned by that request for spatial data to constrain a SQL query that selects the desired tabular data for that area of interest. The Soil Data Access suite provides no option to return a predefined set of tabular attributes, although we do provide a variety of sample SQL queries that can be adapted to one’s needs. http://soils.usda.gov/technical/classification/osd/ – Official Soil Series Descriptions (OSD) refer to the descriptions approved by the Natural Resources Conservation Service, which define specific soil series in the United States. These official soil series descriptions are descriptions of the taxa in the series category of the national system of classification. They mainly serve as specifications for identifying and classifying soils, which are used to learn about the properties of soils in a particular area.
3.4 U.S. Army Corps of Engineers (ACOE) http://www.nwd-wc.usace.army.mil/report.htm – Examples of regional data (e.g., Columbia Basin) available from the U.S. Army Corps of Engineers (ACOE) include hydrologic statistics, reservoir data, stream flow data, water quality data, Columbia River fish data, forecast data, weather data, and power data.
3.8
3.5 National Oceanic and Atmospheric Administration (NOAA)
NOAA provides access to a rich variety of atmospheric and oceanic databases. Special data products are provided for a fee. http://www.nesdis.noaa.gov/ – National Environmental Satellite, Data, and Information Service (NESDIS). http://cdo.ncdc.noaa.gov/CDO/cdo – National Climatic Data Center (NCDC). http://cdo.ncdc.noaa.gov/cgi-bin/climatenormals/climatenormals.pl – Climates of the States, USCRN Estimated Monthly Normals 1971-2000, Frost/Freeze Data 1971-2000, Monthly Station Climate Summaries, Daily Station Normals 1971-2000, Monthly Station Normals 1971-2000, Monthly Precipitation Probabilities 1971-2000, Annual Degree Days to Selected Bases 1971-2000. Monthly Divisional Normals/Standard Deviations 1971-2000, Snow Normals 1971-2000, Population-Weighted State, Regional, and National Monthly Degree Days, Area-Weighted State, Regional, and National Temp. and Precip, Maps of Annual 1961-1990 Normal Temp., Precipitation and Degree Days. http://www.ncdc.noaa.gov/oa/dataaccesstools.html#climate – Data access tools, including: • Map Interface to Selected Online Data – This GIS-based map interface provides access to US and
global climate/weather data. The user selects the type of data required; then uses a GIS interface to view the available stations and select the stations of interest. This interface is gradually being upgraded to be more user-friendly and have additional features added.
• Global Surface Data Climate Data – Online provides access to US and global climate/weather data, via a web interface. It also provides a map interface (GIS-based) for the data. Users may select data by region, country, state, climate division, county, and station, for any desired time period. A variety of formats are offered.
• http://www.ncdc.noaa.gov/oa/climate/severeweather/extremes.html – Extreme Weather – Extreme Weather and Climate Events – This system provides easy access to a variety of information, data, and reports: U.S. hurricanes, heavy precipitation, temperature extremes & drought, U.S. tornadoes, weather disasters, worldwide weather & climate events, global climate change, historical global extremes, El Nino/La Nina, satellite images & posters, climate monitoring, U.S. local storm events data, climatic data, and U.S. radar composites.
• Charts & Graphs – CLIMVIS - the Climate Visualization system is an interactive graphing tool designed to allow visual browsing of selected data available on-line at the National Climatic Data Center (NCDC). CLIMVIS simply requires the user to step through the data and graphing feature selection process to visually browse the data.
• NCEP Charts – This product contains historical National Center for Environmental Prediction (NCEP) weather charts that are archived at the National Climatic Data Center. Please NOTE: If the day/hour/pressure that you are looking for is not listed in the scroll list, then it is not available. Additional NCEP chart types and earlier years for these online charts are available for offline ordering.
• Climate Maps of the US – National Climatic Data Center's (NCDC) Climate Maps of the United States database (CLIMAPS). In here you will find over 2000 climate maps of the United States, including Alaska and Hawaii. These full color maps are available for climatic elements such as temperature, precipitation, snow, wind, pressure, etc., chosen to portray the climate of the U.S. The period of record of the data for most of the maps is 1961-1990. Most of the maps can be ordered in a high resolution Adobe PDF format, or as ESRI shape files.
3.9
• Volunteer Observing Ship Climate Product – The primary objective of the project is to provide a high-quality subset of marine meteorological data, with extensive associated metadata, to be available in both real time and delayed mode. Specifically, the project gives priority to the following parameters: wind direction and speed, sea level pressure, sea surface temperature, air temperature and humidity.
• Climate Reference Network – The U.S. Climate Reference Network (USCRN) is a network of climate stations now being developed as part of a National Oceanic and Atmospheric Administration (NOAA) initiative. Its primary goal is to provide future long-term homogeneous observations of temperature and precipitation that can be coupled to long-term historical observations for the detection and attribution of present and future climate change.
• Locate a weather or radar station – This tool is very useful if you want to know what stations might be available in your area of the U.S. It allows for searching by a variety of methods, such as state, county, zip code, call sign, and station number.
• Climate Normals – Climate is an important factor in agriculture, commerce, industry, and transportation. The average value of a meteorological element over 30 years is defined as a climatological normal. The normal climate helps in describing the climate and is used as a base to which current conditions can be compared. Every ten years, NCDC computes new thirty-year climate normals for selected temperature and precipitation elements for a large number of U.S. climate and weather stations. These normals are summarized in daily, monthly, divisional, and supplementary normals products.
http://www4.ncdc.noaa.gov/cgi-win/wwcgi.dll?wwevent~storms – Storm Events – Search the NCDC Storm Event database to find various types of storms recorded in your county or use other selection criteria as desired (tornado, flood, storm surge, high wind, blizzard, rain, lightening, coastal flood, flash flood, tsunami wind, heavy snow, ice storm, tropical storm, gusty winds).
3.6 U.S. Environmental Protection Agency (EPA) EPA provides databases specifically formulated for conducting regulatory environmental analyses. http://www.epa.gov/storet/dbtop.html; http://www.epa.gov/storet/ – STOrage and RETrieval (STORET) database is a data repository for water quality, biological, and physical data and is used by state environmental agencies, EPA and other federal agencies, universities, private citizens, and many others. EPA maintains two data management systems containing water quality information for the nation's waters: • http://www.epa.gov/storpubl/legacy/gateway.htm – The Legacy Data Center (LDC) is a static,
archived database that contains historical water quality data dating back to the early part of the 20th century and collected up to the end of 1998.
• http://www.epa.gov/storet/dw_home.html – STORET is an operational system actively being populated with water quality data that contains data collected beginning in 1999, along with older data that has been properly documented and migrated from the LDC.
Both systems contain raw biological, chemical, and physical data on surface and ground water collected by federal, state and local agencies, Indian Tribes, volunteer groups, academics, and others. All 50 States, territories, and jurisdictions of the U.S. are represented in these systems. Each sampling result in the LDC and in STORET is accompanied by information on where the sample was taken (latitude, longitude, state, county, Hydrologic Unit Code and a brief site identification), when the sample was gathered, the medium sampled (e.g., water, sediment, fish tissue), and the name of the organization that sponsored the monitoring. In addition, STORET contains information on why the data were gathered; sampling and
3.10
analytical methods used; the laboratory used to analyze the samples; the quality control checks used when sampling, handling the samples, and analyzing the data; and the personnel responsible for the data. The main database concepts of STORET follow the business of water quality monitoring. • STORET Warehouse Watershed Summary
N http://www.epa.gov/storet/wtshd_summary.html – Summary of Results by Watershed, STORET Station Descriptions
N http://iaspub.epa.gov/storpubl/DW_stationcriteria – Stations by Geographic Location N http://iaspub.epa.gov/storpubl/DW_stationcriteria_STN – Stations by Organization and
Station ID • STORET Regular Results – Physical/Chemical, Biological, and Habitat Result Data
N http://iaspub.epa.gov/storpubl/DW_resultcriteria_geo – Results by Geographic Location N http://iaspub.epa.gov/storpubl/DW_resultcriteria_station –Results by Station N http://iaspub.epa.gov/storpubl/DW_resultcriteria_project –Results by Project
http://www.epa.gov/mrlc/nlcd.html – 1992 National Land Cover Data (NLCD) was the first land-cover mapping project with a national (conterminous) scope. No other national land-cover mapping program had ever been undertaken, despite the existence of Landsat TM since 1984. NLCD 1992 provides 21 different land cover classes at the native 30-meter resolution of Landsat TM for the lower 48 states. The target scene acquisition date was 1992, although cloud cover and other factors forced use of scenes from other years because of a lack of useable images. Mapping was based on unsupervised clustering and logical modeling using a suite of ancillary data. Mapping methodologies are discussed more fully in Vogelmann et al. (1998). NLCD 1992 was completed about December 2000 and has likely been the most widely used land-cover dataset in the United States. Its wide use is a fair benchmark of the success of the program. NLCD 1992 has been used in a wide array of applications, including national environmental reporting, climate change, Clean Water Act studies, and biodiversity and conservation assessments.
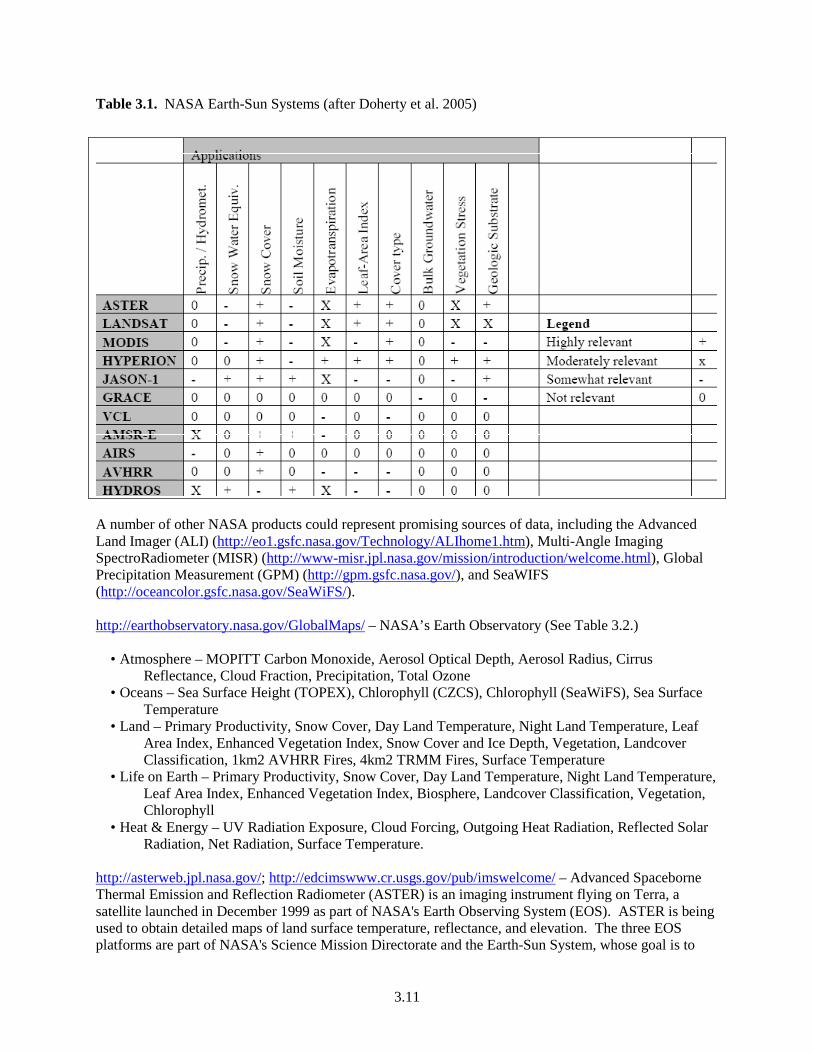
3.7 National Aeronautics and Space Administration (NASA) A variety of NASA sensors can be utilized for watershed analyses. For example, MODIS products such as MOD10 (snow cover), MOD11 (land surface temperature and emissivity), MOD06 (cloud product), MOD07 (atmospheric profiles), MOD12 (land cover type), MOD13 (vegetation indices), MOD15 (LAI and FPAR), and MOD16 (evapotranspiration) can provide valuable data. Table 3.1 presents a summary of possible NASA sensors that might lend additional support to biosphere assessments. These are satellite based so their information tends to be related more to a global perspective.
3.11
Table 3.1. NASA Earth-Sun Systems (after Doherty et al. 2005)
A number of other NASA products could represent promising sources of data, including the Advanced Land Imager (ALI) (http://eo1.gsfc.nasa.gov/Technology/ALIhome1.htm), Multi-Angle Imaging SpectroRadiometer (MISR) (http://www-misr.jpl.nasa.gov/mission/introduction/welcome.html), Global Precipitation Measurement (GPM) (http://gpm.gsfc.nasa.gov/), and SeaWIFS (http://oceancolor.gsfc.nasa.gov/SeaWiFS/). http://earthobservatory.nasa.gov/GlobalMaps/ – NASA’s Earth Observatory (See Table 3.2.) • Atmosphere – MOPITT Carbon Monoxide, Aerosol Optical Depth, Aerosol Radius, Cirrus
Reflectance, Cloud Fraction, Precipitation, Total Ozone • Oceans – Sea Surface Height (TOPEX), Chlorophyll (CZCS), Chlorophyll (SeaWiFS), Sea Surface
Temperature • Land – Primary Productivity, Snow Cover, Day Land Temperature, Night Land Temperature, Leaf
Area Index, Enhanced Vegetation Index, Snow Cover and Ice Depth, Vegetation, Landcover Classification, 1km2 AVHRR Fires, 4km2 TRMM Fires, Surface Temperature
• Life on Earth – Primary Productivity, Snow Cover, Day Land Temperature, Night Land Temperature, Leaf Area Index, Enhanced Vegetation Index, Biosphere, Landcover Classification, Vegetation, Chlorophyll
• Heat & Energy – UV Radiation Exposure, Cloud Forcing, Outgoing Heat Radiation, Reflected Solar Radiation, Net Radiation, Surface Temperature.
http://asterweb.jpl.nasa.gov/; http://edcimswww.cr.usgs.gov/pub/imswelcome/ – Advanced Spaceborne Thermal Emission and Reflection Radiometer (ASTER) is an imaging instrument flying on Terra, a satellite launched in December 1999 as part of NASA's Earth Observing System (EOS). ASTER is being used to obtain detailed maps of land surface temperature, reflectance, and elevation. The three EOS platforms are part of NASA's Science Mission Directorate and the Earth-Sun System, whose goal is to
3.12
observe, understand, and model the Earth system to discover how it is changing, to better predict change, and to understand the consequences for life on Earth. http://landsat.usgs.gov/index.php – LANDSAT represents the world's longest continuously acquired collection of space-based land remote sensing data. The Landsat Project is a joint initiative of the U.S. Geological Survey (USGS) and the National Aeronautics and Space Administration (NASA) designed to gather Earth resource data from space. NASA developed and launched the spacecrafts, while the USGS handles the operations, maintenance, and the management of all ground data reception, processing, archiving, product generation, and distribution. The 35-year record of images provides a unique resource for people who work in agriculture, geology, forestry, regional planning, education, mapping, and global change research. http://modis.gsfc.nasa.gov/ – Moderate Resolution Imaging Spectroradiometer (MODIS) is a key instrument aboard the Terra (EOS AM) and Aqua (EOS PM) satellites. Terra's orbit around the Earth is timed so that it passes from north to south across the equator in the morning, while Aqua passes south to north over the equator in the afternoon. Terra MODIS and Aqua MODIS are viewing the entire Earth's surface every 1 to 2 days, acquiring data in 36 spectral bands, or groups of wavelengths (see MODIS Technical Specifications). These data improve understanding of global dynamics and processes occurring on the land, in the oceans, and in the lower atmosphere. MODIS is playing a vital role in the development of validated, global, interactive Earth system models able to predict global change accurately enough to assist policy makers in making sound decisions concerning the protection of our environment. http://eo1.gsfc.nasa.gov/Technology/Hyperion.html – The Hyperion instrument provides a new class of Earth observation data for improved Earth surface characterization. The Hyperion provides a science grade instrument with quality calibration based on heritage from the LEWIS Hyperspectral Imaging Instrument (HSI). The Hyperion capabilities provide resolution of surface properties into hundreds of spectral bands versus the ten multispectral bands flown on traditional Landsat imaging missions. Through these large numbers of spectral bands, complex land eco-systems shall be imaged and accurately classified. The Hyperion provides a high-resolution hyperspectral imager capable of resolving 220 spectral bands (from 0.4 to 2.5 :m) with a 30-meter spatial resolution. The instrument images a 7.5 km by 100 km land area per image and provides detailed spectral mapping across all 220 channels with high radiometric accuracy. http://sealevel.jpl.nasa.gov/mission/jason-1.html – Jason-1 is an oceanography mission to monitor global ocean circulation, improve global climate predictions, and monitor events such as El Nino conditions and ocean eddies. The Jason-1 satellite carries a radar altimeter. It is a follow-on mission to the highly successful TOPEX/Poseidon mission, which measured ocean surface topography to an accuracy of 4.2 cm, enabled scientists to forecast the 1997-1998 El Niño, and improved understanding of ocean circulation and its effect of global climate. Jason-1 altimeter data are part of a suite of data provided by other NASA missions – the GRACE mission uses two satellites to accurately measure Earth's mass distribution, and the QuikSCAT scatterometer mission will measure ocean-surface winds. The Delta vehicle was shared with the Thermosphere, Ionosphere, Mesosphere, Energetics and Dynamics (TIMED) mission. Accurate observations of sea-surface height and ocean winds provide scientists with information about the speed and direction of ocean currents and about the heat stored in the ocean which, in turn, reveals global climate variations. Jason 1 will help scientists in their quest to understand these global climate forces. http://www.csr.utexas.edu/grace/asdp.html – Gravity Recovery and Climate Experiment (GRACE) is making detailed measurements of Earth's gravity field, which will lead to discoveries about gravity and Earth's natural systems.
3.13
http://www.ghcc.msfc.nasa.gov/AMSR/objectives.html – The EOS AQUA AMSR-E measures geophysical parameters supporting several global change science and monitoring efforts, including precipitation, oceanic water vapor, cloud water, near-surface wind speed, sea surface temperature, soil moisture, snow cover, and sea ice parameters. http://airs.jpl.nasa.gov/ – The Atmospheric Infrared Sounder (AIRS) constitutes an innovative atmospheric sounding system of infrared, microwave, and visible sensors. The infrared radiance data product is stable to 10 mK/yr and accurate to better than 250 mK. This product is the most accurate and stable set of hyperspectral infrared radiance spectra measurements made in space to date, and it meets the criteria identified by the National Research Council for climate data records. The geophysical products provide daily global temperature profiles at an accuracy of 1 K per 1 km thick layer in the troposphere and moisture profiles at an accuracy of 20% per 2 km thick layer in the lower troposphere (20%-60% in the upper troposphere). With the Version 5 release the L2 and L3 products also include the burden and profiles of the minor gases: O3, CO, and CH4. The accuracy of the temperature and humidity profiles derived from AIRS/AMSU/HSB is recognized as improving forecasts from meteorological prediction models. http://gcmd.nasa.gov/records/GCMD_JPL_AVHRR_PATHFDR_allSST_V4.1.html – Advanced Very High Resolution Radiometers (AVHRR) – The NOAA/NASA AVHRR Oceans Pathfinder All-SST data product consists of daily and monthly values of sea surface temperature (SST) derived from the 5-channel Advanced Very High Resolution Radiometers (AVHRR) on board the NOAA -7, -9, -11 and -14 polar orbiting satellites. Unlike the AVHRR Pathfinder Best-SST product, all pixel values, regardless of the quality flag, are retained in this product. Data for both the ascending pass (daytime) and descending pass (nighttime) are available globally in Hierarchical Data Format (HDF). Data are given on equal-angle grids of 4096 pixels longitude by 2048 pixels latitude (referred to as the ~9km grid), 2048 pixels longitude by 1024 pixels latitude (the ~18km grid), and 720 pixels longitude by 360 pixels latitude (the ~54km grid or the 0.5 degree grid).
4.1
4.0 READILY AVAILABLE SOFTWARE FOR RETRIEVING DATA FOR INTEGRATION WITH MODELS
Software systems designed to help with the retrieval of input data required for hydrological modeling could potentially be very useful to NRC staff conducting environmental analyses. The objective is to provide tools that greatly reduce the effort to extract needed subsets of data from large databases.
4.1 Data Retrieval Function Overview The need is to populate model-specific metadata files for modeling applications by acquiring data from other databases. Databases can:
• vary in size (some databases are very large, but the user may only require access to a small portion of the information),
• be developed for specific models (e.g., aquifer) or applications (micro-environmental), • contain special information (e.g., statistical data), • be incomplete, and • be located on the host PC or at a remote location.
Remotely accessed databases often represent larger general repositories of information. The linkage of databases to other components in the system can be addressed in a similar manner as the linkage protocol associated with the models. The model owner defines input requirements for the model through a series of metadata files used to describe the attributes and characteristics of each variable associated with a model or databases. These metadata files are sometimes referred to as DICtionary files (DICs). The DICs provide the database owner with a template of the data needs of the models in the system and can map the data to the needs of the models. The system would provide the necessary tools to map the database contents to the input requirements of the models, as identified by database DICs. Therefore, by knowing the user-defined input and model boundary condition requirements, database DICs can be developed and the models would then have the option to consume only that information from the database that met the model's needs. A database would populate a dataset meeting the format specifications of a database DIC. To consume that information, the model would reference the same datasets (based on the database DICs). Data would then be directly transferred from the database to the model. In the instance where the Boundary Condition DICtionary is describing information coming from a database, there is no expectation that the dataset for that DICtionary or set of DICtionaries, will be complete. It is unrealistic to require a database to understand and meet the input requirements of every possible model that might want to access its data repository. The module receiving information from a database must have provisions to accept incomplete datasets. This means that a default procedure for completing an incomplete dataset must be performed by the receiving model, or a user-interface option (i.e., user intervention) to fully populate the dataset must be provided. Like models, databases could be linked to databases, thereby providing a simple mechanism to prioritize the same type of data (e.g., bulk density) from multiple databases (e.g., national, regional, and site-specific). The databases linked closest to the model icon take precedence over those databases further from the model. If a site-specific database did not fulfill the boundary condition requirements of the
4.2
model, then data gaps would be filled by the regional database, then the national database. For conflicting information (e.g., different cancer potency factors provided by each database), the closest database could take precedence, or the user could have the option to choose the database that is most relevant.
4.2 Summary of Data Acquisition Systems This section provides a summary of several data acquisition systems that are currently available for helping obtain data for hydrologic modeling applications.
4.2.1 Hydrologic Data Acquisition and Processing System The Hydrologic Data Acquisition and Processing System (HDAPS) provides an automated, flexible, and extendable system for retrieving various types of near real-time data for use in modeling hydrologic processes. HDAPS is under active development (Version 0.5.6 as of January 2009). Additionally, the code is maintained through the open-source, client-server, multi-platform, version control system, Subversion (SVN) (http://subversion.tigris.org) allowing multiple developers to edit source code simultaneously. The HDAPS system is a small suite of Python scripts (http://www.python.org) formulated into two core processing elements: (1) Data Downloader, and (2) Data Processor. The HDAPS system is designed to be extendable, keeping future data needs in mind. Under this approach, new modules can be written and inserted into the two processing elements. The system is currently designed to retrieve 12 data themes including spatio-temporal Geographic Information System (GIS) and remote-sensing data, as well as fixed temporal data such as stream gage and SNOTEL. Currently, five data themes in HDAPS are operational. Appendix C provides additional information on HDAPS.
4.2.2 Integrated Water Resources Modeling System External Data Harvester The Integrated Water Resources Modeling System (IWRMS) External Data Harvester1 enables users to set up one-time or scheduled recurring extractions of data from data sources (both internal and external to the government agency) and to store the parsed data in SQL tables in the Data Repository. Harvested data can then be checked out for quality assurance/control purposes or it can be used directly by models. The external data harvester provides a user-friendly user interface that allows the user to specify a path to the data (e.g., URL, FTP site, web or network accessible database, and local flat ASCII files), select a format, and graphically create a parsing recipe for extracting data of interest from the source. This process is called registering a data source. Once the registration is complete, the data harvester will then harvest the data and store it in an SQL table in a database on the user’s computer. If the user specified a harvest schedule during registration, the data harvester will harvest data according to the schedule specified and concatenate the new data to the original SQL table. Data harvests from different data sources or harvests registered independently are stored in separate SQL tables. If a data harvest fails, an e-mail notification is sent to the user to inform them. The user can then check on the error, which can typically be caused by an error in the parsing instructions, data not being posted by the provider, or the data provider changing the data format. Harvested data can be accessed using standard SQL queries or through the IWRMS Data Browser, which allows the user to easily query data harvester data sets.
1 Data Harvester User Guide (2009 Unpublished Draft), PNNL-15877, Pacific Northwest National Laboratory, Richland, Washington.
4.3
4.2.3 Data for Environmental Modeling Environmental Data Download Tool The Data for Environmental Modeling (D4EM) provides a mechanism for accessing heterogeneous data using the Environmental Data Download Tool (EDDT), addresses abstract complexity of data access and conversion from model users, provides a reusable, extensible component-based architecture, automates common tasks, and uses public domain software written with a .Net framework. The D4EM/EDDT is a comprehensive set of open source software tools that automates the process of populating model input datasets with environmental data available from distributed data sources. Data management and geoprocessing components included in D4EM/EDDT allow for complex data transformations. Geoprocessing operations are implemented through linkages with open source GIS software. The components also handle metadata and data caching. While D4EM was initially developed to meet the data requirements for two EPA modeling systems [Multimedia, Multi-pathway, Multi-receptor Risk Assessment (3MRA) and the Better Assessment Science Integrating point and Non-point Sources (BASINS)], its component-based architecture allows it to be integrated into other modeling applications. The components are written in Microsoft .Net languages - C# and Visual Basic .Net. Current data sources include EPA's STORET data, U.S. Geological Survey (USGS) Terraserver maps and photos, USGS National Water Information System (NWIS) data, USGS National Hydrography Dataset (NHD), and the multi-agency National Land Cover Dataset (NLCD). Appendix D contains additional information on D4EM.
4.2.4 FRAMES Data Client Editor, Data Owner Tool, Data Extraction Tool The FRAMES Internet Database Tools are comprised of three components: the Database Owner’s Tool (DOT), the Data Extraction Tool (DET), and the Database Client Editor (DCE). These software tools were developed to allow FRAMES to access remote databases (Pelton et al. 2001). The DOT is support software that allows the database owner to map the database structure to a file, which holds the developed extraction plans (mappings), database schema, and the schema of the Database DIC. In effect, the DOT documents the meta-information associated with the database and data to be extracted, when the extraction is invoked. The DET extracts the data from the designated database and returns it to the DCE through the Hypertext Transfer Protocol (http). When invoked by the DCE, the DET goes out to the DOT database, retrieves the desired extraction plan from the DOT database, extracts the appropriate data through a Structured Query Language (SQL) server, and returns it to the DCE, meeting the metadata requirements outlined by the Database DIC. The DCE allows the user to specify what data are being requested from the database and invokes the DET. The DCE stores the data returned by the DET on the local drive for eventual consumption by module icons (and their underlying models) connected to the data-set icon.
4.2.5 FRAMES Joint Frequency Distribution Generator The FRAMES Joint Frequency Data (JFD) Generator (Droppo 2006) provides the capability of creating joint frequency tables, which contain summaries of the frequency of occurrence of meteorological dispersion, wind speed, and wind direction. This capability was developed to assist the users of these systems in the preparation of JFD input files required by the climatological air dispersion models. The software is not intended as a general database extraction tool.
4.4
The JFD Generator computations are made by an updated version of the U.S. Environmental Protection Agency (EPA) STAbility ARray (STAR) program. Surface observations are combined with computed seasonally and diurnally varying solar flux rates to estimate the ambient atmospheric dispersion rates, represented as a stability category. The wind speeds and directions are obtained directly from the hourly surface-observation data. The product is a file in a format that can be directly read by an air-dispersion model. In addition to the CD-144 format, the updated version of the software can read Samson and Support Center for Regulatory Atmospheric Modeling (SCRAM) data formats, which are available on a number of web sites, (http://www.epa.gov/scram001, http://www.lakes-environmental.com, http://www.nws.noaa.gov). Before using this program, the user will need to obtain a file containing historical records of surface meteorological observations from an onsite or nearby location. This data file must be stored in an accessible directory on the host machine.
4.2.6 National Snow and Ice Data Center The National Snow and Ice Data Center (NSIDC; http://nsidc.org/data/tools/) develops a variety of Data Tools for viewing and analyzing data as well as Development Tools to support software development. Data tools help users extract and read data from a variety of formats, display data within packages such as Research System's IDL, or assist in the geolocation of gridded products. • Hierarchical Data Format - Earth Observing System (HDF-EOS) – NSIDC created this site to answer
common questions about HDF-EOS and to provide simple methods for working with the HDF-EOS format.
• AMSR-E Swath to Grid Toolkit (AS2GT) – Use this suite of software tools to subset and grid L1B and L2A AMSR-E swath data. These tools make it easy to process data into custom grids with any temporal or spatial resolution. When you download the software, you get AS2GT as part of a larger package that also allows you to work with some forms of SSM/I and SMMR data.
• EASE-Grid Geolocation Tools – Tools include IDL routines and map projections for geolocation and conversion tools to use with EASE-Grid data sets.
• MODIS Swath-to-Grid Toolbox (MS2GT) – This set of software tools reads HDF-EOS files containing MODIS swath data and produces flat binary files containing gridded data in a variety of map projections. MS2GT consists of three Perl programs that make calls to several standalone IDL and C programs.
• HDF-EOS Imaging Tool (EOS IT) – This interface has two modes. One mode opens, geolocates, and visualizes multiple swath or grid products in separate but dynamically linked windows. Another mode allows users to examine individual bits from data fields. (Users must have IDL 5.6 installed to run EOS-IT.)
• IMCORR Software – IMCORR software uses two images and input parameters and matches small sub-scenes from the two images.
NSIDC programmers created a series of small applications, which form the "building blocks" of many of the other tools that NSIDC provides. These tools are not related to particular datasets but can be used in other programs. • JazPanel – A Java applet that can specify geographic areas of interest as part of an HTML forms
interface. • Mapx – An object-oriented geographic coordinate transformation library available in both C and Java. • Spheres – A Java package for doing spherical trigonometry. It includes a Java implementation of the
backtrack orbit search algorithm.
4.5
4.2.7 CUAHSI Hydrologic Information System
The Consortium of Universities for the Advancement of Hydrologic Science, Inc. (CUAHSI; http://his.cuahsi.org/) Hydrologic Information System (HIS) provides web services, tools, standards, and procedures to access data for hydrologic analysis.
In addition to tools for searching and publishing hydrological data, the CUAHSI-HIS provides the following data access tools:
• WaterML (WaterOneFlow) Web Services. Web services are computer applications that interact with and exchange information with other applications over the internet. Web services format the data as XML; the specific variety of XML that is generated by the WaterOneFlow web services is known as CUAHSI WaterML.
• HydroExcel: WaterOneFlow Excel Client. HydroExcel is an Excel spreadsheet that provides direct access to WaterOneFlow web services, serving data both from national data providers and universities. The spreadsheet uses Visual Basic for Applications (VBA) macros and an object library called HydroObjects to communicate with and retrieve data from WaterOneFlow web services.
• HydroGET: An ArcGIS™ Web Service Client. Hydrologic GIS Extraction Tool (HydroGET) gives ArcGIS users the ability to ingest web service data into ArcGIS™. HydroGET can work with any web service as long as the web service complies with CUAHSI’s WaterML protocol.
• HydroLink. HydroLink provides access to a directory of WaterML files using the OpenMI (http://www.openmi.org) protocol. The component can be run on Windows using the .Net Framework 2.0 or on Windows, Mac OS, or Linux using Mono (http://www.mono-project.com).
• FetchWaterML. This command line tool automates the process of downloading WaterML files from CUAHSI WaterOneFlow servers. A WaterML file stores a hydrologic time series (one location, one variable, multiple observations).
• HydroObjects. HydroObjects is a .Net DLL with COM classes that support hydrology applications. The key class in the library is WebServiceWrapper, which provides a method for calling Web Services from a COM (e.g., VBA) environment. This class can be used to call WaterOneFlow Web Services for downloading hydrologic time series.
4.3 Evaluation of Web-Based Data Sources In evaluating data sources, several factors were considered, namely, how the data are accessed, the format of the data, and, in the case of text data, how the data are presented. The evaluation presented in this section was limited to consideration of the HDAPS, IWRMS External Data Harvester, D4EM/EDDT, and FRAMES Internet Database software tools. Comments on each web-based data source are presented below. While all the data tools considered access data from the internet, the only one that professed to be able to access data provided by dynamic web interfaces (i.e., filling in a form to access data), or data stored in HTML tables was the IWRMS External Data Harvester. The IWRMS External Data Harvester can retrieve data from a wide variety of locations, including web, ftp, SQL databases, and local files but is
4.6
limited to tabular text-based data (including data in web tables). Because of its design, the IWRMS External Data Harvester is identified as an acceptable tool for any text- or table-based formats. The IWRMS External Data Harvester has a strict requirement (at least as of this writing) of strict table-based data (CSV, tab delimited, whitespace delimited, or HTML tables). Any other free form or human readable format is not currently supported, although the tool could be modified to support such. Because of this, it was necessary to view the source of all the text-based data to ensure that the formatting of the tables met the IWRMS External Data Harvesters requirements. In the case of HDAPS, only a fixed list of data sources is accessible; these are listed in the table at the end of this section. The D4EM/EDDT tool lists a number of data formats but does not identify which sites it accesses, leaving it up to interpretation as to whether or not the tool is free-form enough to access data in standard formats from any web site. Data involving maps or GIS type data were assumed to either be not automatically available, or in the purview of D4EM/EDDT for data formats explicitly listed in the D4EM/EDDT documentation. A number of data sources listed web services interfaces. In general, the web services probably provide the same data as the web interface, but would likely provide it in an XML format that could be more easily parsed, and requests for data would be standardized rather than using the Data Harvester approach of parsing a web page and filling in form data. Although none of the data access tools actually supports web services (with the possible exception of the CUAHSI-HIS), most could be easily updated to. It is anticipated that many data sources will be available via web services interfaces in the future, so it may be worth the investment to either update the current tools with this capability, or develop a new tool that can access data provided as a web service. http://waterdata.usgs.gov/nwis/
• Accessible via D4EM/EDDT • Stream gage data available via HDAPS
http://terraserver-usa.com
• Accessible using D4EM/EDDT • Provides a web services interface.
http://nhd.usgs.gov/index.html
• FTP data accessible through IWRMS External Data Harvester • NOTE: same data accessible through http://cfpub1.epa.gov/surf/locate/index.cfm (actual data
from USGS site and with proper URL's should be accessible via IWRMS External Data Harvester)
• Accessible via D4EM/EDDT http://edc2.usgs.gov/geodata/index.php
• May be accessible using IWRMS External Data Harvester harvest local files feature o Data are stored in compressed text files o Would need to be downloaded and uncompressed first
http://edc.usgs.gov/products/elevation/gtopo30/gtopo30.html
• May be accessible using IWRMS External Data Harvester harvest local files feature o Data are stored in compressed text files o Would need to be downloaded and uncompressed first
http://eros.usgs.gov/products/elevation/gtopo30/hydro/
4.7
• Data downloaded as compressed archive • Geographic and watershed info • May be accessible via D4EM/EDDT
http://www.tucson.ars.ag.gov/dap
• Data can be retrieved through IWRMS External Data Harvester http://ars.usda.gov/Main/docs.htm?docid=9696
• Data in compressed archive • Data can be read using IWRMS External Data Harvester's "Local Harvest" function
http://www.ars.usda.gov/services/docs.htm?docid=14011
• Data may be parsed, but may require small modifications to tools to retrieve data • HDAPS and IWRMS External Data Harvester should be simple enough to modify to retrieve
data. ftp://ftp.wcc.nrcs.usda.gov
• Data retrievable via IWRMS External Data Harvester • SNOTEL data are available using HDAPS
http://www.wcc.nrcs.usda.gov/gis/index.html
• D4EM/EDDT may be able to process data, but steps are unknown • Image-based data
http://soils.usda.gov (also http://ssldata.nrcs.usda.gov)
• Data are contained in multiple tables. Not easily parsed. • Is possible to download data in a CSV format which could be read in by IWRMS External Data
Harvester. http://websoilsurvey.nrcs.usda.gov/app
• Interactive application, not easily automated • The data can be downloaded through a web interface as a text file on the local computer. In this
case, while the web interface would probably need to be navigated by a person, the data could be downloaded to a file and parsed by one of the tools so that it could be used in a model.
http://soildatamart.nrcs.usda.gov
• Data must be downloaded via a manual process (requires Email address for access) • Data retrievable as Access database. May be read by IWRMS External Data Harvester
http://datagateway.nrcs.usda.gov
• Java applet (requires user interaction) http://www.nrcs.usda.gov/technical/efotg
• Mostly useful for maps, but information available here is also available through other NRCS sites.
http://www.ars.usda.gov/services/docs.htm?docid=8953
• Data stored in access tables • Should be accessible using IWRMS External Data Harvester
4.8
http://www.ncgc.nrcs.usda.gov/products/datasets/elevation/index.html http://www.ncgc.nrcs.usda.gov/products/datasets/elevation/dem.html http://www.ncgc.nrcs.usda.gov/products/datasets/elevation/ned.html
• Data may come in a compressed archive • No way to access some data non-interactively (accessed using a JAVA applet.) • Available via D4EM/EDDT
http://lidar.cr.usgs.gov/
• Unknown. May be accessible via D4EM/EDDT. http://www.ncgc.nrcs.usda.gov/products/datasets/drg/index.html
• Currently available via DataGateway (above) http://www.soils.usda.gov/survey/geography/ssurgo/
• Data available via DataGateway and http://soildatamart.nrcs.usda.gov/ (offline from 12 am to 4 am MST)
http://www.soils.usda.gov/survey/geography/statsgo/
• Data available via DataGateway and http://soildatamart.nrcs.usda.gov/ • Ability to access is planned for D4EM/EDDT
http://www.ncgc.nrcs.usda.gov/products/datasets/watershed/
• D4EM/EDDT http://sdmdataaccess.nrcs.usda.gov/
• Query functionality available • May be available to IWRMS External Data Harvester • Web services query functionality available, but could get more from developing a web services
extension http://soils.usda.gov/technical/classification/osd/
• Unsure of how these data would be retrieved http://www.nwd-wc.usace.army.mil/report.htm
• Tabular data retrievable through IWRMS External Data Harvester http://www.nesdis.noaa.gov/
• Tabular data could be retrieved via IWRMS External Data Harvester • Image data would need to be retrieved via D4EM/EDDT
http://cdo.ncdc.noaa.gov/CDO/cdo
• Data can be parsed by IWRMS External Data Harvester, but may require manual download http://www.ncdc.noaa.gov/oa/dataaccesstools.html#climate
• Some of the information here is linked to data sources already listed • Tabular data could be processed by IWRMS External Data Harvester. Graphical data will need to
be processed by another tool, perhaps D4EM/EDDT.
4.9
• Appears that most data requires purchase, which would require user intervention and precludes automated data retrieval
http://www4.ncdc.noaa.gov/cgi-win/wwcgi.dll?wwevent~storms
• Data should be retrievable with IWRMS External Data Harvester http://www.epa.gov/storpubl/legacy/gateway.htm
• Data accessible via D4EM/EDDT http://www.epa.gov/storet/dw_home.html
• Legacy data available via D4EM/EDDT. It is unknown whether new STORET data are available. http://www.epa.gov/storet/wtshd_summary.html http://iaspub.epa.gov/storpubl/DW_stationcriteria http://iaspub.epa.gov/storpubl/DW_stationcriteria_STN http://iaspub.epa.gov/storpubl/DW_resultcriteria_geo http://iaspub.epa.gov/storpubl/DW_resultcriteria_station http://iaspub.epa.gov/storpubl/DW_resultcriteria_project
• Data are batch processed. These are STORET data, so available via D4EM/EDDT http://www.epa.gov/mrlc/nlcd.html
• Data are available via D4EM/EDDT http://www-misr.jpl.nasa.gov/mission/data/data.html
• Not currently listed as accessible by any tool. http://www-misr.jpl.nasa.gov/mission/introduction/welcome.html
• Data available as NetCDF (readable by FRAMES) http://gpm.gsfc.nasa.gov/
• Not currently available http://oceancolor.gsfc.nasa.gov/SeaWiFS/
• Imaging products. Possible that D4EM/EDDT can retrieve it. http://earthobservatory.nasa.gov/GlobalMaps/
• Some of the same date is available from MODIS (retrievable by HDAPS) http://asterweb.jpl.nasa.gov/
• ASTER is on demand • Previously requested observations are available via
(http://edcimswww.cr.usgs.gov/pub/imswelcome/) http://landsat.usgs.gov/index.php
• Data available in a variety of GIS formats. Unknown for automatic retrieval (some pay access required)
http://modis.gsfc.nasa.gov/
• available via HDAPS
4.10
http://eo1.gsfc.nasa.gov/Technology/Hyperion.html • Not yet available
http://sealevel.jpl.nasa.gov/mission/jason-1.html
• No links to data found on this page. http://www.csr.utexas.edu/grace/asdp.html
• Some data may be password protected. http://www.ghcc.msfc.nasa.gov/AMSR/objectives.html
• Some of the data links do not work • Access to archived data requires registration, but real links can be found once registered • May be accessible via D4EM/EDDT
http://disc.gsfc.nasa.gov/AIRS/data-holdings/by-data-product/data_products.shtml
• HDF files available • May be accessible via D4EM/EDDT.
http://gcmd.nasa.gov/records/GCMD_JPL_AVHRR_PATHFDR_allSST_V4.1.html
• Data available in HDF • May be accessible via D4EM/EDDT.
4.11
Table 4.1. Data Access Table
Web Address
IWR
MS
Ext
erna
l Dat
a H
arve
ster
D4E
M/E
DD
T
HD
APS
FRA
MES
http://waterdata.usgs.gov/nwis/ X X http://terraserver-usa.com X http://nhd.usgs.gov/index.html X X http://edc2.usgs.gov/geodata/index.php X http://edc.usgs.gov/products/elevation/gtopo30/gtopo30.html X http://eros.usgs.gov/products/elevation/gtopo30/hydro/ ? http://www.tucson.ars.ag.gov/dap X http://ars.usda.gov/Main/docs.htm?docid=9696 X http://www.ars.usda.gov/services/docs.htm?docid=14011 ? ? ftp://ftp.wcc.nrcs.usda.gov X X http://www.wcc.nrcs.usda.gov/gis/index.html ? http://soils.usda.gov http://ssldata.nrcs.usda.gov ?
http://websoilsurvey.nrcs.usda.gov/app ? ? http://soildatamart.nrcs.usda.gov x http://datagateway.nrcs.usda.gov http://www.nrcs.usda.gov/technical/efotg ? ? http://www.ars.usda.gov/services/docs.htm?docid=8953 x http://www.ncgc.nrcs.usda.gov/products/datasets/elevation/index.html http://www.ncgc.nrcs.usda.gov/products/datasets/elevation/dem.html http://www.ncgc.nrcs.usda.gov/products/datasets/elevation/ned.html
X
http://lidar.cr.usgs.gov/ ? http://www.ncgc.nrcs.usda.gov/products/datasets/drg/index.html X – Automatically retrievable x – Can be used, but requires other actions to retrieve ? – May be able to process data, but steps to do so are unknown O – Data available through another site that is able to be automatically retrieved.
4.12
Web Address
IWR
MS
Ext
erna
l Dat
a H
arve
ster
D4E
M/E
DD
T
HD
APS
FRA
MES
http://www.soils.usda.gov/survey/geography/ssurgo/ http://www.soils.usda.gov/survey/geography/statsgo/ (via http://soildatamart.nrcs.usda.gov/)
x
http://www.ncgc.nrcs.usda.gov/products/datasets/watershed/ X http://sdmdataaccess.nrcs.usda.gov/ X http://soils.usda.gov/technical/classification/osd/ http://www.nwd-wc.usace.army.mil/report.htm X X http://www.nesdis.noaa.gov/ X ? http://cdo.ncdc.noaa.gov/CDO/cdo x http://www.ncdc.noaa.gov/oa/dataaccesstools.html#climate x ? http://www4.ncdc.noaa.gov/cgi-win/wwcgi.dll?wwevent~storms X http://www.epa.gov/storpubl/legacy/gateway.htm X http://www.epa.gov/storet/dw_home.html X http://www.epa.gov/storet/wtshd_summary.html http://iaspub.epa.gov/storpubl/DW_stationcriteria http://iaspub.epa.gov/storpubl/DW_stationcriteria_STN http://iaspub.epa.gov/storpubl/DW_resultcriteria_geo http://iaspub.epa.gov/storpubl/DW_resultcriteria_station http://iaspub.epa.gov/storpubl/DW_resultcriteria_project
X
http://www.epa.gov/mrlc/nlcd.html X http://www-misr.jpl.nasa.gov/mission/data/data.html http://www-misr.jpl.nasa.gov/mission/introduction/welcome.html x http://gpm.gsfc.nasa.gov/ http://oceancolor.gsfc.nasa.gov/SeaWiFS/ ? ? http://earthobservatory.nasa.gov/GlobalMaps/ O http://asterweb.jpl.nasa.gov/ ? ? http://landsat.usgs.gov/index.php ? ? http://modis.gsfc.nasa.gov/ X X – Automatically retrievable x – Can be used, but requires other actions to retrieve ? – May be able to process data, but steps to do so are unknown O – Data available through another site that is able to be automatically retrieved.
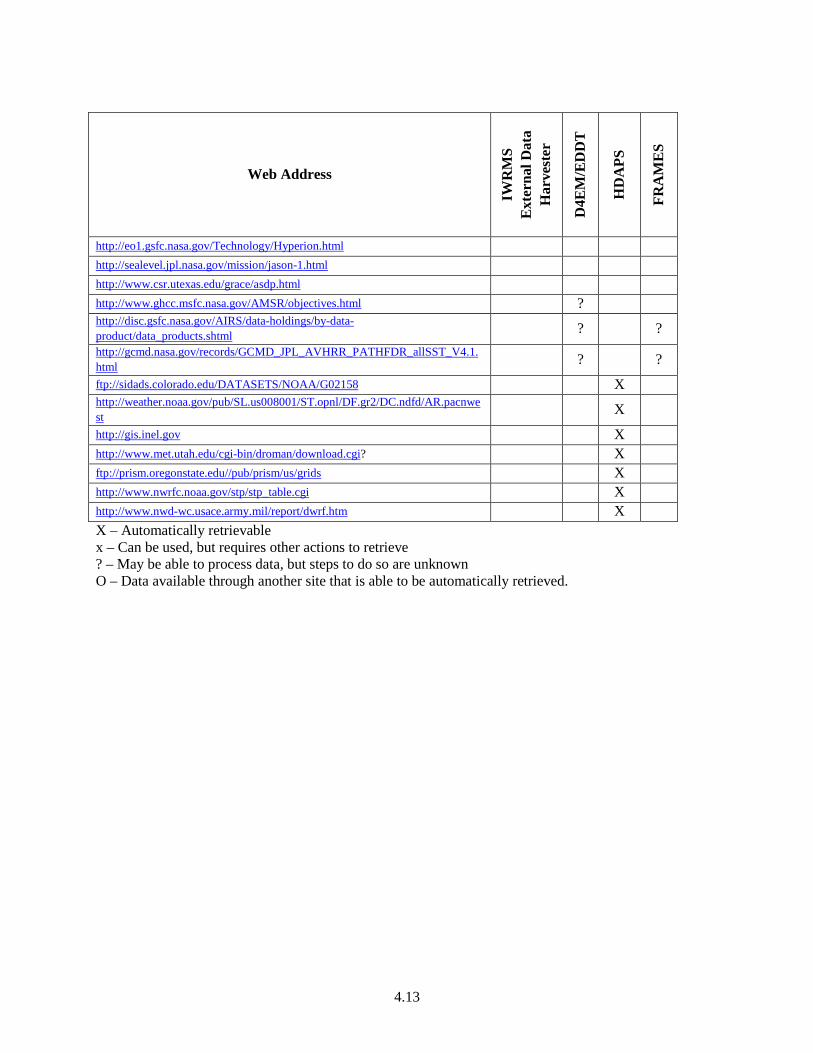
4.13
Web Address
IWR
MS
Ext
erna
l Dat
a H
arve
ster
D4E
M/E
DD
T
HD
APS
FRA
MES
http://eo1.gsfc.nasa.gov/Technology/Hyperion.html http://sealevel.jpl.nasa.gov/mission/jason-1.html http://www.csr.utexas.edu/grace/asdp.html http://www.ghcc.msfc.nasa.gov/AMSR/objectives.html ? http://disc.gsfc.nasa.gov/AIRS/data-holdings/by-data-product/data_products.shtml ? ? http://gcmd.nasa.gov/records/GCMD_JPL_AVHRR_PATHFDR_allSST_V4.1.html ? ?
ftp://sidads.colorado.edu/DATASETS/NOAA/G02158 X http://weather.noaa.gov/pub/SL.us008001/ST.opnl/DF.gr2/DC.ndfd/AR.pacnwest X
http://gis.inel.gov X http://www.met.utah.edu/cgi-bin/droman/download.cgi? X ftp://prism.oregonstate.edu//pub/prism/us/grids X http://www.nwrfc.noaa.gov/stp/stp_table.cgi X http://www.nwd-wc.usace.army.mil/report/dwrf.htm X X – Automatically retrievable x – Can be used, but requires other actions to retrieve ? – May be able to process data, but steps to do so are unknown O – Data available through another site that is able to be automatically retrieved.
5.1
5.0 Conclusion
One of the objectives of this report was to identify and review available data sources relevant to hydrologic analyses for reactor licensing, including available sources for data and information that are useful in assigning values to the parameters of models used in reactor licensing analyses and in assessing uncertainty in parameter values. As discussed in Section 2, the list of potential parameters in hydrologic transport analyses is long. The data sources described in Section 3 can be useful to define a subset of these parameters, including site features (e.g., watershed boundaries, stream locations, reservoirs, site topography), site properties (e.g., surface conditions, subsurface hydraulic properties, water quality), and site boundary conditions, input forcings, and extreme events (e.g., stream discharge, lake levels, precipitation, recharge, flood and drought characteristics). The other primary objective of the report was to identify and review available software tools for accessing established databases (such as those described in Section 3), retrieving the data, and integrating it with models. The emphasis in this review was on existing software products with minimal required modifications to enable their use with FRAMES. A number of software tools were identified and described in Section 4. The ability of four of these tools to access and retrieve the data sources identified in Section 3 was reviewed: Hydrologic Data Acquisition and Processing System (HDAPS), Integrated Water Resources Modeling System (IWRMS) External Data Harvester, Data for Environmental Modeling Environmental Data Download Tool (D4EM EDDT), and the FRAMES Internet Database Tools. Of these, the FRAMES Internet Database Tools is the only one to rely on software at the data source (the Data Owner Tool). Although the Consortium of Universities for the Advancement of Hydrologic Science Hydrologic Information System (CUAHSI HIS) software was not reviewed for its ability to access and retrieve the data sources identified in Section 3, this software is intended to provide access to a broad range of hydrologic data, similar to HDAPS, the IWRMS Data Harvester, the D4EM EDDT. For linking data harvesting tools to environmental assessment models within the FRAMES modeling environment, there are at least two issues to consider. One is the ability of the software tools to access and retrieve the required data. The other is the ability to integrate the data into the modeling. Based on Table 4.1, the IWRMS External Data Harvester and the D4EM EDDT each separately cover many of the relevant data sources and together would provide access to nearly all of the identified data sources (with, perhaps, some additional capability development required). In addition, IWRMS and D4EM have been developed to be capable of integration with the FRAMES modeling environment. These software tools thus should be the starting point for developing a general capability to integrate external data sources with models for NRC applications. Some standardization would be useful. For example, a standard use for terms and parameters in models would facilitate the error-free application of data harvesting software and the exchange of data between models. Standardization of the way in which data is stored after data retrieval would facilitate the ability to use multiple data harvesters. In addition, the tools that do support modeling frameworks like FRAMES currently do so differently, injecting their data into different portions of the modeling process. Standardization would also facilitate the use of multiple data harvesters and modeling frameworks and would accelerate the development of additional capabilities.

5.2
6.1
6.0 REFERENCES
Burt, R., M.A. Wilson, M.D. Mays, and C.W. Lee. 2003. Major and Trace Elements of Selected Pedons in the U.S. J. of Environ. Qual. 32:2109-2121. Doherty, M., T. Martin, M. Wigmosta, G. Sehlke, R. Jeanquart, and C. Lear. 2005. Evolving a Solutions Network of Resource Conservation and Development Councils, Watershed Management Teams, and NASA Research Institutions Across the Nation. The North Olympic Peninsula Resource Conservation and Development Council, Port Angeles, Washington, and Pacific Northwest National Laboratory, Richland, Washington. Droppo, J.G., Jr. 2006. ARAMS/FRAMES Joint Frequency Data (JFD) Generator. PNNL-16149. Pacific Northwest National Laboratory, Richland, WA. Holmgren, G.G.S., M.W. Meyer, R.L. Chaney, and R.B. Daniels. 1993. “Cadmium, lead, zinc, copper, and nickel in agricultural soils in the United States of America.” J. Environ. Qual. 22:335-348. Pelton, M.A., R.Y. Taira, K.E. Dorow, F.C. Rutz, N.A. Reitz, and G. Whelan. 2001. FRAMES Internet Database Tools: Database Owner’s Tool (DOT), Data Extraction Tool (DET), and Database Client Editor (DCE). PNNL-13428, Pacific Northwest National Laboratory, Richland, Washington. Meyer, P.D., M. Ye, M.L. Rockhold, S.P. Neuman, and K.J. Cantrell. 2007. Combined Estimation of Hydrogeologic Conceptual Model, Parameter, and Scenario Uncertainty with Application to Uranium Transport at the Hanford Site 300 Area, NUREG/CR-6940, U.S. Nuclear Regulatory Commission, Washington, DC. Mualem, Y. 1976. “A new model predicting the hydraulic conductivity of unsaturated porous media.” Water Resour. Res. 12:513-522. Schaap, M.G., F.J. Leij, and M. Th. van Genuchten. 1998. Neural network analysis for hierarchical prediction of soil hydraulic properties, Soil Sci. Soc. Am. J., 62(4):847-855. Schaap, M.G. and F.J. Leij, 2000. Improved prediction of unsaturated hydraulic conductivity with the Mualem-van Genuchten model, Soil Sci. Soc. Am. J., 64(3):843-851. van Genuchten, M.Th. 1980. “A closed-form equation for predicting the hydraulic conductivity of unsaturated soils.” Soil Sci. Am. J. 44:892-898. Vogelmann, J.E., T.L. Sohl, P.V. Campbell, and D.M. Shaw. 1998. Regional Land Cover Characterization Using Landsat Thematic Mapper Data and Ancillary Data Sources. in Environmental Monitoring and Assessment, Kluwer Academic Publishers, The Netherlands, 51:415–428.

6.2
APPENDIX A
FRAMES 2.0 System Input Dictionaries

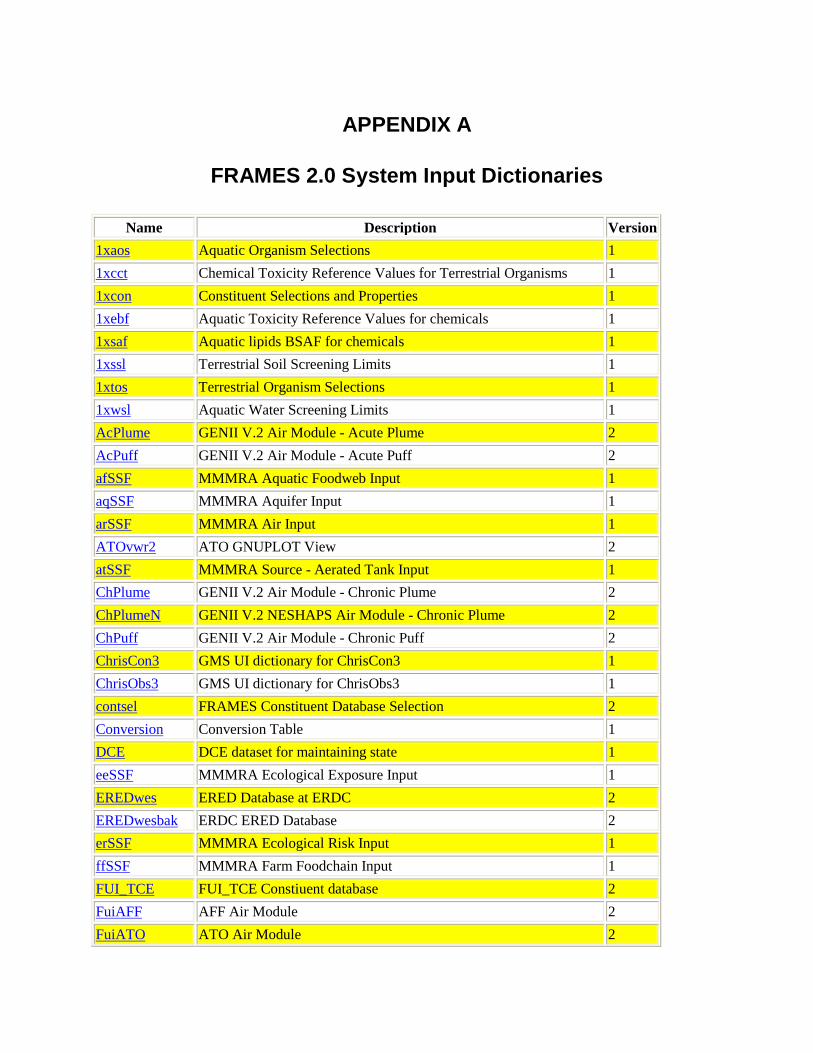
APPENDIX A
FRAMES 2.0 System Input Dictionaries
Name Description Version 1xaos Aquatic Organism Selections 1 1xcct Chemical Toxicity Reference Values for Terrestrial Organisms 1 1xcon Constituent Selections and Properties 1 1xebf Aquatic Toxicity Reference Values for chemicals 1 1xsaf Aquatic lipids BSAF for chemicals 1 1xssl Terrestrial Soil Screening Limits 1 1xtos Terrestrial Organism Selections 1 1xwsl Aquatic Water Screening Limits 1 AcPlume GENII V.2 Air Module - Acute Plume 2 AcPuff GENII V.2 Air Module - Acute Puff 2 afSSF MMMRA Aquatic Foodweb Input 1 aqSSF MMMRA Aquifer Input 1 arSSF MMMRA Air Input 1 ATOvwr2 ATO GNUPLOT View 2 atSSF MMMRA Source - Aerated Tank Input 1 ChPlume GENII V.2 Air Module - Chronic Plume 2 ChPlumeN GENII V.2 NESHAPS Air Module - Chronic Plume 2 ChPuff GENII V.2 Air Module - Chronic Puff 2 ChrisCon3 GMS UI dictionary for ChrisCon3 1 ChrisObs3 GMS UI dictionary for ChrisObs3 1 contsel FRAMES Constituent Database Selection 2 Conversion Conversion Table 1 DCE DCE dataset for maintaining state 1 eeSSF MMMRA Ecological Exposure Input 1 EREDwes ERED Database at ERDC 2 EREDwesbak ERDC ERED Database 2 erSSF MMMRA Ecological Risk Input 1 ffSSF MMMRA Farm Foodchain Input 1 FUI_TCE FUI_TCE Constiuent database 2 FuiAFF AFF Air Module 2 FuiATO ATO Air Module 2
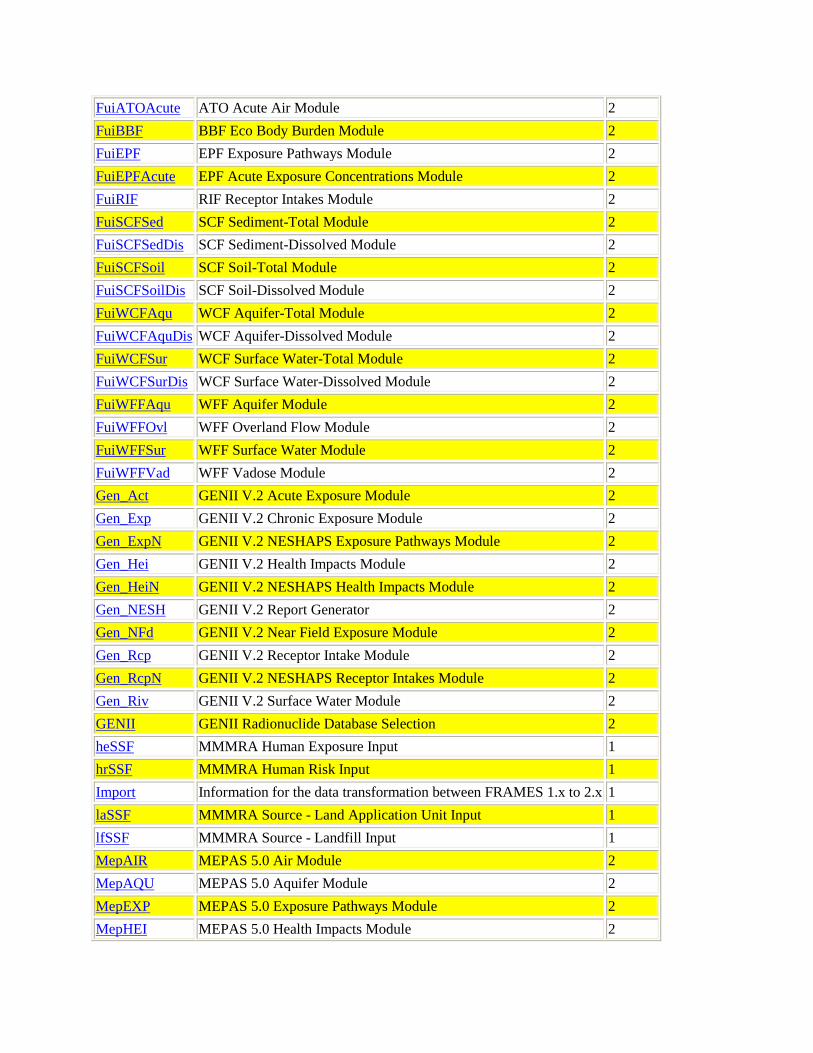
FuiATOAcute ATO Acute Air Module 2 FuiBBF BBF Eco Body Burden Module 2 FuiEPF EPF Exposure Pathways Module 2 FuiEPFAcute EPF Acute Exposure Concentrations Module 2 FuiRIF RIF Receptor Intakes Module 2 FuiSCFSed SCF Sediment-Total Module 2 FuiSCFSedDis SCF Sediment-Dissolved Module 2 FuiSCFSoil SCF Soil-Total Module 2 FuiSCFSoilDis SCF Soil-Dissolved Module 2 FuiWCFAqu WCF Aquifer-Total Module 2 FuiWCFAquDis WCF Aquifer-Dissolved Module 2 FuiWCFSur WCF Surface Water-Total Module 2 FuiWCFSurDis WCF Surface Water-Dissolved Module 2 FuiWFFAqu WFF Aquifer Module 2 FuiWFFOvl WFF Overland Flow Module 2 FuiWFFSur WFF Surface Water Module 2 FuiWFFVad WFF Vadose Module 2 Gen_Act GENII V.2 Acute Exposure Module 2 Gen_Exp GENII V.2 Chronic Exposure Module 2 Gen_ExpN GENII V.2 NESHAPS Exposure Pathways Module 2 Gen_Hei GENII V.2 Health Impacts Module 2 Gen_HeiN GENII V.2 NESHAPS Health Impacts Module 2 Gen_NESH GENII V.2 Report Generator 2 Gen_NFd GENII V.2 Near Field Exposure Module 2 Gen_Rcp GENII V.2 Receptor Intake Module 2 Gen_RcpN GENII V.2 NESHAPS Receptor Intakes Module 2 Gen_Riv GENII V.2 Surface Water Module 2 GENII GENII Radionuclide Database Selection 2 heSSF MMMRA Human Exposure Input 1 hrSSF MMMRA Human Risk Input 1 Import Information for the data transformation between FRAMES 1.x to 2.x 1 laSSF MMMRA Source - Land Application Unit Input 1 lfSSF MMMRA Source - Landfill Input 1 MepAIR MEPAS 5.0 Air Module 2 MepAQU MEPAS 5.0 Aquifer Module 2 MepEXP MEPAS 5.0 Exposure Pathways Module 2 MepHEI MEPAS 5.0 Health Impacts Module 2
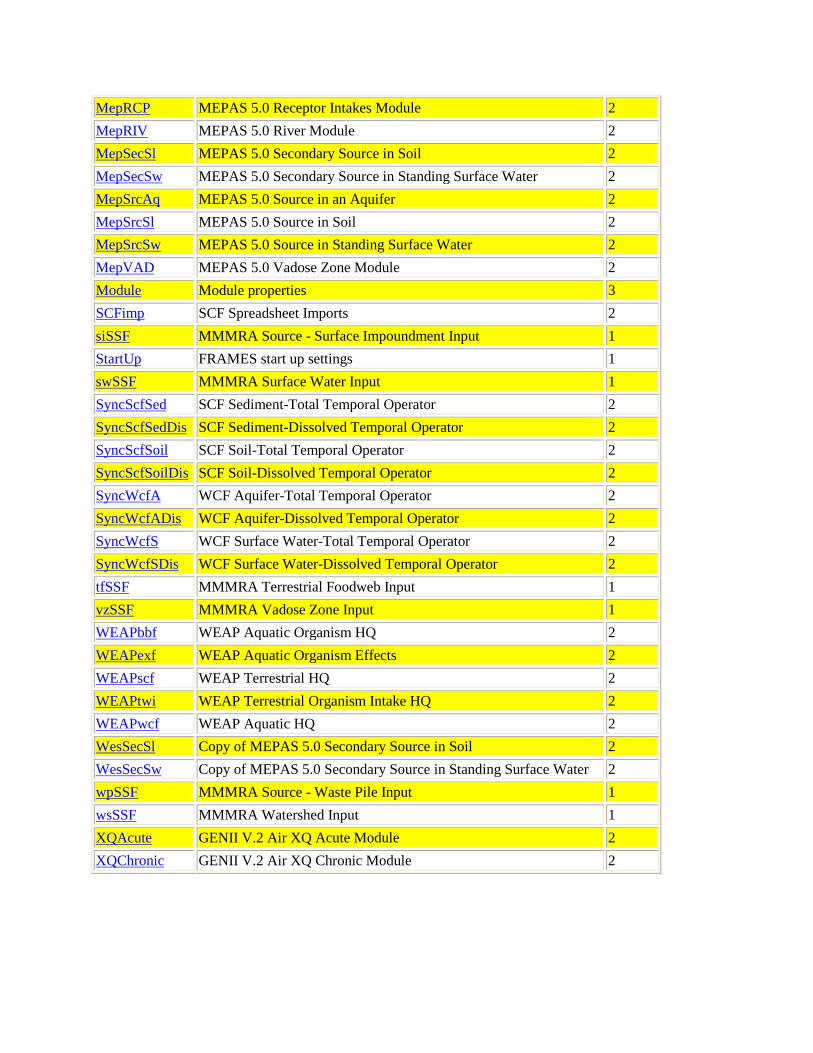
MepRCP MEPAS 5.0 Receptor Intakes Module 2 MepRIV MEPAS 5.0 River Module 2 MepSecSl MEPAS 5.0 Secondary Source in Soil 2 MepSecSw MEPAS 5.0 Secondary Source in Standing Surface Water 2 MepSrcAq MEPAS 5.0 Source in an Aquifer 2 MepSrcSl MEPAS 5.0 Source in Soil 2 MepSrcSw MEPAS 5.0 Source in Standing Surface Water 2 MepVAD MEPAS 5.0 Vadose Zone Module 2 Module Module properties 3 SCFimp SCF Spreadsheet Imports 2 siSSF MMMRA Source - Surface Impoundment Input 1 StartUp FRAMES start up settings 1 swSSF MMMRA Surface Water Input 1 SyncScfSed SCF Sediment-Total Temporal Operator 2 SyncScfSedDis SCF Sediment-Dissolved Temporal Operator 2 SyncScfSoil SCF Soil-Total Temporal Operator 2 SyncScfSoilDis SCF Soil-Dissolved Temporal Operator 2 SyncWcfA WCF Aquifer-Total Temporal Operator 2 SyncWcfADis WCF Aquifer-Dissolved Temporal Operator 2 SyncWcfS WCF Surface Water-Total Temporal Operator 2 SyncWcfSDis WCF Surface Water-Dissolved Temporal Operator 2 tfSSF MMMRA Terrestrial Foodweb Input 1 vzSSF MMMRA Vadose Zone Input 1 WEAPbbf WEAP Aquatic Organism HQ 2 WEAPexf WEAP Aquatic Organism Effects 2 WEAPscf WEAP Terrestrial HQ 2 WEAPtwi WEAP Terrestrial Organism Intake HQ 2 WEAPwcf WEAP Aquatic HQ 2 WesSecSl Copy of MEPAS 5.0 Secondary Source in Soil 2 WesSecSw Copy of MEPAS 5.0 Secondary Source in Standing Surface Water 2 wpSSF MMMRA Source - Waste Pile Input 1 wsSSF MMMRA Watershed Input 1 XQAcute GENII V.2 Air XQ Acute Module 2 XQChronic GENII V.2 Air XQ Chronic Module 2
APPENDIX B
Selected FRAMES 2.0 Dictionaries Related to Source Term, Transport, and Impact Analyses


APPENDIX B
Selected FRAMES 2.0 Dictionaries Related to Source Term, Transport, and Impact Analyses
Legend for Tables Column Name Meaning
S Self-Indexed D Dimensional Size U Uncertainty can apply (Stochastic) K Is the variable a key to others
MEPAS 5.0 Source in an Aquifer (MepSrcAq)
Name Description Unit Measure Type Range S D U K CVTFormat Number format to use STRING Y 1 N N KDCLASS Soil-texture classification STRING Y 1 N N KDCLAY % Clay of soil percent Ratio FLOAT 0-100 Y 1 N N KDIRON % Iron and aluminum in the soil percent Ratio FLOAT 0-99 Y 1 N N KDOMC % Organic matter content of soil percent Ratio FLOAT 0-10 Y 1 N N KDPH pH of top soil FLOAT 0.1-14 Y 1 N N KDSAND % Sand of soil percent Ratio FLOAT 0-100 Y 1 N N KDSILT % Silt of soil percent Ratio FLOAT 0-100 Y 1 N N STAIRSPC Volumetric air content fraction Ratio FLOAT 0-1 Y 1 Y N STAIRSPC_NUM Number of air -need info- time pairs INTEGER 0-10 Y 1 N N STAIRSPC_TIM Air -need info- time yr Time FLOAT 0-9.99999968E+37 Y 1 N N
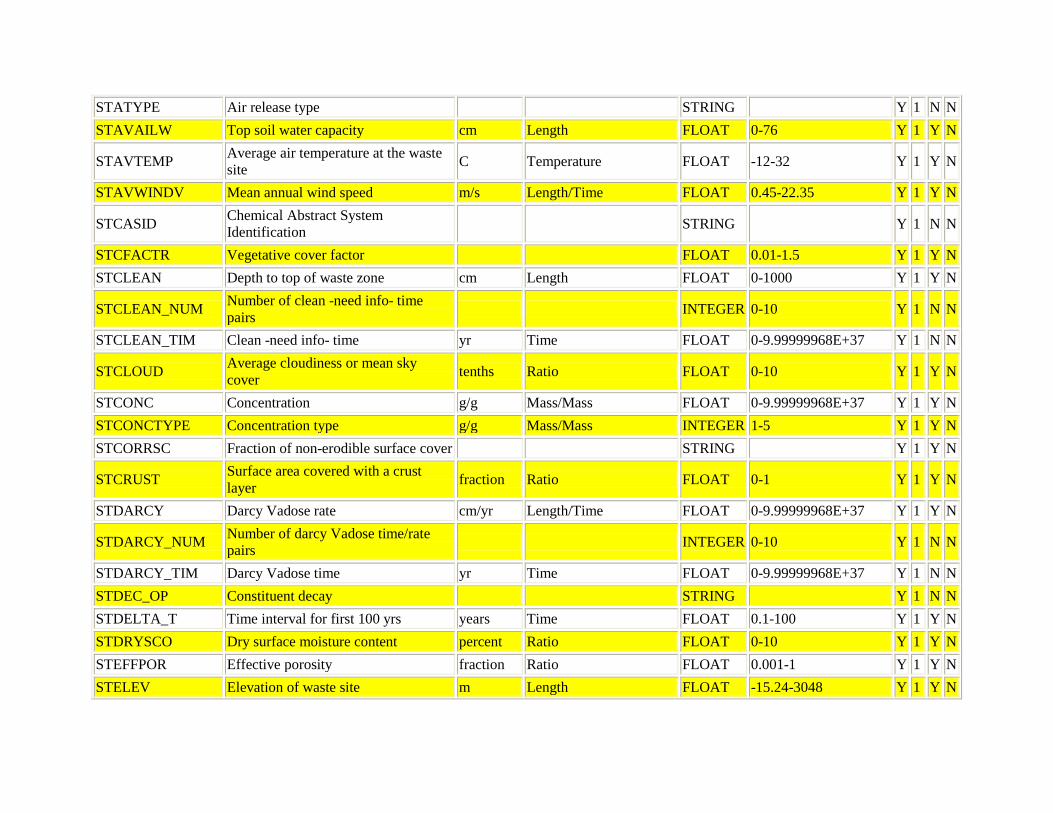
STATYPE Air release type STRING Y 1 N N STAVAILW Top soil water capacity cm Length FLOAT 0-76 Y 1 Y N
STAVTEMP Average air temperature at the waste site C Temperature FLOAT -12-32 Y 1 Y N
STAVWINDV Mean annual wind speed m/s Length/Time FLOAT 0.45-22.35 Y 1 Y N
STCASID Chemical Abstract System Identification STRING Y 1 N N
STCFACTR Vegetative cover factor FLOAT 0.01-1.5 Y 1 Y N STCLEAN Depth to top of waste zone cm Length FLOAT 0-1000 Y 1 Y N
STCLEAN_NUM Number of clean -need info- time pairs INTEGER 0-10 Y 1 N N
STCLEAN_TIM Clean -need info- time yr Time FLOAT 0-9.99999968E+37 Y 1 N N
STCLOUD Average cloudiness or mean sky cover tenths Ratio FLOAT 0-10 Y 1 Y N
STCONC Concentration g/g Mass/Mass FLOAT 0-9.99999968E+37 Y 1 Y N STCONCTYPE Concentration type g/g Mass/Mass INTEGER 1-5 Y 1 Y N STCORRSC Fraction of non-erodible surface cover STRING Y 1 Y N
STCRUST Surface area covered with a crust layer fraction Ratio FLOAT 0-1 Y 1 Y N
STDARCY Darcy Vadose rate cm/yr Length/Time FLOAT 0-9.99999968E+37 Y 1 Y N
STDARCY_NUM Number of darcy Vadose time/rate pairs INTEGER 0-10 Y 1 N N
STDARCY_TIM Darcy Vadose time yr Time FLOAT 0-9.99999968E+37 Y 1 N N STDEC_OP Constituent decay STRING Y 1 N N STDELTA_T Time interval for first 100 yrs years Time FLOAT 0.1-100 Y 1 Y N STDRYSCO Dry surface moisture content percent Ratio FLOAT 0-10 Y 1 Y N STEFFPOR Effective porosity fraction Ratio FLOAT 0.001-1 Y 1 Y N STELEV Elevation of waste site m Length FLOAT -15.24-3048 Y 1 Y N
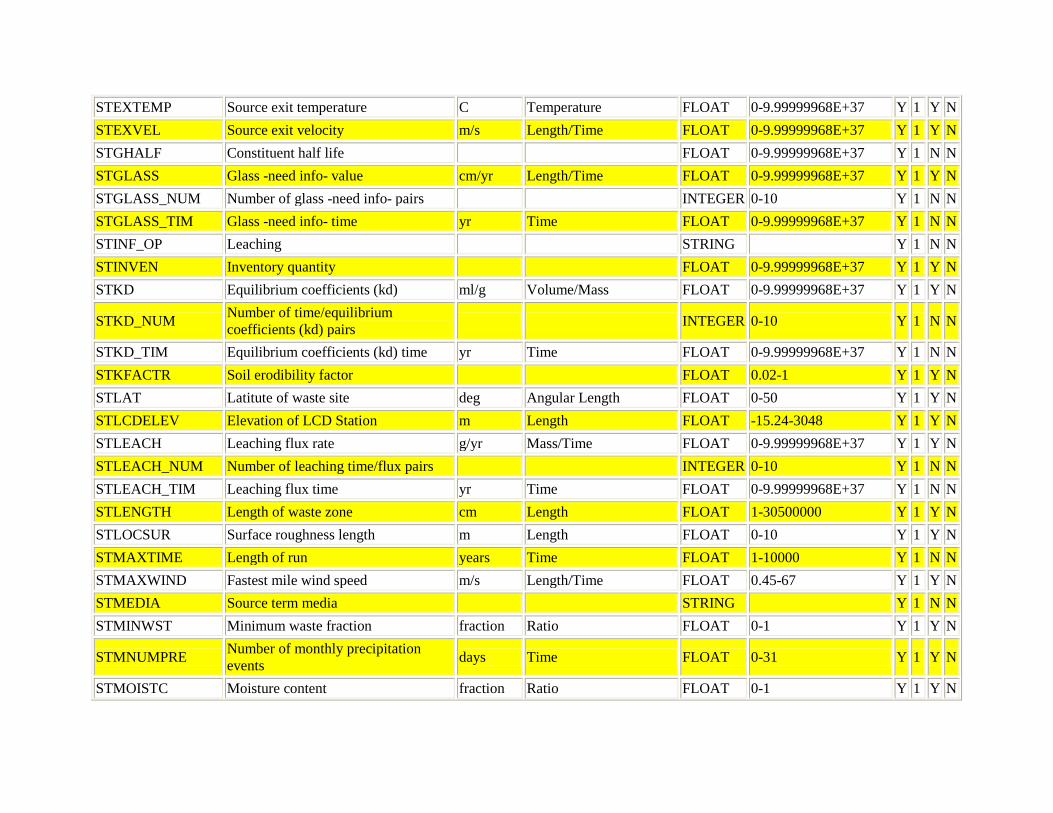
STEXTEMP Source exit temperature C Temperature FLOAT 0-9.99999968E+37 Y 1 Y N STEXVEL Source exit velocity m/s Length/Time FLOAT 0-9.99999968E+37 Y 1 Y N STGHALF Constituent half life FLOAT 0-9.99999968E+37 Y 1 N N STGLASS Glass -need info- value cm/yr Length/Time FLOAT 0-9.99999968E+37 Y 1 Y N STGLASS_NUM Number of glass -need info- pairs INTEGER 0-10 Y 1 N N STGLASS_TIM Glass -need info- time yr Time FLOAT 0-9.99999968E+37 Y 1 N N STINF_OP Leaching STRING Y 1 N N STINVEN Inventory quantity FLOAT 0-9.99999968E+37 Y 1 Y N STKD Equilibrium coefficients (kd) ml/g Volume/Mass FLOAT 0-9.99999968E+37 Y 1 Y N
STKD_NUM Number of time/equilibrium coefficients (kd) pairs INTEGER 0-10 Y 1 N N
STKD_TIM Equilibrium coefficients (kd) time yr Time FLOAT 0-9.99999968E+37 Y 1 N N STKFACTR Soil erodibility factor FLOAT 0.02-1 Y 1 Y N STLAT Latitute of waste site deg Angular Length FLOAT 0-50 Y 1 Y N STLCDELEV Elevation of LCD Station m Length FLOAT -15.24-3048 Y 1 Y N STLEACH Leaching flux rate g/yr Mass/Time FLOAT 0-9.99999968E+37 Y 1 Y N STLEACH_NUM Number of leaching time/flux pairs INTEGER 0-10 Y 1 N N STLEACH_TIM Leaching flux time yr Time FLOAT 0-9.99999968E+37 Y 1 N N STLENGTH Length of waste zone cm Length FLOAT 1-30500000 Y 1 Y N STLOCSUR Surface roughness length m Length FLOAT 0-10 Y 1 Y N STMAXTIME Length of run years Time FLOAT 1-10000 Y 1 N N STMAXWIND Fastest mile wind speed m/s Length/Time FLOAT 0.45-67 Y 1 Y N STMEDIA Source term media STRING Y 1 N N STMINWST Minimum waste fraction fraction Ratio FLOAT 0-1 Y 1 Y N
STMNUMPRE Number of monthly precipitation events days Time FLOAT 0-31 Y 1 Y N
STMOISTC Moisture content fraction Ratio FLOAT 0-1 Y 1 Y N
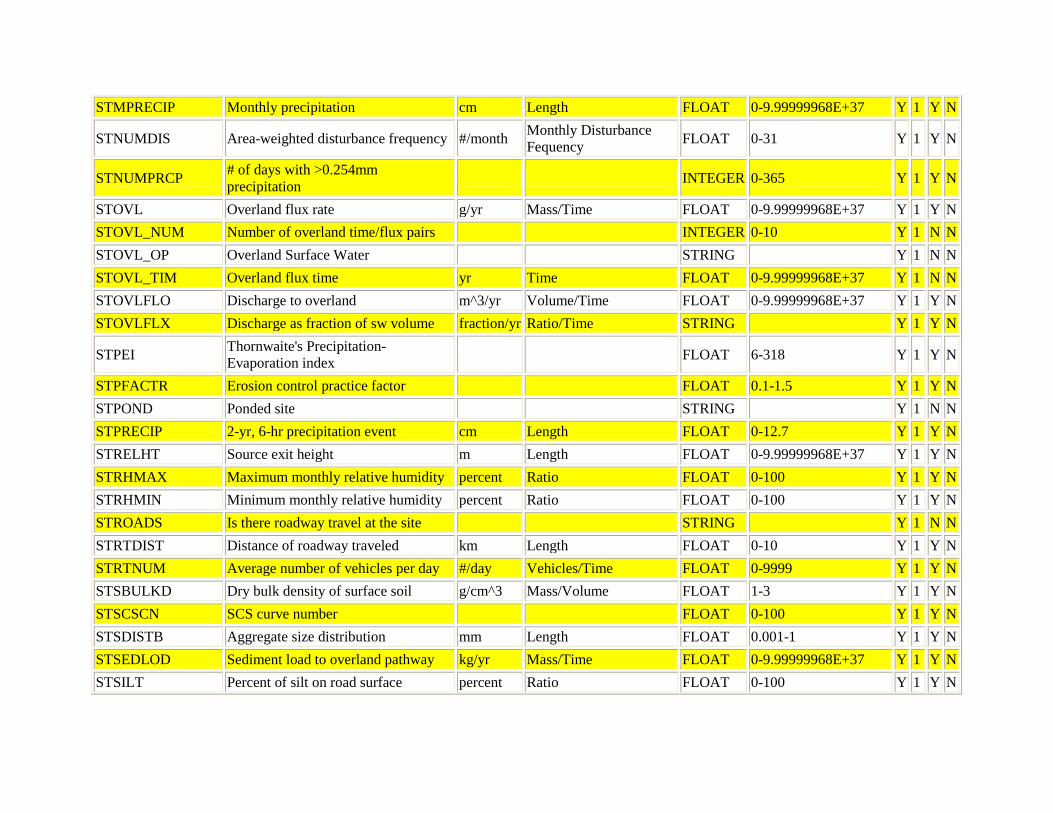
STMPRECIP Monthly precipitation cm Length FLOAT 0-9.99999968E+37 Y 1 Y N
STNUMDIS Area-weighted disturbance frequency #/month Monthly Disturbance Fequency FLOAT 0-31 Y 1 Y N
STNUMPRCP # of days with >0.254mm precipitation INTEGER 0-365 Y 1 Y N
STOVL Overland flux rate g/yr Mass/Time FLOAT 0-9.99999968E+37 Y 1 Y N STOVL_NUM Number of overland time/flux pairs INTEGER 0-10 Y 1 N N STOVL_OP Overland Surface Water STRING Y 1 N N STOVL_TIM Overland flux time yr Time FLOAT 0-9.99999968E+37 Y 1 N N STOVLFLO Discharge to overland m^3/yr Volume/Time FLOAT 0-9.99999968E+37 Y 1 Y N STOVLFLX Discharge as fraction of sw volume fraction/yr Ratio/Time STRING Y 1 Y N
STPEI Thornwaite's Precipitation-Evaporation index FLOAT 6-318 Y 1 Y N
STPFACTR Erosion control practice factor FLOAT 0.1-1.5 Y 1 Y N STPOND Ponded site STRING Y 1 N N STPRECIP 2-yr, 6-hr precipitation event cm Length FLOAT 0-12.7 Y 1 Y N STRELHT Source exit height m Length FLOAT 0-9.99999968E+37 Y 1 Y N STRHMAX Maximum monthly relative humidity percent Ratio FLOAT 0-100 Y 1 Y N STRHMIN Minimum monthly relative humidity percent Ratio FLOAT 0-100 Y 1 Y N STROADS Is there roadway travel at the site STRING Y 1 N N STRTDIST Distance of roadway traveled km Length FLOAT 0-10 Y 1 Y N STRTNUM Average number of vehicles per day #/day Vehicles/Time FLOAT 0-9999 Y 1 Y N STSBULKD Dry bulk density of surface soil g/cm^3 Mass/Volume FLOAT 1-3 Y 1 Y N STSCSCN SCS curve number FLOAT 0-100 Y 1 Y N STSDISTB Aggregate size distribution mm Length FLOAT 0.001-1 Y 1 Y N STSEDLOD Sediment load to overland pathway kg/yr Mass/Time FLOAT 0-9.99999968E+37 Y 1 Y N STSILT Percent of silt on road surface percent Ratio FLOAT 0-100 Y 1 Y N
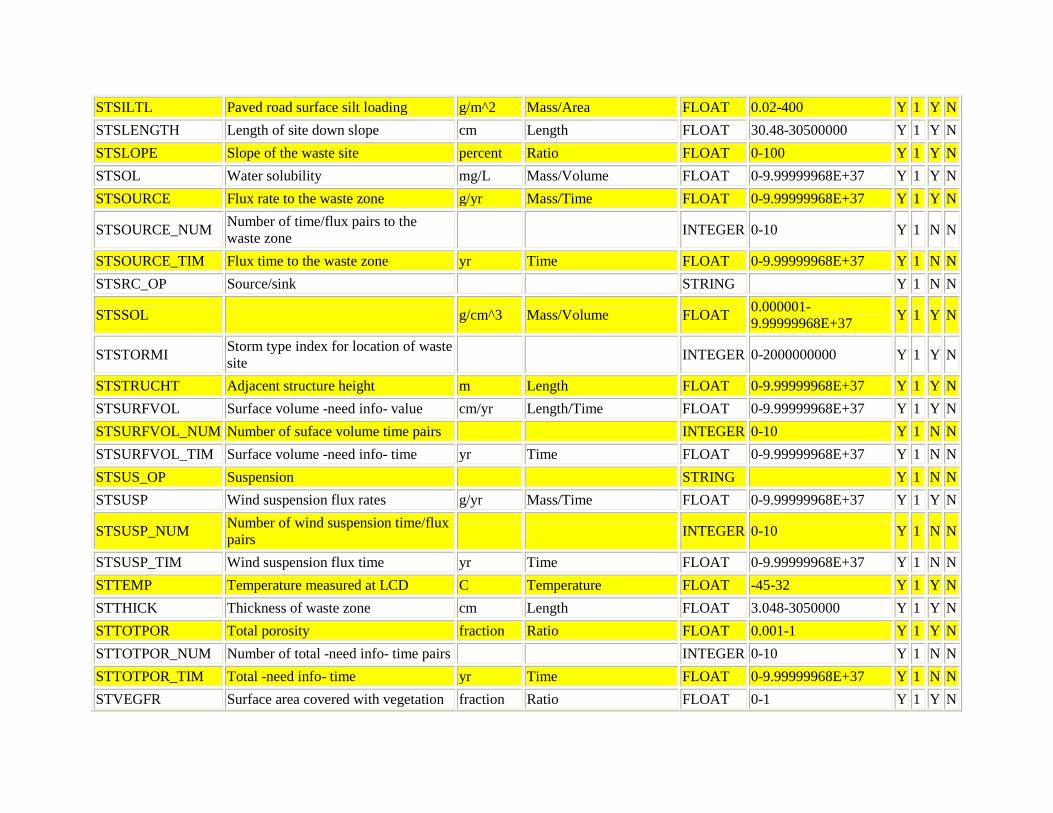
STSILTL Paved road surface silt loading g/m^2 Mass/Area FLOAT 0.02-400 Y 1 Y N STSLENGTH Length of site down slope cm Length FLOAT 30.48-30500000 Y 1 Y N STSLOPE Slope of the waste site percent Ratio FLOAT 0-100 Y 1 Y N STSOL Water solubility mg/L Mass/Volume FLOAT 0-9.99999968E+37 Y 1 Y N STSOURCE Flux rate to the waste zone g/yr Mass/Time FLOAT 0-9.99999968E+37 Y 1 Y N
STSOURCE_NUM Number of time/flux pairs to the waste zone INTEGER 0-10 Y 1 N N
STSOURCE_TIM Flux time to the waste zone yr Time FLOAT 0-9.99999968E+37 Y 1 N N STSRC_OP Source/sink STRING Y 1 N N
STSSOL g/cm^3 Mass/Volume FLOAT 0.000001-9.99999968E+37 Y 1 Y N
STSTORMI Storm type index for location of waste site INTEGER 0-2000000000 Y 1 Y N
STSTRUCHT Adjacent structure height m Length FLOAT 0-9.99999968E+37 Y 1 Y N STSURFVOL Surface volume -need info- value cm/yr Length/Time FLOAT 0-9.99999968E+37 Y 1 Y N STSURFVOL_NUM Number of suface volume time pairs INTEGER 0-10 Y 1 N N STSURFVOL_TIM Surface volume -need info- time yr Time FLOAT 0-9.99999968E+37 Y 1 N N STSUS_OP Suspension STRING Y 1 N N STSUSP Wind suspension flux rates g/yr Mass/Time FLOAT 0-9.99999968E+37 Y 1 Y N
STSUSP_NUM Number of wind suspension time/flux pairs INTEGER 0-10 Y 1 N N
STSUSP_TIM Wind suspension flux time yr Time FLOAT 0-9.99999968E+37 Y 1 N N STTEMP Temperature measured at LCD C Temperature FLOAT -45-32 Y 1 Y N STTHICK Thickness of waste zone cm Length FLOAT 3.048-3050000 Y 1 Y N STTOTPOR Total porosity fraction Ratio FLOAT 0.001-1 Y 1 Y N STTOTPOR_NUM Number of total -need info- time pairs INTEGER 0-10 Y 1 N N STTOTPOR_TIM Total -need info- time yr Time FLOAT 0-9.99999968E+37 Y 1 N N STVEGFR Surface area covered with vegetation fraction Ratio FLOAT 0-1 Y 1 Y N
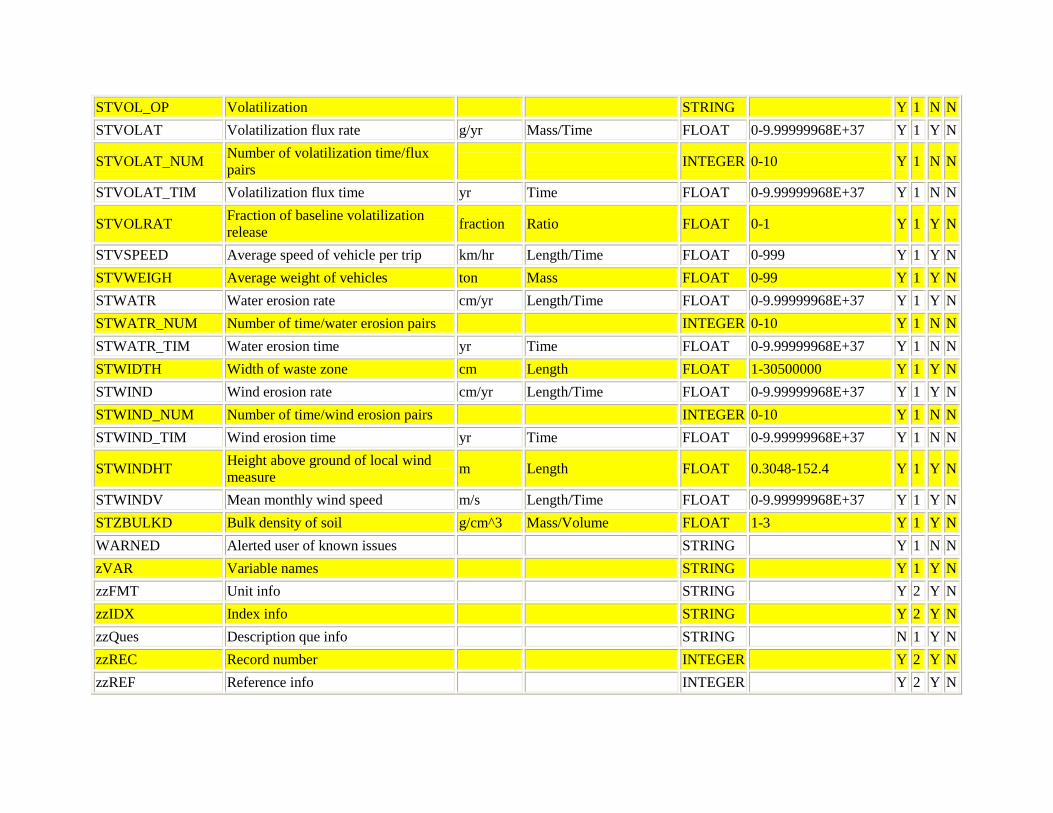
STVOL_OP Volatilization STRING Y 1 N N STVOLAT Volatilization flux rate g/yr Mass/Time FLOAT 0-9.99999968E+37 Y 1 Y N
STVOLAT_NUM Number of volatilization time/flux pairs INTEGER 0-10 Y 1 N N
STVOLAT_TIM Volatilization flux time yr Time FLOAT 0-9.99999968E+37 Y 1 N N
STVOLRAT Fraction of baseline volatilization release fraction Ratio FLOAT 0-1 Y 1 Y N
STVSPEED Average speed of vehicle per trip km/hr Length/Time FLOAT 0-999 Y 1 Y N STVWEIGH Average weight of vehicles ton Mass FLOAT 0-99 Y 1 Y N STWATR Water erosion rate cm/yr Length/Time FLOAT 0-9.99999968E+37 Y 1 Y N STWATR_NUM Number of time/water erosion pairs INTEGER 0-10 Y 1 N N STWATR_TIM Water erosion time yr Time FLOAT 0-9.99999968E+37 Y 1 N N STWIDTH Width of waste zone cm Length FLOAT 1-30500000 Y 1 Y N STWIND Wind erosion rate cm/yr Length/Time FLOAT 0-9.99999968E+37 Y 1 Y N STWIND_NUM Number of time/wind erosion pairs INTEGER 0-10 Y 1 N N STWIND_TIM Wind erosion time yr Time FLOAT 0-9.99999968E+37 Y 1 N N
STWINDHT Height above ground of local wind measure m Length FLOAT 0.3048-152.4 Y 1 Y N
STWINDV Mean monthly wind speed m/s Length/Time FLOAT 0-9.99999968E+37 Y 1 Y N STZBULKD Bulk density of soil g/cm^3 Mass/Volume FLOAT 1-3 Y 1 Y N WARNED Alerted user of known issues STRING Y 1 N N zVAR Variable names STRING Y 1 Y N zzFMT Unit info STRING Y 2 Y N zzIDX Index info STRING Y 2 Y N zzQues Description que info STRING N 1 Y N zzREC Record number INTEGER Y 2 Y N zzREF Reference info INTEGER Y 2 Y N
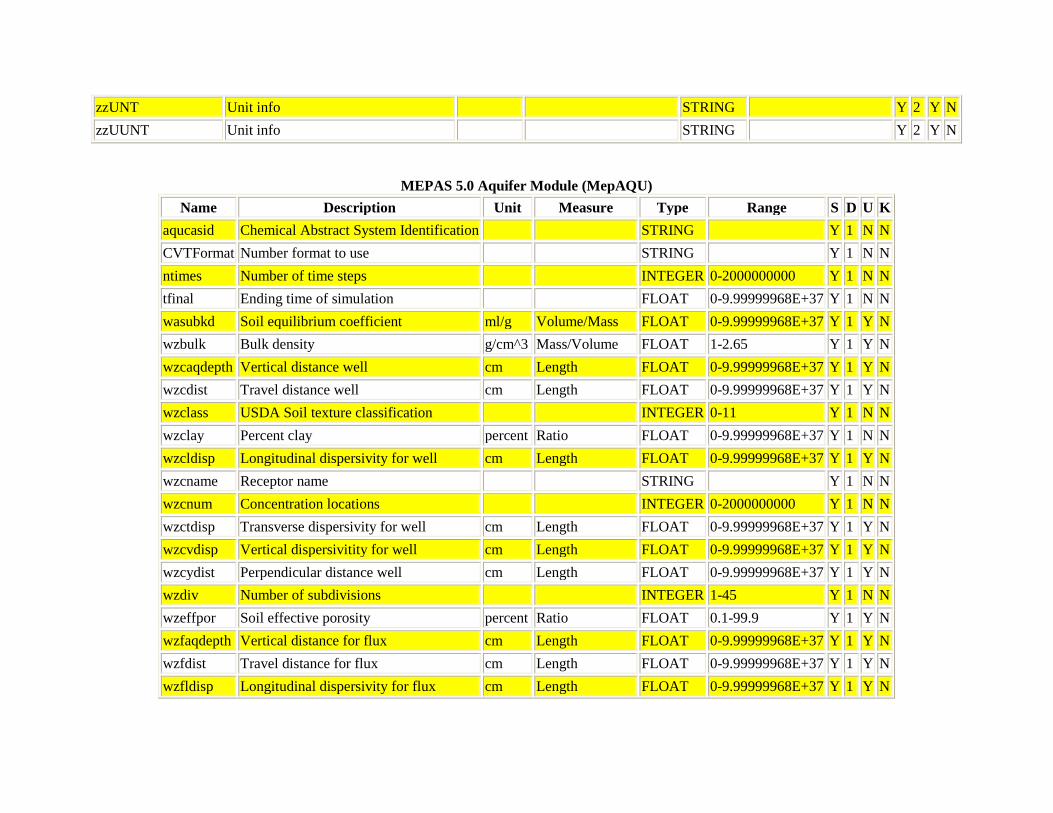
zzUNT Unit info STRING Y 2 Y N zzUUNT Unit info STRING Y 2 Y N
MEPAS 5.0 Aquifer Module (MepAQU) Name Description Unit Measure Type Range S D U K
aqucasid Chemical Abstract System Identification STRING Y 1 N N CVTFormat Number format to use STRING Y 1 N N ntimes Number of time steps INTEGER 0-2000000000 Y 1 N N tfinal Ending time of simulation FLOAT 0-9.99999968E+37 Y 1 N N wasubkd Soil equilibrium coefficient ml/g Volume/Mass FLOAT 0-9.99999968E+37 Y 1 Y N wzbulk Bulk density g/cm^3 Mass/Volume FLOAT 1-2.65 Y 1 Y N wzcaqdepth Vertical distance well cm Length FLOAT 0-9.99999968E+37 Y 1 Y N wzcdist Travel distance well cm Length FLOAT 0-9.99999968E+37 Y 1 Y N wzclass USDA Soil texture classification INTEGER 0-11 Y 1 N N wzclay Percent clay percent Ratio FLOAT 0-9.99999968E+37 Y 1 N N wzcldisp Longitudinal dispersivity for well cm Length FLOAT 0-9.99999968E+37 Y 1 Y N wzcname Receptor name STRING Y 1 N N wzcnum Concentration locations INTEGER 0-2000000000 Y 1 N N wzctdisp Transverse dispersivity for well cm Length FLOAT 0-9.99999968E+37 Y 1 Y N wzcvdisp Vertical dispersivitity for well cm Length FLOAT 0-9.99999968E+37 Y 1 Y N wzcydist Perpendicular distance well cm Length FLOAT 0-9.99999968E+37 Y 1 Y N wzdiv Number of subdivisions INTEGER 1-45 Y 1 N N wzeffpor Soil effective porosity percent Ratio FLOAT 0.1-99.9 Y 1 Y N wzfaqdepth Vertical distance for flux cm Length FLOAT 0-9.99999968E+37 Y 1 Y N wzfdist Travel distance for flux cm Length FLOAT 0-9.99999968E+37 Y 1 Y N wzfldisp Longitudinal dispersivity for flux cm Length FLOAT 0-9.99999968E+37 Y 1 Y N
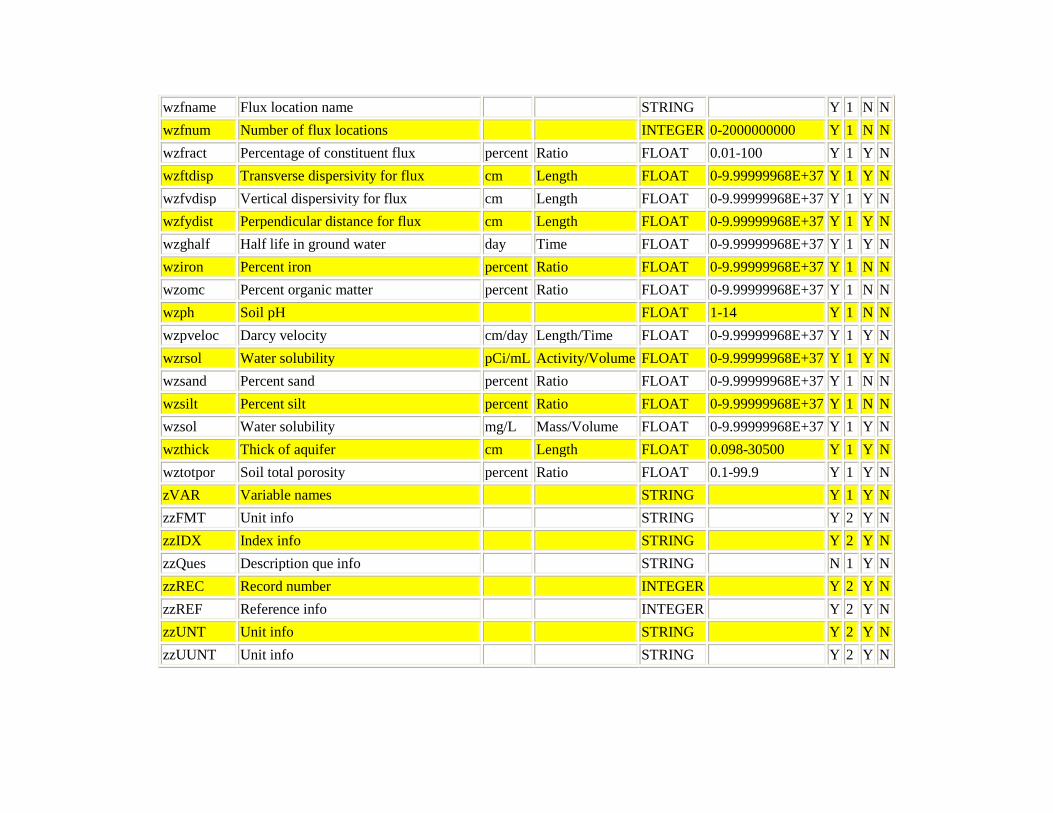
wzfname Flux location name STRING Y 1 N N wzfnum Number of flux locations INTEGER 0-2000000000 Y 1 N N wzfract Percentage of constituent flux percent Ratio FLOAT 0.01-100 Y 1 Y N wzftdisp Transverse dispersivity for flux cm Length FLOAT 0-9.99999968E+37 Y 1 Y N wzfvdisp Vertical dispersivity for flux cm Length FLOAT 0-9.99999968E+37 Y 1 Y N wzfydist Perpendicular distance for flux cm Length FLOAT 0-9.99999968E+37 Y 1 Y N wzghalf Half life in ground water day Time FLOAT 0-9.99999968E+37 Y 1 Y N wziron Percent iron percent Ratio FLOAT 0-9.99999968E+37 Y 1 N N wzomc Percent organic matter percent Ratio FLOAT 0-9.99999968E+37 Y 1 N N wzph Soil pH FLOAT 1-14 Y 1 N N wzpveloc Darcy velocity cm/day Length/Time FLOAT 0-9.99999968E+37 Y 1 Y N wzrsol Water solubility pCi/mL Activity/Volume FLOAT 0-9.99999968E+37 Y 1 Y N wzsand Percent sand percent Ratio FLOAT 0-9.99999968E+37 Y 1 N N wzsilt Percent silt percent Ratio FLOAT 0-9.99999968E+37 Y 1 N N wzsol Water solubility mg/L Mass/Volume FLOAT 0-9.99999968E+37 Y 1 Y N wzthick Thick of aquifer cm Length FLOAT 0.098-30500 Y 1 Y N wztotpor Soil total porosity percent Ratio FLOAT 0.1-99.9 Y 1 Y N zVAR Variable names STRING Y 1 Y N zzFMT Unit info STRING Y 2 Y N zzIDX Index info STRING Y 2 Y N zzQues Description que info STRING N 1 Y N zzREC Record number INTEGER Y 2 Y N zzREF Reference info INTEGER Y 2 Y N zzUNT Unit info STRING Y 2 Y N zzUUNT Unit info STRING Y 2 Y N
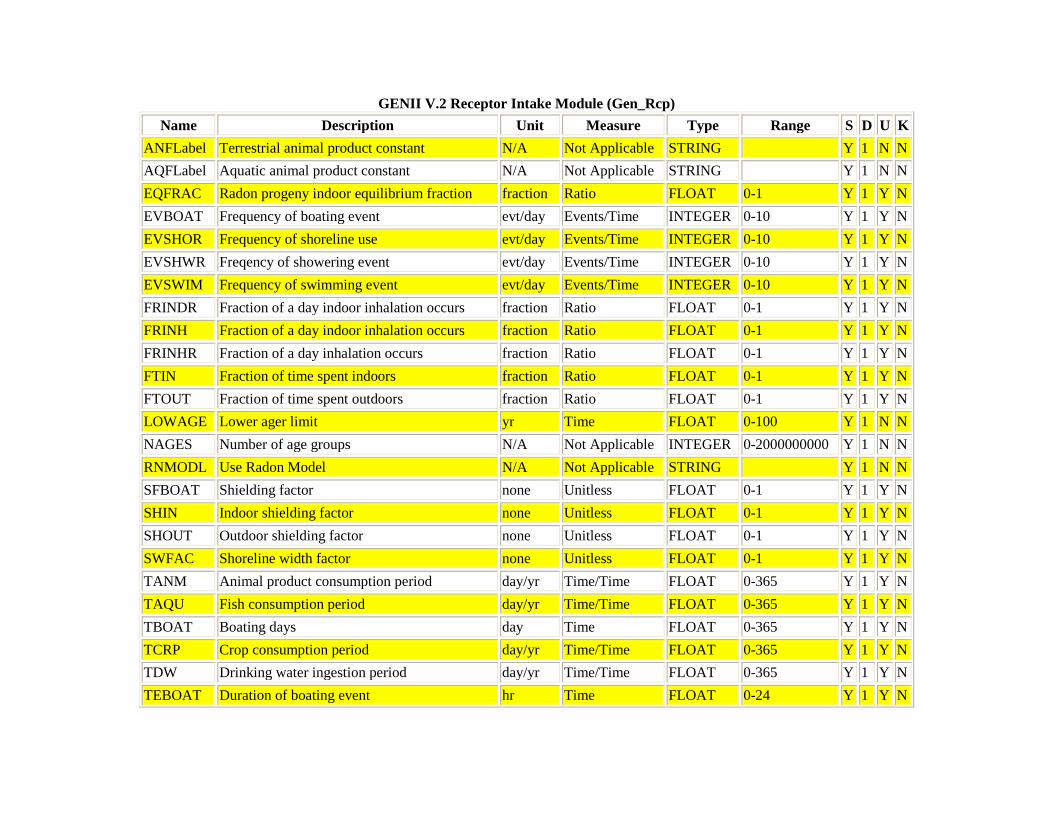
GENII V.2 Receptor Intake Module (Gen_Rcp) Name Description Unit Measure Type Range S D U K
ANFLabel Terrestrial animal product constant N/A Not Applicable STRING Y 1 N N AQFLabel Aquatic animal product constant N/A Not Applicable STRING Y 1 N N EQFRAC Radon progeny indoor equilibrium fraction fraction Ratio FLOAT 0-1 Y 1 Y N EVBOAT Frequency of boating event evt/day Events/Time INTEGER 0-10 Y 1 Y N EVSHOR Frequency of shoreline use evt/day Events/Time INTEGER 0-10 Y 1 Y N EVSHWR Freqency of showering event evt/day Events/Time INTEGER 0-10 Y 1 Y N EVSWIM Frequency of swimming event evt/day Events/Time INTEGER 0-10 Y 1 Y N FRINDR Fraction of a day indoor inhalation occurs fraction Ratio FLOAT 0-1 Y 1 Y N FRINH Fraction of a day indoor inhalation occurs fraction Ratio FLOAT 0-1 Y 1 Y N FRINHR Fraction of a day inhalation occurs fraction Ratio FLOAT 0-1 Y 1 Y N FTIN Fraction of time spent indoors fraction Ratio FLOAT 0-1 Y 1 Y N FTOUT Fraction of time spent outdoors fraction Ratio FLOAT 0-1 Y 1 Y N LOWAGE Lower ager limit yr Time FLOAT 0-100 Y 1 N N NAGES Number of age groups N/A Not Applicable INTEGER 0-2000000000 Y 1 N N RNMODL Use Radon Model N/A Not Applicable STRING Y 1 N N SFBOAT Shielding factor none Unitless FLOAT 0-1 Y 1 Y N SHIN Indoor shielding factor none Unitless FLOAT 0-1 Y 1 Y N SHOUT Outdoor shielding factor none Unitless FLOAT 0-1 Y 1 Y N SWFAC Shoreline width factor none Unitless FLOAT 0-1 Y 1 Y N TANM Animal product consumption period day/yr Time/Time FLOAT 0-365 Y 1 Y N TAQU Fish consumption period day/yr Time/Time FLOAT 0-365 Y 1 Y N TBOAT Boating days day Time FLOAT 0-365 Y 1 Y N TCRP Crop consumption period day/yr Time/Time FLOAT 0-365 Y 1 Y N TDW Drinking water ingestion period day/yr Time/Time FLOAT 0-365 Y 1 Y N TEBOAT Duration of boating event hr Time FLOAT 0-24 Y 1 Y N
TESHOR Duration of shoreline use events hr Time FLOAT 0-24 Y 1 Y N TESHWR Duration of showering event hr Time FLOAT 0-24 Y 1 Y N TESWIM Duration of swimming event hr Time FLOAT 0-24 Y 1 Y N TEXAIR Yearly plume immersion exposure time day Time FLOAT 0-365 Y 1 Y N TEXGRD Yearly external ground exposure time day Time FLOAT 0-365 Y 1 Y N TFDLabel Plant product constant N/A Not Applicable STRING Y 1 N N TINDRH Indoor air inhalation period day/yr Time/Time FLOAT 0-365 Y 1 Y N TINH Air inhalation period day/yr Time/Time FLOAT 0-365 Y 1 Y N TINHR Resuspended soil inhalation period day/yr Time/Time FLOAT 0-365 Y 1 Y N TSHOR Shoreline days day Time FLOAT 0-365 Y 1 Y N TSHWR Showering days day Time FLOAT 0-365 Y 1 Y N TSOIL Soil contact days day Time FLOAT 0-365 Y 1 Y N TSWIM Swimming days day Time FLOAT 0-365 Y 1 Y N UANM Animal product consumption rate kg/day Mass/Time FLOAT 0-10 Y 1 Y N UAQU Aquatic food consumption rate kg/day Mass/Time FLOAT 0-10 Y 1 Y N UCRP Crop consumption rate kg/day Mass/Time FLOAT 0-10 Y 1 Y N UDW Drinking water ingestion rate L/day Volume/Time FLOAT 0-10 Y 1 Y N UEXAIR Daily plume immersion exposure time hr Time FLOAT 0-24 Y 1 Y N UEXGRD Daily external ground exposure time hr Time FLOAT 0-24 Y 1 Y N UINDRH Indoor air inhalation rate m^3/day Volume/Time FLOAT 0-50 Y 1 Y N UINH Air inhalation rate m^3/day Volume/Time FLOAT 0-50 Y 1 Y N UINHR Resuspended soil inhalation rate m^3/day Volume/Time FLOAT 0-50 Y 1 Y N UPAGE Upper age limit yr Time FLOAT 0-100 Y 1 N N USHIN Ingestion rate of water while showering L/hr Volume/Time FLOAT 0-10 Y 1 Y N USOIL Inadvertent soil ingestion rate mg/day Mass/Time FLOAT 0-15000 Y 1 Y N USWIM Ingestion rate of water while swimming L/hr Volume/Time FLOAT 0-10 Y 1 Y N zVAR Variable names STRING Y 1 Y N
zzFMT Unit info STRING Y 2 Y N zzIDX Index info STRING Y 2 Y N zzQues Description que info STRING N 1 Y N zzREC Record number INTEGER Y 2 Y N zzREF Reference info INTEGER Y 2 Y N zzUNT Unit info STRING Y 2 Y N zzUUNT Unit info STRING Y 2 Y N
APPENDIX C
Hydrologic Data Acquisition and Processing System

C.1
APPENDIX C
Hydrologic Data Acquisition and Processing System
Currently, the HDAPS system is deployed on a Red Hat Enterprise Linux v. 4 server and data are stored on a distributed and auto-mounted disk storage system at Pacific Northwest National Laboratory referred to as the HydroNet. Although the code currently runs under Linux, through the modification of global path variables, the system is extendable to any other operating system that supports the Python language including Microsoft Windows, Mac OS X, Solaris, and AIX. The following data themes are currently designed into the system: 1. http://waterdata.usgs.gov/nwis/ – USGS Real-Time Stream Gage: Mean daily discharge data from the
National Water Information System (NWIS) are retrieved for real-time stations throughout Washington, Oregon, Idaho, and western Montana. HDAPS can be adjusted for more frequent updates as some gages are broadcasting data on 15-minute or hourly basis. Data can be retrieved for any USGS real-time gage station.
2. http://waterdata.usgs.gov/nwis/ – USGS Historic Stream Gage: Mean daily discharge data are collected periodically for decommissioned gages. Historic data are repeatedly collected to capture any changes to records.
3. ftp://ftp.wcc.nrcs.usda.gov/data/snow/snotel/cards – SNOTEL: Natural Resource Conservation Service (NRCS) Snowpack Telemetry data are collected daily for all SNOTEL stations in Washington, Oregon, Idaho, and Montana. Data include values for precipitation, temperature, and SWE.
4. ftp://sidads.colorado.edu/DATASETS/NOAA/G02158 – SNODAS: The National Weather Service's (NWS) operates the National Operational Hydrologic Remote Sensing Center (NOHRSC) and produces the Snow Data Assimilation System (SNODAS), which is a spatially distributed model producing various snow state products including SWE. These data are retrieved and processed daily.
5. http://weather.noaa.gov/pub/SL.us008001/ST.opnl/DF.gr2/DC.ndfd/AR.pacnwest – NDFD: The NWS National Digital Forecast Database (NDFD) provides spatially-distributed weather forecast data for 3-168 hours (depending on the data theme). Data are specifically retrieved for the Pacific Northwest region to reduce computational and storage burden.
6. http://gis.inel.gov – MODIS: The MODIS/Terra/Aqua snow covered area (SCA) product is available from the National Snow and Ice Data Center (NSIDC) and as a merged product available from Idaho National Laboratory that is designed for daily retrieval and processing.
7. http://www.met.utah.edu/cgi-bin/droman/download.cgi?... – Meteorology: Weather station data available from Pacific Northwest COOP, ASOS, AWOS, and AgriMet stations will be incorporated into HDAPS in the future. There is a greater level of complexity to retrieve these data since they are housed in several different locations and need a greater level of anomaly and missing data detection.
8. ftp://prism.oregonstate.edu//pub/prism/us/grids – PRISM: A spatially distributed 800-m climate dataset is available as a monthly mean product from Oregon State University through the Parameter-elevation Regressions on Independent Slopes Model (PRISM). This model provides data for precipitation, accumulated precipitation, average maximum temperature, average minimum temperature, and average dewpoint. Data are retrieved monthly.
9. http://www.nwrfc.noaa.gov/stp/stp_table.cgi – Northwest River Forecast Center Single-Trace Procedure (STP): The NWS Northwest River Forecast Center produces a deterministic long-
C.2
range forecast (45-120 days) for the Columbia River watershed at specific "forecast points" in the basin. HDAPS will acquire this information daily and use it as a comparison against PNNL-produced forecasts.
10. Northwest River Forecast Center Ensemble Prediction System (ESP): NWS Northwest River Forecast Center produces a 12-month ensemble forecast for "forecast points" within the Columbia River watershed. HDAPS will acquire this information as it is released and use it as a comparison against PNNL-produced forecasts.
11. Army Corps of Engineers Volumetric Forecast Data: The U.S. Army Corps of Engineers (USACE) produces volumetric inflow forecasts monthly from October-June for their projects. HDAPS will acquire volumetric forecast data as it is released and produce monthly comparisons with PNNL-derived volumetric forecasts.
12. Corps of Engineers Publicly Available Operations Data: The USACE provides hourly operations data from each project. These data include outflow via power turbine and spillway, forebay and tailwater elevations, and hydraulic head. HDAPS will retrieve this publicly available data and process it into a continuous hourly dataset which is available for modeling and multi-objective optimization requirements.
Currently, both the data downloading and processing initializations are controlled by operating system scheduling (i.e., crontab under Linux). Data processing procedures specific to each data theme are executed once the download process has been verified as complete. A combination of error log files and email notifications are sent when either a download or a processing error is encountered, in which case the HDAPS operators can resolve the issue. Certain FTP and HTTP protocol servers have proven to be sensitive to download requests and through time, HDAPS has adapted to these situations. For example, a common problem has been interrupted data downloads and non-existent data on the data servers. In these cases, logic has been built to repeat data-gathering requests over different time periods. The HDAPS Data Processor component has various tasks it is responsible for; this is largely dependent upon the dataset that is being processed. In many cases, the HDAPS Data Processor is interacting with a GIS system to ingest, project, mosaic, clip to specific watersheds, and overall prepare the dataset for model integration. In other cases, such as streamflow values retrieved from the USGS gauging stations, statistical processing is completed to evaluate the daily flow exceedence values over the history of the gage, and finally, other processing steps may include conversion of units so all data are consistent in the units. Future developments will be geared toward using machine-learning approaches to intelligently fill in missing data values. In addition, the operating system scheduling will be eliminated and replaced with a Python-based scheduler, which will become part of the integrated HDAPS.
APPENDIX D
Data for Environmental Modeling

D.1
APPENDIX D
Data for Environmental Modeling (D4EM): Background and Example Applications of Data Automation
Kurt L. Wolfe4, Rajbir S. Parmar1, Gerard F. Laniak1, Aaron B. Parks2, Laura Wilson2,
Jo Ellen Brandmeyer2,Daniel P. Ames3, Mark H. Gray4
Abstract Data is a basic requirement for most modeling applications. Collecting data is expensive and time consuming. High speed internet connections and growing databases of online environmental data go a long way to overcoming issues of data scarcity. Among the obstacles still remaining are: locating sources of data, querying the data sources, understanding various access protocols, and converting data from native to model specific formats. The Data for Environmental Modeling (D4EM) project demonstrates the development of a comprehensive set of open source software tools that overcome these obstacles by automating the process of populating model input datasets with environmental data available from distributed data sources. Data management and geoprocessing components included in D4EM allow for complex data transformations. Geoprocessing operations are implemented through linkages with open source GIS software. The components also handle metadata and data caching. While this project was initially undertaken to meet the data requirements for two US Environmental Protection Agency (USEPA) modeling systems, i.e. 3MRA (Multimedia, Multi-pathway, Multi-receptor Risk Assessment) and the BASINS (Better Assessment Science Integrating point and Non-point Sources), its component-based architecture allows it to be integrated into other modeling applications. The components are written in Microsoft .Net languages – C# and Visual Basic .Net. Current data sources include: EPA’s STORET data, U.S. Geological Survey (USGS) Terraserver maps and photos, USGS National Water Information System (NWIS) data and the multi agency National Land Cover Dataset (NLCD). 1.0 Introduction Environmental assessments of potential human and ecological health risks, the primary mechanism for informing regulatory decisions, increasingly demand a systems view of the environment. See for example the Millenium Assessment (Millennium Ecosystem Assessment, 2005), the Clean Air Mercury Rule (US EPA 2005), and the Chesapeake Bay Program (Kemp et al. 2000.) Defensible environmental outcomes require an integrated multi-stressor, multi-media, multi-pathway approach, thereby adequately addressing the impact of anthropogenic activities on the health and well being of both human and ecological receptors.
4 1US EPA, Office of Research and Development, 960 College Station Road, Athens, GA 30605 2RTI International, 3040 Cornwallis Road, Post Office Box 12194, Research Triangle Park, NC 27709 3Department of Geosciences, Idaho State University, 921 S. 8th Avenue, Stop 8072 Pocatello, ID 83209 4Aqua Terra Consultants, 150 E. Ponce de Leon Ave., Suite 355, Decatur, GA 30030
D.2
A principle means for organizing and executing modern environmental assessments is modeling. Models, at their core, are consumers and producers of information, primarily in the form of an encompassing and widely used term, “data.” A strategic response to the increasingly complex world of regulatory decision making is the ability to integrate and automate the processes of data access, retrieval, processing, display, and formatting in the application of environmental models. The objective of the Data for Environmental Modeling (D4EM) Project is to develop a comprehensive set of open source software tools that allow environmental model developers to populate model input files with environmental data available from disparate sources. Included in this paper are brief descriptions of the range of data needs associated with modern environmental assessments, the major elements of the D4EM open source software system, and example applications of the functionality of D4EM to develop data for the integrated modeling of watershed sub-basins and receiving surface waters. 2.0 Environmental Assessment Data Needs Several Federal Agencies are currently involved in developing and applying relatively complex modeling systems: e.g., the USEPA’s 3MRA (Multi-media, Multi-receptor, Multi-pathway Risk Assessment) and BASINS, the USDA’s Object Modeling System, and the Department of Defense’s Advanced Risk Assessment Modeling System (ARAMS) (US EPA, 2003., US EPA, 2001., David et al., 2002, Dortch and Gerald, 2002.) . Each of these software infrastructures is designed to facilitate the integrated application of multiple science models, many of which are legacy models not designed with a requirement for interoperability. The assessments conducted using these modeling systems range from simulating non-point source contaminant movement through watersheds and subsequent impacts on surface waters to estimating the national scale impact of industrial waste disposal on the health of human and ecological receptors. As an example, Figure 1 illustrates a view of the integrated science models included in the USEPA 3MRA modeling system. The 3MRA modeling system includes seventeen different types of environmental simulation models. The directional lines denote movement of data from one model to another. These models, in turn, are contained within a Framework for Risk Analysis in Multimedia Environmental Systems (FRAMES). FRAMES is a software infrastructure that manages the integrated application of the science models from source release to environmental exposure and risk. The FRAMES infrastructure facilitates users selection and configuration of simulations, manages the execution of the science models and post processors, performs quality control on all data flow through the system, and manages error identification and reporting. Integrated modeling systems such as 3MRA obviously require a significant amount of environmental data but also require that the data be expressed in a manner that is consistent with its use throughout the system. For example, site layout data is of particular interest because it includes spatial attributes that describe the extent and interconnectedness of the various physical features within the modeling domain (i.e., air, water, watersheds, ecological habitats, etc.). Data must be collected and organized from a systems perspective in addition to the individual model perspective. Take, for example, the case of a watershed model that produces erosive and runoff fluxes from individual sub-basins combined with and a surface water model that receives these fluxes and simulates the resulting impacts within each segment of its associated network. In order for these two models to function in a coupled manner, a consistent watershed sub-basin identification method is needed. One that associates each contributing area with the appropriate surface water segment. This unified view of the connectivity among physical features of a model application significantly increases the overall data preparation burden.
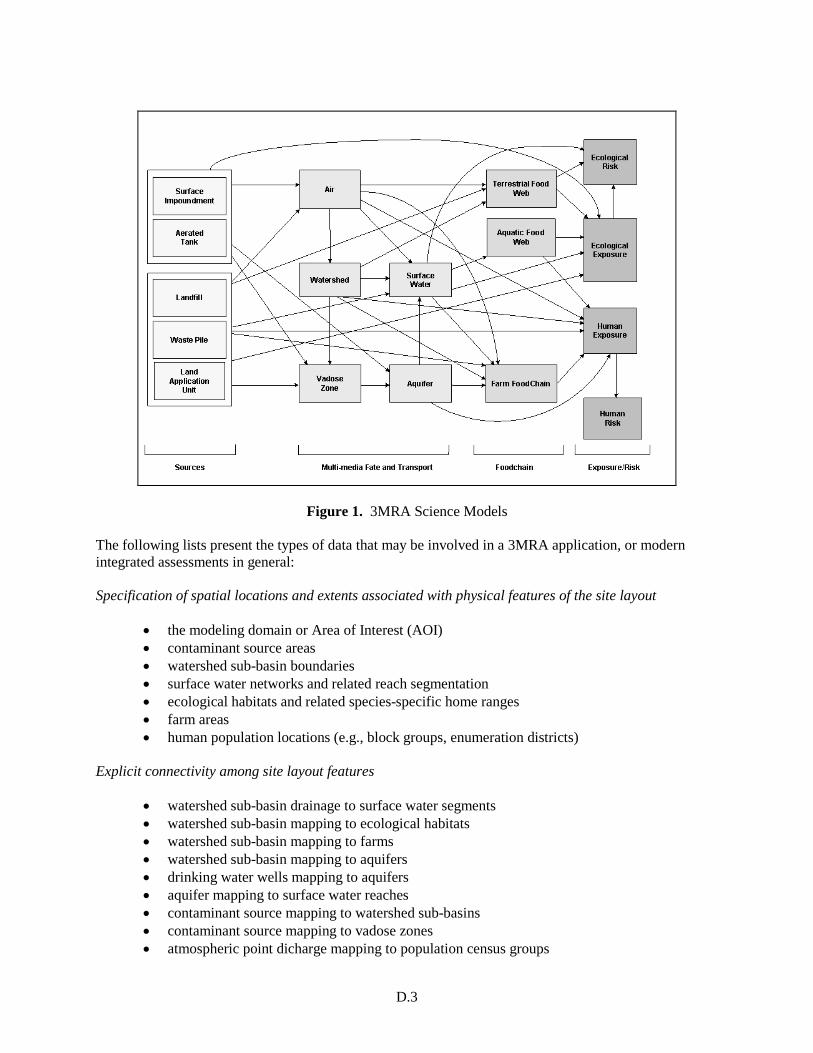
D.3
Figure 1. 3MRA Science Models The following lists present the types of data that may be involved in a 3MRA application, or modern integrated assessments in general:
Specification of spatial locations and extents associated with physical features of the site layout
• the modeling domain or Area of Interest (AOI) • contaminant source areas • watershed sub-basin boundaries • surface water networks and related reach segmentation • ecological habitats and related species-specific home ranges • farm areas • human population locations (e.g., block groups, enumeration districts)
Explicit connectivity among site layout features
• watershed sub-basin drainage to surface water segments • watershed sub-basin mapping to ecological habitats • watershed sub-basin mapping to farms • watershed sub-basin mapping to aquifers • drinking water wells mapping to aquifers • aquifer mapping to surface water reaches • contaminant source mapping to watershed sub-basins • contaminant source mapping to vadose zones • atmospheric point dicharge mapping to population census groups
D.4
• atmospheric point dicharge mapping to surface water segments • atmospheric point dicharge mapping to watershed sub-basins • meteorology stations • surface soil properties • watershed sub-basin landcover/landuse • contaminant point sources • stream and waterbody geometry and locations of gaging stations • vadose zone profiles and properties • subsurface soil properties and well locations with pumping rates • habitat species/home ranges and related characteristics •
Spatially independent data • chemical properties • human and ecological exposure factors • human and ecological risk factors
3.0 Data for Environmental Modeling (D4EM) The technical objective of the D4EM software system is to facilitate the automated access, retrieval, display, and processing of all data needed to perform integrated environmental modeling. D4EM is designed for Microsoft Windows XP using .NET and java programming languages. The system is designed for desktop modeling applications accessing internet based sources of data. The system architecture is component-based and consists of libraries of routines, each with a documented application programming interface (API). The software is written to be model/modeling system independent, that is, it is accessible to any modeling system implementing a “thin interface” between D4EM and a modeling system user interface. The D4EM system contains no proprietary software and is being developed in an open source collaborative manner intended for use and enhancement by the larger environmental science community. To ensure that the source of the data and all data processing steps are preserved the design includes the collection and cataloguing of metadata. Metadata contains descriptive information about the execution of each step of the data access, retrieval, and processing procedures. The metadata accompanies the data packet throughout D4EM. This is an essential quality assurance feature of the design that provides for transparency and reproducibility.
The software components of the D4EM system include a user interface, four libraries containing data methods and tools, and a database containing results of data collection efforts. The libraries include the use case library; the data manager library; the environmental data download tools library; and the GIS library. Each library has an Application Programming Interface (API), thus allowing direct programmatic access to any D4EM functionality. The collection of libraries and related functionality for automated model input is described below.
Environmental Data Download Tools Library The environmental data download tools (EDDT) library contains utilities for accessing and retrieving data from a wide range of data sources. The EDDT API provides a common interface for requesting data from the various sources. On the data source side, EDDT contains software that is specific to individual data sources, each containing their own protocols for accessing and retrieving data. Increasingly, Federal
D.5
Agencies are providing standards based web services that make EDDT connectivity and data querying relatively straight forward. Data sources currently accessible with D4EM include:
• EPA’s STORET http://www.epa.gov/storet/dbtop.html • US Geological Survey (USGS) Terraserver http://terraserver-usa.com/ • USGS National Water Information System (NWIS) http://waterdata.usgs.gov/nwis • USGS National Hydrography Dataset (NHD) http://nhd.usgs.gov/index.html • National Land Cover Dataset (NLCD) http://www.epa.gov/mrlc/nlcd.html
Data Manager Library The Data Manager library contains utilities for processing raw data into a format matched to the input needs of the environmental model(s). Principle categories of data management include statistical characterization and GIS manipulation. GIS Library MapWindow (http://www.mapwindow.com) is an open source GIS adopted for use with D4EM. MapWindow is a lightweight, extensible, and freely distributable GIS that provides the necessary functionality for satisfying the basic GIS needs of environmental modeling. The MapWindow software system includes a GIS processing engine (MapWinGIS ActiveX control), a user interface/map display application, and a series of “plug-ins” that add specific functionality to the system (e.g., geo-processing, additional user interface features, etc.). The MapWinGIS includes a GIS API for vector and raster geoprocessing. MapWindow is an integral part of functionality for utilities and methods included in other D4EM libraries. Use Case Library The Use Case Library contains high level algorithms for processing and organizing logical units of data needed by models. For example, watershed models require sub-basins be delineated on the basis of digital elevation data. The watershed delineation use case is an algorithm that manages the process of acquiring the necessary elevation data and processing it into a form that provides the geographic boundaries of each resulting drainage sub-basin. Use case algorithms request data and related processing from the Data Manager (DM). The Data Manager, in turn, requests data from EDDT that retrieves the data and returns it to the DM for any necessary processing, at which point the finished data is returned to the Use Case. Use cases are intended to be reusable and extensible, that is, they are intended to produce well defined groupings of data needed by classes of models, not simply an individual model. For example, a use case may be designed to collect census data, specifically the distribution and demographics of human populations within an area of interest. If well designed, the use case can be employed by multiple models that require the same data. A use case, when completed, places the resulting data and all associated metadata into a D4EM database for eventual transfer to specific model input files. Variable names within the D4EM database reflect a standardization of nomenclature. In order to transfer data from D4EM to a model or modeling system, the modeler must write a use case whose function is to map and transfer data from the D4EM database into specific model input files and formats.
D.6
Figure 2 illustrates the set of use cases currently under development. Use cases with shading have been coded. These use cases, and specifically the dependencies among them are targeted to 3MRA and its collection of science models (see Figure 1). It is believed, all though not yet demonstrated, that these use cases can be utilized by other models as well. User Interface The D4EM user interface receives, from a model or modeling system, a list of use cases that are to be executed. D4EM organizes the use cases into a logical execution sequence as a function of relevant data dependencies and steps through the use cases gathering necessary information from the user regarding required input data and options selection. Figure 3 presents an example of the initial D4EM interface. At the top of the screen is a list of requested use cases in order of execution. At the bottom of the screen the execution order is presented graphically and the status of execution is displayed using different shadings in the use case boxes. There are six use cases involved in this scenario, starting with the Source_AOI use case, which establishes the location and geographic extent of a particular source of contamination and the extent of the area surrounding the source that is to be included in the modeling. The WaterNetwork and Watershed (delineation) use cases are executed next. These use cases define the geographic extents, boundaries, and interconnectedness of the surface water network and watershed sub-basins. Both use cases are focused on the geographic area specified in the Source_AOI use case. These use cases are followed by Watershed and Waterbody Attributes use cases. The Attributes use cases collect additional data related to specific watershed sub-basins found in the area of interest (e.g., soils characteristics) while the waterbody attributes include such data as stream geometry and flow. The final use case, QA & run SDP, populates 3MRA watershed and surface water model input files with the data resulting from the executed use cases. Thus, the last D4EM use case is always a model specific use case that maps D4EM standard nomenclature data to model specific input data names and formats.
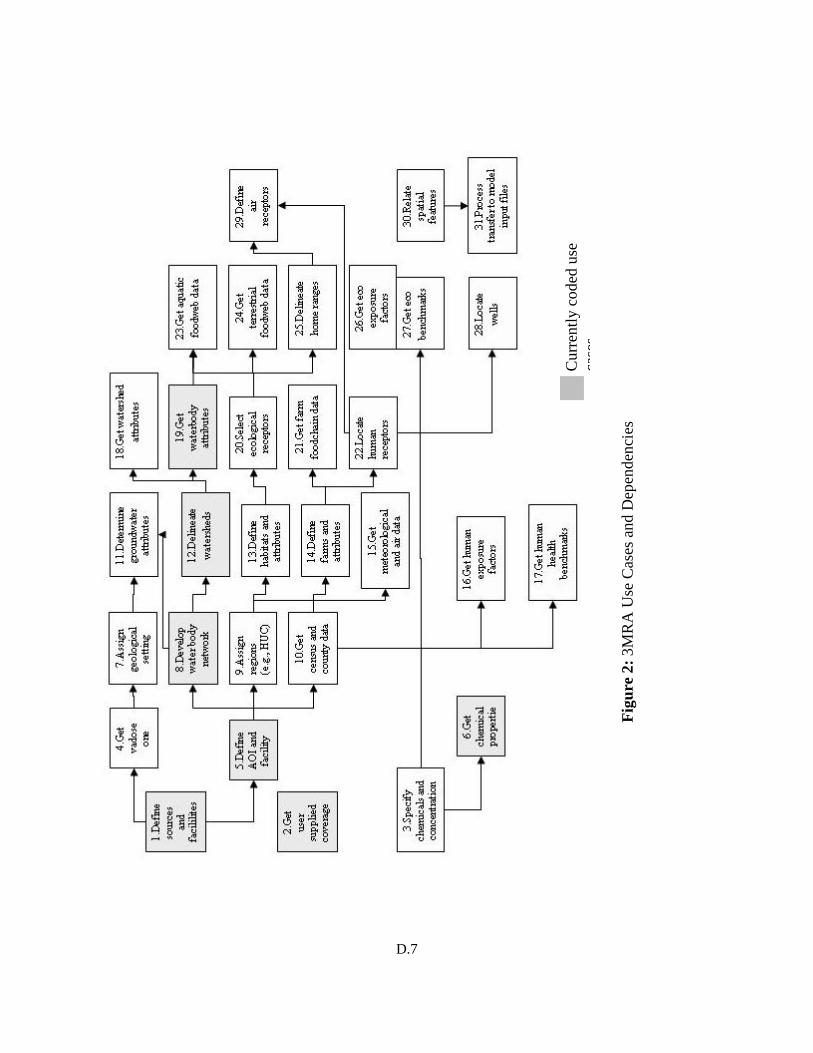
D.7
Figu
re 2
: 3M
RA
Use
Cas
es a
nd D
epen
denc
ies
Cur
rent
ly c
oded
use
ca
ses
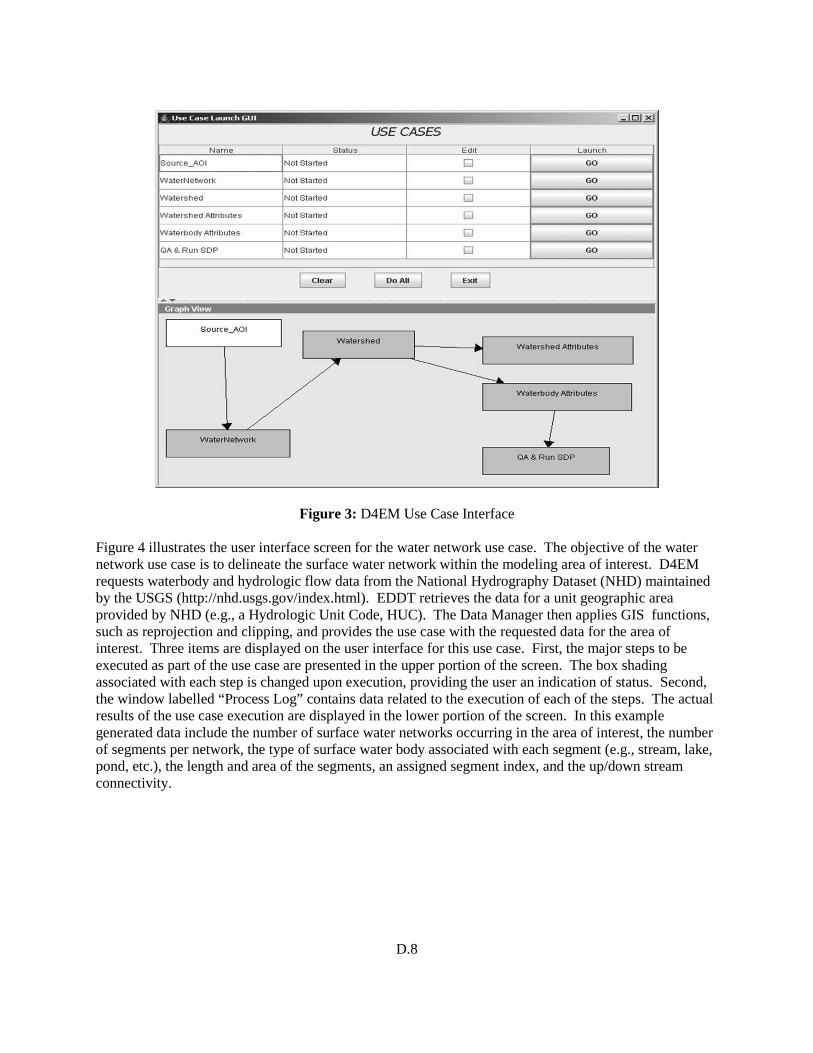
D.8
Figure 3: D4EM Use Case Interface Figure 4 illustrates the user interface screen for the water network use case. The objective of the water network use case is to delineate the surface water network within the modeling area of interest. D4EM requests waterbody and hydrologic flow data from the National Hydrography Dataset (NHD) maintained by the USGS (http://nhd.usgs.gov/index.html). EDDT retrieves the data for a unit geographic area provided by NHD (e.g., a Hydrologic Unit Code, HUC). The Data Manager then applies GIS functions, such as reprojection and clipping, and provides the use case with the requested data for the area of interest. Three items are displayed on the user interface for this use case. First, the major steps to be executed as part of the use case are presented in the upper portion of the screen. The box shading associated with each step is changed upon execution, providing the user an indication of status. Second, the window labelled “Process Log” contains data related to the execution of each of the steps. The actual results of the use case execution are displayed in the lower portion of the screen. In this example generated data include the number of surface water networks occurring in the area of interest, the number of segments per network, the type of surface water body associated with each segment (e.g., stream, lake, pond, etc.), the length and area of the segments, an assigned segment index, and the up/down stream connectivity.
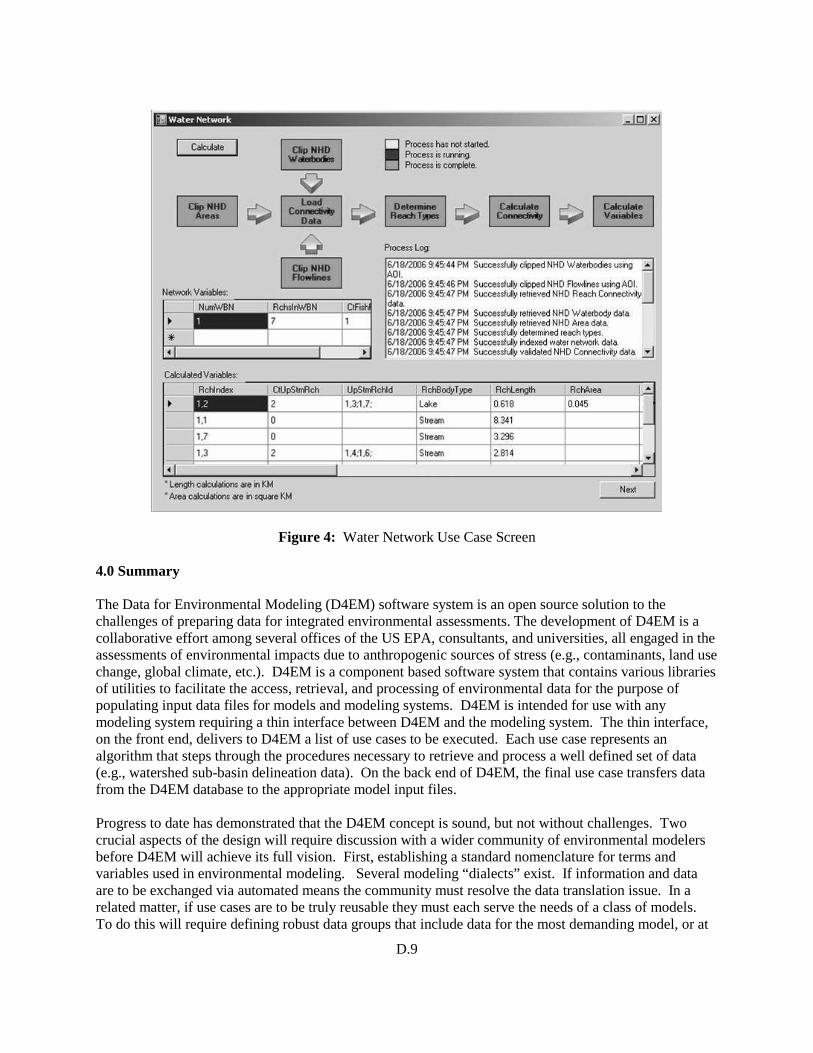
D.9
Figure 4: Water Network Use Case Screen 4.0 Summary The Data for Environmental Modeling (D4EM) software system is an open source solution to the challenges of preparing data for integrated environmental assessments. The development of D4EM is a collaborative effort among several offices of the US EPA, consultants, and universities, all engaged in the assessments of environmental impacts due to anthropogenic sources of stress (e.g., contaminants, land use change, global climate, etc.). D4EM is a component based software system that contains various libraries of utilities to facilitate the access, retrieval, and processing of environmental data for the purpose of populating input data files for models and modeling systems. D4EM is intended for use with any modeling system requiring a thin interface between D4EM and the modeling system. The thin interface, on the front end, delivers to D4EM a list of use cases to be executed. Each use case represents an algorithm that steps through the procedures necessary to retrieve and process a well defined set of data (e.g., watershed sub-basin delineation data). On the back end of D4EM, the final use case transfers data from the D4EM database to the appropriate model input files. Progress to date has demonstrated that the D4EM concept is sound, but not without challenges. Two crucial aspects of the design will require discussion with a wider community of environmental modelers before D4EM will achieve its full vision. First, establishing a standard nomenclature for terms and variables used in environmental modeling. Several modeling “dialects” exist. If information and data are to be exchanged via automated means the community must resolve the data translation issue. In a related matter, if use cases are to be truly reusable they must each serve the needs of a class of models. To do this will require defining robust data groups that include data for the most demanding model, or at
D.10
least a reasonably demanding model. To establish these data groupings will also require community discussion. The developers of D4EM welcome the participation of others in this endeavour. This paper has been reviewed in accordance with the U.S. Environmental Protection Agency’s peer and administrative review policies and approved for publication. Mention of trade names or commercial products does not constitute endorsement or recommendation for use. References David, O., Markstrom, S. L., Rojas, K. W., Ahuja, L. R., and Schneider, I. W. 2002. The Object Modeling System, in: Agricultural System Models in Field Research and Technology Transfer, edited by: Ahuja, L., Ma, L., Howell, T. A., Lewis Publishers, CRC Press LLC, 317–331. Dortch, M. S., and Gerald, J. S. 2002. Army Risk Assessment Modeling System for Evaluating Health Impacts Associated with Exposure to Chemical, Brownfield Sites: Assessment, Rehabilitation and Development, edt. by C. A. Brebbia, D. Almorza, and H. Klapperich, WIT Press, Southampton, UK. Kemp, MW., R. Bartleson, S.Blumenshine, J.D. Hagey, and W.R.Boyton. 2000. Ecosystem Models of the Chesapeake Bay Relating Nutrient Loadings, Environmental Conditions, and Living Resources. Technical Report. Chesapeake Bay Program Office, Annapolis, MD. Millennium Ecosystem Assessment. 2005. Ecosystems and Human Well-being: Synthesis. Island Press, Washington, DC. US EPA. 2001. Better Assessment Science Integrating Point and Non-Point Source BASINS Version 3.0. Office of Water. Washington, D.C. EPA-823-H-01-001. June 2001. US EPA. 2003. Multimedia, Multipathway, and Multireceptor Risk Assessment (3MRA) Modeling System. Volume I: Modeling System and Science Office of Research and Development - National Exposure Research Laboratory and Office of Solid Waste. Washington, D.C. EPA530-D-03-001a July 2003. US EPA. 2005. Regulatory Impact Analysis of the Clean Air Mercury Rule (Final Report), Office of Air Quality Planning and Standards, Environmental Air Quality Strategies and Standards Division, EPA-452/R-05-003. March 2005.