Embed Size (px)
Citation preview
Technology ahead of its time
Cytec Industries Inc. (NYSE : CYT)
Investor Day Presentation
Presented by: David Lilley, Chairman, President and CEO
Jim Cronin, Executive Vice President and CFOShane Fleming, President Cytec Specialty ChemicalsSteve Speak, President Cytec Engineered Materials
May 9, 2007
2
Forward Looking Statement and Non-GAAP Measures
During the course of this meeting we may make forward-looking statements. All statements that address expectations or projections about the future are forward-looking statements.
Some of these statements include words such as “expects”, “anticipates,” “plans,” “intends,” “projects,” and “outlook.” Although they reflect our current expectations, these statements are not guarantees of future performance because they involve a number of risks, uncertainties, and assumptions.
Included in this presentation are estimates for full year 2007 sales and earnings. These were included in our April 19, 2007 press release, which was also furnished as an exhibit to a current report on Form 8-K. These estimates set forth the Company’s assumptions and management’s best estimate of the full year 2007 sales and earnings at that time based on various assumptions set forth in the press release. There can be no assurance that sales or earnings will develop in the manner projected. Actual results may differ materially.
We recommend that you review Cytec’s SEC filings for a discussion of some of the factors which could cause actual results to differ materially from its expectations and projections. This and other Cytec information may be accessed at www.cytec.com.
In sections of this presentation certain ‘non-GAAP” measures are provided and identified as such. We believe that the “non-GAAP” measures can more accurately reflect comparisons of year to year trends and is consistent with how we review the information. A reconciliation of all “non-GAAP” measures to the applicable GAAP measure is provided in the appendix at the end of this presentation.
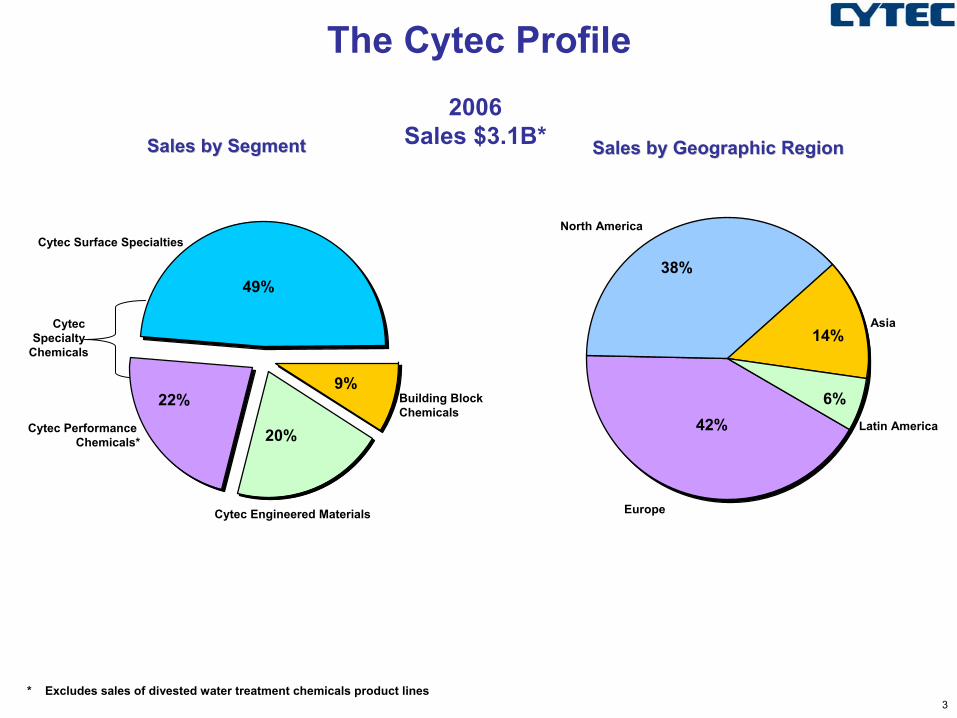
3
49%
22%9%
20%
Sales by SegmentSales by Segment Sales by Geographic RegionSales by Geographic Region
* Excludes sales of divested water treatment chemicals product lines
Cytec Surface Specialties
Building Block Chemicals
Cytec Engineered Materials
Cytec Performance Chemicals*
North America
Europe
Asia
Latin America
The Cytec Profile2006
Sales $3.1B*
38%
14%
6%42%
Cytec Specialty
Chemicals
4
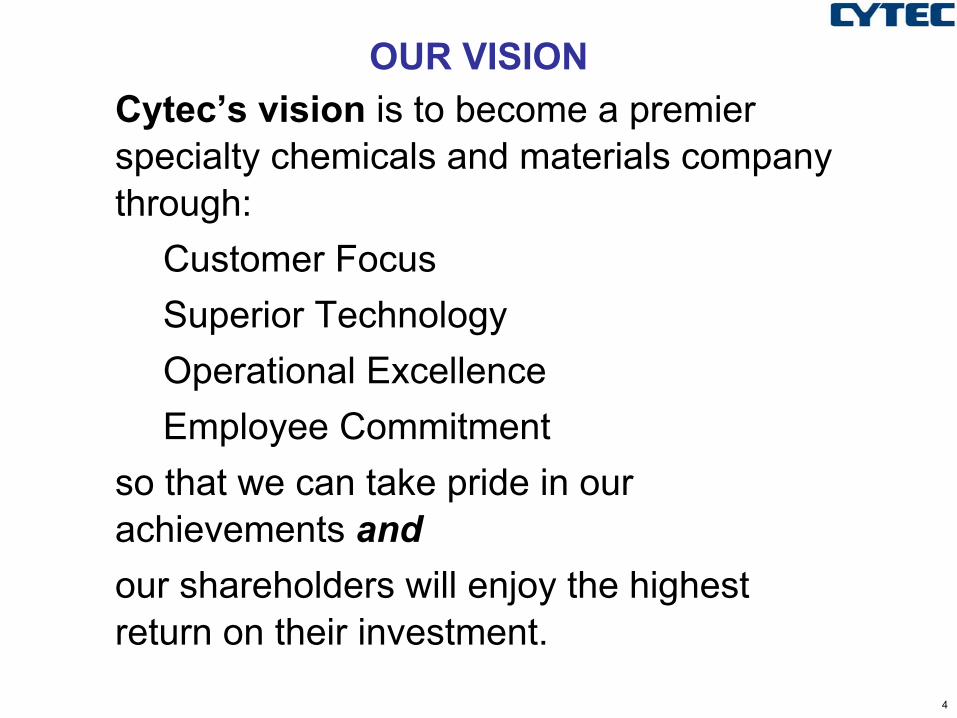
OUR VISIONCytec’s vision is to become a premier specialty chemicals and materials company through:
Customer FocusSuperior TechnologyOperational ExcellenceEmployee Commitment
so that we can take pride in our achievements and our shareholders will enjoy the highest return on their investment.
5
OUR MISSION
Cytec’s mission is to enhanceshareholder value through double-digit percentage annual growth in earnings per share, while achieving a superior return on equity .
6
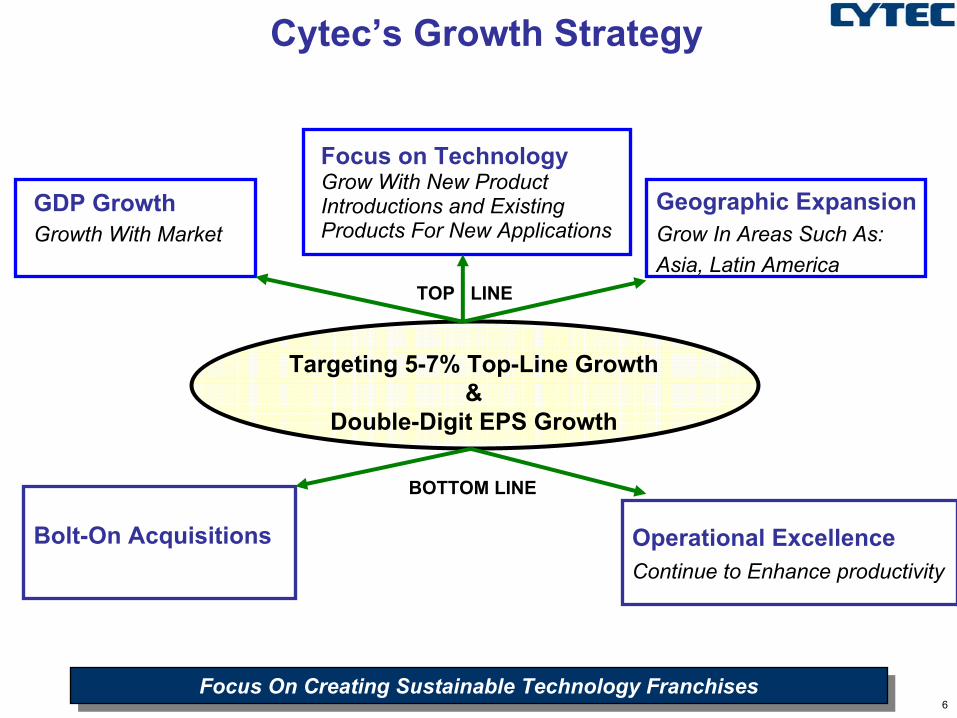
Cytec’s Growth Strategy
GDP GrowthGrowth With Market
Focus on TechnologyGrow With New ProductIntroductions and ExistingProducts For New Applications
Bolt-On Acquisitions Operational ExcellenceContinue to Enhance productivity
Targeting 5-7% Top-Line Growth&
Double-Digit EPS Growth
TOP LINE
BOTTOM LINE
Geographic ExpansionGrow In Areas Such As: Asia, Latin America
Focus On Creating Sustainable Technology FranchisesFocus On Creating Sustainable Technology Franchises
7
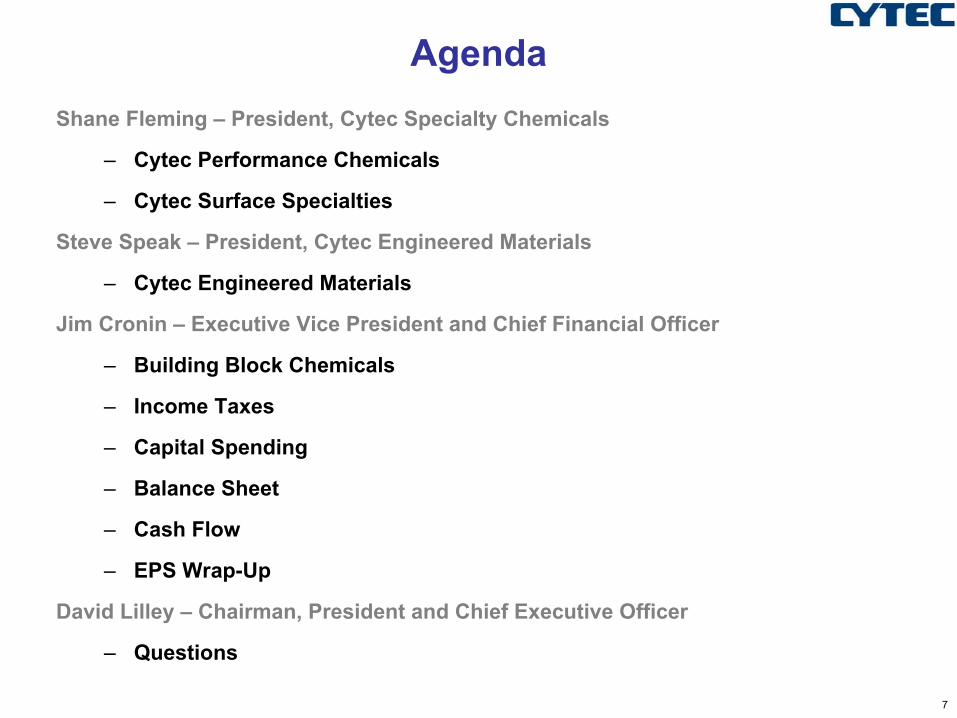
AgendaShane Fleming – President, Cytec Specialty Chemicals
– Cytec Performance Chemicals
– Cytec Surface Specialties
Steve Speak – President, Cytec Engineered Materials
– Cytec Engineered Materials
Jim Cronin – Executive Vice President and Chief Financial Officer
– Building Block Chemicals
– Income Taxes
– Capital Spending
– Balance Sheet
– Cash Flow
– EPS Wrap-Up
David Lilley – Chairman, President and Chief Executive Officer
– Questions
8
Cytec Performance Chemicals
Product lines discussed today:• Mining Chemicals
• Polymer Additives
• Pressure Sensitive Adhesives
Shane Fleming, President Cytec Specialty ChemicalsShane Fleming, President Cytec Specialty Chemicals
9
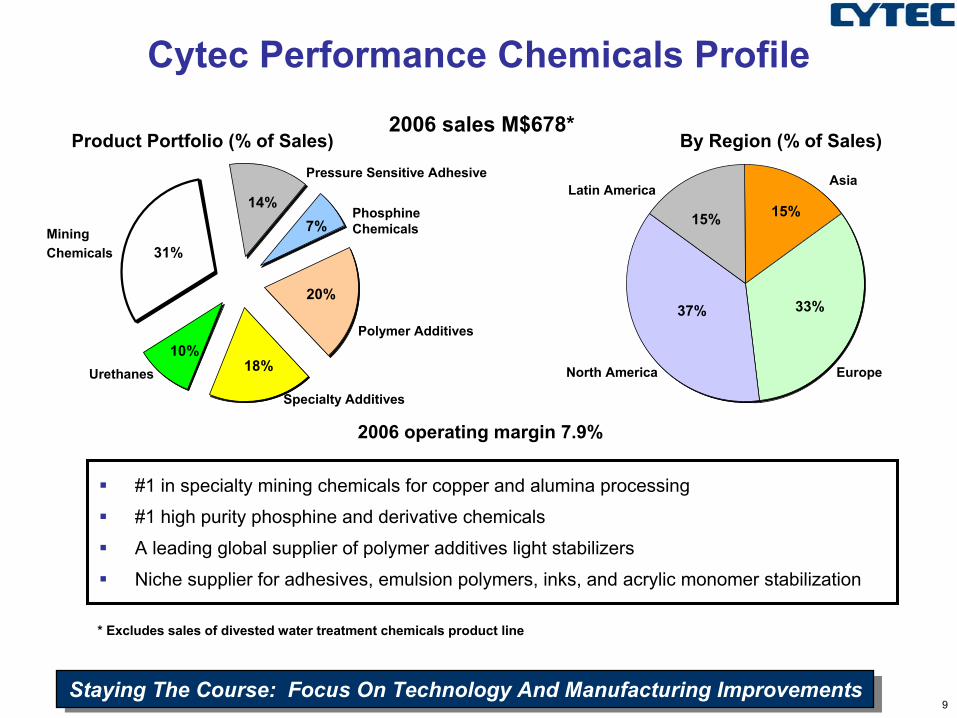
Cytec Performance Chemicals Profile2006 sales M$678*
#1 in specialty mining chemicals for copper and alumina processing
#1 high purity phosphine and derivative chemicals
A leading global supplier of polymer additives light stabilizers
Niche supplier for adhesives, emulsion polymers, inks, and acrylic monomer stabilization
2006 operating margin 7.9%
Pressure Sensitive Adhesive
Specialty Additives
MiningChemicals
Phosphine Chemicals
Polymer Additives
Urethanes
Asia Latin America
North America Europe
Product Portfolio (% of Sales) By Region (% of Sales)
31%
7%14%
37%
10%18%
20%33%
15%15%
* Excludes sales of divested water treatment chemicals product line
Staying The Course: Focus On Technology And Manufacturing ImprovementsStaying The Course: Focus On Technology And Manufacturing Improvements
10
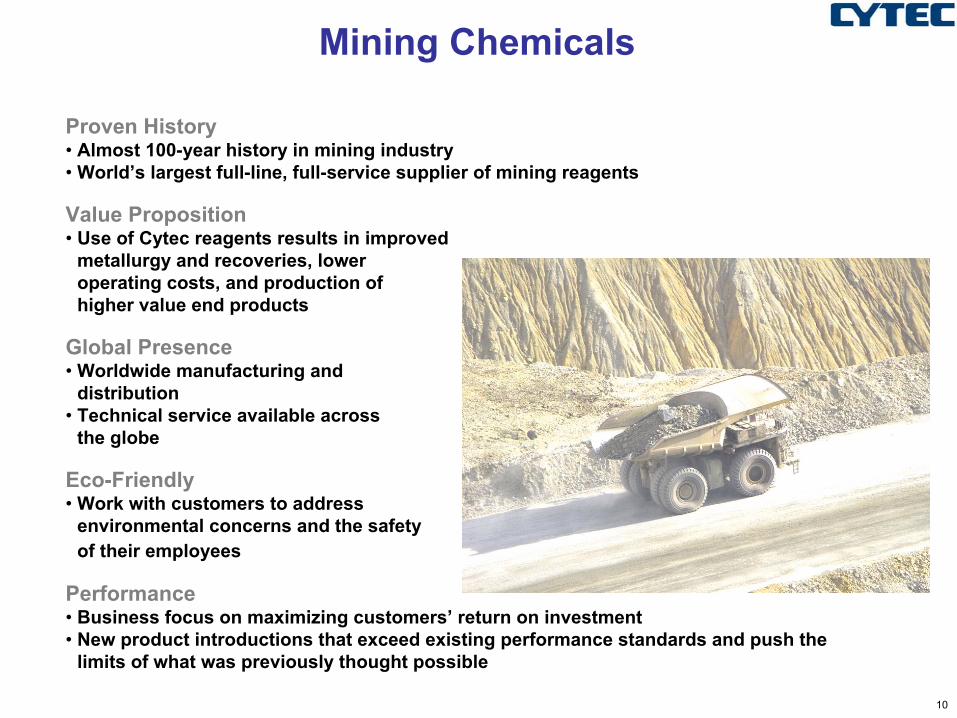
Mining Chemicals
Proven History• Almost 100-year history in mining industry• World’s largest full-line, full-service supplier of mining reagents
Value Proposition• Use of Cytec reagents results in improved
metallurgy and recoveries, lower operating costs, and production ofhigher value end products
Global Presence• Worldwide manufacturing and
distribution• Technical service available across
the globe
Eco-Friendly• Work with customers to address
environmental concerns and the safety of their employees
Performance• Business focus on maximizing customers’ return on investment• New product introductions that exceed existing performance standards and push the
limits of what was previously thought possible
11
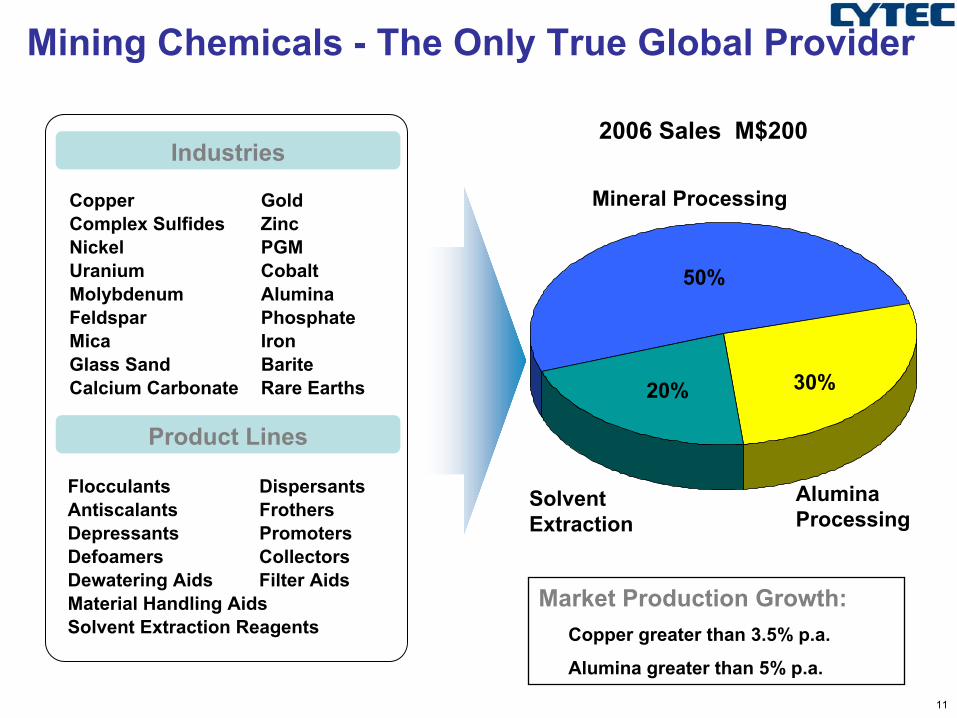
Mining Chemicals - The Only True Global Provider
Industries
Copper GoldComplex Sulfides ZincNickel PGMUranium CobaltMolybdenum AluminaFeldspar PhosphateMica IronGlass Sand BariteCalcium Carbonate Rare Earths
Product Lines
30%
50%
20%
Alumina Processing
Solvent Extraction
Mineral Processing
Flocculants DispersantsAntiscalants FrothersDepressants PromotersDefoamers CollectorsDewatering Aids Filter AidsMaterial Handling AidsSolvent Extraction Reagents
2006 Sales M$200
Market Production Growth:Copper greater than 3.5% p.a.
Alumina greater than 5% p.a.
12
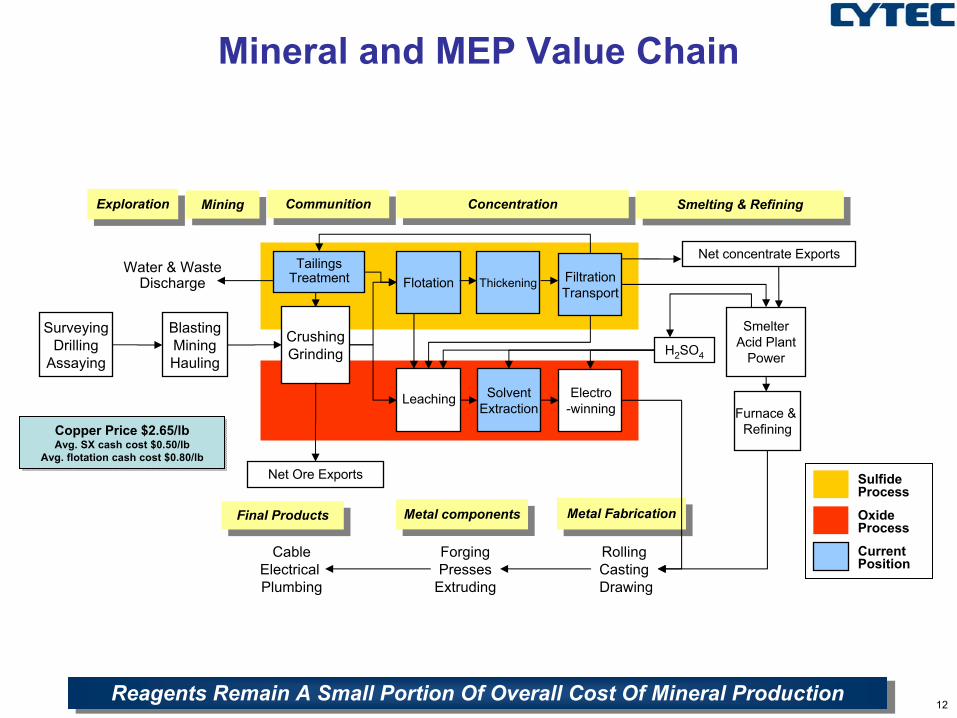
Mineral and MEP Value Chain
Reagents Remain A Small Portion Of Overall Cost Of Mineral ProductionReagents Remain A Small Portion Of Overall Cost Of Mineral Production
SolventExtraction
ExplorationExploration CommunitionCommunition ConcentrationConcentration Smelting & RefiningSmelting & Refining
Flotation
MiningMining
Thickening
Final ProductsFinal Products Metal componentsMetal components Metal FabricationMetal Fabrication
CableElectrical Plumbing
Net Ore Exports
Water & Waste Discharge
CurrentPosition
OxideProcess
SulfideProcess
BlastingMiningHauling
Net concentrate Exports
SmelterAcid Plant
Power
TailingsTreatment
Electro-winning Furnace &
Refining
CrushingGrinding
RollingCastingDrawing
ForgingPresses
Extruding
SurveyingDrilling
Assaying
Leaching
Copper Price $2.65/lbAvg. SX cash cost $0.50/lb
Avg. flotation cash cost $0.80/lb
Copper Price $2.65/lbAvg. SX cash cost $0.50/lb
Avg. flotation cash cost $0.80/lb
FiltrationTransport
H2SO4
13
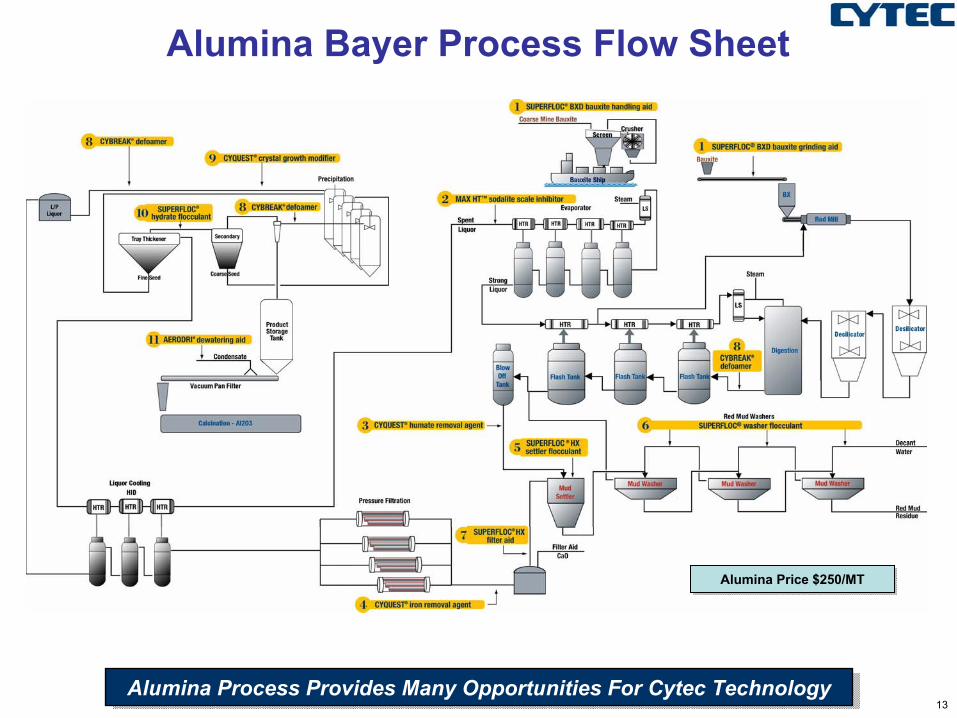
Alumina Bayer Process Flow Sheet
Alumina Process Provides Many Opportunities For Cytec TechnologyAlumina Process Provides Many Opportunities For Cytec Technology
Alumina Price $250/MTAlumina Price $250/MT
14
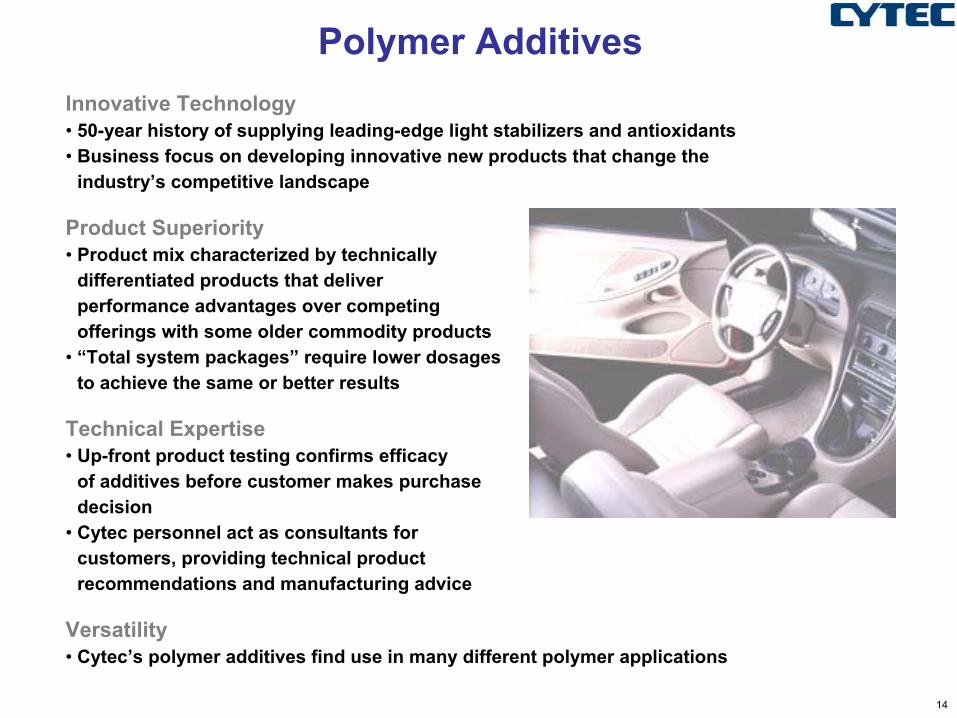
Polymer AdditivesInnovative Technology• 50-year history of supplying leading-edge light stabilizers and antioxidants• Business focus on developing innovative new products that change the
industry’s competitive landscape
Product Superiority• Product mix characterized by technically
differentiated products that deliver performance advantages over competing offerings with some older commodity products
• “Total system packages” require lower dosages to achieve the same or better results
Technical Expertise• Up-front product testing confirms efficacy
of additives before customer makes purchasedecision
• Cytec personnel act as consultants for customers, providing technical product recommendations and manufacturing advice
Versatility• Cytec’s polymer additives find use in many different polymer applications
15
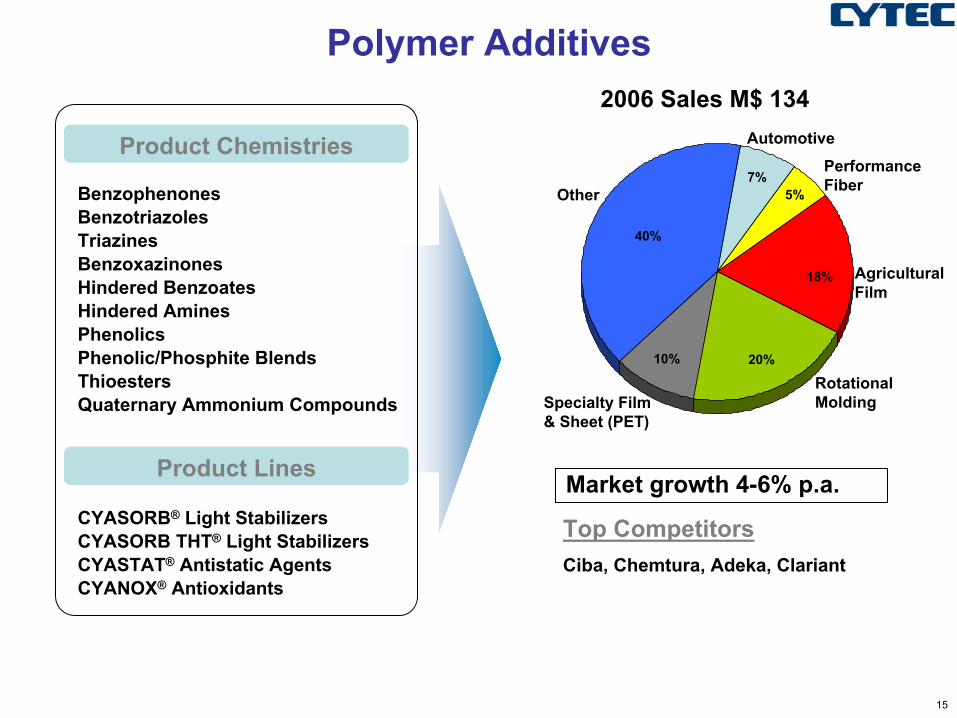
Polymer Additives
40%
7%
18%
20%10%
5%
Automotive
Performance FiberOther
RotationalMolding
Agricultural Film
Specialty Film & Sheet (PET)
Product Chemistries
BenzophenonesBenzotriazolesTriazinesBenzoxazinonesHindered BenzoatesHindered AminesPhenolicsPhenolic/Phosphite BlendsThioestersQuaternary Ammonium Compounds
Product Lines
CYASORB® Light StabilizersCYASORB THT® Light StabilizersCYASTAT® Antistatic AgentsCYANOX® Antioxidants
2006 Sales M$ 134
Top CompetitorsCiba, Chemtura, Adeka, Clariant
Market growth 4-6% p.a.
16
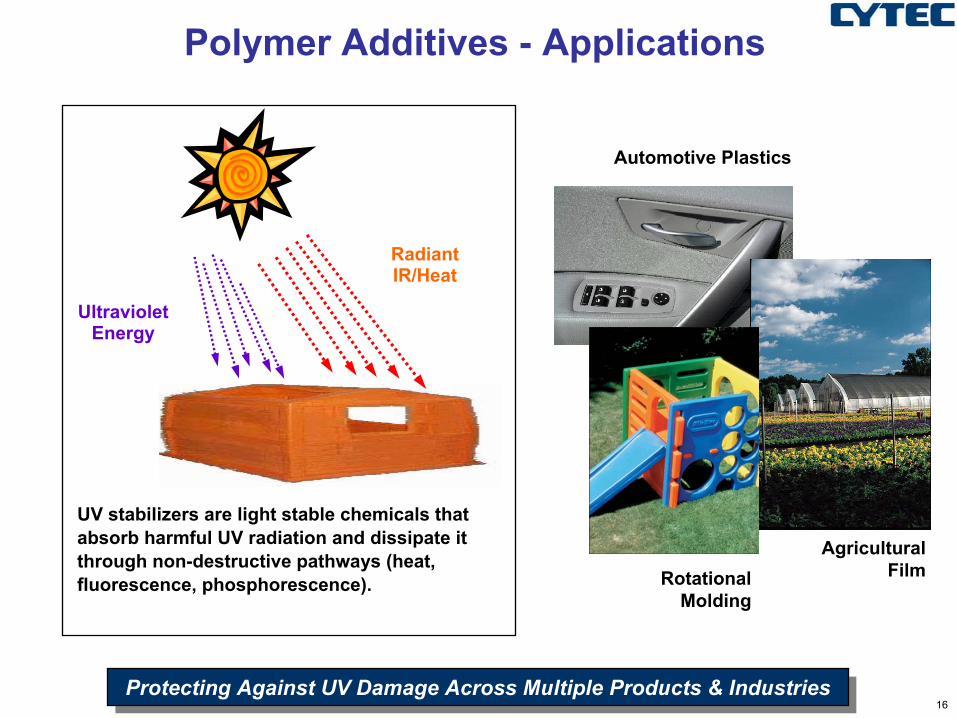
Polymer Additives - Applications
Automotive Plastics
Agricultural FilmRotational
Molding
UltravioletEnergy
RadiantIR/Heat
UV stabilizers are light stable chemicals that absorb harmful UV radiation and dissipate it through non-destructive pathways (heat, fluorescence, phosphorescence).
Protecting Against UV Damage Across Multiple Products & IndustriesProtecting Against UV Damage Across Multiple Products & Industries
17
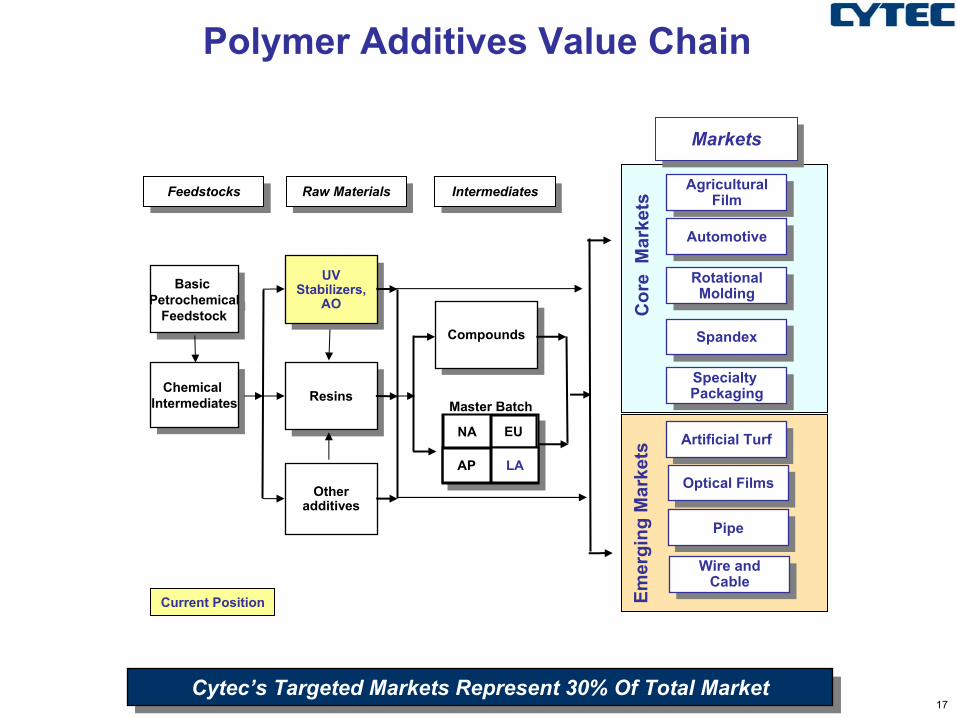
Basic Petrochemical
Feedstock
Basic Petrochemical
Feedstock
FeedstocksFeedstocks
Chemical IntermediatesChemical
Intermediates
PipePipe
Specialty Packaging
Specialty Packaging
AgriculturalFilm
AgriculturalFilmRaw MaterialsRaw Materials IntermediatesIntermediates
MarketsMarkets
AutomotiveAutomotive
Otheradditives
ResinsResins
UVStabilizers,
AO
UVStabilizers,
AO
Current Position
Master Batch
NA EU
AP LA
Rotational Molding
Rotational Molding
Optical FilmsOptical Films
Wire and Cable
Wire and Cable
Cor
e M
arke
ts
CompoundsCompounds SpandexSpandex
Artificial TurfArtificial Turf
Cytec’s Targeted Markets Represent 30% Of Total MarketCytec’s Targeted Markets Represent 30% Of Total Market
Emer
ging
Mar
kets
Polymer Additives Value Chain
18
Polymer Additives - Business Approach
• Continue targeted market approach with differentiated triazine technology
• Focus R&D and technical service on selected market sectors
• Continue active assessment of product line profitability of mature products
• Drive operational excellence initiatives at US plant to improve return on assets
• Limit capex to only fast payback projects
A Turnaround Business – Good Progress Made In Last 12 MonthsA Turnaround Business – Good Progress Made In Last 12 Months
19
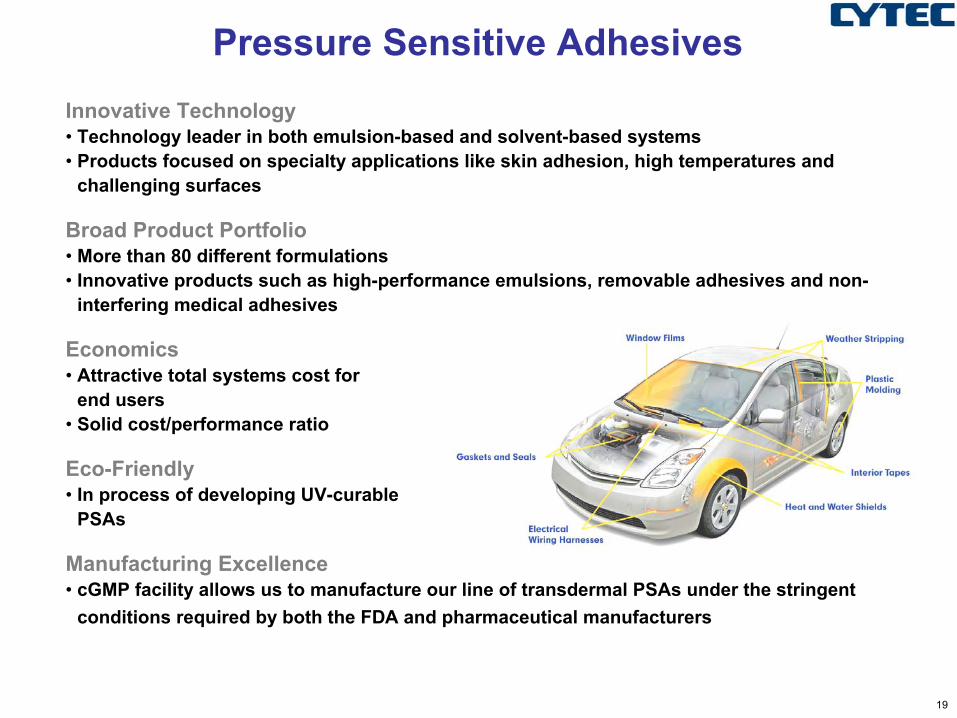
Pressure Sensitive AdhesivesInnovative Technology• Technology leader in both emulsion-based and solvent-based systems• Products focused on specialty applications like skin adhesion, high temperatures and
challenging surfaces
Broad Product Portfolio• More than 80 different formulations• Innovative products such as high-performance emulsions, removable adhesives and non-
interfering medical adhesives
Economics• Attractive total systems cost for
end users• Solid cost/performance ratio
Eco-Friendly• In process of developing UV-curable
PSAs
Manufacturing Excellence• cGMP facility allows us to manufacture our line of transdermal PSAs under the stringent
conditions required by both the FDA and pharmaceutical manufacturers
20
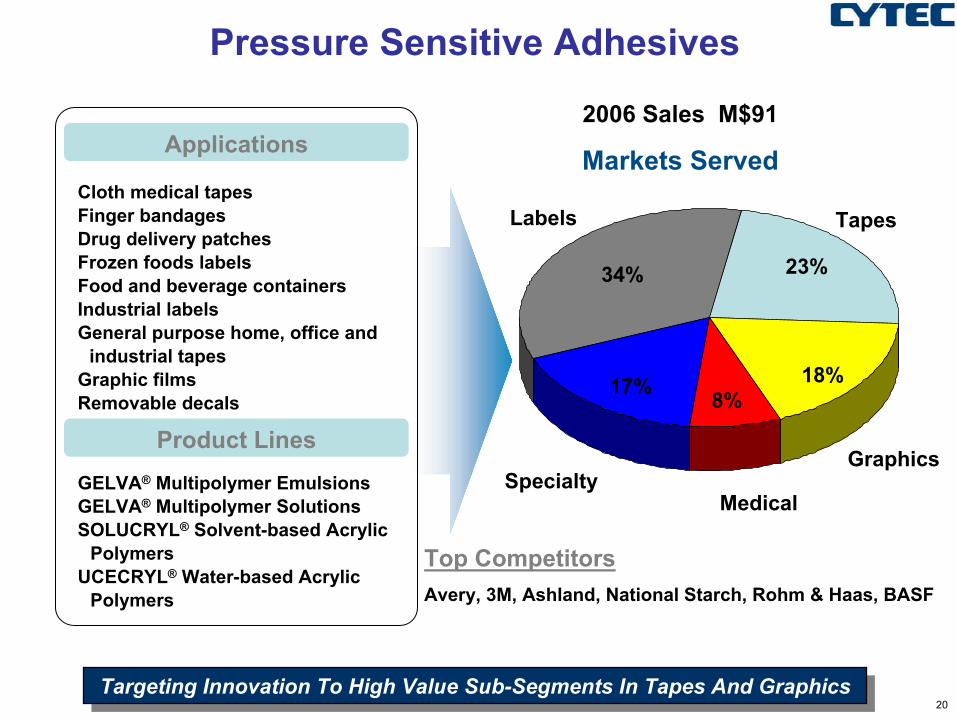
Pressure Sensitive Adhesives
34%
Labels
23%
18%8%17%
Tapes
Graphics
MedicalSpecialty
Applications
Product LinesGELVA® Multipolymer EmulsionsGELVA® Multipolymer SolutionsSOLUCRYL® Solvent-based Acrylic
Polymers UCECRYL® Water-based Acrylic
Polymers
Cloth medical tapesFinger bandagesDrug delivery patchesFrozen foods labelsFood and beverage containersIndustrial labels General purpose home, office and
industrial tapes Graphic filmsRemovable decals
2006 Sales M$91
Markets Served
Top CompetitorsAvery, 3M, Ashland, National Starch, Rohm & Haas, BASF
Targeting Innovation To High Value Sub-Segments In Tapes And GraphicsTargeting Innovation To High Value Sub-Segments In Tapes And Graphics
21
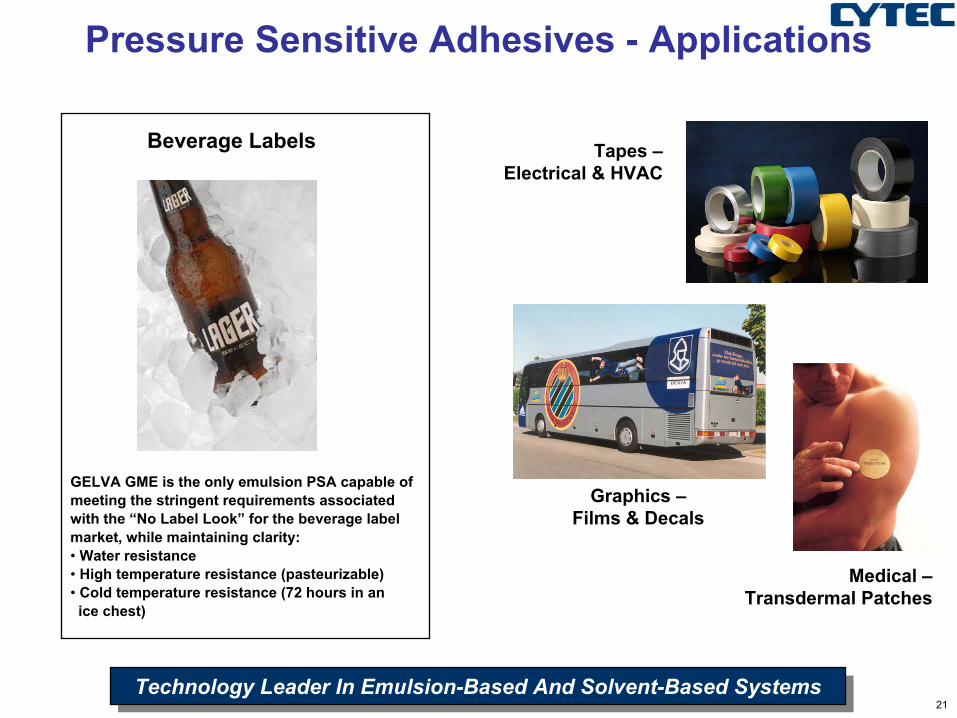
Pressure Sensitive Adhesives - Applications
Tapes –Electrical & HVAC
Medical –Transdermal Patches
Graphics –Films & Decals
GELVA GME is the only emulsion PSA capable of meeting the stringent requirements associated with the “No Label Look” for the beverage label market, while maintaining clarity:• Water resistance• High temperature resistance (pasteurizable)• Cold temperature resistance (72 hours in an ice chest)
Beverage Labels
Technology Leader In Emulsion-Based And Solvent-Based SystemsTechnology Leader In Emulsion-Based And Solvent-Based Systems
22
PSA Value Chain
Creating New Technology Platform With Eco-Friendly UV Cure PSACreating New Technology Platform With Eco-Friendly UV Cure PSA
BasicPetrochemical
FeedstockChemical
Intermediates
Solvents
LabelCoaters
Raw MaterialsRaw Materials IntermediatesIntermediates CoaterCoater End UserEnd UserConverterConverter
Current Position
Adhesives BU
Other PSAs
Acrylic Solvent borne PSA
Monomers
Additives
Paper
Film
Other Facestocks
Foam
Release Liners
GraphicCoaters
TapeCoaters
MedicalCoaters
SpecialtyCoaters
Converters
Paper Merchants
Screen Printers
Sign Shops
Digital Houses
Converters
Distributors
Manufacturer
/
Brand Owner
Acrylic Water borne PSA
UV PSA
Target Position
23
Pressure Sensitive Adhesives - Business approach
Already Actioned
• Rationalize to a global organization based on functional lines
• Eliminate duplicate activities e.g. local R&D
• Establish cost effective manufacturing network
Path Forward
• Focus R&D activity on high value niche applications
• Increase market presence and penetration of Asian market
24
Cytec Performance Chemicals - Summary
• Portfolio of technology driven product lines requiring different business approaches– Strong positions in growth markets e.g. Mining
Chemicals and Phosphines (market and technology leadership), PSA (leader in both emulsion and solvent-based technologies)
– Opportunity to improve earnings through productivity, and additional product rationalization / asset restructuring in turnaround product lines, i.e. Polymer Additives and Urethanes
– Operate Specialty Additives for cash
Portfolio Approach Expected To Yield Average Annual +10% EBIT GrowthPortfolio Approach Expected To Yield Average Annual +10% EBIT Growth
25
Cytec Surface Specialties
• The Coatings Market
• Our Product Lines
• Our Earnings Growth
Shane Fleming, President Cytec Specialty ChemicalsShane Fleming, President Cytec Specialty Chemicals
26
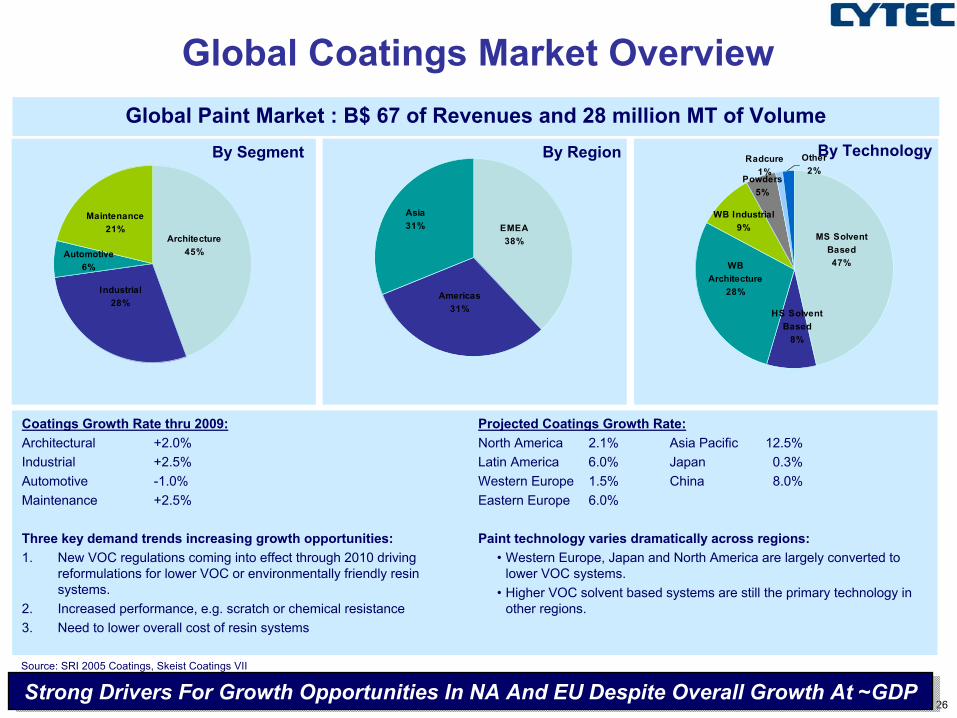
Global Coatings Market Overview
Maintenance21%
Automotive6%
Industrial28%
Architecture45%
By Segment
EMEA38%
Americas31%
Asia31%
By Region
WB Industrial9%
Powders5%
Radcure1%
Other2%
WB Architecture
28%
HS Solvent Based
8%
MS Solvent Based47%
By Technology
Projected Coatings Growth Rate:North America 2.1% Asia Pacific 12.5%Latin America 6.0% Japan 0.3%Western Europe 1.5% China 8.0%Eastern Europe 6.0%
Paint technology varies dramatically across regions:• Western Europe, Japan and North America are largely converted to
lower VOC systems. • Higher VOC solvent based systems are still the primary technology in
other regions.
Coatings Growth Rate thru 2009:Architectural +2.0%Industrial +2.5%Automotive -1.0%Maintenance +2.5%
Three key demand trends increasing growth opportunities:1. New VOC regulations coming into effect through 2010 driving
reformulations for lower VOC or environmentally friendly resin systems.
2. Increased performance, e.g. scratch or chemical resistance3. Need to lower overall cost of resin systems
Strong Drivers For Growth Opportunities In NA And EU Despite Overall Growth At ~GDPStrong Drivers For Growth Opportunities In NA And EU Despite Overall Growth At ~GDP
Global Paint Market : B$ 67 of Revenues and 28 million MT of Volume
Source: SRI 2005 Coatings, Skeist Coatings VII
27
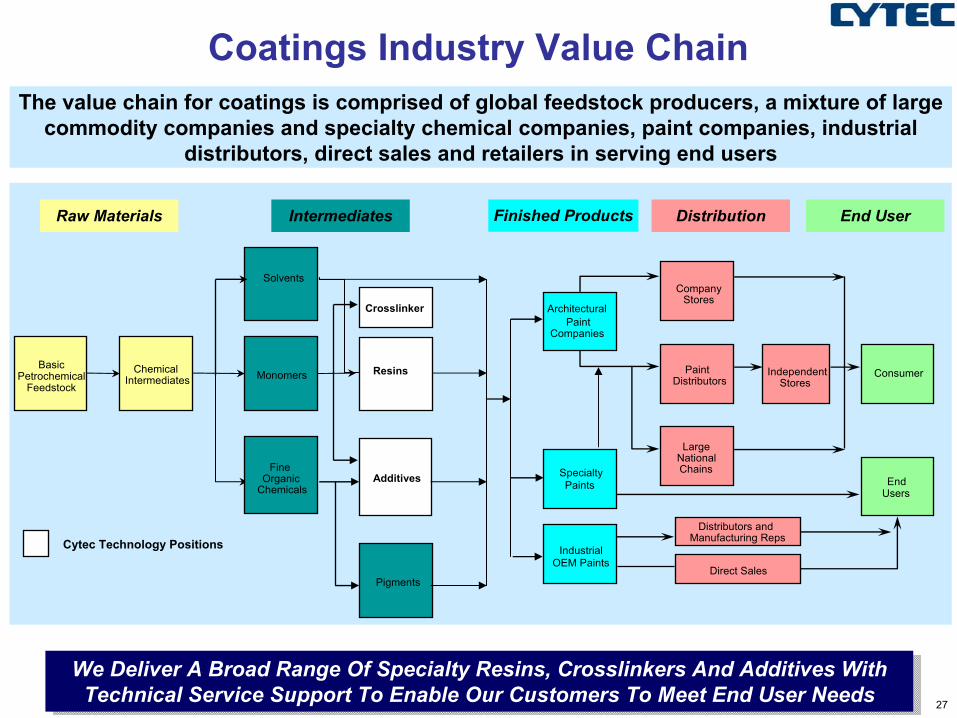
The value chain for coatings is comprised of global feedstock producers, a mixture of large commodity companies and specialty chemical companies, paint companies, industrial
distributors, direct sales and retailers in serving end users
BasicPetrochemical
Feedstock
ChemicalIntermediates Monomers
Solvents
FineOrganic
ChemicalsSpecialtyPaints
IndustrialOEM Paints
ArchitecturalPaint
Companies
CompanyStores
PaintDistributors
LargeNationalChains
EndUsers
Distributors andManufacturing Reps
Direct Sales
IndependentStores
Consumer
Raw Materials Intermediates Finished Products End UserDistribution
Coatings Industry Value Chain
Pigments
Resins
Additives
Resins
We Deliver A Broad Range Of Specialty Resins, Crosslinkers And Additives With Technical Service Support To Enable Our Customers To Meet End User Needs
We Deliver A Broad Range Of Specialty Resins, Crosslinkers And Additives With Technical Service Support To Enable Our Customers To Meet End User Needs
Crosslinker
Cytec Technology Positions
28
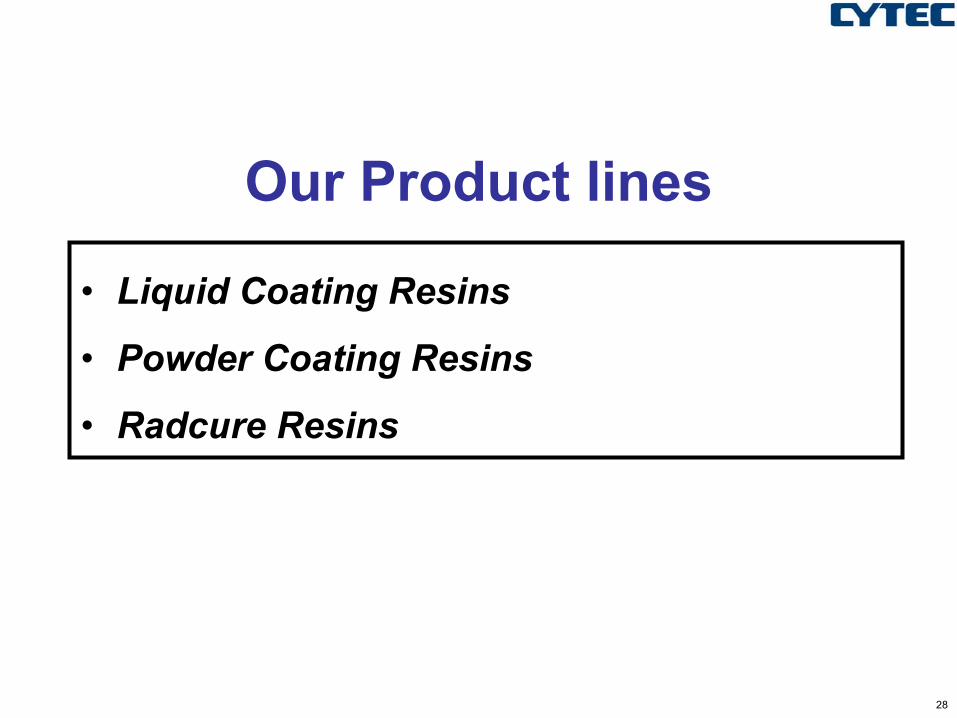
Our Product lines
• Liquid Coating Resins
• Powder Coating Resins
• Radcure Resins
29
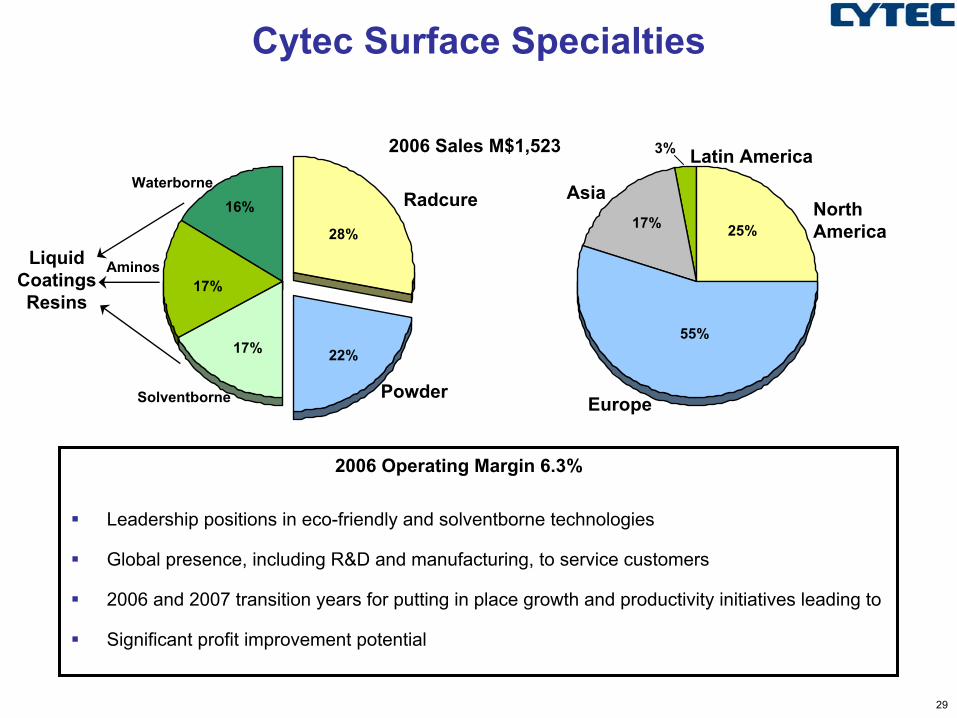
Cytec Surface Specialties
Waterborne
Powder
Radcure
Aminos
Solventborne
North America
Europe
Asia
Latin America2006 Sales M$1,523
2006 Operating Margin 6.3%
Leadership positions in eco-friendly and solventborne technologies
Global presence, including R&D and manufacturing, to service customers
2006 and 2007 transition years for putting in place growth and productivity initiatives leading to
Significant profit improvement potential
16%
22%
28%
3%
25%
55%
17%
17%
17%
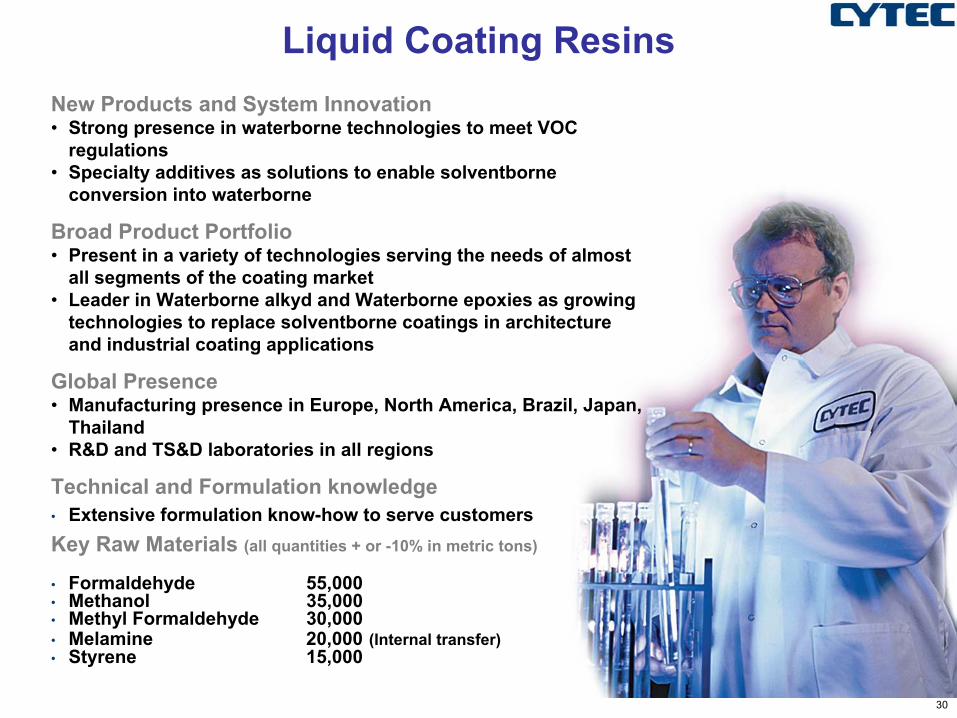
LiquidCoatingsResins
30
Liquid Coating ResinsNew Products and System Innovation • Strong presence in waterborne technologies to meet VOC
regulations• Specialty additives as solutions to enable solventborne
conversion into waterborne
Broad Product Portfolio• Present in a variety of technologies serving the needs of almost
all segments of the coating market• Leader in Waterborne alkyd and Waterborne epoxies as growing
technologies to replace solventborne coatings in architecture and industrial coating applications
Global Presence• Manufacturing presence in Europe, North America, Brazil, Japan,
Thailand• R&D and TS&D laboratories in all regions
Technical and Formulation knowledge• Extensive formulation know-how to serve customersKey Raw Materials (all quantities + or -10% in metric tons)
• Formaldehyde 55,000• Methanol 35,000• Methyl Formaldehyde 30,000• Melamine 20,000 (Internal transfer)• Styrene 15,000
31
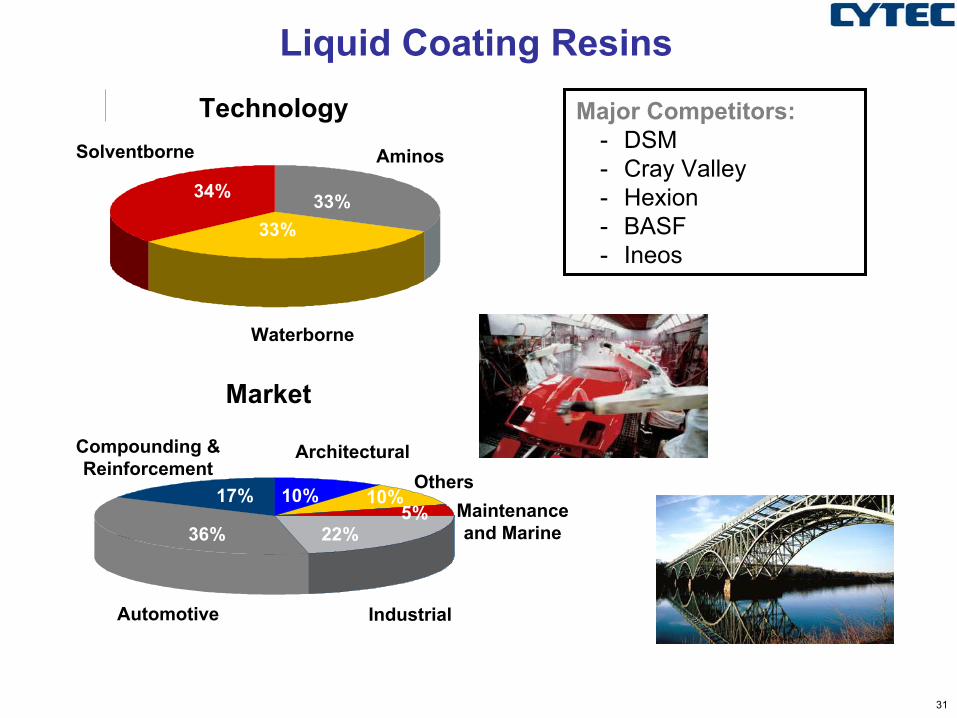
Liquid Coating Resins
Waterborne
Solventborne Aminos
33%33%
34%
Technology
Market
Automotive
ArchitecturalCompounding &Reinforcement
OthersMaintenanceand Marine
Industrial
10%17%
36%
10%5%
22%
Major Competitors:- DSM- Cray Valley- Hexion- BASF- Ineos
32
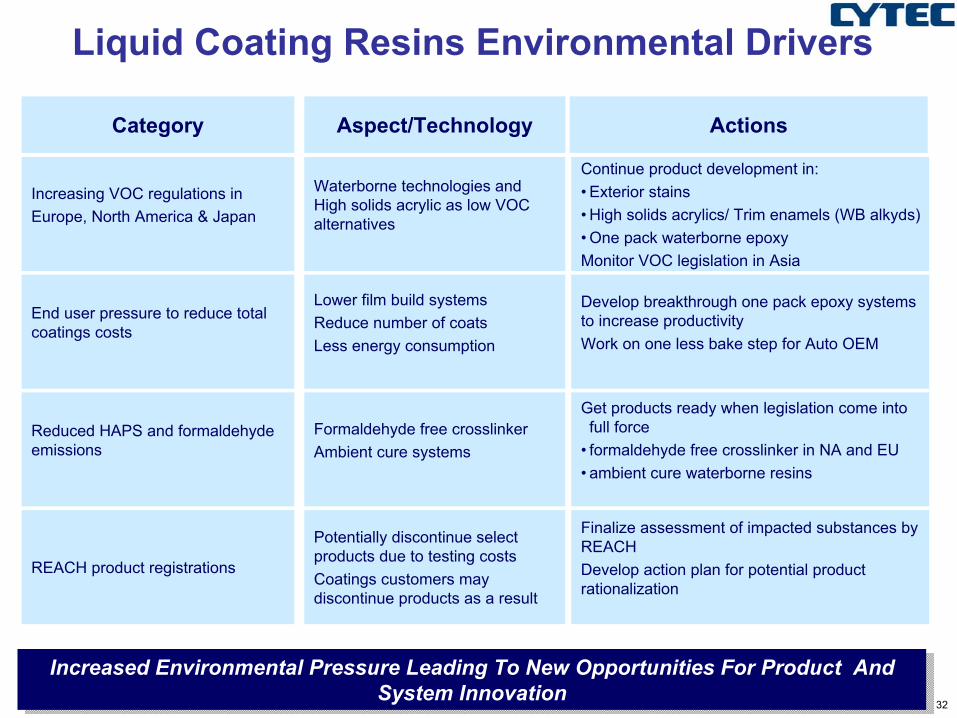
Liquid Coating Resins Environmental Drivers
Increasing VOC regulations in Europe, North America & Japan
Waterborne technologies and High solids acrylic as low VOC alternatives
Continue product development in:• Exterior stains• High solids acrylics/ Trim enamels (WB alkyds)• One pack waterborne epoxyMonitor VOC legislation in Asia
Category Aspect/Technology Actions
Increased Environmental Pressure Leading To New Opportunities For Product And System Innovation
Increased Environmental Pressure Leading To New Opportunities For Product And System Innovation
End user pressure to reduce total coatings costs
Lower film build systemsReduce number of coatsLess energy consumption
Develop breakthrough one pack epoxy systems to increase productivity Work on one less bake step for Auto OEM
Reduced HAPS and formaldehyde emissions
Formaldehyde free crosslinker Ambient cure systems
Get products ready when legislation come into full force
• formaldehyde free crosslinker in NA and EU• ambient cure waterborne resins
REACH product registrations
Potentially discontinue select products due to testing costsCoatings customers may discontinue products as a result
Finalize assessment of impacted substances by REACHDevelop action plan for potential product rationalization
33
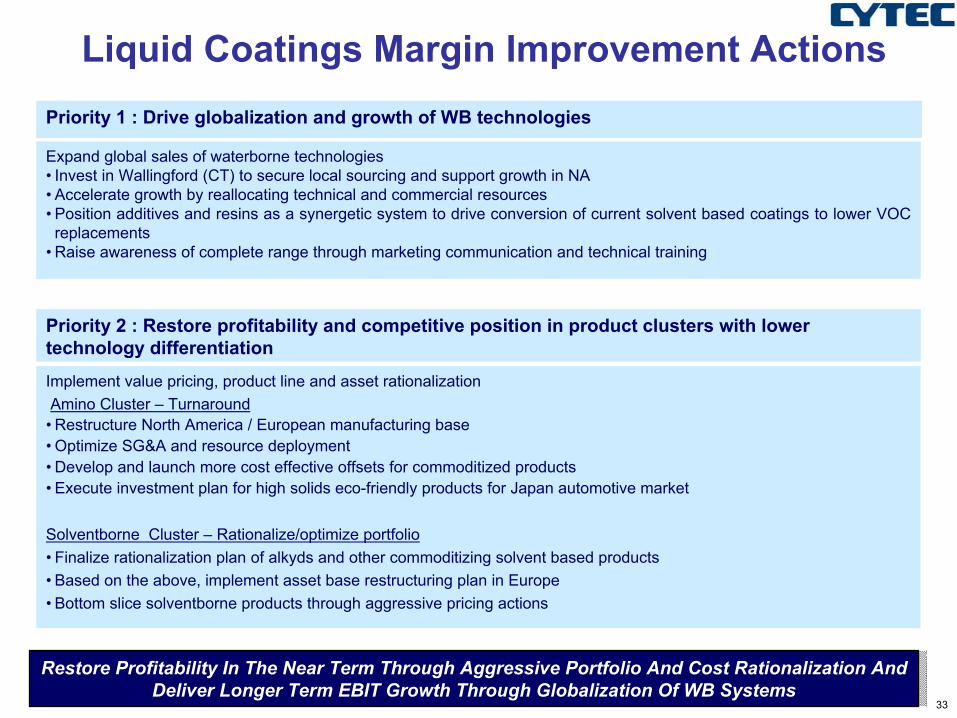
Priority 2 : Restore profitability and competitive position in product clusters with lower technology differentiation
Liquid Coatings Margin Improvement Actions
Restore Profitability In The Near Term Through Aggressive Portfolio And Cost Rationalization And Deliver Longer Term EBIT Growth Through Globalization Of WB Systems
Restore Profitability In The Near Term Through Aggressive Portfolio And Cost Rationalization And Deliver Longer Term EBIT Growth Through Globalization Of WB Systems
Implement value pricing, product line and asset rationalizationAmino Cluster – Turnaround
• Restructure North America / European manufacturing base• Optimize SG&A and resource deployment• Develop and launch more cost effective offsets for commoditized products• Execute investment plan for high solids eco-friendly products for Japan automotive market
Solventborne Cluster – Rationalize/optimize portfolio• Finalize rationalization plan of alkyds and other commoditizing solvent based products• Based on the above, implement asset base restructuring plan in Europe• Bottom slice solventborne products through aggressive pricing actions
Expand global sales of waterborne technologies • Invest in Wallingford (CT) to secure local sourcing and support growth in NA• Accelerate growth by reallocating technical and commercial resources• Position additives and resins as a synergetic system to drive conversion of current solvent based coatings to lower VOC replacements
• Raise awareness of complete range through marketing communication and technical training
Priority 1 : Drive globalization and growth of WB technologies
34
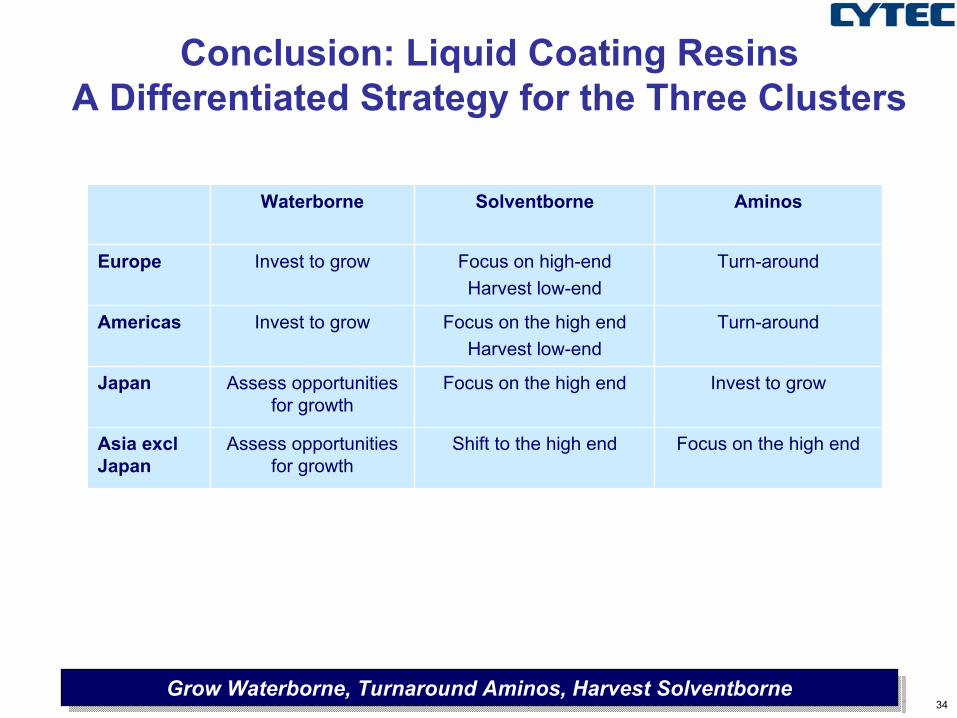
Conclusion: Liquid Coating Resins A Differentiated Strategy for the Three Clusters
Grow Waterborne, Turnaround Aminos, Harvest SolventborneGrow Waterborne, Turnaround Aminos, Harvest Solventborne
Invest to growFocus on the high endAssess opportunities for growth
Japan
Focus on the high endShift to the high endAssess opportunities for growth
Asia excl Japan
Turn-aroundFocus on the high endHarvest low-end
Invest to growAmericas
Turn-aroundFocus on high-endHarvest low-end
Invest to growEurope
AminosSolventborneWaterborne
35
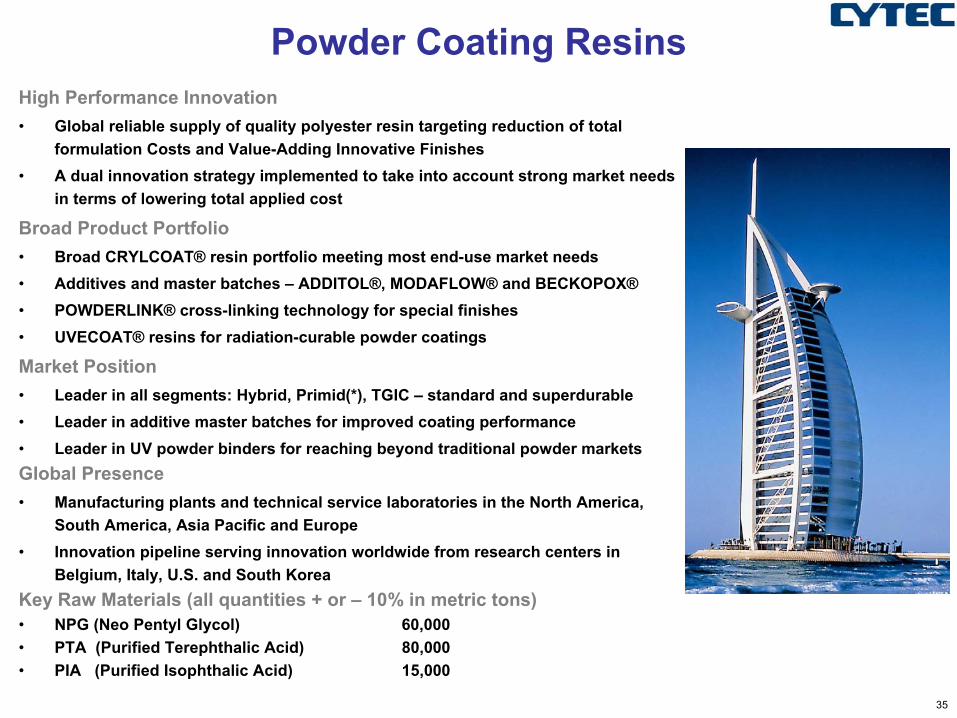
Powder Coating ResinsHigh Performance Innovation• Global reliable supply of quality polyester resin targeting reduction of total
formulation Costs and Value-Adding Innovative Finishes• A dual innovation strategy implemented to take into account strong market needs
in terms of lowering total applied cost
Broad Product Portfolio• Broad CRYLCOAT® resin portfolio meeting most end-use market needs• Additives and master batches – ADDITOL®, MODAFLOW® and BECKOPOX®• POWDERLINK® cross-linking technology for special finishes• UVECOAT® resins for radiation-curable powder coatings
Market Position• Leader in all segments: Hybrid, Primid(*), TGIC – standard and superdurable• Leader in additive master batches for improved coating performance• Leader in UV powder binders for reaching beyond traditional powder marketsGlobal Presence• Manufacturing plants and technical service laboratories in the North America,
South America, Asia Pacific and Europe• Innovation pipeline serving innovation worldwide from research centers in
Belgium, Italy, U.S. and South KoreaKey Raw Materials (all quantities + or – 10% in metric tons)• NPG (Neo Pentyl Glycol) 60,000• PTA (Purified Terephthalic Acid) 80,000• PIA (Purified Isophthalic Acid) 15,000
36
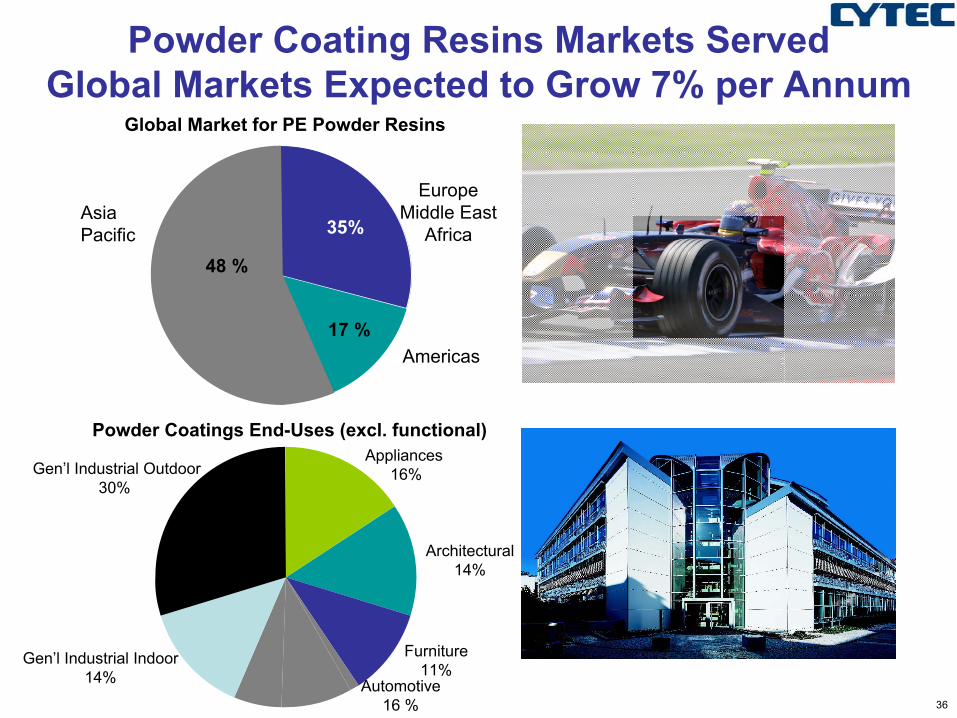
Powder Coatings End-Uses (excl. functional)
Architectural14%
Furniture11%
Automotive16 %
Gen’l Industrial Outdoor30%
Gen’l Industrial Indoor14%
Appliances16%
Global Market for PE Powder Resins
Powder Coating Resins Markets ServedGlobal Markets Expected to Grow 7% per Annum
EuropeMiddle East
Africa
Americas
Asia Pacific
17 %
35%
48 %
37
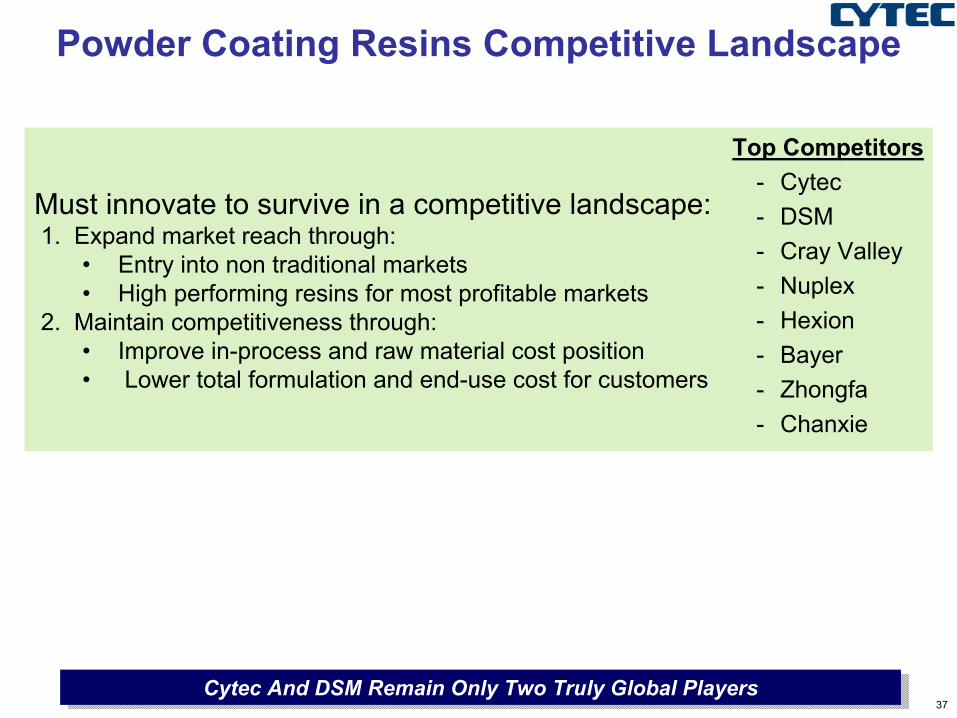
Must innovate to survive in a competitive landscape:1. Expand market reach through:
• Entry into non traditional markets• High performing resins for most profitable markets
2. Maintain competitiveness through:• Improve in-process and raw material cost position• Lower total formulation and end-use cost for customers
Powder Coating Resins Competitive Landscape
Cytec And DSM Remain Only Two Truly Global PlayersCytec And DSM Remain Only Two Truly Global Players
Top Competitors- Cytec- DSM- Cray Valley- Nuplex- Hexion- Bayer- Zhongfa- Chanxie
38
Powder Coating Resins Environmental Drivers
Strengthening VOC regulationsfocus Europe/Americas first
Powder as a recognized low VOC option
• Include low VOC in value proposition in segment where powder penetration is low• Review opportunities to promote powder as VOC-free surface finishing option• Priority to Europe and Americas but follow up needed for Asia at later time
Category Aspect/Technology Actions
Polyester Powder – Intrinsically Compliant To Most Stringent Enviro RegulationsPolyester Powder – Intrinsically Compliant To Most Stringent Enviro Regulations
Increasing energy costsLow bake powderUV Powder
Regulations related to health hazard and toxicology concerns
• Reinforce low energy usage in UV powder value proposition• Promote and expand use of low bake technology based on energy efficiency• Assess energy usage of powder vis-à-vis other coating solutions
TGICBisphenol A
• Continue to promote resins for TGIC-free formulations in southern Europe• Develop optimized systems compliant with food contact regulations• Replace liquid and powder systems using epoxy with full polyester solutions
39
Conclusion: Powder Coating Resins
Margin Improvement
Operational Excellence
Product mix optimization and dual innovation strategy focusing on both improving cost position and expanding the
reach of powder into more profitable segments
Continuous capacity stretch to support demand at next-to-zero cost, through lean manufacturing implementation and
process innovation
Global Leadership Position
Maintain global leadership position, growing business and promoting profitable innovation in powder coating with global
key accounts and industry winners
Good Top-Line And Earnings Growth But Margins Held Down By Low End CompetitorsGood Top-Line And Earnings Growth But Margins Held Down By Low End Competitors
40
RADCURE™ Energy Curable Solutions
Innovative Technology• 35+ years experience in radiation curing technology• Pioneer and worldwide leader in UV & EB energy curable Oligomers
and Monomers
Broad Product Portfolio• Portfolio of 500+ efficient and environmentally-friendly coating resins,
additives and servicesEconomics• High production throughput (fast cure rates)• Low energy requirements
Total Solutions Provider• World class technical service and application support expertise
Eco-Friendly• Zero or low solvent emissions
Performance• High gloss/ultra smooth surfaces• Ability to coat heat sensitive substrates
Key Raw Materials (all quantities + or – 10% in metric tons)• Acrylic acid 40,000• Diglycidylether BPA 10,000• TPG (tri propylene glycol) 10,500
41
RADCURE Markets Served
Graphic Arts
Packaging Publishing
Commercial Industrial
Radiation Curing Is An Attractive Solution For Many ApplicationsRadiation Curing Is An Attractive Solution For Many Applications
Industrial Coatings
Wood
Plastics
Opto-Electronics
Metal
Glass Lamination
Electronics
5% Inks
24%
Plastics & Metal
29%
Wood & Paper
19%
OPV
23%
Monomers
33%
Formulations &Additives
10%
Oligomers
57%

42
WOOD
PUTTY
PRIMER
SEALER
TOP COAT
Wood – Parquet Flooring
TFT Glass substrate
Black matrix
Polarizer
Electrode
Liquid crystal
Protective film
ElectrodeAlignment film
Sealant
Anisotropicconductorfilm
TAB
Driver LSI
PCB
SpacerLight diffuser Prism sheet Waveguideplate
Edge light
Reflector
PolarizerColor filter
Electronics (flat panel displays)
Cytec Is A Global Player With Diversified Portfolio In All Major UV ApplicationsCytec Is A Global Player With Diversified Portfolio In All Major UV Applications
UV/EB Curing Resins & Additives Example of Applications
Red=Target Applications
RadcureApplication
43
Radcure Resins Competitive Landscape
Source: Cytec estimate
Leadership Position Within A Fragmented Global Competitive EnvironmentLeadership Position Within A Fragmented Global Competitive Environment
Key Focus Going Forward:
• Technical differentiation (breakthrough
applications, cost effective production)
• Progressive diversification (non-traditional
applications)
• Flexibility and speed critical
Key Competitors:
• Sartomer
• BASF
• Eternal
• AGI
• Cognis
• Bayer
•Toa Gosei
• Regional Players
44
Category
1. Solvent reduction in the Inks and OPV industry
2. VOC/ CO2 reduction for the coil industry
3. VOC/ CO2 reduction for industrial spray applications
4. Heavy metal reduction in electronics
5. Highest energy cost in history
6. Oil based raw materials getting scarce
7. Recycling of coated finished goods
Aspect
Radcure inks for indirect food contact and approval of Radcure systems for direct food contact
Radcure systems for coil
Radiation curable spray coatings for wood, plastics & automotive
Radiation curable alternatives for chromium based technology
Radiation curing is the most energy efficient way to cure inks and coatings
Radiation curable products based on renewable resources
Radiation curable products compatible with the recycling process
Actions
Develop/ market low extractable, low odorrange of products & Food contact Legislation initiative in US
Develop / market UV primer for coil to replace solvent system
Develop / market low viscosity systems for spray applications ( WB UV )
Develop / market UV curable black matrix inks for LCD’s production
Increase emphasis on energy savings in print advertising and push faster curing products
Develop resins based on renewable raw materials and market these in existing and new application areas
Include recycling capability developments for paper & board, plastics for packaging, automotive
Radcure Resins Environmental Drivers & Market Opportunities
Key Drivers; Cost/Productivity – Environmental Legislation – PerformanceKey Drivers; Cost/Productivity – Environmental Legislation – Performance
45
Conclusion: Radcure Resins
Platform BusinessApproach
Invest to SustainGlobal Leadership
Dedicated teams to drive global focus on major growth initiatives. Key platforms include Electronics and Water Borne technologies
Accelerating resource loading in Asia high growth region.Capital expenditures for new capacity/productivity. Acquisitions to fill key technology / market gaps including targets in fast growing electronics market.
Dual Strategy
Intensify efforts to identify and develop breakthroughapplications in and outside the current coatings and ink market as well as drive productivity initiatives to remain competitive in core resin manufacturing
Good Top-Line And Earnings Growth Through Innovation And ProductivityGood Top-Line And Earnings Growth Through Innovation And Productivity
46
Cytec Surface SpecialtiesEarnings Growth
Investment in eco-friendly products and high growth markets
– Wallingford, CT. waterborne resins plant; start-up Q2 ‘08
– China Radcure oligomers plant; start-up Q2 ‘08
– Aminos capacity expansion in Japan mid-2009
Increased productivity from innovation
– Revitalized and balanced product development pipelines – striking the
right mix of “Breakthrough and Incremental” projects
– Disciplined project execution linking R&D, Marketing and Manufacturing
using Cytec Innovation Management System (CIMS) process
Driving Innovation Across Entire OrganizationDriving Innovation Across Entire Organization
47
Product rationalization / Asset restructuring• Product rationalization
– Additional rationalization ongoing of solventborne product lines coupled with asset redeployment to waterborne products (primarily Europe)
– Maximizing asset utilization by bottom slicing lower margin business to optimize mix
• Asset restructuring– Dijon plant shutdown / product transfers complete; now in “clean and
secure” phase
– Additional restructuring investigations ongoing for Liquid Coating Resins
Expect Completion Of Study For Further Restructuring By Q3, 2007Expect Completion Of Study For Further Restructuring By Q3, 2007
Cytec Surface SpecialtiesEarnings Growth
48
Cytec Surface SpecialtiesEarnings Growth
Operational Excellence to Improve Margins• R&D supporting Manufacturing to improve basic process chemistry
and qualify alternate / lower cost raw materials– Savings beginning in 2007
• Lean manufacturing being introduced at all major sites, reducingcosts and adding capacity at low / no capital
– Powders; gained 20% capacity globally, 10% headcount reduction at 2nd largest site
– LCR; Expect 15% capacity gain at largest plant to support LCR growth, and allow other site rationalization.
• Expanded / Integrated Six Sigma programs– In-house training of Black-belts across global manufacturing base
– Six Sigma related yield improvements programs across multiple product lines delivered > $2 million per year in savings in 2006; integrated into other major efforts as a key contributor
Lean Program Delivering Real Value in Lower Costs / Extra CapacityLean Program Delivering Real Value in Lower Costs / Extra Capacity
49
Cytec Surface SpecialtiesEarnings Growth
Operational Excellence continued• Best practice sharing leveraging global “Product Line Cluster” manufacturing
organization– Radcure; sharing monomers recovery work at San Fernando Plant (savings of $1 million) to all
sites will result in > $4-5 million per year savings (Target date for completion: year end 2008)
– LCR; European sites absorbed high value products from Dijon shutdown with virtually no added capital or operating costs
• Dedicated energy / waste reduction teams focused on lowering energy usage and waste generation costs
– 2007 Targets:• Energy savings of >$2 million/year through engineering solutions
• Waste reduction savings of $1.5 – 2.0 million
• On track with implementation of Global ERP system– Real-time access to global data (faster decision making, lower inventory, improved service
levels)
– Increased productivity (and lower maintenance costs)
– Slated for completion by end of 2008
Multi-Pronged Approach Leading to Earnings GrowthMulti-Pronged Approach Leading to Earnings Growth
50
Cytec Surface SpecialtiesPost 2007
• Well aligned with key market trends:– Move to environmentally friendly products
– Presence in high growth Asia markets
• Target for top line growth of 5% per annum
• Target for average earnings growth of 15% per annum which includes benefits of actions to get to 10% operating margin
Innovation And Relentless Focus On Costs Will Drive Improvement In Surface SpecialtiesInnovation And Relentless Focus On Costs Will Drive Improvement In Surface Specialties
51
Presented By: Steve Speak
President, Cytec Engineered Materials
52
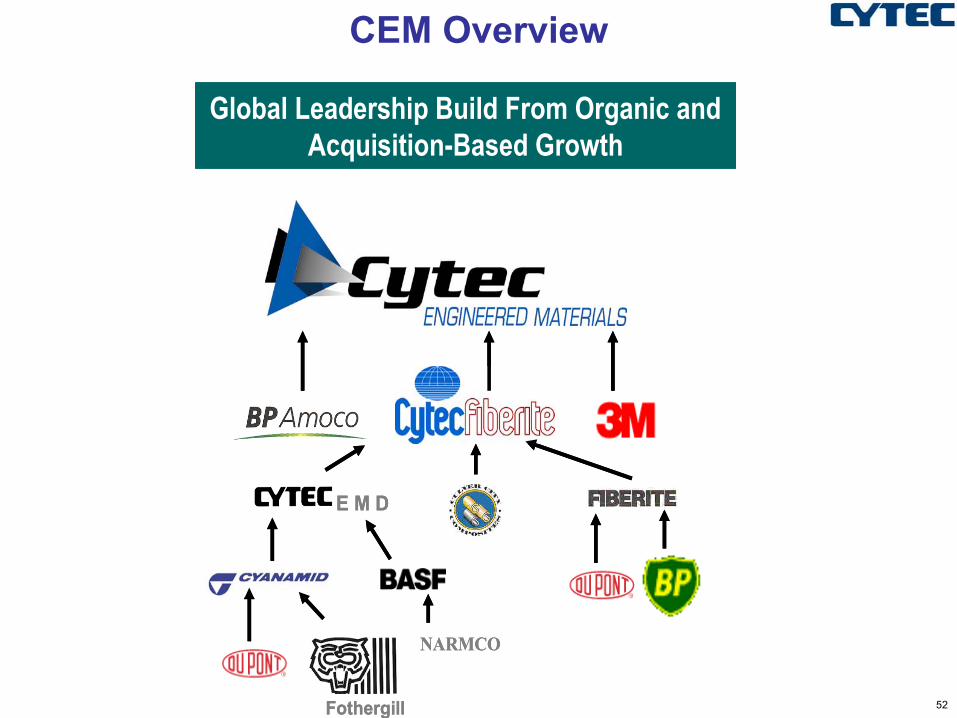
CEM Overview
Global Leadership Build From Organic and Acquisition-Based Growth
E M D
Fothergill
NARMCO
Global Leadership Build From Organic and Acquisition-Based Growth
E M D
Fothergill
NARMCO
53
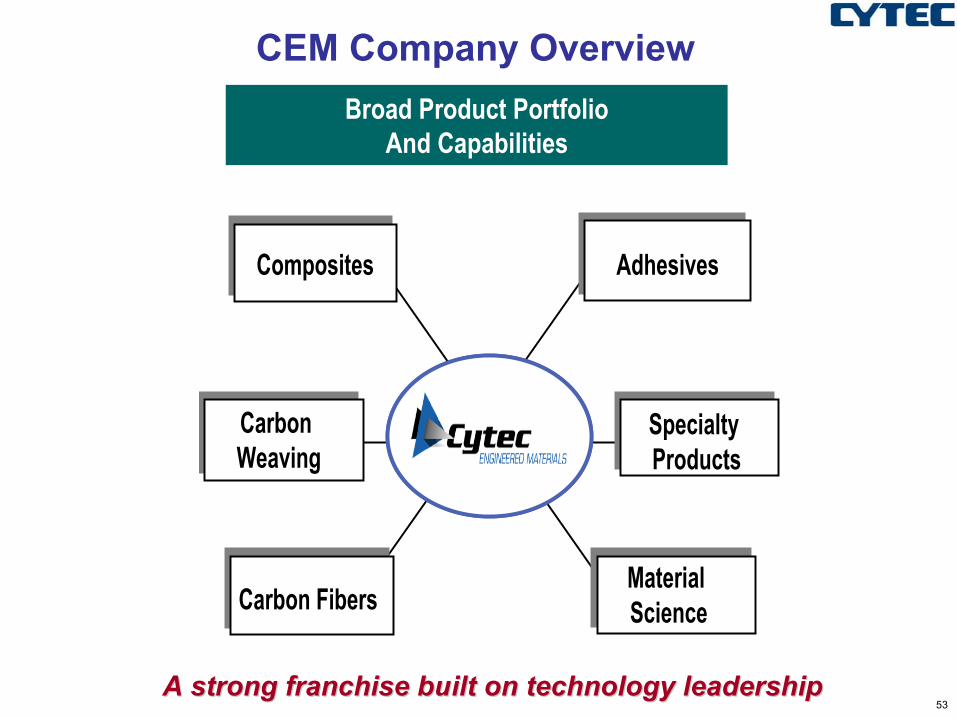
CEM Company OverviewBroad Product Portfolio
And Capabilities
Composites Adhesives
Carbon Fibers
Carbon Weaving
Specialty Products
Material Science
A strong franchise built on technology leadershipA strong franchise built on technology leadership
54
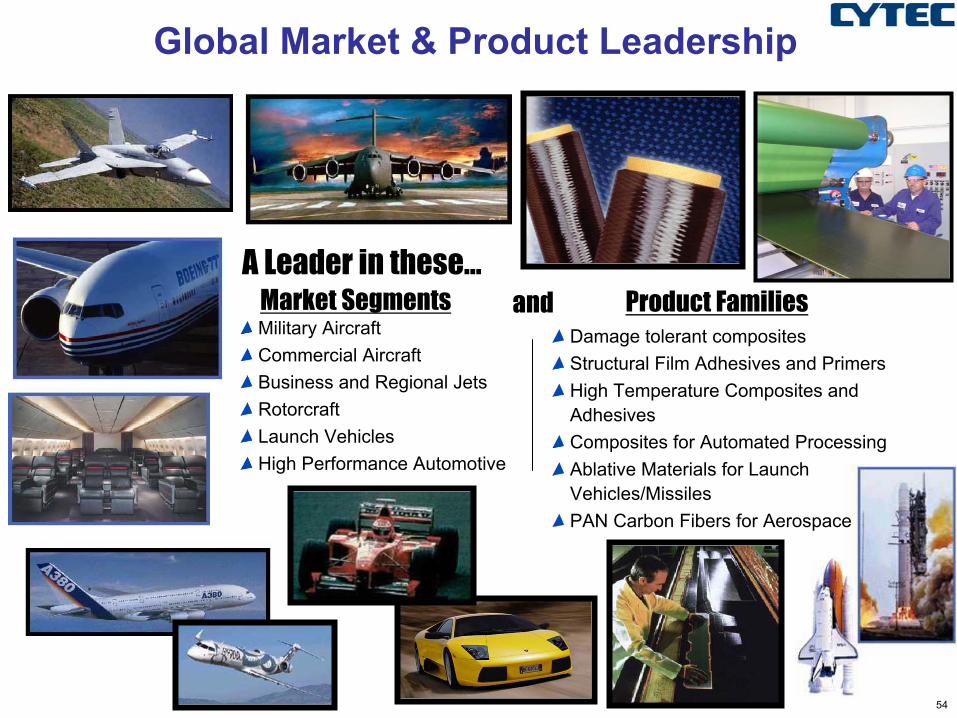
Global Market & Product Leadership
Market Segments Product Familiesand
A Leader in these…
Military AircraftCommercial Aircraft Business and Regional JetsRotorcraftLaunch VehiclesHigh Performance Automotive
Damage tolerant composites Structural Film Adhesives and PrimersHigh Temperature Composites and AdhesivesComposites for Automated ProcessingAblative Materials for Launch Vehicles/MissilesPAN Carbon Fibers for Aerospace
55
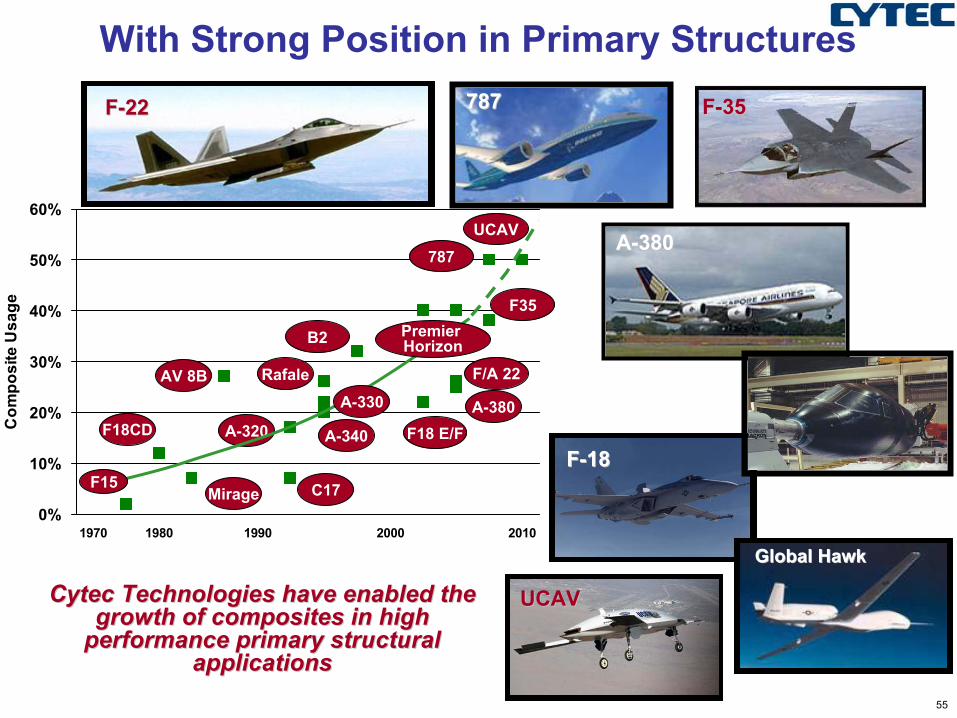
With Strong Position in Primary StructuresFF--2222
Cytec Technologies have enabled the Cytec Technologies have enabled the growth of composites in high growth of composites in high
performance primary structural performance primary structural applicationsapplications
PremierPremier
AA--380380
FF--3535
0%
10%
20%
30%
40%
50%
60%
1970 1980 1990 2000 2010
Com
posi
te U
sage
Mirage
F18CD
C17
AV 8B Rafale
F18 E/F
UCAV
F35
F/A 22
B2
A-380A-320 A-340
A-330
F15
787
Premier Horizon
787787
FF--1818
UCAVUCAV
Global HawkGlobal Hawk
56
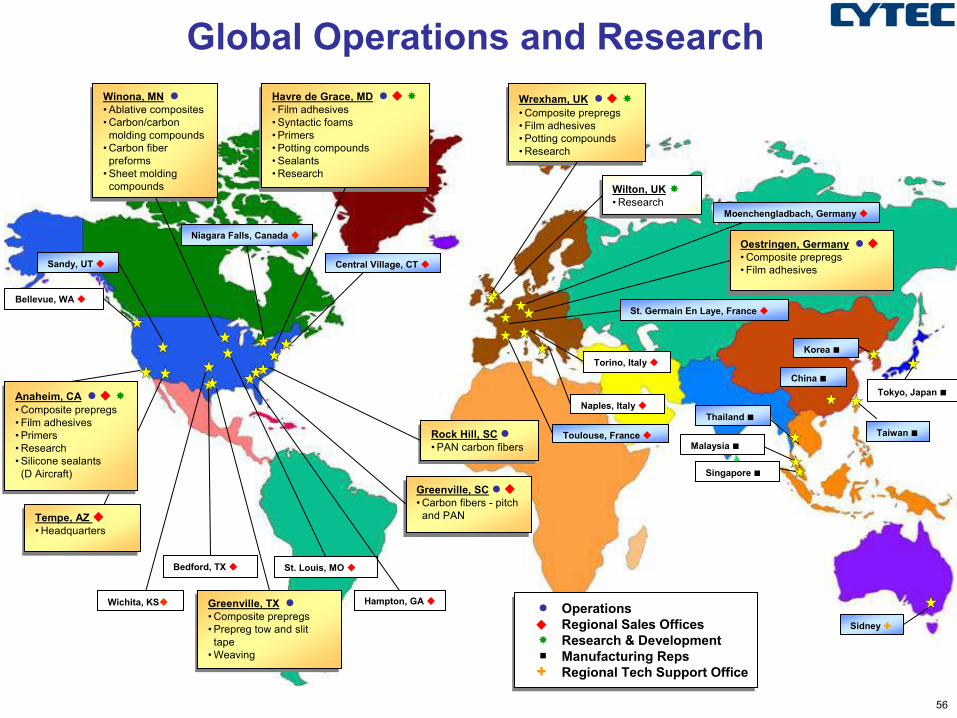
Global Operations and Research
Oestringen, Germany• Composite prepregs• Film adhesives
Oestringen, Germany• Composite prepregs• Film adhesives
Havre de Grace, MD• Film adhesives• Syntactic foams• Primers• Potting compounds• Sealants• Research
Havre de Grace, MD• Film adhesives• Syntactic foams• Primers• Potting compounds• Sealants• Research
Rock Hill, SC• PAN carbon fibersRock Hill, SC• PAN carbon fibers
Bellevue, WA
Greenville, SC• Carbon fibers - pitch and PAN
Greenville, SC• Carbon fibers - pitch and PAN
Hampton, GA
Sandy, UT
Winona, MN• Ablative composites• Carbon/carbon molding compounds
• Carbon fiber preforms
• Sheet molding compounds
Winona, MN• Ablative composites• Carbon/carbon molding compounds
• Carbon fiber preforms
• Sheet molding compounds
Greenville, TX• Composite prepregs• Prepreg tow and slit tape
• Weaving
Greenville, TX• Composite prepregs• Prepreg tow and slit tape
• Weaving
St. Louis, MO
Wrexham, UK• Composite prepregs • Film adhesives • Potting compounds• Research
Wrexham, UK• Composite prepregs • Film adhesives • Potting compounds• Research
Wilton, UK• ResearchWilton, UK• Research
Naples, Italy
Toulouse, France
Niagara Falls, Canada
■
OperationsRegional Sales OfficesResearch & DevelopmentManufacturing RepsRegional Tech Support Office
Wichita, KS
Tempe, AZ • HeadquartersTempe, AZ • Headquarters
Torino, Italy
St. Germain En Laye, France
Central Village, CT
Bedford, TX
Moenchengladbach, Germany
China ■
Singapore ■
Thailand ■Anaheim, CA• Composite prepregs• Film adhesives • Primers• Research• Silicone sealants (D Aircraft)
Anaheim, CA• Composite prepregs• Film adhesives • Primers• Research• Silicone sealants (D Aircraft)
Malaysia ■
Korea ■
Taiwan ■
Tokyo, Japan ■
Sidney
57
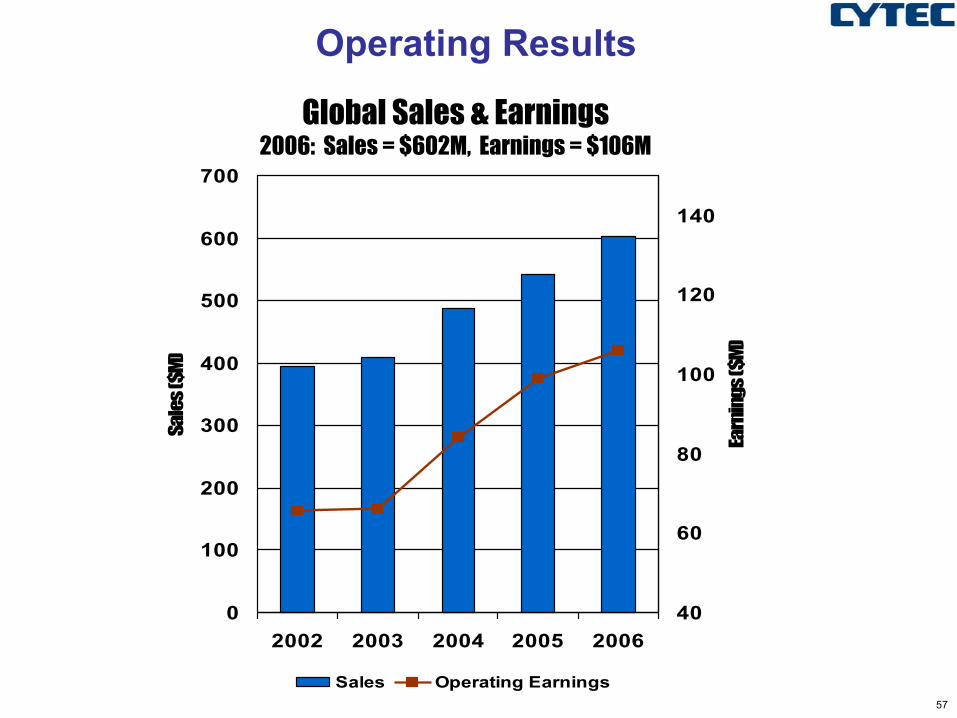
Operating Results
0
100
200
300
400
500
600
700
2002 2003 2004 2005 2006
Sale
s ($
M)
40
60
80
100
120
140
Earn
ings
($M
)
Sales Operating Earnings
Global Sales & Earnings2006: Sales = $602M, Earnings = $106M
58
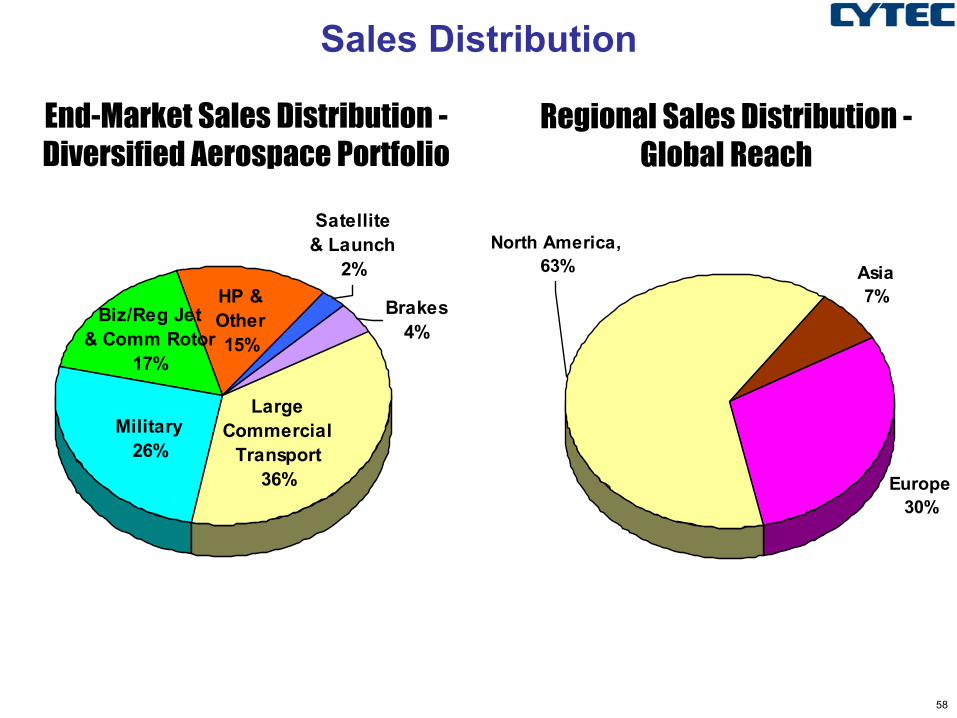
Sales Distribution
End-Market Sales Distribution -Diversified Aerospace Portfolio
Regional Sales Distribution -Global Reach
North America,63%
Europe30%
Asia7%
Satellite & Launch
2%
Brakes4%
HP & Other15%
Biz/Reg Jet & Comm Rotor
17%
Military 26%
Large Commercial
Transport36%
59
What is a Composite?
• Combination of a reinforcement material and a matrix
• Early examples– Mud and straw– Fiberglass and Resins
• Fibers provide strength and stiffness
• Matrix protects fiber, transfers loads between fibers and imparts other value-added attributes
• “Advanced” composites - Reinforcement = carbon fiber. Typically 65% Fiber / 35% Resin
60
“Prepreg” Manufacturing
Release paper
Resin Applicator
Resin Film Roll
HOT MELT RESIN
Continuous fiber
Or
Woven fabrics
Resin Film
Heat & pressureResin Film
Cooling of
Material
“Prepreg” Fabric or Tape
Resin Film
Heat & pressureResin Film
Cooling of
Material
“Prepreg” Fabric or Tape
61
If the Composites Industry was a Person…What Would it Look Like?
62
Still early in the growth and adoption cycle…but
mature and proved in terms of performance,
reliability and value
Carbon Composites
Aluminum Steel
LowTechnology
Maturity
HighTechnology
Maturity
Technology Learning CurveTechnology Learning Curve
If the Composites Industry was a Person…What Would it Look Like?
63
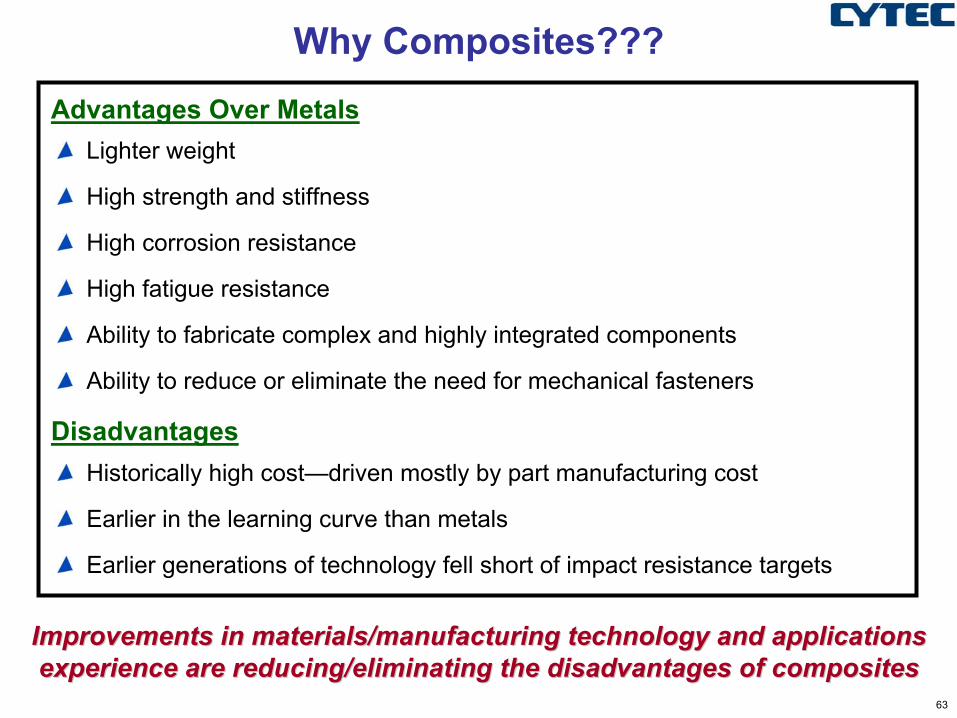
Why Composites???
Advantages Over Metals
Improvements in materials/manufacturing technology and applicatiImprovements in materials/manufacturing technology and applications ons experience are reducing/eliminating the disadvantages of composiexperience are reducing/eliminating the disadvantages of compositestes
Lighter weight
High strength and stiffness
High corrosion resistance
High fatigue resistance
Ability to fabricate complex and highly integrated components
Ability to reduce or eliminate the need for mechanical fasteners
Historically high cost—driven mostly by part manufacturing cost
Earlier in the learning curve than metals
Earlier generations of technology fell short of impact resistance targets
Disadvantages
64
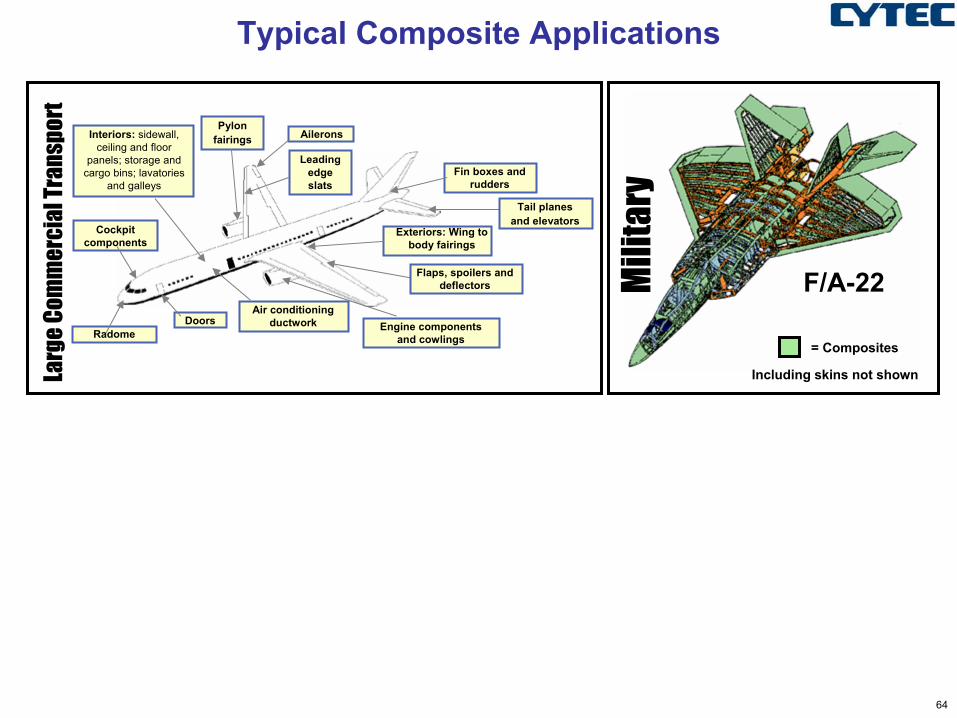
Typical Composite Applications
F/A-22
= Composites
Including skins not shown
Mili
tary
Larg
e Co
mm
erci
al T
rans
port
Cockpit components
Doors
Interiors: sidewall, ceiling and floor
panels; storage and cargo bins; lavatories
and galleys
Radome
Air conditioning ductwork
Pylonfairings
Leadingedgeslats
Ailerons
Fin boxes and rudders
Engine components and cowlings
Exteriors: Wing to body fairings
Flaps, spoilers and deflectors
Tail planesand elevators
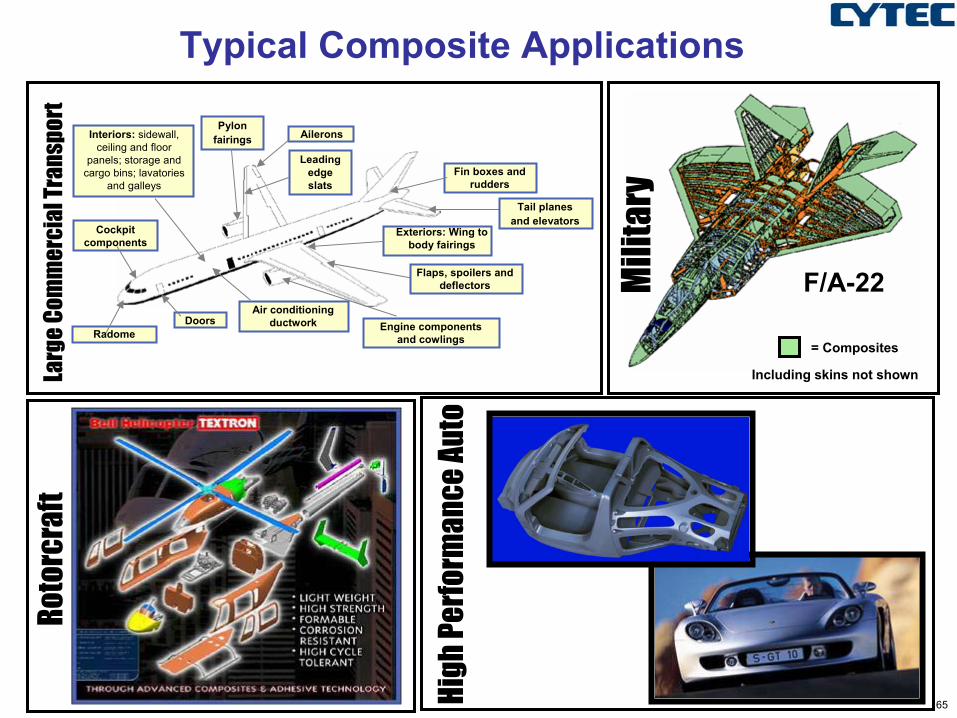
65
Typical Composite Applications
F/A-22
= Composites
Including skins not shown
Roto
rcra
ft
Mili
tary
Larg
e Co
mm
erci
al T
rans
port
High
Per
form
ance
Aut
o
Cockpit components
Doors
Interiors: sidewall, ceiling and floor
panels; storage and cargo bins; lavatories
and galleys
Radome
Air conditioning ductwork
Pylonfairings
Leadingedgeslats
Ailerons
Fin boxes and rudders
Engine components and cowlings
Exteriors: Wing to body fairings
Flaps, spoilers and deflectors
Tail planesand elevators
66
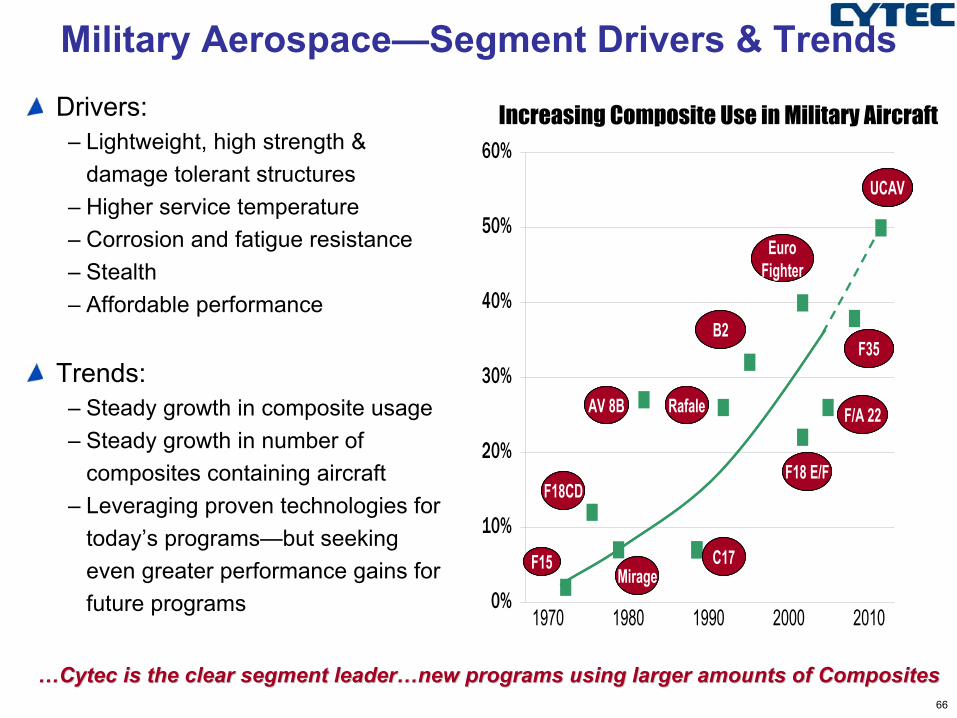
Military Aerospace—Segment Drivers & TrendsDrivers: – Lightweight, high strength &
damage tolerant structures– Higher service temperature – Corrosion and fatigue resistance– Stealth– Affordable performance
Trends: – Steady growth in composite usage– Steady growth in number of
composites containing aircraft – Leveraging proven technologies for
today’s programs—but seeking even greater performance gains for future programs
……Cytec is the clear segment leaderCytec is the clear segment leader……new programs using larger amounts of Compositesnew programs using larger amounts of Composites
0%
10%
20%
30%
40%
50%
60%
MirageF15
F18CD
C17
AV 8B Rafale
F18 E/F
UCAV
EuroFighter
F35
F/A 22
B2
1970 1980 1990 2000 20100%
10%
20%
30%
40%
50%
60%
MirageF15
F18CD
C17
AV 8B Rafale
F18 E/F
UCAV
EuroFighter
F35
F/A 22
B2
0%
10%
20%
30%
40%
50%
60%
MirageF15
F18CD
C17
AV 8B Rafale
F18 E/F
UCAV
EuroFighter
F35
F/A 22
B2
MirageF15
F18CD
C17
AV 8B Rafale
F18 E/F
UCAV
EuroFighter
F35
F/A 22
B2
MirageF15
F18CD
C17
AV 8B Rafale
F18 E/F
UCAV
EuroFighter
F35
F/A 22
B2
1970 1980 1990 2000 2010
Increasing Composite Use in Military Aircraft
67
Commercial Aerospace—Segment Drivers & TrendsDrivers:
– Revenue passenger mile (RPM) growth
– Aircraft obsolescence and replacement
– Customer preferences/improved performance
– Fuel cost escalation
Trends: – Increasing Large Commercial
Transport (LCT) and Business Jet production rates
– Strong order backlog, continuing to build
– Strong secular trend towards adoption of composites to achieve higher aircraft performance value
Production RatesProduction Rates
Orders and BacklogOrders and BacklogBacklogOrders
200
400
600
800
1000
1200
2002 2003 2004 2005 2006 2007 2008 2009
Total CEM Proj Boeing/CEM Proj Airbus/CEM Proj
0250500750
100012501500175020002250
1998 1999 2000 2001 2002 2003 2004 2005 2006-500
1000
2500
4000
5500
Boeing Orders Airbus Orders Backlog
68
% composite by weight of aircraft% composite by weight of aircraft
Step Change In Composite Usage%
Com
posi
te
1970 1975 1980 1985 1990 1995 2000 2005 2010 2015
747
757/767A300-600
777A330/340
747-400
A310
High50%
% C
ompo
site
1970 1975 1980 1985 1990 1995 2000 2005 2010 2015
747747
757/767757/767A300-600A300-600
777777A330/340A330/340
747-400747-400
A310A310Low 10%
FSA
69
……increasing production rates for current generation aircraft and increasing production rates for current generation aircraft and the secular the secular trend toward increased composites provide long growth potential!trend toward increased composites provide long growth potential!
% composite by weight of aircraft% composite by weight of aircraft
Step Change In Composite Usage%
Com
posi
te
1970 1975 1980 1985 1990 1995 2000 2005 2010 2015
747
757/767A300-600
777A330/340
747-400
A310
High50%
% C
ompo
site
1970 1975 1980 1985 1990 1995 2000 2005 2010 2015
747747
757/767757/767A300-600A300-600
777777A330/340A330/340
747-400747-400
A310A310Low 10%
A380
Future Single Aisle
787
A380A380
A350
Future Single Aisle
FSA
70
The Challenges For Composite Suppliers
• Affordable Performance
• Developing the Supply Chain
Technology Advancement
Expanding Supply To Meet Demand
Matching Geographic Point of Supply with Customer Demand
=
=
=
71
Technology Mission: First In Technology Solutions
First and foremost a technology company
Strongest competitive discriminator
Primary platform for creating value for our customers
Rich heritage and technology portfolio developed over 65 years of investment
Customer focus and Operations Excellence critical to delivering technology value
72
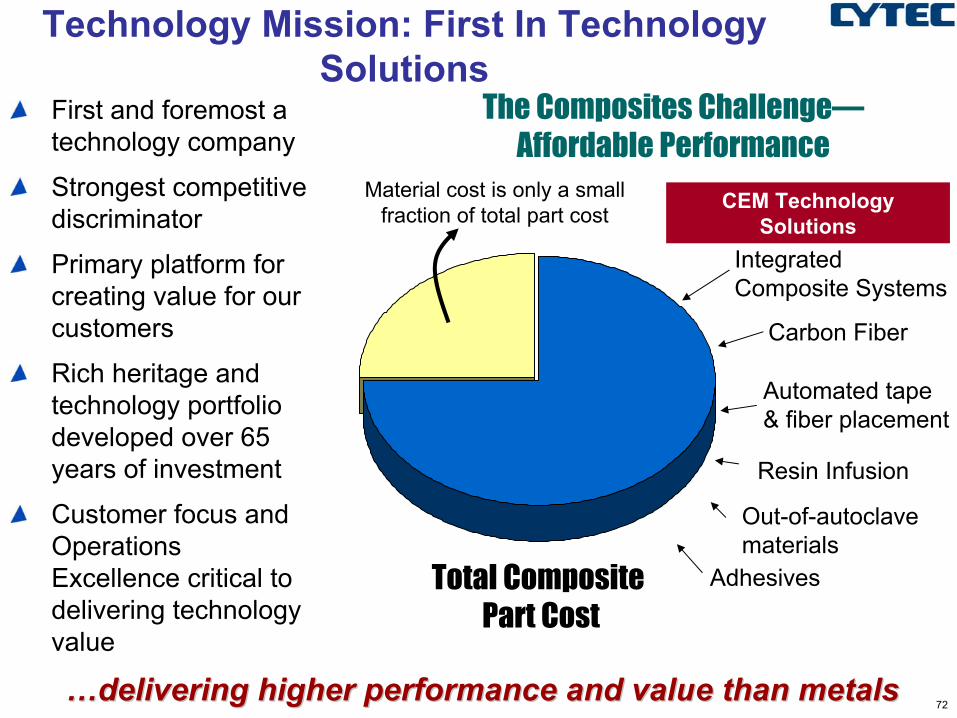
Technology Mission: First In Technology Solutions
First and foremost a technology company
Strongest competitive discriminator
Primary platform for creating value for our customers
Rich heritage and technology portfolio developed over 65 years of investment
Customer focus and Operations Excellence critical to delivering technology value
The Composites Challenge—Affordable Performance
Material cost is only a small fraction of total part cost
Total Composite Part Cost
CEM Technology Solutions
Out-of-autoclave materials
Integrated Composite Systems
Automated tape & fiber placement
Resin Infusion
Adhesives
……delivering higher performance and value than metalsdelivering higher performance and value than metals
Carbon Fiber
73
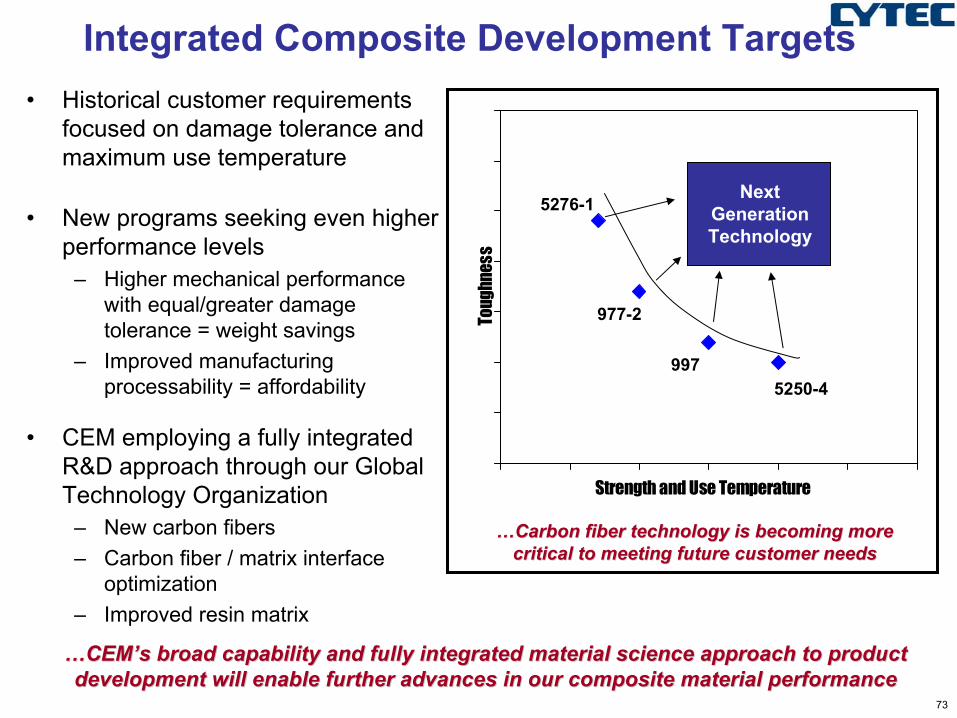
Integrated Composite Development Targets• Historical customer requirements
focused on damage tolerance and maximum use temperature
• New programs seeking even higher performance levels
– Higher mechanical performance with equal/greater damage tolerance = weight savings
– Improved manufacturing processability = affordability
• CEM employing a fully integrated R&D approach through our Global Technology Organization
– New carbon fibers– Carbon fiber / matrix interface
optimization– Improved resin matrix
……CEMCEM’’s broad capability and fully integrated material science approacs broad capability and fully integrated material science approach to product h to product development will enable further advances in our composite materidevelopment will enable further advances in our composite material performance al performance
……Carbon fiber technology is becoming more Carbon fiber technology is becoming more critical to meeting future customer needscritical to meeting future customer needs
Strength and Use TemperatureTo
ughn
ess
5276-1
5250-4997
977-2
NextGenerationTechnology
74
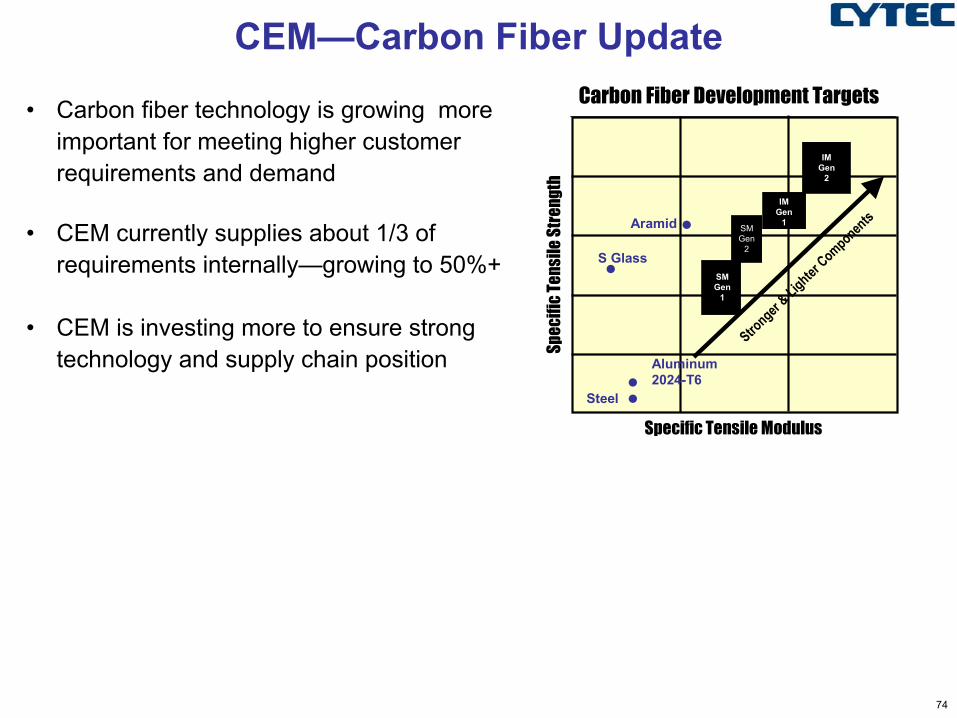
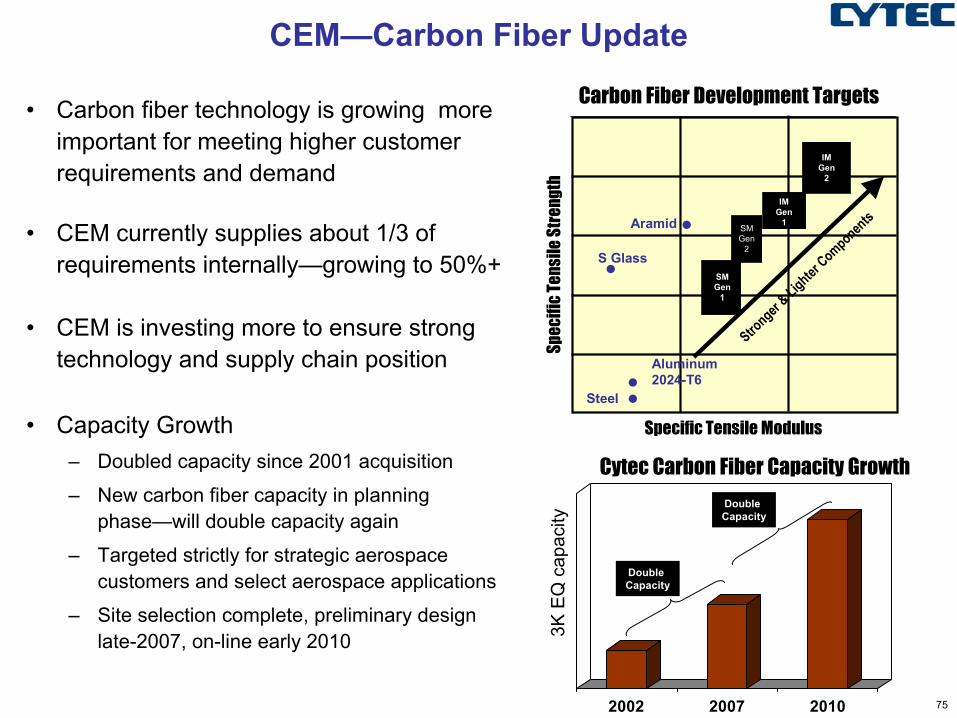
CEM—Carbon Fiber Update
• Carbon fiber technology is growing more important for meeting higher customer requirements and demand
• CEM currently supplies about 1/3 of requirements internally—growing to 50%+
• CEM is investing more to ensure strong technology and supply chain position
Carbon Fiber Development Targets
Spec
ific
Tens
ile S
tren
gth
Specific Tensile Modulus
Stronger &
Lighter ComponentsAramid
S Glass
Steel
Aluminum2024-T6
SMGen
1
SMGen
2
IMGen
1
IMGen
2
75
CEM—Carbon Fiber Update
• Carbon fiber technology is growing more important for meeting higher customer requirements and demand
• CEM currently supplies about 1/3 of requirements internally—growing to 50%+
• CEM is investing more to ensure strong technology and supply chain position
2002 2007 2010
3K E
Q c
apac
ity
Carbon Fiber Development Targets
Cytec Carbon Fiber Capacity Growth
Double Capacity
Double Capacity
• Capacity Growth– Doubled capacity since 2001 acquisition
– New carbon fiber capacity in planning phase—will double capacity again
– Targeted strictly for strategic aerospace customers and select aerospace applications
– Site selection complete, preliminary design late-2007, on-line early 2010
Spec
ific
Tens
ile S
tren
gth
Specific Tensile Modulus
Stronger &
Lighter ComponentsAramid
S Glass
Steel
Aluminum2024-T6
SMGen
1
SMGen
2
IMGen
1
IMGen
2
76
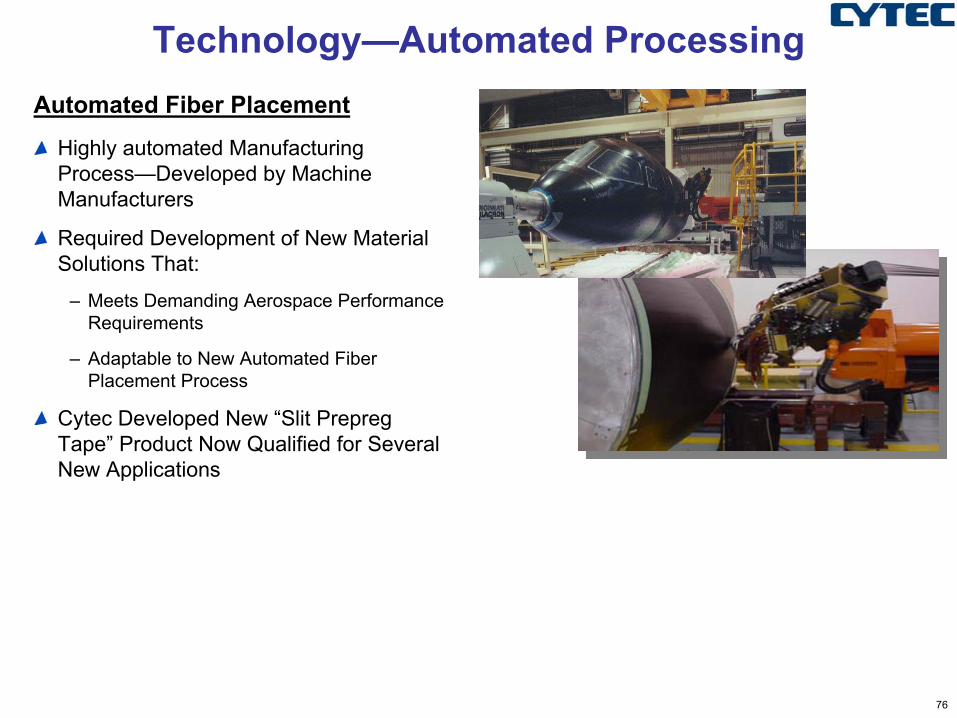
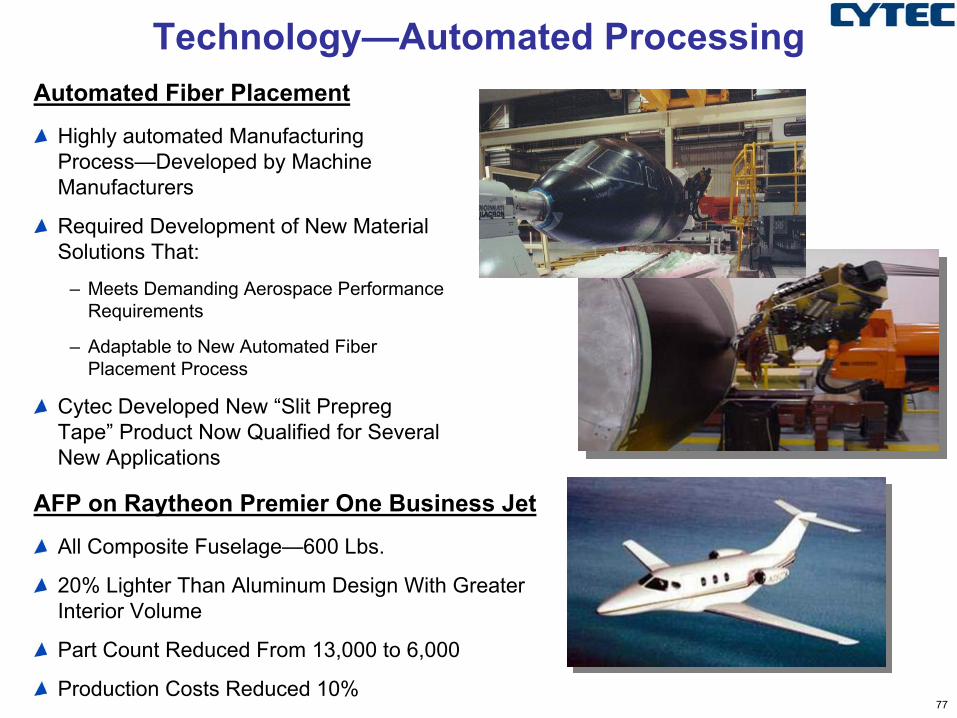
Technology—Automated ProcessingAutomated Fiber Placement
Highly automated Manufacturing Process—Developed by Machine Manufacturers
Required Development of New Material Solutions That:
– Meets Demanding Aerospace Performance Requirements
– Adaptable to New Automated Fiber Placement Process
Cytec Developed New “Slit PrepregTape” Product Now Qualified for Several New Applications
77
Technology—Automated Processing
AFP on Raytheon Premier One Business Jet
All Composite Fuselage—600 Lbs.
20% Lighter Than Aluminum Design With Greater Interior Volume
Part Count Reduced From 13,000 to 6,000
Production Costs Reduced 10%
Automated Fiber Placement
Highly automated Manufacturing Process—Developed by Machine Manufacturers
Required Development of New Material Solutions That:
– Meets Demanding Aerospace Performance Requirements
– Adaptable to New Automated Fiber Placement Process
Cytec Developed New “Slit PrepregTape” Product Now Qualified for Several New Applications
78
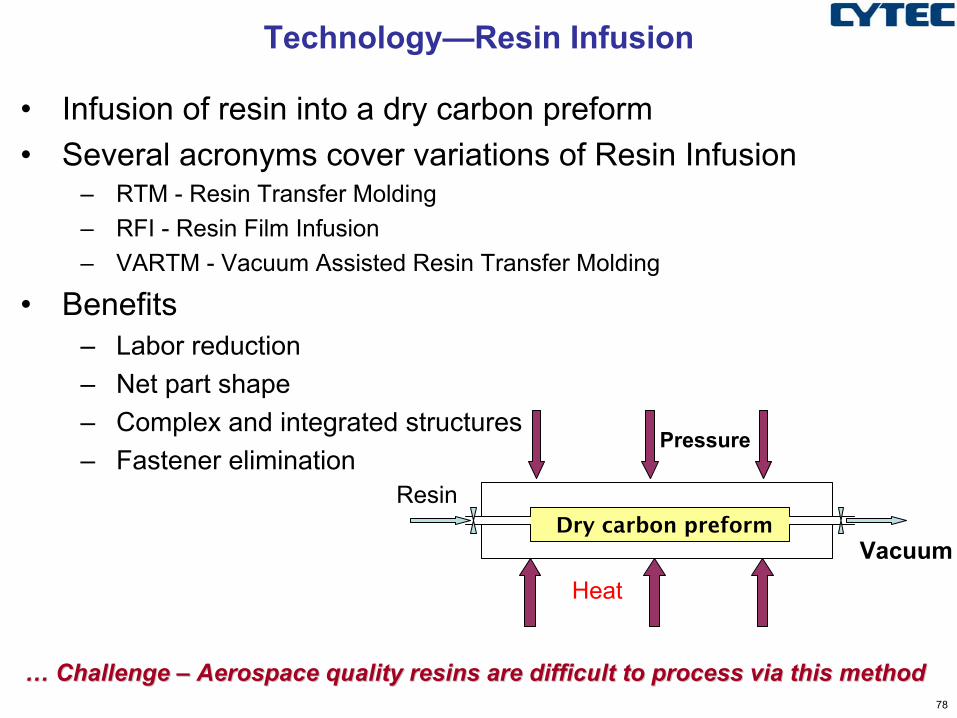
Technology—Resin Infusion
• Infusion of resin into a dry carbon preform• Several acronyms cover variations of Resin Infusion
– RTM - Resin Transfer Molding– RFI - Resin Film Infusion– VARTM - Vacuum Assisted Resin Transfer Molding
• Benefits– Labor reduction– Net part shape– Complex and integrated structures– Fastener elimination
Pressure
Resin
Heat
VacuumDry carbon preform
…… Challenge Challenge –– Aerospace quality resins are difficult to process via this methAerospace quality resins are difficult to process via this methodod
79
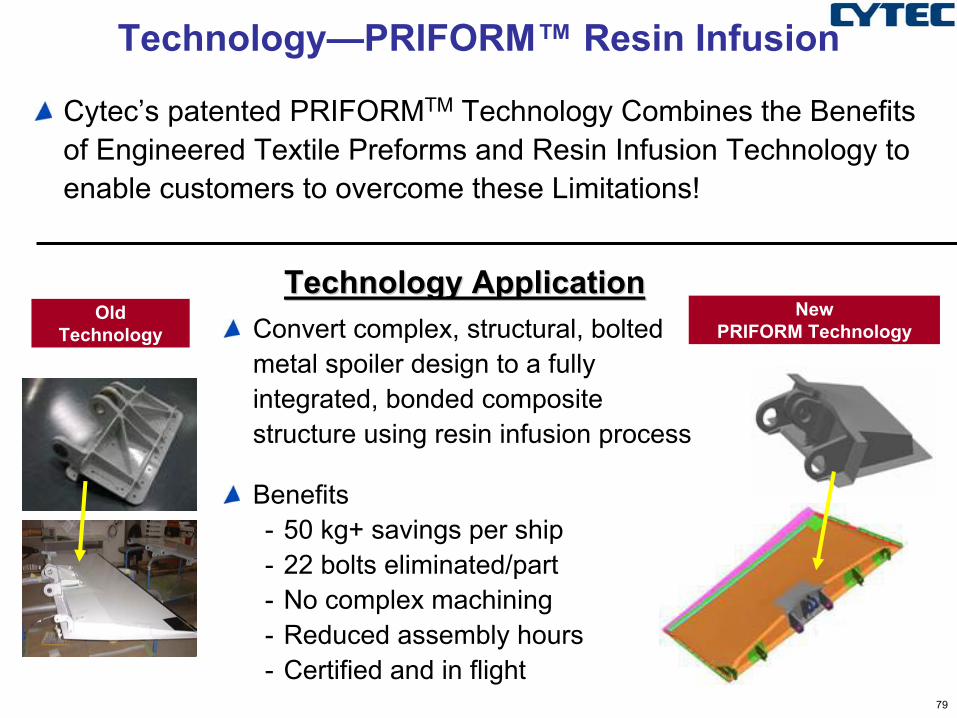
Technology—PRIFORM™ Resin Infusion
Technology Application Technology Application Convert complex, structural, bolted metal spoiler design to a fully integrated, bonded composite structure using resin infusion process
Benefits- 50 kg+ savings per ship- 22 bolts eliminated/part- No complex machining- Reduced assembly hours- Certified and in flight
Old Technology
New PRIFORM Technology
Cytec’s patented PRIFORMTM Technology Combines the Benefits of Engineered Textile Preforms and Resin Infusion Technology to enable customers to overcome these Limitations!
80
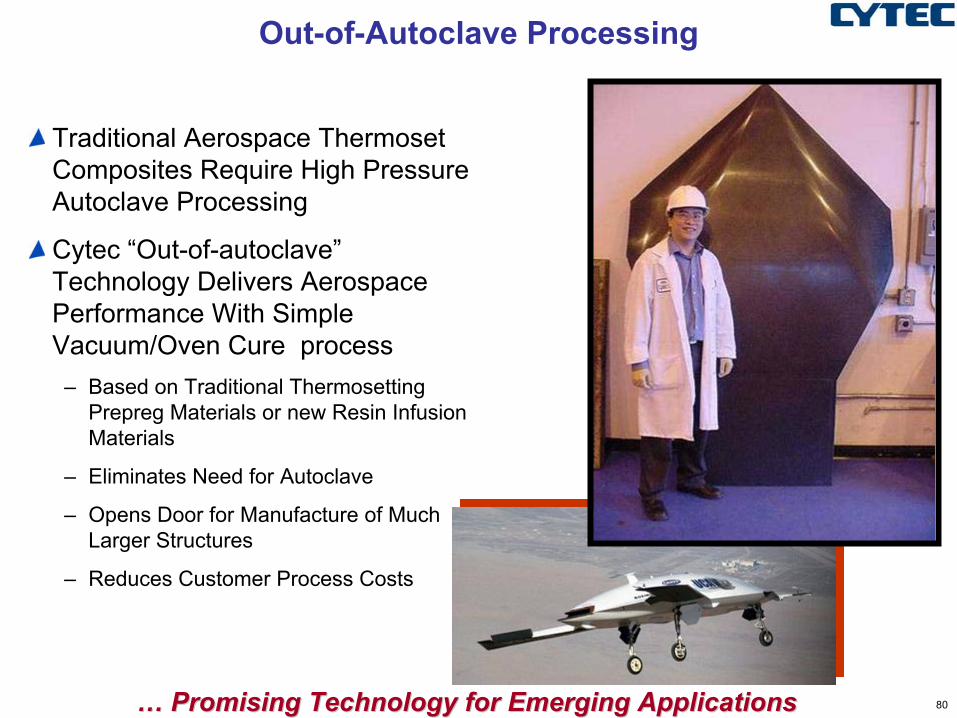
Out-of-Autoclave Processing
Traditional Aerospace ThermosetComposites Require High Pressure Autoclave Processing
Cytec “Out-of-autoclave”Technology Delivers Aerospace Performance With Simple Vacuum/Oven Cure process
– Based on Traditional Thermosetting Prepreg Materials or new Resin Infusion Materials
– Eliminates Need for Autoclave
– Opens Door for Manufacture of Much Larger Structures
– Reduces Customer Process Costs
…… Promising Technology for Emerging ApplicationsPromising Technology for Emerging Applications
81
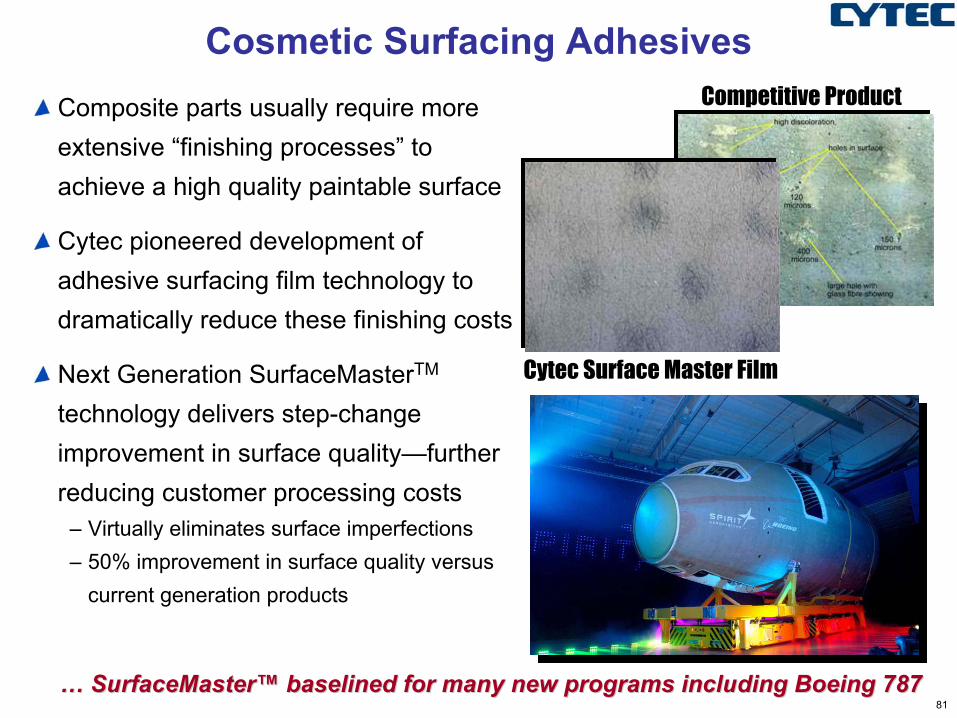
Cosmetic Surfacing AdhesivesCompetitive ProductComposite parts usually require more
extensive “finishing processes” to achieve a high quality paintable surface
Cytec pioneered development of adhesive surfacing film technology to dramatically reduce these finishing costs
Next Generation SurfaceMasterTM
technology delivers step-change improvement in surface quality—further reducing customer processing costs
– Virtually eliminates surface imperfections– 50% improvement in surface quality versus
current generation products
…… SurfaceMasterSurfaceMaster™™ baselinedbaselined for many new programs including Boeing 787 for many new programs including Boeing 787
Cytec Surface Master Film
82
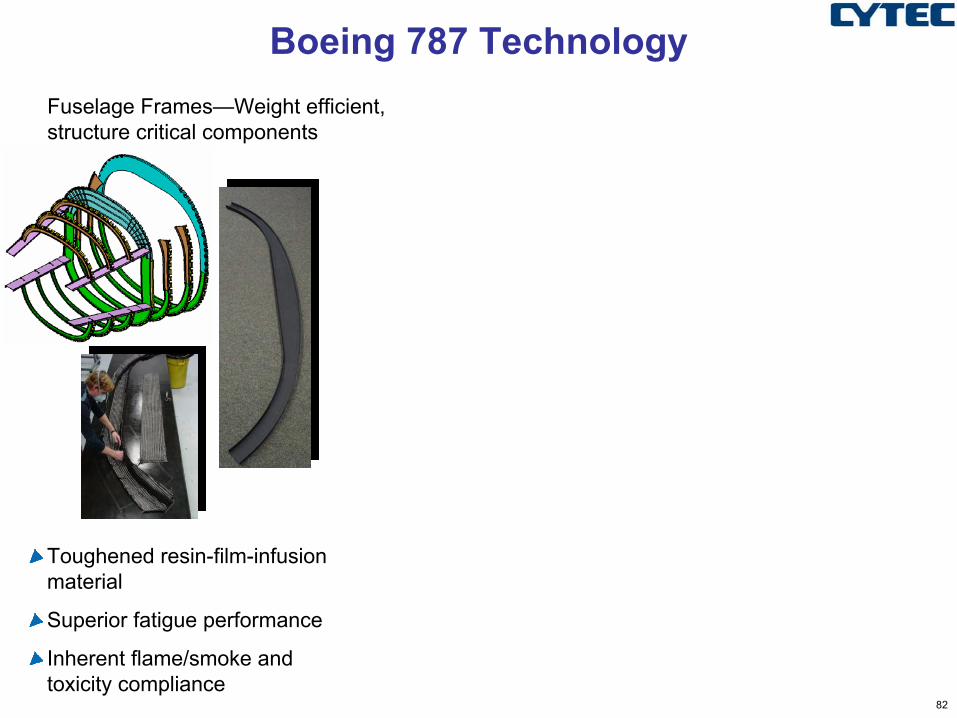
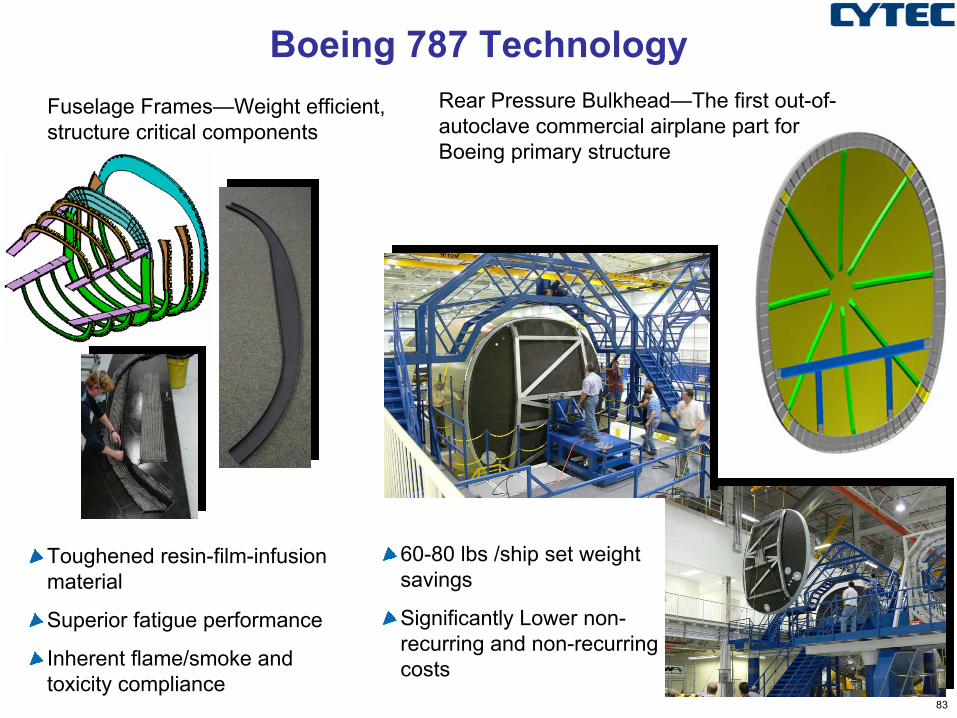
Boeing 787 Technology
Toughened resin-film-infusion material
Superior fatigue performance
Inherent flame/smoke and toxicity compliance
Fuselage Frames—Weight efficient, structure critical components
83
Boeing 787 Technology
Toughened resin-film-infusion material
Superior fatigue performance
Inherent flame/smoke and toxicity compliance
Fuselage Frames—Weight efficient, structure critical components
Rear Pressure Bulkhead—The first out-of-autoclave commercial airplane part for Boeing primary structure
60-80 lbs /ship set weight savings
Significantly Lower non-recurring and non-recurring costs
84
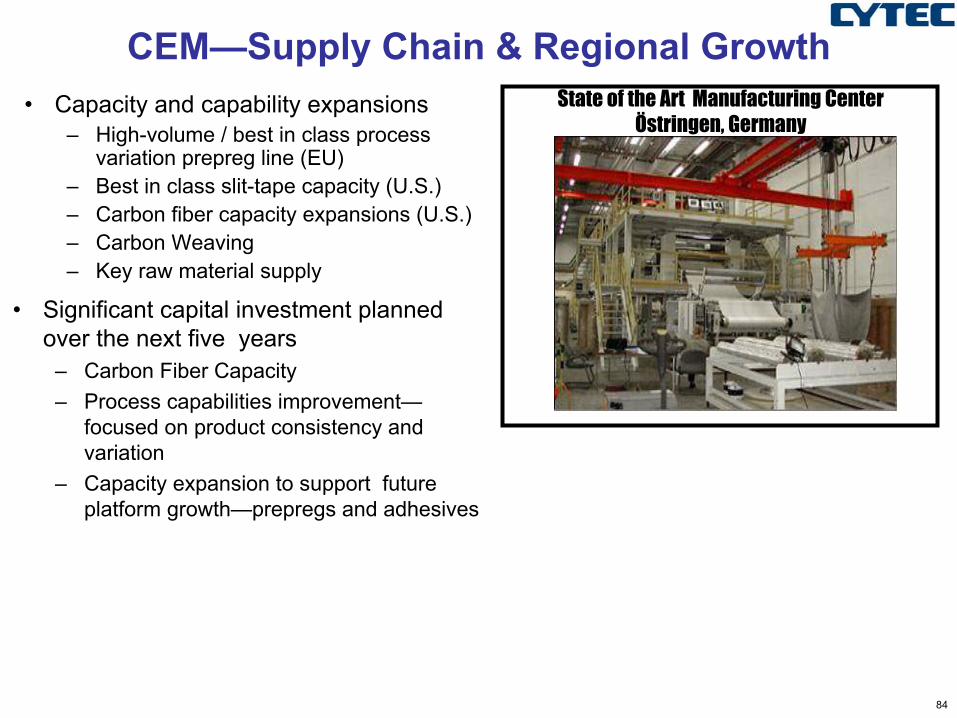
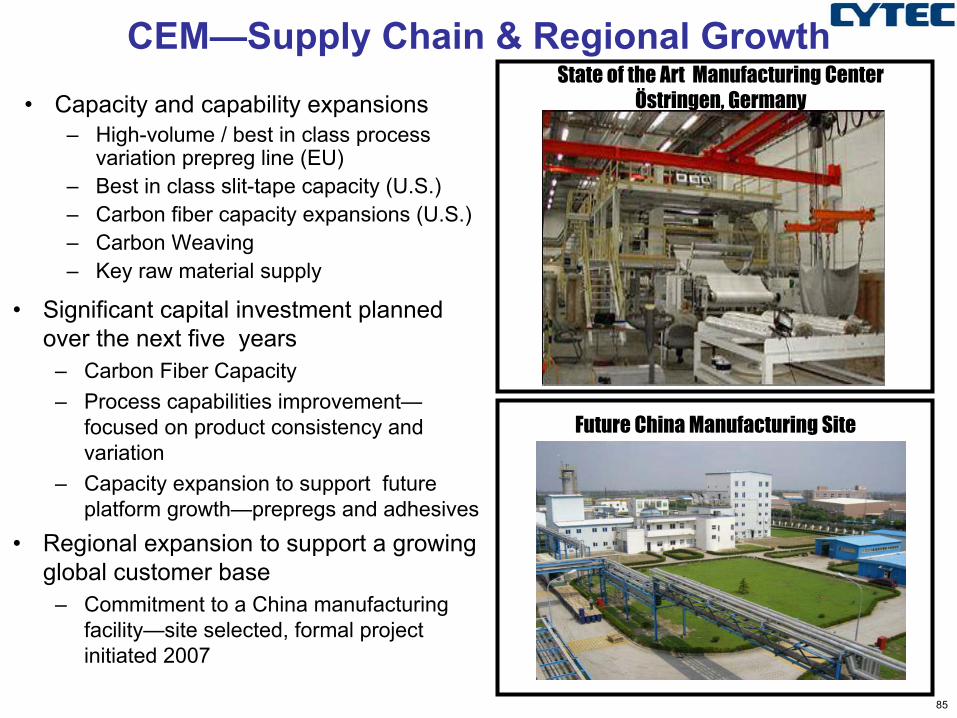
CEM—Supply Chain & Regional Growth• Capacity and capability expansions
– High-volume / best in class process variation prepreg line (EU)
– Best in class slit-tape capacity (U.S.)– Carbon fiber capacity expansions (U.S.) – Carbon Weaving– Key raw material supply
State of the Art Manufacturing CenterÖstringen, Germany
• Significant capital investment planned over the next five years
– Carbon Fiber Capacity– Process capabilities improvement—
focused on product consistency and variation
– Capacity expansion to support future platform growth—prepregs and adhesives
85
CEM—Supply Chain & Regional Growth• Capacity and capability expansions
– High-volume / best in class process variation prepreg line (EU)
– Best in class slit-tape capacity (U.S.)– Carbon fiber capacity expansions (U.S.) – Carbon Weaving– Key raw material supply
State of the Art Manufacturing CenterÖstringen, Germany
• Significant capital investment planned over the next five years
– Carbon Fiber Capacity– Process capabilities improvement—
focused on product consistency and variation
– Capacity expansion to support future platform growth—prepregs and adhesives
• Regional expansion to support a growing global customer base
– Commitment to a China manufacturing facility—site selected, formal project initiated 2007
Future China Manufacturing Site
86
Mission and Business Objectives
Business Objectives• Annual top line growth ~10%• 15% average annual earnings growth• Lay solid foundation for sustained new program growth in
the next decade
Mission
Cytec Engineered Materials will be a premier growth organization continuously creating value by providing innovative engineered material solutions for the most demanding applications.
87
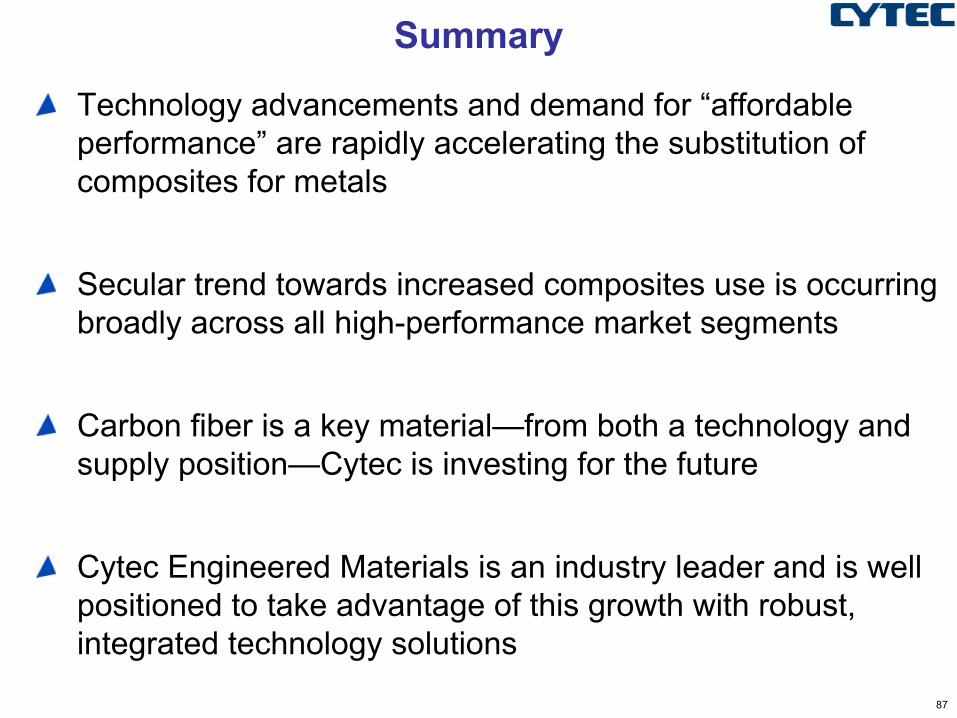
Summary
Technology advancements and demand for “affordable performance” are rapidly accelerating the substitution of composites for metals
Secular trend towards increased composites use is occurring broadly across all high-performance market segments
Carbon fiber is a key material—from both a technology and supply position—Cytec is investing for the future
Cytec Engineered Materials is an industry leader and is well positioned to take advantage of this growth with robust, integrated technology solutions
88
… to create a new future!… to create a new future!
Breaking Through Barriers ...Breaking Through Barriers ...
89
Agenda
Jim Cronin – Executive Vice President and Chief Financial Officer
– Building Block Chemicals
– Income Taxes
– Capital Spending
– Balance Sheet
– Cash Flow
– EPS Wrap-Up
90
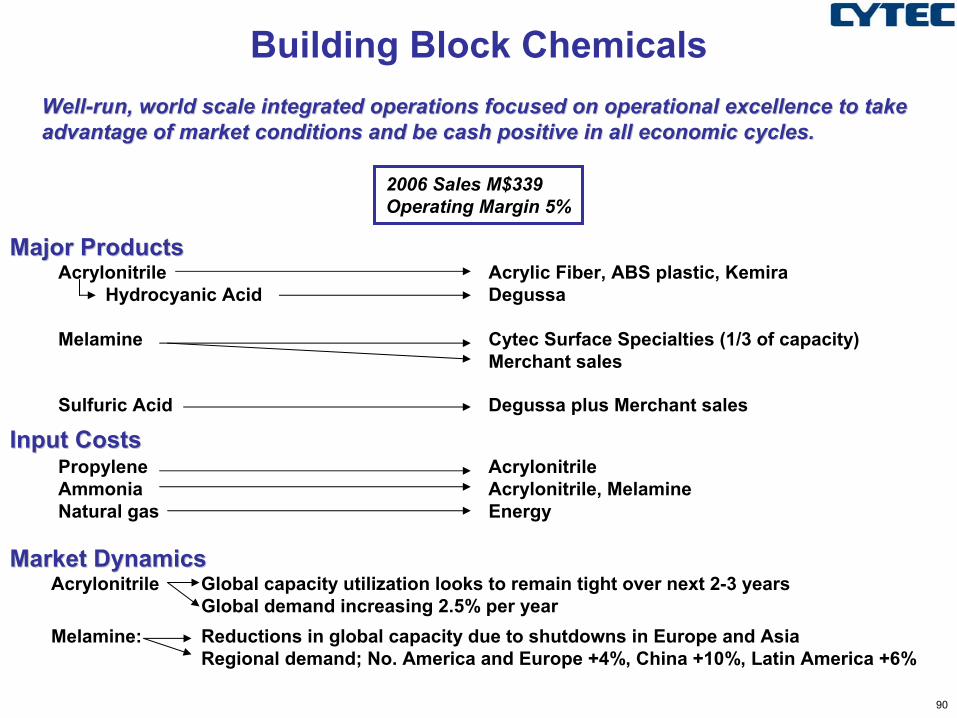
Major ProductsMajor ProductsAcrylonitrile Acrylic Fiber, ABS plastic, Kemira
Hydrocyanic Acid Degussa
Melamine Cytec Surface Specialties (1/3 of capacity)Merchant sales
Sulfuric Acid Degussa plus Merchant sales
Input CostsInput CostsPropylene AcrylonitrileAmmonia Acrylonitrile, MelamineNatural gas Energy
Building Block ChemicalsWellWell--run, world scale integrated operations focused on operational exrun, world scale integrated operations focused on operational excellence to take cellence to take advantage of market conditions and be cash positive in all econoadvantage of market conditions and be cash positive in all economic cycles. mic cycles.
2006 Sales M$339Operating Margin 5%
Market DynamicsMarket DynamicsAcrylonitrile Global capacity utilization looks to remain tight over next 2-3 years
Global demand increasing 2.5% per yearMelamine: Reductions in global capacity due to shutdowns in Europe and Asia
Regional demand; No. America and Europe +4%, China +10%, Latin America +6%
91
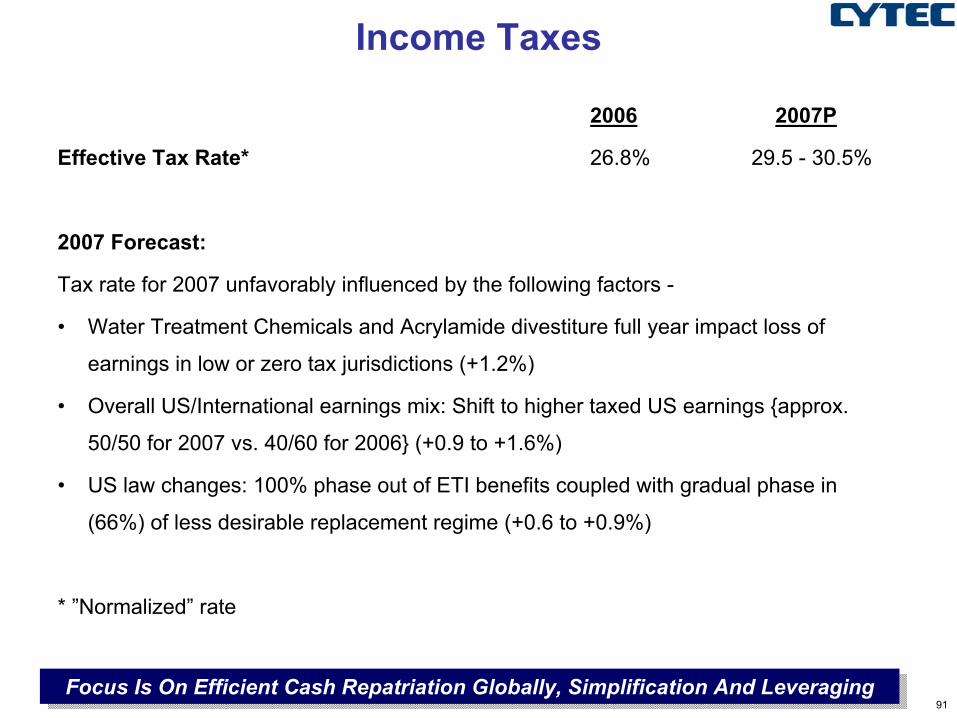
Income Taxes
2006 2007P
Effective Tax Rate* 26.8% 29.5 - 30.5%
2007 Forecast:
Tax rate for 2007 unfavorably influenced by the following factors -
• Water Treatment Chemicals and Acrylamide divestiture full year impact loss of
earnings in low or zero tax jurisdictions (+1.2%)
• Overall US/International earnings mix: Shift to higher taxed US earnings {approx.
50/50 for 2007 vs. 40/60 for 2006} (+0.9 to +1.6%)
• US law changes: 100% phase out of ETI benefits coupled with gradual phase in
(66%) of less desirable replacement regime (+0.6 to +0.9%)
* ”Normalized” rate
Focus Is On Efficient Cash Repatriation Globally, Simplification And LeveragingFocus Is On Efficient Cash Repatriation Globally, Simplification And Leveraging
92
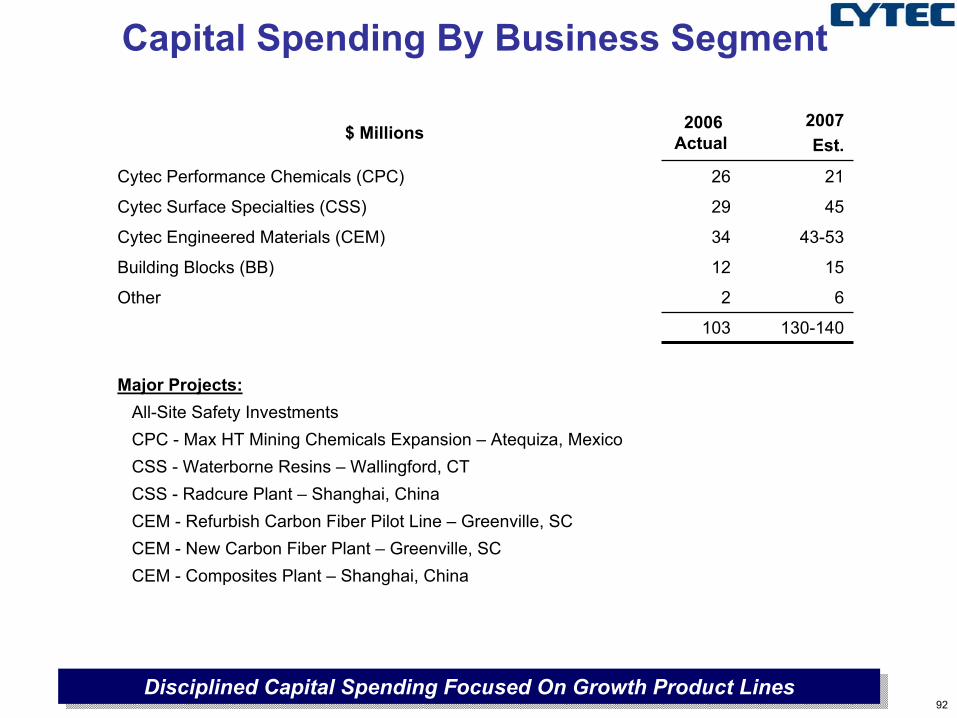
Capital Spending By Business Segment
CPC - Max HT Mining Chemicals Expansion – Atequiza, MexicoAll-Site Safety Investments
CEM - Composites Plant – Shanghai, ChinaCEM - New Carbon Fiber Plant – Greenville, SCCEM - Refurbish Carbon Fiber Pilot Line – Greenville, SCCSS - Radcure Plant – Shanghai, ChinaCSS - Waterborne Resins – Wallingford, CT
Major Projects:
130-140103
62Other
1512Building Blocks (BB)
43-5334Cytec Engineered Materials (CEM)
4529Cytec Surface Specialties (CSS)
2126Cytec Performance Chemicals (CPC)
2007 Est.
2006 Actual$ Millions
Disciplined Capital Spending Focused On Growth Product LinesDisciplined Capital Spending Focused On Growth Product Lines
93
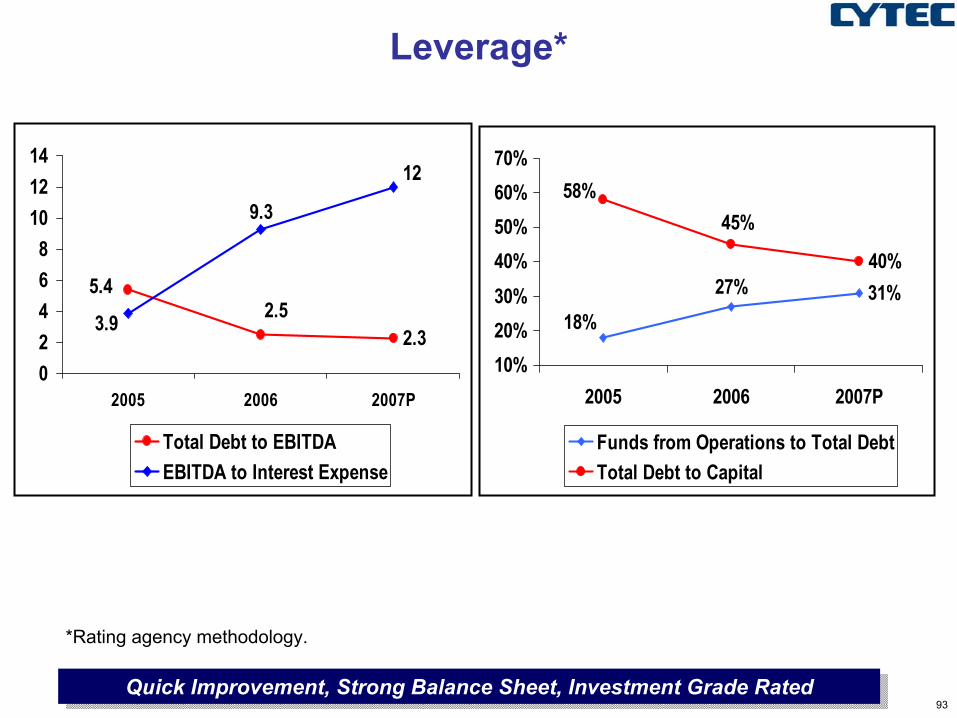
Leverage*
2.3
5.42.5
12
3.9
9.3
02468
101214
2005 2006 2007P
Total Debt to EBITDAEBITDA to Interest Expense
31%40%
27%18%
45%58%
10%20%30%40%50%60%70%
2005 2006 2007P
Funds from Operations to Total DebtTotal Debt to Capital
*Rating agency methodology.
Quick Improvement, Strong Balance Sheet, Investment Grade RatedQuick Improvement, Strong Balance Sheet, Investment Grade Rated
94
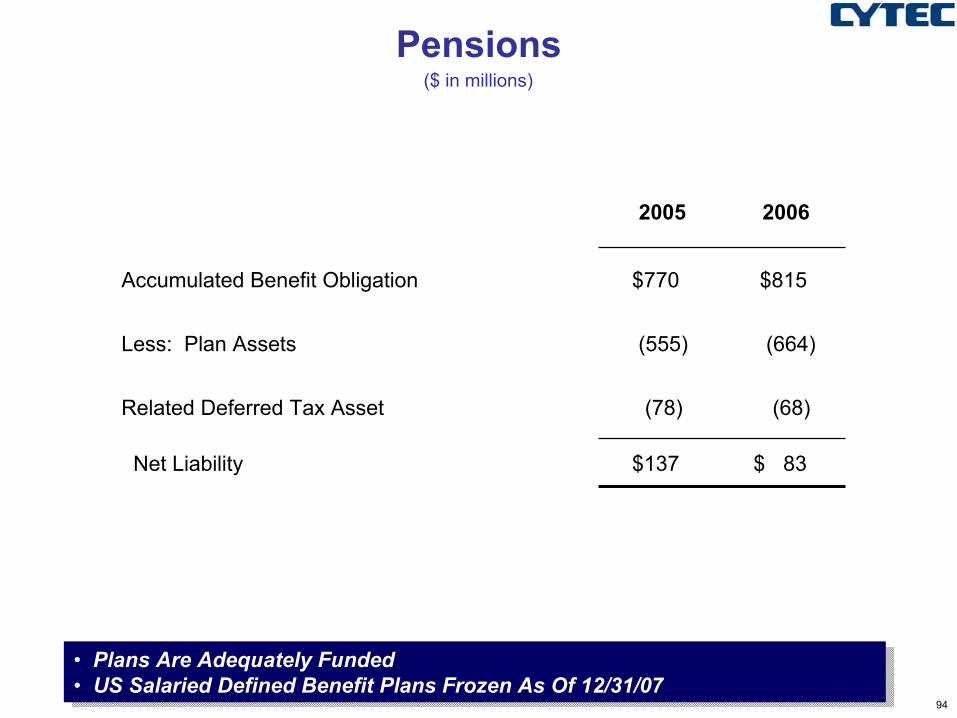
Pensions($ in millions)
$ 83$137Net Liability
(68)(78)Related Deferred Tax Asset
(664)(555)Less: Plan Assets
$815$770Accumulated Benefit Obligation
20062005
• Plans Are Adequately Funded• US Salaried Defined Benefit Plans Frozen As Of 12/31/07
• Plans Are Adequately Funded• US Salaried Defined Benefit Plans Frozen As Of 12/31/07
95
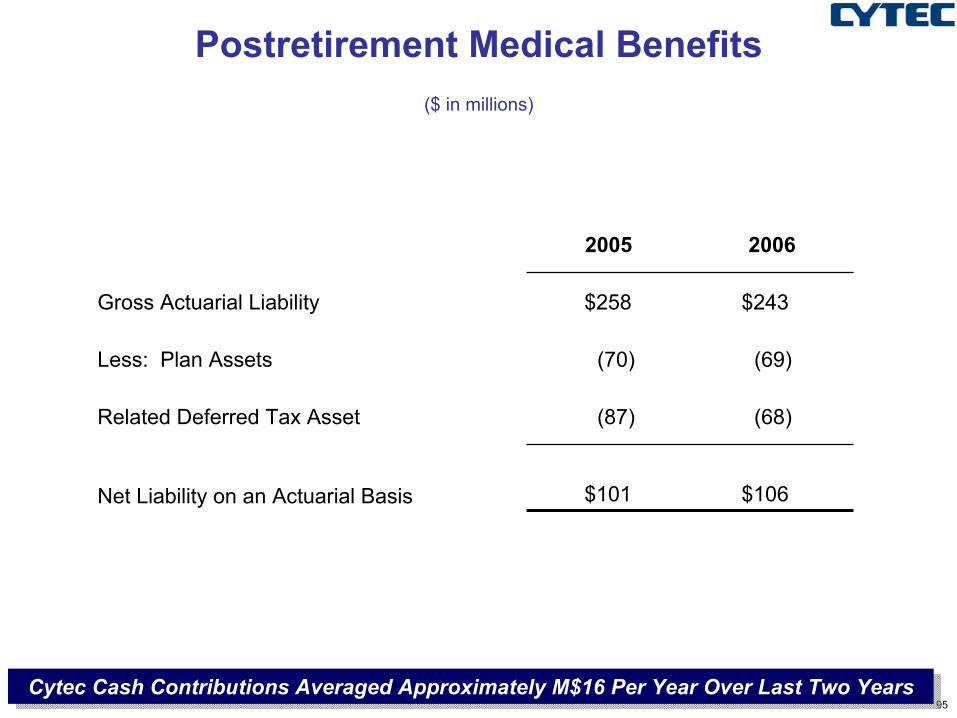
Postretirement Medical Benefits($ in millions)
Cytec Cash Contributions Averaged Approximately M$16 Per Year Over Last Two YearsCytec Cash Contributions Averaged Approximately M$16 Per Year Over Last Two Years
$106$101Net Liability on an Actuarial Basis
(68)(87)Related Deferred Tax Asset
(69)(70)Less: Plan Assets
$243$258Gross Actuarial Liability
20062005
96
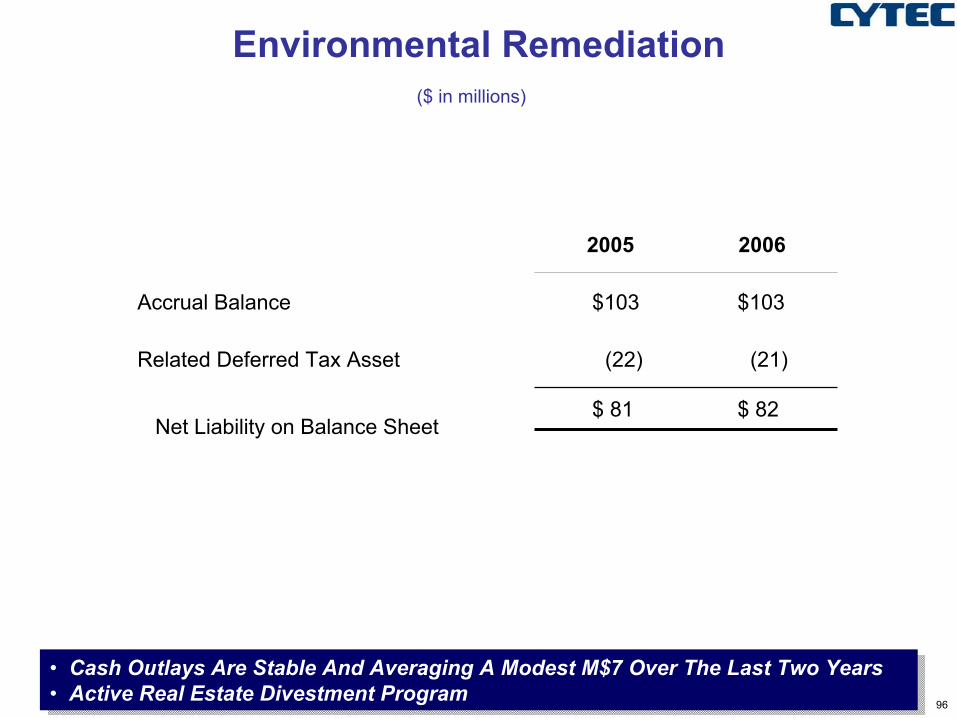
Environmental Remediation ($ in millions)
$ 82$ 81Net Liability on Balance Sheet
(21)(22)Related Deferred Tax Asset
$103$103Accrual Balance
20062005
• Cash Outlays Are Stable And Averaging A Modest M$7 Over The Last Two Years• Active Real Estate Divestment Program
• Cash Outlays Are Stable And Averaging A Modest M$7 Over The Last Two Years• Active Real Estate Divestment Program
97
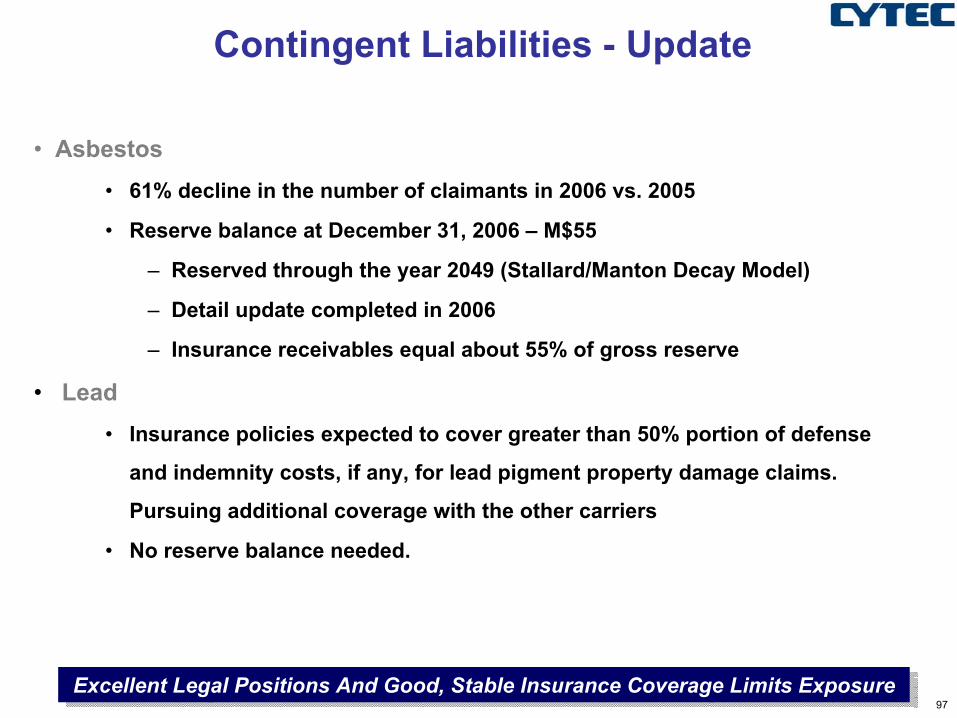
Contingent Liabilities - Update
• Asbestos• 61% decline in the number of claimants in 2006 vs. 2005
• Reserve balance at December 31, 2006 – M$55
– Reserved through the year 2049 (Stallard/Manton Decay Model)
– Detail update completed in 2006
– Insurance receivables equal about 55% of gross reserve
• Lead • Insurance policies expected to cover greater than 50% portion of defense
and indemnity costs, if any, for lead pigment property damage claims.
Pursuing additional coverage with the other carriers
• No reserve balance needed.
Excellent Legal Positions And Good, Stable Insurance Coverage Limits ExposureExcellent Legal Positions And Good, Stable Insurance Coverage Limits Exposure
98
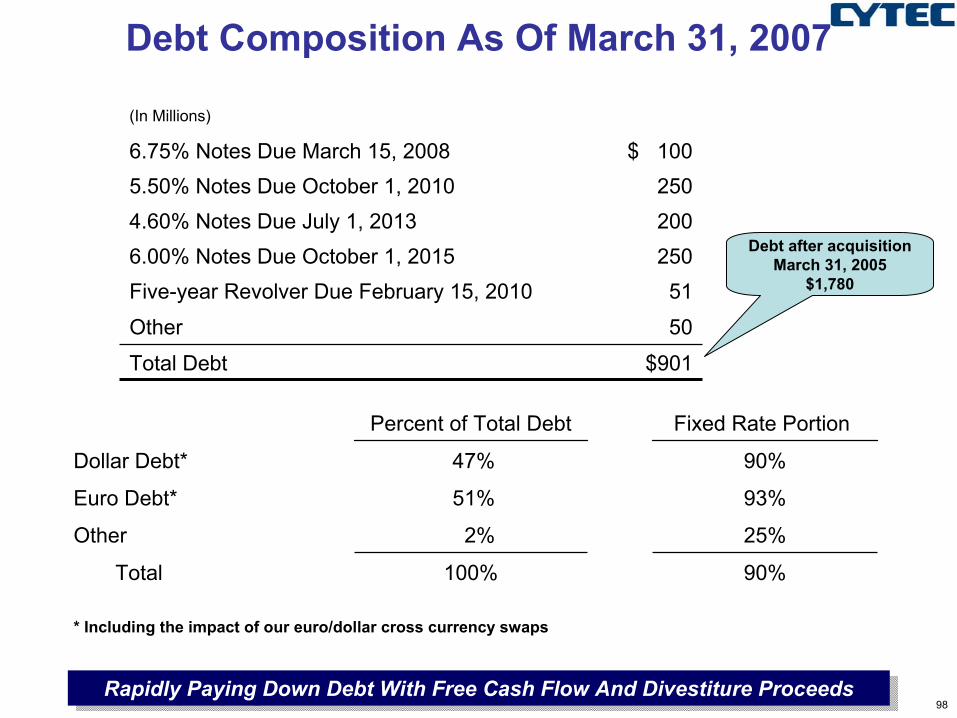
Debt Composition As Of March 31, 2007
90%100%Total
25%2%Other
93%51%Euro Debt*
90%47%Dollar Debt*
Fixed Rate Portion Percent of Total Debt
51Five-year Revolver Due February 15, 2010
(In Millions)
$901Total Debt
50Other
2506.00% Notes Due October 1, 20152004.60% Notes Due July 1, 20132505.50% Notes Due October 1, 2010
$ 1006.75% Notes Due March 15, 2008
Debt after acquisition March 31, 2005
$1,780
* Including the impact of our euro/dollar cross currency swaps
Rapidly Paying Down Debt With Free Cash Flow And Divestiture ProceedsRapidly Paying Down Debt With Free Cash Flow And Divestiture Proceeds
99
0
100
200
300
400
'07 '08 '09 '10 '11 '12 '13 '14 '15 '16Year
Am
ount Outstanding
Long-Term Debt Maturities As of March 31, 2007
Five-yearRevolver -
Public Debt -
Can be prepaid with excess cash any time prior to maturity
Well Distributed Maturity ProfileWell Distributed Maturity Profile
In Millions
$
100
Uses of Cash 2002 - 2006
21%
73%
3% 2%
66%
16%
11%8%
Investing In Cytec’s Future GrowthInvesting In Cytec’s Future Growth
Including Surf. Spec. Acquisition Excluding Surf. Spec. Acquisition
Capex M&A Share Repurchase Dividend
101
Uses of Cash cont’d
Key points:• Good cash flow and balance sheet• Manageable liabilities• Uses of cash going forward:
• Maintenance of business capital• Capital projects to support the growth businesses• Pay down debt• Bolt-on acquisitions (stock buyback hurdle rate)• Stock buyback• Dividends
Our Financial Strength Let’s Us Consider All The Above Uses Of CashOur Financial Strength Let’s Us Consider All The Above Uses Of Cash
102
Cash Flow Statement($ in millions)
*including ($76) gain on sales of assets and ($73) net working capital**including ($16) gain on sale of assets and ($57) net working capital
$116$124Free Cash Flow
3245Options Exercised
(19)(19)Dividends
(130)(103)Capital Expenditures
$233$201Cash Flow from Operations
(107)**(147)*Working Capital and Other
142153Depreciation and Amortization
$198$195Net Income
2007P2006
103
Earnings Per Share 2004-2007
2004 2005 2006 2007P
Reported $2.96 $1.27 $4.01 N/A”Normalized” $3.03 $3.07 $3.45 3.60-3.80% Growth 31% 1% 12% 4%-10%
Successful Achievement of 2007 EPS Target Contingent Upon …..1. Execution of ….
Selling price initiatives exceeding the raw material cost increasesKeeping up with market growth and market share gainsSignificant cost and efficiency improvements at manufacturing locations
2. Keeping people motivated and innovative through turbulent times. Focus on the priorities.
Major Risks to the 2007 Plan ….1. Higher than plan raw material costs and raw material cost volatility caused by
shortages and spikes in oil prices2. Competition failing to raise or giving up price for share3. Regional recession
104
Technology ahead of its time
Cytec Industries Inc. (NYSE : CYT)
Investor Day Presentation
May 9, 2007
105
Reconciliation of “Non-GAAP” Measures to GAAP MeasuresManagement believes that net after-tax earnings and diluted earnings per share before special items, non-GAAP measures, are meaningful to investors because they provide a view of the Company with respect to ongoing operations. Special items represent significant charges or credits that are important to an understanding of the Company’s overall operating results in the periods presented. Such measurements are not recognized in accordance with generally accepted accounting principles (GAAP) and should not be viewed as an alternative to GAAP measures of performance.Full-Year 2004 “Non-GAAP” Diluted EPS $3.03
- Add back Reduction in Income Tax Provision 0.06- Add back Litigation Settlement Charge (0.12)- Add back Premium Paid to Redeem Preferred Stock (0.24)- Add back Settlement of Disputed Matters with Series C Holders (0.04)- Add back Settlements of Carbon Fiber Litigation Matters (0.15)- Add back Gains on anticipatory currency and interest rate hedging 0.42
Full-Year 2004 Reported Diluted EPS $2.96Full Year 2005 “Non-GAAP” Diluted EPS 3.07
- Add back purchase accounting charges for fair value of inventory in excess of normal manufacturing cost (0.33)- Add back write-off of in-process research and development costs of Surface Specialties (0.80)- Add back loss on currency and interest rate derivative transactions (0.60)- Add back anticipated settlement of a certain litigation matter (0.04)- Add back optional redemption of Mandatory Par Put Remarketed Securities (MOPPRS) prior to their maturity (0.30)- Add back income tax benefit reflecting favorable developments on of tax audits with respect to prior years returns 0.61- Add back restructuring costs (0.27)- Add back settlement to resolve a dispute over an environmental matter (0.07)- Add back Integration expenses related to acquired businesses (0.00)
Full Year 2005 Reported Diluted EPS 1.27Full Year 2006 “Non-GAAP” Diluted EPS $3.45
- Add back asset impairment charge 0.51- Add back net restructuring charge 0.33- Add back integration costs related to acquired business 0.03- Add back charge related to UK benefit plan change 0.04- Add back net charge related to contingent liability study/update 0.03- Add back gain relating to a certain legal dispute (0.26)- Add back gain on divestiture (1.23)- Add back income tax benefit related to completion of prior years audits (0.07)- Add back tax on capital reduction at an international subsidiary 0.04- Add back cumulative effect of accounting change 0.02
Full Year 2006 Reported Diluted EPS $4.01
Cytec Industries Inc.