Embed Size (px)
Citation preview
ORIGINAL PAPER
Teleconnection between rainfall over South China and the EastEuropean Plain in July and August
Qin Su & Riyu Lu
Received: 27 August 2013 /Accepted: 27 November 2013# Springer-Verlag Wien 2013
Abstract In the present reported work, we identified thatthere is a significant negative relationship between rainfallover South China (SC) and the East European Plain (EEP)in the months of July and August, and investigated the possi-ble reason for this negative relationship. The correlation coef-ficients between SC and the EEP rainfall were calculated to be−0.42 for July and −0.35 for August, both significant at the95 % confidence level. We report that a wave-like train ofcirculation anomalies and a pathway of wave-activity fluxstretching from Europe to East China connect the anticyclonicanomaly over Europe and the cyclonic anomaly over centraland southern China, which are responsible for less EEP rain-fall and more SC rainfall. We suggest that the teleconnectionbetween SC and EEP rainfall results from the extension ofstationary Rossby waves in the mid-latitudes in the uppertroposphere for both July and August. This stationaryRossby wave is contributed to by summer North AtlanticOscillation (NAO) and its extension features are determinedby the location and intensity of the climatological upper-tropospheric westerly jet. Furthermore, we found that therewas an interdecadal change around the mid-1970s in thenegative SC–EEP rainfall relationship for both July andAugust. The negative correlation was significant and strongin the period 1976–2005, but much weaker in the period1955–1975. The extension of stationary Rossby waves from
Europe to East China was responsible for the significantnegative relationship during the period 1976–2005.
1 Introduction
Teleconnection refers to the relationship between two or moreclimate anomalies separated by large distances. Manyteleconnection patterns have been well documented, and themost well known is the Southern Oscillation, connecting sea-level pressure at Tahiti to that at Darwin, Australia.Teleconnection patterns with at least one foot in the tropicsmay help with climate predictability in remote locations be-cause of the relatively higher predictability of tropical climate.For instance, predicting ENSO events enables the predictionof North American climate anomalies by the concept of thePacific–North American Pattern.
There are some teleconnection patterns during summer inthe extratropics, such as North Atlantic Oscillation (NAO). Itis characterized by a seesaw pattern between polar and mid-latitude regions over the Atlantic Ocean (e.g., Barnston andLivezey 1987), and summer NAO has an influence over alarge area. For instance, the climate over Northern Europe isdirectly influenced by the southern lobe of summer NAO(e.g., Folland et al. 2009). In addition, precipitation and sur-face temperature over Mediterranean regions and East Asiaare also remotely affected (e.g., Sun et al. 2008; Blade et al.2012; Sun and Wang 2012).
Another extratropical teleconnection pattern has been iden-tified along the upper-tropopsheric westerly jet in the mid-latitudes and is called the "Silk Road Pattern" (Lu et al. 2002;Enomoto et al. 2003). The Silk Road Pattern is maintained byinertial dynamics, and tropical heating anomalies may play arole in triggering the teleconnection pattern (Sato andTakahashi 2006; Kosaka et al. 2009; Yasui and Watanabe2010; Ding et al. 2011; Chen and Huang 2012). For example,
Q. Su : R. Lu (*)State Key Laboratory of Numerical Modeling for AtmosphericSciences and Geophysical Fluid Dynamics, Institute of AtmosphericPhysics, Chinese Academy of Sciences, P.O. Box 9804,Beijing 100029, Chinae-mail: [email protected]
Q. SuUniversity of the Chinese Academy of Sciences,Beijing 100049, China
Theor Appl ClimatolDOI 10.1007/s00704-013-1058-y
Yasui and Watanabe (2010) suggested that heating anomaliesover the eastern Mediterranean region and equatorial Africaare effective at exciting this teleconnection along the Asian jet.Meanwhile, other studies have indicated that thisteleconnection pattern has a great impact on the climate inEast Asia. For instance, it contributes to the formation andvariation of the Bonin High near Japan (Enomoto et al. 2003),the mid-July break of the Mongolian rainy season by forminga barotropic ridge over Mongolia (Iwasaki and Nii 2006), andan increase in rainfall over North China by developing a ridgein the upper troposphere over the Korean Peninsula (Lianget al. 2011).
Other teleconnections have been identified as occurringduring summer over the extratropics, but these tend to be lessdominant in comparison with the above-mentioned NAO andSilk Road Pattern. For instance, Wakabayashi and Kawamura(2004) identified two teleconnection patterns in the mid-highlatitudes of the Eurasian continent. In fact, these mid-highlatitude teleconnections and the Silk Road Pattern may operatetogether to jointly affect regional climate (Iwao and Takahashi2008; Moon et al. 2013).
The present reported study detected a significant rela-tionship in rainfall variability between South China (SC)and the East European Plain (EEP) in the months of Julyand August. SC is located at the southeastern-most edge ofthe Eurasian continent, while the EEP is situated in thenorthwest part of the continent. Between them, there is along distance of about 7000 km. In this paper, we illustratethis SC–EEP rainfall relationship, and then examine thecirculation anomalies that may be responsible for therelationship.
SC is situated in the East Asian summer monsoon region,and as such experiences some of the greatest levels of precip-itation in the country. The interannual standard deviations ofSC rainfall in July and August are comparable to those inMayand June, although the amounts of SC rainfall in July andAugust are smaller than those in May and June (Su et al.2013). The amounts of SC rainfall are about 170–180 mm month−1 and the standard deviations are around55 mmmonth−1 in July and August. Su et al. (2013) indicatedthat the patterns of circulation anomalies associated with Julyand August SC rainfall variations are significantly distinctfrom those associated with May and June rainfall, implyingthat it is appropriate to distinguish July–August from May–June when circulation anomalies associated with SC rainfallare averaged over summer months.
Located in the northwest part of the Eurasian continent, theEEP experiences much less rainfall in comparison with SC.Recently, Zveryaev and Allan (2010) indicated that the lead-ing modes of European precipitation for both July and Augustare characterized by coherent precipitation variation over theEEP and a relatively weak and opposite variation over theMediterranean region. They also suggested that these leading
modes are intimately associated with summer NAO.Moreover, Rossby waves propagating in the mid-high lati-tudes have an impact on the summer climate variability inEurope. For instance, the long-lasting blocking high overEastern Europe, which is maintained by Rossby waves(Schneidereit et al. 2012), results in the well-known extremeheat wave event in the EEP in the summer of 2010 (e.g.,Mokhov 2011; Lupo et al. 2012). In addition, sea surfacetemperature and sea ice concentration also play a role inaffecting the EEP climate (Semenov et al. 2012).
Sun et al. (2008) and Sun and Wang (2012) reported that astrong relationship between summer NAO and rainfall/temperature in the northern part of East Asia has beenestablished since the late 1970s, while no such relationshipcould be detected before that time. Therefore, the possibleinterdecadal change in the SC–EEP rainfall relationship is alsodiscussed here. The rest of the paper is organized as follows.Section 2 describes the datasets used in the study. Section 3examines the relationships between SC rainfall and EEP rain-fall, especially their interannual variations. The atmosphericcirculation anomalies associated with the relationships arealso documented in this section. Section 4 presents theinterdecadal change of the relationship between the interan-nual variations of SC rainfall and EEP rainfall. Section 5 isdevoted to a summary.
2 Datasets
Monthly precipitation data for the period 1951–2009 fromthe Climate Research Unit (CRU) high-resolution griddeddataset, CRU TS 3.1 (Harris et al. 2013), were used in thestudy. The resolution of this dataset is 0.5° (longitude) by0.5° (latitude). Monthly rainfall data recorded at 160 sta-tions provided by the Chinese Meteorological Data Centerfor the same period were also used. Monthly mean horizon-tal winds and geopotential heights in the upper tropospherefor the period 1955–2005 were obtained from the NationalCenters for Environmental Prediction/National Center forAtmosphere Research (NCEP/NCAR) reanalysis datasets(Kalnay et al. 1996), which have a resolution of 2.5°(longitude) by 2.5° (latitude). The monthly NAO index(NAOI) used in the study was obtained from the ClimatePrediction Center website (http://www.cpc.ncep.noaa.gov/data/teledoc/nao.shtml), which is calculated according toBarnston and Livezey (1987). The time period used forNAOI was 1955–2005. In addition, we present the horizon-tal components of the wave-activity flux, which were cal-culated according to Takaya and Nakamura (1997) andwere dependent on both zonally varying basic flow andstationary disturbances. The wave-activity flux is used torepresent the local group velocity.
Q. Su, R. Lu
3 The relationship between SC and EEP rainfall
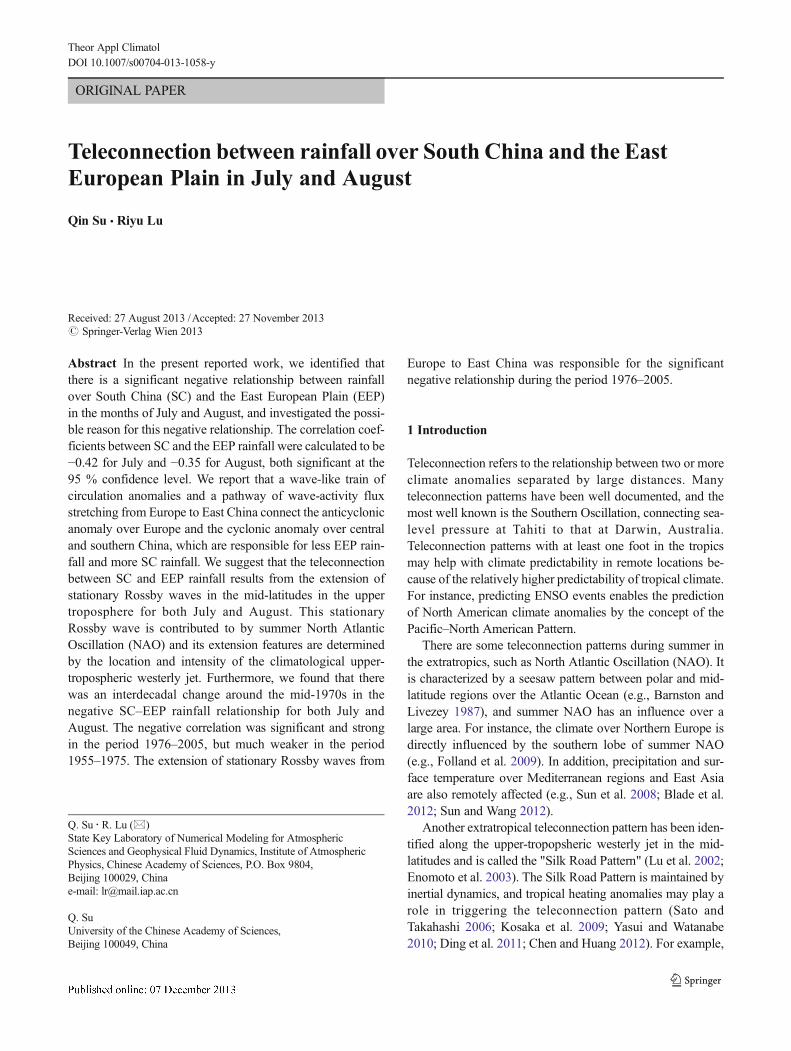
Figure 1 shows the correlation coefficients between the SCrainfall index (SCI) and land rainfall. The SCI was obtainedby averaging the precipitation at 29 stations over the SCregion, which was defined as the southeast part of mainlandChina between the longitudes 105ºE and 120ºE and betweenthe latitudes 21°N and 28°N. Large areas of significant posi-tive correlation appear over SC in July and August (rightpanels of Fig. 1a and b), indicating that the SCI defined hereexhibits a good representation of SC rainfall in both months.There is a weak and negative correlation north of the region ofpositive correlation.
Interestingly, the interannual variations of SC rainfall ex-hibit a significant negative correlation with the variations ofrainfall over the EEP, in both July and August (left panels ofFig. 1a and b). The significant negative correlation in Julyextends from the Black Sea to the EEP, and in August from thenorth of the Baltic Sea to Eastern Europe. There is also
relatively weak and positive correlation in the Mediterraneanregion (not shown). These patterns of correlation coefficientsover Europe resemble the leading modes of European precip-itation for both July and August, characterized by a large areaof coherent precipitation variations from the British Isles tothe EEP and a small area of opposite variation over theMediterranean region (Zveryaev and Allan 2010).
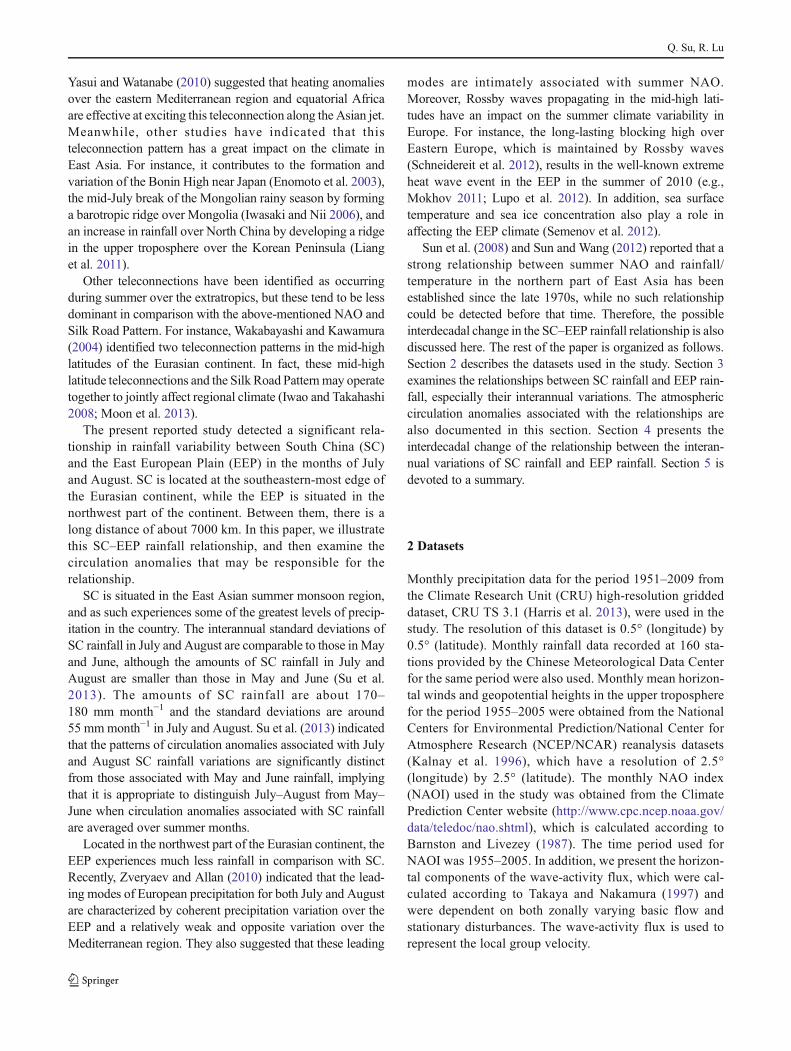
To facilitate further analyses, we specified the regionbetween the longitudes 30°E and 50°E and between thelatitudes 50°N and 60°N as the EEP, and defined the EEPrainfall index (EEPI) as the precipitation averaged overthis region. Figure 2 shows the standardized SCI andEEPI in July and August, respectively. Standardized timeseries were used to facilitate comparison, since the stan-dard deviations, as well as amounts, of SC rainfall aremuch greater than those of EEP rainfall. The standarddeviations of EEPI are around 20 mm month−1 in Julyand August, being only about one-third of those for SCI.Similarly, the amounts of EEP rainfall in July and August
a
b
Fig. 1 Correlation of SC rainfallwith land rainfall: a July; bAugust. The contour interval is0.2 and the contour line of zerohas been omitted. The shadingshows correlations significant atthe 95 % confidence level
South China–East European Plain rainfall relationship
are around 65 mm month−1, being about one-third of SCrainfall.
The negative relationship detected in Fig. 1 can be seenmore clearly in the rainfall variations shown in Fig. 2. Thevariations of SCI and EEPI exhibit opposite signs in mostyears, and the correlation coefficients between these twoindices are −0.42 for July and −0.35 for August, both of whichare significant at the 95 % confidence level.
SC summer rainfall exhibits clear interdecadal variation(Kwon et al. 2007; Wu et al. 2010; Liu et al. 2011; Chenet al. 2012; Ye and Lu 2012; Sui et al. 2013), as does EEPrainfall. Therefore, we separated interannual and interdecadalvariations in SC and EEP rainfall, and primarily analyzed theinterannual component. The interannual component was ob-tained by removing the interdecadal component from theoriginal data, and the interdecadal component was simplydefined as 9-year running averages. It should be noted thatthe interannual variations are dominant in the variations ofboth SC and EEP rainfall, with the interannual componentexplaining 93.8 % and 97.6 % of the total variance for JulySCI and EEPI, respectively. For August, these numberschange to 97.5 % and 86.7 %, respectively. The correlationcoefficients between the interannual variations of SCI andEEPI are −0.44 for July and −0.31 for August, significant atthe 95 % confidence level.
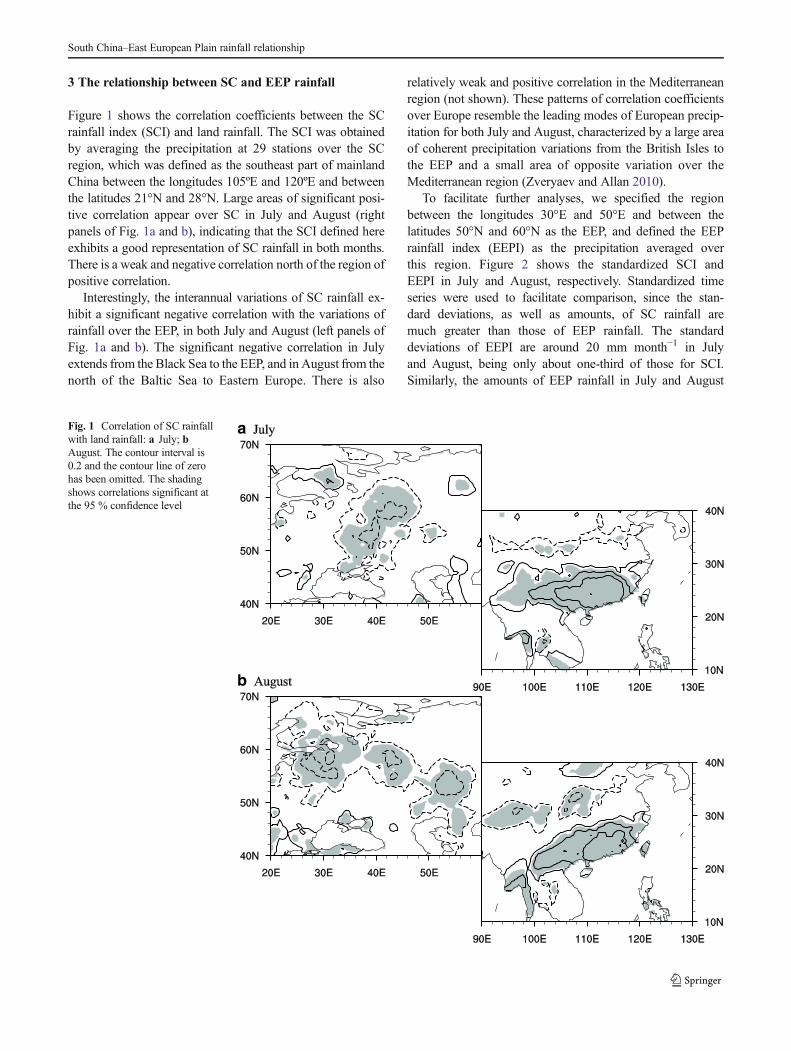
Figure 3 shows the composite geopotential height anoma-lies and the corresponding wave-activity flux at 200 hPa, inassociation with the negative SCI–EEPI relationship. Thecomposite anomalies refer to the differences of geopotentialheights between the wet SC–dry EEP years and the dry SC–wet EEP years. The wet SC–dry EEP years during the period1955–2005 were defined as when the interannual variations ofSCI were greater than half the standard deviation, while theinterannual variations of EEPI were less than minus half thestandard deviation. The dry SC–wet EEP years were definedin a similar way. There are eight wet SC–dry EEP years andnine dry SC–wet EEP years for July, and seven years for bothcategories for August (Table 1).
Awave-like train in the mid-high latitudes extending fromEurope to East China characterizes the geopotential heightanomalies associated with the negative SCI–EEPI relationshipfor both July and August (Fig. 3a and b). There is a positiveheight anomaly over Europe for both months, and it is stron-ger and occupies a larger area for August in comparison withJuly. East of this positive height anomaly, there is a negativeanomaly. By comparing with the precipitation anomaliesshown in Fig. 1, it is evident that these circulation anomaliesare coherent with the precipitation anomalies. The northerlyanomalies correspond well with the negative rainfall
a
b
Fig. 2 Standardized time series of rainfall anomalies over the EEP (solidline) and SC (dashed line): a July; b August a
b
Fig. 3 Composite differences of geopotential heights (contours; units:gpm) at 200 hPa between the wet SC–dry EEP years and the dry SC–wetEEP years (see Table 1). The vectors show the corresponding wave-activity flux (units: m2 s−2) according to Takaya and Nakamura (1997):a July; b August. The contour interval is 15 gpm and the contour line ofzero has been omitted. Thewave-activity flux has also been omitted whenits value was less than 10 m2 s−2
Q. Su, R. Lu
anomalies in both months, implying a balance between coldadvection and adiabatic heating caused by descending flow,which can be identified by less rainfall occurring in the region.There is an anticyclonic anomaly over Mongolia and northernChina, and a cyclonic anomaly over central and southernChina.
The wave-activity flux suggests that the above-mentionedcirculation anomalies could be explained as an extension ofstationary Rossby waves. The wave-activity flux shows thatwaves extend eastwards over Europe, turn southeastwards overWest Asia, and propagate eastwards again along the westerly jetinto eastern China, and southwards out of the jet into central andsouthern China. The pathways of stationary waves are similarbetween July and August, suggesting that stationary Rossbywaves stretch from Europe to eastern China in both months.There is another obvious pathway of waves in the high latitudesover Eastern Europe and Siberia, but it may not be relevant to therelationship between SC and EEP rainfall.
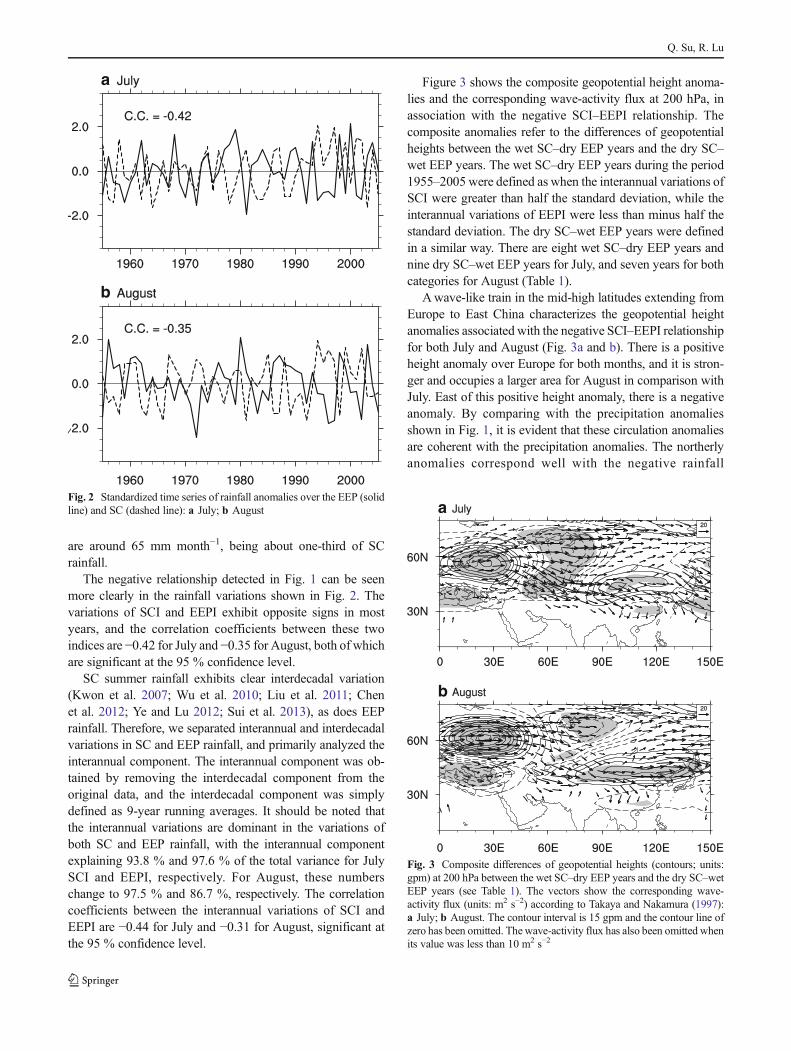
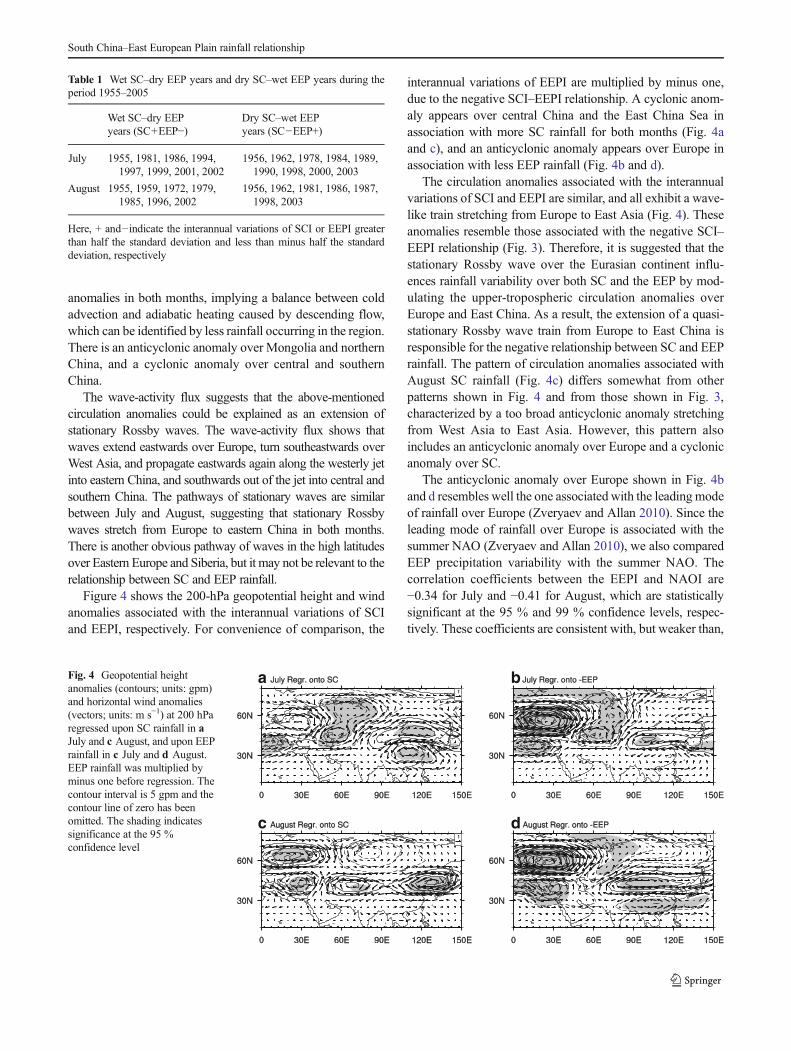
Figure 4 shows the 200-hPa geopotential height and windanomalies associated with the interannual variations of SCIand EEPI, respectively. For convenience of comparison, the
interannual variations of EEPI are multiplied by minus one,due to the negative SCI–EEPI relationship. A cyclonic anom-aly appears over central China and the East China Sea inassociation with more SC rainfall for both months (Fig. 4aand c), and an anticyclonic anomaly appears over Europe inassociation with less EEP rainfall (Fig. 4b and d).
The circulation anomalies associated with the interannualvariations of SCI and EEPI are similar, and all exhibit a wave-like train stretching from Europe to East Asia (Fig. 4). Theseanomalies resemble those associated with the negative SCI–EEPI relationship (Fig. 3). Therefore, it is suggested that thestationary Rossby wave over the Eurasian continent influ-ences rainfall variability over both SC and the EEP by mod-ulating the upper-tropospheric circulation anomalies overEurope and East China. As a result, the extension of a quasi-stationary Rossby wave train from Europe to East China isresponsible for the negative relationship between SC and EEPrainfall. The pattern of circulation anomalies associated withAugust SC rainfall (Fig. 4c) differs somewhat from otherpatterns shown in Fig. 4 and from those shown in Fig. 3,characterized by a too broad anticyclonic anomaly stretchingfrom West Asia to East Asia. However, this pattern alsoincludes an anticyclonic anomaly over Europe and a cyclonicanomaly over SC.
The anticyclonic anomaly over Europe shown in Fig. 4band d resembles well the one associated with the leadingmodeof rainfall over Europe (Zveryaev and Allan 2010). Since theleading mode of rainfall over Europe is associated with thesummer NAO (Zveryaev and Allan 2010), we also comparedEEP precipitation variability with the summer NAO. Thecorrelation coefficients between the EEPI and NAOI are−0.34 for July and −0.41 for August, which are statisticallysignificant at the 95 % and 99 % confidence levels, respec-tively. These coefficients are consistent with, but weaker than,
a b
c d
Fig. 4 Geopotential heightanomalies (contours; units: gpm)and horizontal wind anomalies(vectors; units: m s−1) at 200 hParegressed upon SC rainfall in aJuly and c August, and upon EEPrainfall in c July and d August.EEP rainfall was multiplied byminus one before regression. Thecontour interval is 5 gpm and thecontour line of zero has beenomitted. The shading indicatessignificance at the 95 %confidence level
Table 1 Wet SC–dry EEP years and dry SC–wet EEP years during theperiod 1955–2005
Wet SC–dry EEPyears (SC+EEP−)
Dry SC–wet EEPyears (SC−EEP+)
July 1955, 1981, 1986, 1994,1997, 1999, 2001, 2002
1956, 1962, 1978, 1984, 1989,1990, 1998, 2000, 2003
August 1955, 1959, 1972, 1979,1985, 1996, 2002
1956, 1962, 1981, 1986, 1987,1998, 2003
Here, + and−indicate the interannual variations of SCI or EEPI greaterthan half the standard deviation and less than minus half the standarddeviation, respectively
South China–East European Plain rainfall relationship
those between the leading European rainfall mode and theNAO reported in Zveryaev and Allan (2010).
Westerly jets act as a waveguide and trap teleconnectionpatterns or Rossby waves (Hoskins and Ambrizzi 1993;Ambrizzi et al. 1995). Therefore, the existence and routesof teleconnection patterns may be significantly affected bychanges in the shape of westerly jets (e.g., Yun et al. 2011).The Asian jet exhibits a marked subseasonal variation dur-ing summer. The core of the Asian jet retreats westwardsfrom the western North Pacific at about 140°E to theEurasian continent at about 90°E during mid-June to mid-July (Zhang et al. 2006). This subseasonal change in theAsian jet provides an extra opportunity to confirm the roleof basic flow in affecting teleconnection patterns. For thispurpose, we analyzed the May and June situations in addi-tion to the July and August ones, and made comparisonsbetween them. Considering the eastward propagation ofRossby waves, we used the most upstream cell of theteleconnection patterns identified in the present study as areference, examined the monthly results, and defined anEEP circulation anomaly index (EEP–CI) by averagingthe monthly 200-hPa geopotential height anomalies overthe region between the longitudes 10°E and 40°E andbetween the latitudes 50°N and 60°N. The correlation co-efficients between the EEP–CI and EEPI are −0.70, −0.68,−0.69 and −0.73 for May, June, July and August, respec-tively, indicating that the EEP–CI represents the large-scalecirculation anomaly associated with EEP rainfallvariability.
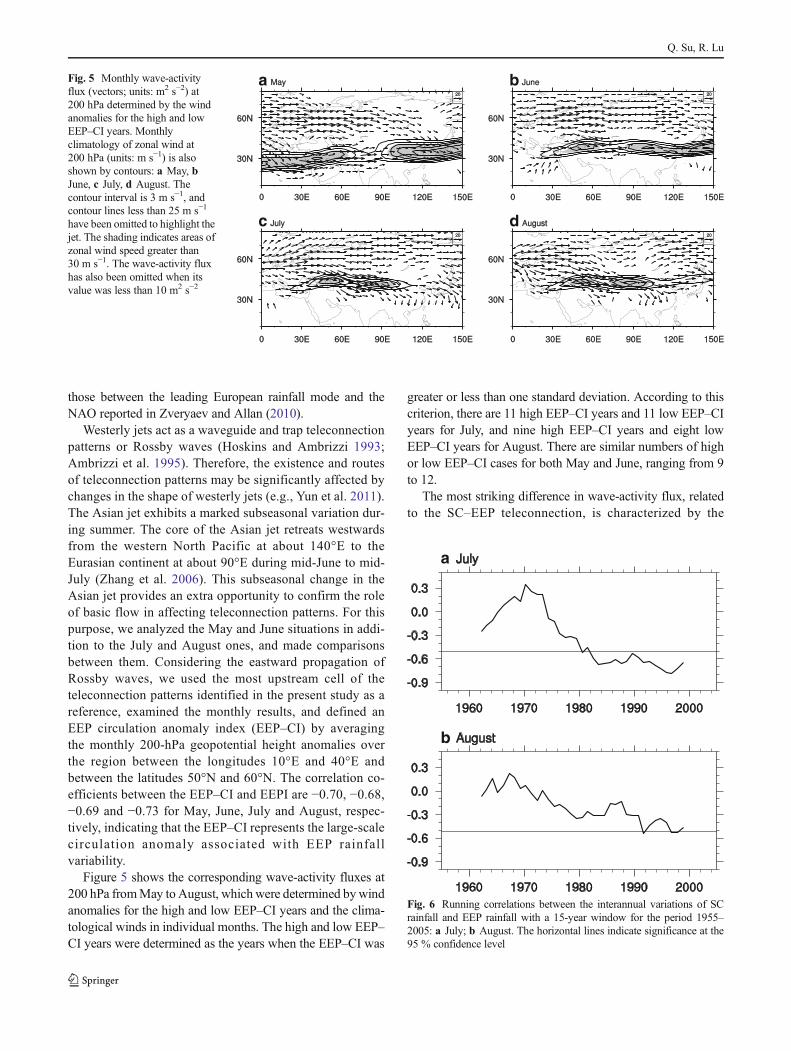
Figure 5 shows the corresponding wave-activity fluxes at200 hPa fromMay toAugust, whichwere determined bywindanomalies for the high and low EEP–CI years and the clima-tological winds in individual months. The high and low EEP–CI years were determined as the years when the EEP–CI was
greater or less than one standard deviation. According to thiscriterion, there are 11 high EEP–CI years and 11 low EEP–CIyears for July, and nine high EEP–CI years and eight lowEEP–CI years for August. There are similar numbers of highor low EEP–CI cases for both May and June, ranging from 9to 12.
The most striking difference in wave-activity flux, relatedto the SC–EEP teleconnection, is characterized by the
a
b
Fig. 6 Running correlations between the interannual variations of SCrainfall and EEP rainfall with a 15-year window for the period 1955–2005: a July; b August. The horizontal lines indicate significance at the95 % confidence level
a
c d
bFig. 5 Monthly wave-activityflux (vectors; units: m2 s−2) at200 hPa determined by the windanomalies for the high and lowEEP–CI years. Monthlyclimatology of zonal wind at200 hPa (units: m s−1) is alsoshown by contours: a May, bJune, c July, d August. Thecontour interval is 3 m s−1, andcontour lines less than 25 m s−1
have been omitted to highlight thejet. The shading indicates areas ofzonal wind speed greater than30 m s−1. The wave-activity fluxhas also been omitted when itsvalue was less than 10 m2 s−2
Q. Su, R. Lu
different routes of wave-activity flux over China betweenMay–June and July–August. The wave-activity flux passeseastwards into the western Pacific inMay and June, but curvessouthwards in China and towards SC in July and August. Thismonthly difference in the route of wave-activity flux can beexplained by the subseasonal change in the Asian jet. TheAsian westerly jet is strong over East Asia and the westernPacific in May and June, with the core of the jet locating overthe western Pacific (Fig. 5a and b). By contrast, the Asian jet isgreatly weakened over East Asia in July and August in com-parison with May and June, and shrinks significantly west-wards onto the Tibetan Plateau (Fig. 5c and d). Thissubseasonal change in the Asian jet is consistent with Zhanget al. (2006). The significant weakness of zonal wind overEast Asia deprives the Asian jet of its role in trapping station-ary Rossby waves along it in July and August, and thusRossby waves may escape from the Asian jet over East Asiaand extend into SC. The southward propagation of Rossbywaves over East Asia, rather than northward propagation, is inagreement with Kosaka and Nakamura (2006), who indicateda southward wave-activity flux in the upper troposphere overEast Asia.
This difference in the route of wave-activity flux betweenMay–June and July–August can provide another reason forthe SC–EEP rainfall relationship being significant in July andAugust, but not in May and June. Actually, the correlationcoefficients between the SCI and EEPI are −0.04 and −0.02for May and June, respectively, implying independence be-tween SC and EEP rainfall variations for these 2 months.
The common feature among the months is that the wave-activity flux enters southwards into the Asian jet roughlyover the Mediterranean region and Middle East, and thenmoves along the jet. This confirms the role of the Asian jetas a waveguide.
4 The interdecadal change of relationshipbetween the interannual variations
It can be seen from Table 1 that most of the years with anevident negative SCI–EEPI relationship appear after the mid-1970s. There are only eight cases from the period 1955–1975,but 23 cases from the period 1976–2005. The possibility foran inverse relationship is much lower for the former period,even considering that the latter period comprises more years(30 years) than the former period (21 years). This implies thatthe relationship between interannual variations of SC and EEPrainfall might experience interdecadal change.
Figure 6 confirms the existence of interdecadal change inthe SC–EEP rainfall relationship. An evident interdecadalchange in the relationship between the interannual variationsof SC and EEP rainfall occurs in the mid-1970s for both Julyand August. For July, a weak SCI–EEPI relationship is foundbefore the mid-1970s: negative before the mid-1960s andpositive from the mid-1960s to the mid-1970s. However, therelationship remains negative after the mid-1970s, becomesstrengthened until about 1982, after which it remains stableand becomes statistically significant. For August, the correla-tion coefficients are close to zero before the mid-1970s, while
Table 2 Correlation coefficients between the interannual variations ofSC and EEP rainfall during the periods 1955–1975 and 1976–2005
1955–1975 1976–2005
July −0.01 −0.65August −0.12 −0.40
The correlation coefficients that appear in bold are significant at the 95 %confidence level
a
c d
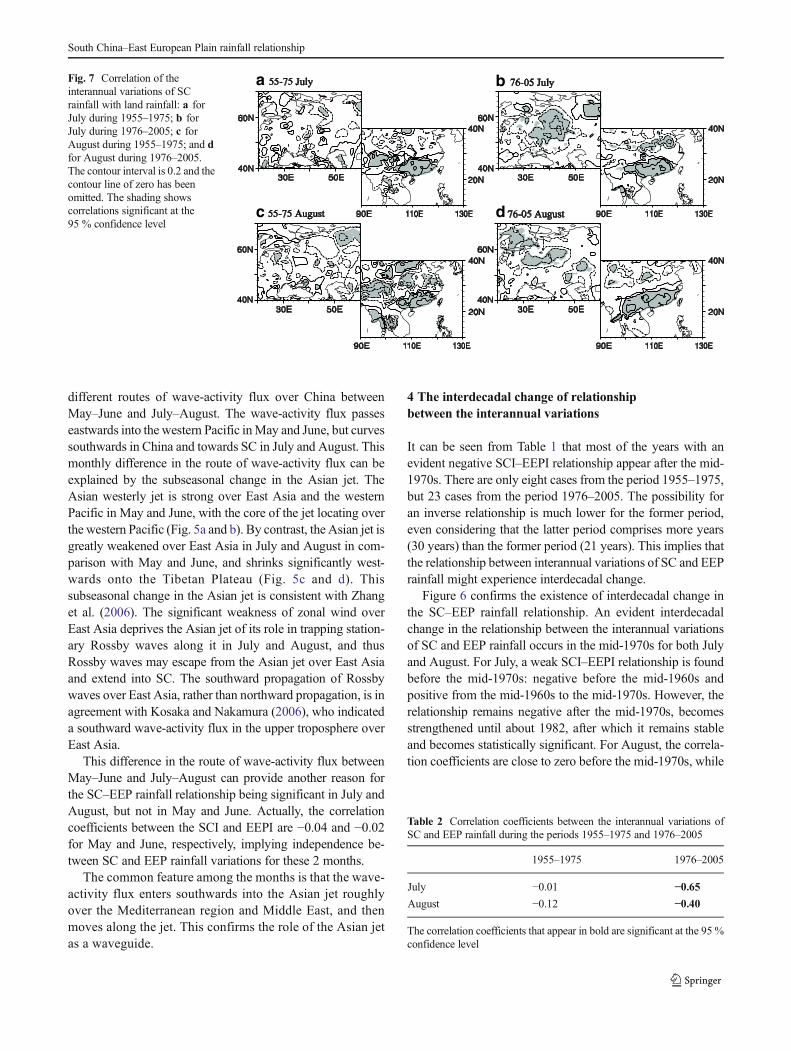
bFig. 7 Correlation of theinterannual variations of SCrainfall with land rainfall: a forJuly during 1955–1975; b forJuly during 1976–2005; c forAugust during 1955–1975; and dfor August during 1976–2005.The contour interval is 0.2 and thecontour line of zero has beenomitted. The shading showscorrelations significant at the95 % confidence level
South China–East European Plain rainfall relationship
a negative relationship appears and becomes stronger after thelate 1980s.
We divided the analysis period into two parts, 1955–1975and 1976–2005, to facilitate the comparison between weakand strong relationships. The dividing point was selected as1975/1976, since the 15-year running correlation coefficientsbecome stable and strong after 1983 for July. The stable andnegative relationship seems to appear a couple of years earlierfor August. However, a slight modification in the dividingpoint does not change the present conclusions.
Figure 7 shows the correlation coefficients between the SCIand rainfall over land for these two periods, respectively. It isevident that SC rainfall is negatively correlated to EEP rainfallin the period 1976–2005, but a significant relationship cannotbe detected between them in the period 1955–1975. In theperiod 1976–2005, the patterns of the correlation coefficientsin both July and August (Fig. 7b and d) are similar to thoseduring 1955–2005 (Fig. 1). The correlation coefficients be-tween the interannual variations of SCI and EEPI are −0.65 forJuly and −0.40 for August in this period (Table 2), significantat the 95 % confidence level. In contrast, in the period 1955–1975, there are hardly any areas of significant correlationcoefficient over the EEP (Fig. 7a and c). The correlationcoefficients between the SCI and EEPI are −0.01 for Julyand −0.12 for August. The relationship is quite weak in thisperiod. Thus, the inverse relationship in rainfall is contributedto mainly by the latter period.
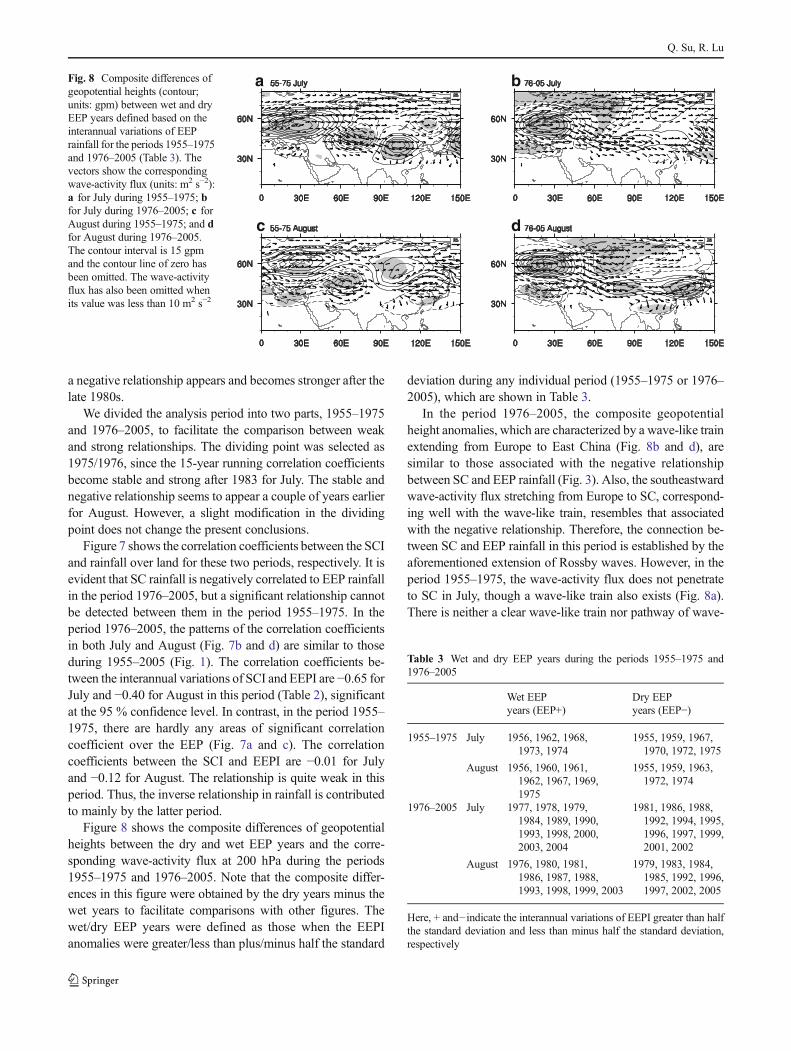
Figure 8 shows the composite differences of geopotentialheights between the dry and wet EEP years and the corre-sponding wave-activity flux at 200 hPa during the periods1955–1975 and 1976–2005. Note that the composite differ-ences in this figure were obtained by the dry years minus thewet years to facilitate comparisons with other figures. Thewet/dry EEP years were defined as those when the EEPIanomalies were greater/less than plus/minus half the standard
deviation during any individual period (1955–1975 or 1976–2005), which are shown in Table 3.
In the period 1976–2005, the composite geopotentialheight anomalies, which are characterized by a wave-like trainextending from Europe to East China (Fig. 8b and d), aresimilar to those associated with the negative relationshipbetween SC and EEP rainfall (Fig. 3). Also, the southeastwardwave-activity flux stretching from Europe to SC, correspond-ing well with the wave-like train, resembles that associatedwith the negative relationship. Therefore, the connection be-tween SC and EEP rainfall in this period is established by theaforementioned extension of Rossby waves. However, in theperiod 1955–1975, the wave-activity flux does not penetrateto SC in July, though a wave-like train also exists (Fig. 8a).There is neither a clear wave-like train nor pathway of wave-
Table 3 Wet and dry EEP years during the periods 1955–1975 and1976–2005
Wet EEPyears (EEP+)
Dry EEPyears (EEP−)
1955–1975 July 1956, 1962, 1968,1973, 1974
1955, 1959, 1967,1970, 1972, 1975
August 1956, 1960, 1961,1962, 1967, 1969,1975
1955, 1959, 1963,1972, 1974
1976–2005 July 1977, 1978, 1979,1984, 1989, 1990,1993, 1998, 2000,2003, 2004
1981, 1986, 1988,1992, 1994, 1995,1996, 1997, 1999,2001, 2002
August 1976, 1980, 1981,1986, 1987, 1988,1993, 1998, 1999, 2003
1979, 1983, 1984,1985, 1992, 1996,1997, 2002, 2005
Here, + and−indicate the interannual variations of EEPI greater than halfthe standard deviation and less than minus half the standard deviation,respectively
a b
dc
Fig. 8 Composite differences ofgeopotential heights (contour;units: gpm) between wet and dryEEP years defined based on theinterannual variations of EEPrainfall for the periods 1955–1975and 1976–2005 (Table 3). Thevectors show the correspondingwave-activity flux (units: m2 s−2):a for July during 1955–1975; bfor July during 1976–2005; c forAugust during 1955–1975; and dfor August during 1976–2005.The contour interval is 15 gpmand the contour line of zero hasbeen omitted. The wave-activityflux has also been omitted whenits value was less than 10 m2 s−2
Q. Su, R. Lu
activity flux from Europe to East China in August (Fig. 8c).The wave-activity flux shows an evident break around 90°Efor August. Thus, these circulation anomalies and wave-activity flux provide dynamical evidence for the strongerinverse relationship in rainfall during the period 1976–2005and weaker relationship during the period 1955–1975.
The interdecadal change in jet location around the mid-1970s might be responsible for the above-mentioned changesin teleconnections and wave-activity flux. Zhang and Huang(2011) indicated that the East Asian jet axis has moved south-ward in July and August since the end of 1970s. This south-ward shift of the East Asian jet may be helpful for the exten-sion of Rossby waves into SC and a resultant closer SC–EEPrainfall teleconnection. Furthermore, it should be noted thatthere are various factors affecting both SC rainfall and EEPrainfall. The effects of these factors on rainfall may exhibit ainterdecadal change, and thus affect the SC–EEP rainfallrelationship on the decadal timescale. For instance, Wu et al.(2012) indicated that the sea surface temperatures in thetropical Pacific and Indian Ocean have an opposite impacton SC rainfall before and after 1970s. More studies may benecessary to better gain a understanding of the interdecadalchange in the SC–EEP rainfall relationship.
5 Conclusions
The relationship between rainfall anomalies over SC and EEPin July and August and the possible reasons for the relation-ship have been revealed by using observational and reanalysisdata for the period 1951–2009. The results showed that SCrainfall and EEP rainfall are significantly and negatively re-lated. The correlation coefficients between the SCI and EEPI,which were used to represent rainfall anomalies over theseremote regions, were −0.42 for July and −0.35 for August, allsignificant at the 95 % confidence level. These correlationcoefficients were only slightly modified, being −0.44 for Julyand −0.31 for August, when interannual components— afterremoving interdecadal components — were used for thecalculation.
Analysis of the circulation anomalies and wave-activityflux indicated that the connection of interannual rainfallanomalies between SC and the EEP can be attributed to theextension of stationary Rossby waves in the mid-high lati-tudes in the upper troposphere for both July and August. Thereis a wave-like train of circulation anomalies and a pathway ofwave-activity flux stretching from Europe to East China,linking the anticyclonic anomaly over Europe and the cyclon-ic anomaly over central and southern China, which are re-sponsible for less EEP rainfall and more SC rainfall, respec-tively. In addition, the anticyclonic anomaly over Europe isassociated with the summer NAO.
This wave-like pattern responsible for the SC–EEP rainfallrelationship is, to some extent, determined by the shape of theAsian westerly jet, which can play a role as a waveguide. TheRossby wave is trapped in the Asian jet and penetrates west-wards along it into the western North Pacific inMay and June,and thus does not lead to an inverse relationship between SCand EEP rainfall. When the core of the Asian jet shifts west-wards and the Asian jet is weakened over East Asia in July andAugust, the jet’s ability to trap the Rossby wave wanes, andthus the Rossby wave may escape from the jet over East Asiaand extend southwards into central and southern China.
It was further found that the relationship between theinterannual variations of SC rainfall and EEP rainfall experi-ences an interdecadal change around the mid-1970s for bothmonths. The correlation coefficients were calculated as −0.65for July and −0.40 for August in the period 1976–2005, allsignificant at the 95 % confidence level, but were −0.01 forJuly and −0.12 for August in the period 1955–1975. Thecirculation anomalies and wave-activity flux for these twoperiods indicated that there was an extension of stationaryRossby waves from Europe to East China during the period1976–2005, but not during the period 1955–1975, providing adynamical explanation for the interdecadal change in interan-nual relationship between SC and EEP rainfall.
Acknowledgements This study was supported by the National BasicResearch Program of China (grant no. 2010CB950403).
References
Ambrizzi T, Hoskins BJ, Hsu H-H (1995) Rossby wave propagation andteleconnection patterns in the austral winter. J Atmos Sci 52(21):3661–3672
Barnston AG, Livezey RE (1987) Classification, seasonality and persis-tence of low-frequency atmospheric circulation patterns. MonWeather Rev 115:1083–1126
Blade I, Liebmann B, Fortuny D, van Oldenborgh GJ (2012) Observed andsimulated impacts of the summer NAO in Europe: implications forprojected drying in the Mediterranean region. Clim Dyn 39:709–727
Chen GS, Huang RH (2012) Excitationmechanisms of the teleconnectionpatterns affecting the July precipitation in Northwest China. J Clim25:7834–7851
Chen J, Wu R, Wen Z (2012) Contribution of South China Sea tropicalcyclones to an increase in southern China summer rainfall around1993. Adv Atmos Sci 29(3):585–598
Ding QH, Wang B, Wallace JM, Branstator G (2011) Tropical–extratropical teleconnections in boreal summer: observed interannu-al variability. J Clim 24(7):1878–1896
Enomoto T, Hoskins BJ, Matsuda Y (2003) The formation mechanism ofthe Bonin high in August. Q J R Meteorol Soc 129:157–178
Folland CK, Knight J, Linderholm HW, Fereday D, Ineson S, Hurrell JW(2009) The summer North Atlantic Oscillation: past, present, andfuture. J Clim 22:1082–1103
Harris, I., Jones P. D., Osborn T. J., Lister D. H. (2013) Updated high-resolution grids of monthly climatic observations–the CRU TS3.10Dataset. Int. J. Climatol. doi: 10.1002/joc.3711. in press.
South China–East European Plain rainfall relationship
Hoskins BJ, Ambrizzi T (1993) Rossby-wave propagation on a realisticlongitudinally varying low. J Atmos Sci 50(12):1661–1671
Iwao K, Takahashi M (2008) A precipitation seesaw mode betweennortheast Asia and Siberia in summer caused by Rossby waves overthe Eurasian continent. J Clim 21:2401–2419
Iwasaki H, Nii T (2006) The break in the mongolian rainy season and itsrelation to the stationary rossby wave along the Asian jet. J Clim 19:3394–3405
Kalnay E, Kanamitsu M, Kistler R, Collins W, Deaven D, Gandin L,Iredell M, Saha S, White G, Woollen J, Zhu Y, Chelliah M,Ebisuzaki W, Higgins W, Janowiak J, Mo KC, Ropelewski C,Wang J, Leetmaa A, Reynolds R, Jenne R, Joseph D (1996) TheNCEP/NCAR 40-year reanalysis project. Bull Am Meteorol Soc77(3):437–471
Kosaka Y, Nakamura H (2006) Structure and dynamics of the summer-time Pacific–Japan teleconnection pattern. Q J R Meteorol Soc 132:2009–2030
Kosaka Y, Nakamura H, Watanabe M, Kimoto M (2009) Analysis on thedynamics of a wave-like teleconnection pattern along the summer-time Asian jet based on a reanalysis dataset and climate modelsimulations. J Meteorol Soc Jpn 87(3):561–580
Kwon M, Jhun JG, Ha KJ (2007) Decadal change in east Asian summermonsoon circulation in the mid-1990s. Geophys Res Lett 34,L21706. doi:10.1029/2007GL031977
Liang F, Tao SY, Wei J, Bueh C (2011) Variation in summer rainfall inNorth China during the period 1956–2007 and links with atmo-spheric circulation. Adv Atmos Sci 28(2):363–374
Liu Y, Huang G, Huang R (2011) Inter-decadal variability of summerrainfall in Eastern China detected by the Lepage test. Theor ApplClimatol 106:481–488. doi:10.1007/s00704-011-0442-8
Lu RY, Oh JH, Kim BJ (2002) A teleconnection pattern in upper-levelmeridional wind over the North African and Eurasian continent insummer. Tellus Ser A 54:44–55
Lupo AR, Mokhov II, Akperov MG, Chernokulsky AV, Athar H (2012)A dynamical analysis of the role of the planetary- and synoptic-scalein the summer of 2010 blocking episodes over the European part ofRussia. Advances in Meteorology, Article ID 584257. doi:10.1155/2012/584257
Mokhov II (2011) Specific features of the 2010 summer heat formation in theEuropean territory of Russia in the context of general climate changesand climate anomalies. Izv. Atmos Ocean Phys 47(6):709–716
Moon J-Y, Wang B, Ha K-J, Lee J-Y (2013) Teleconnections associatedwith Northern Hemisphere summer monsoon intraseasonal oscilla-tion. Clim Dyn 40:2761–2774
Sato N, Takahashi M (2006) Dynamical processes related to the appear-ance of quasi-stationary waves on the subtropical jet in the midsum-mer Northern Hemisphere. J Clim 19:1531–1544
Schneidereit A, Schubert S, Vargin P, Lunkeit F, Zhu XH, Peters DHW,Fraedrich K (2012) Large-scale flow and the long-lasting blocking
high over Russia: summer 2010. Mon Weather Rev 140(9):2967–2981
Semenov VA, Mokhov II, Latif M (2012) Influence of the ocean surfacetemperature and sea ice concentration on regional climate changes inEurasia in recent decades. Izv. Atmos Ocean Phys 48(4):403–421
Su, Q., Lu R. Y., Li C. F. (2013) Large-scale circulation anomaliesassociated with interannual variation in monthly rainfall overSouth China from May to August. Adv. Atmos. Sci. doi: 10.1007/s00376-013-3051-x, in press.
Sui Y, Jiang D, Tian Z (2013) Latest update of the climatology andchanges in the seasonal distribution of precipitation over China.Theor Appl Climatol 113:599–610. doi:10.1007/s00704-012-0810-z
Sun JQ,Wang HJ (2012) Changes of the connection between the summerNorth Atlantic Oscillation and the East Asian summer rainfall. JGeophys Res 117, D08110. doi:10.1029/2012JD017482
Sun JQ, Wang HJ, Yuan W (2008) Decadal variations of the relationshipbetween the summer North Atlantic Oscillation and middle EastAsian air temperature. J Geophys Res 113, D15107. doi:10.1029/2007JD009626
Takaya K, Nakamura H (1997) A formulation of a wave-activity flux forstationary Rossby waves on a zonally varying basic flow. GeophysRes Lett 24(23):2985–2988
Wakabayashi S, Kawamura R (2004) Extraction of major teleconnectionpatterns possibly associated with the anomalous summer climate inJapan. J Meteorol Soc Jpn 82(6):1577–1588
Wu R, Wen Z, Yang S, Li Y (2010) An interdecadal change insouthern China summer rainfall around 1992/93. J Clim 23:2389–2403
Wu R, Yang S, Wen Z, Huang G, Hu K (2012) Interdecadal change in therelationship of southern China summer rainfall with tropical Indo-Pacific SST. Theor Appl Climatol 108:119–133
Yasui S, Watanabe M (2010) Forcing processes of the summertimecircumglobal teleconnection pattern in a dry AGCM. J Clim 23:2093–2114
Ye H, Lu RY (2012) Dominant patterns of summer rainfall anomalies inEast China during 1951–2006. Adv Atmos Sci 29(4):695–704
Yun KS, Kim SY, Ha KJ, Watanabe M (2011) Effects of subseasonalbasic state changes on Rossby wave propagation during northernsummer. J Geophys Res 116, D24102. doi:10.1029/2011JD016258
Zhang Y, Huang D (2011) Has the East Asian westerly jet experienced apoleward displacement in recent decades? Adv Atmos Sci 28(6):1259–1265
Zhang Y, Kuang X, Guo W, Zhou T (2006) Seasonal evolution of theupper-tropospheric westerly jet core over East Asia. Geophys ResLett 33, L11708. doi:10.1029/2006GL026377
Zveryaev II, Allan RP (2010) Summertime precipitation variability overEurope and its links to atmospheric dynamics and evaporation. JGeophys Res 115, D12102. doi:10.1029/2008JD011213
Q. Su, R. Lu