Embed Size (px)
Citation preview
Eur. J. Biochem. 126, 263-269 (1982) 0 FEBS 1982
Temperature Dependence of ADP/ATP Translocation in Mitochondria
Martin KLINCENBERG, Karin GREBE, and Maria APPEL
Institut fur Physikalische Biochemie der Universitat Munchen
(Received March 10 /May 25, 1982)
The temperature dependence of the adenine nucleotide exchange in mitochondria has been determined by employing a rapid mixing, quenching and sampling apparatus and the inhibitor quench-back exchange method. Thus the exchange is resolved down to 0.1 s. Rates are evaluated from accumulating the time-dependent progress at about 10 points.
The exchange rate in liver mitochondria was determined from - 10 "C to + 10 "C in the presence of 20 % glycol, from 0 "C to 25 "C, and from 20 "C to 40 "C under partial inhibition by carboxyatractylate. The total range between - 10 "C to f 4 0 "C has only one temperature break at 13 "C. From the Arrhenius plot between - 10 "C to + 13 "C, EA zz 140 kJ and above 13 "C, EA z 56 kJ is evaluated, corresponding to a Q,, of 8 and 2 respectively.
In beef heart mitochondria the exchange rate was measured between 0 "C and 20 "C, and between 15 "C and 30 "C under partial inhibition with carboxyatractylate. There is a temperature break around 14°C with EA z 143 kJ between 0 "C and 14 "C and EA
The extrapolated translocation rates at 37 "C are 500 and 1800 pmol min- (gprotein)- for rat liver and for beef heart mitochondria respectively.
The temperature break is suggested to reflect a conformation change since there is no reversed break at low temperature, the temperature break changes in sonic particles and no lipid phase transition at 14 "C in mitochondria has been reported.
60 kJ from 15 "C to 30 "C.
The adenine nucleotide translocation in mitochondria has earlier been shown to be highly temperature-dependent [l]. However, the previously published data have several shortcom- ings. Although obtained with the relatively rapid inhibitor stop method, they cover only the time range between 0 "C and 20 "C and are mainly extrapolated rates, not including initial time data. Since there is no method of continuously recording the exchange, one has to rely on cumbersome sampling and separation of the mitochondria.
The development of new rapid-sampling methods in com- bination with the fully automated control of mixing, sampling and quenching has permitted the resolution of the exchange kinetics down to 0.1 s. Thus the rate measurements could be extended up to about 40 "C.
It seems important to publish these data, which were collected some years ago and which, we believe, are today the best available on the rate of the ADP/ATP exchange. In view of the central role of ADP/ATP translocation they should fill an important gap felt in the evaluation of metabolic data. Attention is also focused in the existence of a temperature break and its possible implication in lipid phase transition of the mitochondrial membrane.
MATERIALS AND METHODS
The determination of the ADP/ATP exchange rate was based on the inhibitor stop method combined with a back- exchange [2]. In this method the intramitochondrial adenine nucleotides are first labeled with 3H or 14C and for the actual exchange experiments the efflux of radioactive label was measured on addition of external ADP and ATP. The time course of exchange is followed by discrete sampling and by stopping the exchange on addition of excess carboxy- atractylate.
The time available for following the exchange is determined by the limited size of the intramitochondrial nucleotide pool and the rate of the exchange. At higher temperature the exchange rate is so rapid that the half-time until equilibration may be less than one second. Therefore, only rapid mixing and sampling techniques as provided by 'RAMQUESA' (see below), with resolution of less than 0.1 s, permit determination of the translocation rate of the adenine nucleotide in mitochon- dria under these conditions.
Mitochondria were isolated from rat liver or from beef heart according to the usual procedures. The stock solutions containing about 40 mg protein/ml were mixed with undiluted commercial [14C]ADP, [3H]ADP, [14C]ATP or [3H]ATP (15000 dis. min- mg protein- *) at 0 "C for 60 min in order to label the endogenous nucleotides fully. The mitochondria were then diluted 20-fold and centrifuged in order to remove residual external labeled nucleotides. The label is equally distributed among endogenous ATP, ADP and AMP, independently, whether labeled ADP or ATP are added. For the exchange experiments about 6 ml incubation medium, consisting of 0.25 M sucrose, 20 mM Tris, pH 7.2, with addition in some instances of 2 mM succinate and 2 mM glutamate, 2 mM Pi, are filled into the thermostated reaction chamber of RAMQUESA. After the medium has assumed the set tempera- ture about 6 mg mitochondria1 protein are added.
Immediately before the exchange reaction, 1 ml is sampled from the reaction vessel and injected into 0.2 m14 M HClO, for analysis of the intramitochondrial nucleotide pattern (see below). The moving-mixing chamber with the syringe filled with 10 mM ADP solution is placed on top of the reaction vessel and a first sample is ejected, giving the zero value. Then the rapid mixing and automated sampling sequence is actuated. After the last sample the temperature in the reaction vessel is checked again and this value is taken as the actual reaction temperature.
264
1 time
processor delay
Fig. 1. Tlie rapid-mixinx-sampling and Quenching uppuratus ( R A M Q U E S A ) . A. The mechanical design. B. Block scheme of the preprogrammable apparatus. 1 Moving mixing chamber, 2 reaction chamber, 3 circulating fluid, 4 rapid valve, 5 rapid valve step motor, 6 quenching fluid vessel, 7 quenching Auid valve, 8 quench mixing chamber, 9 motor, 10 sample vessel holder, I I sample change motor, 12 sample cups
The quenching fluid contained 150 pM carboxyatractylate such that the final concentration after quenching is about 50 pM. Immediately after sampling, the cups are centrifuged at 0°C for 10 min at about 7000 x g in a microcentrifuge to which the rotary holder of the collecting cups is fitted. From the supernatant 200 p1 are withdrawn and injected into the acid scintillation fluid for counting. One final sample is not centrifuged and gives the total radioactivity.
The nucleotide pattern, i. e. the relative distribution of radioactive ATP, ADP and AMP of the endogenous nucleotide pool, is determined by small-column anion-exchange chroma- tography, in a similar way to that described previously [3]. The content of nucleotides, and thus the size of the intramitochon- drial adenine nucleotide pool, is determined in the extracts by enzymatic analysis.
Rapid Mixing, Quenching, Sampling Apparatus (RAMQUESA)
A scheme of the apparatus and of the programmable controls is given in Fig. 1. The apparatus has been constructed at this institute in collaboration with Hubert Nakel, Hans Berger and Werner Oellerer (see also [4]). The working principle is to sample aliquots at discrete times during reaction. For this purpose the apparatus is equipped with a rapid mixing device (moving-mixing chamber) for starting the reaction, a thermostatic reaction vessel, rapid frictionless valves, a second mixing chamber for quenching before injection into a series of reaction vessels. The moving-mixing chamber is based on a device developed earlier for making a rapid addition into optical cuvettes [5]. It consists of a syringe filled with a starting reactant and a mixing disk with about 15 inclined holes which is fitted to the cylindrical reaction vessel. For distributing the reactant the disk has two channels with small holes facing downwards which are connected by a flexible teflon tube to the
syringe. The plunger of the syringe and the disk are connected by two steel bars such that, on pushing the plunger, simul- taneously the mixing disk moves through the reaction fluid dispensing the reactant and squeezing with high turbulance the reaction mixture through the skewed holes. The plunger is actuated by air pressure and mixing rates of down to 20 ms are attained. The mixing apparatus is easily bolted down airtight on top of the reaction vessel by a special lever device.
The reaction fluid in the reaction vessel is under air or N2 pressure of about 0.5 bar (50 kPa). The walls of the cylindrical reaction vessels are made of precision glass and are carefully thermostated. From the thermostated bottom of the reaction vessel a duct leads to a valve which is designed to move with high speed and without friction by closing against a small O-ring. The pinion of the valve is moved by a rapid stepping motor, achieving opening and closing in less than 10 ms. Thus almost rectangular opening periods of 2 ms may be obtained to assure equal sizes of sample volumes. The reaction mixture then passes through a circular four-jet mixing-quenching chamber wbch serves for the rapid addition of the quenching fluid. This quenching reagent, stored in a thermostated quenching fluid vessel, is dispensed by another frictionless valve driven by a stepping motor. It opens and closes 2 ms within the time of the sample valve. The quenching volume is added at a ratio of about 0.5 to the sampling volume. The quenched mixture is then injected into the collecting cups which are in a holder accepting 12 cups. This holder has the shape of a centrifuge head, slides out easily and may be placed into an adapted Eppendorf microfuge. The sample holder disk is equipped with brakes in order to prevent overshoot on moving to the next sample. The injection tip is devised such as to avoid splashing of the ejected fluid from the sampling vessel.
The size of the cylindrical reaction chamber is about 15 ml and in most applications 8 ml reaction fluid is used. The volume of the added fluid is about 0.25 ml and the size of the samples
265
1.0 - ( A f R a t : 27'C - v - - - ? - rn 0 -
- T
0 1 2 3 4 5 6 Time (s)
0.06
0.04 t
0.02 f
(B) Beef: 13OC .:'
. *
A'
w.
?.' vT=143.7 p n o l min-' (g protein).'
i ... 0 is....
: :. 1.0 2.0 3.0
Time (s)
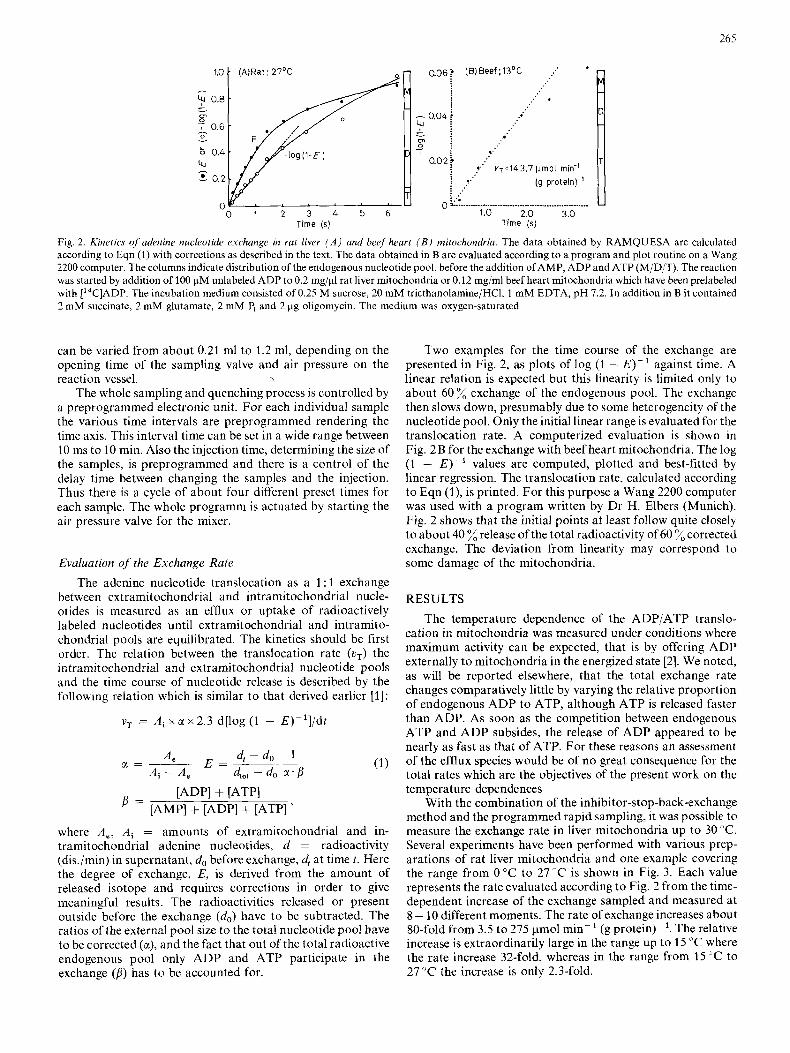
Fig. 2. Kinetics of adenine nucleotide exchange in rat liver ( A ) and beef heart ( B ) mitochondria. The data obtained by RAMQUESA are calculated according to Eqn (1) with corrections as described in the text. The data obtained in B are evaluated according to a program and plot routine on a Wang 2200 computer. The columns indicate distribution of the endogenous nucleotide pool, before the addition of AMP, ADP and ATP (M/D/T). The reaction was started by addition of 100 pM unlabeled ADP to 0.2 mg/pl rat liver mitochondria or 0.12 mg/ml beef heart mitochondria which have been prelabeled with [I4C]ADP. The incubation medium consisted of 0.25 M sucrose, 20 mM triethanolamine/HCl, 1 mM EDTA, pH 7.2. In addition in B it contained 2 mM succinate, 2 mM glutamate, 2 mM Pi and 2 pg oligomycin. The medium was oxygen-saturated
can be varied from about 0.21 ml to 1.2 ml, depending on the opening time of the sampling valve and air pressure on the reaction vessel. \
The whole sampling and quenching process is controlled by a preprogrammed electronic unit. For each individual sample the various time intervals are preprogrammed rendering the time axis. This interval time can be set in a wide range between 10 ms to 10 min. Also the injection time, determining the size of the samples, is preprogrammed and there is a control of the delay time between changing the samples and the injection. Thus there is a cycle of about four different preset times for each sample. The whole programm is actuated by starting the air pressure valve for the mixer.
Evaluation of the Exchange Rate The adenine nucleotide translocation as a 1 : 1 exchange
between extramitochondrial and intramitochondrial nucle- otides is measured as an efflux or uptake of radioactively labeled nucleotides until extramitochondrial and intramito- chondrial pools are equilibrated. The kinetics should be first order. The relation between the translocation rate (uT) the intramitochondrial and extramitochondrial nucleotide pools and the time course of nucleotide release is described by the following relation which is similar to that derived earlier [I]:
V , = Ai x a x 2.3 d[log (1 - E)-']/dt
d, - d o 1 dt,, - do a. P
E = _____ A, Aj - A,
a=---
[ADPI + [ATPI = [AMP] + [ADP] + [ATP] '
where A,, Ai = amounts of extramitochondrial and in- tramitochondrial adenine nucleotides, d = radioactivity (dis./min) in supernatant, do before exchange, d, at time t . Here the degree of exchange, E, is derived from the amount of released isotope and requires corrections in order to give meaningful results. The radioactivities released or present outside before the exchange (do) have to be subtracted. The ratios of the external pool size to the total nucleotide pool have to be corrected (a), and the fact that out of the total radioactive endogenous pool only ADP and ATP participate in the exchange (p) has to be accounted for.
Two examples for the time course of the exchange are presented in Fig. 2, as plots of log (1 - E)-' against time. A linear relation is expected but this linearity is limited only to about 60% exchange of the endogenous pool. The exchange then slows down, presumably due to some heterogeneity of the nucleotide pool. Only the initial linear range is evaluated for the translocation rate. A computerized evaluation is shown in Fig. 2 B for the exchange with beef heart mitochondria. The log (1 - E)-' values are computed, plotted and best-fitted by linear regression. The translocation rate, calculated according to Eqn (l), is printed. For this purpose a Wang 2200 computer was used with a program written by Dr H. Elbers (Munich). Fig. 2 shows that the initial points at least follow quite closely to about 40 % release of the total radioactivity of 60 %corrected exchange. The deviation from linearity may correspond to some damage of the mitochondria.
RESULTS The temperature dependence of the ADP/ATP translo-
cation in mitochondria was measured under conditions where maximum activity can be expected, that is by offering ADP externally to mitochondria in the energized state [2]. We noted, as will be reported elsewhere, that the total exchange rate changes comparatively little by varying the relative proportion of endogenous ADP to ATP, although ATP is released faster than ADP. As soon as the competition between endogenous ATP and ADP subsides, the release of ADP appeared to be nearly as fast as that of ATP. For these reasons an assessment of the efflux species would be of no great consequence for the total rates which are the objectives of the present work on the temperature dependences
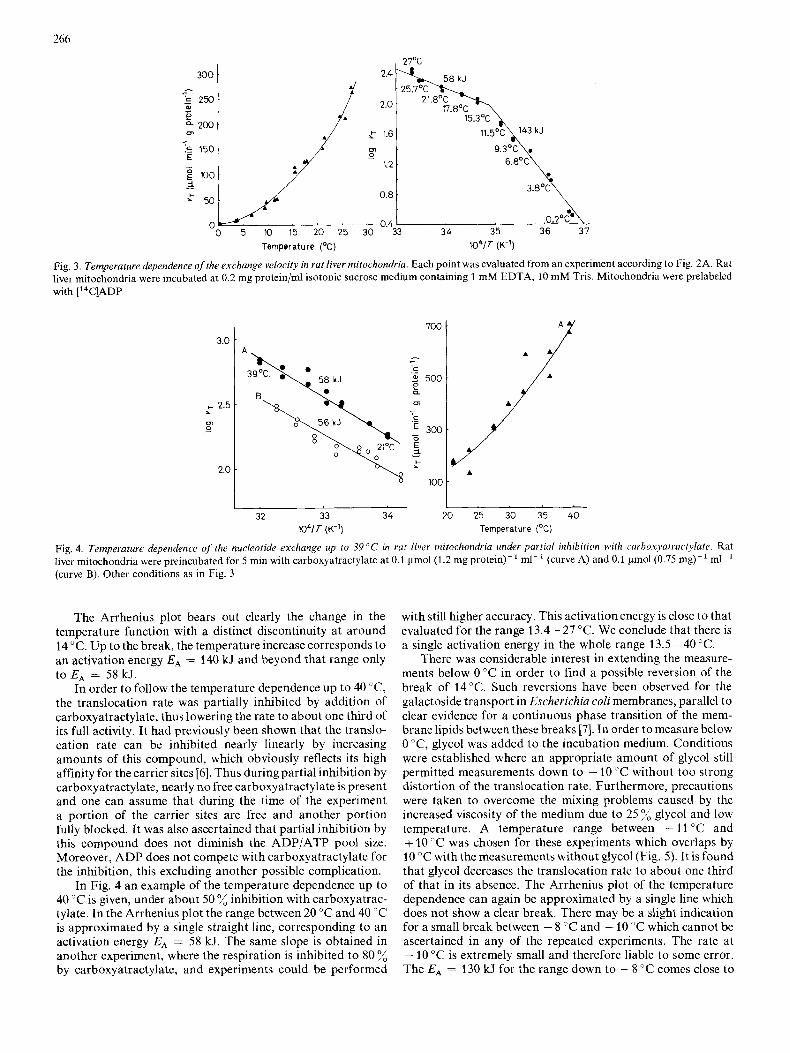
With the combination of the inhibitor-stop-back-exchange method and the programmed rapid sampling, it was possible to measure the exchange rate in liver mitochondria up to 30 "C. Several experiments have been performed with various prep- arations of rat liver mitochondria and one example covering the range from 0°C to 27°C is shown in Fig. 3. Each value represents the rate evaluated according to Fig. 2 from the time- dependent increase of the exchange sampled and measured at 8 - 10 different moments. The rate of exchange increases about 80-fold from 3.5 to 275 pmol min- (g protein)- '. The relative increase is extraordinarily large in the range up to 15 "C where the rate increase 32-fold, whereas in the range from 15 "C to 27 "C the increase is only 2.3-fold.
266
2 7 T 300 1 2.4
2.0
1.6
1.2
0.0
0.4
Temperature ("C)
I 34 35 36 37
Fig. 3. Temperature dependence of the exchange velocity in rat liver mitochondria. Each point was evaluated from an experiment according to Fig. 2A. Rat liver mitochondria were incubated at 0.2 mg protein/ml isotonic sucrose medium containing 1 mM EDTA, 10 mM Tris. Mitochondria were prelabeled with [14C]ADP
700 t
1 1 32 33 34 2 0 25 30 35 40
1041 r (K-1) Temperature ("C)
Fig. 4. Temperature dependence of the nucleotide exchange up to 39 "C in rat liver mitochondria under partial inhibition with carboxyatractylate. Rat liver mitochondria were preincubated for 5 min with carboxyatractylate at 0.1 pmol (1.2 mgprotein)-' ml-' (curve A) and 0.1 pmol (0.75 mg)-' ml-' (curve B). Other conditions as in Fig. 3
The Arrhenius plot bears out clearly the change in the temperature function with a distinct discontinuity at around 14 "C. Up to the break, the temperature increase corresponds to an activation energy EA = 140 kJ and beyond that range only to EA = 58 kJ.
In order to follow the temperature dependence up to 40 "C, the translocation rate was partially inhibited by addition of carboxyatractylate, thus lowering the rate to about one third of its full activity. It had previously been shown that the translo- cation rate can be inhibited nearly linearly by increasing amounts of this compound, which obviously reflects its high affinity for the carrier sites [6]. Thus during partial inhibition by carboxyatractylate, nearly no free carboxyatractylate is present and one can assume that during the time of the experiment a portion of the carrier sites are free and another portion fully blocked. It was also ascertained that partial inhibition by this compound does not diminish the ADPIATP pool size. Moreover, ADP does not compete with carboxyatractylate for the inhibition, this excluding another possible complication.
In Fig. 4 an example of the temperature dependence up to 40 "C is given, under about 50 % inhibition with carboxyatrac- tylate. In the Arrhenius plot the range between 20 "C and 40 'C is approximated by a single straight line, corresponding to an activation energy EA = 58 kJ. The same slope is obtained in another experiment, where the respiration is inhibited to 80 % by carboxyatractylate, and experiments could be performed
with still higher accuracy. This activation energy is close to that evaluated for the range 13.4- 27 "C. We conclude that there is a single activation energy in the whole range 13.5 - 40 "C.
There was considerable interest in extending the measure- ments below 0 "C in order to find a possible reversion of the break of 24°C. Such reversions have been observed for the galactoside transport in Escherichiu coli membranes, parallel to clear evidence for a continuous phase transition of the mem- brane lipids between these breaks [7]. In order tomeasure below 0 "C, glycol was added to the incubation medium. Conditions were established where an appropriate amount of glycol still permitted measurements down to - 10 "C without too strong distortion of the translocation rate. Furthermore, precautions were taken to overcome the mixing problems caused by the increased viscosity of the medium due to 25 % glycol and low temperature. A temperature range between - 11 "C and + 10 "C was chosen for these experiments which overlaps by 10 "C with the measurements without glycol (Fig. 5). It is found that glycol decreases the translocation rate to about one third of that in its absence. The Arrhenius plot of the temperature dependence can again be approximated by a single line which does not show a clear break. There may be a slight indication for a small break between - 8 "C and - 10 "C which cannot be ascertained in any of the repeated experiments. The rate at - 10 "C is extremely small and therefore liable to some error. The EA = 130 kJ for the range down to - 8 "C comes close to
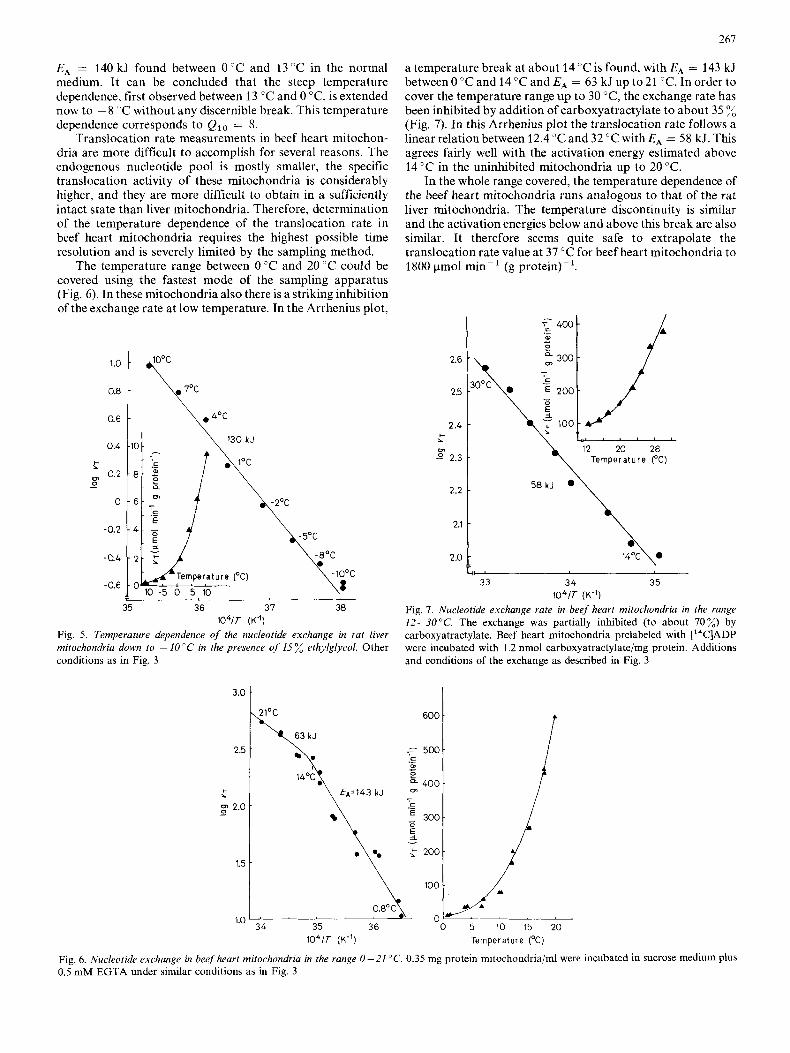
EA = 140 kJ found between 0 "C and 13 "C in the normal medium. It can be concluded that the steep temperature dependence, first observed between 13 "C and 0 "C, is extended now to - 8 "C without any discernible break. This temperature dependence corresponds to QIo = 8.
Translocation rate measurements in beef heart mitochon- dria are more difficult to accomplish for several reasons. The endogenous nucleotide pool is mostly smaller, the specific translocation activity of these mitochondria is considerably higher, and they are more difficult to obtain in a sufficiently intact state than liver mitochondria. Therefore, determination of the temperature dependence of the translocation rate in beef heart mitochondria requires the highest possible time resolution and is severely limited by the sampling method.
The temperature range between 0 "C and 20 "C could be covered using the fastest mode of the sampling apparatus (Fig. 6). In these mitochondria also there is a striking inhibition of the exchange rate at low temperature. In the Arrhenius plot,
1 .o
0.8
0.6
0.4
c
0.2 0 -
0
-0.2
-0.4
-0.6
\*40c
35 36 37 38 i o 4 r (K-1)
Fig. 5. Temperature dependence of the nucleotide exchange in rat liver mitochondria down to - 10 "C in the presence of 15 % ethylglycol. Other conditions as in Fig. 3
140c\=143 kJ
261
a temperature break at about 14 "C is found, with E A = 143 kJ between 0 "C and 14 "C and EA = 63 kJ up to 21 "C. In order to cover the temperature range up to 30 "C, the exchange rate has been inhibited by addition of carboxyatractylate to about 35 % (Fig. 7). In this Arrhenius plot the translocation rate follows a linear relation between 12.4 "C and 32 "C with EA = 58 kJ. This agrees fairly well with the activation energy estimated above 14 "C in the uninhibited mitochondria up to 20 "C.
In the whole range covered, the temperature dependence of the beef heart mitochondria runs analogous to that of the rat liver mitochondria. The temperature discontinuity is similar and the activation energies below and above this break are also similar. It therefore seems quite safe to extrapolate the translocation rate value at 37 "C for beef heart mitochondria to 1800 pmol min-' (g protein)-'.
2.6
25
2.4 c
m 2 2.3
2.2
2.1
2 .o 1 ,
33 3 4 35
Fig. I . Nucleotide exchange rate in beef heart mitochondria in the range 12-3OOC. The exchange was partially inhibited (to about 70%) by carboxyatractylate. Beef heart mitochondria prelabeled with [14C]ADP were incubated with 3.2 nmol carboxyatractylate/mg protein. Additions and conditions of the exchange as described in Fig. 3
1 0 4 r (K-')
104/r (K-') Temperature ("C)
Fig. 6 . Nucleotide exchange in beef heart mitochondria in the range 0-21 "C. 0.35 mg protein mitochondria/ml were incubated in sucrose medium plus 0.5 niM EGTA under similar conditions as in Fig. 3
268
DISCUSSION
It has been previously pointed out [8] that the determination of the translocation rate of the adenine nucleotide in mitochon- dria, particularly those at higher temperature, requires sophis- ticated measurements due to inherent experimental problems. These are, in particular, the limitation of the measuring range by the size of the endogenous nucleotide pool and the high time resolution required for measuring initial rates. Furthermore, the primary data have to be appropriately evaluated, taking into account the exchangeable endogenous nucleotide pool size, etc. The majority of translocation data given in the literature does not fulfil these criteria and therefore widely divergent data are reported (see criticism in [9]). Moreover, rigorous evaluation of the primary data has rarely been attempted.
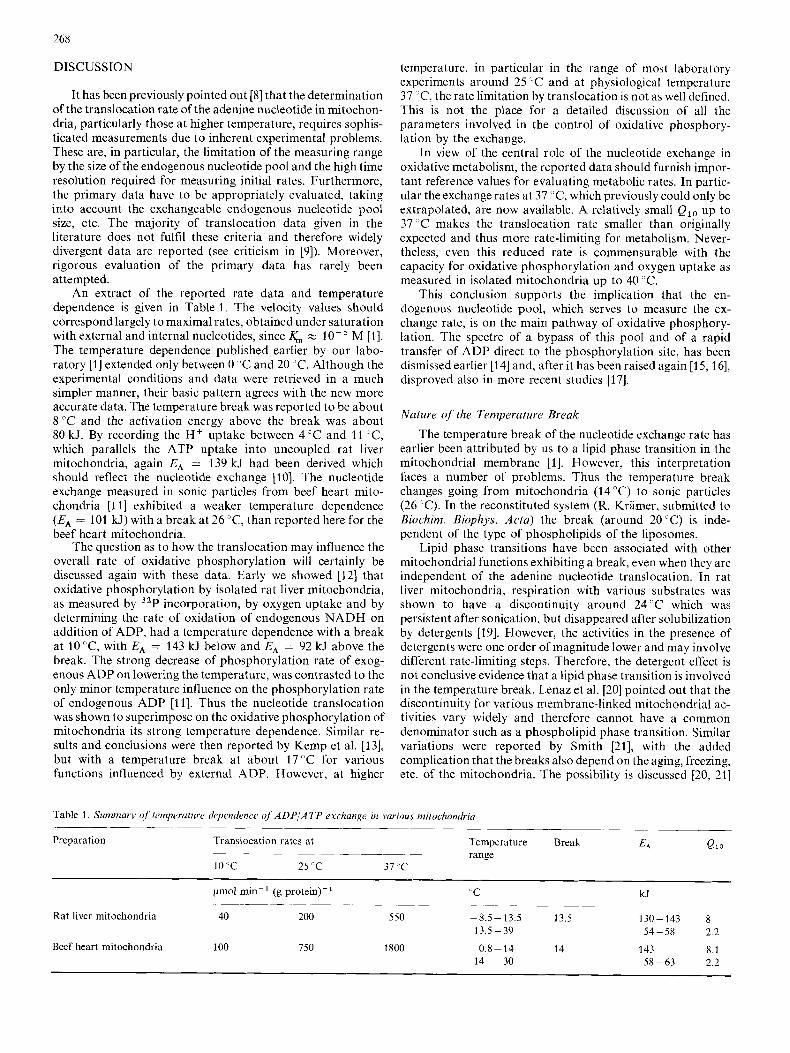
An extract of the reported rate data and temperature dependence is given in Table 1. The velocity values should correspond largely to maximal rates, obtained under saturation with external and internal nucleotides, since k;, z M [I]. The temperature dependence published earlier by our labo- ratory [I] extended only between 0 "C and 20 "C. Although the experimental conditions and data were retrieved in a much simpler manner, their basic pattern agrees with the new more accurate data. The temperature break was reported to be about 8°C and the activation energy above the break was about 80 kJ. By recording the H + uptake between 4°C and 11 "C, which parallels the ATP uptake into uncoupled rat liver mitochondria, again EA = 139 kJ had been derived which should reflect the nucleotide exchange [lo]. The nucleotide exchange measured in sonic particles from beef heart mito- chondria [I I ] exhibited a weaker temperature dependence (EA = 101 kJ) with a break at 26 'C, than reported here for the beef heart mitochondria.
The question as to how the translocation may influence the overall rate of oxidative phosphorylation will certainly be discussed again with these data. Early we showed [I21 that oxidative phosphorylation by isolated rat liver mitochondria, as measured by 32P incorporation, by oxygen uptake and by determining the rate of oxidation of endogenous NADH on addition of ADP, had a temperature dependence with a break at 1O"C, with EA = 143 kJ below and EA = 92 kJ above the break. The strong decrease of phosphorylation rate of exog- enous ADP on lowering the temperature, was contrasted to the only minor temperature influence on the phosphorylation rate of endogenous ADP [l I]. Thus the nucleotide translocation was shown to superimpose on the oxidative phosphorylation of mitochondria its strong temperature dependence. Similar re- sults and conclusions were then reported by Kemp et al. [13], but with a temperature break at about 17°C for various functions influenced by external ADP. However, at higher
temperature, in particular in the range of most laboratory experiments around 25 "C and at physiological temperature 37 "C, the rate limitation by translocation is not as well defined. This is not the place for a detailed discussion of all the parameters involved in the control of oxidative phosphory- lation by the exchange.
In view of the central role of the nucleotide exchange in oxidative metabolism, the reported data should furnish impor- tant reference values for evaluating metabolic rates. In partic- ular the exchange rates at 37 "C, which previously could only be extrapolated, are now available. A relatively small Qlo up to 37 "C makes the translocation rate smaller than originally expected and thus more rate-limiting for metabolism. Never- theless, even this reduced rate is commensurable with the capacity for oxidative phosphorylation and oxygen uptake as measured in isolated mitochondria up to 40 "C.
This conclusion supports the implication that the en- dogenous nucleotide pool, which serves to measure the ex- change rate, is on the main pathway of oxidative phosphory- lation. The spectre of a bypass of this pool and of a rapid transfer of ADP direct to the phosphorylation site, has been dismissed earlier [I41 and, after it has been raised again [15, 161, disproved also in more recent studies [17].
Nature of' the Temperature Break The temperature break of the nucleotide exchange rate has
earlier been attributed by us to a lipid phase transition in the mitochondrial membrane [I]. However, this interpretation faces a number of problems. Thus the temperature break changes going from mitochondria (14 "C) to sonic particles (26 "C). In the reconstituted system (R. Kramer, submitted to Biochim. Biophys. Acta) the break (around 20°C) is inde- pendent of the type of phospholipids of the liposomes.
Lipid phase transitions have been associated with other mitochondrial functions exhibiting a break, even when they are independent of the adenine nucleotide translocation. In rat liver mitochondria, respiration with various substrates was shown to have a discontinuity around 24°C which was persistent after sonication, but disappeared after solubilization by detergents [19]. However, the activities in the presence of detergents were one order of magnitude lower and may involve different rate-limiting steps. Therefore, the detergent effect is not conclusive evidence that a lipid phase transition is involved in the temperature break. Lenaz et al. [20] pointed out that the discontinuity for various membrane-linked mitochondrial ac- tivities vary widely and therefore cannot have a common denominator such as a phospholipid phase transition. Similar variations were reported by Smith [21], with the added complication that the breaks also depend on the aging, freezing, etc. of the mitochondria. The possibility is discussed [20, 211
Table 1 Summary of tempeiuture dependence of ADPIATP exchunge in vuriou mitochondria
Preparation Translocation rates at Tempeldture Break E A Q i o
10 C 25 C 37 c
pmol min- (g protein)- C kJ
range - - ~ ~ - ~ - ~ ~ -
~ ~~ __ -~
Rat liver mitochondria 40 200 550 -8 5-13 5 13 5 130-143 8 13 5-39 54-58 2 2
Beef heart mitochondria 100 750 1800 08-14 14 143 8 1 14 -30 58-63 2 2
that various enzymes are surrounded by different phospho- lipids and therefore localized phase transitions influence their activities.
The lipid phase transition concept seemed to draw support from studies on plant mitochondria and cold-blooded animals which have considerably lower temperature breaks [19, 221. Also in yeast strongly variable discontinuities, however again between 14 C, were observed [22].
Attempts to demonstrate these phase transitions by various physical probes gave contradictory results. Studies with a lipid spin label [23] seemed to indicate a temperature-dependent phase transition a t 23’C in liver and at 12°C in plant mitochondria. In contrast, with lipophilic fluorescent probes in mitochondria, no transition points were detected [24]. By differential calorimetry a broad phase transition, centered around 4 ‘T, has been reported 1251 which is, however, contradicted by another report [26].
However, whatever these probes may reflect in the mito- chondrial membrane, they do not indicate the existence of a transition point at 1 4 T , the temperature break of the ADP/ATP exchange. On the other hand, if there were a lipid phase transition in the membrane, it should be felt much more strongly by ‘intrinsic’ membrane functions, such as transport, rather than by more peripheral functions, such as dehy- drogenase activity.
In at least one other transport system, the galactoside transport through Eschevichia coli membranes, a strong case has been made for a correlation between lipid phase transition and temperature dependence [7]. In this case the break at higher temperature is compensated by a break in the opposite direction at lower temperature such that the temperature dependence is equal above and below the break. The resulting steep range between the two breaks is correlated to a con- tinuous transition between two membrane phases between which the carrier is redistributed. The carrier has a lower transport activity in the ordered phase but with the same intrinsic activation energy. The futile search for a similar reversion of the temperature dependence at low temperature for the ADPIATP transport down to -10°C argues here against a similar interpretation of the observed discontinuity of the temperature dependence. Furthermore, in E. coli, the temperature breaks are clearly supported by direct evidence for lipid phase transitions whereas these are absent for the mitochondria in this range.
In another transport system, the CaZf pump of the sarcoplasmatic reticulum, temperature breaks have been ob- served in the Ca2+-ATPase at 20 “C, independently of whether it is membrane-bound or solubilized by detergent [27]. Earlier a lipid annulus around this enzyme has been claimed to be responsible for this break [28]; however, the soluble ATPase is virtually lipid-free. As a result, the temperature break was attributed to an intrinsic property of this transport pump [27].
In conclusion, it seems that the adenine nucleotide trans- port cannot be correlated to a lipid phase transition as shown for the galactoside transport of E. coli. Therefore, an intrinsic conformation change of the adenine nucleotide carrier at the break point, causing different activation energies, may be responsible for the break, similarly as suggested for the Ca2+- ATPase. In addition, we propose that lipid-protein in- teraction is involved in the conformational transition as this type of temperature break is preferentially observed with mem-
brane-bound proteins, e.g. with most mitochondria1 activities. Consequently the hydrophobic interactions of the protein with lipids or detergents should be changed by the confor- mational transition. This can only be a working hypothesis and considerably more work has to be invested to resolve this long- standing problem.
This work was financially supported by the Sonderf~)r.schungshe~eich 51 and by the grants K1 13411 9- 21 of the Deutsche For.sclzzing.~ge~i~,i~,scliu~. Thanks are due to Dr H. Elhers for writing the program and plot routine. H. Berger, H. Nakel, W. Oellerer and B. Bartel participated in the development of RAMQUESA over a period of four years.
REFERENCES
1. Pfaff, E., Heldt, H. W. & Klingenberg, M. (1969) Eur. J. Biochiw. 10,
2. Pfaff, E. & Klingenberg, hi. (1968) Eur. J . Biochem. 6, 66-79. 3. Pfaff, E. (1965) Doctoral Thesis, Marburg. 4. Palmieri, F. & Klingenberg, M. (1979) Methods E n q w d . 56, 229-
233. 5. Klingenberg, M. (1964) in Rupid Mixing and Sumpling Technique.\ in
Biochemistry (Chance, B. et al., eds) pp. 61 -65, Academic Press, New York.
6 . Klingenherg, M., Grebe, K . & Scherer, B. (1975) Eur. J . Biochrm. 52, 351 - 363.
7. Thilo, L., Triuble, H. & Ovcrath, P. (1977) Biochrmi.siry, 16, 1283- 1290.
8. Klingenherg, M. (1970) in ESSSUJ~Y in Bioc/iemistry (Camphcil. P. N. & Dickens, F., eds) pp. 119-159, Academic Press, New York.
9. Klingenherg, M., Heldt, H. W. & Pfaff, E. (1969) in The Energy Lcwi und Metabolic Control in Mitochondria (Papa, S . et al., eds) pp. 237 -253, Adriatica Editrice, Bari.
10. Wulf, R., Kaltstein, A. & Klingenherg, M. (1978) Eur. J. Biochenz. 82, 585 - 592.
11. Klingenherg, M. (1977) Eur. J . Biochem. 76, 553-565. 12. Heldt, H. W. & Klingenberg, M. (1968) Eztr. J . Biochem. 4, 1-8. 13. Kemp, Jr. A.,Groot,G.S. P. &Reitsma, H. J . (1969) Biochim. Binphjx.
14. Heldt, H. W. & Klingenherg, M. (1965) Biochem. Z . 343, 433-451. IS. Vignais, P. V., Vignais, P. M. & Doussiere, J. (1975) Biochim. 8inphy.s.
16. Out, T. A,, Valeton, E. & Kemp, A., Jr (1976) Biochim. Bioph.ys. A m ,
17. Klingenherg, M. (1977) in Structure and Function of Energj,- Transducing Mcmhrunes (van Dam, K. &van Gelder, B. F., cds) pp. 275 - 282, Elsevier/North Holland, Amsterdam.
484- 493.
Acts, 180, 28 - 34.
Acta, 376, 219-230.
440, 697-710.
18. Reference deleted. 19. Raison, J. K., Lyons, J. M. & Thomson, W. W. (1971) Arch. Biochcni.
20. Lenaz, G., Sechi, A. M., Parenti-Castelli, G., Landi, L. & Bertoli, E.
21. Smith, C. L. (1973) Comp. Biochem. Physiol. 46, 445-461. 22. Watson, K., Bertoli, E. &Griffiths, D. E. (1975) Biochem. J . 146,401 -
23. Raison, J. K., Lyons, L. M., Mehlhorn, R. J. &Keith, A. D. (1971) .f.
24. Vanderkoi, J. M. & Chance, B. (1972) FEBS Left. 22, 23-26. 25. Blazyk, J. F. & Steim, J . M. (1972) Biochim. Biophys. Acta, 266, 737-
26. Feo, F., Canuto, R. A,, Garcea, R., Avogadro, A., Villa, M. & Celasco,
27. Dean, W. L. & Tanford, C. (1978) Biochemistry, 17, 1683- 1690. 28. Hesketh, T. R., Smith, G. A,, Houslay, M. D., McGill, K. A., Birdsall,
N. J. M., Mecalf, J. C. & Warren, J. B. (1976) Biochrmistry, 15, 4145-4152.
Biophys. 142, 83 - 90.
(1 972) Biochem. Binphys. Res. Comnzun. 49, 536- 542.
407.
Bid. Chem. 246, 4036 - 4040.
741.
M. (1976) FEBS Lett. 72, 262-2266,
M. Klingenberg, K. Grebe and M. Appel, lnstitut fur Physiologische Chemie, Physikalische Biochemie und Zellhiologie, Ludwig-Maximilians-Universitat Miinchen, GoethestraBe 33, D-8000 Munchen 2, Federal Republic of Germany


![Mitochondrial stress signaling - bchi · MitochondrialMitochondrial stress stress signalingsignaling ... Dominika Malińska. Role of mitochondria in the cell O 2.-H 2O 2 [Ca 2+] ADP](https://img.pdfslide.net/doc/110x75/5b783e727f8b9a805c8ed236/mitochondrial-stress-signaling-mitochondrialmitochondrial-stress-stress-signalingsignaling.jpg)

![Regulation of Insulin Secretion II MPB333_Ja… · 2 Glucose stimulated insulin secretion (GSIS) [Ca2+] i V m ATP ADP K ATP Ca V GLUT2 mitochondria GK glucose glycolysis PKA Epac](https://img.pdfslide.net/doc/110x75/5aebd7447f8b9ae5318e3cc6/regulation-of-insulin-secretion-ii-mpb333ja2-glucose-stimulated-insulin-secretion.jpg)