Embed Size (px)
Citation preview
Supported by:
TENNESSEENONPROFITCOMPENSATIONSURVEY
2016
WATKINS UIBERALL FIRM PROFILE
Watkins Uiberall has provided reputable accounting and business consulting services in the Mid-South since 1971. Today it stands as the largest locally-owned certified public accounting firm in Memphis. Through its affiliated company, Plan Administration Consulting, LLC, the Firm goes beyond traditional tax, accounting, and auditing services by offering clients extended services such as retirement plan administration and healthcare-focused business consulting.
For more than four decades, Watkins Uiberall has worked closely with the Mid-South nonprofit community and has made significant investments in training its staff in the specialized needs of nonprofit organizations. The Firm has gained a wealth of knowledge and experience through its work with arts, educational, healthcare, human service, religious, and civic organizations. Watkins Uiberall is committed to helping nonprofit clients increase the efficiency and productivity of their organizations and periodically hosts seminars focused on topics that affect nonprofit organizations for board members and executives.
Community Involvement
At Watkins Uiberall, we are proud of the communities in which we operate—and the places our employees and clients call home. We believe that, as a member of the business community, we have a responsibility to make a meaningful difference in the improvement of our region. With a commitment to actively give back to the community, we serve as a resource for various Mid-South nonprofit and charitable organizations. We encourage our employees to provide volunteer hours, financial support, and other means of assistance to those organizations whose purpose is community-driven.
Our dedicated team of nonprofit specialists can assist with the following:
• Attestation Services
• Tax Services
• Consulting Services
• Retirement Plan Services
The next time your organization goes out to bid for accounting services, please consider Watkins Uiberall in your RFP process. We would appreciate the opportunity to serve you. For questions or more information, please contact Daniel Moore, CPA at 901.761.2720 or [email protected].
Memphis – 1661 Aaron Brenner Drive | Suite 300 | Memphis, TN 38120 | 901.761.2720 | 901.683.1120 faxTupelo – 417 West Main Street | Suite 100 | Tupelo, MS 38804 | 662.269.4014 | 662.269.4016 fax
www.wucpas.com
Dear Survey Participant,
Thank you for your participation in Watkins Uiberall’s 2016 Tennessee Nonprofit Compensation Survey. We have analyzed the results of the surveys received from nonprofit organizations across the State of Tennessee.
In an effort to present the information in a manner that can be easily interpreted and utilized, we have provided the following:
• A description of the survey respondents, including geography, field of work, and budget size.
• Summaries and graphical presentation of the reported data, including the organization leadership, staffing practices, benefits, and compensation.
• Cross-tabulated data to compare organization policies to budget size.
• Excerpts of compensation data comparing the Memphis, Nashville, Chattanooga and Knoxville Metro Statistical Areas (MSAs) with national averages from the 2016 GuideStar Nonprofit Compensation Report, based on 2014 data.
We would like to extend a special thanks to our supporting organizations: the Alliance for Nonprofit Excellence in Memphis, the Center for Nonprofit Management in Nashville, the United Way of Greater Chattanooga’s Center for Nonprofits, the Alliance for Better Nonprofits in Knoxville, and the East Tennessee Foundation in Knoxville. Without their input and cooperation, we would not have been able to gather the volume of data necessary to produce a meaningful survey.
If you are not a member of one of these supporting organizations, we invite you to learn more about their services and offerings as described in the organizational profiles following the survey results.
We hope you find this information useful to your organization and appreciate your participation in our survey. If you have any suggestions regarding the content for future surveys or any questions regarding the information presented, please contact Daniel Moore, CPA, Director of Nonprofit Services, at 901.761.2720 or [email protected].
For more information about Watkins Uiberall, please see our Firm Profile on the previous page. You can also visit our website at www.wucpas.com.
Thanks again for your participation,
417 West Main Street • Suite 100Tupelo, MS 38804
662.269.4014 phone • 662.269.4016 fax
1661 Aaron Brenner Drive • Suite 300Memphis, TN 38120
901.761.2720 phone • 901.683.1120 fax
www.wucpas.com
Tennessee Nonprofit Compensation Survey
INTRODUCTION ......................................................... 2
Methodology ..................................................... 2
Key Findings ...................................................... 3
PARTICIPANT PROFILES ............................................. 4
ORGANIZATION LEADERSHIP ................................... 6
Executive Director/Chief Executive Officer ...... 6
Board of Directors ............................................. 6
ORGANIZATION STAFF .............................................. 7
Employees ......................................................... 7
Independent Contractors .................................. 8
Volunteers ......................................................... 9
Interns/VISTAs ................................................... 9
Age of Staff ..................................................... 10
STAFFING PRACTICES .............................................. 11
Salaries ............................................................ 11
Employee Retention ........................................ 13
Professional Development ............................. 15
BENEFITS .................................................................. 17
Health Insurance .............................................. 17
Dental Insurance .............................................. 20
Vision Insurance............................................... 21
Additional Benefits ......................................... 21
COMPENSATION ...................................................... 26
Administrative/General Office ........................ 26
Advocacy and Public Policy ............................ 26
Communications .............................................. 27
Community Engagement ................................ 27
Education ........................................................ 28
Executive ........................................................ 29
Facilities/Maintenance .................................... 30
Finance ............................................................ 30
Graphics/Design ............................................. 31
Human Resources ........................................... 31
Income Generation/Fundraising ..................... 32
Information Technology .................................. 32
Legal Services ................................................. 33
Marketing ....................................................... 33
Medical Services ............................................. 34
Mental Health ................................................. 35
Program Administration ................................. 35
Public Relations .............................................. 36
Retail Gift/Thrift Shop .................................... 36
Social Work/Social Services ............................ 37
Volunteerism .................................................. 37
SUPPORTING ORGANIZATIONS .............................. 43
TABLE OF CONTENTS
Tennessee Nonprofit Compensation Survey
2
INTRODUCTION METHODOLOGY
This is the sixth annual Tennessee Nonprofit Compensation Survey conducted by the Memphis-based Certified Public Accounting firm Watkins Uiberall, PLLC, the Alliance for Nonprofit Excellence in Memphis, the Center for Nonprofit Management in Nashville, The United Way of Greater Chattanooga Center for Nonprofits, The Alliance for Better Nonprofits in Knoxville, and the East Tennessee Foundation in Knoxville.
The chief purpose of this report is to provide nonprofit leaders with comparability data that can be utilized in the process of determining reasonable compensation. It is the only report of its kind in Tennessee and can be used in conjunction with national compensation studies to compare regional compensation figures with those in other parts of the U.S. This report contains data collected from survey participants across Tennessee as well as key state and national data from GuideStar’s Nonprofit Compensation Report to aid in comparative analysis. It can be used by volunteer boards, donors, and funders in reviewing organizational budgets and by public officials who make important decisions about public investments in nonprofits.
In addition to salary data for 92 nonprofit positions, this report includes profiles of survey participants; gender and ethnic makeup of nonprofit executives; use of part-time, hourly, and contract staff; involvement of volunteers; retention and professional development of employees; and provision of insurance, retirement, and other benefits. It also details how compensation levels, staffing practices, and benefits vary based on organization size, as measured by annual revenues.
Organizations participating in the survey represent a broad cross-section of Tennessee’s nonprofit sector with budgets ranging from less than $100,000 to more than $100 million. They play diverse roles in their communities as providers of human services, education, health care, housing, arts programming, and numerous other services. They are urban, suburban, and rural and represent many different fields of work, constituents, and funding models. Many are well established, with more than half having been in operation for more than 25 years.
The survey was distributed electronically in late 2016 and included 102 multiple-choice questions. This report is based on data collected from the one hundred fifty (150) organizations that responded to the survey. National and state-wide compensation data was collected from the 2016 GuideStar Nonprofit Compensation Report.
Participating organizations are categorized as:
• “Small” if their gross annual revenues are less than $1 million.
• “Medium-Sized” if their gross annual revenues are between $1 million and $10 million.
• “Large” if their gross annual revenues are at least $10 million.
3
Tennessee Nonprofit Compensation Survey
KEY FINDINGS
Employment
• 85% of organizations have fewer than 50 full-time employees.
• 83% have at least 1 part-time employee; 24% have more than 10.
• 43% expect their number of employees to increase this year.
• 75% have hourly workers.
• 84% use contractors to perform some services, with the most common contracted services being bookkeeping and payroll.
• 92% use volunteers, and 35% say that volunteers provide more than 20% of their labor.
• 47% use interns and 5% use AmeriCorps VISTAs.
Executive and Board Leadership
• 66% of organizations have a female executive director.
• 80% of small organizations, 62% of medium-sized organizations, and 21% of large organizations have a female executive director.
• Only 10% of executive directors are of a racial or ethnic minority.
• Nearly 50% of executive directors have a graduate degree.
• 50% of organizations have 15 or fewer board members.
Salaries
• 71% of participants say they use national or local salary surveys to help determine salaries; 50% talk to other organizations; 30% review other organizations’ 990 forms.
• 12% of organizations give automatic salary increases to employees; 32% give cost-of-living salary increases; and 73% give merit-based salary increases.
• 83% say salary increases would be issued this year. Of this group, 28% expect raises will average 1%-2% and 44% expect raises to average 3%-4%.
• 25% of small and 12% of medium-sized organizations do not expect to give raises in 2017. 100% of large organizations expect to give raises of at least 1%.
Health Benefits
• 64% of organizations offer an employer-provided health insurance plan. Only 31% of small organizations offer a health plan, compared to 89% of medium-sized and 100% of large organizations.
• 27% of employers pay 100% of premiums for their employee health insurance plan.
• 89% of organizations that offer health insurance coverage to employees also offer coverage to family members. However, only 36% pay more than 50% of premiums for family members.
• 74% say their health insurance plan premiums increased in 2016. Of these, 24% say the increase was more than 10%.
• 62% of respondents say their organizations offer employer-provided dental insurance coverage. Of these, 56% pay for at least 50% of the plan premium.
• 48% of respondents offer employer-provided vision insurance coverage. Of these, 33% pay for at least 50% of the plan premium.
• 7% of organizations use the health insurance marketplace for their insurance. Of those, 63% say that marketplace costs are lower than other available plans.
Retirement Benefits
• 24% of organizations offer employee 401k plans, 24% offer 403b plans, and 12% offer simple IRAs.
• 35% say employees qualify for retirement benefits after 1 year; 30% offer benefits after an employee works between 3 months and 1 year of employment.
Paid Leave
• Combined paid-time off (PTO): For those organizations that offer vacation and sick leave combined, the most common range of PTO provided is 11 to 20 days per year for employees who have worked up to 5 years and more than 20 days per year for employees who have worked more than 5 years.
• Paid vacation time: For those organizations that offer paid vacation time, the most common range of vacation time provided is 11 to 20 days per year for employees who have worked up to 10 years and more than 20 days for employees who have worked more than 10 years.
• Paid sick leave: For those organizations that offer paid sick leave, the most common range of sick leave provided is 11 to 20 days for all employees.
Tennessee Nonprofit Compensation Survey
4
PARTICIPANT PROFILES
Geographic Location
Of the 150 organizations that participated in this survey
• 22% are located in West Tennessee
• 49% are located in Middle Tennessee
• 29% are located in East Tennessee
Field of Work
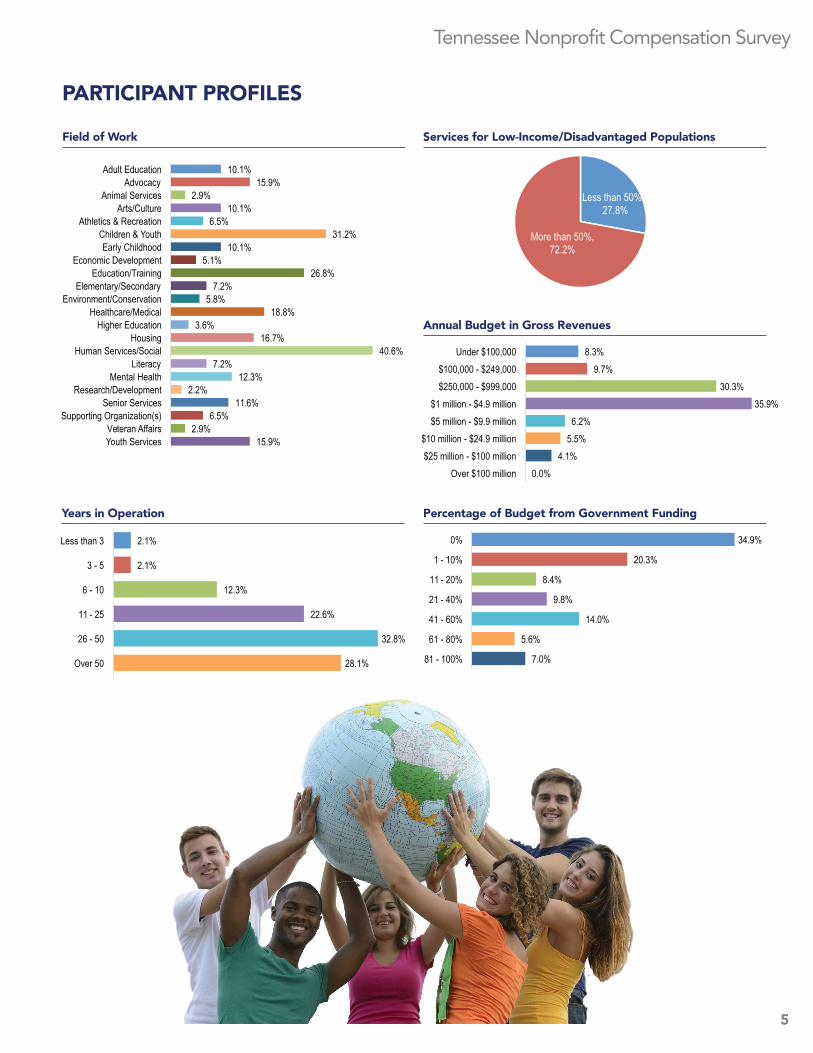
Survey participants represent many fields of work. Primary fields include: human services (41%), children and youth (31%), education (27%), healthcare (19%), and housing (17%).
Services for Low-Income/Disadvantaged Populations
More than 72% of survey participants primarily serve low-income and/or disadvantaged populations.
Years in Operation
Most participants are well-established organizations.
• 28% have been operating more than 50 years
• 33% have been operating between 26 and 50 years
• 35% have been operating between 6 and 25 years
• 4% have been operating for 5 years or less
Annual Budget in Gross Revenues
Organizations of all budget sizes participated in the survey, with the majority being organizations with gross annual revenues between $250,000 and $10 million.
• 18% have gross annual revenues of less than $250,000
• 30% have gross annual revenues between $250,000 and $1 million
• 42% have gross annual revenues between $1 million and $10 million
• Nearly 10% have gross annual revenues of more than $10 million
Percentage of Budget from Government Funding
• 35% of organizations say they receive no funding from government grants or contracts
• 29% say that up to 20% of their budget comes from government grants or contracts
• 24% say that between 21% and 60% of their budget comes from government grants or contracts
• Just over 12% say that more than 60% of their funding comes from government grants or contracts
67% of small organizations say that they receive no funding from government grants or contracts, while 25% of medium-sized organizations and 23% of large organizations say that they receive no government funding.
Fiscal Year End Date
Nearly 47% of organizations end their fiscal year on June 30, while 39% end their fiscal year on December 31.
5
Tennessee Nonprofit Compensation Survey
Field of Work
Percentage of Budget from Government Funding
Services for Low-Income/Disadvantaged Populations
Years in Operation
Annual Budget in Gross Revenues
PARTICIPANT PROFILES
10.1% 15.9%
2.9% 10.1%
6.5% 31.2%
10.1% 5.1%
26.8% 7.2%
5.8% 18.8%
3.6% 16.7%
40.6% 7.2%
12.3% 2.2%
11.6% 6.5%
2.9% 15.9%
Adult Education Advocacy
Animal Services Arts/Culture
Athletics & Recreation Children & Youth Early Childhood
Economic Development Education/Training
Elementary/Secondary Environment/Conservation
Healthcare/Medical Higher Education
Housing Human Services/Social
Literacy Mental Health
Research/Development Senior Services
Supporting Organization(s) Veteran Affairs Youth Services
Less than 50%, 27.8%
More than 50%, 72.2%
8.3% 9.7%
30.3% 35.9%
6.2% 5.5%
4.1% 0.0%
Under $100,000 $100,000 - $249,000 $250,000 - $999,000
$1 million - $4.9 million $5 million - $9.9 million
$10 million - $24.9 million $25 million - $100 million
Over $100 million
2.1%
2.1%
12.3%
22.6%
32.8%
28.1%
Less than 3
3 - 5
6 - 10
11 - 25
26 - 50
Over 50
34.9%
20.3%
8.4%
9.8%
14.0%
5.6%
7.0%
0%
1 - 10%
11 - 20%
21 - 40%
41 - 60%
61 - 80%
81 - 100%
Tennessee Nonprofit Compensation Survey
6
Ethnic Makeup of Board of Directors
Education Level Attained by Executive Director/CEO
Ethnicity of Executive Director/CEO
Number of Board Members
ORGANIZATION LEADERSHIP
Executive Director/Chief Executive Officer
Gender of Executive Director/CEO
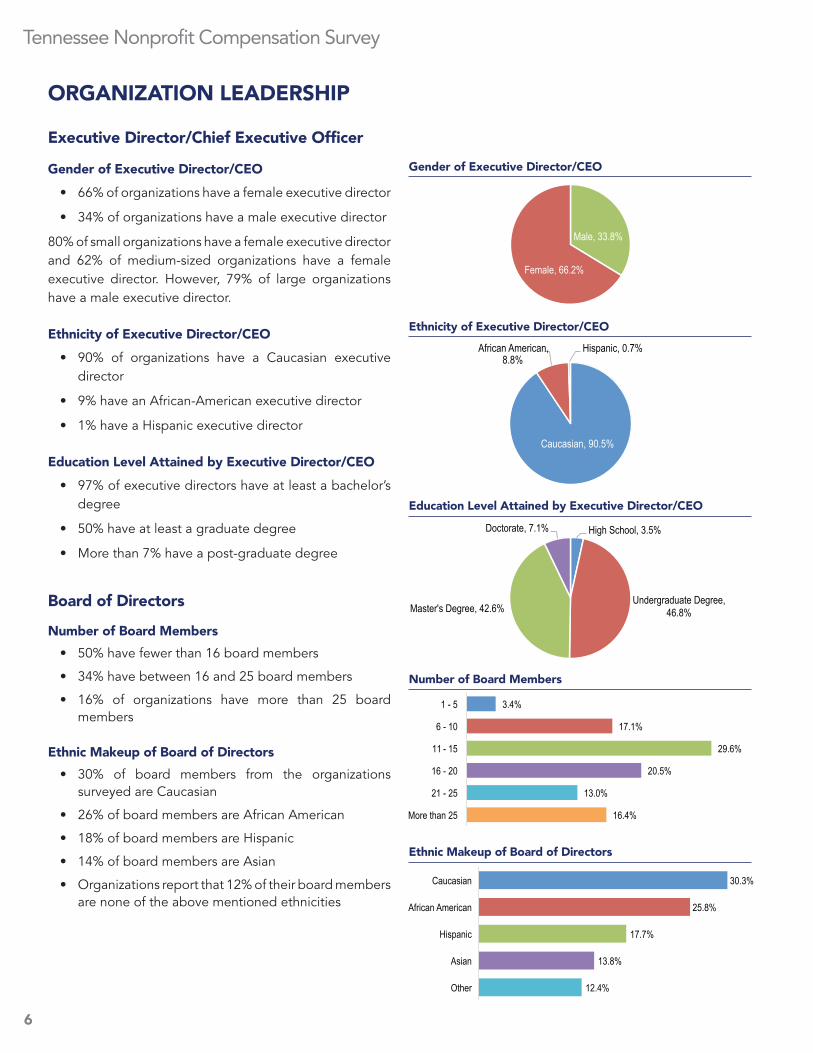
• 66% of organizations have a female executive director
• 34% of organizations have a male executive director
80% of small organizations have a female executive director and 62% of medium-sized organizations have a female executive director. However, 79% of large organizations have a male executive director.
Ethnicity of Executive Director/CEO
• 90% of organizations have a Caucasian executive director
• 9% have an African-American executive director
• 1% have a Hispanic executive director
Education Level Attained by Executive Director/CEO
• 97% of executive directors have at least a bachelor’s degree
• 50% have at least a graduate degree
• More than 7% have a post-graduate degree
Board of Directors
Number of Board Members
• 50% have fewer than 16 board members
• 34% have between 16 and 25 board members
• 16% of organizations have more than 25 board members
Ethnic Makeup of Board of Directors
• 30% of board members from the organizations surveyed are Caucasian
• 26% of board members are African American
• 18% of board members are Hispanic
• 14% of board members are Asian
• Organizations report that 12% of their board members are none of the above mentioned ethnicities
Gender of Executive Director/CEO
Male, 33.8%
Female, 66.2%
High School, 3.5%
Undergraduate Degree, 46.8% Master's Degree, 42.6%
Doctorate, 7.1%
Caucasian, 90.5%
African American, 8.8%
Hispanic, 0.7%
30.3%
25.8%
17.7%
13.8%
12.4%
Caucasian
African American
Hispanic
Asian
Other
3.4%
17.1%
29.6%
20.5%
13.0%
16.4%
1 - 5
6 - 10
11 - 15
16 - 20
21 - 25
More than 25
7
Tennessee Nonprofit Compensation Survey
ORGANIZATION STAFF
Employees
Full-Time Employees
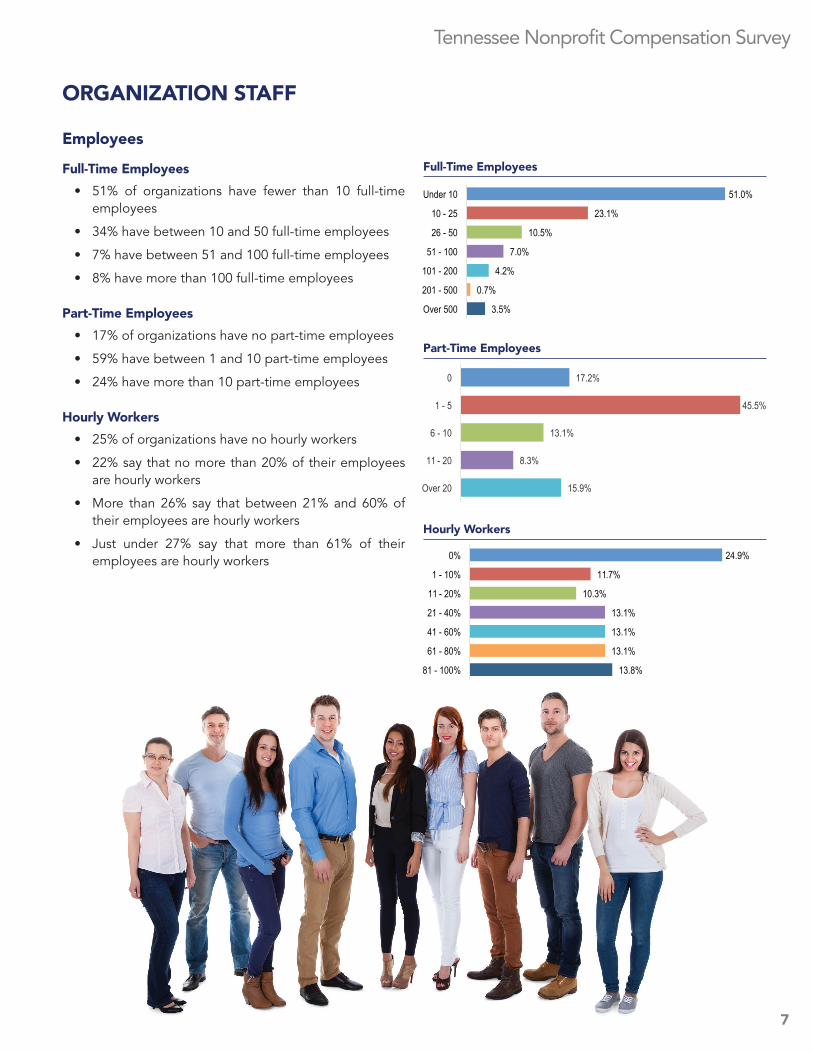
• 51% of organizations have fewer than 10 full-time employees
• 34% have between 10 and 50 full-time employees
• 7% have between 51 and 100 full-time employees
• 8% have more than 100 full-time employees
Part-Time Employees
• 17% of organizations have no part-time employees
• 59% have between 1 and 10 part-time employees
• 24% have more than 10 part-time employees
Hourly Workers
• 25% of organizations have no hourly workers
• 22% say that no more than 20% of their employees are hourly workers
• More than 26% say that between 21% and 60% of their employees are hourly workers
• Just under 27% say that more than 61% of their employees are hourly workers
Full-Time Employees
Part-Time Employees
Hourly Workers
51.0%
23.1%
10.5%
7.0%
4.2%
0.7%
3.5%
Under 10
10 - 25
26 - 50
51 - 100
101 - 200
201 - 500
Over 500
17.2%
45.5%
13.1%
8.3%
15.9%
0
1 - 5
6 - 10
11 - 20
Over 20
24.9%
11.7%
10.3%
13.1%
13.1%
13.1%
13.8%
0%
1 - 10%
11 - 20%
21 - 40%
41 - 60%
61 - 80%
81 - 100%
Tennessee Nonprofit Compensation Survey
8
ORGANIZATION STAFF
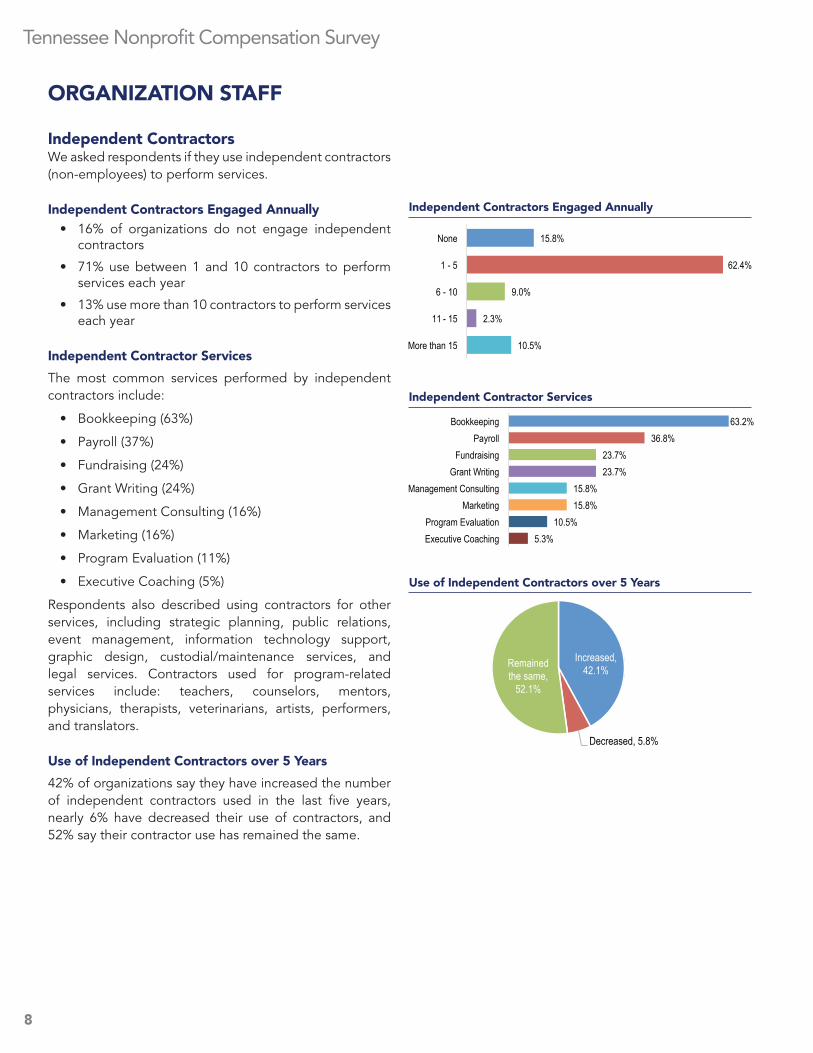
Independent ContractorsWe asked respondents if they use independent contractors (non-employees) to perform services.
Independent Contractors Engaged Annually• 16% of organizations do not engage independent
contractors
• 71% use between 1 and 10 contractors to perform services each year
• 13% use more than 10 contractors to perform services each year
Independent Contractor Services
The most common services performed by independent contractors include:
• Bookkeeping (63%)
• Payroll (37%)
• Fundraising (24%)
• Grant Writing (24%)
• Management Consulting (16%)
• Marketing (16%)
• Program Evaluation (11%)
• Executive Coaching (5%)
Respondents also described using contractors for other services, including strategic planning, public relations, event management, information technology support, graphic design, custodial/maintenance services, and legal services. Contractors used for program-related services include: teachers, counselors, mentors, physicians, therapists, veterinarians, artists, performers, and translators.
Use of Independent Contractors over 5 Years
42% of organizations say they have increased the number of independent contractors used in the last five years, nearly 6% have decreased their use of contractors, and 52% say their contractor use has remained the same.
Independent Contractors Engaged Annually
Independent Contractor Services
Use of Independent Contractors over 5 Years
15.8%
62.4%
9.0%
2.3%
10.5%
None
1 - 5
6 - 10
11 - 15
More than 15
Increased, 42.1%
Decreased, 5.8%
Remained the same,
52.1%
63.2% 36.8%
23.7% 23.7%
15.8% 15.8%
10.5% 5.3%
Bookkeeping Payroll
Fundraising Grant Writing
Management Consulting Marketing
Program Evaluation Executive Coaching
9
Tennessee Nonprofit Compensation Survey
Volunteers
Labor Hours Provided by Volunteers
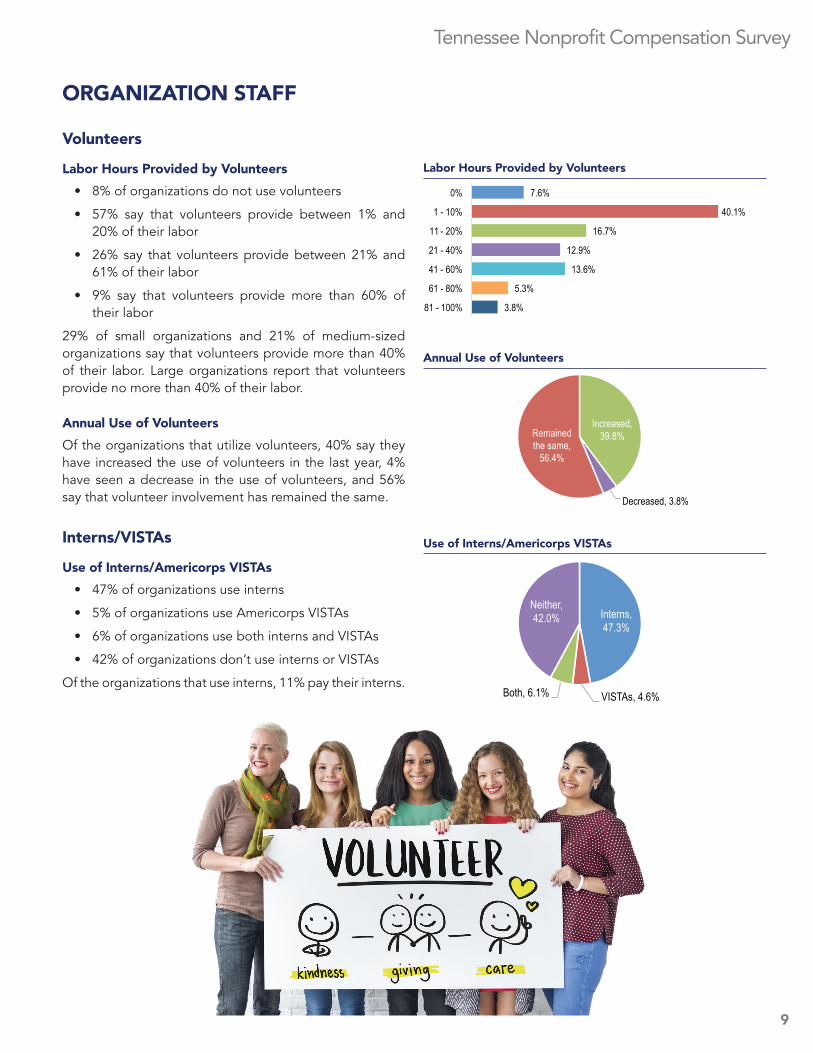
• 8% of organizations do not use volunteers
• 57% say that volunteers provide between 1% and 20% of their labor
• 26% say that volunteers provide between 21% and 61% of their labor
• 9% say that volunteers provide more than 60% of their labor
29% of small organizations and 21% of medium-sized organizations say that volunteers provide more than 40% of their labor. Large organizations report that volunteers provide no more than 40% of their labor.
Annual Use of Volunteers
Of the organizations that utilize volunteers, 40% say they have increased the use of volunteers in the last year, 4% have seen a decrease in the use of volunteers, and 56% say that volunteer involvement has remained the same.
Interns/VISTAs
Use of Interns/Americorps VISTAs
• 47% of organizations use interns
• 5% of organizations use Americorps VISTAs
• 6% of organizations use both interns and VISTAs
• 42% of organizations don’t use interns or VISTAs
Of the organizations that use interns, 11% pay their interns.
Labor Hours Provided by Volunteers
Annual Use of Volunteers
ORGANIZATION STAFF
Use of Interns/Americorps VISTAs
Increased,39.8%
Decreased, 3.8%
Remained the same,
56.4%
Interns, 47.3%
VISTAs, 4.6% Both, 6.1%
Neither, 42.0%
7.6%
40.1%
16.7%
12.9%
13.6%
5.3%
3.8%
0%
1 - 10%
11 - 20%
21 - 40%
41 - 60%
61 - 80%
81 - 100%
Tennessee Nonprofit Compensation Survey
10
ORGANIZATION STAFF
Age of Staff
Percentage of Workforce Aged 52-70 “Baby Boomers”
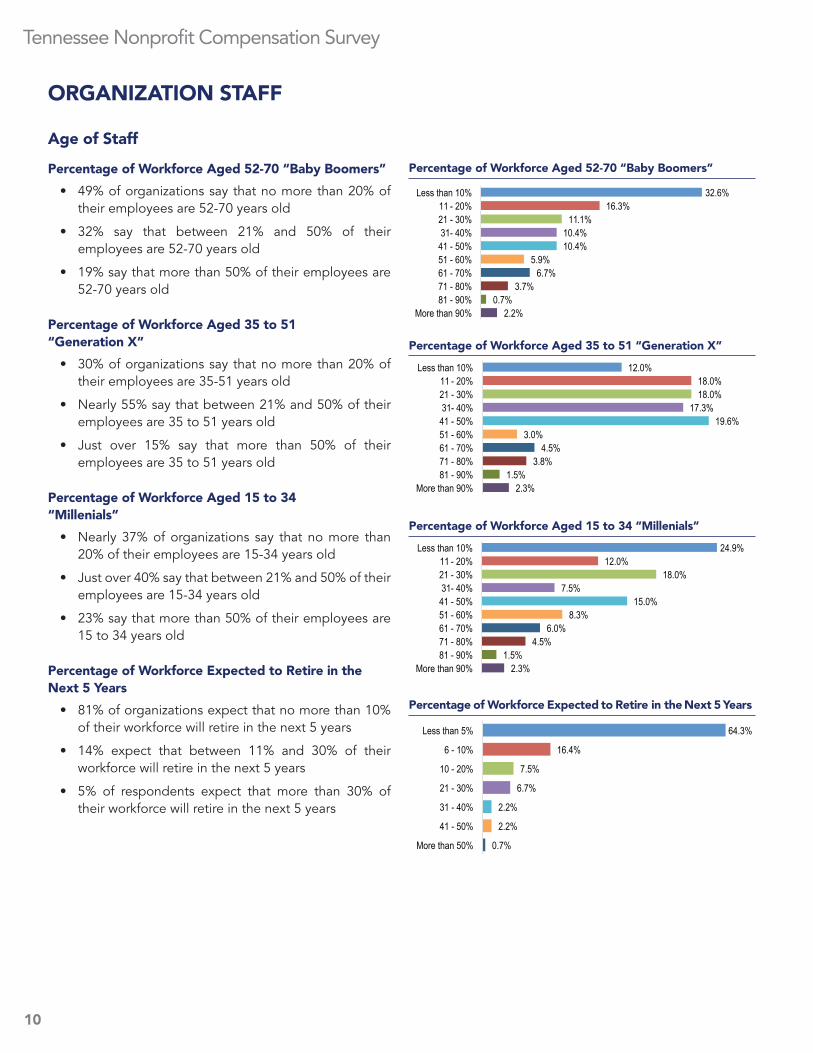
• 49% of organizations say that no more than 20% of their employees are 52-70 years old
• 32% say that between 21% and 50% of their employees are 52-70 years old
• 19% say that more than 50% of their employees are 52-70 years old
Percentage of Workforce Aged 35 to 51 “Generation X”
• 30% of organizations say that no more than 20% of their employees are 35-51 years old
• Nearly 55% say that between 21% and 50% of their employees are 35 to 51 years old
• Just over 15% say that more than 50% of their employees are 35 to 51 years old
Percentage of Workforce Aged 15 to 34 “Millenials”
• Nearly 37% of organizations say that no more than 20% of their employees are 15-34 years old
• Just over 40% say that between 21% and 50% of their employees are 15-34 years old
• 23% say that more than 50% of their employees are 15 to 34 years old
Percentage of Workforce Expected to Retire in the Next 5 Years
• 81% of organizations expect that no more than 10% of their workforce will retire in the next 5 years
• 14% expect that between 11% and 30% of their workforce will retire in the next 5 years
• 5% of respondents expect that more than 30% of their workforce will retire in the next 5 years
Percentage of Workforce Aged 52-70 “Baby Boomers”
Percentage of Workforce Aged 35 to 51 “Generation X”
Percentage of Workforce Aged 15 to 34 “Millenials”
Percentage of Workforce Expected to Retire in the Next 5 Years
32.6% 16.3%
11.1% 10.4% 10.4%
5.9% 6.7%
3.7% 0.7%
2.2%
Less than 10% 11 - 20% 21 - 30% 31- 40%
41 - 50% 51 - 60% 61 - 70% 71 - 80% 81 - 90%
More than 90%
12.0% 18.0% 18.0%
17.3% 19.6%
3.0% 4.5%
3.8% 1.5%
2.3%
Less than 10% 11 - 20% 21 - 30% 31- 40%
41 - 50% 51 - 60% 61 - 70% 71 - 80% 81 - 90%
More than 90%
24.9% 12.0%
18.0% 7.5%
15.0% 8.3%
6.0% 4.5%
1.5% 2.3%
Less than 10% 11 - 20% 21 - 30% 31- 40%
41 - 50% 51 - 60% 61 - 70% 71 - 80% 81 - 90%
More than 90%
64.3%
16.4%
7.5%
6.7%
2.2%
2.2%
0.7%
Less than 5%
6 - 10%
10 - 20%
21 - 30%
31 - 40%
41 - 50%
More than 50%
11
Tennessee Nonprofit Compensation Survey
STAFFING PRACTICES
Salaries
Methods for Determining Employee Salaries
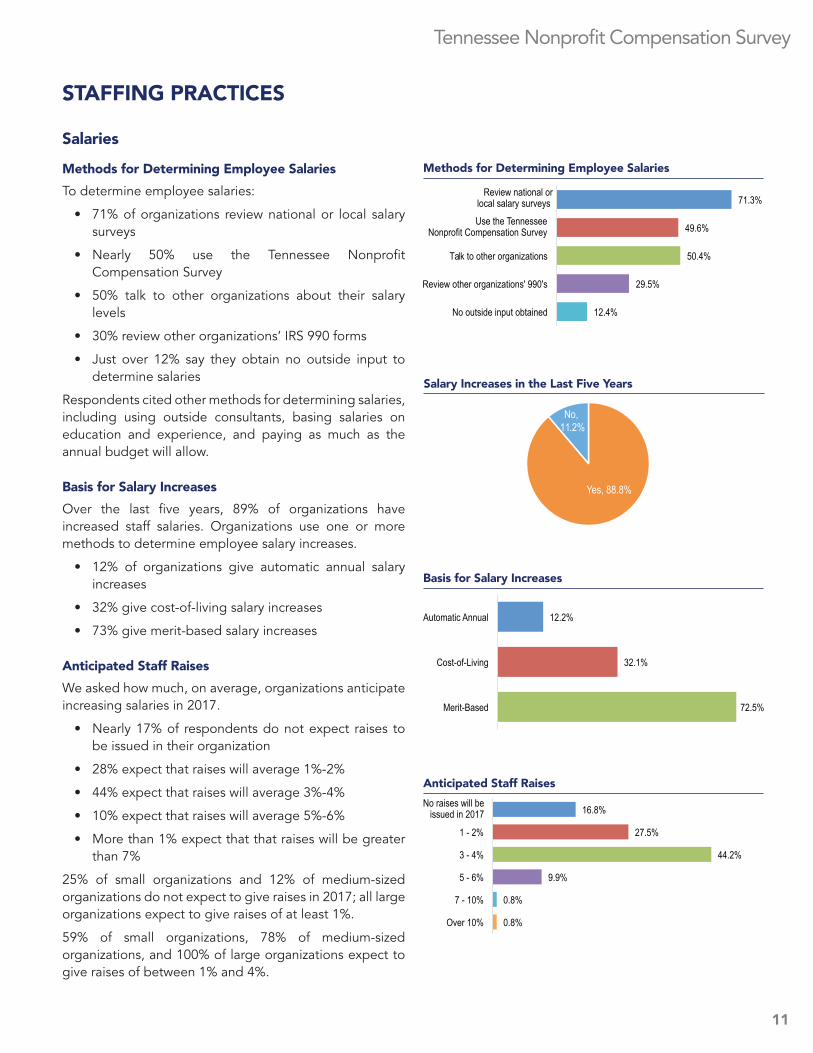
To determine employee salaries:
• 71% of organizations review national or local salary surveys
• Nearly 50% use the Tennessee Nonprofit Compensation Survey
• 50% talk to other organizations about their salary levels
• 30% review other organizations’ IRS 990 forms
• Just over 12% say they obtain no outside input to determine salaries
Respondents cited other methods for determining salaries, including using outside consultants, basing salaries on education and experience, and paying as much as the annual budget will allow.
Basis for Salary Increases
Over the last five years, 89% of organizations have increased staff salaries. Organizations use one or more methods to determine employee salary increases.
• 12% of organizations give automatic annual salary increases
• 32% give cost-of-living salary increases
• 73% give merit-based salary increases
Anticipated Staff Raises
We asked how much, on average, organizations anticipate increasing salaries in 2017.
• Nearly 17% of respondents do not expect raises to be issued in their organization
• 28% expect that raises will average 1%-2%
• 44% expect that raises will average 3%-4%
• 10% expect that raises will average 5%-6%
• More than 1% expect that that raises will be greater than 7%
25% of small organizations and 12% of medium-sized organizations do not expect to give raises in 2017; all large organizations expect to give raises of at least 1%.
59% of small organizations, 78% of medium-sized organizations, and 100% of large organizations expect to give raises of between 1% and 4%.
12.2%
32.1%
72.5%
Automatic Annual
Cost-of-Living
Merit-Based
Methods for Determining Employee Salaries
Basis for Salary Increases
Anticipated Staff Raises
71.3%
49.6%
50.4%
29.5%
12.4%
Review national orlocal salary surveys Use the Tennessee
Nonprofit Compensation Survey
Talk to other organizations
Review other organizations' 990's
No outside input obtained
Yes, 88.8%
No, 11.2%
Salary Increases in the Last Five Years
16.8%
27.5%
44.2%
9.9%
0.8%
0.8%
No raises will be issued in 2017
1 - 2%
3 - 4%
5 - 6%
7 - 10%
Over 10%
Tennessee Nonprofit Compensation Survey
12
STAFFING PRACTICES
Changes in Staff Size
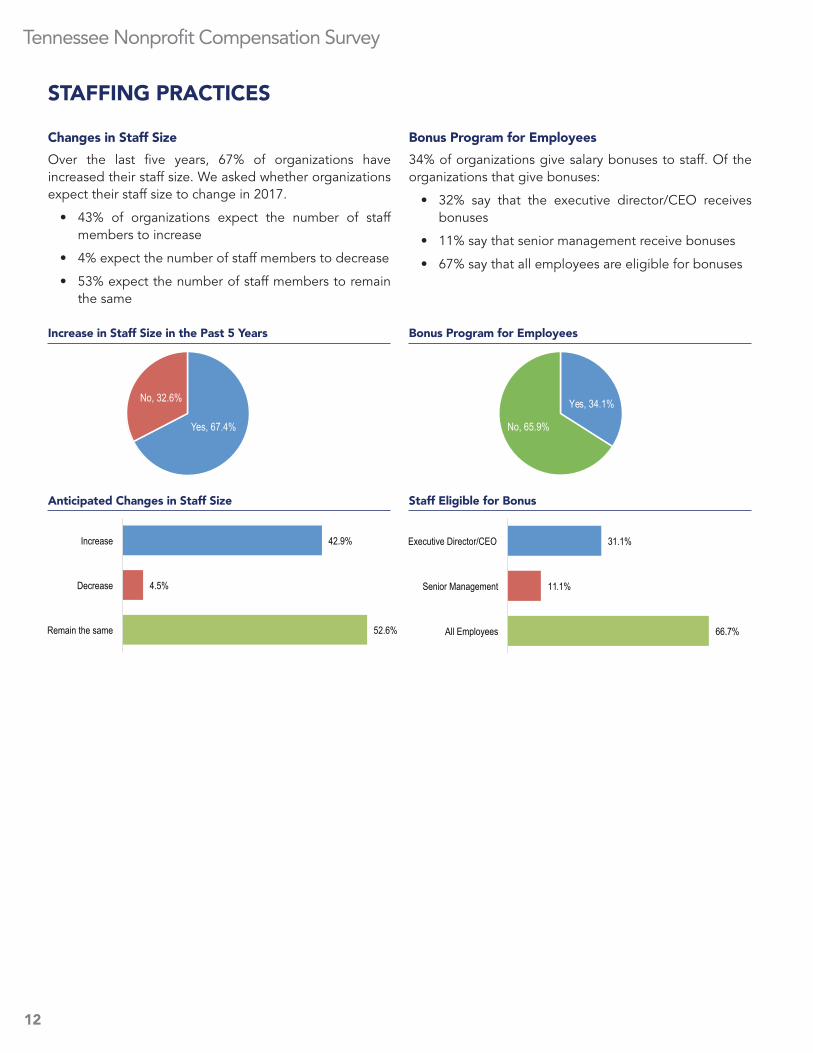
Over the last five years, 67% of organizations have increased their staff size. We asked whether organizations expect their staff size to change in 2017.
• 43% of organizations expect the number of staff members to increase
• 4% expect the number of staff members to decrease
• 53% expect the number of staff members to remain the same
Bonus Program for Employees
34% of organizations give salary bonuses to staff. Of the organizations that give bonuses:
• 32% say that the executive director/CEO receives bonuses
• 11% say that senior management receive bonuses
• 67% say that all employees are eligible for bonuses
Increase in Staff Size in the Past 5 Years Bonus Program for Employees
Staff Eligible for Bonus Anticipated Changes in Staff Size
Yes, 67.4%
No, 32.6%
42.9%
4.5%
52.6%
Increase
Decrease
Remain the same
Yes, 34.1%
No, 65.9%
31.1%
11.1%
66.7%
Executive Director/CEO
Senior Management
All Employees
13
Tennessee Nonprofit Compensation Survey
STAFFING PRACTICES
Employee Retention
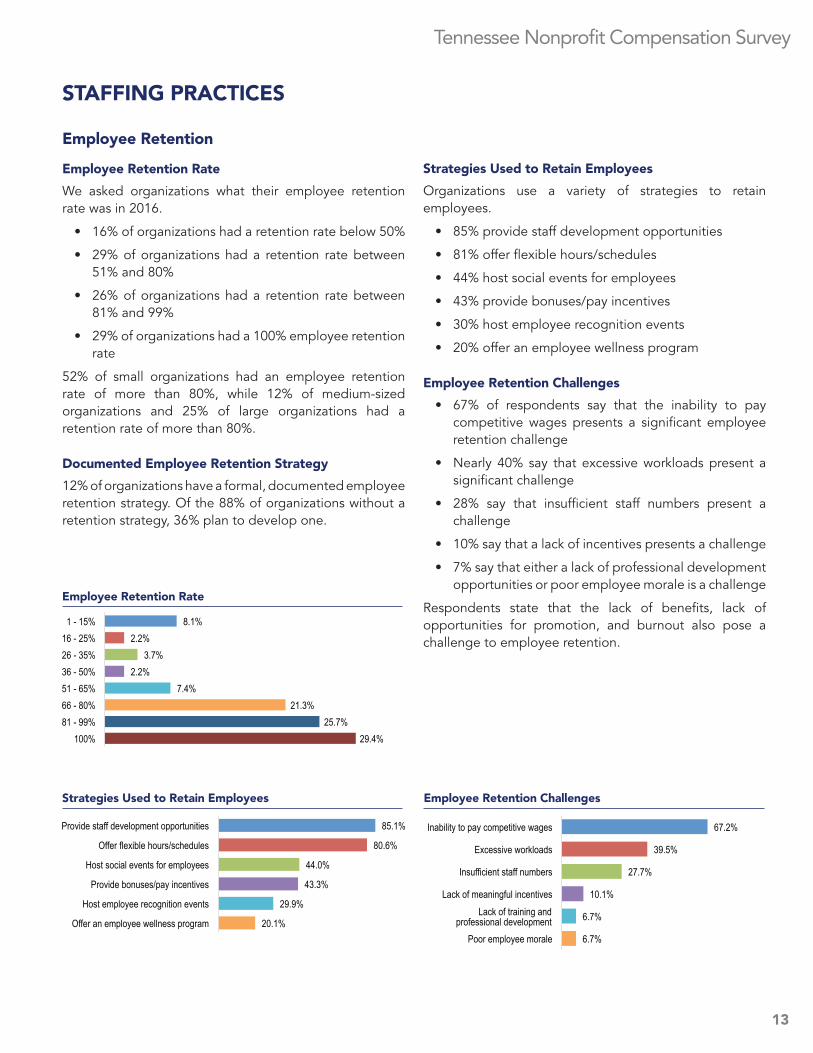
Employee Retention Rate
We asked organizations what their employee retention rate was in 2016.
• 16% of organizations had a retention rate below 50%
• 29% of organizations had a retention rate between 51% and 80%
• 26% of organizations had a retention rate between 81% and 99%
• 29% of organizations had a 100% employee retention rate
52% of small organizations had an employee retention rate of more than 80%, while 12% of medium-sized organizations and 25% of large organizations had a retention rate of more than 80%.
Documented Employee Retention Strategy
12% of organizations have a formal, documented employee retention strategy. Of the 88% of organizations without a retention strategy, 36% plan to develop one.
Strategies Used to Retain Employees
Organizations use a variety of strategies to retain employees.
• 85% provide staff development opportunities
• 81% offer flexible hours/schedules
• 44% host social events for employees
• 43% provide bonuses/pay incentives
• 30% host employee recognition events
• 20% offer an employee wellness program
Employee Retention Challenges
• 67% of respondents say that the inability to pay competitive wages presents a significant employee retention challenge
• Nearly 40% say that excessive workloads present a significant challenge
• 28% say that insufficient staff numbers present a challenge
• 10% say that a lack of incentives presents a challenge
• 7% say that either a lack of professional development opportunities or poor employee morale is a challenge
Respondents state that the lack of benefits, lack of opportunities for promotion, and burnout also pose a challenge to employee retention.
Employee Retention Rate
Strategies Used to Retain Employees Employee Retention Challenges
85.1%
80.6%
44.0%
43.3%
29.9%
20.1%
Provide staff development opportunities
Offer flexible hours/schedules
Host social events for employees
Provide bonuses/pay incentives
Host employee recognition events
Offer an employee wellness program
67.2%
39.5%
27.7%
10.1%
6.7%
6.7%
Inability to pay competitive wages
Excessive workloads
Insufficient staff numbers
Lack of meaningful incentives Lack of training and
professional developmentPoor employee morale
8.1% 2.2%
3.7% 2.2%
7.4% 21.3%
25.7% 29.4%
1 - 15% 16 - 25% 26 - 35% 36 - 50% 51 - 65% 66 - 80% 81 - 99%
100%
Tennessee Nonprofit Compensation Survey
14
STAFFING PRACTICES
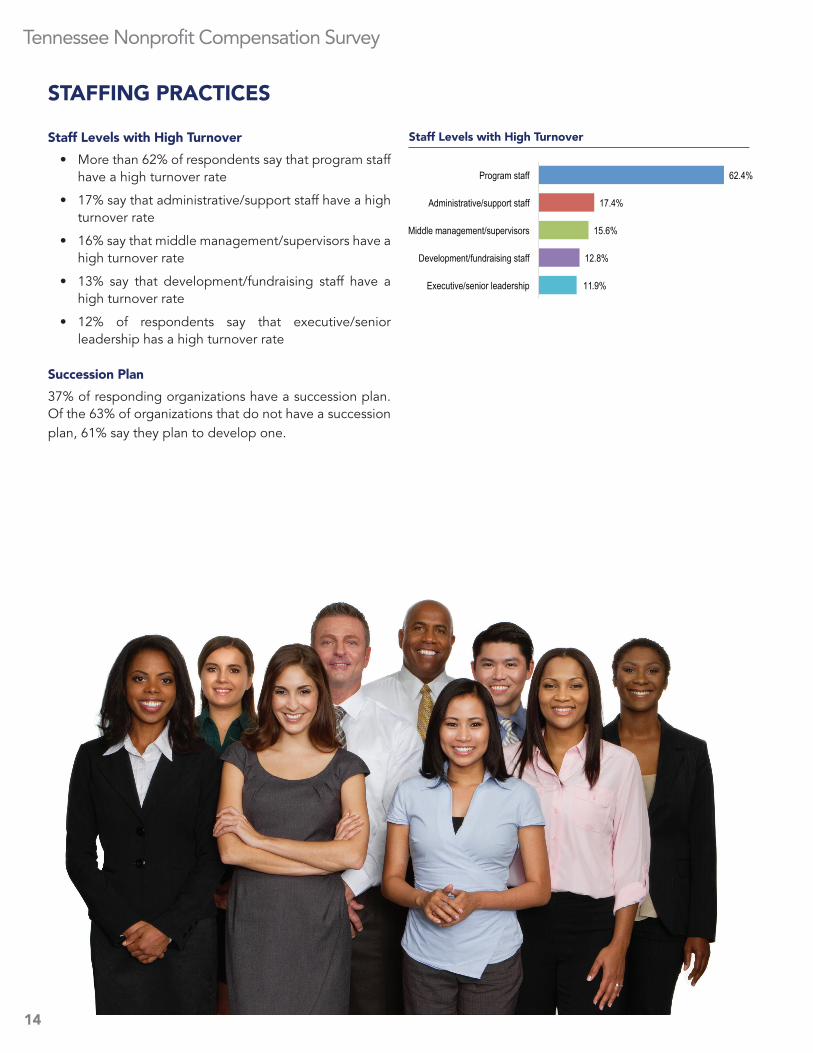
Staff Levels with High Turnover
• More than 62% of respondents say that program staff have a high turnover rate
• 17% say that administrative/support staff have a high turnover rate
• 16% say that middle management/supervisors have a high turnover rate
• 13% say that development/fundraising staff have a high turnover rate
• 12% of respondents say that executive/senior leadership has a high turnover rate
Succession Plan
37% of responding organizations have a succession plan. Of the 63% of organizations that do not have a succession plan, 61% say they plan to develop one.
Staff Levels with High Turnover
62.4%
17.4%
15.6%
12.8%
11.9%
Program staff
Administrative/support staff
Middle management/supervisors
Development/fundraising staff
Executive/senior leadership
15
Tennessee Nonprofit Compensation Survey
STAFFING PRACTICES
Professional Development
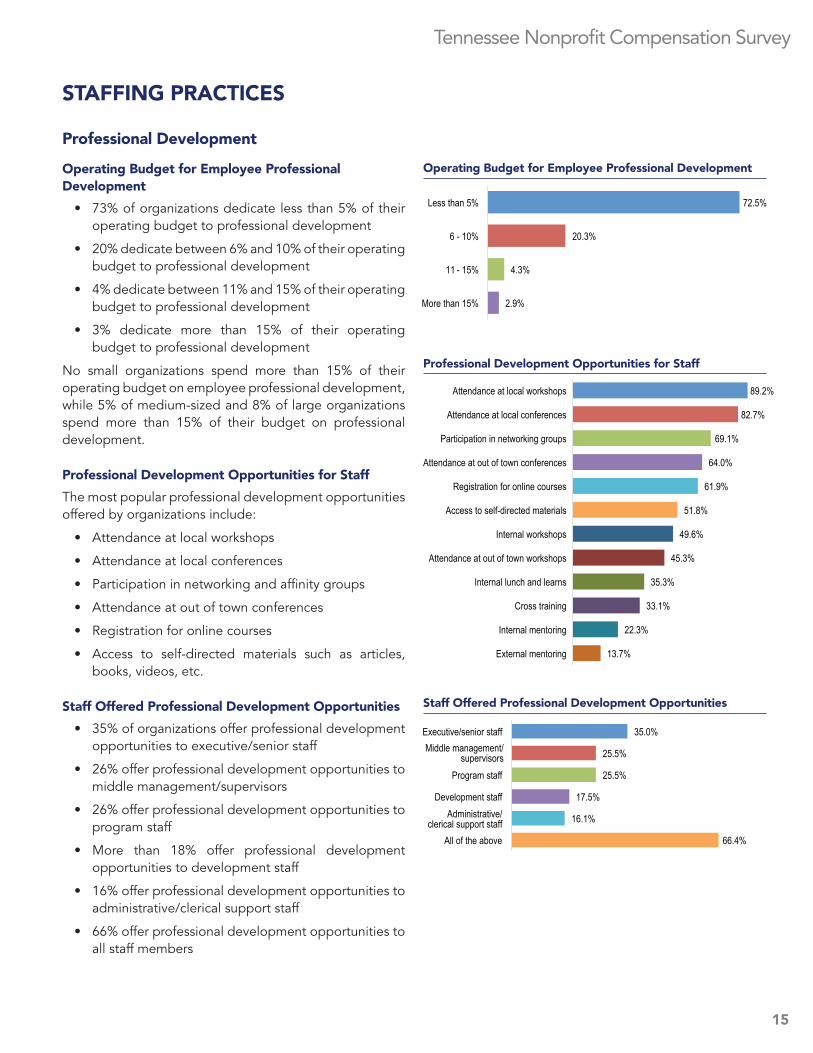
Operating Budget for Employee Professional Development
• 73% of organizations dedicate less than 5% of their operating budget to professional development
• 20% dedicate between 6% and 10% of their operating budget to professional development
• 4% dedicate between 11% and 15% of their operating budget to professional development
• 3% dedicate more than 15% of their operating budget to professional development
No small organizations spend more than 15% of their operating budget on employee professional development, while 5% of medium-sized and 8% of large organizations spend more than 15% of their budget on professional development.
Professional Development Opportunities for Staff
The most popular professional development opportunities offered by organizations include:
• Attendance at local workshops
• Attendance at local conferences
• Participation in networking and affinity groups
• Attendance at out of town conferences
• Registration for online courses
• Access to self-directed materials such as articles, books, videos, etc.
Staff Offered Professional Development Opportunities
• 35% of organizations offer professional development opportunities to executive/senior staff
• 26% offer professional development opportunities to middle management/supervisors
• 26% offer professional development opportunities to program staff
• More than 18% offer professional development opportunities to development staff
• 16% offer professional development opportunities to administrative/clerical support staff
• 66% offer professional development opportunities to all staff members
Operating Budget for Employee Professional Development
Professional Development Opportunities for Staff
Staff Offered Professional Development Opportunities
72.5%
20.3%
4.3%
2.9%
Less than 5%
6 - 10%
11 - 15%
More than 15%
35.0%
25.5%
25.5%
17.5%
16.1%
66.4%
Executive/senior staff Middle management/
supervisorsProgram staff
Development staff Administrative/
clerical support staffAll of the above
89.2%
82.7%
69.1%
64.0%
61.9%
51.8%
49.6%
45.3%
35.3%
33.1%
22.3%
13.7%
Attendance at local workshops
Attendance at local conferences
Participation in networking groups
Attendance at out of town conferences
Registration for online courses
Access to self-directed materials
Internal workshops
Attendance at out of town workshops
Internal lunch and learns
Cross training
Internal mentoring
External mentoring
Tennessee Nonprofit Compensation Survey
16
Overtime Policies and the Final Rule
In 2016, the U.S. Department of Labor updated overtime regulations to extend overtime pay protections to more than 4 million workers. Under the new Fair Labor Standards Act (FLSA) regulations, employees making less than $47,476 per year would be made eligible for overtime automatically, regardless of their job duties. The “Final Rule” was to go into effect on December 1, 2016. In November, the rule was put on hold when a federal judge issued an injunction to delay implementation. Pending further review by the court, no changes to the existing overtime regulations have gone into effect.
As part of the 2016 Nonprofit Compensation Survey (which was distributed prior to the injunction), organizations provided information on their plans to adjust employee salaries and classifications to comply with the new overtime regulations.
Organizations Affected by the Final Rule
54% of organizations surveyed have commercial revenues of less than $500,000 and are not covered by the Final Rule. 8% of organizations did not know if they were covered by the Final Rule.
Workforce Classified as Non-Exempt
• 27% of organizations say that less than 20% of their workforce would be classified as non-exempt
• 19% say that between 20% and 50% of their workforce would be classified as non-exempt
• 22% say that between 51% and 80% of their workforce would be classified as non-exempt
• 32% say that more than 80% of their workforce would be classified as non-exempt
STAFFING PRACTICES
Methods of Addressing the New Overtime Regulations
Organizations will make some or all of the following changes to address the new FLSA regulations.
• 23% of organizations will pay overtime for hours worked in addition to salaried hours
• 7% of organizations will raise salaries to or above the threshold of $47,476 per year
• 6% will adjust employees’ base salary and pay overtime
• 4% will evaluate and realign employee workload
• 2% will hire additional employees to reduce the need for overtime hours
Employees Affected by Final Rule
• 49% of organizations say that less than 21% of their employees would be affected by the new FLSA regulations
• 17% say that between 21% and 40% of their employees would be affected
• 14% say that between 41% and 60% of their employees would be affected
• 10% say that between 61% and 80% of their employees would be affected
• 10% say that more than 81% of their employees would be affected
17
Tennessee Nonprofit Compensation Survey
BENEFITS
Health Insurance
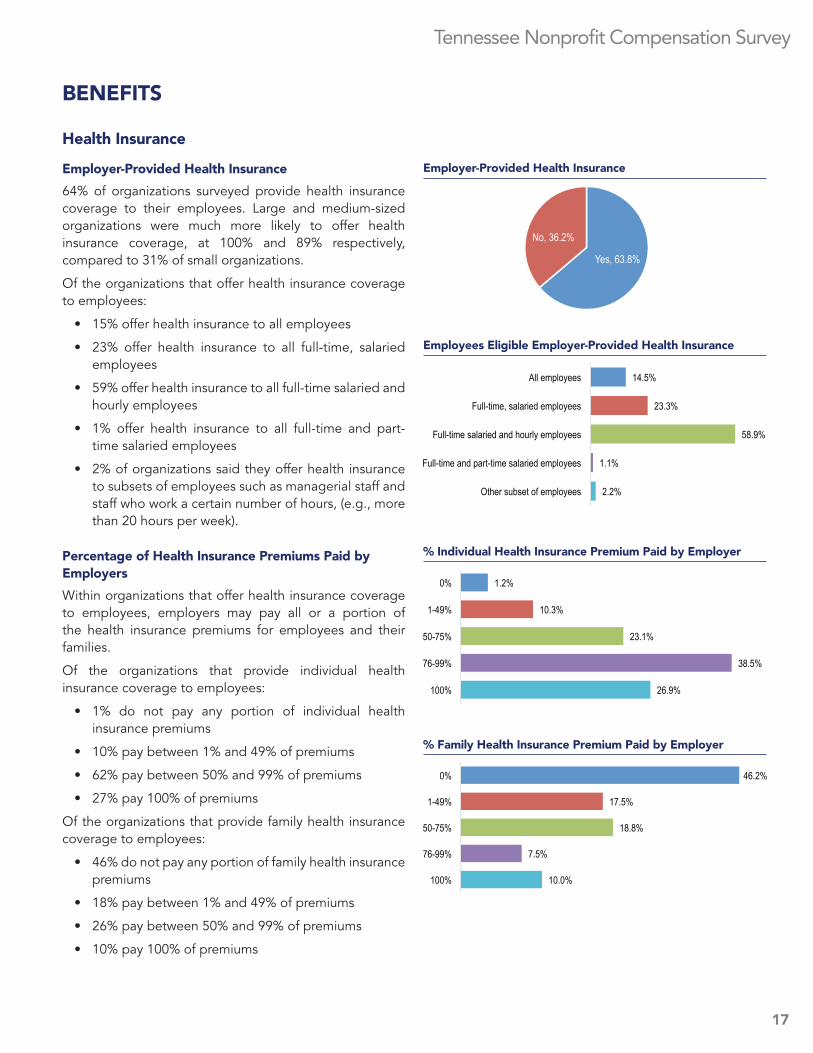
Employer-Provided Health Insurance
64% of organizations surveyed provide health insurance coverage to their employees. Large and medium-sized organizations were much more likely to offer health insurance coverage, at 100% and 89% respectively, compared to 31% of small organizations.
Of the organizations that offer health insurance coverage to employees:
• 15% offer health insurance to all employees
• 23% offer health insurance to all full-time, salaried employees
• 59% offer health insurance to all full-time salaried and hourly employees
• 1% offer health insurance to all full-time and part-time salaried employees
• 2% of organizations said they offer health insurance to subsets of employees such as managerial staff and staff who work a certain number of hours, (e.g., more than 20 hours per week).
Percentage of Health Insurance Premiums Paid by Employers
Within organizations that offer health insurance coverage to employees, employers may pay all or a portion of the health insurance premiums for employees and their families.
Of the organizations that provide individual health insurance coverage to employees:
• 1% do not pay any portion of individual health insurance premiums
• 10% pay between 1% and 49% of premiums
• 62% pay between 50% and 99% of premiums
• 27% pay 100% of premiums
Of the organizations that provide family health insurance coverage to employees:
• 46% do not pay any portion of family health insurance premiums
• 18% pay between 1% and 49% of premiums
• 26% pay between 50% and 99% of premiums
• 10% pay 100% of premiums
Yes, 63.8%
No, 36.2%
14.5%
23.3%
58.9%
1.1%
2.2%
All employees
Full-time, salaried employees
Full-time salaried and hourly employees
Full-time and part-time salaried employees
Other subset of employees
Employer-Provided Health Insurance
Employees Eligible Employer-Provided Health Insurance
% Individual Health Insurance Premium Paid by Employer
% Family Health Insurance Premium Paid by Employer
1.2%
10.3%
23.1%
38.5%
26.9%
0%
1-49%
50-75%
76-99%
100%
46.2%
17.5%
18.8%
7.5%
10.0%
0%
1-49%
50-75%
76-99%
100%
Tennessee Nonprofit Compensation Survey
18
BENEFITS
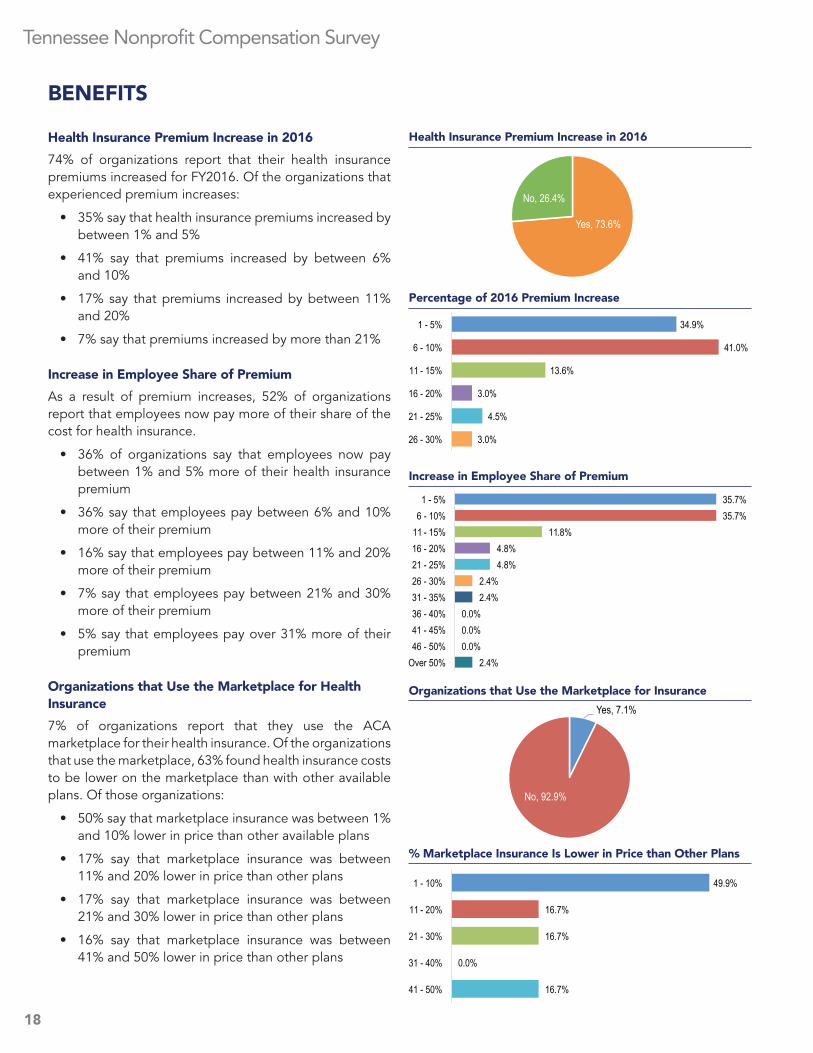
Health Insurance Premium Increase in 2016
74% of organizations report that their health insurance premiums increased for FY2016. Of the organizations that experienced premium increases:
• 35% say that health insurance premiums increased by between 1% and 5%
• 41% say that premiums increased by between 6% and 10%
• 17% say that premiums increased by between 11% and 20%
• 7% say that premiums increased by more than 21%
Increase in Employee Share of Premium
As a result of premium increases, 52% of organizations report that employees now pay more of their share of the cost for health insurance.
• 36% of organizations say that employees now pay between 1% and 5% more of their health insurance premium
• 36% say that employees pay between 6% and 10% more of their premium
• 16% say that employees pay between 11% and 20% more of their premium
• 7% say that employees pay between 21% and 30% more of their premium
• 5% say that employees pay over 31% more of their premium
Organizations that Use the Marketplace for Health Insurance
7% of organizations report that they use the ACA marketplace for their health insurance. Of the organizations that use the marketplace, 63% found health insurance costs to be lower on the marketplace than with other available plans. Of those organizations:
• 50% say that marketplace insurance was between 1% and 10% lower in price than other available plans
• 17% say that marketplace insurance was between 11% and 20% lower in price than other plans
• 17% say that marketplace insurance was between 21% and 30% lower in price than other plans
• 16% say that marketplace insurance was between 41% and 50% lower in price than other plans
Organizations that Use the Marketplace for Insurance
% Marketplace Insurance Is Lower in Price than Other Plans
Yes, 73.6%
No, 26.4%
Health Insurance Premium Increase in 2016
Percentage of 2016 Premium Increase
Increase in Employee Share of Premium
Yes, 7.1%
No, 92.9%
35.7% 35.7%
11.8% 4.8% 4.8%
2.4% 2.4%
0.0% 0.0% 0.0%
2.4%
1 - 5% 6 - 10%
11 - 15% 16 - 20% 21 - 25% 26 - 30% 31 - 35% 36 - 40% 41 - 45% 46 - 50%
Over 50%
49.9%
16.7%
16.7%
0.0%
16.7%
1 - 10%
11 - 20%
21 - 30%
31 - 40%
41 - 50%
34.9%
41.0%
13.6%
3.0%
4.5%
3.0%
1 - 5%
6 - 10%
11 - 15%
16 - 20%
21 - 25%
26 - 30%
19
Tennessee Nonprofit Compensation Survey
BENEFITS
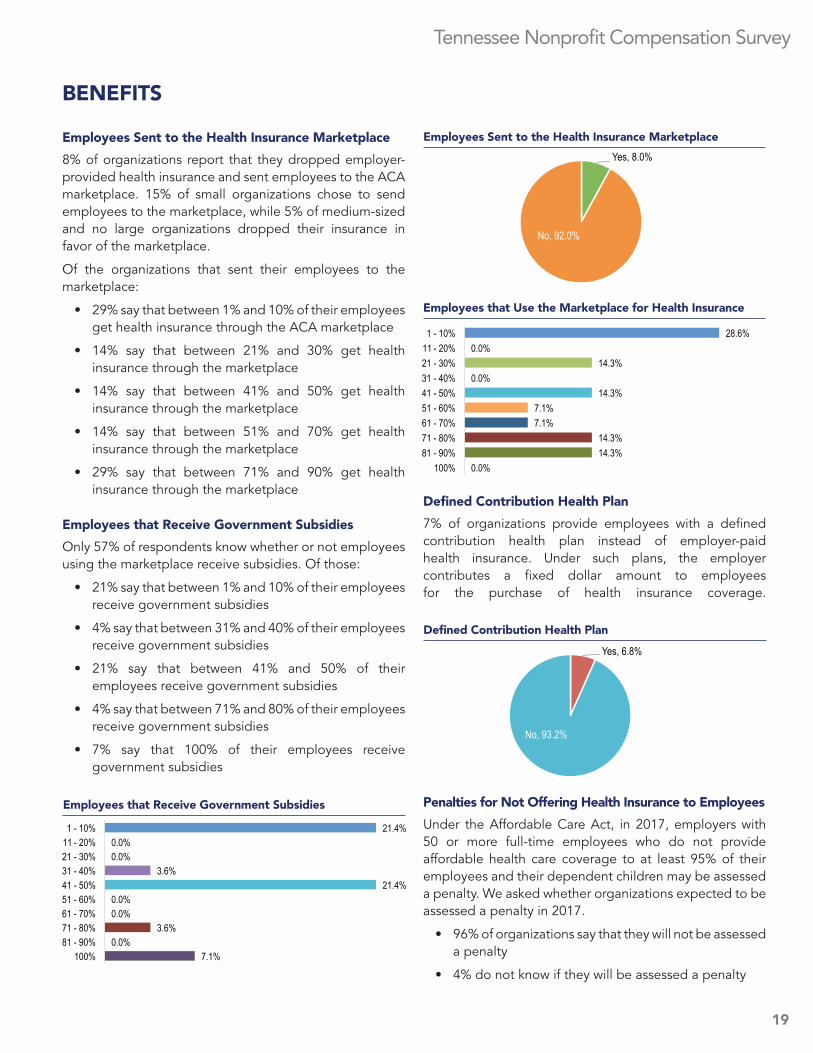
Employees Sent to the Health Insurance Marketplace
8% of organizations report that they dropped employer-provided health insurance and sent employees to the ACA marketplace. 15% of small organizations chose to send employees to the marketplace, while 5% of medium-sized and no large organizations dropped their insurance in favor of the marketplace.
Of the organizations that sent their employees to the marketplace:
• 29% say that between 1% and 10% of their employees get health insurance through the ACA marketplace
• 14% say that between 21% and 30% get health insurance through the marketplace
• 14% say that between 41% and 50% get health insurance through the marketplace
• 14% say that between 51% and 70% get health insurance through the marketplace
• 29% say that between 71% and 90% get health insurance through the marketplace
Employees that Receive Government Subsidies
Only 57% of respondents know whether or not employees using the marketplace receive subsidies. Of those:
• 21% say that between 1% and 10% of their employees receive government subsidies
• 4% say that between 31% and 40% of their employees receive government subsidies
• 21% say that between 41% and 50% of their employees receive government subsidies
• 4% say that between 71% and 80% of their employees receive government subsidies
• 7% say that 100% of their employees receive government subsidies
Defined Contribution Health Plan
7% of organizations provide employees with a defined contribution health plan instead of employer-paid health insurance. Under such plans, the employer contributes a fixed dollar amount to employees for the purchase of health insurance coverage.
Penalties for Not Offering Health Insurance to Employees
Under the Affordable Care Act, in 2017, employers with 50 or more full-time employees who do not provide affordable health care coverage to at least 95% of their employees and their dependent children may be assessed a penalty. We asked whether organizations expected to be assessed a penalty in 2017.
• 96% of organizations say that they will not be assessed a penalty
• 4% do not know if they will be assessed a penalty
Employees that Use the Marketplace for Health Insurance
Defined Contribution Health Plan
Employees Sent to the Health Insurance Marketplace
Yes, 8.0%
No, 92.0%
28.6% 0.0%
14.3% 0.0%
14.3% 7.1% 7.1%
14.3% 14.3%
0.0%
1 - 10% 11 - 20% 21 - 30% 31 - 40% 41 - 50% 51 - 60% 61 - 70% 71 - 80% 81 - 90%
100%
21.4% 0.0% 0.0%
3.6% 21.4%
0.0% 0.0%
3.6% 0.0%
7.1%
1 - 10% 11 - 20% 21 - 30% 31 - 40% 41 - 50% 51 - 60% 61 - 70% 71 - 80% 81 - 90%
100%
Employees that Receive Government Subsidies
Yes, 6.8%
No, 93.2%
Tennessee Nonprofit Compensation Survey
20
BENEFITS
Dental Insurance
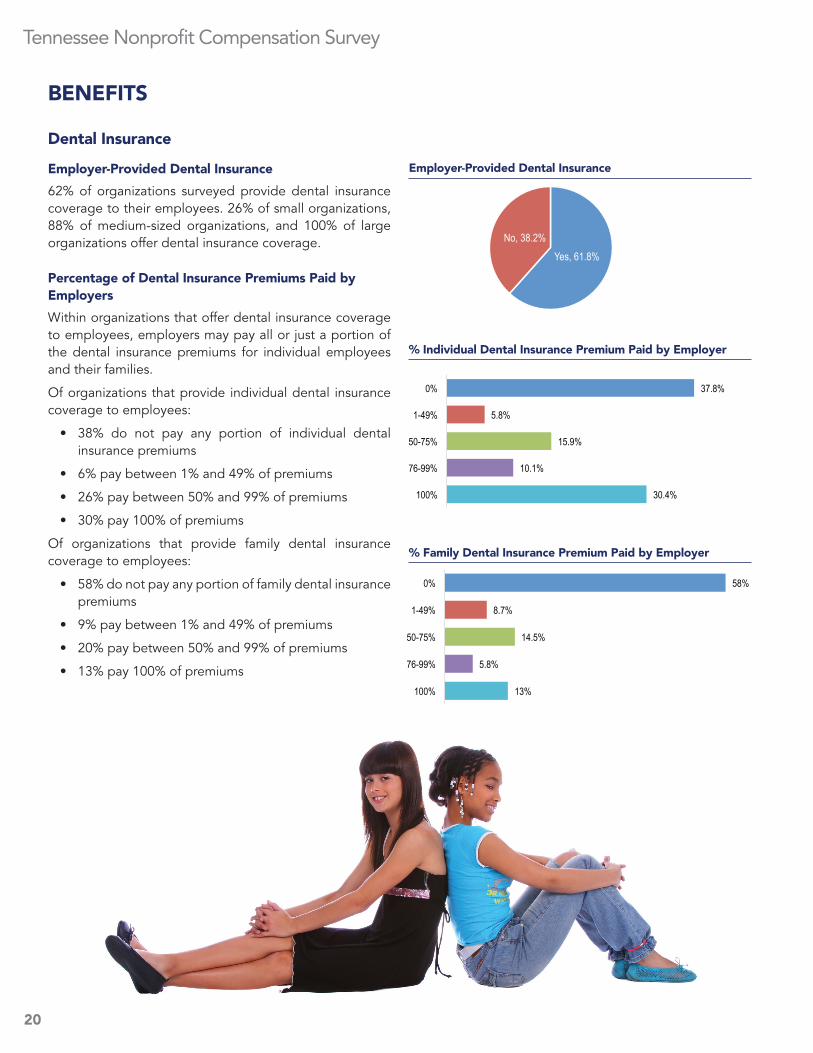
Employer-Provided Dental Insurance
62% of organizations surveyed provide dental insurance coverage to their employees. 26% of small organizations, 88% of medium-sized organizations, and 100% of large organizations offer dental insurance coverage.
Percentage of Dental Insurance Premiums Paid by Employers
Within organizations that offer dental insurance coverage to employees, employers may pay all or just a portion of the dental insurance premiums for individual employees and their families.
Of organizations that provide individual dental insurance coverage to employees:
• 38% do not pay any portion of individual dental insurance premiums
• 6% pay between 1% and 49% of premiums
• 26% pay between 50% and 99% of premiums
• 30% pay 100% of premiums
Of organizations that provide family dental insurance coverage to employees:
• 58% do not pay any portion of family dental insurance premiums
• 9% pay between 1% and 49% of premiums
• 20% pay between 50% and 99% of premiums
• 13% pay 100% of premiums
Employer-Provided Dental Insurance
% Individual Dental Insurance Premium Paid by Employer
% Family Dental Insurance Premium Paid by Employer
Yes, 61.8% No, 38.2%
37.8%
5.8%
15.9%
10.1%
30.4%
0%
1-49%
50-75%
76-99%
100%
58%
8.7%
14.5%
5.8%
13%
0%
1-49%
50-75%
76-99%
100%
21
Tennessee Nonprofit Compensation Survey
BENEFITS
Vision Insurance
Employer-Provided Vision Insurance
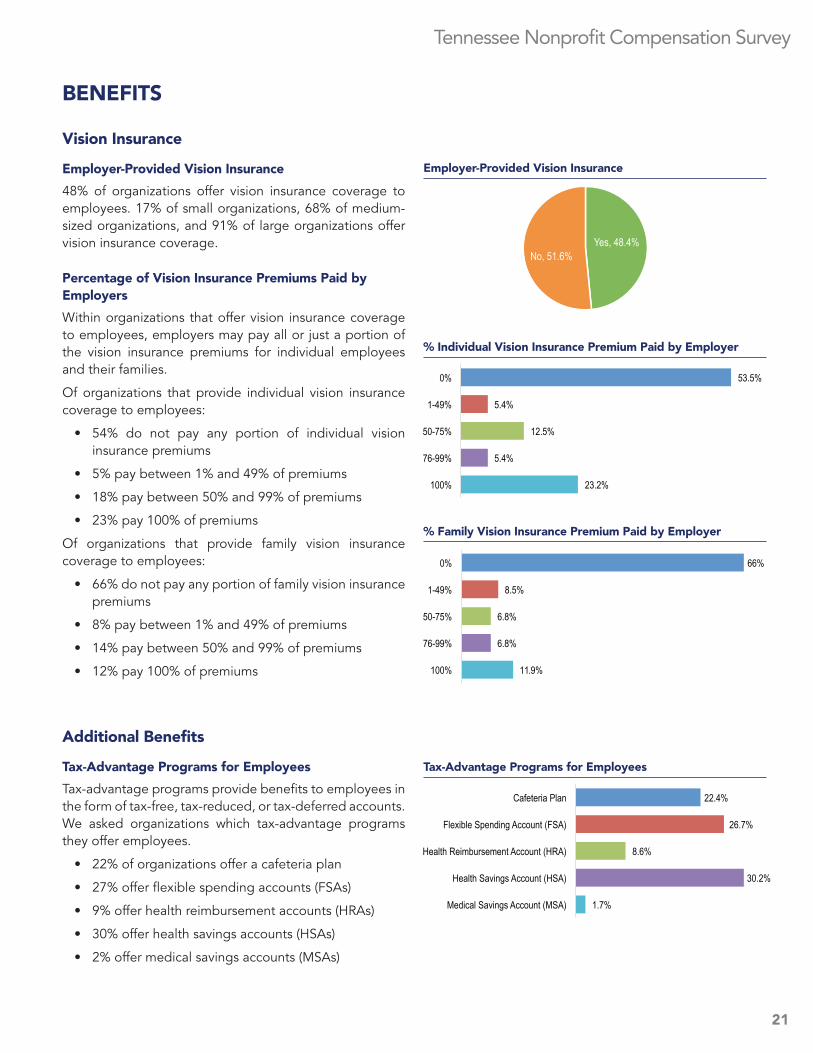
48% of organizations offer vision insurance coverage to employees. 17% of small organizations, 68% of medium-sized organizations, and 91% of large organizations offer vision insurance coverage.
Percentage of Vision Insurance Premiums Paid by Employers
Within organizations that offer vision insurance coverage to employees, employers may pay all or just a portion of the vision insurance premiums for individual employees and their families.
Of organizations that provide individual vision insurance coverage to employees:
• 54% do not pay any portion of individual vision insurance premiums
• 5% pay between 1% and 49% of premiums
• 18% pay between 50% and 99% of premiums
• 23% pay 100% of premiums
Of organizations that provide family vision insurance coverage to employees:
• 66% do not pay any portion of family vision insurance premiums
• 8% pay between 1% and 49% of premiums
• 14% pay between 50% and 99% of premiums
• 12% pay 100% of premiums
Additional Benefits
Tax-Advantage Programs for Employees
Tax-advantage programs provide benefits to employees in the form of tax-free, tax-reduced, or tax-deferred accounts. We asked organizations which tax-advantage programs they offer employees.
• 22% of organizations offer a cafeteria plan
• 27% offer flexible spending accounts (FSAs)
• 9% offer health reimbursement accounts (HRAs)
• 30% offer health savings accounts (HSAs)
• 2% offer medical savings accounts (MSAs)
Employer-Provided Vision Insurance
% Individual Vision Insurance Premium Paid by Employer
% Family Vision Insurance Premium Paid by Employer
Tax-Advantage Programs for Employees
Yes, 48.4% No, 51.6%
53.5%
5.4%
12.5%
5.4%
23.2%
0%
1-49%
50-75%
76-99%
100%
66%
8.5%
6.8%
6.8%
11.9%
0%
1-49%
50-75%
76-99%
100%
22.4%
26.7%
8.6%
30.2%
1.7%
Cafeteria Plan
Flexible Spending Account (FSA)
Health Reimbursement Account (HRA)
Health Savings Account (HSA)
Medical Savings Account (MSA)
Tennessee Nonprofit Compensation Survey
22
Retirement Plans for Employees
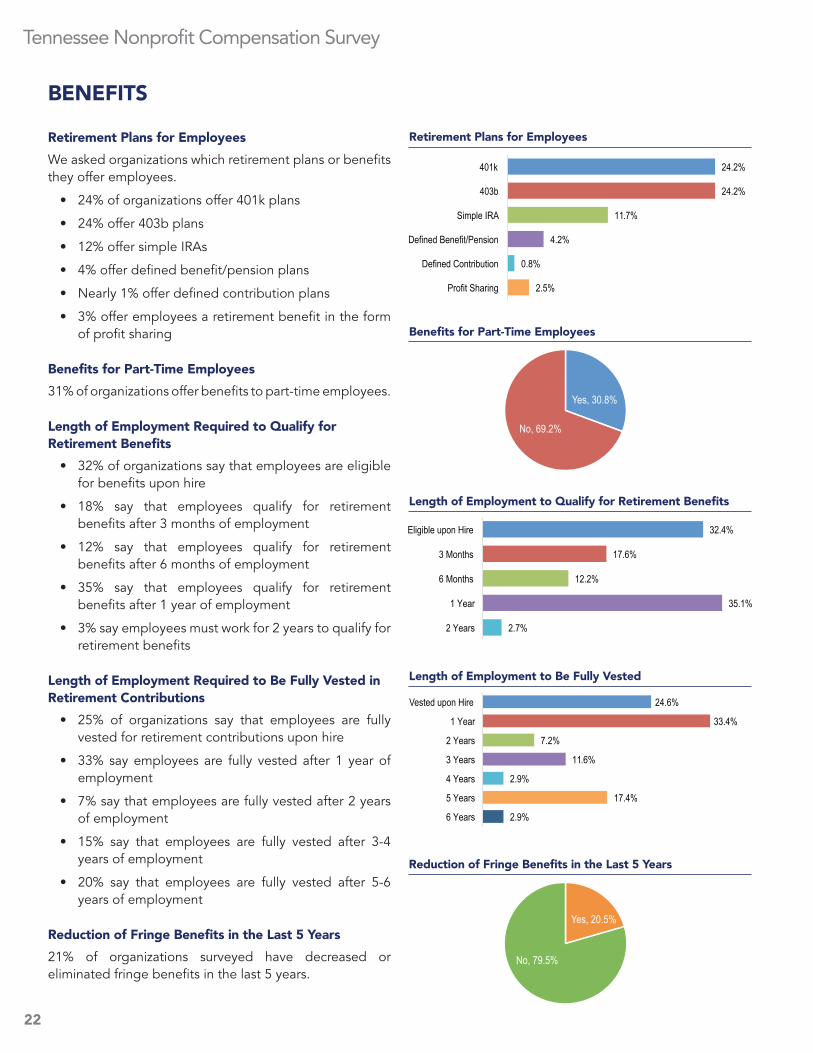
We asked organizations which retirement plans or benefits they offer employees.
• 24% of organizations offer 401k plans
• 24% offer 403b plans
• 12% offer simple IRAs
• 4% offer defined benefit/pension plans
• Nearly 1% offer defined contribution plans
• 3% offer employees a retirement benefit in the form of profit sharing
Benefits for Part-Time Employees
31% of organizations offer benefits to part-time employees.
Length of Employment Required to Qualify for Retirement Benefits
• 32% of organizations say that employees are eligible for benefits upon hire
• 18% say that employees qualify for retirement benefits after 3 months of employment
• 12% say that employees qualify for retirement benefits after 6 months of employment
• 35% say that employees qualify for retirement benefits after 1 year of employment
• 3% say employees must work for 2 years to qualify for retirement benefits
Length of Employment Required to Be Fully Vested in Retirement Contributions
• 25% of organizations say that employees are fully vested for retirement contributions upon hire
• 33% say employees are fully vested after 1 year of employment
• 7% say that employees are fully vested after 2 years of employment
• 15% say that employees are fully vested after 3-4 years of employment
• 20% say that employees are fully vested after 5-6 years of employment
Reduction of Fringe Benefits in the Last 5 Years
21% of organizations surveyed have decreased or eliminated fringe benefits in the last 5 years.
BENEFITS
Retirement Plans for Employees
Benefits for Part-Time Employees
Length of Employment to Qualify for Retirement Benefits
24.2%
24.2%
11.7%
4.2%
0.8%
2.5%
401k
403b
Simple IRA
Defined Benefit/Pension
Defined Contribution
Profit Sharing
Yes, 30.8%
No, 69.2%
Length of Employment to Be Fully Vested
Reduction of Fringe Benefits in the Last 5 Years
Yes, 20.5%
No, 79.5%
32.4%
17.6%
12.2%
35.1%
2.7%
Eligible upon Hire
3 Months
6 Months
1 Year
2 Years
24.6%
33.4%
7.2%
11.6%
2.9%
17.4%
2.9%
Vested upon Hire
1 Year
2 Years
3 Years
4 Years
5 Years
6 Years
23
Tennessee Nonprofit Compensation Survey
BENEFITS
Paid Time Off for Full-Time Employees
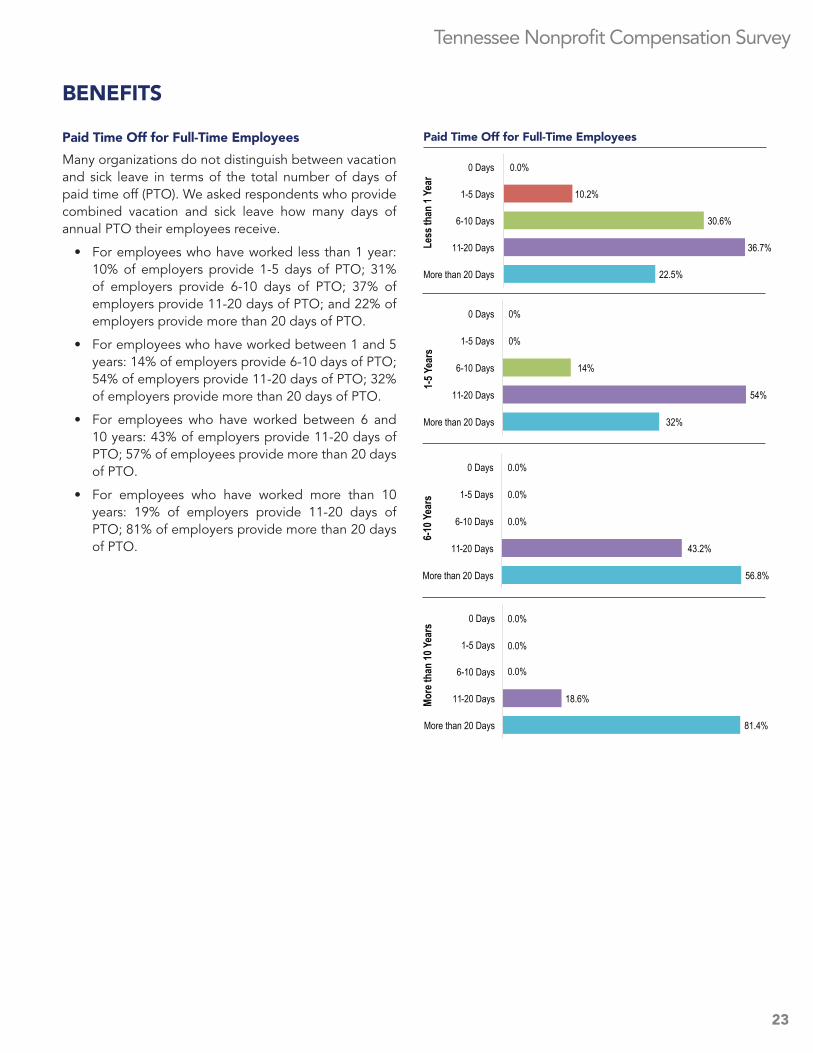
Many organizations do not distinguish between vacation and sick leave in terms of the total number of days of paid time off (PTO). We asked respondents who provide combined vacation and sick leave how many days of annual PTO their employees receive.
• For employees who have worked less than 1 year: 10% of employers provide 1-5 days of PTO; 31% of employers provide 6-10 days of PTO; 37% of employers provide 11-20 days of PTO; and 22% of employers provide more than 20 days of PTO.
• For employees who have worked between 1 and 5 years: 14% of employers provide 6-10 days of PTO; 54% of employers provide 11-20 days of PTO; 32% of employers provide more than 20 days of PTO.
• For employees who have worked between 6 and 10 years: 43% of employers provide 11-20 days of PTO; 57% of employees provide more than 20 days of PTO.
• For employees who have worked more than 10 years: 19% of employers provide 11-20 days of PTO; 81% of employers provide more than 20 days of PTO.
Paid Time Off for Full-Time Employees
Les
s tha
n 1 Y
ear
More
than
10 Y
ears
6-
10 Y
ears
0.0%
10.2%
30.6%
36.7%
22.5%
0 Days
1-5 Days
6-10 Days
11-20 Days
More than 20 Days
0%
0%
14%
54%
32%
0 Days
1-5 Days
6-10 Days
11-20 Days
More than 20 Days
0.0%
0.0%
0.0%
43.2%
56.8%
0 Days
1-5 Days
6-10 Days
11-20 Days
More than 20 Days
1-5 Y
ears
18.6%
81.4%
0 Days
1-5 Days
6-10 Days
11-20 Days
More than 20 Days
0.0%
0.0%
0.0%
Tennessee Nonprofit Compensation Survey
24
Paid Vacation for Full-Time Employees
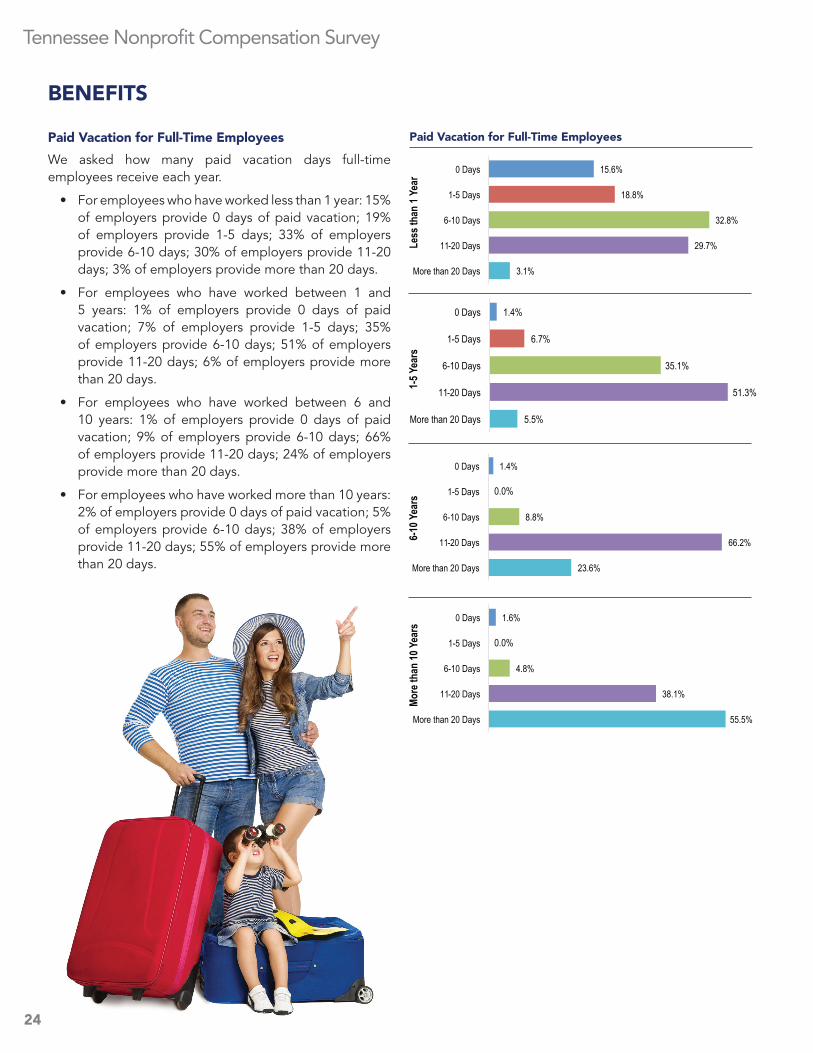
We asked how many paid vacation days full-time employees receive each year.
• For employees who have worked less than 1 year: 15% of employers provide 0 days of paid vacation; 19% of employers provide 1-5 days; 33% of employers provide 6-10 days; 30% of employers provide 11-20 days; 3% of employers provide more than 20 days.
• For employees who have worked between 1 and 5 years: 1% of employers provide 0 days of paid vacation; 7% of employers provide 1-5 days; 35% of employers provide 6-10 days; 51% of employers provide 11-20 days; 6% of employers provide more than 20 days.
• For employees who have worked between 6 and 10 years: 1% of employers provide 0 days of paid vacation; 9% of employers provide 6-10 days; 66% of employers provide 11-20 days; 24% of employers provide more than 20 days.
• For employees who have worked more than 10 years: 2% of employers provide 0 days of paid vacation; 5% of employers provide 6-10 days; 38% of employers provide 11-20 days; 55% of employers provide more than 20 days.
BENEFITS
Paid Vacation for Full-Time Employees
Les
s tha
n 1 Y
ear
More
than
10 Y
ears
6-
10 Y
ears
1-
5 Yea
rs
15.6%
18.8%
32.8%
29.7%
3.1%
0 Days
1-5 Days
6-10 Days
11-20 Days
More than 20 Days
1.4%
6.7%
35.1%
51.3%
5.5%
0 Days
1-5 Days
6-10 Days
11-20 Days
More than 20 Days
1.4%
8.8%
66.2%
23.6%
0 Days
1-5 Days
6-10 Days
11-20 Days
More than 20 Days
0.0%
1.6%
4.8%
38.1%
55.5%
0 Days
1-5 Days
6-10 Days
11-20 Days
More than 20 Days
0.0%
25
Tennessee Nonprofit Compensation Survey
BENEFITS
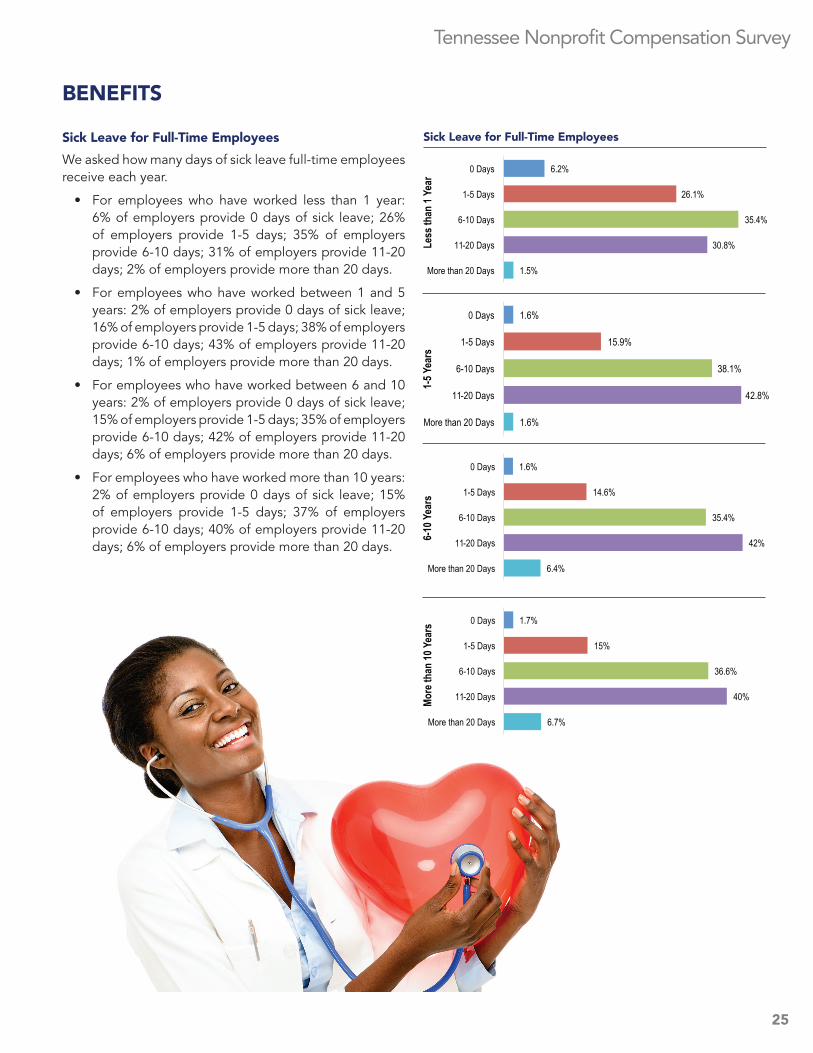
Sick Leave for Full-Time Employees
We asked how many days of sick leave full-time employees receive each year.
• For employees who have worked less than 1 year: 6% of employers provide 0 days of sick leave; 26% of employers provide 1-5 days; 35% of employers provide 6-10 days; 31% of employers provide 11-20 days; 2% of employers provide more than 20 days.
• For employees who have worked between 1 and 5 years: 2% of employers provide 0 days of sick leave; 16% of employers provide 1-5 days; 38% of employers provide 6-10 days; 43% of employers provide 11-20 days; 1% of employers provide more than 20 days.
• For employees who have worked between 6 and 10 years: 2% of employers provide 0 days of sick leave; 15% of employers provide 1-5 days; 35% of employers provide 6-10 days; 42% of employers provide 11-20 days; 6% of employers provide more than 20 days.
• For employees who have worked more than 10 years: 2% of employers provide 0 days of sick leave; 15% of employers provide 1-5 days; 37% of employers provide 6-10 days; 40% of employers provide 11-20 days; 6% of employers provide more than 20 days.
Sick Leave for Full-Time Employees
Les
s tha
n 1 Y
ear
More
than
10 Y
ears
6-
10 Y
ears
1-
5 Yea
rs
6.2%
26.1%
35.4%
30.8%
1.5%
0 Days
1-5 Days
6-10 Days
11-20 Days
More than 20 Days
1.6%
14.6%
35.4%
42%
6.4%
0 Days
1-5 Days
6-10 Days
11-20 Days
More than 20 Days
1.7%
15%
36.6%
40%
6.7%
0 Days
1-5 Days
6-10 Days
11-20 Days
More than 20 Days
1.6%
15.9%
38.1%
42.8%
1.6%
0 Days
1-5 Days
6-10 Days
11-20 Days
More than 20 Days
Tennessee Nonprofit Compensation Survey
26
Administrative Assistant
Executive Assistant Office Manager
COMPENSATION
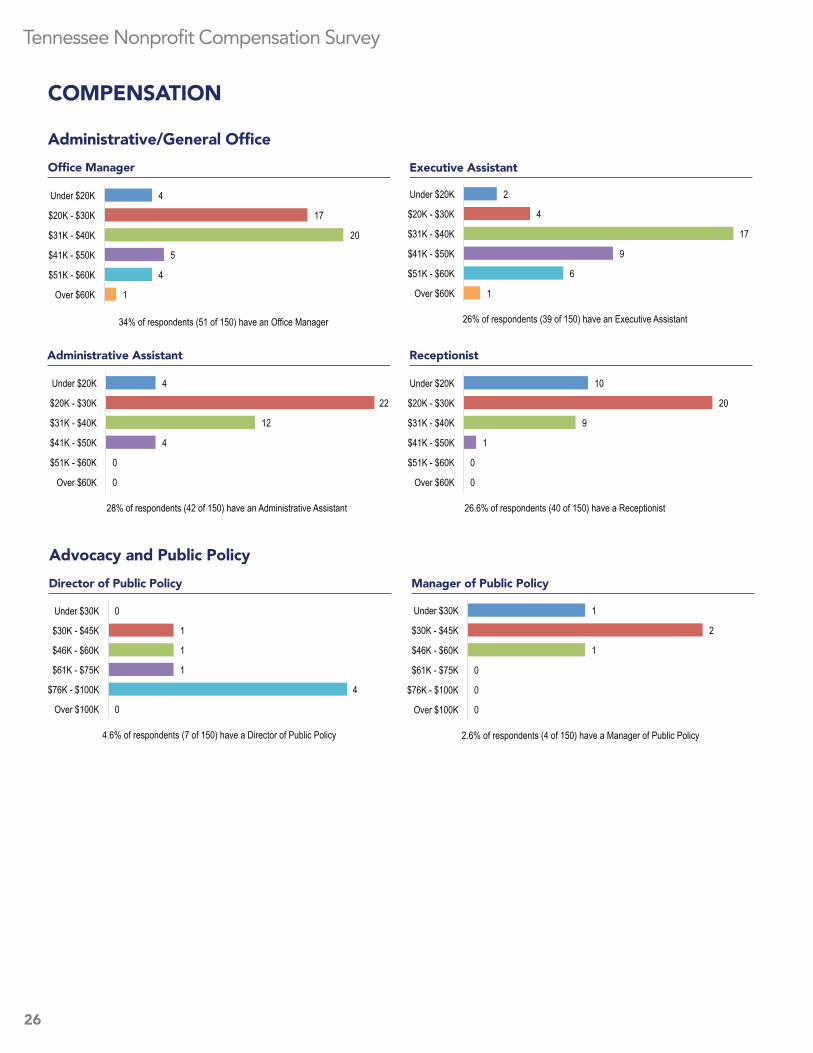
Administrative/General Office
Receptionist
Director of Public Policy Manager of Public Policy
Advocacy and Public Policy
4
17
20
5
4
1
Under $20K
$20K - $30K
$31K - $40K
$41K - $50K
$51K - $60K
Over $60K
34% of respondents (51 of 150) have an Office Manager
2
4
17
9
6
1
Under $20K
$20K - $30K
$31K - $40K
$41K - $50K
$51K - $60K
Over $60K
26% of respondents (39 of 150) have an Executive Assistant
4
22
12
4
0
0
Under $20K
$20K - $30K
$31K - $40K
$41K - $50K
$51K - $60K
Over $60K
28% of respondents (42 of 150) have an Administrative Assistant
10
20
9
1
0
0
Under $20K
$20K - $30K
$31K - $40K
$41K - $50K
$51K - $60K
Over $60K
26.6% of respondents (40 of 150) have a Receptionist
1
2
1
0
0
0
Under $30K
$30K - $45K
$46K - $60K
$61K - $75K
$76K - $100K
Over $100K
2.6% of respondents (4 of 150) have a Manager of Public Policy
0
1
1
1
4
0
Under $30K
$30K - $45K
$46K - $60K
$61K - $75K
$76K - $100K
Over $100K
4.6% of respondents (7 of 150) have a Director of Public Policy
27
Tennessee Nonprofit Compensation Survey
Manager of Communications
Assistant Director of Communications Director of Communications
COMPENSATION
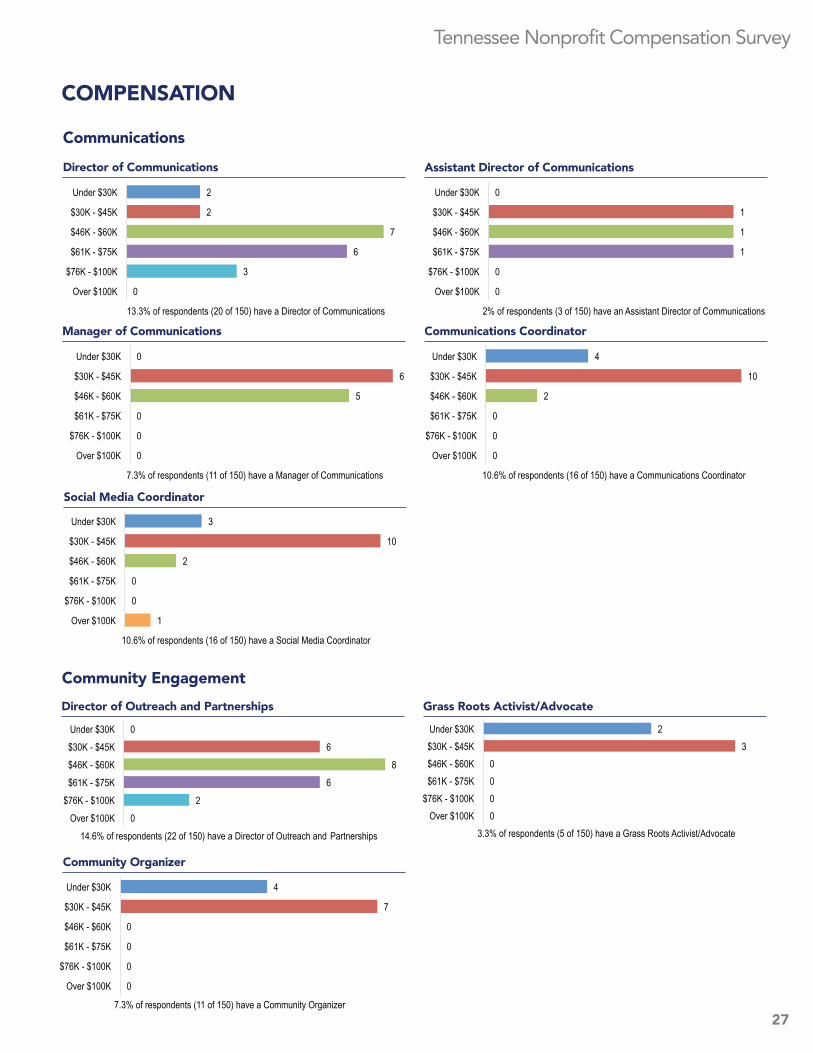
Communications
Communications Coordinator
Social Media Coordinator
Director of Outreach and Partnerships
Community Engagement
Grass Roots Activist/Advocate
Community Organizer
2
2
7
6
3
0
Under $30K
$30K - $45K
$46K - $60K
$61K - $75K
$76K - $100K
Over $100K
13.3% of respondents (20 of 150) have a Director of Communications
0
1
1
1
0
0
Under $30K
$30K - $45K
$46K - $60K
$61K - $75K
$76K - $100K
Over $100K
2% of respondents (3 of 150) have an Assistant Director of Communications
0
6
5
0
0
0
Under $30K
$30K - $45K
$46K - $60K
$61K - $75K
$76K - $100K
Over $100K
7.3% of respondents (11 of 150) have a Manager of Communications
4
10
2
0
0
0
Under $30K
$30K - $45K
$46K - $60K
$61K - $75K
$76K - $100K
Over $100K
10.6% of respondents (16 of 150) have a Communications Coordinator
3
10
2
0
0
1
Under $30K
$30K - $45K
$46K - $60K
$61K - $75K
$76K - $100K
Over $100K
10.6% of respondents (16 of 150) have a Social Media Coordinator
0 6
8 6
2 0
Under $30K $30K - $45K $46K - $60K $61K - $75K
$76K - $100K Over $100K
14.6% of respondents (22 of 150) have a Director of Outreach and Partnerships
4
7
0
0
0
0
Under $30K
$30K - $45K
$46K - $60K
$61K - $75K
$76K - $100K
Over $100K
7.3% of respondents (11 of 150) have a Community Organizer
2 3
0 0 0 0
Under $30K $30K - $45K $46K - $60K $61K - $75K
$76K - $100K Over $100K
3.3% of respondents (5 of 150) have a Grass Roots Activist/Advocate
Tennessee Nonprofit Compensation Survey
28
Counselor
Instructor/Teacher Director of Education
COMPENSATION
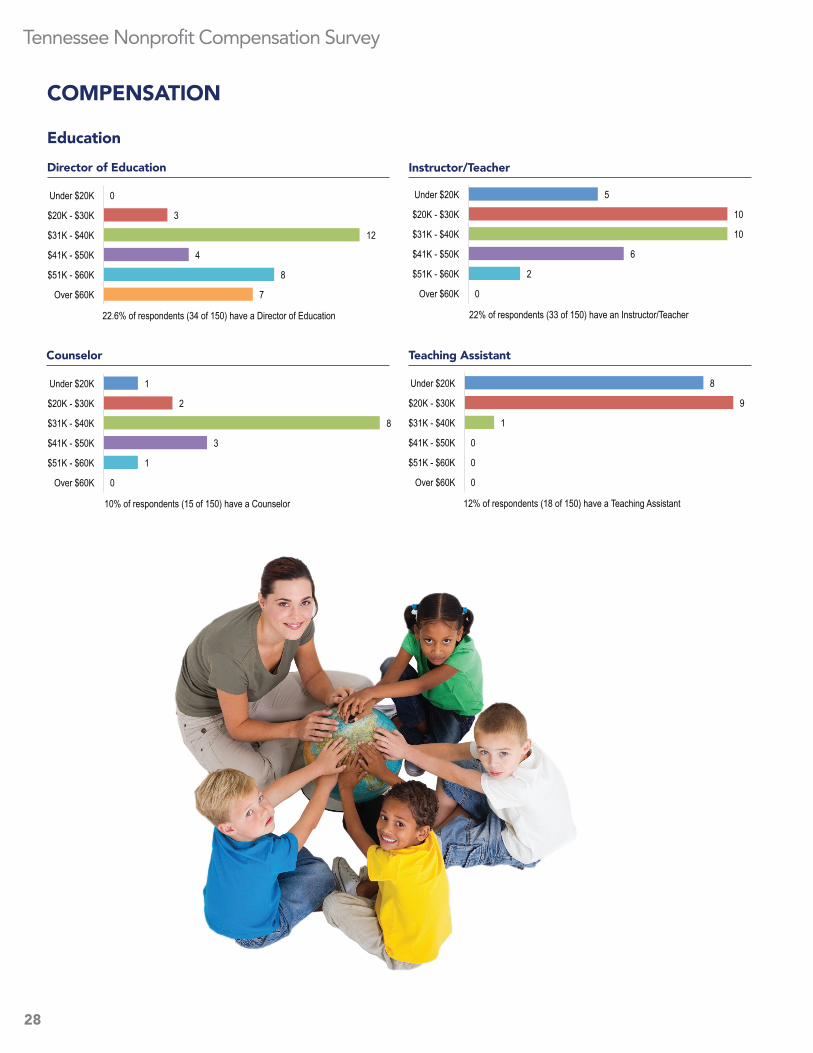
Education
Teaching Assistant
5
10
10
6
2
0
Under $20K
$20K - $30K
$31K - $40K
$41K - $50K
$51K - $60K
Over $60K
22% of respondents (33 of 150) have an Instructor/Teacher
0
3
12
4
8
7
Under $20K
$20K - $30K
$31K - $40K
$41K - $50K
$51K - $60K
Over $60K
22.6% of respondents (34 of 150) have a Director of Education
1
2
8
3
1
0
Under $20K
$20K - $30K
$31K - $40K
$41K - $50K
$51K - $60K
Over $60K
10% of respondents (15 of 150) have a Counselor
8
9
1
0
0
0
Under $20K
$20K - $30K
$31K - $40K
$41K - $50K
$51K - $60K
Over $60K
12% of respondents (18 of 150) have a Teaching Assistant
29
Tennessee Nonprofit Compensation Survey
COMPENSATION
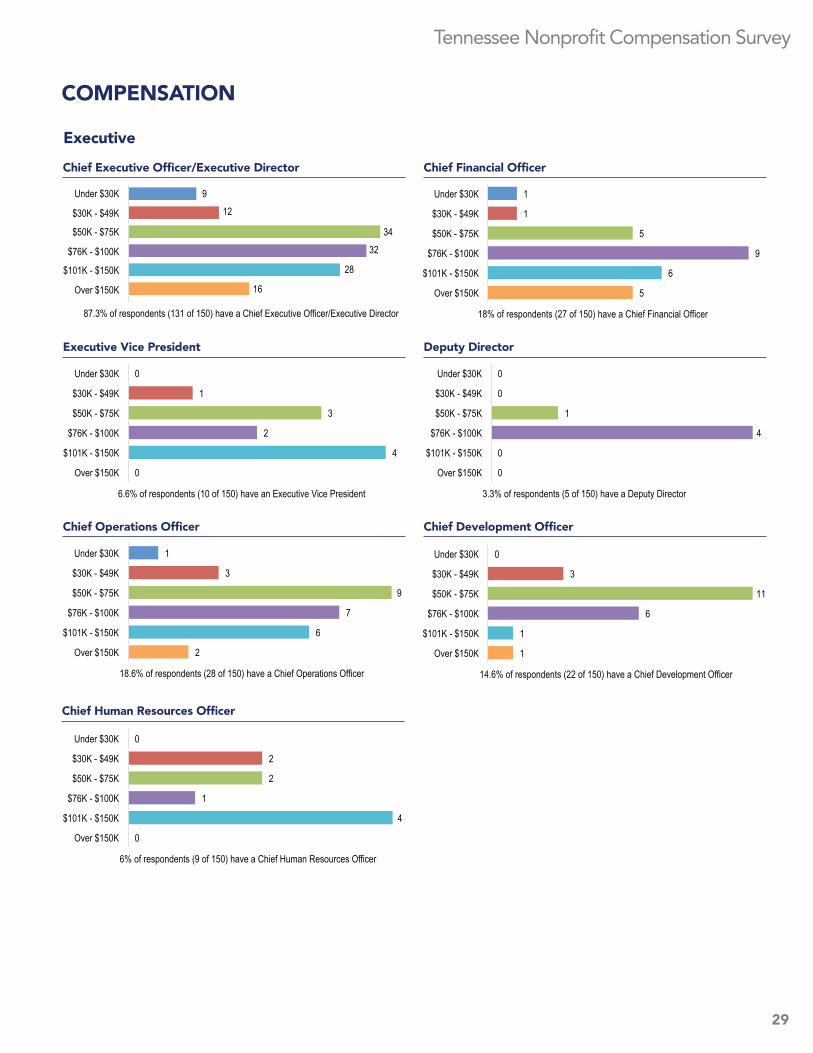
Chief Executive Officer/Executive Director
Executive
Chief Financial Officer
Executive Vice President Deputy Director
Chief Operations Officer Chief Development Officer
Chief Human Resources Officer
0
1
3
2
4
0
Under $30K
$30K - $49K
$50K - $75K
$76K - $100K
$101K - $150K
Over $150K
6.6% of respondents (10 of 150) have an Executive Vice President
0
0
1
4
0
0
Under $30K
$30K - $49K
$50K - $75K
$76K - $100K
$101K - $150K
Over $150K
3.3% of respondents (5 of 150) have a Deputy Director
1
3
9
7
6
2
Under $30K
$30K - $49K
$50K - $75K
$76K - $100K
$101K - $150K
Over $150K
18.6% of respondents (28 of 150) have a Chief Operations Officer
0
3
11
6
1
1
Under $30K
$30K - $49K
$50K - $75K
$76K - $100K
$101K - $150K
Over $150K
14.6% of respondents (22 of 150) have a Chief Development Officer
0
2
2
1
4
0
Under $30K
$30K - $49K
$50K - $75K
$76K - $100K
$101K - $150K
Over $150K
6% of respondents (9 of 150) have a Chief Human Resources Officer
9 12
34 32
28
16
Under $30K
$30K - $49K
$50K - $75K
$76K - $100K
$101K - $150K
Over $150K
87.3% of respondents (131 of 150) have a Chief Executive Officer/Executive Director
1
1
5
9
6
5
Under $30K
$30K - $49K
$50K - $75K
$76K - $100K
$101K - $150K
Over $150K
18% of respondents (27 of 150) have a Chief Financial Officer
Tennessee Nonprofit Compensation Survey
30
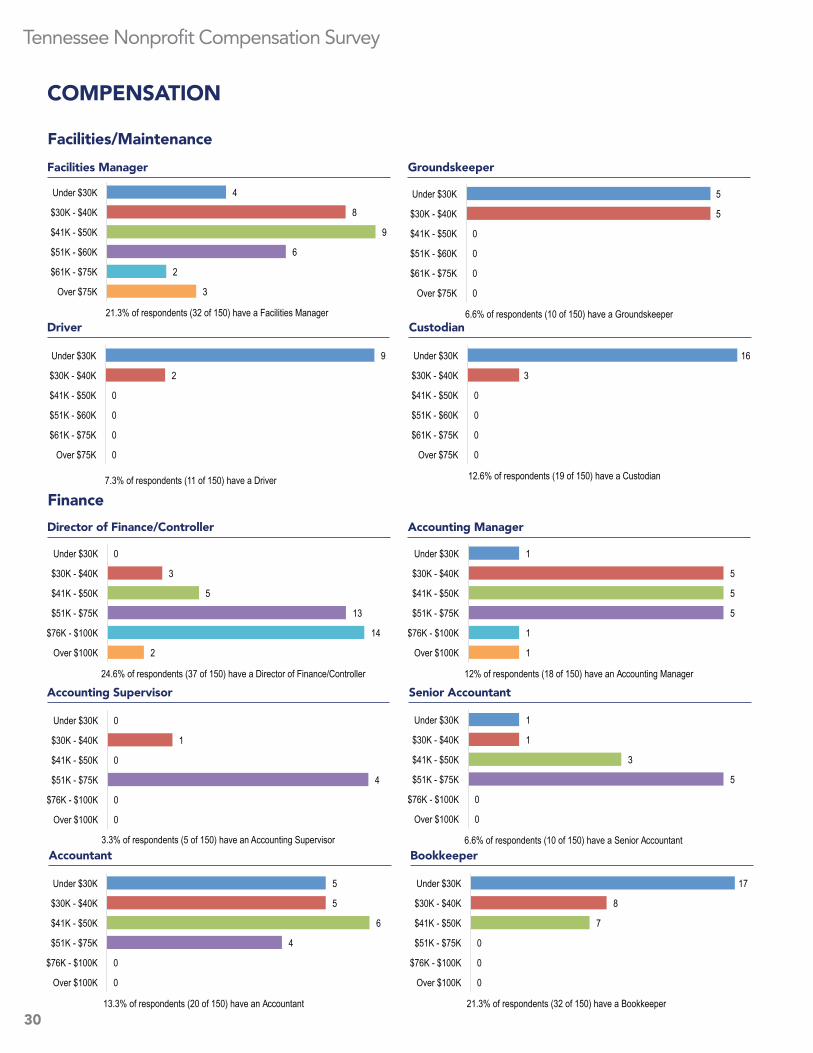
Bookkeeper Accountant
COMPENSATION
Facilities Manager
Facilities/Maintenance
Driver
Groundskeeper
Custodian
Director of Finance/Controller
Finance
Accounting Supervisor
Accounting Manager
Senior Accountant
4
8
9
6
2
3
Under $30K
$30K - $40K
$41K - $50K
$51K - $60K
$61K - $75K
Over $75K
21.3% of respondents (32 of 150) have a Facilities Manager
5
5
0
0
0
0
Under $30K
$30K - $40K
$41K - $50K
$51K - $60K
$61K - $75K
Over $75K
6.6% of respondents (10 of 150) have a Groundskeeper
16
3
0
0
0
0
Under $30K
$30K - $40K
$41K - $50K
$51K - $60K
$61K - $75K
Over $75K
12.6% of respondents (19 of 150) have a Custodian
9
2
0
0
0
0
Under $30K
$30K - $40K
$41K - $50K
$51K - $60K
$61K - $75K
Over $75K
7.3% of respondents (11 of 150) have a Driver
0
3
5
13
14
2
Under $30K
$30K - $40K
$41K - $50K
$51K - $75K
$76K - $100K
Over $100K
24.6% of respondents (37 of 150) have a Director of Finance/Controller
1
5
5
5
1
1
Under $30K
$30K - $40K
$41K - $50K
$51K - $75K
$76K - $100K
Over $100K
12% of respondents (18 of 150) have an Accounting Manager
0
1
0
4
0
0
Under $30K
$30K - $40K
$41K - $50K
$51K - $75K
$76K - $100K
Over $100K
3.3% of respondents (5 of 150) have an Accounting Supervisor
1
1
3
5
0
0
Under $30K
$30K - $40K
$41K - $50K
$51K - $75K
$76K - $100K
Over $100K
6.6% of respondents (10 of 150) have a Senior Accountant
5
5
6
4
0
0
Under $30K
$30K - $40K
$41K - $50K
$51K - $75K
$76K - $100K
Over $100K
13.3% of respondents (20 of 150) have an Accountant
17
8
7
0
0
0
Under $30K
$30K - $40K
$41K - $50K
$51K - $75K
$76K - $100K
Over $100K
21.3% of respondents (32 of 150) have a Bookkeeper
31
Tennessee Nonprofit Compensation Survey
COMPENSATION
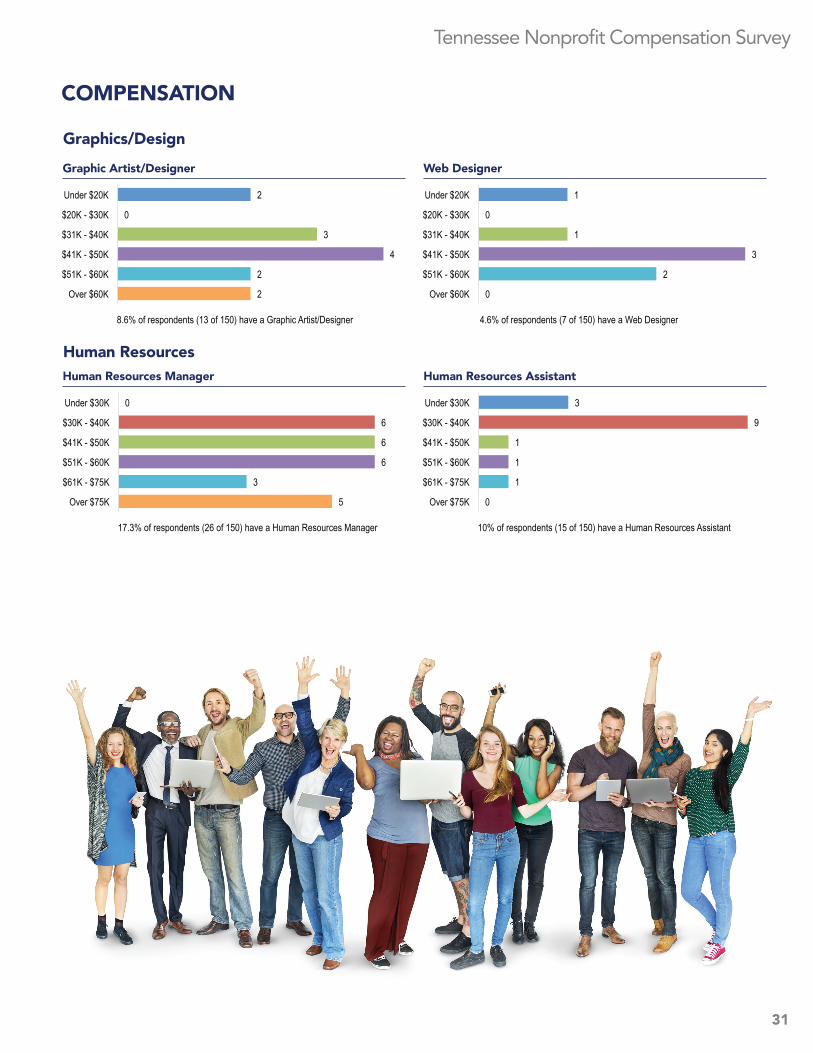
Graphic Artist/Designer
Graphics/Design
Web Designer
Human Resources Manager
Human Resources Human Resources Assistant
2
0
3
4
2
2
Under $20K
$20K - $30K
$31K - $40K
$41K - $50K
$51K - $60K
Over $60K
8.6% of respondents (13 of 150) have a Graphic Artist/Designer
1
0
1
3
2
0
Under $20K
$20K - $30K
$31K - $40K
$41K - $50K
$51K - $60K
Over $60K
4.6% of respondents (7 of 150) have a Web Designer
0
6
6
6
3
5
Under $30K
$30K - $40K
$41K - $50K
$51K - $60K
$61K - $75K
Over $75K
17.3% of respondents (26 of 150) have a Human Resources Manager
3
9
1
1
1
0
Under $30K
$30K - $40K
$41K - $50K
$51K - $60K
$61K - $75K
Over $75K
10% of respondents (15 of 150) have a Human Resources Assistant
Tennessee Nonprofit Compensation Survey
32
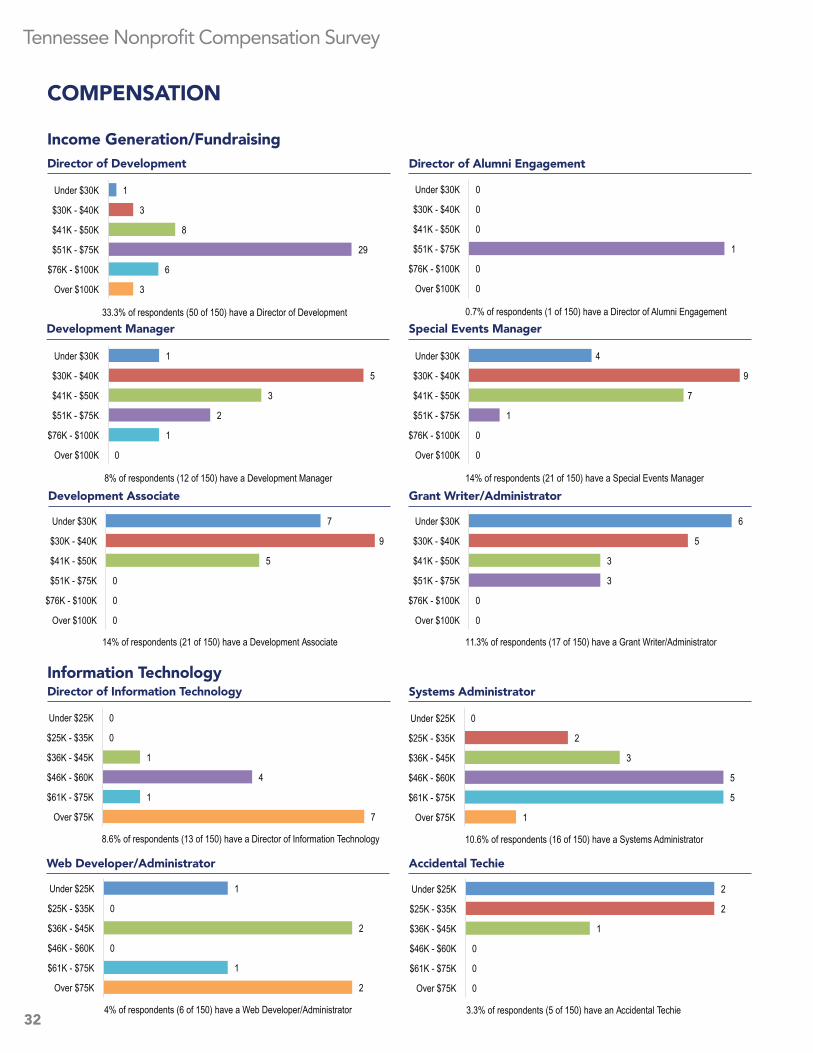
Development Manager
Director of Alumni Engagement Director of Development
COMPENSATION
Income Generation/Fundraising
Special Events Manager
Development Associate Grant Writer/Administrator
Web Developer/Administrator
Systems Administrator Director of Information Technology Information Technology
Accidental Techie
1
3
8
29
6
3
Under $30K
$30K - $40K
$41K - $50K
$51K - $75K
$76K - $100K
Over $100K
33.3% of respondents (50 of 150) have a Director of Development
0
0
0
1
0
0
Under $30K
$30K - $40K
$41K - $50K
$51K - $75K
$76K - $100K
Over $100K
0.7% of respondents (1 of 150) have a Director of Alumni Engagement
1
5
3
2
1
0
Under $30K
$30K - $40K
$41K - $50K
$51K - $75K
$76K - $100K
Over $100K
8% of respondents (12 of 150) have a Development Manager
4
9
7
1
0
0
Under $30K
$30K - $40K
$41K - $50K
$51K - $75K
$76K - $100K
Over $100K
14% of respondents (21 of 150) have a Special Events Manager
6
5
3
3
0
0
Under $30K
$30K - $40K
$41K - $50K
$51K - $75K
$76K - $100K
Over $100K
11.3% of respondents (17 of 150) have a Grant Writer/Administrator
7
9
5
0
0
0
Under $30K
$30K - $40K
$41K - $50K
$51K - $75K
$76K - $100K
Over $100K
14% of respondents (21 of 150) have a Development Associate
0
0
1
4
1
7
Under $25K
$25K - $35K
$36K - $45K
$46K - $60K
$61K - $75K
Over $75K
8.6% of respondents (13 of 150) have a Director of Information Technology
0
2
3
5
5
1
Under $25K
$25K - $35K
$36K - $45K
$46K - $60K
$61K - $75K
Over $75K
10.6% of respondents (16 of 150) have a Systems Administrator
1
0
2
0
1
2
Under $25K
$25K - $35K
$36K - $45K
$46K - $60K
$61K - $75K
Over $75K
4% of respondents (6 of 150) have a Web Developer/Administrator
2
2
1
0
0
0
Under $25K
$25K - $35K
$36K - $45K
$46K - $60K
$61K - $75K
Over $75K
3.3% of respondents (5 of 150) have an Accidental Techie
33
Tennessee Nonprofit Compensation Survey
Paralegal
Staff Attorney Managing Attorney
Legal Services
Legal Secretary
Marketing Manager
Assistant Director of Marketing Director of Marketing
Marketing
Marketing Coordinator
Social Media Coordinator Marketing Researcher
COMPENSATION
2
0
0
0
0
4
Under $25K
$25K - $35K
$36K - $45K
$46K - $60K
$61K - $75K
Over $75K
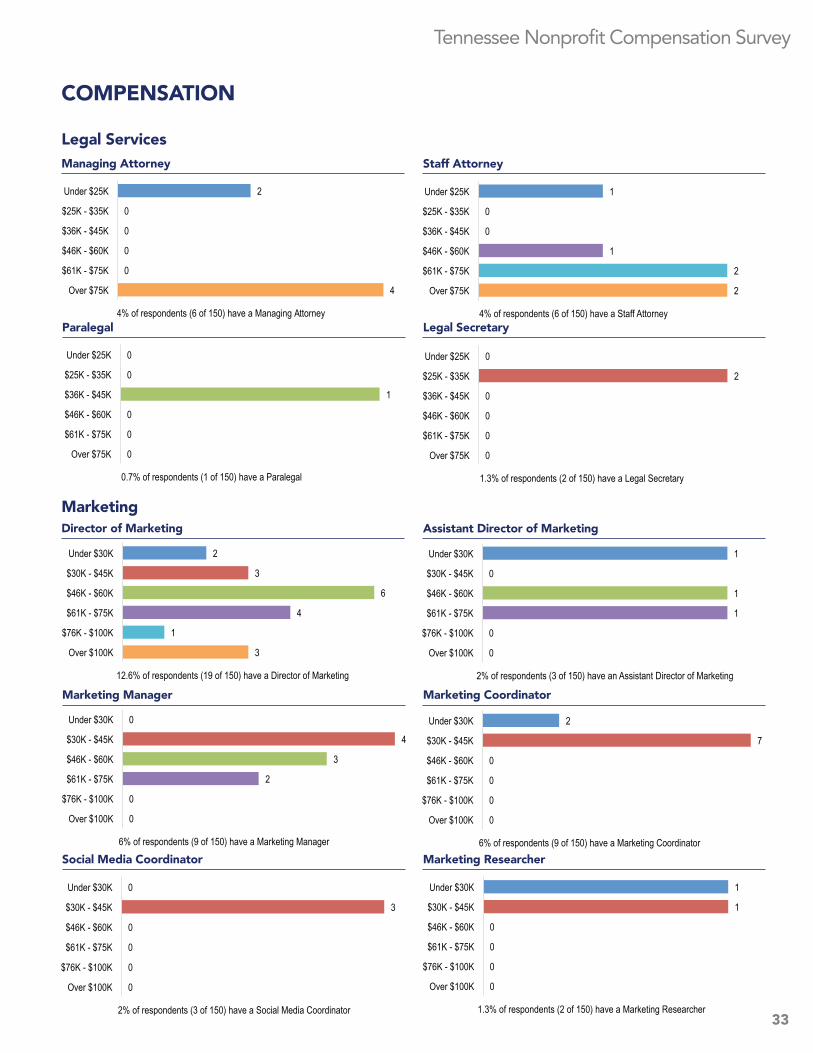
4% of respondents (6 of 150) have a Managing Attorney
1
0
0
1
2
2
Under $25K
$25K - $35K
$36K - $45K
$46K - $60K
$61K - $75K
Over $75K
4% of respondents (6 of 150) have a Staff Attorney
0
0
1
0
0
0
Under $25K
$25K - $35K
$36K - $45K
$46K - $60K
$61K - $75K
Over $75K
0.7% of respondents (1 of 150) have a Paralegal
0
2
0
0
0
0
Under $25K
$25K - $35K
$36K - $45K
$46K - $60K
$61K - $75K
Over $75K
1.3% of respondents (2 of 150) have a Legal Secretary
2
3
6
4
1
3
Under $30K
$30K - $45K
$46K - $60K
$61K - $75K
$76K - $100K
Over $100K
12.6% of respondents (19 of 150) have a Director of Marketing
1
0
1
1
0
0
Under $30K
$30K - $45K
$46K - $60K
$61K - $75K
$76K - $100K
Over $100K
2% of respondents (3 of 150) have an Assistant Director of Marketing
0
4
3
2
0
0
Under $30K
$30K - $45K
$46K - $60K
$61K - $75K
$76K - $100K
Over $100K
6% of respondents (9 of 150) have a Marketing Manager
2
7
0
0
0
0
Under $30K
$30K - $45K
$46K - $60K
$61K - $75K
$76K - $100K
Over $100K
6% of respondents (9 of 150) have a Marketing Coordinator
0
3
0
0
0
0
Under $30K
$30K - $45K
$46K - $60K
$61K - $75K
$76K - $100K
Over $100K
2% of respondents (3 of 150) have a Social Media Coordinator
1
1
0
0
0
0
Under $30K
$30K - $45K
$46K - $60K
$61K - $75K
$76K - $100K
Over $100K
1.3% of respondents (2 of 150) have a Marketing Researcher
Tennessee Nonprofit Compensation Survey
34
Director of Nursing
Clinic Director Medical Services Director
COMPENSATION
Medical Services
Speech Pathologist
Physical Therapist Occupational Therapist
Medical Records Clerk
Nurse Practitioner Registered Nurse
0
1
1
0
0
4
Under $30K
$30K - $49K
$50K - $75K
$76K - $100K
$101K - $150K
Over $150K
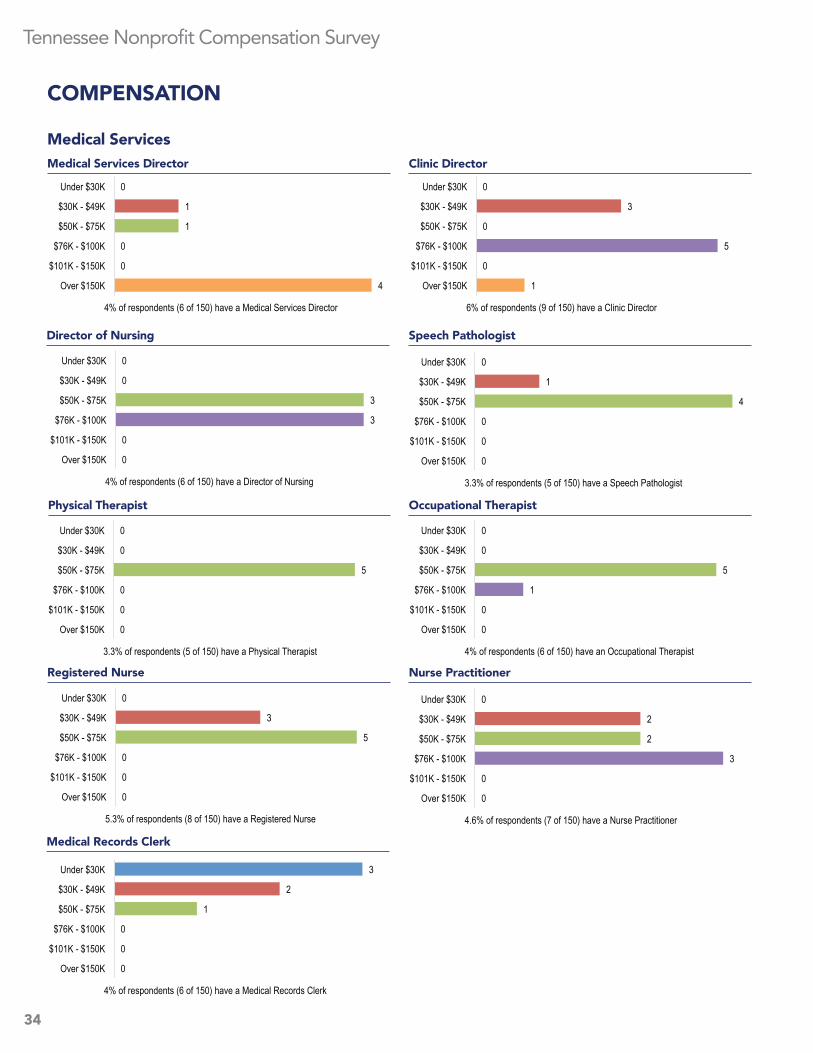
4% of respondents (6 of 150) have a Medical Services Director
0
3
0
5
0
1
Under $30K
$30K - $49K
$50K - $75K
$76K - $100K
$101K - $150K
Over $150K
6% of respondents (9 of 150) have a Clinic Director
0
0
3
3
0
0
Under $30K
$30K - $49K
$50K - $75K
$76K - $100K
$101K - $150K
Over $150K
4% of respondents (6 of 150) have a Director of Nursing
0
1
4
0
0
0
Under $30K
$30K - $49K
$50K - $75K
$76K - $100K
$101K - $150K
Over $150K
3.3% of respondents (5 of 150) have a Speech Pathologist
0
0
5
0
0
0
Under $30K
$30K - $49K
$50K - $75K
$76K - $100K
$101K - $150K
Over $150K
3.3% of respondents (5 of 150) have a Physical Therapist
0
0
5
1
0
0
Under $30K
$30K - $49K
$50K - $75K
$76K - $100K
$101K - $150K
Over $150K
4% of respondents (6 of 150) have an Occupational Therapist
0
3
5
0
0
0
Under $30K
$30K - $49K
$50K - $75K
$76K - $100K
$101K - $150K
Over $150K
5.3% of respondents (8 of 150) have a Registered Nurse
0
2
2
3
0
0
Under $30K
$30K - $49K
$50K - $75K
$76K - $100K
$101K - $150K
Over $150K
4.6% of respondents (7 of 150) have a Nurse Practitioner
3
2
1
0
0
0
Under $30K
$30K - $49K
$50K - $75K
$76K - $100K
$101K - $150K
Over $150K
4% of respondents (6 of 150) have a Medical Records Clerk
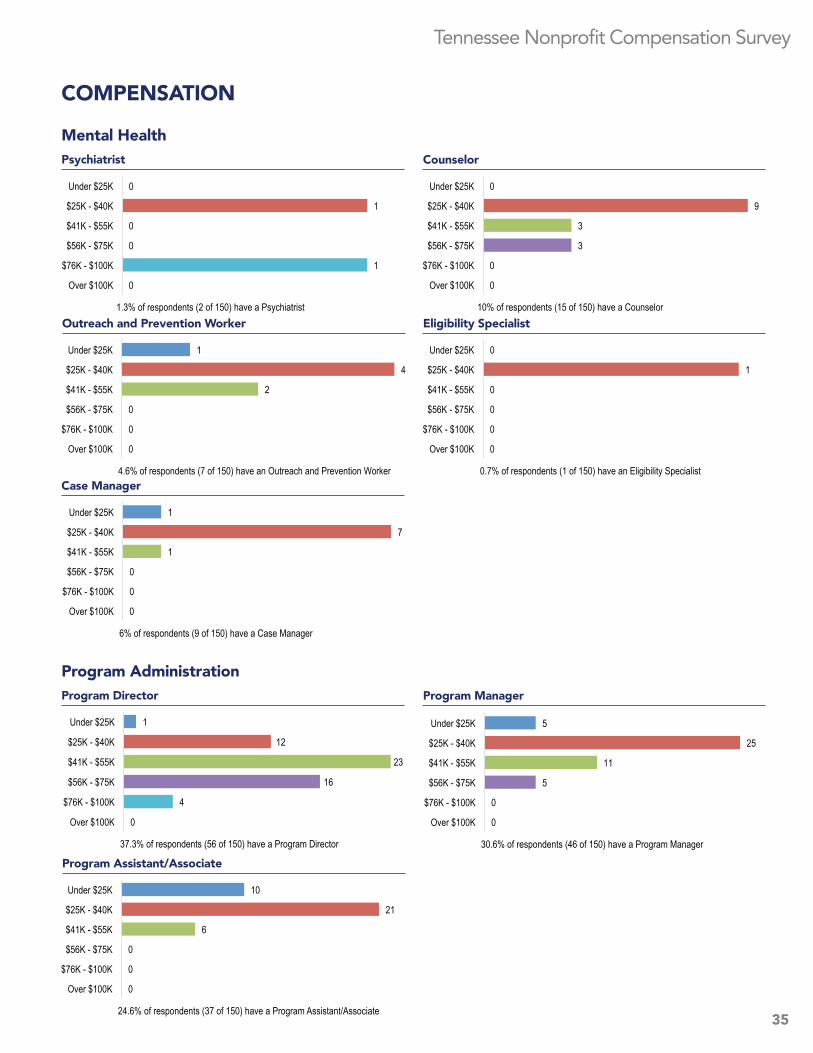
35
Tennessee Nonprofit Compensation Survey
Outreach and Prevention Worker
Counselor Psychiatrist
Mental Health
Eligibility Specialist
Case Manager
Program Assistant/Associate
Program Manager Program Director
Program Administration
COMPENSATION
0
1
0
0
1
0
Under $25K
$25K - $40K
$41K - $55K
$56K - $75K
$76K - $100K
Over $100K
1.3% of respondents (2 of 150) have a Psychiatrist
0
9
3
3
0
0
Under $25K
$25K - $40K
$41K - $55K
$56K - $75K
$76K - $100K
Over $100K
10% of respondents (15 of 150) have a Counselor
1
4
2
0
0
0
Under $25K
$25K - $40K
$41K - $55K
$56K - $75K
$76K - $100K
Over $100K
4.6% of respondents (7 of 150) have an Outreach and Prevention Worker
0
1
0
0
0
0
Under $25K
$25K - $40K
$41K - $55K
$56K - $75K
$76K - $100K
Over $100K
0.7% of respondents (1 of 150) have an Eligibility Specialist
1
7
1
0
0
0
Under $25K
$25K - $40K
$41K - $55K
$56K - $75K
$76K - $100K
Over $100K
6% of respondents (9 of 150) have a Case Manager
1
12
23
16
4
0
Under $25K
$25K - $40K
$41K - $55K
$56K - $75K
$76K - $100K
Over $100K
37.3% of respondents (56 of 150) have a Program Director
5
25
11
5
0
0
Under $25K
$25K - $40K
$41K - $55K
$56K - $75K
$76K - $100K
Over $100K
30.6% of respondents (46 of 150) have a Program Manager
10
21
6
0
0
0
Under $25K
$25K - $40K
$41K - $55K
$56K - $75K
$76K - $100K
Over $100K
24.6% of respondents (37 of 150) have a Program Assistant/Associate
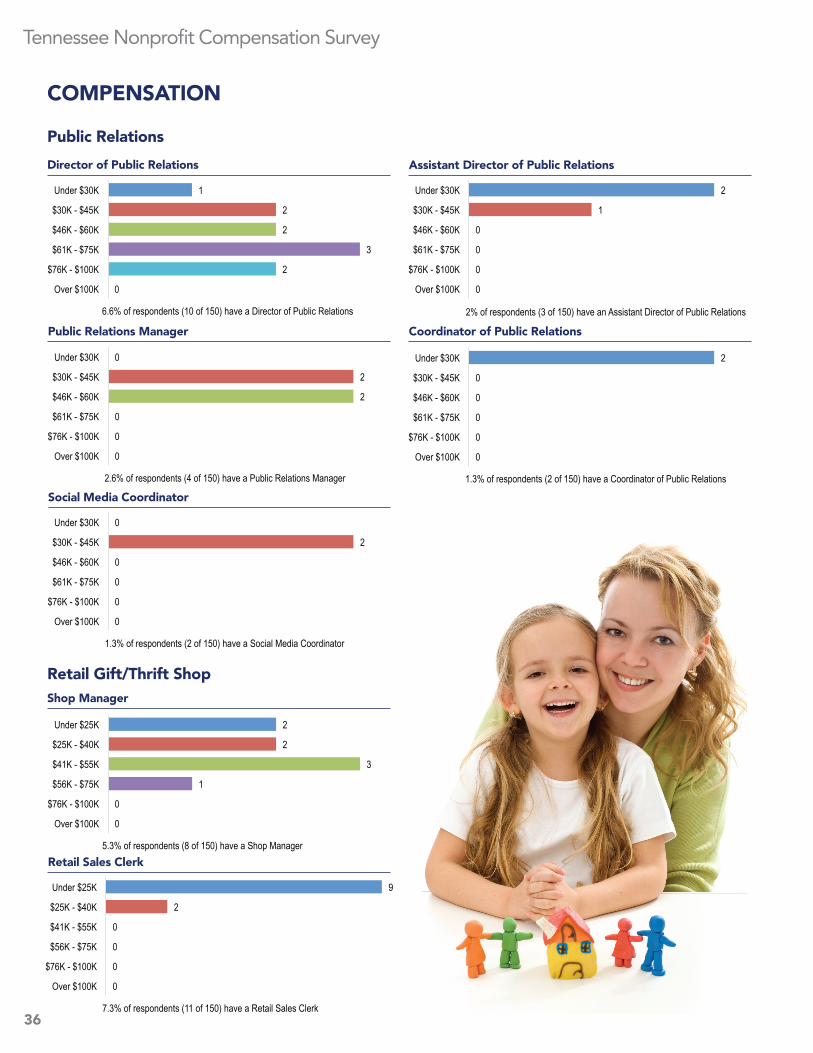
Tennessee Nonprofit Compensation Survey
36
Public Relations Manager
Assistant Director of Public Relations Director of Public Relations
COMPENSATION
Public Relations
Coordinator of Public Relations
Social Media Coordinator
Retail Sales Clerk
Shop Manager
Retail Gift/Thrift Shop
1
2
2
3
2
0
Under $30K
$30K - $45K
$46K - $60K
$61K - $75K
$76K - $100K
Over $100K
6.6% of respondents (10 of 150) have a Director of Public Relations
2
1
0
0
0
0
Under $30K
$30K - $45K
$46K - $60K
$61K - $75K
$76K - $100K
Over $100K
2% of respondents (3 of 150) have an Assistant Director of Public Relations
0
2
2
0
0
0
Under $30K
$30K - $45K
$46K - $60K
$61K - $75K
$76K - $100K
Over $100K
2.6% of respondents (4 of 150) have a Public Relations Manager
2
0
0
0
0
0
Under $30K
$30K - $45K
$46K - $60K
$61K - $75K
$76K - $100K
Over $100K
1.3% of respondents (2 of 150) have a Coordinator of Public Relations
0
2
0
0
0
0
Under $30K
$30K - $45K
$46K - $60K
$61K - $75K
$76K - $100K
Over $100K
1.3% of respondents (2 of 150) have a Social Media Coordinator
2
2
3
1
0
0
Under $25K
$25K - $40K
$41K - $55K
$56K - $75K
$76K - $100K
Over $100K
5.3% of respondents (8 of 150) have a Shop Manager
9
2
0
0
0
0
Under $25K
$25K - $40K
$41K - $55K
$56K - $75K
$76K - $100K
Over $100K
7.3% of respondents (11 of 150) have a Retail Sales Clerk
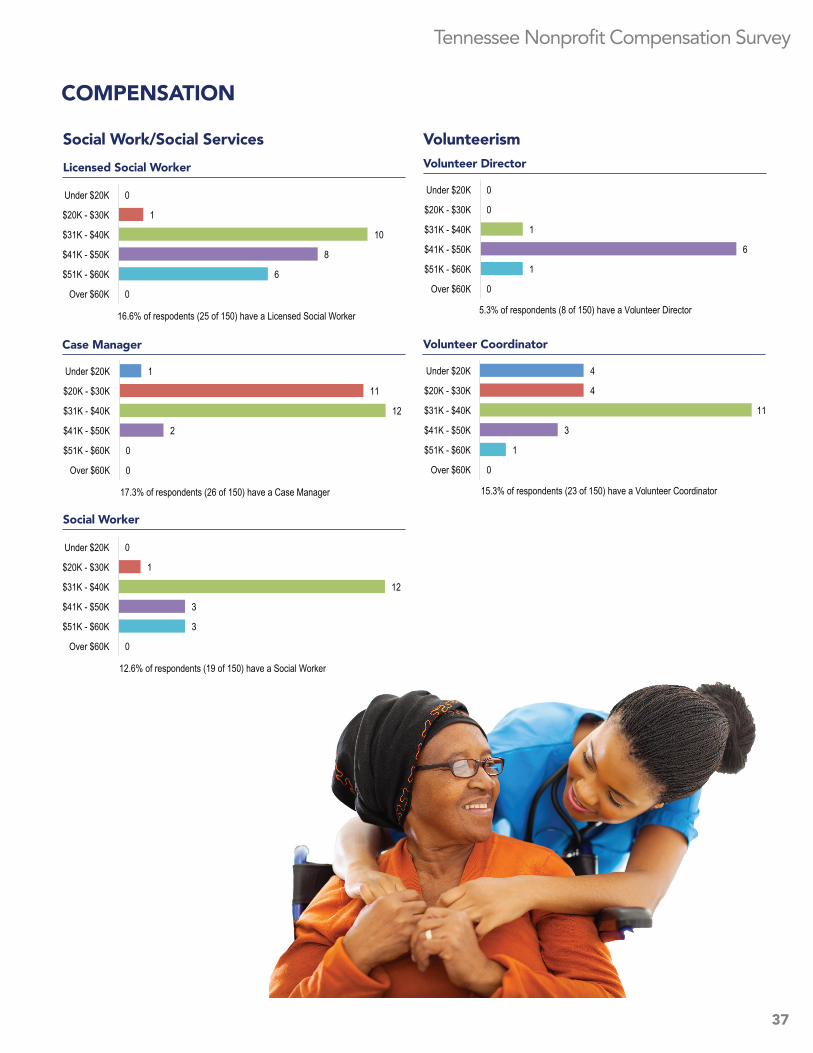
37
Tennessee Nonprofit Compensation Survey
Volunteer Coordinator
Volunteer Director
Volunteerism
Case Manager
Social Worker
Licensed Social Worker
Social Work/Social Services
COMPENSATION
0
1
10
8
6
0
Under $20K
$20K - $30K
$31K - $40K
$41K - $50K
$51K - $60K
Over $60K
16.6% of respodents (25 of 150) have a Licensed Social Worker
0
1
12
3
3
0
Under $20K
$20K - $30K
$31K - $40K
$41K - $50K
$51K - $60K
Over $60K
12.6% of respondents (19 of 150) have a Social Worker
1
11
12
2
0
0
Under $20K
$20K - $30K
$31K - $40K
$41K - $50K
$51K - $60K
Over $60K
17.3% of respondents (26 of 150) have a Case Manager
0
0
1
6
1
0
Under $20K
$20K - $30K
$31K - $40K
$41K - $50K
$51K - $60K
Over $60K
5.3% of respondents (8 of 150) have a Volunteer Director
4
4
11
3
1
0
Under $20K
$20K - $30K
$31K - $40K
$41K - $50K
$51K - $60K
Over $60K
15.3% of respondents (23 of 150) have a Volunteer Coordinator
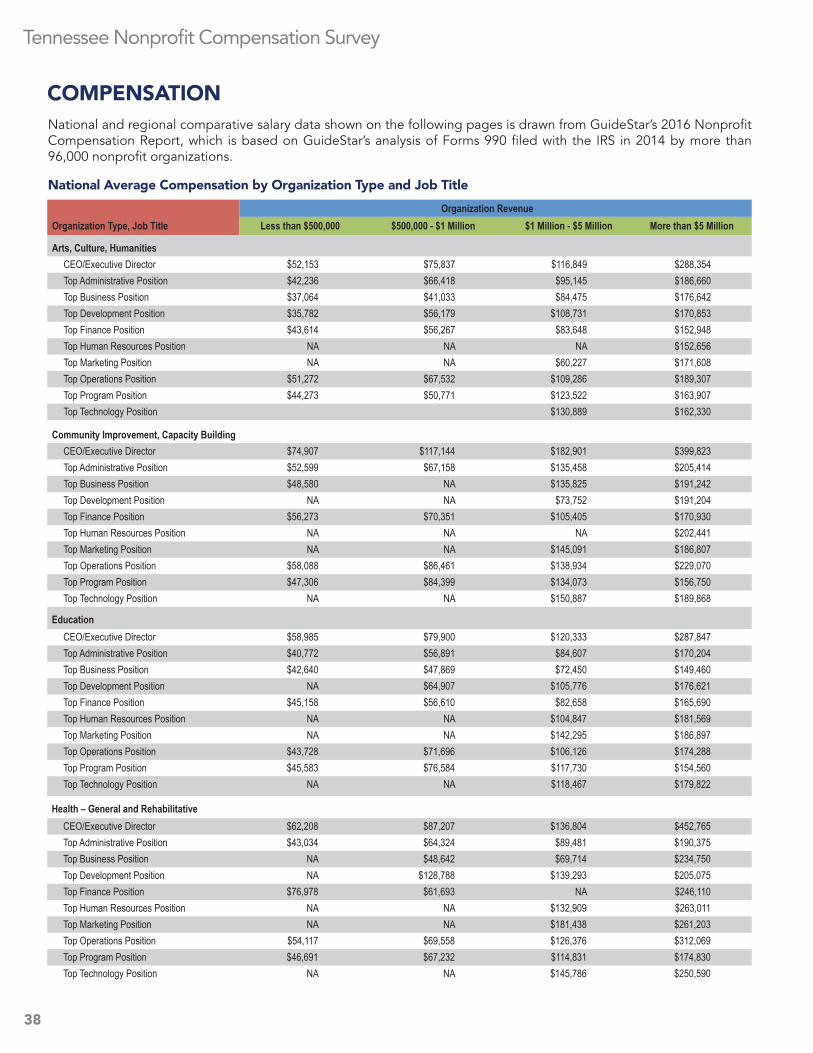
Tennessee Nonprofit Compensation Survey
38
COMPENSATION
Organization RevenueOrganization Type, Job Title Less than $500,000 $500,000 - $1 Million $1 Million - $5 Million More than $5 Million
Arts, Culture, HumanitiesCEO/Executive Director $52,153 $75,837 $116,849 $288,354Top Administrative Position $42,236 $66,418 $95,145 $186,660Top Business Position $37,064 $41,033 $84,475 $176,642Top Development Position $35,782 $56,179 $108,731 $170,853Top Finance Position $43,614 $56,267 $83,648 $152,948Top Human Resources Position NA NA NA $152,656Top Marketing Position NA NA $60,227 $171,608Top Operations Position $51,272 $67,532 $109,286 $189,307Top Program Position $44,273 $50,771 $123,522 $163,907Top Technology Position $130,889 $162,330
Community Improvement, Capacity BuildingCEO/Executive Director $74,907 $117,144 $182,901 $399,823Top Administrative Position $52,599 $67,158 $135,458 $205,414Top Business Position $48,580 NA $135,825 $191,242Top Development Position NA NA $73,752 $191,204Top Finance Position $56,273 $70,351 $105,405 $170,930Top Human Resources Position NA NA NA $202,441Top Marketing Position NA NA $145,091 $186,807Top Operations Position $58,088 $86,461 $138,934 $229,070Top Program Position $47,306 $84,399 $134,073 $156,750Top Technology Position NA NA $150,887 $189,868
EducationCEO/Executive Director $58,985 $79,900 $120,333 $287,847Top Administrative Position $40,772 $56,891 $84,607 $170,204Top Business Position $42,640 $47,869 $72,450 $149,460Top Development Position NA $64,907 $105,776 $176,621Top Finance Position $45,158 $56,610 $82,658 $165,690Top Human Resources Position NA NA $104,847 $181,569Top Marketing Position NA NA $142,295 $186,897Top Operations Position $43,728 $71,696 $106,126 $174,288Top Program Position $45,583 $76,584 $117,730 $154,560Top Technology Position NA NA $118,467 $179,822
Health – General and RehabilitativeCEO/Executive Director $62,208 $87,207 $136,804 $452,765Top Administrative Position $43,034 $64,324 $89,481 $190,375Top Business Position NA $48,642 $69,714 $234,750Top Development Position NA $128,788 $139,293 $205,075Top Finance Position $76,978 $61,693 NA $246,110Top Human Resources Position NA NA $132,909 $263,011Top Marketing Position NA NA $181,438 $261,203Top Operations Position $54,117 $69,558 $126,376 $312,069Top Program Position $46,691 $67,232 $114,831 $174,830Top Technology Position NA NA $145,786 $250,590
National Average Compensation by Organization Type and Job Title
National and regional comparative salary data shown on the following pages is drawn from GuideStar’s 2016 Nonprofit Compensation Report, which is based on GuideStar’s analysis of Forms 990 filed with the IRS in 2014 by more than 96,000 nonprofit organizations.
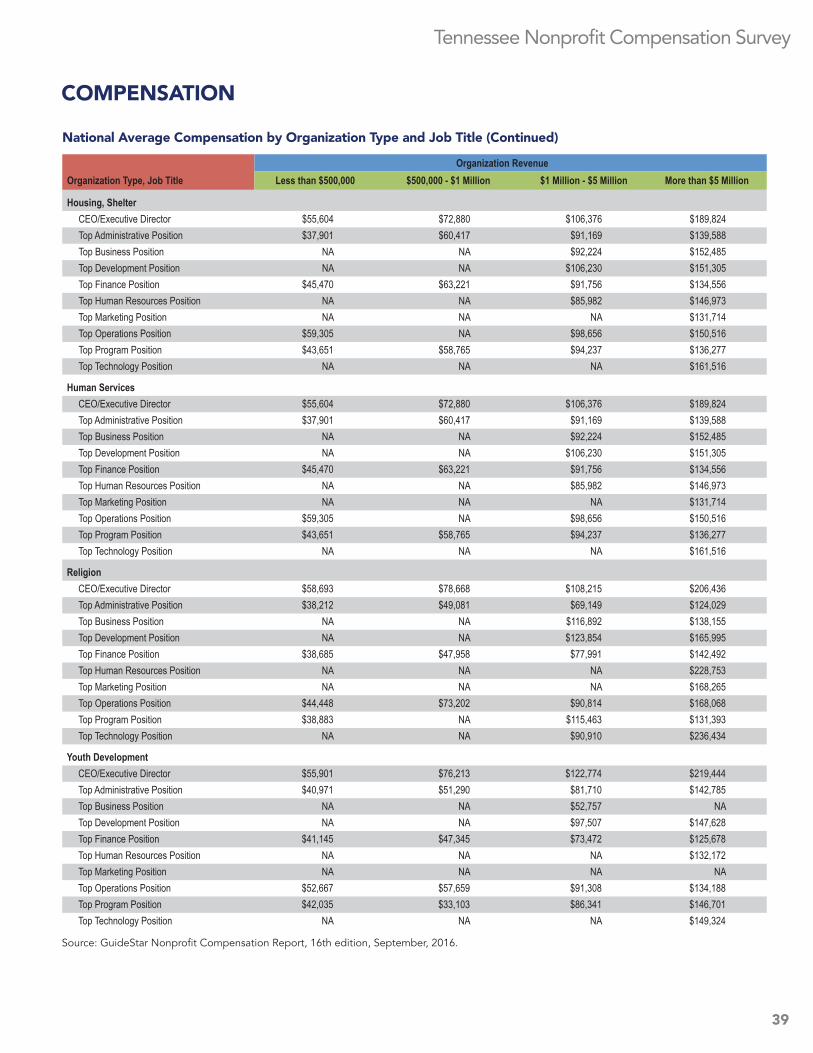
39
Tennessee Nonprofit Compensation Survey
COMPENSATION
Organization RevenueOrganization Type, Job Title Less than $500,000 $500,000 - $1 Million $1 Million - $5 Million More than $5 Million
Housing, ShelterCEO/Executive Director $55,604 $72,880 $106,376 $189,824Top Administrative Position $37,901 $60,417 $91,169 $139,588Top Business Position NA NA $92,224 $152,485Top Development Position NA NA $106,230 $151,305Top Finance Position $45,470 $63,221 $91,756 $134,556Top Human Resources Position NA NA $85,982 $146,973Top Marketing Position NA NA NA $131,714Top Operations Position $59,305 NA $98,656 $150,516Top Program Position $43,651 $58,765 $94,237 $136,277Top Technology Position NA NA NA $161,516
Human ServicesCEO/Executive Director $55,604 $72,880 $106,376 $189,824Top Administrative Position $37,901 $60,417 $91,169 $139,588Top Business Position NA NA $92,224 $152,485Top Development Position NA NA $106,230 $151,305Top Finance Position $45,470 $63,221 $91,756 $134,556Top Human Resources Position NA NA $85,982 $146,973Top Marketing Position NA NA NA $131,714Top Operations Position $59,305 NA $98,656 $150,516Top Program Position $43,651 $58,765 $94,237 $136,277Top Technology Position NA NA NA $161,516
ReligionCEO/Executive Director $58,693 $78,668 $108,215 $206,436Top Administrative Position $38,212 $49,081 $69,149 $124,029Top Business Position NA NA $116,892 $138,155Top Development Position NA NA $123,854 $165,995Top Finance Position $38,685 $47,958 $77,991 $142,492Top Human Resources Position NA NA NA $228,753Top Marketing Position NA NA NA $168,265Top Operations Position $44,448 $73,202 $90,814 $168,068Top Program Position $38,883 NA $115,463 $131,393Top Technology Position NA NA $90,910 $236,434
Youth DevelopmentCEO/Executive Director $55,901 $76,213 $122,774 $219,444Top Administrative Position $40,971 $51,290 $81,710 $142,785Top Business Position NA NA $52,757 NATop Development Position NA NA $97,507 $147,628Top Finance Position $41,145 $47,345 $73,472 $125,678Top Human Resources Position NA NA NA $132,172Top Marketing Position NA NA NA NATop Operations Position $52,667 $57,659 $91,308 $134,188Top Program Position $42,035 $33,103 $86,341 $146,701Top Technology Position NA NA NA $149,324
National Average Compensation by Organization Type and Job Title (Continued)
Source: GuideStar Nonprofit Compensation Report, 16th edition, September, 2016.
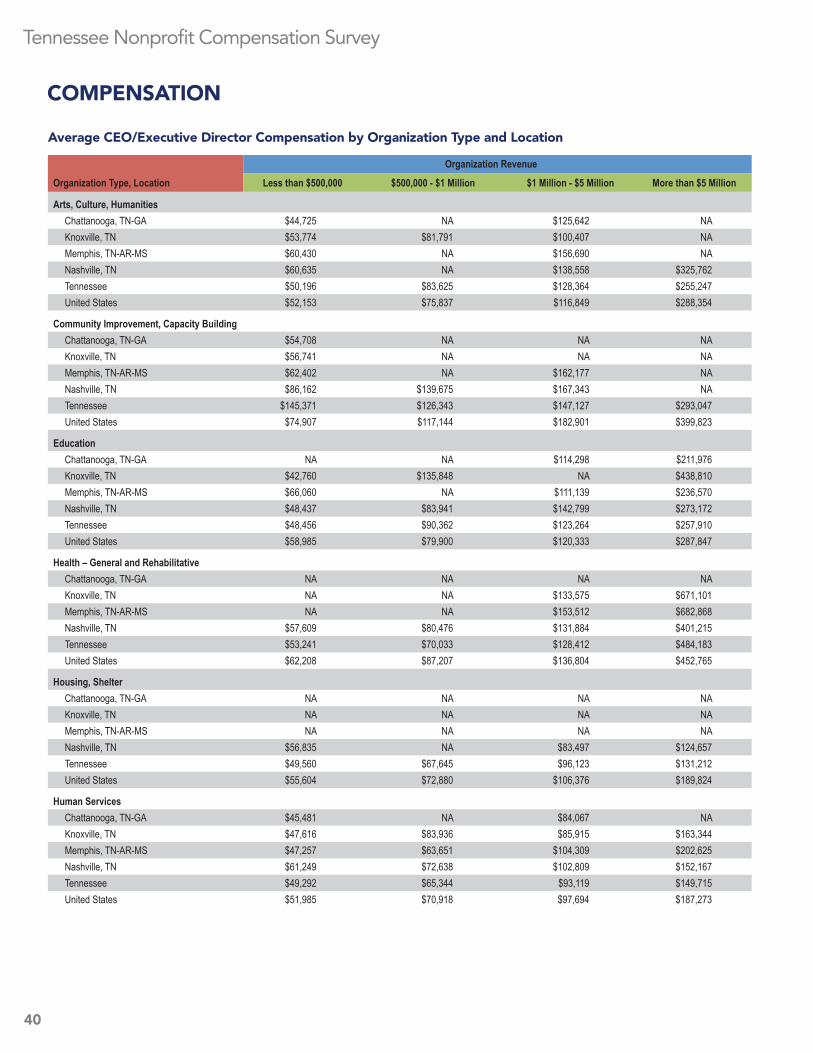
Tennessee Nonprofit Compensation Survey
40
Organization Revenue
Organization Type, Location Less than $500,000 $500,000 - $1 Million $1 Million - $5 Million More than $5 Million
Arts, Culture, HumanitiesChattanooga, TN-GA $44,725 NA $125,642 NAKnoxville, TN $53,774 $81,791 $100,407 NAMemphis, TN-AR-MS $60,430 NA $156,690 NANashville, TN $60,635 NA $138,558 $325,762Tennessee $50,196 $83,625 $128,364 $255,247United States $52,153 $75,837 $116,849 $288,354
Community Improvement, Capacity BuildingChattanooga, TN-GA $54,708 NA NA NAKnoxville, TN $56,741 NA NA NAMemphis, TN-AR-MS $62,402 NA $162,177 NANashville, TN $86,162 $139,675 $167,343 NATennessee $145,371 $126,343 $147,127 $293,047United States $74,907 $117,144 $182,901 $399,823
EducationChattanooga, TN-GA NA NA $114,298 $211,976Knoxville, TN $42,760 $135,848 NA $438,810Memphis, TN-AR-MS $66,060 NA $111,139 $236,570Nashville, TN $48,437 $83,941 $142,799 $273,172Tennessee $48,456 $90,362 $123,264 $257,910United States $58,985 $79,900 $120,333 $287,847
Health – General and RehabilitativeChattanooga, TN-GA NA NA NA NAKnoxville, TN NA NA $133,575 $671,101Memphis, TN-AR-MS NA NA $153,512 $682,868Nashville, TN $57,609 $80,476 $131,884 $401,215Tennessee $53,241 $70,033 $128,412 $484,183United States $62,208 $87,207 $136,804 $452,765
Housing, ShelterChattanooga, TN-GA NA NA NA NAKnoxville, TN NA NA NA NAMemphis, TN-AR-MS NA NA NA NANashville, TN $56,835 NA $83,497 $124,657Tennessee $49,560 $67,645 $96,123 $131,212United States $55,604 $72,880 $106,376 $189,824
Human ServicesChattanooga, TN-GA $45,481 NA $84,067 NAKnoxville, TN $47,616 $83,936 $85,915 $163,344Memphis, TN-AR-MS $47,257 $63,651 $104,309 $202,625Nashville, TN $61,249 $72,638 $102,809 $152,167Tennessee $49,292 $65,344 $93,119 $149,715United States $51,985 $70,918 $97,694 $187,273
COMPENSATION
Average CEO/Executive Director Compensation by Organization Type and Location
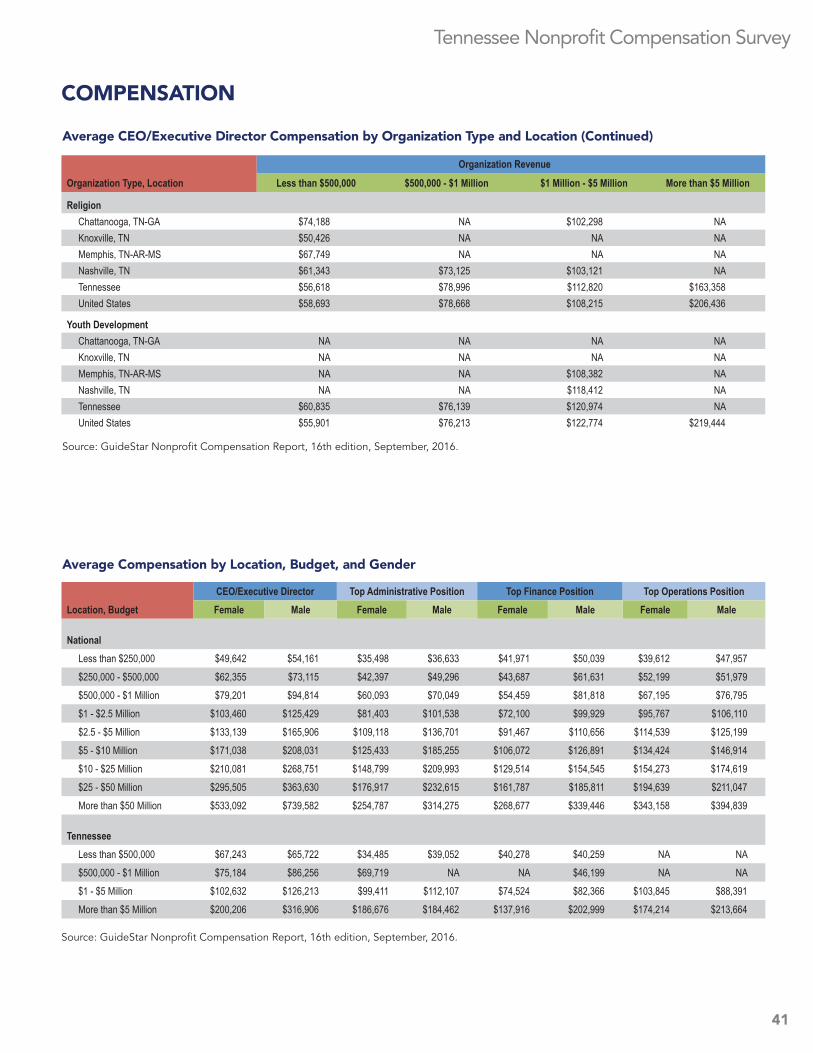
41
Tennessee Nonprofit Compensation Survey
Organization Revenue
Organization Type, Location Less than $500,000 $500,000 - $1 Million $1 Million - $5 Million More than $5 Million
ReligionChattanooga, TN-GA $74,188 NA $102,298 NAKnoxville, TN $50,426 NA NA NAMemphis, TN-AR-MS $67,749 NA NA NANashville, TN $61,343 $73,125 $103,121 NATennessee $56,618 $78,996 $112,820 $163,358United States $58,693 $78,668 $108,215 $206,436
Youth DevelopmentChattanooga, TN-GA NA NA NA NAKnoxville, TN NA NA NA NAMemphis, TN-AR-MS NA NA $108,382 NANashville, TN NA NA $118,412 NATennessee $60,835 $76,139 $120,974 NAUnited States $55,901 $76,213 $122,774 $219,444
COMPENSATION
Average CEO/Executive Director Compensation by Organization Type and Location (Continued)
Location, BudgetCEO/Executive Director Top Administrative Position Top Finance Position Top Operations Position Female Male Female Male Female Male Female Male
NationalLess than $250,000 $49,642 $54,161 $35,498 $36,633 $41,971 $50,039 $39,612 $47,957$250,000 - $500,000 $62,355 $73,115 $42,397 $49,296 $43,687 $61,631 $52,199 $51,979$500,000 - $1 Million $79,201 $94,814 $60,093 $70,049 $54,459 $81,818 $67,195 $76,795$1 - $2.5 Million $103,460 $125,429 $81,403 $101,538 $72,100 $99,929 $95,767 $106,110$2.5 - $5 Million $133,139 $165,906 $109,118 $136,701 $91,467 $110,656 $114,539 $125,199$5 - $10 Million $171,038 $208,031 $125,433 $185,255 $106,072 $126,891 $134,424 $146,914$10 - $25 Million $210,081 $268,751 $148,799 $209,993 $129,514 $154,545 $154,273 $174,619$25 - $50 Million $295,505 $363,630 $176,917 $232,615 $161,787 $185,811 $194,639 $211,047More than $50 Million $533,092 $739,582 $254,787 $314,275 $268,677 $339,446 $343,158 $394,839
TennesseeLess than $500,000 $67,243 $65,722 $34,485 $39,052 $40,278 $40,259 NA NA$500,000 - $1 Million $75,184 $86,256 $69,719 NA NA $46,199 NA NA$1 - $5 Million $102,632 $126,213 $99,411 $112,107 $74,524 $82,366 $103,845 $88,391More than $5 Million $200,206 $316,906 $186,676 $184,462 $137,916 $202,999 $174,214 $213,664
Average Compensation by Location, Budget, and Gender
Source: GuideStar Nonprofit Compensation Report, 16th edition, September, 2016.
Source: GuideStar Nonprofit Compensation Report, 16th edition, September, 2016.
43
Tennessee Nonprofit Compensation Survey
Alliance for Nonprofit Excellence – MemphisFounded in 1992, the Alliance equips nonprofit leaders with the skills and abilities to make an effective difference in Memphis and the Mid-South. Their educational programs, consulting services and nationally recognized Program for Nonprofit Excellence transform board and staff member’s passion into know how and provide organizations a clear way to move their mission and goals forward.
Kevin Dean, Interim CEO – [email protected] 1919 Lynnfield Rd., Suite 200 • Memphis, TN 38119 • T: 901.684.6605 • F: 901.684.6616 • www.npexcellence.org
Alliance for Better Nonprofits - KnoxvilleThe Alliance for Better Nonprofits (ABN) is a membership-based organization that serves nonprofits in 25 East Tennessee counties by helping them achieve their missions; therefore making a bigger impact in their communities. Our goal is to walk with the region’s nonprofits on their journey toward efficiency and effectiveness through training, consulting, and resources, including the nationally recognized Standards for Excellence®. ABN has a relational approach of assisting nonprofits by providing the tools they need to increase their capacity and their impact. Collaborating makes our communities stronger and creates the opportunity for organizations to thrive.
Jerry Askew, President – [email protected] The Regas Building • 318 N. Gay Street, Suite 203 • Knoxville, TN 37917 • T: 865-313-2077 • www.betternonprofits.org
Center for Nonprofit Management – NashvilleSince 1986, the Center for Nonprofit Management has been a home to Middle Tennessee’s nonprofit leaders offering a place to relax, share triumphs and find solutions to problems. At CNM, nonprofit board members, executives and staff have the opportunity to learn how to enhance their services through their comprehensive calendar of skill-building workshops and annual Bridge to Excellence conference.
Tari Hughes, President & CEO – [email protected] 37 Peabody St., Suite 201 • Nashville, TN 37210 • T: 615.259.0100 • F: 615.259.0400 • www.cnm.org
Center for Nonprofits – ChattanoogaThe United Way of Greater Chattanooga opened the doors of the Center for Nonprofits in 1999 to help nonprofit organizations operate more efficiently and effectively in achieving their missions. As a management service organization, they offer workshops, tailored training sessions, consultation services, planning and facilitation, board development, online resources and a library dedicated to excellence in nonprofit management.
Laura McCann, Vice President – [email protected] 630 Market Street • P.O. Box 4027 • Chattanooga, TN 37405 • T: 423.752.0300 • F: 423.267.8060 • www.cnpchatt.org
East Tennessee Foundation - KnoxvilleThe East Tennessee Foundation is a public, nonprofit, community foundation created by and for the people of East Tennessee where many donors join together to make the region they love a better place, today and for future generations. A wide variety of assets in any amount can be accepted to serve almost any charitable purpose. ETF is a collection of hundreds of individual charitable funds and supporting foundations established by individuals, families, businesses, and other nonprofits and foundations.
Michael McClamroch, President & CEO – [email protected] 625 Market Street • Knoxville, TN 37902 • T: 865.524.1223 • F: 865.637.6039 • www.easttennesseefoundation.org
SUPPORTING ORGANIZATIONS

Memphis – 1661 Aaron Brenner Drive | Suite 300 | Memphis, TN 38120 | 901.761.2720 | 901.683.1120 faxTupelo – 417 West Main Street | Suite 100 | Tupelo, MS 38804 | 662.269.4014 | 662.269.4016 fax
www.wucpas.com