Embed Size (px)
Citation preview
TENSION TESTS OF HEADED STUD ANCHORAGES IN NARROW / THIN EDGE MEMBERS
Neal S. Anderson1*, A. Koray Tureyen2, Donald F. Meinheit3
1Staff Consultant, Simpson, Gumpertz and Heger, Chicago, Illinois, USA 2 Senior Associate, Wiss, Janney, Elstner Associates, Inc., Northbrook, Illinois USA
3Principal, Wiss, Janney, Elstner Associates, Inc., Chicago, Illinois USA *Corresponding Author Email: [email protected]
ABSTRACT
The Precast/Prestressed Concrete Institute (PCI) sponsored a comprehensive research program to assess the capacity of headed-stud group anchorages. The PCI program was initiated in response to significant differences between headed stud design, as outlined in the PCI Design Handbook and the ACI 318 Building Code. Not covered by the PCI sponsored testing, but nonetheless important, were headed-stud groups located in thin or narrow members; that is, anchors embedded in a narrow member with two parallel free edges reducing the concrete breakout cone area. Tests of headed stud anchorage groups loaded in tension in this fashion are not extensively reported in the literature.
The test program herein, conducted by staff of Wiss, Janney, Elstner Associates, Inc. (WJE), was an in-house, unsponsored test program of 16 tension tests. Considered were the variables of embedment depth, edge distance, and spacing of the anchors parallel to the free edge. Test anchorages used one, two, and four headed studs in the connection. Transverse stud spacing, perpendicular to the edges, was also a secondary variable in this study. The results were compared to the present ACI 318-141, Chapter 17 provisions where two sides of the breakout surface are truncated. This paper provides a summary of the research work.
1 Introduction
Designing anchorages located in a narrow edge of a member are often avoided because of their perceived lower capacity attributed to the truncated concrete breakout cone from the small (narrow), two parallel side-edge distances. In ACI 318, Chapter 17 terminology, the edge distance from the anchor to the free edge is represented by ca1 or ca2.
Placing an anchorage plate in the narrow edge of a floor slab to facilitate connecting a curtain-wall system is one typical example where this type of anchorage frequently occurs. Although this type of slab edge connection frequently carries gravity shear load, wind suction can also produce tension on these anchor groups. Conventional floor slabs range in thickness from 150 to 250 mm (6 to 10 in.), thus providing side-edge distances less than 75 to 125 mm (3 to 5 in.) if one line of anchors is used at mid-depth of the slab.
3rd International Symposium on
Connections between Steel and Concrete Stuttgart, Germany, September 27th -29th , 2017
Neal S. Anderson, A. Koray Tureyen, and Donald F. Meinheit
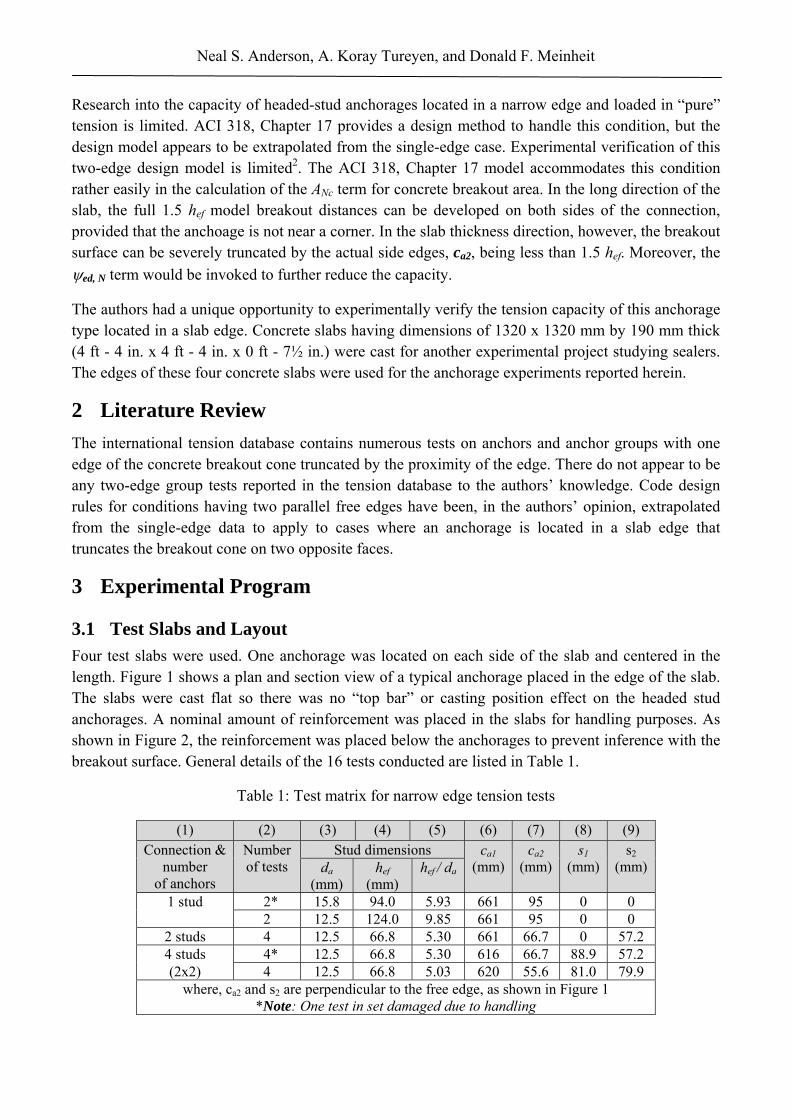
Research into the capacity of headed-stud anchorages located in a narrow edge and loaded in “pure” tension is limited. ACI 318, Chapter 17 provides a design method to handle this condition, but the design model appears to be extrapolated from the single-edge case. Experimental verification of this two-edge design model is limited2. The ACI 318, Chapter 17 model accommodates this condition rather easily in the calculation of the ANc term for concrete breakout area. In the long direction of the slab, the full 1.5 hef model breakout distances can be developed on both sides of the connection, provided that the anchoage is not near a corner. In the slab thickness direction, however, the breakout surface can be severely truncated by the actual side edges, ca2, being less than 1.5 hef. Moreover, the
ed, N term would be invoked to further reduce the capacity.
The authors had a unique opportunity to experimentally verify the tension capacity of this anchorage type located in a slab edge. Concrete slabs having dimensions of 1320 x 1320 mm by 190 mm thick (4 ft - 4 in. x 4 ft - 4 in. x 0 ft - 7½ in.) were cast for another experimental project studying sealers. The edges of these four concrete slabs were used for the anchorage experiments reported herein.
2 Literature Review
The international tension database contains numerous tests on anchors and anchor groups with one edge of the concrete breakout cone truncated by the proximity of the edge. There do not appear to be any two-edge group tests reported in the tension database to the authors’ knowledge. Code design rules for conditions having two parallel free edges have been, in the authors’ opinion, extrapolated from the single-edge data to apply to cases where an anchorage is located in a slab edge that truncates the breakout cone on two opposite faces.
3 Experimental Program
3.1 Test Slabs and Layout
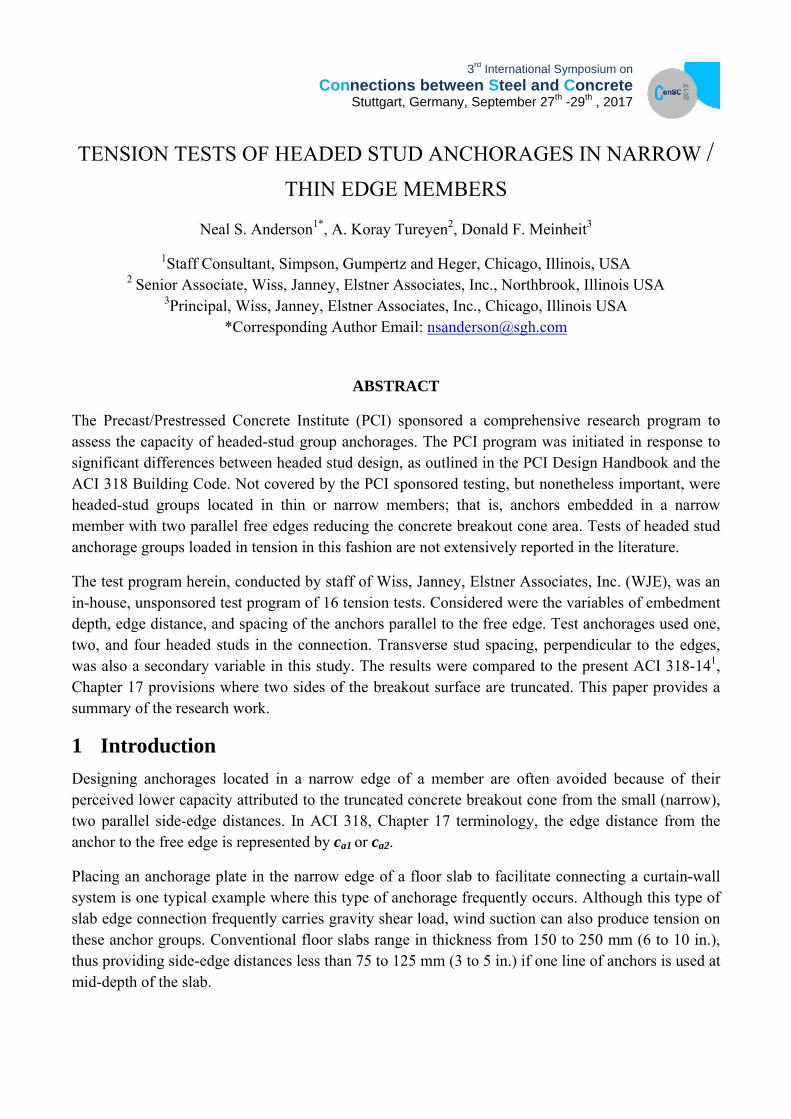
Four test slabs were used. One anchorage was located on each side of the slab and centered in the length. Figure 1 shows a plan and section view of a typical anchorage placed in the edge of the slab. The slabs were cast flat so there was no “top bar” or casting position effect on the headed stud anchorages. A nominal amount of reinforcement was placed in the slabs for handling purposes. As shown in Figure 2, the reinforcement was placed below the anchorages to prevent inference with the breakout surface. General details of the 16 tests conducted are listed in Table 1.
Table 1: Test matrix for narrow edge tension tests
(1) (2) (3) (4) (5) (6) (7) (8) (9) Connection &
number of anchors
Number of tests
Stud dimensions ca1
(mm) ca2
(mm) s1
(mm) s2
(mm) da
(mm) hef
(mm) hef / da
1 stud 2* 15.8 94.0 5.93 661 95 0 0 2 12.5 124.0 9.85 661 95 0 0
2 studs 4 12.5 66.8 5.30 661 66.7 0 57.2 4 studs 4* 12.5 66.8 5.30 616 66.7 88.9 57.2 (2x2) 4 12.5 66.8 5.03 620 55.6 81.0 79.9
where, ca2 and s2 are perpendicular to the free edge, as shown in Figure 1 *Note: One test in set damaged due to handling
Neal S. Anderson, A. Koray Tureyen, and Donald F. Meinheit
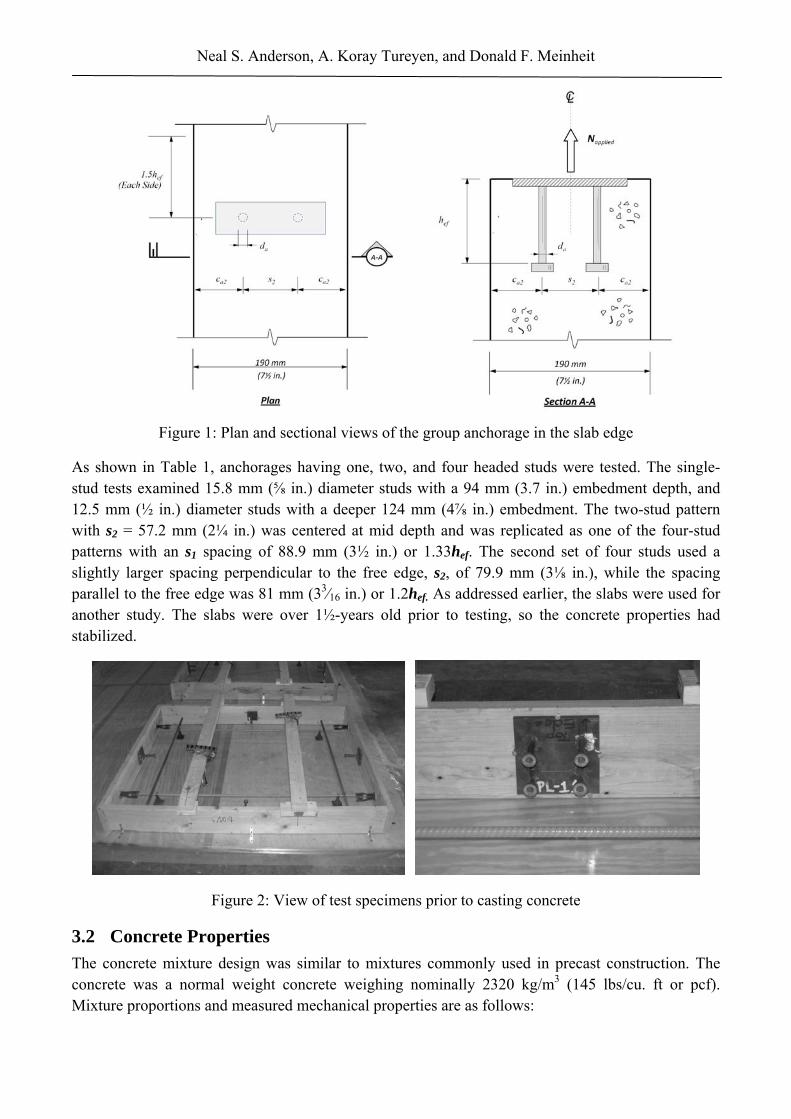
Figure 1: Plan and sectional views of the group anchorage in the slab edge
As shown in Table 1, anchorages having one, two, and four headed studs were tested. The single-stud tests examined 15.8 mm (⅝ in.) diameter studs with a 94 mm (3.7 in.) embedment depth, and 12.5 mm (½ in.) diameter studs with a deeper 124 mm (4⅞ in.) embedment. The two-stud pattern with s2 = 57.2 mm (2¼ in.) was centered at mid depth and was replicated as one of the four-stud patterns with an s1 spacing of 88.9 mm (3½ in.) or 1.33hef. The second set of four studs used a slightly larger spacing perpendicular to the free edge, s2, of 79.9 mm (3⅛ in.), while the spacing parallel to the free edge was 81 mm (33⁄16 in.) or 1.2hef. As addressed earlier, the slabs were used for another study. The slabs were over 1½-years old prior to testing, so the concrete properties had stabilized.
Figure 2: View of test specimens prior to casting concrete
3.2 Concrete Properties
The concrete mixture design was similar to mixtures commonly used in precast construction. The concrete was a normal weight concrete weighing nominally 2320 kg/m3 (145 lbs/cu. ft or pcf). Mixture proportions and measured mechanical properties are as follows:
Neal S. Anderson, A. Koray Tureyen, and Donald F. Meinheit
314 kg/m3 (530 lbs/cu. yd.) of Type I cement,
1094 kg/m3 (1844 lbs/cu. yd.) limestone coarse aggregate with a 19 mm (¾-in.) nominal maximum aggregate size,
825 kg/m3 (1390 lbs/cu. yd.) sand,
water-cement ratio = 0.42, water reducer and air entertaining admixture included,
measured slump of 172 mm (6¾ in.) and 7.8 percent air content,
average compressive strength at 28 days: 30 MPa (4,440 psi),
average compressive strength at time of anchor testing: 34.9 MPa (5060 psi),
average splitting tensile strength at time of anchor testing: 3.1 MPa (455 psi).
3.3 Headed Stud Properties
The ultimate tensile strength of the headed studs varied from a low of 536 MPa (77.7 ksi) to a high of 563 MPa (81.6 ksi). All the load-deformation curves for studs tested in direct tension in air exhibited rounded, but ductile behavior. The ultimate tensile strengths of the studs used in the various anchorages are listed in Table 2.
3.4 Test Procedures
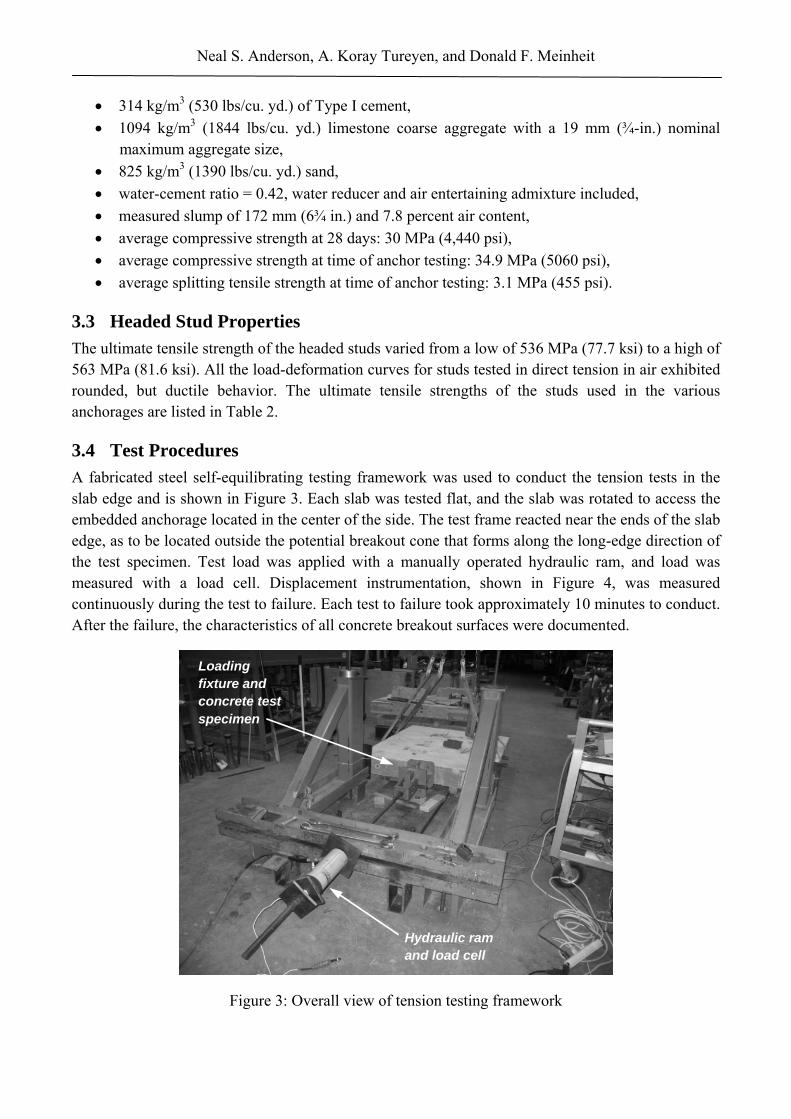
A fabricated steel self-equilibrating testing framework was used to conduct the tension tests in the slab edge and is shown in Figure 3. Each slab was tested flat, and the slab was rotated to access the embedded anchorage located in the center of the side. The test frame reacted near the ends of the slab edge, as to be located outside the potential breakout cone that forms along the long-edge direction of the test specimen. Test load was applied with a manually operated hydraulic ram, and load was measured with a load cell. Displacement instrumentation, shown in Figure 4, was measured continuously during the test to failure. Each test to failure took approximately 10 minutes to conduct. After the failure, the characteristics of all concrete breakout surfaces were documented.
Figure 3: Overall view of tension testing framework
Loading fixture and concrete test specimen
Hydraulic ram and load cell
Neal S. Anderson, A. Koray Tureyen, and Donald F. Meinheit
Figure 4: Load fixture and displacement transducers to measure deformations
3.5 Load-Deflection Behavior
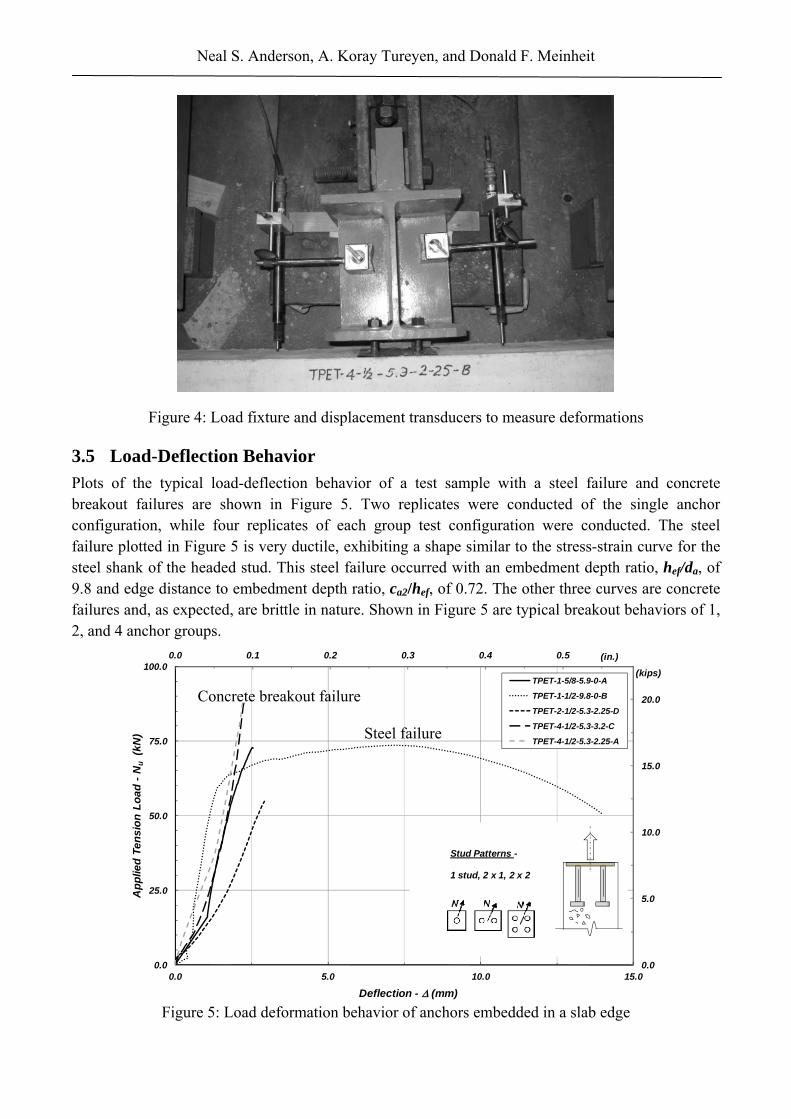
Plots of the typical load-deflection behavior of a test sample with a steel failure and concrete breakout failures are shown in Figure 5. Two replicates were conducted of the single anchor configuration, while four replicates of each group test configuration were conducted. The steel failure plotted in Figure 5 is very ductile, exhibiting a shape similar to the stress-strain curve for the steel shank of the headed stud. This steel failure occurred with an embedment depth ratio, hef/da, of 9.8 and edge distance to embedment depth ratio, ca2/hef, of 0.72. The other three curves are concrete failures and, as expected, are brittle in nature. Shown in Figure 5 are typical breakout behaviors of 1, 2, and 4 anchor groups.
0.0 0.1 0.2 0.3 0.4 0.5
0.0
5.0
10.0
15.0
20.0
0.0
25.0
50.0
75.0
100.0
0.0 5.0 10.0 15.0
(in.)
(kips)
Ap
plie
d T
en
sio
n L
oa
d -
Nu
(kN
)
Deflection - (mm)
TPET-1-5/8-5.9-0-A
TPET-1-1/2-9.8-0-B
TPET-2-1/2-5.3-2.25-D
TPET-4-1/2-5.3-3.2-C
TPET-4-1/2-5.3-2.25-A
Stud Patterns -
1 stud, 2 x 1, 2 x 2
Figure 5: Load deformation behavior of anchors embedded in a slab edge
Steel failure
Concrete breakout failure
Neal S. Anderson, A. Koray Tureyen, and Donald F. Meinheit
3.6 Test Behavior
Table 2 presents the numerical test results, along with the actual measured values of the geometry and headed-stud properties. Observations of the failure surfaces follow:
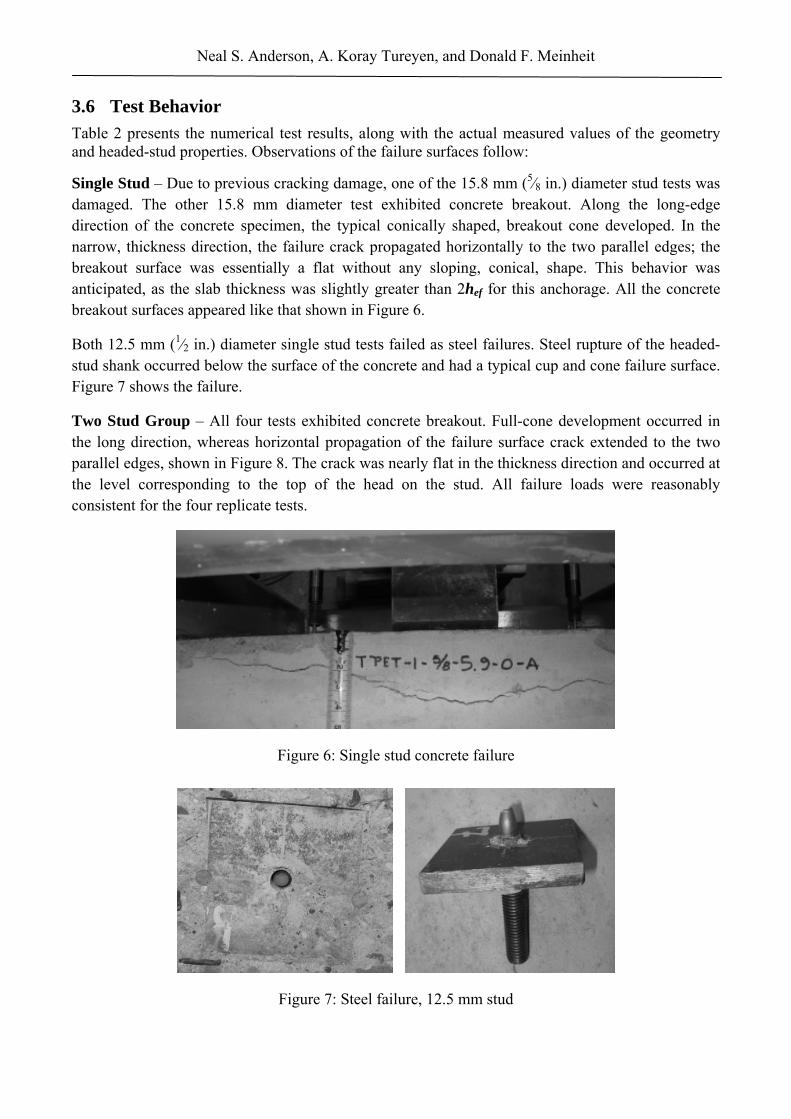
Single Stud – Due to previous cracking damage, one of the 15.8 mm (5⁄8 in.) diameter stud tests was damaged. The other 15.8 mm diameter test exhibited concrete breakout. Along the long-edge direction of the concrete specimen, the typical conically shaped, breakout cone developed. In the narrow, thickness direction, the failure crack propagated horizontally to the two parallel edges; the breakout surface was essentially a flat without any sloping, conical, shape. This behavior was anticipated, as the slab thickness was slightly greater than 2hef for this anchorage. All the concrete breakout surfaces appeared like that shown in Figure 6.
Both 12.5 mm (1⁄2 in.) diameter single stud tests failed as steel failures. Steel rupture of the headed-stud shank occurred below the surface of the concrete and had a typical cup and cone failure surface. Figure 7 shows the failure.
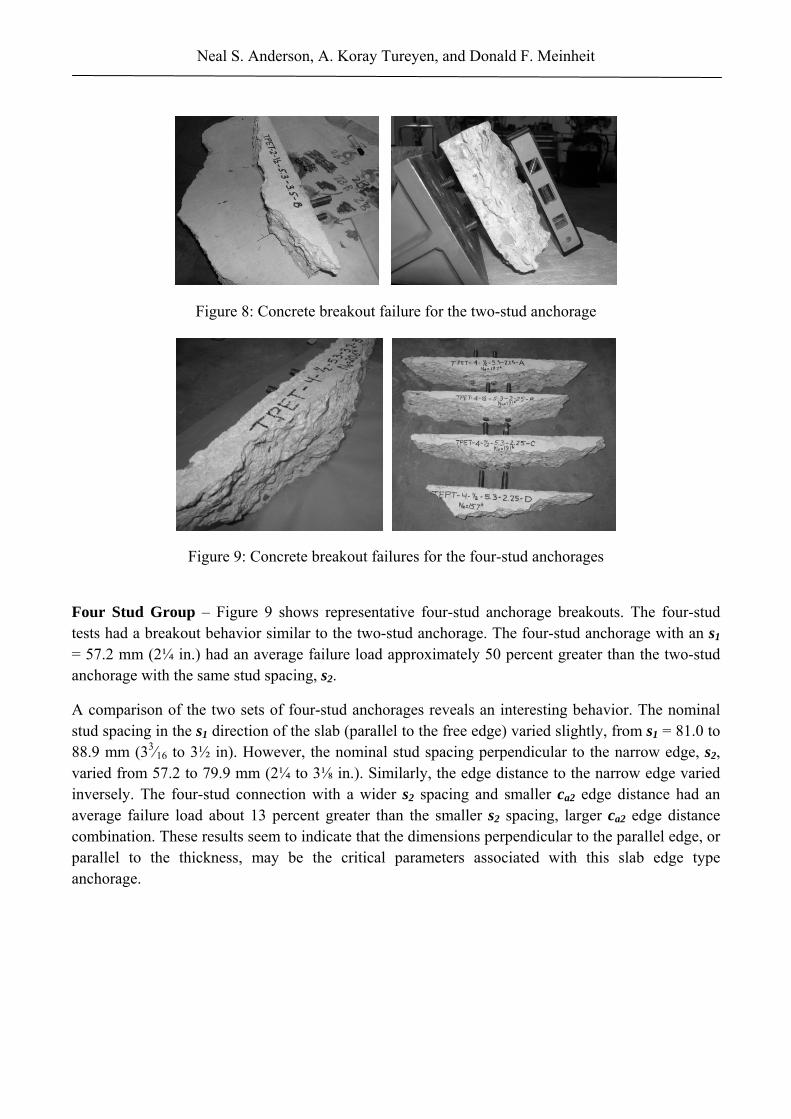
Two Stud Group – All four tests exhibited concrete breakout. Full-cone development occurred in the long direction, whereas horizontal propagation of the failure surface crack extended to the two parallel edges, shown in Figure 8. The crack was nearly flat in the thickness direction and occurred at the level corresponding to the top of the head on the stud. All failure loads were reasonably consistent for the four replicate tests.
Figure 6: Single stud concrete failure
Figure 7: Steel failure, 12.5 mm stud
Neal S. Anderson, A. Koray Tureyen, and Donald F. Meinheit
Figure 8: Concrete breakout failure for the two-stud anchorage
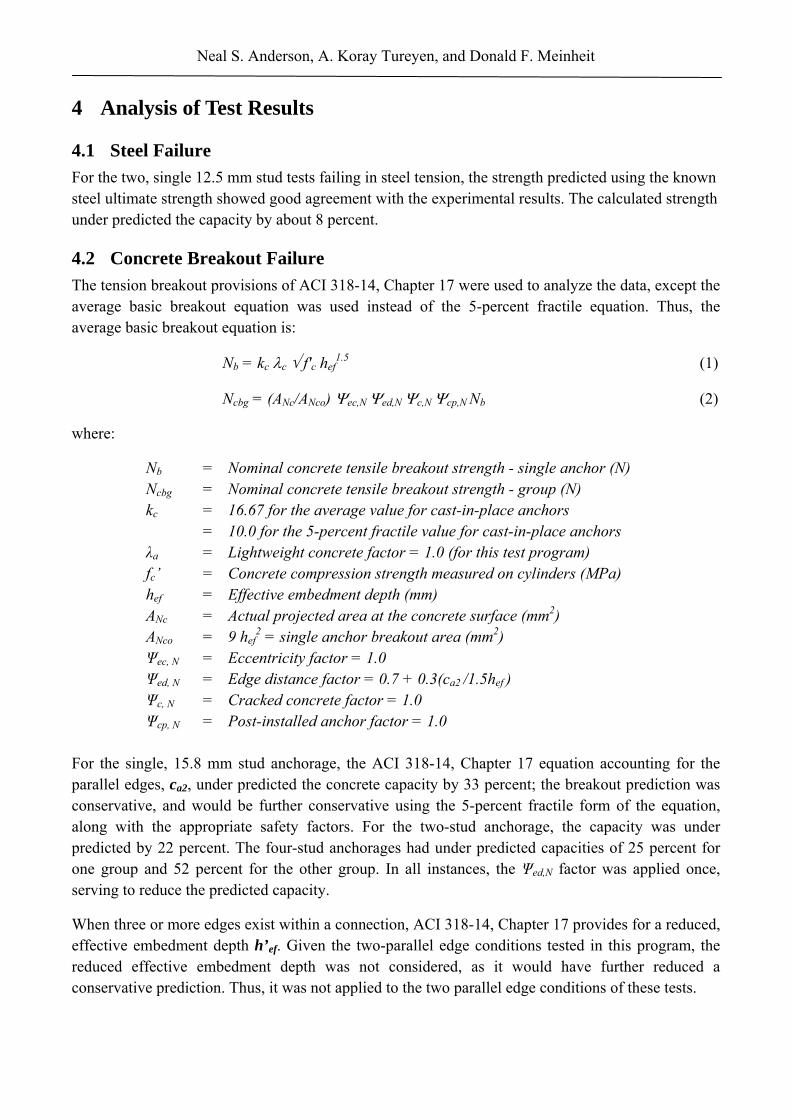
Figure 9: Concrete breakout failures for the four-stud anchorages
Four Stud Group – Figure 9 shows representative four-stud anchorage breakouts. The four-stud tests had a breakout behavior similar to the two-stud anchorage. The four-stud anchorage with an s1 = 57.2 mm (2¼ in.) had an average failure load approximately 50 percent greater than the two-stud anchorage with the same stud spacing, s2.
A comparison of the two sets of four-stud anchorages reveals an interesting behavior. The nominal stud spacing in the s1 direction of the slab (parallel to the free edge) varied slightly, from s1 = 81.0 to 88.9 mm (33⁄16 to 3½ in). However, the nominal stud spacing perpendicular to the narrow edge, s2, varied from 57.2 to 79.9 mm (2¼ to 3⅛ in.). Similarly, the edge distance to the narrow edge varied inversely. The four-stud connection with a wider s2 spacing and smaller ca2 edge distance had an average failure load about 13 percent greater than the smaller s2 spacing, larger ca2 edge distance combination. These results seem to indicate that the dimensions perpendicular to the parallel edge, or parallel to the thickness, may be the critical parameters associated with this slab edge type anchorage.
Neal S. Anderson, A. Koray Tureyen, and Donald F. Meinheit
4 Analysis of Test Results
4.1 Steel Failure
For the two, single 12.5 mm stud tests failing in steel tension, the strength predicted using the known steel ultimate strength showed good agreement with the experimental results. The calculated strength under predicted the capacity by about 8 percent.
4.2 Concrete Breakout Failure
The tension breakout provisions of ACI 318-14, Chapter 17 were used to analyze the data, except the average basic breakout equation was used instead of the 5-percent fractile equation. Thus, the average basic breakout equation is:
Nb = kc c f'c hef1.5 (1)
Ncbg = (ANc/ANco) ec,N ed,N c,N cp,N Nb (2)
where:
Nb = Nominal concrete tensile breakout strength - single anchor (N) Ncbg = Nominal concrete tensile breakout strength - group (N) kc = 16.67 for the average value for cast-in-place anchors = 10.0 for the 5-percent fractile value for cast-in-place anchors λa = Lightweight concrete factor = 1.0 (for this test program) fc’ = Concrete compression strength measured on cylinders (MPa) hef = Effective embedment depth (mm) ANc = Actual projected area at the concrete surface (mm2) ANco = 9 hef
2 = single anchor breakout area (mm2) Ψec, N = Eccentricity factor = 1.0 Ψed, N = Edge distance factor = 0.7 + 0.3(ca2 /1.5hef ) Ψc, N = Cracked concrete factor = 1.0 Ψcp, N = Post-installed anchor factor = 1.0
For the single, 15.8 mm stud anchorage, the ACI 318-14, Chapter 17 equation accounting for the parallel edges, ca2, under predicted the concrete capacity by 33 percent; the breakout prediction was conservative, and would be further conservative using the 5-percent fractile form of the equation, along with the appropriate safety factors. For the two-stud anchorage, the capacity was under predicted by 22 percent. The four-stud anchorages had under predicted capacities of 25 percent for one group and 52 percent for the other group. In all instances, the Ψed,N factor was applied once, serving to reduce the predicted capacity.
When three or more edges exist within a connection, ACI 318-14, Chapter 17 provides for a reduced, effective embedment depth h’ef. Given the two-parallel edge conditions tested in this program, the reduced effective embedment depth was not considered, as it would have further reduced a conservative prediction. Thus, it was not applied to the two parallel edge conditions of these tests.
Neal S. Anderson, A. Koray Tureyen, and Donald F. Meinheit
The above review of the test behavior indicated that the side-edge distance, ca2, and anchor spacing parallel to the thickness, s2, were important parameters in defining capacity. The two- and four-stud anchorages used a constant stud length, so the contribution of hef to the capacity calculation was not studied. However, the embedment depth, hef, would only affect the concrete breakout surface projection along the long edge of the slab. In the thickness direction, the breakout will always be the horizontal thickness of the narrow edge, because the ca2/hef ratio is small. Thus the embedment depth does not affect the breakout in this direction.
Obviously, there will be a critical slab-edge thickness where the concrete breakout surface does not break through the slab thickness, and a cone will develop in the narrow, thickness edge dimension of the slab. This dimension will be dependent on the anchorage configuration and anchor embedment depth, and it may be 3hef or greater. Thus, there will be no constant thickness of a “thin” member that constitutes this behavior type.
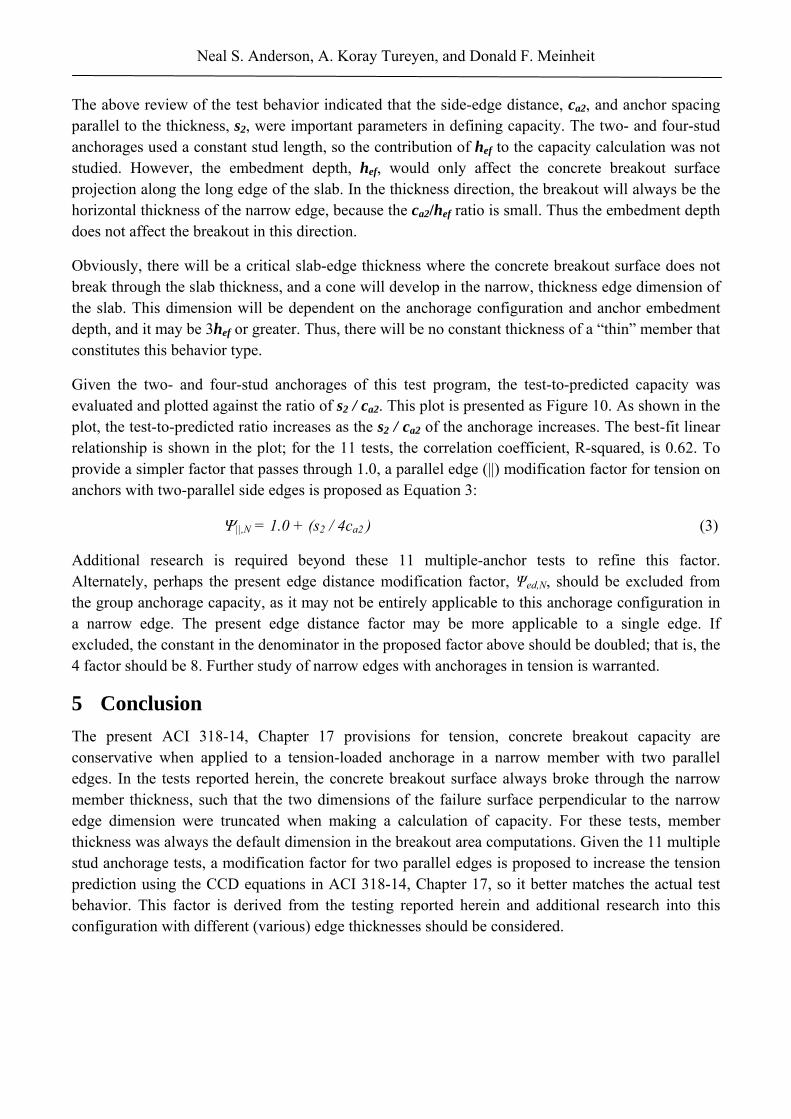
Given the two- and four-stud anchorages of this test program, the test-to-predicted capacity was evaluated and plotted against the ratio of s2 / ca2. This plot is presented as Figure 10. As shown in the plot, the test-to-predicted ratio increases as the s2 / ca2 of the anchorage increases. The best-fit linear relationship is shown in the plot; for the 11 tests, the correlation coefficient, R-squared, is 0.62. To provide a simpler factor that passes through 1.0, a parallel edge (||) modification factor for tension on anchors with two-parallel side edges is proposed as Equation 3:
||,N = 1.0 + (s2 / 4ca2 ) (3)
Additional research is required beyond these 11 multiple-anchor tests to refine this factor. Alternately, perhaps the present edge distance modification factor, Ψed,N, should be excluded from the group anchorage capacity, as it may not be entirely applicable to this anchorage configuration in a narrow edge. The present edge distance factor may be more applicable to a single edge. If excluded, the constant in the denominator in the proposed factor above should be doubled; that is, the 4 factor should be 8. Further study of narrow edges with anchorages in tension is warranted.
5 Conclusion
The present ACI 318-14, Chapter 17 provisions for tension, concrete breakout capacity are conservative when applied to a tension-loaded anchorage in a narrow member with two parallel edges. In the tests reported herein, the concrete breakout surface always broke through the narrow member thickness, such that the two dimensions of the failure surface perpendicular to the narrow edge dimension were truncated when making a calculation of capacity. For these tests, member thickness was always the default dimension in the breakout area computations. Given the 11 multiple stud anchorage tests, a modification factor for two parallel edges is proposed to increase the tension prediction using the CCD equations in ACI 318-14, Chapter 17, so it better matches the actual test behavior. This factor is derived from the testing reported herein and additional research into this configuration with different (various) edge thicknesses should be considered.
Neal S. Anderson, A. Koray Tureyen, and Donald F. Meinheit
Figure 10: Test-to-ACI predicted capacity versus the spacing-to-edge distance ratio
6 Acknowledgement
The authors wish to express their appreciation to the Wiss, Janney, Elstner Associates, Inc. (WJE) for the use of their testing equipment and to Dr. John Lawler of WJE, who allowed the authors to cast these anchorages into the concrete slab edges for slabs being made for another purpose. The authors are also indebted the Precast/Prestressed Concrete Institute for initially sponsoring an extensive research project, which had a few leftover anchorages because the test program scope changed as information on the shear behavior of welded headed stud anchors became available.
References
1. ACI Committee 318 (2014), Building Code Requirements for Structural Concrete (ACI 318-14) and Commentary (ACI 318R-14), American Concrete Institute, Farmington Hills, Michigan, 519 pp.
2. Fuchs W, Eligehausen R and Breen J E: “Concrete Capacity Design (CCD) approach for fastening to concrete”, ACI Structural Journal 92(1), 73-94, 1995
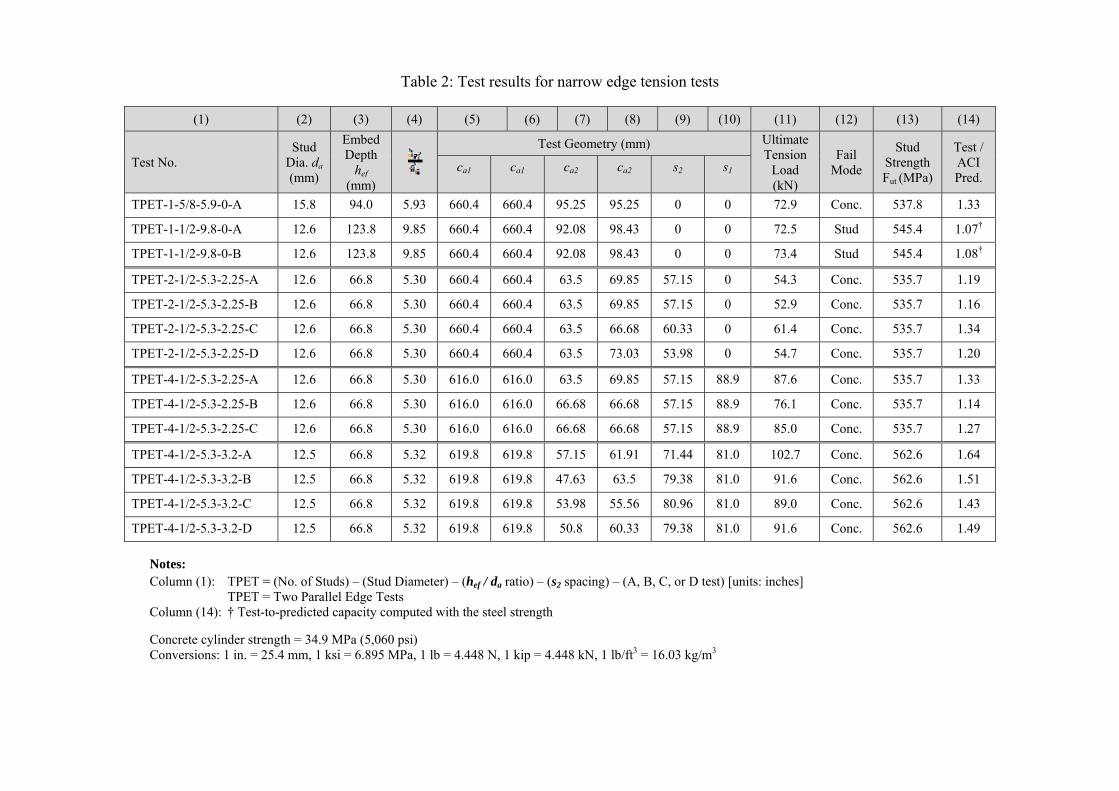
Table 2: Test results for narrow edge tension tests
(1) (2) (3) (4) (5) (6) (7) (8) (9) (10) (11) (12) (13) (14)
Test No. Stud
Dia. da (mm)
Embed Depth
hef (mm)
Test Geometry (mm) Ultimate Tension
Load (kN)
Fail Mode
Stud Strength Fut (MPa)
Test / ACI Pred.
ca1 ca1 ca2 ca2 s2 s1
TPET-1-5/8-5.9-0-A 15.8 94.0 5.93 660.4 660.4 95.25 95.25 0 0 72.9 Conc. 537.8 1.33
TPET-1-1/2-9.8-0-A 12.6 123.8 9.85 660.4 660.4 92.08 98.43 0 0 72.5 Stud 545.4 1.07†
TPET-1-1/2-9.8-0-B 12.6 123.8 9.85 660.4 660.4 92.08 98.43 0 0 73.4 Stud 545.4 1.08†
TPET-2-1/2-5.3-2.25-A 12.6 66.8 5.30 660.4 660.4 63.5 69.85 57.15 0 54.3 Conc. 535.7 1.19
TPET-2-1/2-5.3-2.25-B 12.6 66.8 5.30 660.4 660.4 63.5 69.85 57.15 0 52.9 Conc. 535.7 1.16
TPET-2-1/2-5.3-2.25-C 12.6 66.8 5.30 660.4 660.4 63.5 66.68 60.33 0 61.4 Conc. 535.7 1.34
TPET-2-1/2-5.3-2.25-D 12.6 66.8 5.30 660.4 660.4 63.5 73.03 53.98 0 54.7 Conc. 535.7 1.20
TPET-4-1/2-5.3-2.25-A 12.6 66.8 5.30 616.0 616.0 63.5 69.85 57.15 88.9 87.6 Conc. 535.7 1.33
TPET-4-1/2-5.3-2.25-B 12.6 66.8 5.30 616.0 616.0 66.68 66.68 57.15 88.9 76.1 Conc. 535.7 1.14
TPET-4-1/2-5.3-2.25-C 12.6 66.8 5.30 616.0 616.0 66.68 66.68 57.15 88.9 85.0 Conc. 535.7 1.27
TPET-4-1/2-5.3-3.2-A 12.5 66.8 5.32 619.8 619.8 57.15 61.91 71.44 81.0 102.7 Conc. 562.6 1.64
TPET-4-1/2-5.3-3.2-B 12.5 66.8 5.32 619.8 619.8 47.63 63.5 79.38 81.0 91.6 Conc. 562.6 1.51
TPET-4-1/2-5.3-3.2-C 12.5 66.8 5.32 619.8 619.8 53.98 55.56 80.96 81.0 89.0 Conc. 562.6 1.43
TPET-4-1/2-5.3-3.2-D 12.5 66.8 5.32 619.8 619.8 50.8 60.33 79.38 81.0 91.6 Conc. 562.6 1.49
Notes: Column (1): TPET = (No. of Studs) – (Stud Diameter) – (hef / da ratio) – (s2 spacing) – (A, B, C, or D test) [units: inches] TPET = Two Parallel Edge Tests Column (14): † Test-to-predicted capacity computed with the steel strength
Concrete cylinder strength = 34.9 MPa (5,060 psi) Conversions: 1 in. = 25.4 mm, 1 ksi = 6.895 MPa, 1 lb = 4.448 N, 1 kip = 4.448 kN, 1 lb/ft3 = 16.03 kg/m3