Embed Size (px)
Citation preview

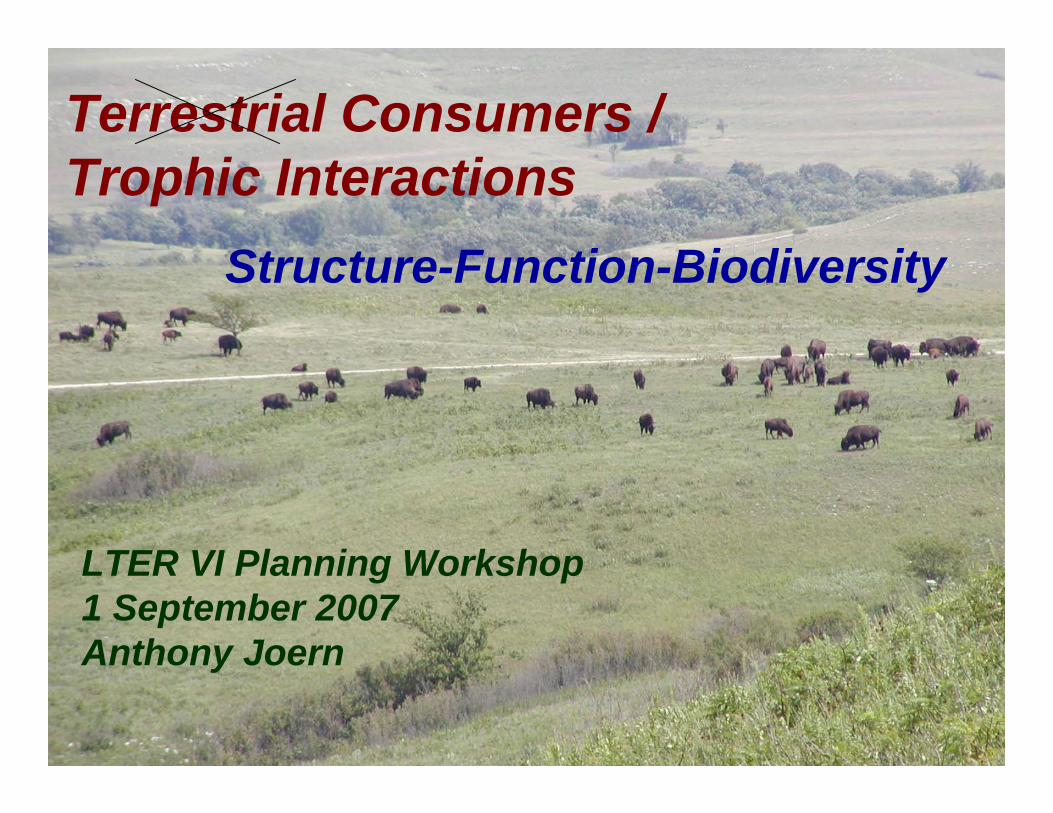
Terrestrial Consumers / Trophic Interactions
Structure-Function-Biodiversity
LTER VI Planning Workshop1 September 2007Anthony Joern
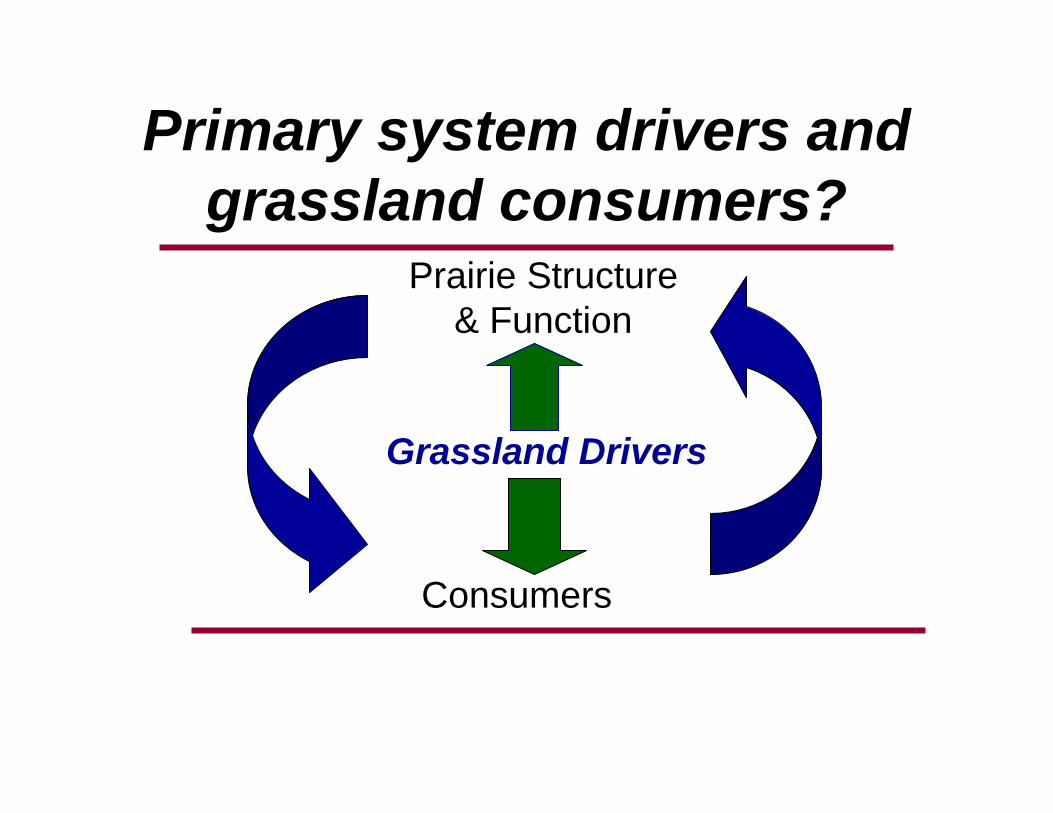
Primary system drivers and grassland consumers?
Prairie Structure& Function
Consumers
Grassland Drivers
Konza Prairie Consumers …
• Focus of many long-term core data sets• Major contributors to site biodiversity• Highly variable dynamics, especially densities• Major participants in food webs, contributing to
community & ecosystem dynamics • Serve as key indicator species for understanding
global environmental change• Major foci of conservation biology
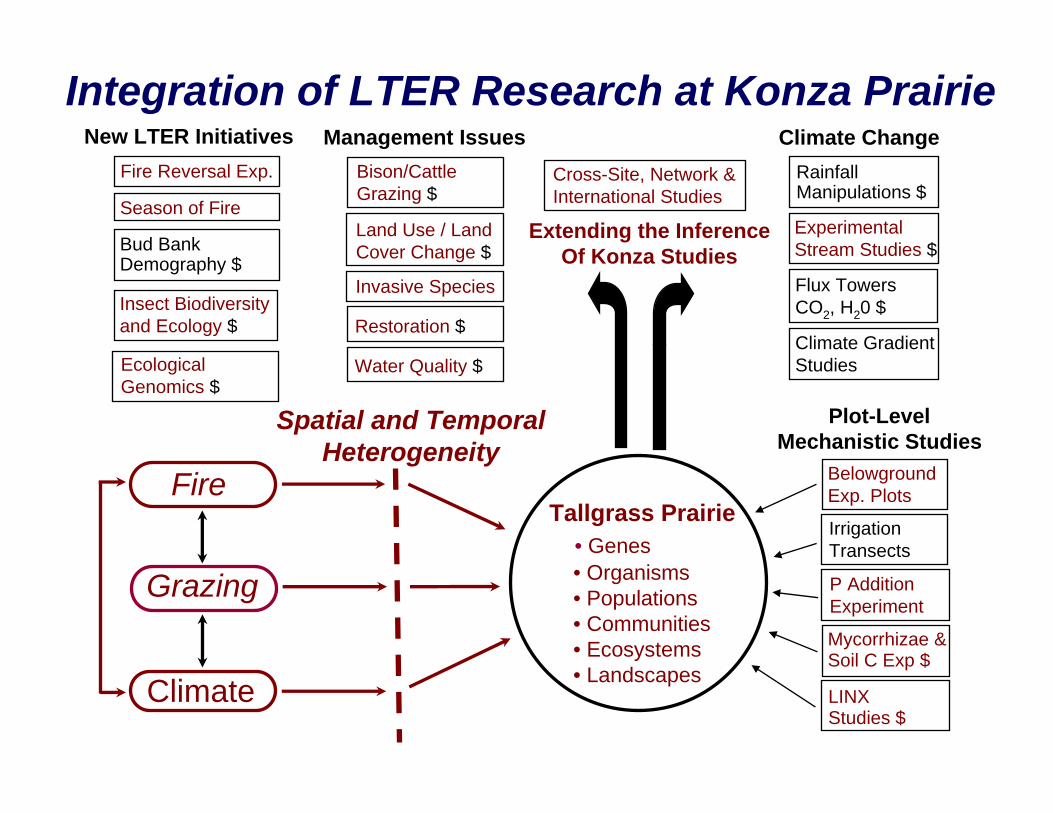
Integration of LTER Research at Konza PrairieNew LTER Initiatives
Season of Fire
Fire Reversal Exp.
Insect Biodiversityand Ecology $
Fire
Grazing
Climate
Spatial and TemporalHeterogeneity
Tallgrass Prairie• Genes• Organisms• Populations• Communities• Ecosystems• Landscapes
Management IssuesBison/Cattle Grazing $
Restoration $
Land Use / LandCover Change $
Water Quality $
Climate Change
Climate GradientStudies
Flux TowersCO2, H20 $
ExperimentalStream Studies $
RainfallManipulations $
Plot-LevelMechanistic Studies
BelowgroundExp. Plots
Irrigation Transects
P AdditionExperiment
Mycorrhizae &Soil C Exp $
LINX Studies $
Extending the InferenceOf Konza StudiesBud Bank
Demography $Invasive Species
Cross-Site, Network & International Studies
EcologicalGenomics $
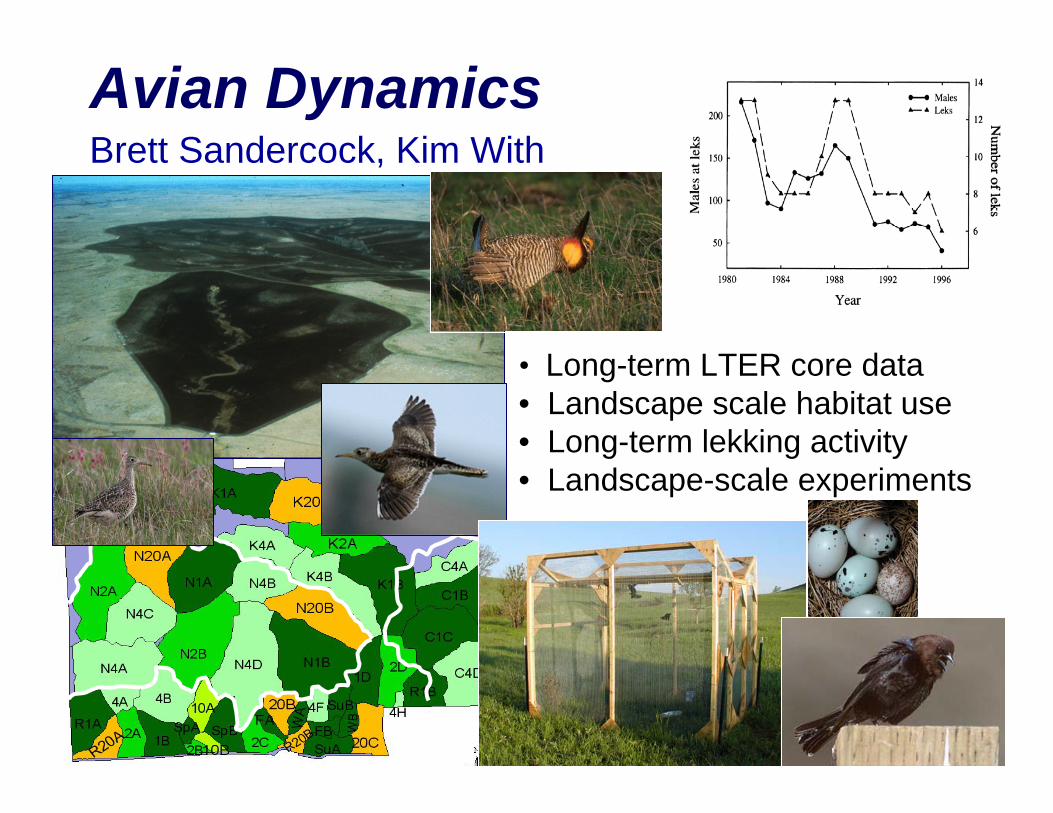
• Long-term LTER core data• Landscape scale habitat use• Long-term lekking activity• Landscape-scale experiments
Avian DynamicsBrett Sandercock, Kim With
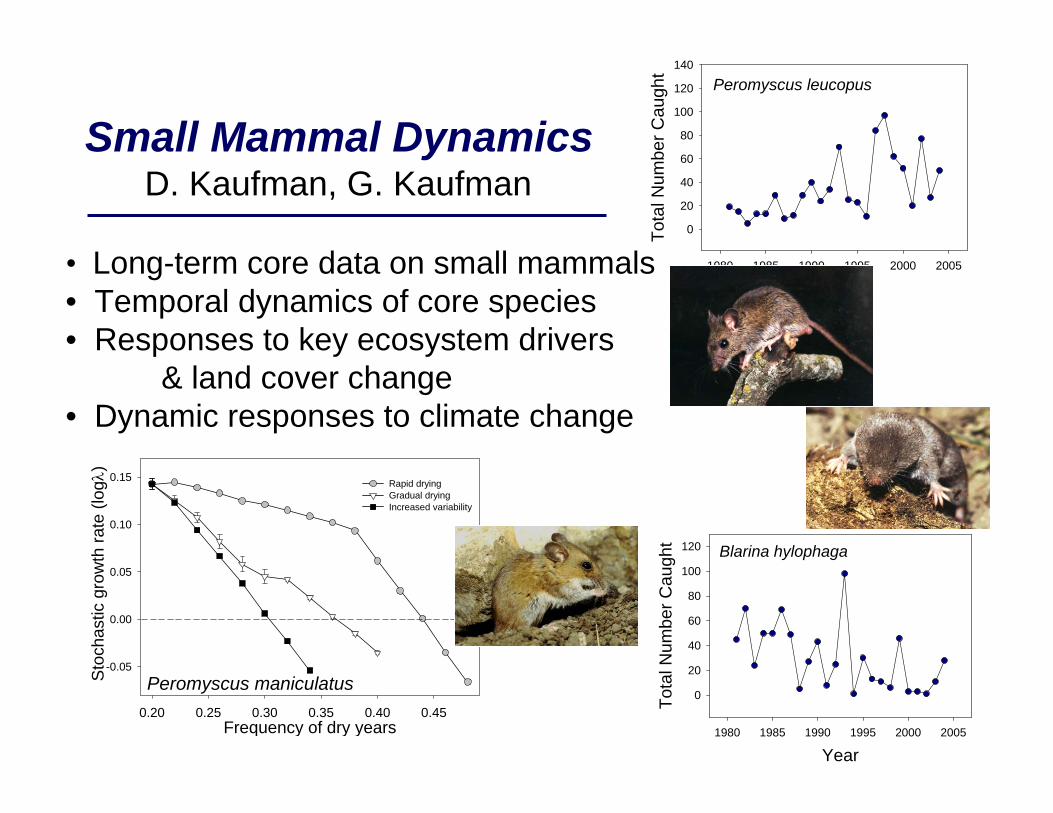
Frequency of dry years0.20 0.25 0.30 0.35 0.40 0.45
Sto
chas
tic g
row
th ra
te (l
ogλ )
-0.05
0.00
0.05
0.10
0.15 Rapid dryingGradual dryingIncreased variability
Peromyscus leucopus
Year1980 1985 1990 1995 2000 2005
Tota
l Num
ber C
augh
t
0
20
40
60
80
100
120
140
Small Mammal Dynamics
Blarina hylophaga
Year1980 1985 1990 1995 2000 2005
Tota
l Num
ber C
augh
t0
20
40
60
80
100
120
D. Kaufman, G. Kaufman
• Long-term core data on small mammals• Temporal dynamics of core species• Responses to key ecosystem drivers
& land cover change• Dynamic responses to climate change
Peromyscus maniculatus
Small Mammal Responses to Climate and Habitat Drivers
Four Research Phases in Konza LTER (since 1981)
I Magnitude & causes in temporal/ spatial variationII Season of annual fire effects on populationsIII Impact of woody invasion (ongoing direction)IV Deer mouse demography (new direction)
Key Points & Rationale• Relevant to climate change themes• Woody invasion/ habitat shifts changing communities• Long term population trends provide baseline to link with
additional • Critical vertebrate component of trophic structure
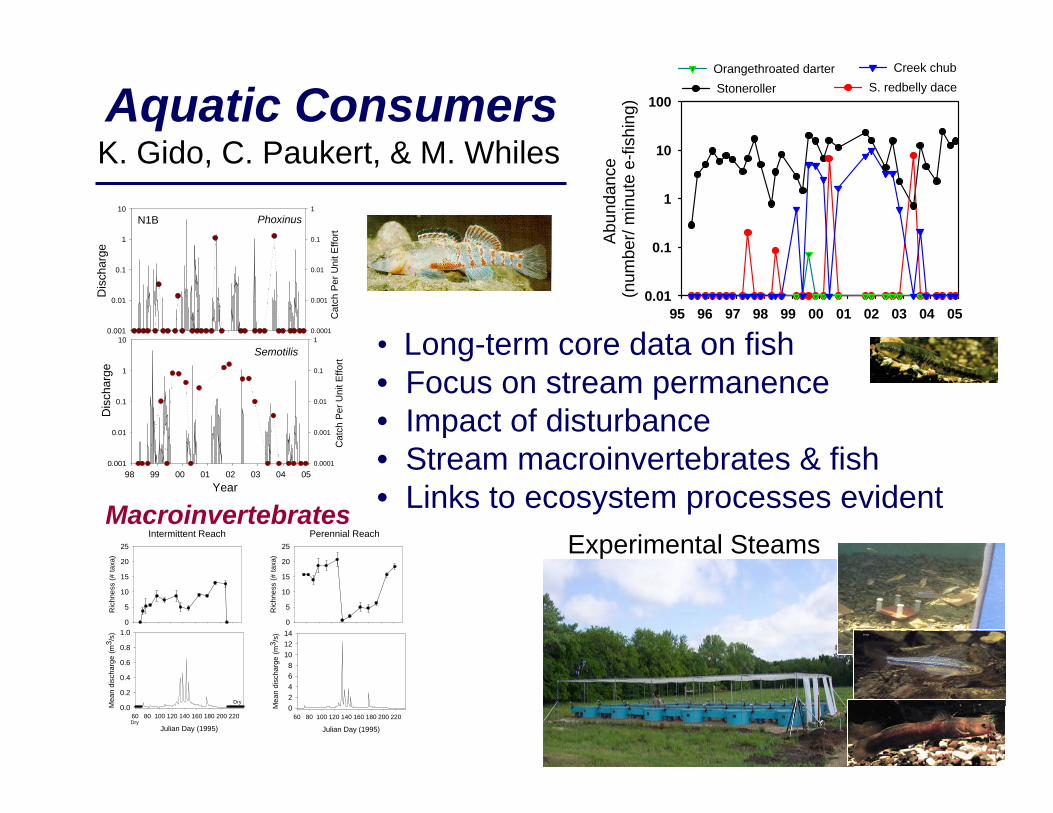
Aquatic Consumers
N1B
Dis
char
ge
0.001
0.01
0.1
1
10
Cat
ch P
er U
nit E
ffort
0.0001
0.001
0.01
0.1
1
Year98 99 00 01 02 03 04 05
Dis
char
ge
0.001
0.01
0.1
1
10C
atch
Per
Uni
t Effo
rt
0.0001
0.001
0.01
0.1
1
Phoxinus
Semotilis
95 96 97 98 99 00 01 02 03 04 05
Abu
ndan
ce
(num
ber/
min
ute
e-fis
hing
)
0.01
0.1
1
10
100Stoneroller S. redbelly daceOrangethroated darter Creek chub
Experimental Steams
• Long-term core data on fish• Focus on stream permanence • Impact of disturbance• Stream macroinvertebrates & fish• Links to ecosystem processes evident
K. Gido, C. Paukert, & M. Whiles
Julian Day (1995)
60 80 100 120 140 160 180 200 220
Mea
n di
scha
rge
(m3 /
s)
0.0
0.2
0.4
0.6
0.8
1.0
Julian Day (1995)
60 80 100 120 140 160 180 200 220
Mea
n di
scha
rge
(m3 /
s)
02468
101214
Ric
hnes
s (#
taxa
)
0
5
10
15
20
25
Ric
hnes
s (#
taxa
)
0
5
10
15
20
25Intermittent Reach Perennial Reach
Dry
Dry
Macroinvertebrates
N fl
ux (g
N m
-2)
0.00
0.05
0.10
0.15
0.20
0.25
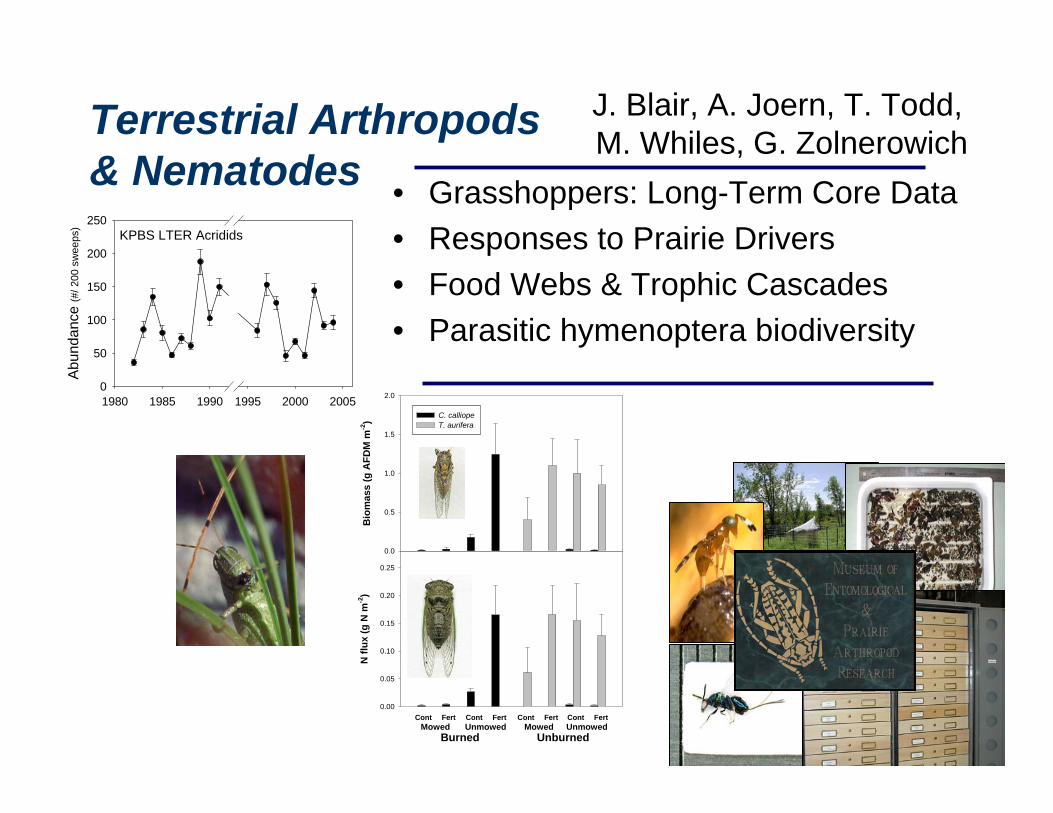
Burned UnburnedMowed Unmowed
FertCont FertCont FertCont FertContMowed Unmowed
Bio
mas
s (g
AFD
M m
-2)
0.0
0.5
1.0
1.5
2.0
C. calliopeT. aurifera
Terrestrial Arthropods & Nematodes • Grasshoppers: Long-Term Core Data
• Responses to Prairie Drivers• Food Webs & Trophic Cascades• Parasitic hymenoptera biodiversity
J. Blair, A. Joern, T. Todd, M. Whiles, G. Zolnerowich
KPBS LTER Acridids
1980 1985 1990 1995 2000 2005
Abu
ndan
ce (#
/ 200
sw
eeps
)
0
50
100
150
200
250
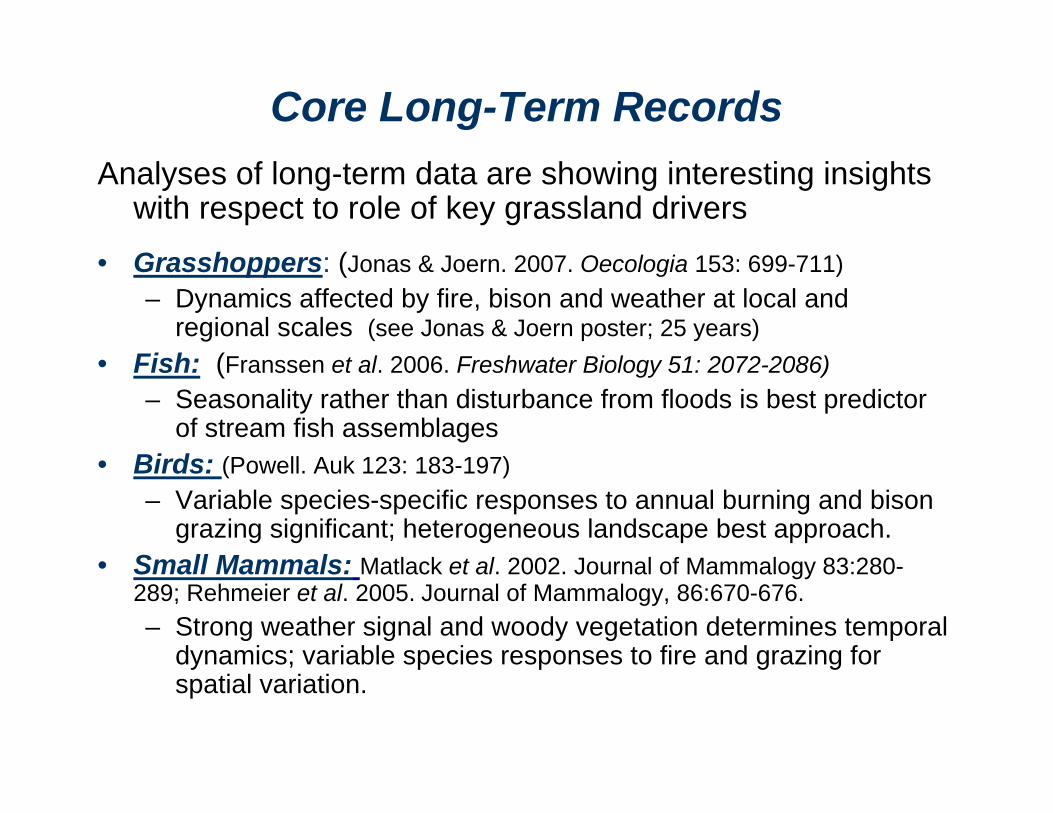
Core Long-Term RecordsAnalyses of long-term data are showing interesting insights
with respect to role of key grassland drivers
• Grasshoppers: (Jonas & Joern. 2007. Oecologia 153: 699-711)– Dynamics affected by fire, bison and weather at local and
regional scales (see Jonas & Joern poster; 25 years)• Fish: (Franssen et al. 2006. Freshwater Biology 51: 2072-2086)
– Seasonality rather than disturbance from floods is best predictor of stream fish assemblages
• Birds: (Powell. Auk 123: 183-197)– Variable species-specific responses to annual burning and bison
grazing significant; heterogeneous landscape best approach.• Small Mammals: Matlack et al. 2002. Journal of Mammalogy 83:280-
289; Rehmeier et al. 2005. Journal of Mammalogy, 86:670-676. – Strong weather signal and woody vegetation determines temporal
dynamics; variable species responses to fire and grazing for spatial variation.
Andropogon gerardii
% F
olia
r N
0.0
0.5
1.0
1.5
2.0
% F
olia
r N
0.0
0.5
1.0
1.5
2.0
2.5(a) (b)Solidago missouriensis
P-Fertilzer (g/m2)0 2 4 6 8 10
% F
olia
r P
0.00
0.05
0.10
0.15
0.20
0.25 0gN10gN
P-Fertilizer (g/m2)0 2 4 6 8 10
% F
olia
r P
0.00
0.04
0.08
0.12
0.160gN10gN
P-Fertilization (g/m2)-2.5 0.0 2.5 5.0 7.5 10.0
Gra
ssho
pper
Den
sity
(#/m
2 )
0
5
10
15
200gN/m2
10gN/ m2
Andropogon gerardii
0 2 4 6 8 10
Per
cent
age
Leaf
Dam
age
0
10
20
300gN10gN
Solidago missouriensis
P-Fertilizer (g/m2)0 2 4 6 8 10
Per
cent
age
Leaf
Dam
age
0
10
20
30
0gN10gN
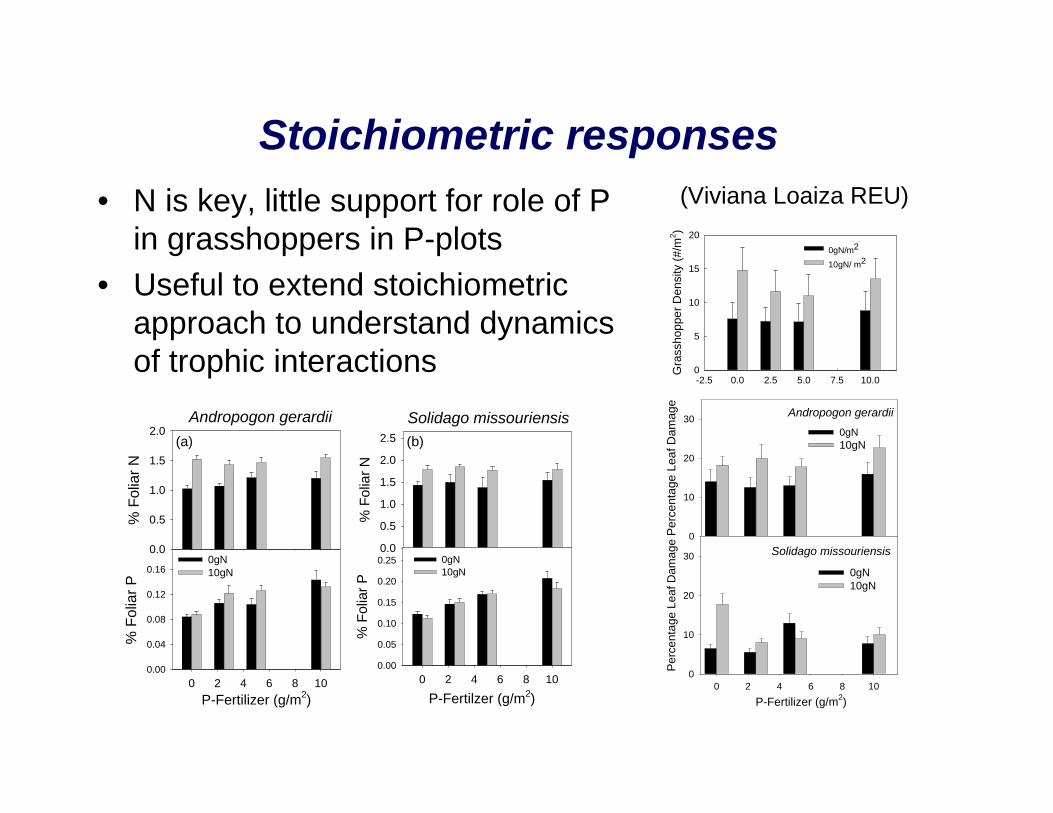
Stoichiometric responses(Viviana Loaiza REU)• N is key, little support for role of P
in grasshoppers in P-plots• Useful to extend stoichiometric
approach to understand dynamics of trophic interactions
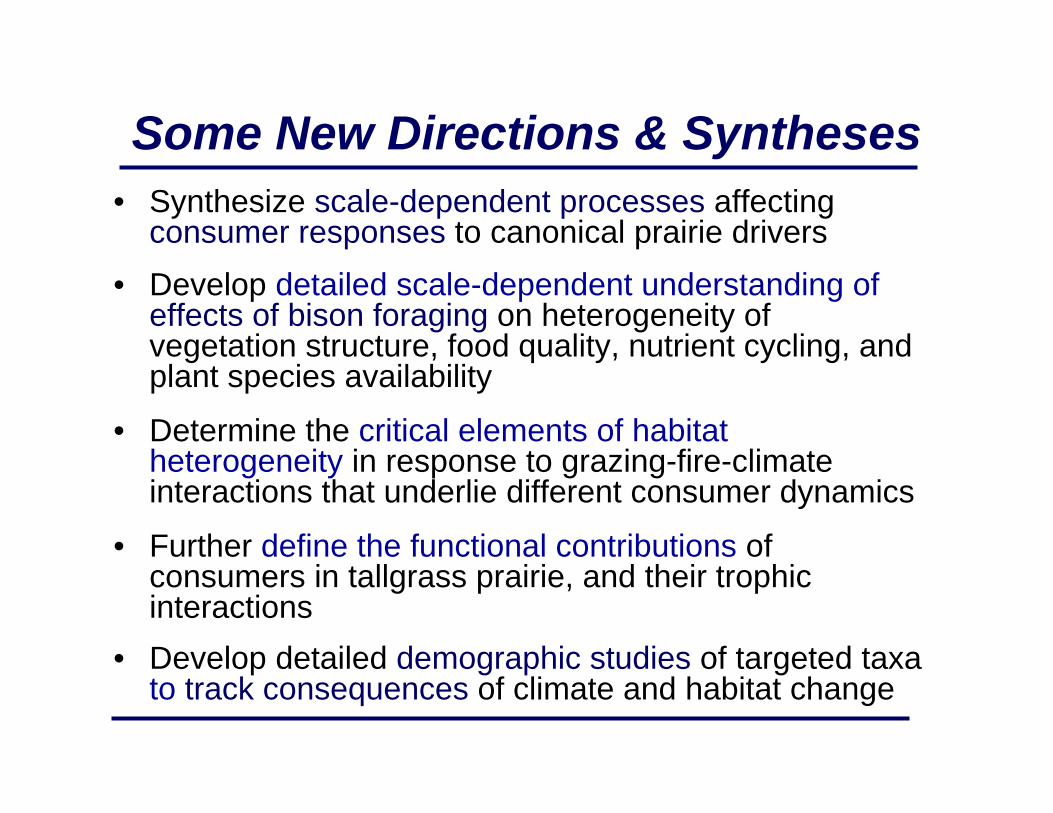
Some New Directions & Syntheses• Synthesize scale-dependent processes affecting
consumer responses to canonical prairie drivers• Develop detailed scale-dependent understanding of
effects of bison foraging on heterogeneity of vegetation structure, food quality, nutrient cycling, and plant species availability
• Determine the critical elements of habitat heterogeneity in response to grazing-fire-climate interactions that underlie different consumer dynamics
• Further define the functional contributions of consumers in tallgrass prairie, and their trophic interactions
• Develop detailed demographic studies of targeted taxa to track consequences of climate and habitat change

• Plant species richness• Vegetation height• Foliar nutritional quality• Variable microclimates &
structural microhabitats for smaller consumers
Bison Create Habitats & Heterogeneity
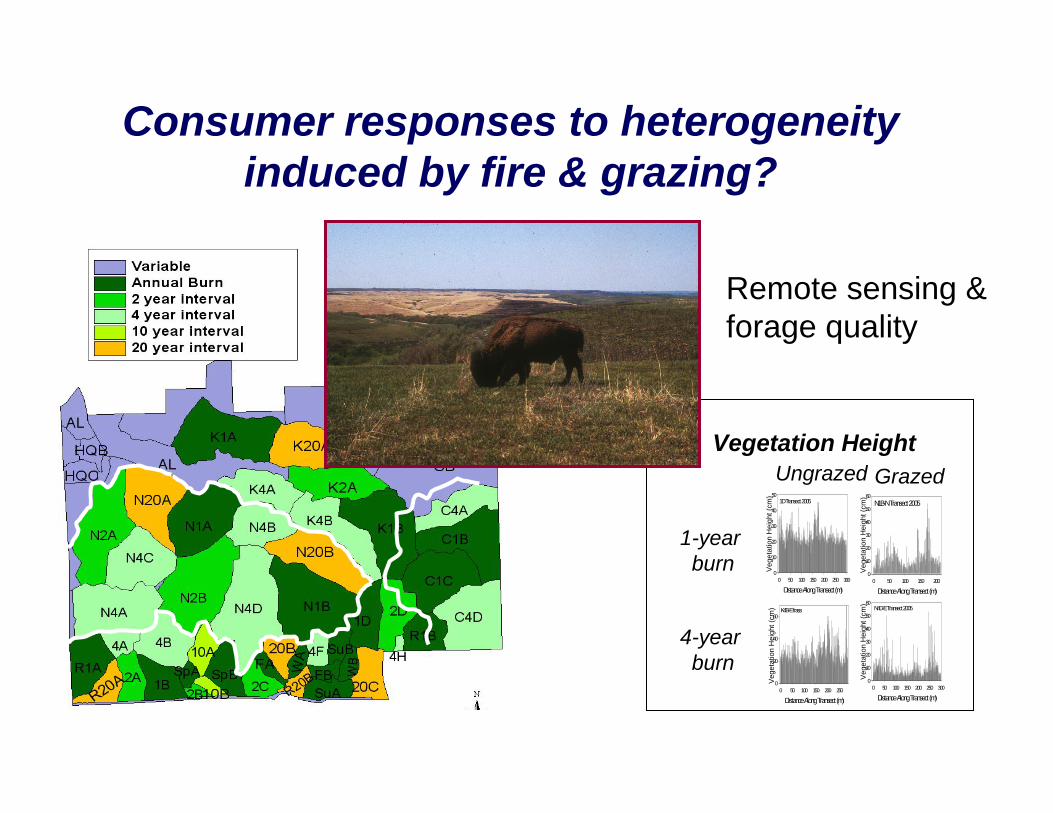
1-year burn
4-year burn
Ungrazed GrazedN1B-N Transect 2005
Distance Along Transect (m)0 50 100 150 200
Veg
etat
ion
Hei
ght (
cm)
0
10
20
30
40
50
601D Transect 2005
Distance Along Transect (m)0 50 100 150 200 250 300
Veg
etat
ion
Hei
ght (
cm)
0
10
20
30
40
50
N4D-E Transect 2005
Distance Along Transect (m)0 50 100 150 200 250 300
Veg
etat
ion
Hei
ght (
cm)
0
10
20
30
40
50
60K4B-E frass
Distance Along Transect (m)0 50 100 150 200 250
Veg
etat
ion
Hei
ght (
cm)
0
20
40
60
Vegetation Height
Consumer responses to heterogeneity induced by fire & grazing?
Remote sensing & forage quality
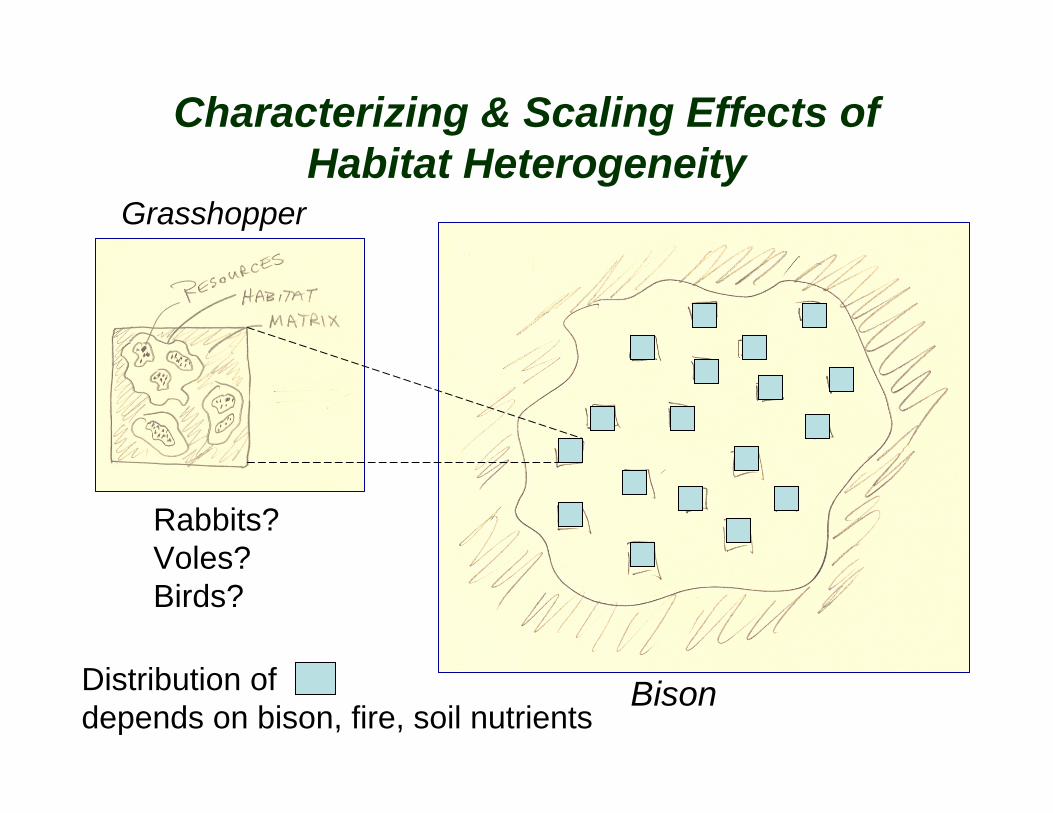
Characterizing & Scaling Effects of Habitat Heterogeneity
Grasshopper
BisonDistribution of depends on bison, fire, soil nutrients
Rabbits?Voles?Birds?
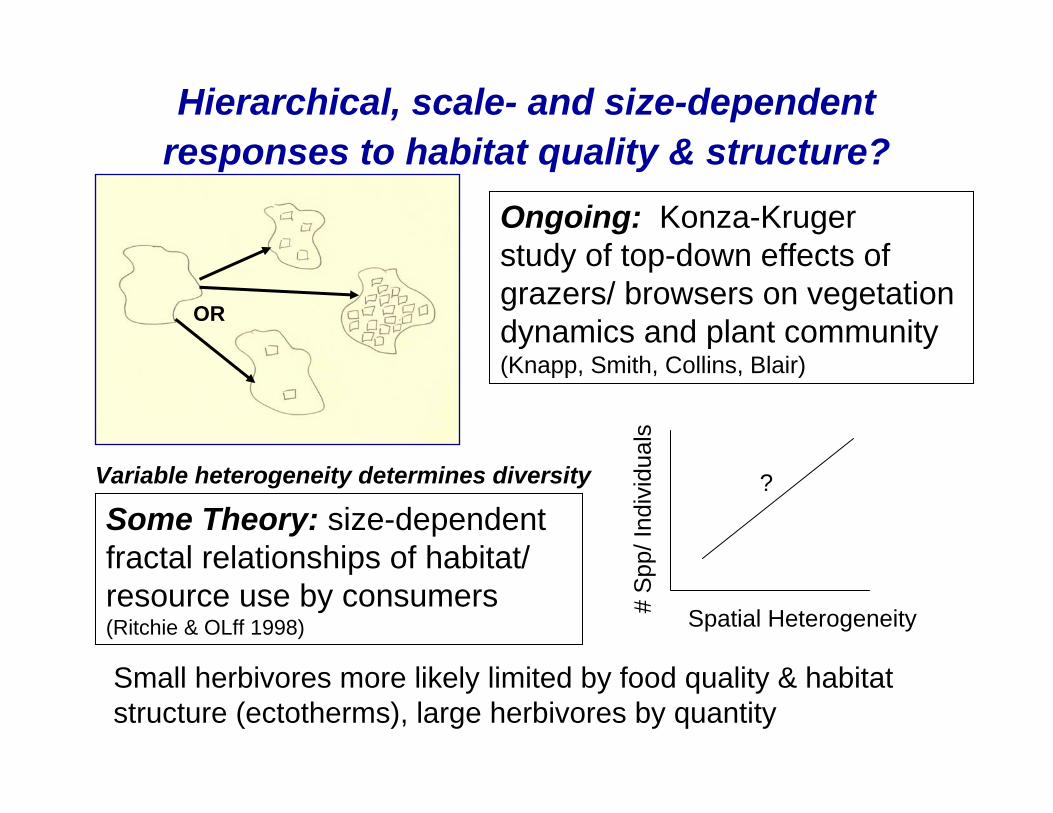
Hierarchical, scale- and size-dependent responses to habitat quality & structure?
OR
Ongoing: Konza-Kruger study of top-down effects of grazers/ browsers on vegetation dynamics and plant community(Knapp, Smith, Collins, Blair)
Some Theory: size-dependent fractal relationships of habitat/ resource use by consumers (Ritchie & OLff 1998)
Variable heterogeneity determines diversity
Spatial Heterogeneity# S
pp/ I
ndiv
idua
ls
?
Small herbivores more likely limited by food quality & habitat structure (ectotherms), large herbivores by quantity
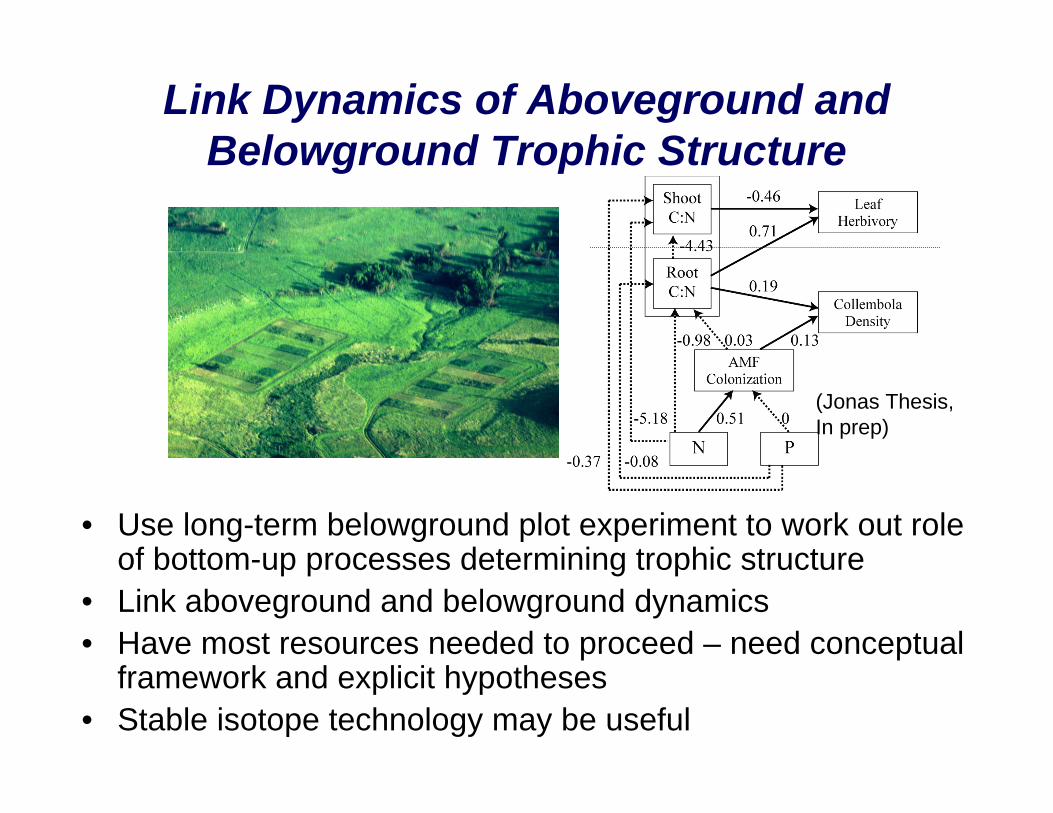
Link Dynamics of Aboveground andBelowground Trophic Structure
• Use long-term belowground plot experiment to work out role of bottom-up processes determining trophic structure
• Link aboveground and belowground dynamics• Have most resources needed to proceed – need conceptual
framework and explicit hypotheses• Stable isotope technology may be useful
(Jonas Thesis, In prep)
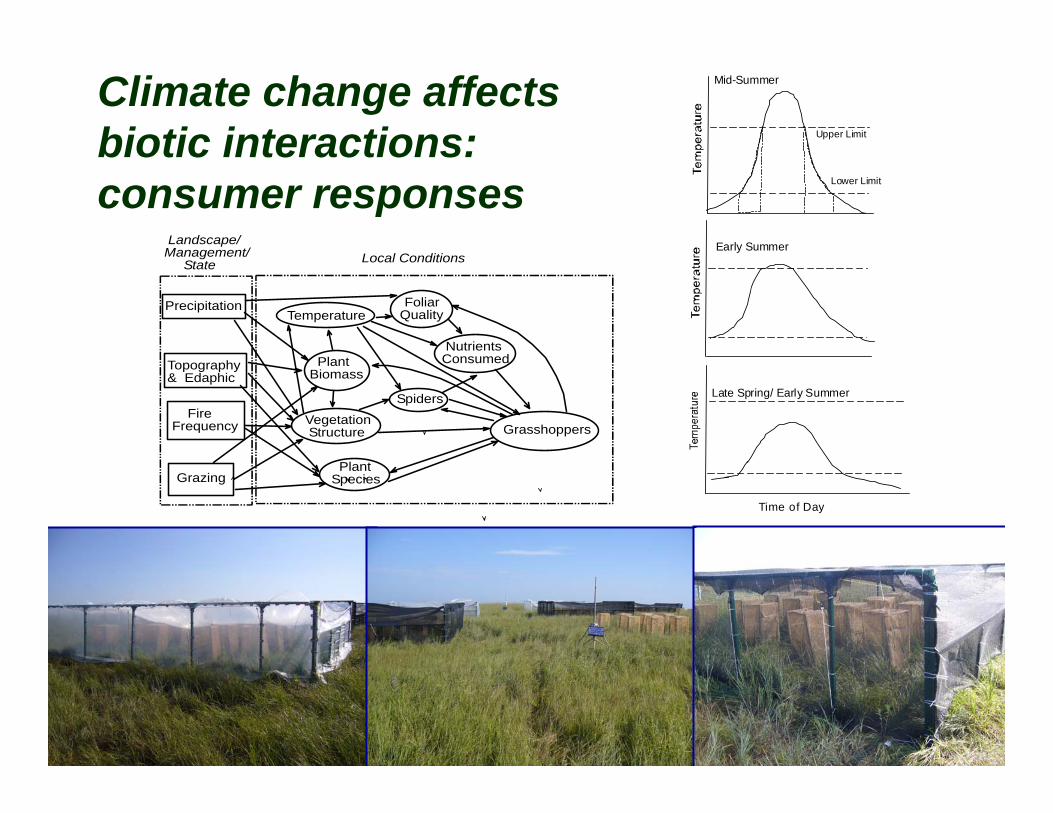
Precipitation
Topography& Edaphic
FireFrequency
Grazing
Landscape/Management/ State Local Conditions
PlantSpecies
Vegetation Structure
Temperature FoliarQuality
Spiders
NutrientsConsumed
Grasshoppers
PlantBiomass
Climate change affects biotic interactions: consumer responses
Mid-Summer
Early Summer
Upper Limit
Lower Limit
Time of Day
Late Spring/ Early Summer
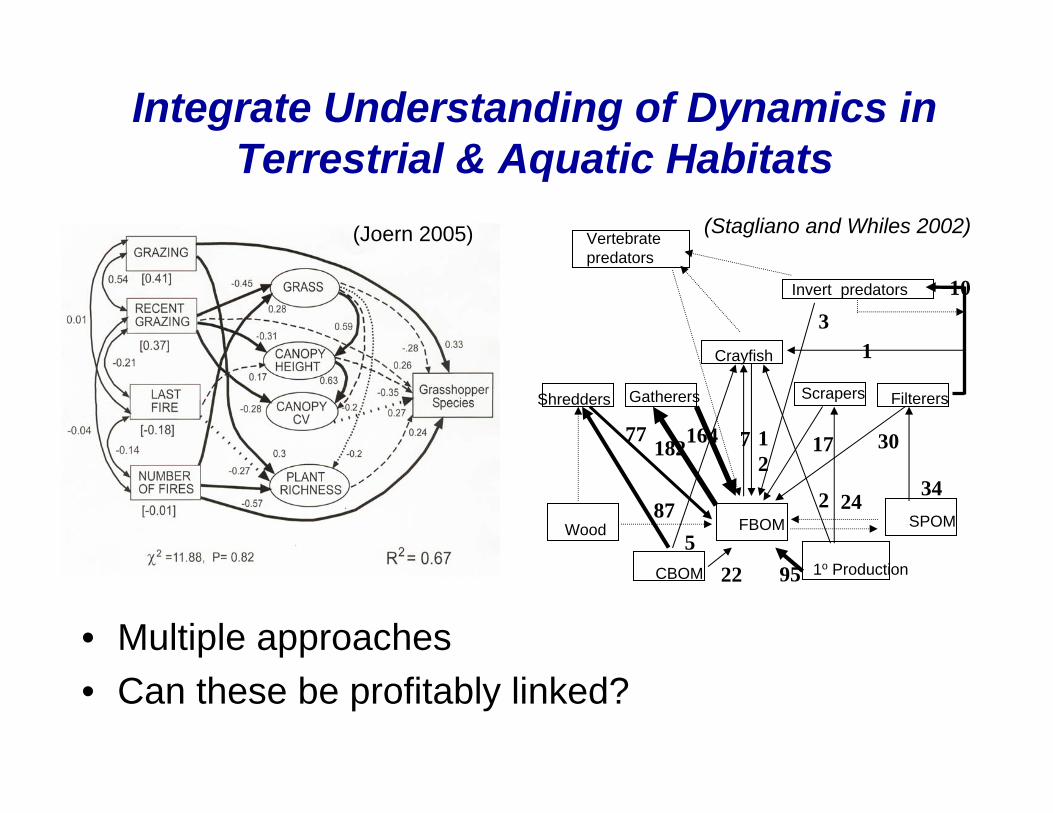
Integrate Understanding of Dynamics in Terrestrial & Aquatic Habitats
• Multiple approaches• Can these be profitably linked?
Shredders
1o Production
Wood
CBOM
FBOM SPOM
Invert predators
Gatherers FilterersScrapers
Crayfish
Vertebrate predators
87
225
77182164 7
24
17
342
3
30
95
12
10
1
(Stagliano and Whiles 2002) (Joern 2005)
Terrestrial Consumers / Trophic Interactions
Structure-Function-Biodiversity
LTER VI Planning Workshop1 September 2007Anthony Joern
![Limited trophic partitioning among sympatric delphinids ... terrestrial inputs results in higher productivity immediately surrounding the atoll [11]; island upwelling effects likely](https://img.pdfslide.net/doc/110x75/5ac3f2267f8b9a57528cb2d7/limited-trophic-partitioning-among-sympatric-delphinids-terrestrial-inputs-results.jpg)