Embed Size (px)
Citation preview
Tertiary education enrolment trends and projections in Latvia
Zane Cunska Baltic International Centre for Economic Policy Studies / University of Latvia
Presentation in Eurostat/UNECE Work Session April 29 2010 / Lisbon
Content Tertiary education in Latvia: facts and
situation Projection methods Scenarios
Stable enrollment ratio scenario Global education trend scenario Crisis scenario
Results Conclusions
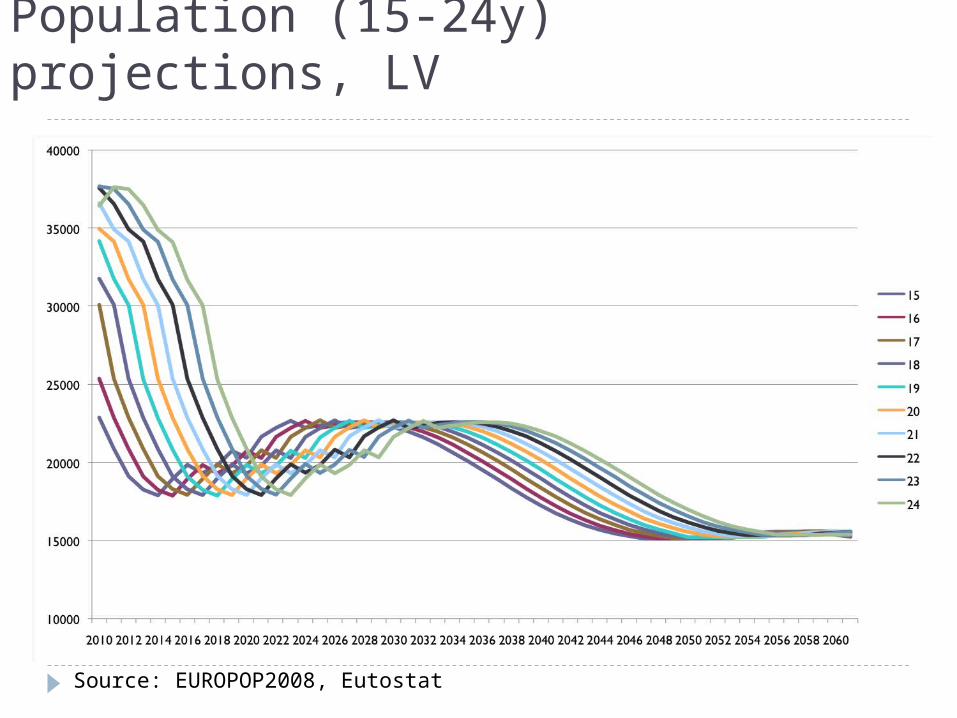
Population (15-24y) projections, LV
Source: EUROPOP2008, Eutostat
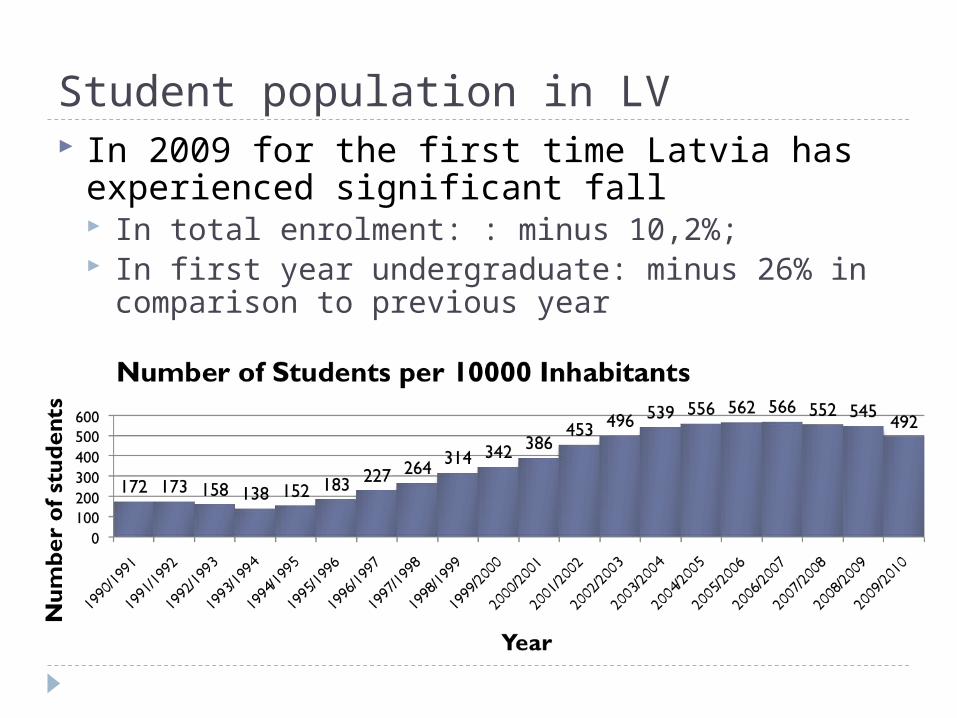
Student population in LV In 2009 for the first time Latvia has
experienced significant fall In total enrolment: : minus 10,2%; In first year undergraduate: minus 26% in
comparison to previous year
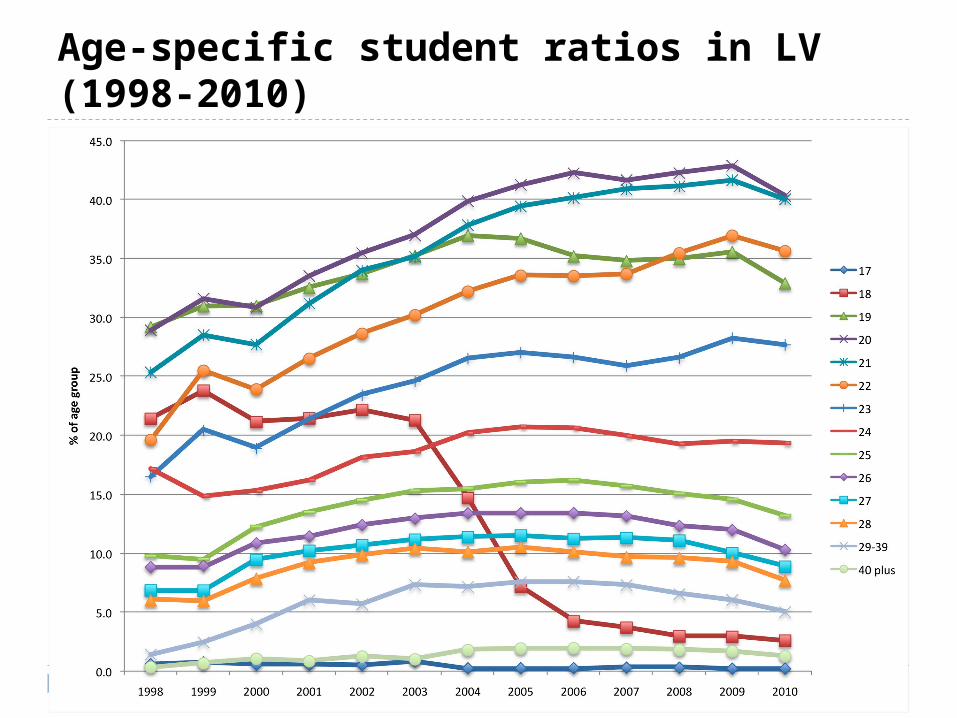
Age-specific student ratios in LV (1998-2010)
Methods Enrolment-ratio method Age-specific enrolment ratio Ext=rxt Txt , based
on Eurostat population projections Txt Ratio development trends rxt
Three development scenarios Stable enrollment ratio Global education trend Crisis
Scenarios – Stable enrolment ratio Tertiary education developing smoothly into the
future, only changes arise from the differences in cohort size.
Assumes: proportion of students in the respective overall age
cohort will continue to change in the same average speed and direction as over the previous period (1998-2010)
Transition rates and dropout rates will change at an average annual rate of change experienced in the observation period
ln(Y/Y(t-1)) = alpha/trend i.e., extrapolate the observed trends over the years 1998-2010, using the OLS and putting a constraint that the growth converges to zero when time converges to infinity
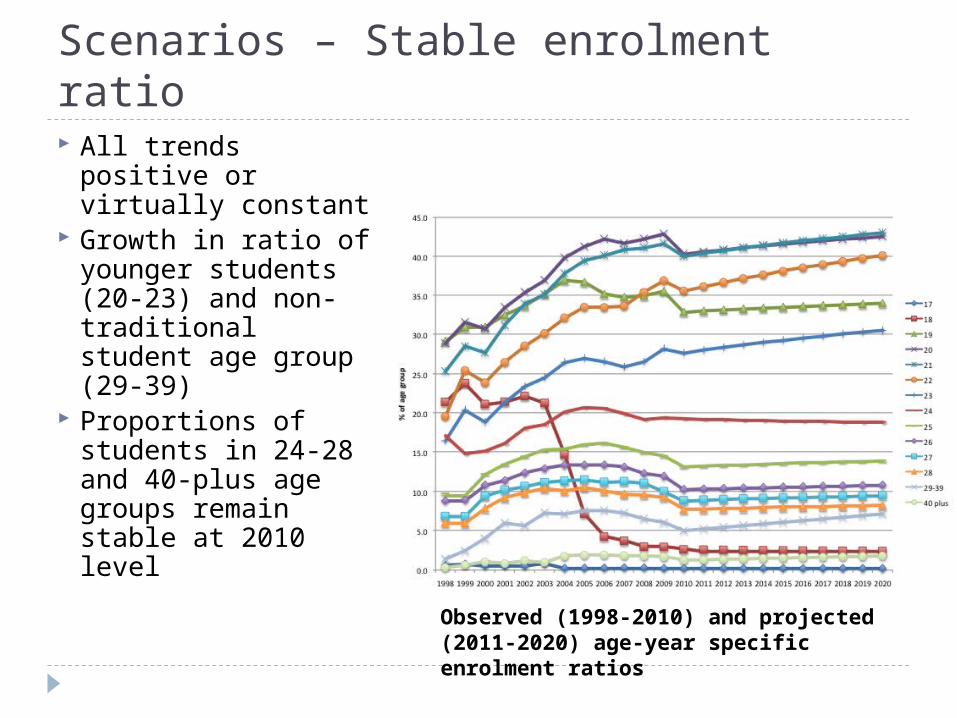
Scenarios – Stable enrolment ratio All trends positive
or virtually constant
Growth in ratio of younger students (20-23) and non-traditional student age group (29-39)
Proportions of students in 24-28 and 40-plus age groups remain stable at 2010 level
Observed (1998-2010) and projected (2011-2020) age-year specific enrolment ratios
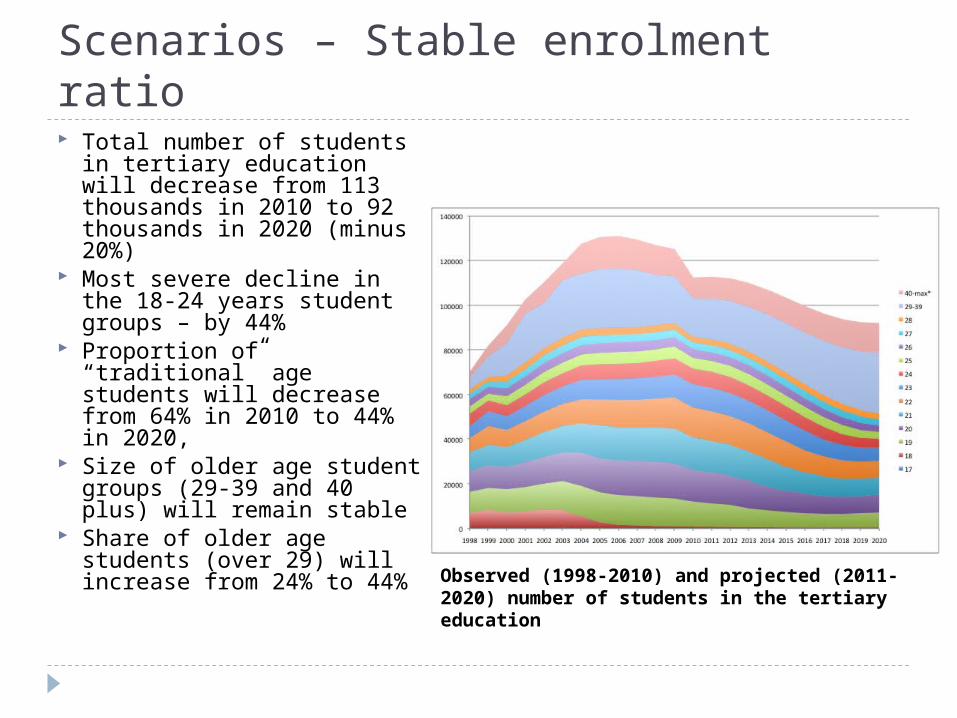
Scenarios – Stable enrolment ratio Total number of students
in tertiary education will decrease from 113 thousands in 2010 to 92 thousands in 2020 (minus 20%)
Most severe decline in the 18-24 years student groups – by 44%
Proportion of “traditional” age students will decrease from 64% in 2010 to 44% in 2020,
Size of older age student groups (29-39 and 40 plus) will remain stable
Share of older age students (over 29) will increase from 24% to 44%
Observed (1998-2010) and projected (2011-2020) number of students in the tertiary education
Scenarios – Global education trend Takes into account the schooling pattern
across European countries and assumes that the lifestyle and study patterns in Latvia and EU converge.
Assumes: The 2011-2020 enrolment ratio structure for
Latvia is converge to that of EU-27 ln(Y/Tt-1) = B(Yt-1-Yav) i.e., the age-specific enrolment rates Y will
converge to the EU-27 average, the speed being dependent on the size of the difference between the rate at t-1 and Yav
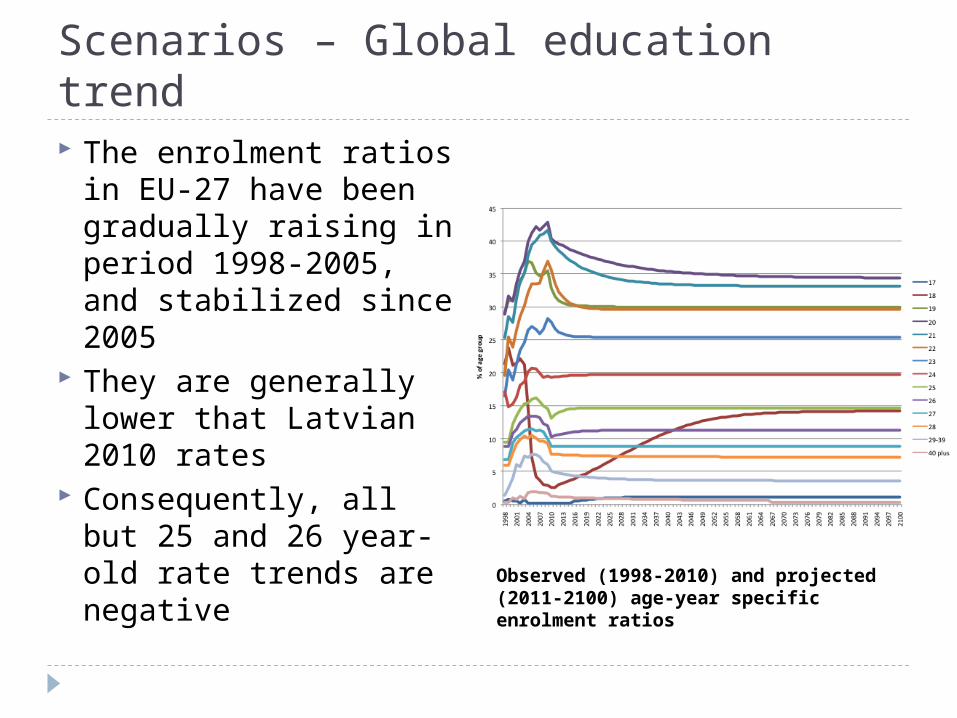
Scenarios – Global education trend The enrolment ratios
in EU-27 have been gradually raising in period 1998-2005, and stabilized since 2005
They are generally lower that Latvian 2010 rates
Consequently, all but 25 and 26 year-old rate trends are negative
Observed (1998-2010) and projected (2011-2100) age-year specific enrolment ratios
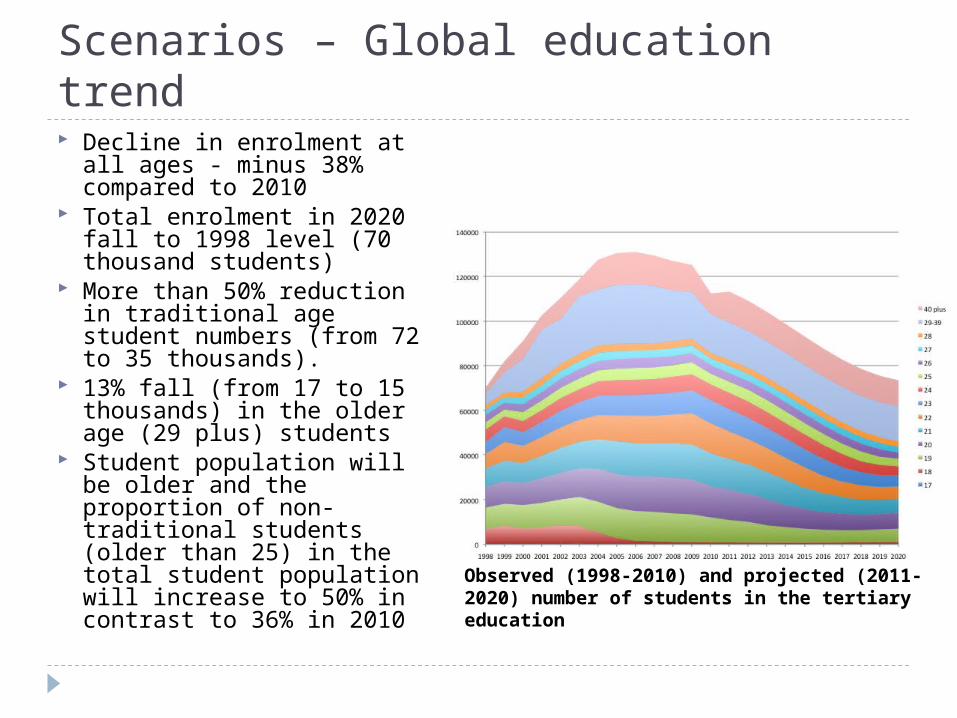
Scenarios – Global education trend Decline in enrolment at all
ages - minus 38% compared to 2010
Total enrolment in 2020 fall to 1998 level (70 thousand students)
More than 50% reduction in traditional age student numbers (from 72 to 35 thousands).
13% fall (from 17 to 15 thousands) in the older age (29 plus) students
Student population will be older and the proportion of non-traditional students (older than 25) in the total student population will increase to 50% in contrast to 36% in 2010
Observed (1998-2010) and projected (2011-2020) number of students in the tertiary education
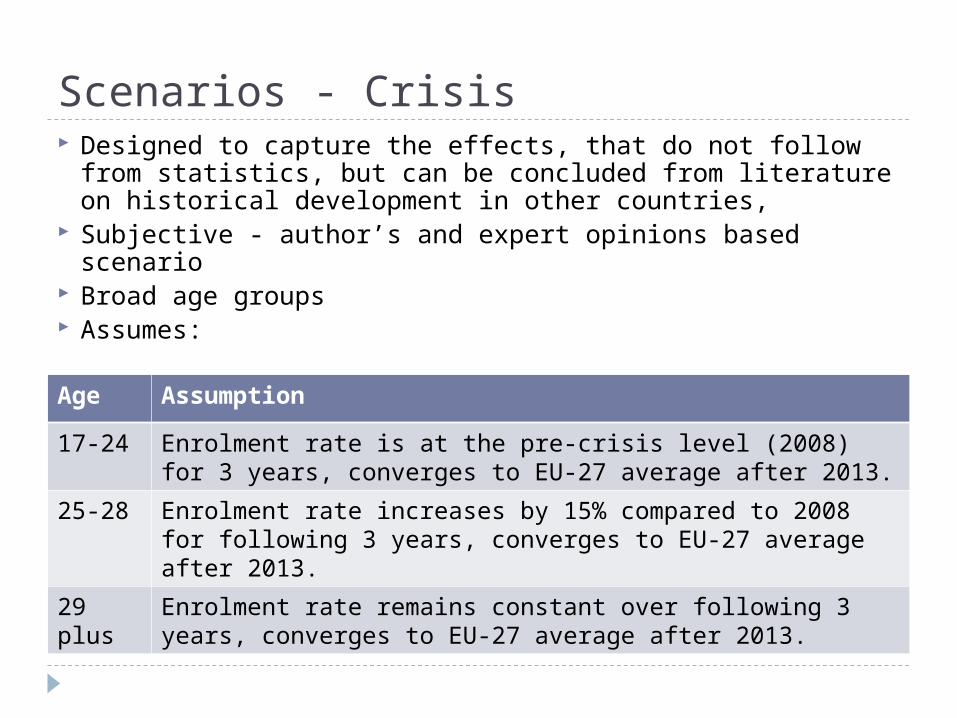
Scenarios - Crisis Designed to capture the effects, that do not follow
from statistics, but can be concluded from literature on historical development in other countries,
Subjective - author’s and expert opinions based scenario
Broad age groups Assumes: Age Assumption
17-24 Enrolment rate is at the pre-crisis level (2008) for 3 years, converges to EU-27 average after 2013.
25-28 Enrolment rate increases by 15% compared to 2008 for following 3 years, converges to EU-27 average after 2013.
29 plus
Enrolment rate remains constant over following 3 years, converges to EU-27 average after 2013.
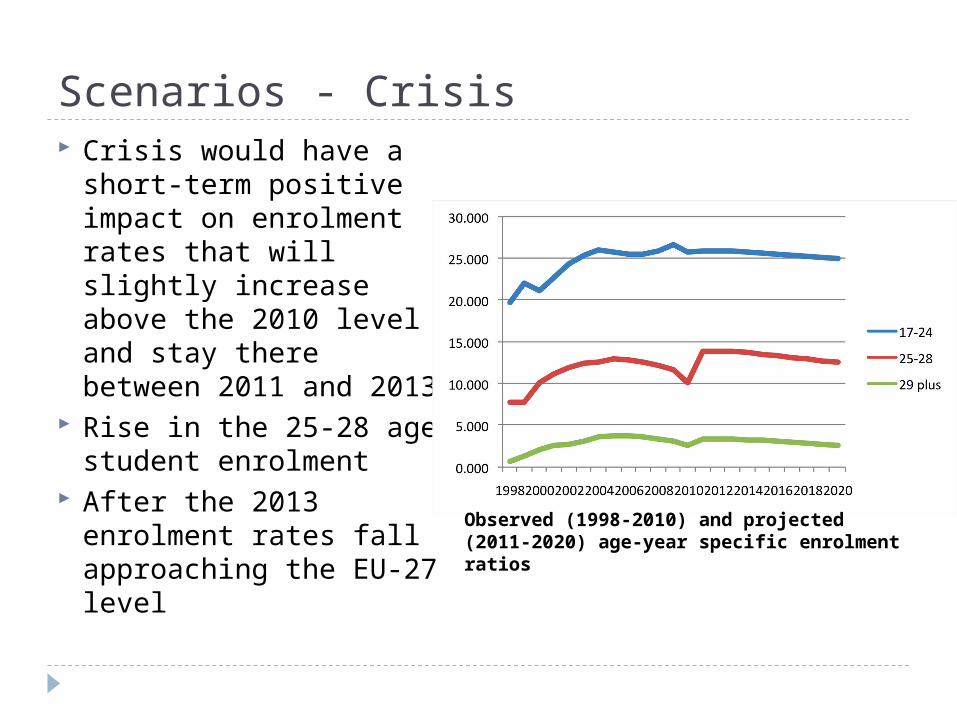
Scenarios - Crisis Crisis would have a
short-term positive impact on enrolment rates that will slightly increase above the 2010 level and stay there between 2011 and 2013
Rise in the 25-28 age student enrolment
After the 2013 enrolment rates fall approaching the EU-27 level
Observed (1998-2010) and projected (2011-2020) age-year specific enrolment ratios
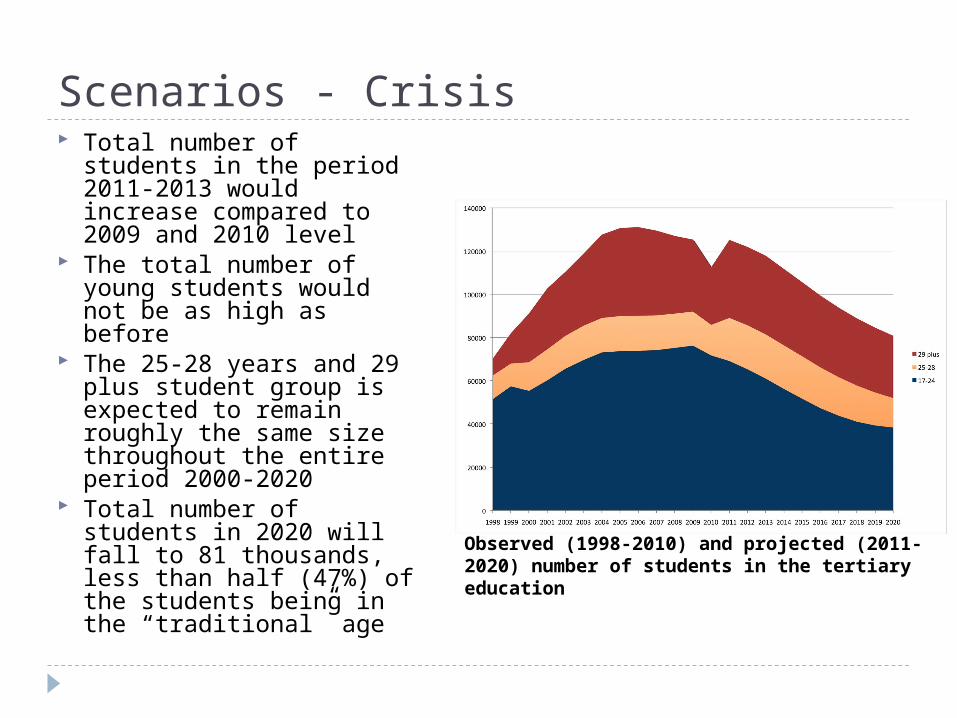
Scenarios - Crisis Total number of students
in the period 2011-2013 would increase compared to 2009 and 2010 level
The total number of young students would not be as high as before
The 25-28 years and 29 plus student group is expected to remain roughly the same size throughout the entire period 2000-2020
Total number of students in 2020 will fall to 81 thousands, less than half (47%) of the students being in the “traditional” age
Observed (1998-2010) and projected (2011-2020) number of students in the tertiary education
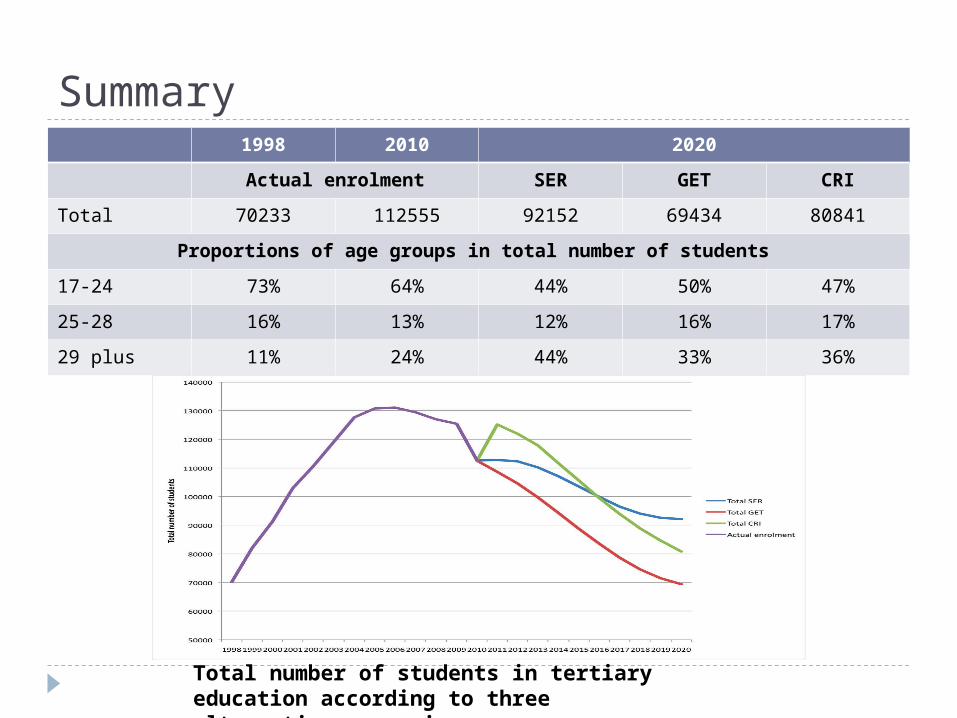
Summary1998 2010 2020
Actual enrolment SER GET CRI
Total 70233 112555 92152 69434 80841
Proportions of age groups in total number of students
17-24 73% 64% 44% 50% 47%
25-28 16% 13% 12% 16% 17%
29 plus 11% 24% 44% 33% 36%
Total number of students in tertiary education according to three alternative scenarios
Conclusions HE system in front of big changes Inexperienced situation Under any development scenario the total
enrolment is very likely to fall (decrease by 18-38%)
The big number of higher education institutions cannot be sustained
Foreign students are unlikely to fully compensate for decrease of cohorts
Thank you!