Embed Size (px)
Citation preview
Sains Malaysiana 48(2)(2019): 473–485 http://dx.doi.org/10.17576/jsm-2019-4802-25
Testing Personal Orientations - Organizational Climate Fit using Polynomial Regressions, Response Surface, and Bootstrapping
(Pengujian Orientasi Peribadi - Iklim Organisasi yang Bersesuaian Berdasarkan Regresi Polinomial, Permukaan Respons dan Butstrap)
ALLISON LEE GIM WAH, NORA MUDA* & ABDUL RAHMAN OTHMAN
ABSTRACT
Personal orientations-organizational climate fit as a predictor of organizational commitment was examined using a sample of 350 Malaysian medical doctors from public and private hospitals in the northern states of Malaysia. The fit hypothesis was tested using polynomial regression and response surface methodology, followed by bootstrapping to estimate confidence intervals and for significance testing of response surface features. The results generally indicated that the personal orientations-organizational climate fit has a positive impact on the affective and normative organizational commitment of doctors. The need for achievement and the need for power were found to be significant dimensions that predicted the affective-normative commitment.
Keywords: Bootstrapping; organizational climate; personal-orientation fit; polynomial regression; response surface
ABSTRAK
Orientasi peribadi-iklim organisasi yang sesuai sebagai peramal bagi komitmen sesebuah organisasi dikaji berdasarkan sampel 350 doktor perubatan Malaysia daripada hospital awam dan swasta di negeri-negeri utara Malaysia. Hipotesis yang sesuai diuji dengan menggunakan regresi polinomial dan kaedah permukaan respons, diikuti dengan analisis butstrap untuk menganggarkan selang keyakinan dan untuk menguji kesignifikanan ciri permukaan respons. Keputusan secara amnya menunjukkan bahawa orientasi peribadi-kesesuaian iklim organisasi mempunyai kesan positif terhadap afektif dan normatif bagi komitmen organisasi oleh doktor. Keperluan untuk peningkatan dan keperluan untuk kuasa didapati merupakan dimensi penting yang meramalkan komitmen afektif-normatif.
Kata kunci: Butstrap; individu-orientasi suaian; iklim organisasi; regresi polinomial; permukaan respons
INTRODUCTION
Many researchers (Adkins et al. 1994; Judge & Cable 1997; Kimura 2011; Kristof 1996; McMillan-Capehart 2007; O’ Reilly et al. 1991; Schneider et al. 1997, 1995) believe that individuals and organizations are attracted to each other based on some sort of fit between personal and organizational characteristics. In spite of the substantial body of literature on this theme (Meglino et al. 1989; Meyer et al. 1998; O’Reilly et al. 1991; Vancouver & Schmitt 1991), there is scant research that focuses specifically on the interaction between personal orientations and organizational climate on organizational commitment of medical doctors. Judge and Cable (1997) noted a paucity of empirical research that confirmed the relationship between fit and attraction to actual (hospital) organizations as opposed to hypothetical organizations. This is particularly interesting because in Malaysia, the perennial problem of exodus of doctors from public hospitals to private practices has been an issue of concern to many stakeholders. Although the attrition problem of doctors could be attributed to several causes, the lack of fit between the doctors and the hospitals could plausibly be one of the main contributing
factors to this vexatious problem. The lack of congruence between the values and norms of an employee to that of the organization may influence the employee’s organizational commitment and subsequently turnover intentions (Alniacik et al. 2013). This study, therefore, endeavoured to investigate the organizational commitment problem among doctors from the vantage point of personal orientations-organizational climate fit. Person-organizational (P - O) fit is commonly defined as the compatibility between a person and an organization on specific characteristics (Kristof 1996) and this congruence is believed to have an impact on organizational behaviour and outcomes (Pervin 1989). A good fit reflects ‘organizational wellness’ (Billsberry 2008) and it is this perception of ‘wellness’ that strengthens organizational commitment. Over the years, many conceptualizations and measurements of fit (Edwards 1991; Kamarul 2010; Kristof-Brown 2007; Sekiguchi 2004) have been documented. For example, earlier works on P-O fit typically employed methods that reduce person and organization measures into a single score to represent P-O fit. This was done by computing the difference between person and organization measures (algebraic
474
difference, that is (O – P), or quadratic difference, that is (O – P)2), or by using profile similarity indices (Edwards 2007, 2001a, 1991; Kristof 1996). Due to methodological problems associated with the use of difference scores and profile similarity indices (Cronbach 1992; Edwards 1994; Edwards & Parry 1993), polynomial regression has been much touted in recent years (Edwards & Parry 1993; Edwards 2001a, 2001b). Although polynomial regression has its merits in P-O fit research, there is still the irksome problem pertaining to precise measurement of the variables. To account for measurement errors, Cheung (2009) recently proposed the latent congruence model (LCM). However, Edwards (2009) contended that the LCM poses interpretational problems and recommended that a linear structural equation model with latent variables be used for quadratic equations in polynomial regressions. Polynomial regression is a special case of the general linear regression model where the independent variables can be present in various powers (Neter et al. 1990). It is based on the assumption that person and organization measures represent distinct constructs (Edwards 2007). It is a feasible alternative to the use of difference scores (Finegan 2000) because it replaces difference scores with the component measures that constitute the difference, and higher-order terms such as the squares and product of these measures (Edwards 2001a, 2001b). Theory and empirical studies have shown that P-O fit relationships are not linear but curvilinear (Livingstone et al. 1997; Van Vianen 2000), thus polynomial regression provides a better fit for the data than the linear model (Neter et al. 1990). Unlike the traditional method, which suppresses the combined effects of the squared terms and the product terms, polynomial regression can account for the contribution of specific model components such as the quadratic and product components to the proportion of variance explained by the model (Kalliath et al. 1999). Polynomial regression also preserves the three-dimensional relationship between the components and the outcome. Used together with response surface methodology, which analyzes features of surfaces (Edwards 2007), polynomial regression is capable of testing more comprehensive and complex hypotheses often associated with studies on fit (Edwards 2007; Ximenez 2000).
THEORETICAL FRAMEWORK AND HYPOTHESES PERSONAL ORIENTATIONS
Ostroff (1993) and Schein and Diamante (1988) found evidence that personal orientations were significantly linked to work-related attitudes and behaviours because individuals have stable needs and tend to consistently act so as to maximize the possibility of satisfying these needs (Becker 1960; Kuusio et al. 2010; Sekiguchi 2004). Based on literature and previous studies (Ansari et al. 1982; Ostroff 1993; Young & Brymer 2000), the term personal orientations in this study refers to the inherent needs of the doctor in relation to the climate attributes in the hospital.
Exploring personal orientations from this angle of need satisfaction is necessary because studies have shown that the degree of satisfaction following need fulfillment and the degree of dissatisfaction following need frustration are directly linked to the strength of the need (Downey et al. 1975; Misra & Kalro 1972). For example, the experience of powerlessness and perceived lack of power, or power deficit in individuals who have a high power need, could be the root cause for disruptive behaviours, and loss of job involvement and organizational identification (Ashforth 1989; Kanungo 1979; Thompson 1981). There are three fundamental needs consistently highlighted in literature. They are the need for achievement, the need for autonomy and the need for power. The need for achievement includes the desire to excel as measured by some standard; the preference for moderate risk-taking; the desire for immediate, concrete feedback; the desire to be responsible for one’s own tasks achievements; and the desire to improve and innovate (Locke 1991). The P-O fit study by Ximenez (2000) showed a strong correlation between achievement and intent to leave. The need for autonomy is a desire for independence or freedom to conduct tangential work activities in a normative manner in line with one’s own discretion (Engel 1970). Lindholm (2003) found that individuals whose institutional environments provide them with the liberty to work independently, remain private, and pursue their own intellectual or professional interests tend to be most content. Individuals with power needs have an internal urge or drive to command attention, get recognition, and control others (McClelland 1995). Liu et al. (2006) found that empowerment of employees correlates positively with organizational commitment.
ORGANIZATIONAL CLIMATE
Having its roots in the Lewinian theory on individuals and their social environments (Denison 1996; Joyce & Slocum 1982), organizational climate is an important determinant of work attitudes and behaviour (Day & Bedeian 1991; Joyce et al. 1977; Schneider & Snyder 1975) because it reflects elements of the organizational environment that are perceived by the employees (McMillan-Capehart 2007). There are many approaches to the study of organizational climate. For the purpose of this study, the definition espoused by Ansari (1980), that is, ‘the sum total of particular attributes of the organization as a whole as well as those values and norms which symbolize the on-going pattern of the organization and its subunits’, was adhered to. To commensurate with the dimensions of personal orientations, only three of the four perceived organizational climate dimensions used by Bhal and Ansari (2000) were incorporated in this study, which are: Achievement-oriented - the extent to which the organization encourages innovation and experimentation, provides freedom to set goals, and is performance-oriented; independence-oriented - the extent to which the organization provides
475
authority and freedom to do the job, and opportunities for independent thoughts and actions; and power-oriented - the extent to which the organization exerts power and control in directing and organizing the activities of its members. The phrasing of the items for the subscales was also modified to correspond with the items for personal orientations.
ORGANIZATIONAL COMMITMENT
Organizational commitment is the strength of an individual’s involvement and identification with a specific organization (Uygur & Kilic 2009), or the bond that links the individual to a particular organization (Mathieu & Zajac 1990). Bhattacharya et al. (1995) described this bond or organizational identification as ‘perceived oneness with or belongingness to an organization,’ which prompts members to prolong their tenure in the organization. According to Allen and Meyer (1990), there are different reasons for being committed to the organization. Some want to remain because of strong affective commitment; some stay on due to strong continuance commitment whilst others lingered on because of strong normative commitment. Affective commitment can be defined as a positive attachment in the form of desire to be with an organization. Continuance commitment can be defined as social cost attachment to, in other words the gains and losses of being with an organization. While normative commitment is the obligatory or loyalty aspect of attachment to an organization.
HYPOTHESES
We postulated that organizational commitment is dependent upon personal orientation and organizational climate and proceeded to test this through the following hypotheses:
H10: The personal orientations-organizational fit is not significantly related to the organizational commitment of doctors.
H20: The autonomy orientation-independence climate fit has the same impact on the affective, normative, and continuance commitment of doctors.
H30: The achievement orientation-achievement climate fit has the same impact on the affective, normative and continuance commitment of doctors.
H40: The power orientation-power climate fit has the same impact on the affective, normative and continuance commitment of doctors.
METHODS
SAMPLE AND PROCEDURE
The sample of medical doctors was taken from seven public and twelve private hospitals in the four northern states of Malaysia: Penang, Perlis, Kedah, and Perak. A total of 1007 questionnaires were mailed to the selected hospitals, which were then randomly distributed to the
medical doctors. A follow-up reminder letter was sent two weeks later. Participation was voluntary. The response rate was 34.96%, as 352 questionnaires were returned. However, two questionnaires had to be discarded due to incomplete answers. There were 228 male and 122 female participants in our study. Chinese formed the majority (47.4%) followed by Bumiputeras (29.7%), Indians (20.3%) and other ethnic groups (2.3%). The participants comprised of 158 (45%) doctors or medical officers and 167 (47.7%) specialists or consultants, while 16 (4.6%) were directors, CEOs, and Head of Departments. The remaining nine or 2.6% of the participants were trainees or house officers. Most of the participants (64.6%) came from the public hospitals and the remaining 35.4% were from the private hospitals. The age of the participants ranged from 24 to 69 years (Mean = 38.03, SD = 9.13) and the mean tenure was 9.36 years with a standard deviation of 7.56.
MEASURES
In order to measure personal orientation, fifteen items were extracted from the original 20 items in Steers and Braunstein’s (1976) Manifest Needs Questionnaire. The Manifest Needs Questionnaire has several advantages. It is a short, yet reliable, and valid scale (Cook et al. 1989). The scales were designed to measure manifest levels of the various needs in work-specific contexts (Cable & Judge 1994; Morris & Synder 1979) and unlike affective responses, these behaviourally-based measures allow the researcher to know which needs were actively pursued (Steers 1977). The five items excluded were from the affiliation orientation dimension. This dimension was irrelevant to the present study. The original reliability coefficients for ‘need for autonomy’, ‘need for achievement’, and ‘need for power’ were .61, .66, and .83, respectively. Organizational climate was measured using Bhal and Ansari’s (2000) original 30-item scale but the dimension of relation orientation was omitted, as it was irrelevant to this study. All the 15 items adopted were rephrased to tailor to the needs of the current research. Independence-oriented climate, achievement-oriented climate, and power-oriented climate had Cronbach’s coefficients alpha of 0.83, 0.65, and 0.60, respectively. Eighteen i tems that specifically measured organizational commitment were adapted from the 36-item scale developed by Meyer et al. (1993). The items were rephrased to suit the context of the study. The reliabilities for the original measures of affective, continuance, and normative organizational commitment were 0.82, 0.74, and 0.83, respectively. Responses for all the measures were rated on a 7-point scale format ranging from strongly disagree to strongly agree. The questionnaire was pre-tested on 50 doctors randomly selected from one public and one private hospital in Penang prior to mailing to the 19 hospitals.
476
DATA ANALYSIS
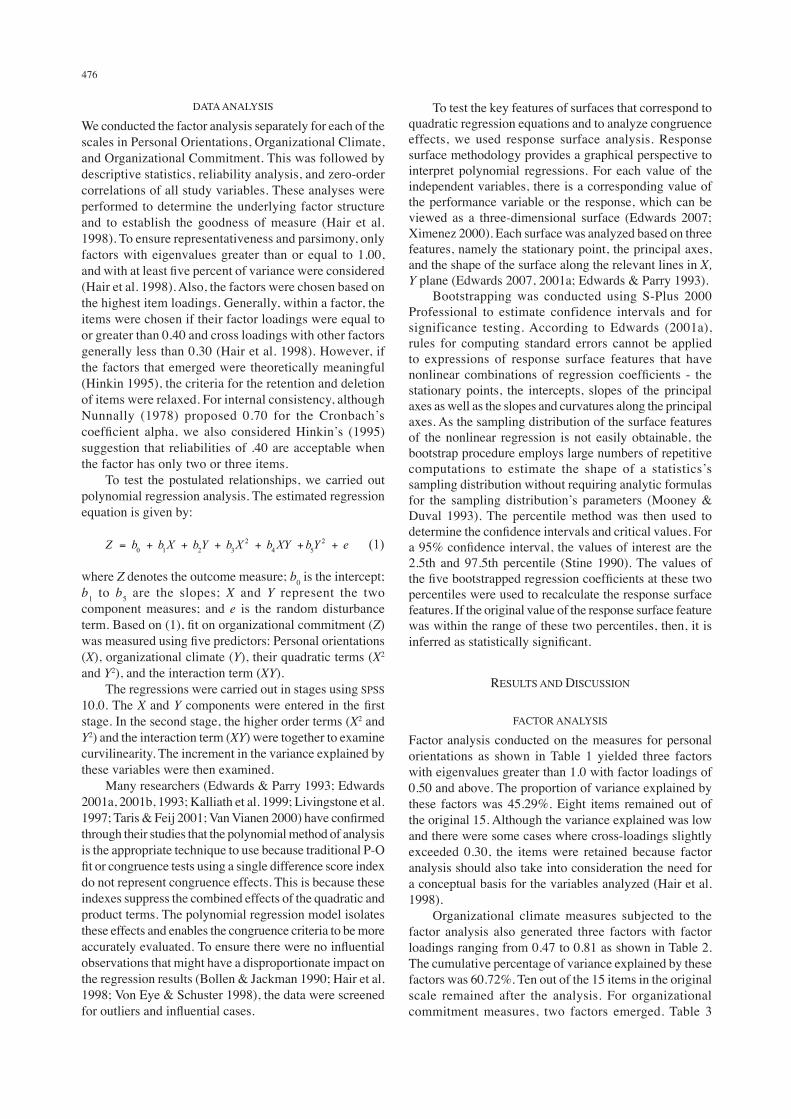
We conducted the factor analysis separately for each of the scales in Personal Orientations, Organizational Climate, and Organizational Commitment. This was followed by descriptive statistics, reliability analysis, and zero-order correlations of all study variables. These analyses were performed to determine the underlying factor structure and to establish the goodness of measure (Hair et al. 1998). To ensure representativeness and parsimony, only factors with eigenvalues greater than or equal to 1.00, and with at least five percent of variance were considered (Hair et al. 1998). Also, the factors were chosen based on the highest item loadings. Generally, within a factor, the items were chosen if their factor loadings were equal to or greater than 0.40 and cross loadings with other factors generally less than 0.30 (Hair et al. 1998). However, if the factors that emerged were theoretically meaningful (Hinkin 1995), the criteria for the retention and deletion of items were relaxed. For internal consistency, although Nunnally (1978) proposed 0.70 for the Cronbach’s coefficient alpha, we also considered Hinkin’s (1995) suggestion that reliabilities of .40 are acceptable when the factor has only two or three items. To test the postulated relationships, we carried out polynomial regression analysis. The estimated regression equation is given by:
(1)
where Z denotes the outcome measure; b0 is the intercept; b1 to b5 are the slopes; X and Y represent the two component measures; and e is the random disturbance term. Based on (1), fit on organizational commitment (Z) was measured using five predictors: Personal orientations (X), organizational climate (Y), their quadratic terms (X2 and Y2), and the interaction term (XY). The regressions were carried out in stages using SPSS 10.0. The X and Y components were entered in the first stage. In the second stage, the higher order terms (X2 and Y2) and the interaction term (XY) were together to examine curvilinearity. The increment in the variance explained by these variables were then examined. Many researchers (Edwards & Parry 1993; Edwards 2001a, 2001b, 1993; Kalliath et al. 1999; Livingstone et al. 1997; Taris & Feij 2001; Van Vianen 2000) have confirmed through their studies that the polynomial method of analysis is the appropriate technique to use because traditional P-O fit or congruence tests using a single difference score index do not represent congruence effects. This is because these indexes suppress the combined effects of the quadratic and product terms. The polynomial regression model isolates these effects and enables the congruence criteria to be more accurately evaluated. To ensure there were no influential observations that might have a disproportionate impact on the regression results (Bollen & Jackman 1990; Hair et al. 1998; Von Eye & Schuster 1998), the data were screened for outliers and influential cases.
To test the key features of surfaces that correspond to quadratic regression equations and to analyze congruence effects, we used response surface analysis. Response surface methodology provides a graphical perspective to interpret polynomial regressions. For each value of the independent variables, there is a corresponding value of the performance variable or the response, which can be viewed as a three-dimensional surface (Edwards 2007; Ximenez 2000). Each surface was analyzed based on three features, namely the stationary point, the principal axes, and the shape of the surface along the relevant lines in X, Y plane (Edwards 2007, 2001a; Edwards & Parry 1993). Bootstrapping was conducted using S-Plus 2000 Professional to estimate confidence intervals and for significance testing. According to Edwards (2001a), rules for computing standard errors cannot be applied to expressions of response surface features that have nonlinear combinations of regression coefficients - the stationary points, the intercepts, slopes of the principal axes as well as the slopes and curvatures along the principal axes. As the sampling distribution of the surface features of the nonlinear regression is not easily obtainable, the bootstrap procedure employs large numbers of repetitive computations to estimate the shape of a statistics’s sampling distribution without requiring analytic formulas for the sampling distribution’s parameters (Mooney & Duval 1993). The percentile method was then used to determine the confidence intervals and critical values. For a 95% confidence interval, the values of interest are the 2.5th and 97.5th percentile (Stine 1990). The values of the five bootstrapped regression coefficients at these two percentiles were used to recalculate the response surface features. If the original value of the response surface feature was within the range of these two percentiles, then, it is inferred as statistically significant.
RESULTS AND DISCUSSION
FACTOR ANALYSIS
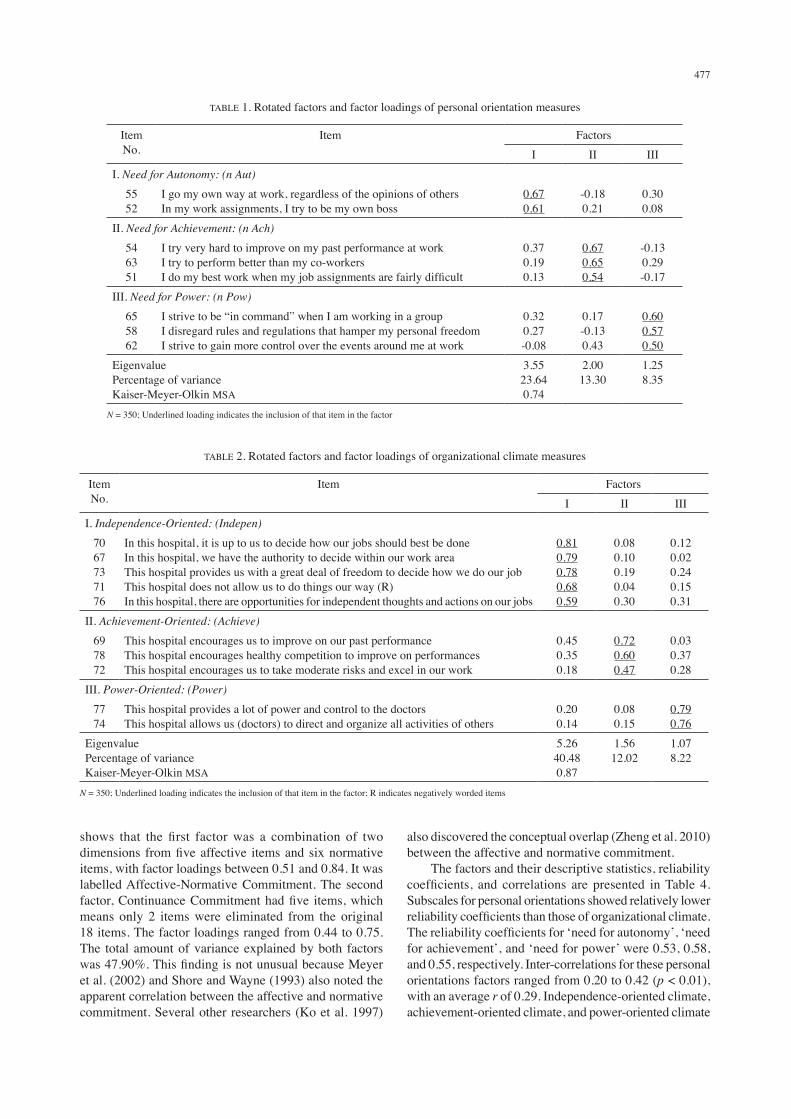
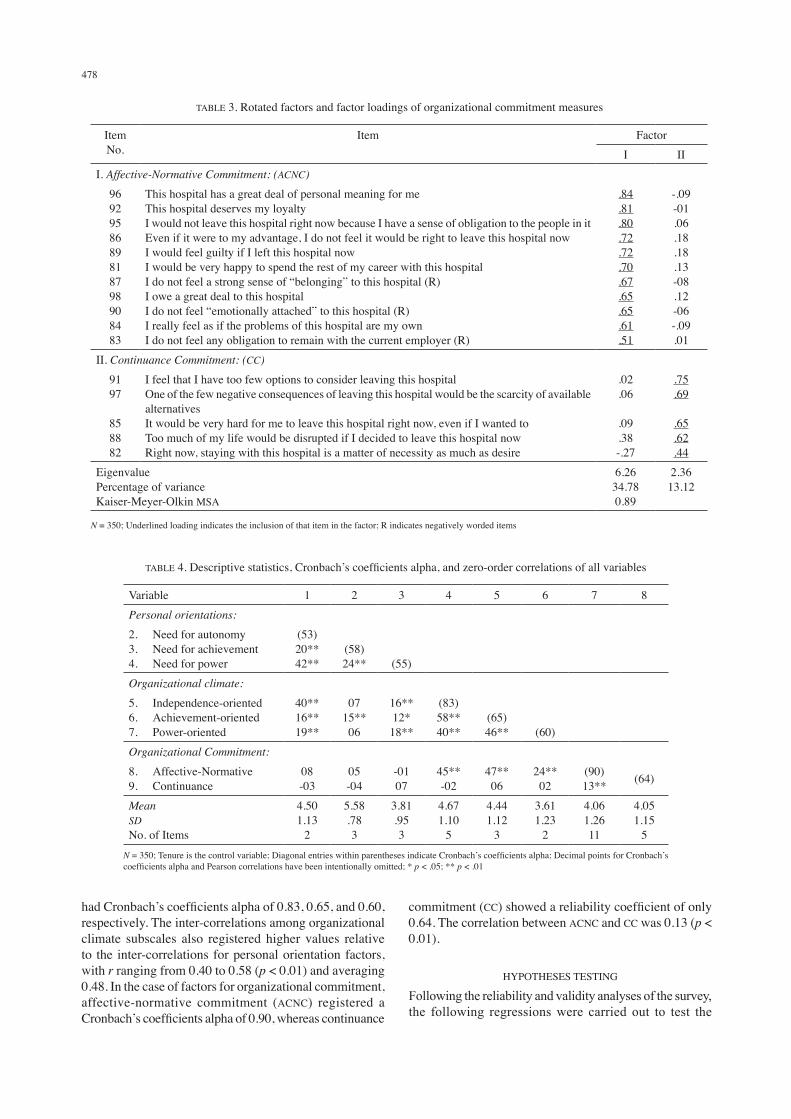
Factor analysis conducted on the measures for personal orientations as shown in Table 1 yielded three factors with eigenvalues greater than 1.0 with factor loadings of 0.50 and above. The proportion of variance explained by these factors was 45.29%. Eight items remained out of the original 15. Although the variance explained was low and there were some cases where cross-loadings slightly exceeded 0.30, the items were retained because factor analysis should also take into consideration the need for a conceptual basis for the variables analyzed (Hair et al. 1998). Organizational climate measures subjected to the factor analysis also generated three factors with factor loadings ranging from 0.47 to 0.81 as shown in Table 2. The cumulative percentage of variance explained by these factors was 60.72%. Ten out of the 15 items in the original scale remained after the analysis. For organizational commitment measures, two factors emerged. Table 3
477
TABLE 1. Rotated factors and factor loadings of personal orientation measures
Item No.
Item FactorsI II III
I. Need for Autonomy: (n Aut)
5552
I go my own way at work, regardless of the opinions of othersIn my work assignments, I try to be my own boss
0.670.61
-0.180.21
0.300.08
II. Need for Achievement: (n Ach)
546351
I try very hard to improve on my past performance at workI try to perform better than my co-workersI do my best work when my job assignments are fairly difficult
0.370.190.13
0.670.650.54
-0.130.29-0.17
III. Need for Power: (n Pow)
655862
I strive to be “in command” when I am working in a groupI disregard rules and regulations that hamper my personal freedomI strive to gain more control over the events around me at work
0.320.27-0.08
0.17-0.130.43
0.600.570.50
EigenvaluePercentage of varianceKaiser-Meyer-Olkin MSA
3.5523.640.74
2.0013.30
1.258.35
N = 350; Underlined loading indicates the inclusion of that item in the factor
TABLE 2. Rotated factors and factor loadings of organizational climate measures
Item No.
Item FactorsI II III
I. Independence-Oriented: (Indepen)
7067737176
In this hospital, it is up to us to decide how our jobs should best be doneIn this hospital, we have the authority to decide within our work areaThis hospital provides us with a great deal of freedom to decide how we do our jobThis hospital does not allow us to do things our way (R)In this hospital, there are opportunities for independent thoughts and actions on our jobs
0.810.790.780.680.59
0.080.100.190.040.30
0.120.020.240.150.31
II. Achievement-Oriented: (Achieve)
697872
This hospital encourages us to improve on our past performanceThis hospital encourages healthy competition to improve on performancesThis hospital encourages us to take moderate risks and excel in our work
0.450.350.18
0.720.600.47
0.030.370.28
III. Power-Oriented: (Power)
7774
This hospital provides a lot of power and control to the doctorsThis hospital allows us (doctors) to direct and organize all activities of others
0.200.14
0.080.15
0.790.76
EigenvaluePercentage of varianceKaiser-Meyer-Olkin MSA
5.2640.480.87
1.5612.02
1.078.22
N = 350; Underlined loading indicates the inclusion of that item in the factor; R indicates negatively worded items
shows that the first factor was a combination of two dimensions from five affective items and six normative items, with factor loadings between 0.51 and 0.84. It was labelled Affective-Normative Commitment. The second factor, Continuance Commitment had five items, which means only 2 items were eliminated from the original 18 items. The factor loadings ranged from 0.44 to 0.75. The total amount of variance explained by both factors was 47.90%. This finding is not unusual because Meyer et al. (2002) and Shore and Wayne (1993) also noted the apparent correlation between the affective and normative commitment. Several other researchers (Ko et al. 1997)
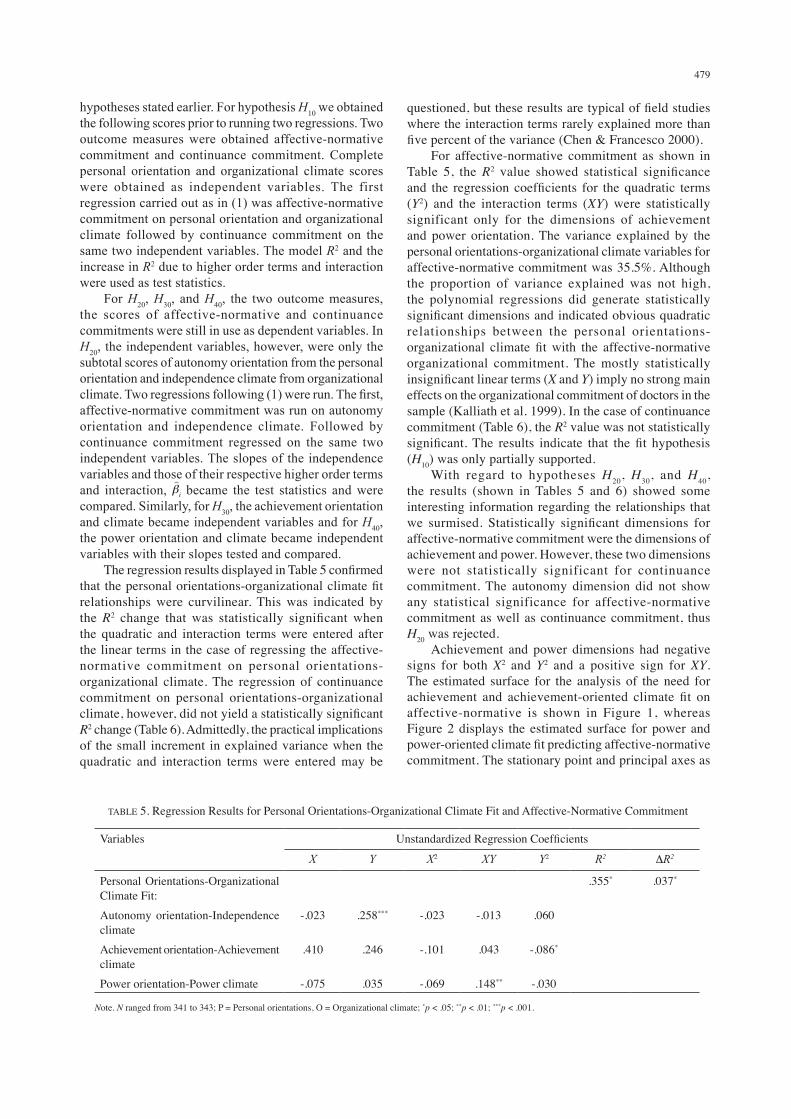
also discovered the conceptual overlap (Zheng et al. 2010) between the affective and normative commitment. The factors and their descriptive statistics, reliability coefficients, and correlations are presented in Table 4. Subscales for personal orientations showed relatively lower reliability coefficients than those of organizational climate. The reliability coefficients for ‘need for autonomy’, ‘need for achievement’, and ‘need for power’ were 0.53, 0.58, and 0.55, respectively. Inter-correlations for these personal orientations factors ranged from 0.20 to 0.42 (p < 0.01), with an average r of 0.29. Independence-oriented climate, achievement-oriented climate, and power-oriented climate
478
had Cronbach’s coefficients alpha of 0.83, 0.65, and 0.60, respectively. The inter-correlations among organizational climate subscales also registered higher values relative to the inter-correlations for personal orientation factors, with r ranging from 0.40 to 0.58 (p < 0.01) and averaging 0.48. In the case of factors for organizational commitment, affective-normative commitment (ACNC) registered a Cronbach’s coefficients alpha of 0.90, whereas continuance
commitment (CC) showed a reliability coefficient of only 0.64. The correlation between ACNC and CC was 0.13 (p < 0.01).
HYPOTHESES TESTING
Following the reliability and validity analyses of the survey, the following regressions were carried out to test the
TABLE 4. Descriptive statistics, Cronbach’s coefficients alpha, and zero-order correlations of all variables
Variable 1 2 3 4 5 6 7 8Personal orientations:
2. Need for autonomy3. Need for achievement4. Need for power
(53)20**42**
(58)24** (55)
Organizational climate:
5. Independence-oriented6. Achievement-oriented7. Power-oriented
40**16**19**
0715**06
16**12*18**
(83)58**40**
(65)46** (60)
Organizational Commitment:
8. Affective-Normative9. Continuance
08-03
05-04
-0107
45**-02
47**06
24**02
(90)13** (64)
MeanSDNo. of Items
4.501.13
2
5.58.783
3.81.953
4.671.10
5
4.441.12
3
3.611.23
2
4.061.2611
4.051.15
5N = 350; Tenure is the control variable; Diagonal entries within parentheses indicate Cronbach’s coefficients alpha; Decimal points for Cronbach’s coefficients alpha and Pearson correlations have been intentionally omitted; * p < .05; ** p < .01
TABLE 3. Rotated factors and factor loadings of organizational commitment measures
Item No.
Item FactorI II
I. Affective-Normative Commitment: (ACNC)
9692958689818798908483
This hospital has a great deal of personal meaning for meThis hospital deserves my loyaltyI would not leave this hospital right now because I have a sense of obligation to the people in itEven if it were to my advantage, I do not feel it would be right to leave this hospital nowI would feel guilty if I left this hospital nowI would be very happy to spend the rest of my career with this hospitalI do not feel a strong sense of “belonging” to this hospital (R)I owe a great deal to this hospitalI do not feel “emotionally attached” to this hospital (R)I really feel as if the problems of this hospital are my ownI do not feel any obligation to remain with the current employer (R)
.84
.81
.80
.72
.72
.70
.67
.65
.65
.61
.51
-.09-01.06.18.18.13-08.12-06-.09.01
II. Continuance Commitment: (CC)
9197
858882
I feel that I have too few options to consider leaving this hospitalOne of the few negative consequences of leaving this hospital would be the scarcity of available alternativesIt would be very hard for me to leave this hospital right now, even if I wanted toToo much of my life would be disrupted if I decided to leave this hospital nowRight now, staying with this hospital is a matter of necessity as much as desire
.02
.06
.09
.38-.27
.75
.69
.65
.62
.44EigenvaluePercentage of varianceKaiser-Meyer-Olkin MSA
6.2634.780.89
2.3613.12
N = 350; Underlined loading indicates the inclusion of that item in the factor; R indicates negatively worded items
479
hypotheses stated earlier. For hypothesis H10 we obtained the following scores prior to running two regressions. Two outcome measures were obtained affective-normative commitment and continuance commitment. Complete personal orientation and organizational climate scores were obtained as independent variables. The first regression carried out as in (1) was affective-normative commitment on personal orientation and organizational climate followed by continuance commitment on the same two independent variables. The model R2 and the increase in R2 due to higher order terms and interaction were used as test statistics. For H20, H30, and H40, the two outcome measures, the scores of affective-normative and continuance commitments were still in use as dependent variables. In H20, the independent variables, however, were only the subtotal scores of autonomy orientation from the personal orientation and independence climate from organizational climate. Two regressions following (1) were run. The first, affective-normative commitment was run on autonomy orientation and independence climate. Followed by continuance commitment regressed on the same two independent variables. The slopes of the independence variables and those of their respective higher order terms and interaction, became the test statistics and were compared. Similarly, for H30, the achievement orientation and climate became independent variables and for H40, the power orientation and climate became independent variables with their slopes tested and compared. The regression results displayed in Table 5 confirmed that the personal orientations-organizational climate fit relationships were curvilinear. This was indicated by the R2 change that was statistically significant when the quadratic and interaction terms were entered after the linear terms in the case of regressing the affective-normative commitment on personal orientations-organizational climate. The regression of continuance commitment on personal orientations-organizational climate, however, did not yield a statistically significant R2 change (Table 6). Admittedly, the practical implications of the small increment in explained variance when the quadratic and interaction terms were entered may be
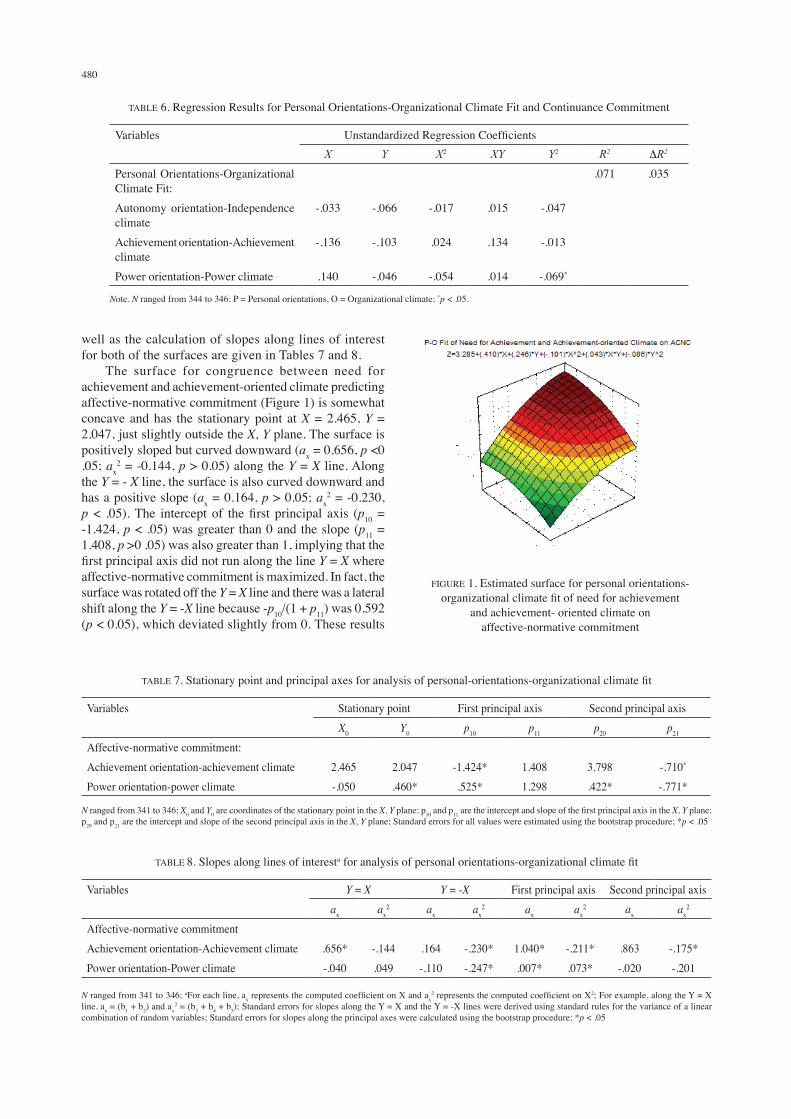
questioned, but these results are typical of field studies where the interaction terms rarely explained more than five percent of the variance (Chen & Francesco 2000). For affective-normative commitment as shown in Table 5, the R2 value showed statistical significance and the regression coefficients for the quadratic terms (Y2) and the interaction terms (XY) were statistically significant only for the dimensions of achievement and power orientation. The variance explained by the personal orientations-organizational climate variables for affective-normative commitment was 35.5%. Although the proportion of variance explained was not high, the polynomial regressions did generate statistically significant dimensions and indicated obvious quadratic relationships between the personal orientations-organizational climate fit with the affective-normative organizational commitment. The mostly statistically insignificant linear terms (X and Y) imply no strong main effects on the organizational commitment of doctors in the sample (Kalliath et al. 1999). In the case of continuance commitment (Table 6), the R2 value was not statistically significant. The results indicate that the fit hypothesis (H10) was only partially supported. With regard to hypotheses H20, H30, and H40, the results (shown in Tables 5 and 6) showed some interesting information regarding the relationships that we surmised. Statistically significant dimensions for affective-normative commitment were the dimensions of achievement and power. However, these two dimensions were not statistically significant for continuance commitment. The autonomy dimension did not show any statistical significance for affective-normative commitment as well as continuance commitment, thus H20 was rejected. Achievement and power dimensions had negative signs for both X2 and Y2 and a positive sign for XY. The estimated surface for the analysis of the need for achievement and achievement-oriented climate fit on affective-normative is shown in Figure 1, whereas Figure 2 displays the estimated surface for power and power-oriented climate fit predicting affective-normative commitment. The stationary point and principal axes as
TABLE 5. Regression Results for Personal Orientations-Organizational Climate Fit and Affective-Normative Commitment
Variables Unstandardized Regression Coefficients
X Y X2 XY Y2 R2 DR2
Personal Orientations-Organizational Climate Fit:
.355* .037*
Autonomy orientation-Independence climate
-.023 .258*** -.023 -.013 .060
Achievement orientation-Achievement climate
.410 .246 -.101 .043 -.086*
Power orientation-Power climate -.075 .035 -.069 .148** -.030
Note. N ranged from 341 to 343; P = Personal orientations, O = Organizational climate; *p < .05; **p < .01; ***p < .001.
480
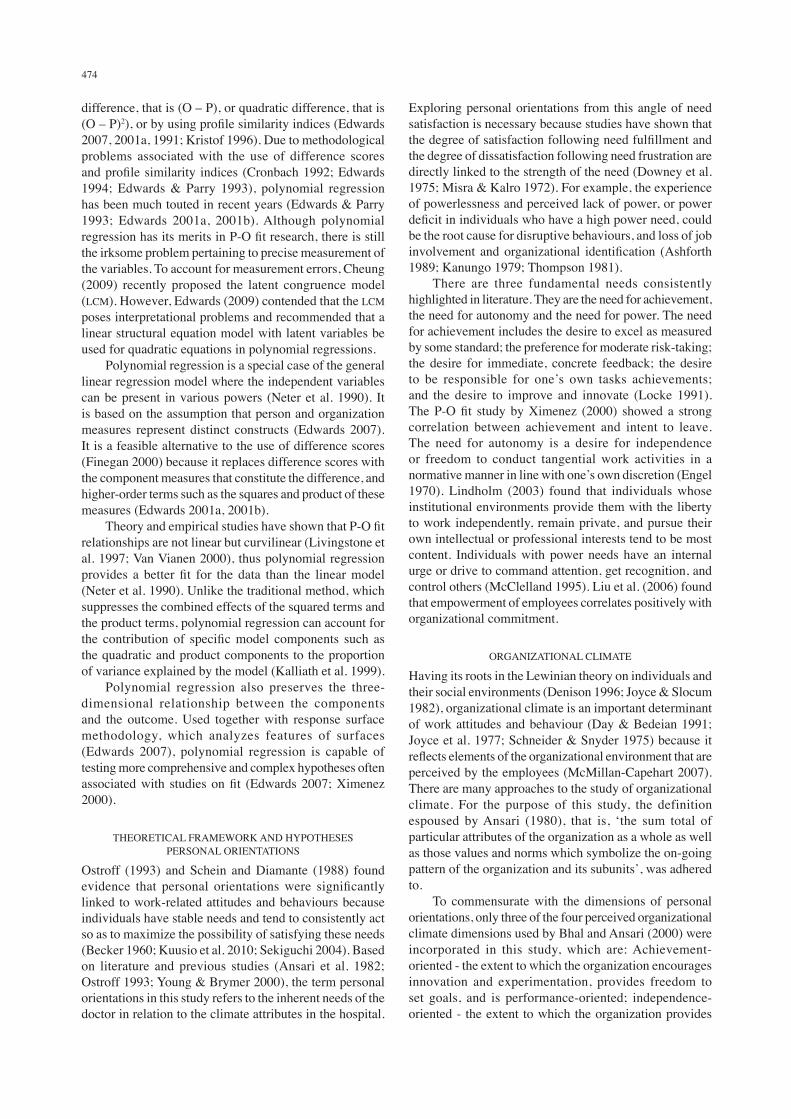
well as the calculation of slopes along lines of interest for both of the surfaces are given in Tables 7 and 8. The surface for congruence between need for achievement and achievement-oriented climate predicting affective-normative commitment (Figure 1) is somewhat concave and has the stationary point at X = 2.465, Y = 2.047, just slightly outside the X, Y plane. The surface is positively sloped but curved downward (ax = 0.656, p <0 .05; ax
2 = -0.144, p > 0.05) along the Y = X line. Along the Y = - X line, the surface is also curved downward and has a positive slope (ax = 0.164, p > 0.05; ax
2 = -0.230, p < .05). The intercept of the first principal axis (p10 = -1.424, p < .05) was greater than 0 and the slope (p11 = 1.408, p >0 .05) was also greater than 1, implying that the first principal axis did not run along the line Y = X where affective-normative commitment is maximized. In fact, the surface was rotated off the Y = X line and there was a lateral shift along the Y = -X line because -p10/(1 + p11) was 0.592 (p < 0.05), which deviated slightly from 0. These results
TABLE 7. Stationary point and principal axes for analysis of personal-orientations-organizational climate fit
Variables Stationary point First principal axis Second principal axisX0 Y0 p10 p11 p20 p21
Affective-normative commitment:Achievement orientation-achievement climate 2.465 2.047 -1.424* 1.408 3.798 -.710*
Power orientation-power climate -.050 .460* .525* 1.298 .422* -.771*
N ranged from 341 to 346; X0 and Y0 are coordinates of the stationary point in the X, Y plane; p10 and p11 are the intercept and slope of the first principal axis in the X, Y plane; p20 and p21 are the intercept and slope of the second principal axis in the X, Y plane; Standard errors for all values were estimated using the bootstrap procedure; *p < .05
TABLE 8. Slopes along lines of interesta for analysis of personal orientations-organizational climate fit
Variables Y = X Y = -X First principal axis Second principal axisax ax
2 ax ax2 ax ax
2 ax ax2
Affective-normative commitmentAchievement orientation-Achievement climate .656* -.144 .164 -.230* 1.040* -.211* .863 -.175*Power orientation-Power climate -.040 .049 -.110 -.247* .007* .073* -.020 -.201
N ranged from 341 to 346; aFor each line, ax represents the computed coefficient on X and ax2 represents the computed coefficient on X2; For example, along the Y = X
line, ax = (b1 + b2) and ax2 = (b3 + b4 + b5); Standard errors for slopes along the Y = X and the Y = -X lines were derived using standard rules for the variance of a linear
combination of random variables; Standard errors for slopes along the principal axes were calculated using the bootstrap procedure; *p < .05
FIGURE 1. Estimated surface for personal orientations-organizational climate fit of need for achievement
and achievement- oriented climate on affective-normative commitment
TABLE 6. Regression Results for Personal Orientations-Organizational Climate Fit and Continuance Commitment
Variables Unstandardized Regression CoefficientsX Y X2 XY Y2 R2 DR2
Personal Orientations-Organizational Climate Fit:
.071 .035
Autonomy orientation-Independence climate
-.033 -.066 -.017 .015 -.047
Achievement orientation-Achievement climate
-.136 -.103 .024 .134 -.013
Power orientation-Power climate .140 -.046 -.054 .014 -.069*
Note. N ranged from 344 to 346; P = Personal orientations, O = Organizational climate; *p < .05.
481
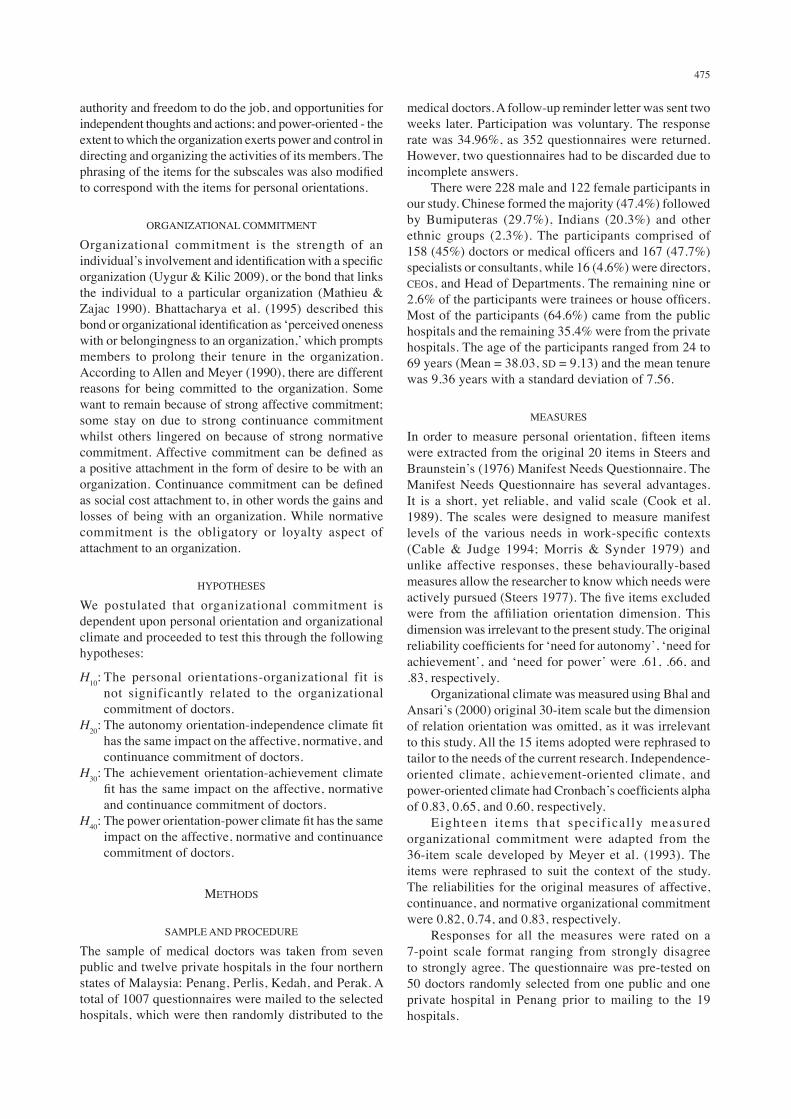
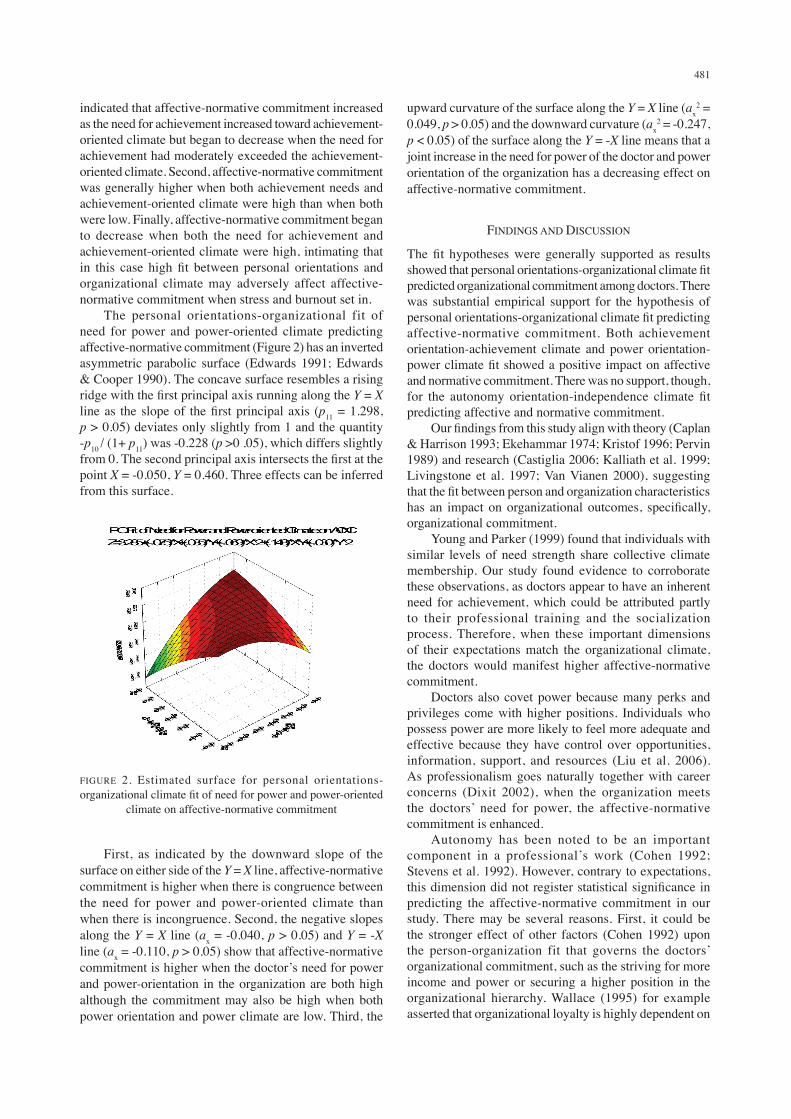
indicated that affective-normative commitment increased as the need for achievement increased toward achievement-oriented climate but began to decrease when the need for achievement had moderately exceeded the achievement-oriented climate. Second, affective-normative commitment was generally higher when both achievement needs and achievement-oriented climate were high than when both were low. Finally, affective-normative commitment began to decrease when both the need for achievement and achievement-oriented climate were high, intimating that in this case high fit between personal orientations and organizational climate may adversely affect affective-normative commitment when stress and burnout set in. The personal orientations-organizational fit of need for power and power-oriented climate predicting affective-normative commitment (Figure 2) has an inverted asymmetric parabolic surface (Edwards 1991; Edwards & Cooper 1990). The concave surface resembles a rising ridge with the first principal axis running along the Y = X line as the slope of the first principal axis (p11 = 1.298, p > 0.05) deviates only slightly from 1 and the quantity -p10 / (1+ p11) was -0.228 (p >0 .05), which differs slightly from 0. The second principal axis intersects the first at the point X = -0.050, Y = 0.460. Three effects can be inferred from this surface.
upward curvature of the surface along the Y = X line (ax2 =
0.049, p > 0.05) and the downward curvature (ax2 = -0.247,
p < 0.05) of the surface along the Y = -X line means that a joint increase in the need for power of the doctor and power orientation of the organization has a decreasing effect on affective-normative commitment.
FINDINGS AND DISCUSSION
The fit hypotheses were generally supported as results showed that personal orientations-organizational climate fit predicted organizational commitment among doctors. There was substantial empirical support for the hypothesis of personal orientations-organizational climate fit predicting affective-normative commitment. Both achievement orientation-achievement climate and power orientation-power climate fit showed a positive impact on affective and normative commitment. There was no support, though, for the autonomy orientation-independence climate fit predicting affective and normative commitment. Our findings from this study align with theory (Caplan & Harrison 1993; Ekehammar 1974; Kristof 1996; Pervin 1989) and research (Castiglia 2006; Kalliath et al. 1999; Livingstone et al. 1997; Van Vianen 2000), suggesting that the fit between person and organization characteristics has an impact on organizational outcomes, specifically, organizational commitment. Young and Parker (1999) found that individuals with similar levels of need strength share collective climate membership. Our study found evidence to corroborate these observations, as doctors appear to have an inherent need for achievement, which could be attributed partly to their professional training and the socialization process. Therefore, when these important dimensions of their expectations match the organizational climate, the doctors would manifest higher affective-normative commitment. Doctors also covet power because many perks and privileges come with higher positions. Individuals who possess power are more likely to feel more adequate and effective because they have control over opportunities, information, support, and resources (Liu et al. 2006). As professionalism goes naturally together with career concerns (Dixit 2002), when the organization meets the doctors’ need for power, the affective-normative commitment is enhanced. Autonomy has been noted to be an important component in a professional’s work (Cohen 1992; Stevens et al. 1992). However, contrary to expectations, this dimension did not register statistical significance in predicting the affective-normative commitment in our study. There may be several reasons. First, it could be the stronger effect of other factors (Cohen 1992) upon the person-organization fit that governs the doctors’ organizational commitment, such as the striving for more income and power or securing a higher position in the organizational hierarchy. Wallace (1995) for example asserted that organizational loyalty is highly dependent on
First, as indicated by the downward slope of the surface on either side of the Y = X line, affective-normative commitment is higher when there is congruence between the need for power and power-oriented climate than when there is incongruence. Second, the negative slopes along the Y = X line (ax = -0.040, p > 0.05) and Y = -X line (ax = -0.110, p > 0.05) show that affective-normative commitment is higher when the doctor’s need for power and power-orientation in the organization are both high although the commitment may also be high when both power orientation and power climate are low. Third, the
FIGURE 2. Estimated surface for personal orientations-organizational climate fit of need for power and power-oriented
climate on affective-normative commitment
482
the professionals’ opportunities for career advancement and rewards such as pay. Sheldon, Elliot and Kim (2001) also noted the insignificant impact of the autonomy dimension in their study. They rationalized that although autonomy is one of the universal psychological needs, it may be more salient for obtaining enhancement rather than for avoiding deficiencies. Hence, autonomy does not influence strongly the affect associated with unsatisfying events. Second, it could be due to the personal dispositions of the doctors that reflect the cultural socialization (Meyer et al. 2002) peculiar to Malaysia. As Malaysia displays high power distance (Hofstede 1980), employees tend to acknowledge their superior’s authority and typically follow the chain of command. Also, the lack of a culture of individualism would mean the relationship of the individual with the organization is not one of independence, but of mutual dependence. This was verified by Parkes et al. (2001) study of person-organization fit across cultures. They found Asian organizations to be more collectivistic than western organizations, and hospitals were more collectivistic than management consultancies. Third, it is plausible that the criticality of autonomy has diminished somewhat as a result of increased managerial control by the cohort of clinicians endowed with management roles (Fitzgerald & Ferlie 2000). These professional managers actively manage their colleagues’ performance. Therefore, the non-significance of the autonomy dimension demonstrates the importance of contextual analysis in the study of personal orientations-organizational climate fit and organizational commitment. One setback in this study is the lack of statistically significant quadratic and interaction terms in predicting affective-normative and continuance organizational commitment. A plausible reason could be the research was not conducted in hypothetical organizations but in existing hospitals. Consonant with the findings of Taris and Feij (2001), who employed the polynomial regression approach in their congruence research, this lack of significant relationships is typical of data procured from actual work settings. Also, the small increment in the variance explained might appear to undermine the principle of parsimony, as the polynomial regression model uses more terms and involves complex computations and analyses. However, the seemingly minuscule incremental contribution of the quadratic and product terms still contributed significantly to the explained variance (Kalliath et al. 1999). A closer look at the results of this study showed that more statistically significant dimensions of the personal orientations-organizational climate fit emerged that enabled evaluation of the congruence effect on organizational commitment.
CONCLUSION
Employing the unconventional approach of polynomial regression analysis and response surface methodology, our study has provided some empirical support to verify the notion that personal orientations-organizational climate
fit does indeed play a role in predicting organizational commitment. The exact shape of the relationships between the personal orientations-organizational climate fit and the distinct dimensions of organizational commitment were also clearly depicted in the response surfaces that were generated. Our findings on the impact of personal orientations-organizational climate congruence on organizational commitment of the medical doctors have important practical implications. If hospital organizations desire high levels of commitment among their staff, effective human resource management and practices that take into account the fit between personal orientations and the organizational climate, have to be implemented. Measures to address the problem of organizational misfits should be accorded primacy, lest the good doctors who do not fit in may leave in a fit!
REFERENCES
Adkins, C.L., Russell, C.J. & Werbel, J.D. 1994. Judgments of fit in the selection process: The role of work value congruence. Personnel Psychology 47: 605-623.
Allen, N.J. & Meyer, J.P. 1990. The measurement and antecedents of affective, continuance, and normative commitment to the organization. Journal of Occupational Psychology 63: 1-18.
Alniacik, E., Alniacik, U., Erat, S. & Akcin, K. 2013. Does person-organization fit moderate the effects of affective commitment and job satisfaction on turnover intentions? Procedia - Social and Behavioral Sciences 99: 274-281.
Ansari, M.A. 1980. Organizational climate: Homogeneity within and heterogeneity between organizations. Journal of Social and Economic Studies 8: 89-96.
Ansari, M.A., Baumgartel, H. & Sullivan, G. 1982. The personal orientation-organizational climate fit and managerial success. Human Relations 35: 1159-1178.
Ashforth, B.E. 1989. The experience of powerlessness in organizations. Organizational Behavior and Human Decision Processes 43: 207-242.
Becker, H.S. 1960. Notes on the concept of commitment. The American Journal of Sociology 66: 32-40.
Bhal, K.T. & Ansari, M.A. 2000. Managing Dyadic Interactions in Organizational Leadership. New Delhi: Sage.
Bhattacharya, C.B., Rao, H. & Glynn, M.A. 1995. Understanding the bond of identification: An investigation of its correlates among art museum members. Journal of Marketing 59: 46-57.
Billsberry, J. 2008. Broad sketches on misfit as an organizational psychopathology. 2nd Global e-Conference on Fit, 19th-21st November, 2008.
Bollen, K.A. & Jackman, R.W. 1990. Regression diagnostics: An expository treatment of outliers and influential cases. In Modern Methods of Data Analysis, edited by Fox, J. & Long, J.S. Newbury Park, CA: Sage. pp. 257-291.
Cable, D.M. & Judge, T.A. 1994. Pay preferences and job search decisions: A person-organization fit perspective. Personnel Psychology 47: 317-348.
Caplan, R.D. & Harrison, R.V. 1993. Person-environment fit theory: Some history, recent developments and future directions. Journal of Social Issues 49: 253-275.
Castiglia, B. 2006. The impact of changing culture in higher education on the person-organization fit, job satisfaction, and organizational commitment of college faculty. Academy of Educational Leadership Journal 10(2): 23-43.
483
Chen, X.Z. & Francesco, A.M. 2000. Employee demography, organizational commitment, and turnover intentions in China: Do cultural differences matter? Human Relations 53: 869-887.
Cheung, G.W. 2009. Introducing the latent congruence model for improving the assessment of similarity, agreement and fit in organizational research. Organizational Research Methods 12(1): 6-33.
Cohen, A. 1992. Antecedents of organizational commitment across occupational groups: A meta-analysis. Journal of Organizational Behavior 13: 539-558.
Cook, J.D., Hepworth, S.J., Wall, T.D. & Warr, P.B. 1989. The Experience of Work: A Conpendium and Review of 249 Measures and Their Use. London: Academic Press.
Cronbach, L.J. 1992. Four psychological bulletin articles in perspective. Psychological Bulletin 112: 389-392.
Day, D.V. & Bedeian, A.G. 1991. Predicting job performance across organizations: The interaction of work orientation and psychological climate. Journal of Management 17: 589-600.
Denison, D.R. 1996. What is the difference between organizational culture and organizational climate? A native’s point of view on a decade of paradigm wars. Academy of Management Review 21: 619-654.
Dixit, A. 2002. Incentives and organizations in the public sector. Journal of Human Resources 37: 697-727.
Downey, H.K., Hellriegel, D. & Slocum Jr., J.W. 1975. Congruence between individual needs, organizational climate, job satisfaction and performance. Academy of Management Journal 18: 149-155.
Edwards, J.R. 2009. Latent variable modelling in congruence research: Current problems and future directions. Organizational Research Methods 12(1): 34-62.
Edwards, J.R. 2007. Polynomial regression and response surface methodology. In Perspectives on Organizational Fit, edited by Ostroff, C. & Judge, T.A. San Francisco: Jossey-Bass. pp. 361-372.
Edwards, J.R. 2001a. Alternatives to difference scores: Polynomial regression analysis and response surface methodology. In Advances in Measurement and Data Analysis edited by Drasgow, F. & Schmitt, N.W. San Francisco: Jossey-Bass. pp. 350-400.
Edwards, J.R. 2001b. Ten difference score myths. Organizational Research Methods 4: 265-287.
Edwards, J.R. 1994. Regression analysis as an alternative to different scores. Journal of Management 20: 683-689.
Edwards, J.R. 1993. Problems with the use of profile similarity indices in the study of congruence in organizational research. Personnel Psychology 46: 641-665.
Edwards, J.R. 1991. Person-job fit: A conceptual integration, literature review and methodological critique. In International Review of Industrial/Organizational Psychology 6, edited by Cooper, C.L. & Robertson, I.T. London: Wiley. pp. 283-357.
Edwards, J.R. & Parry, M.E. 1993. On the use of polynomial regression equations as an alternative to difference scores in organizational research. Academy of Management Journal 36: 1577-1613.
Edwards, J.R. & Cooper, C.L. 1990. The person-environment fit approach to stress: Recurring problems and some suggested solutions. Journal of Organizational Behavior 11: 293-307.
Ekehammar, B. 1974. Interactionism in personality from a historical perspective. Psychological Bulletin 81: 1026-1048.
Engel, G.V. 1970. Professional autonomy and bureaucratic organization. Administrative Science Quarterly 15: 12-21.
Finegan, J.E. 2000. The impact of person and organizational values on organizational commitment. Journal of Occupational and Organizational Psychology 73: 149-169.
Fitzgerald, L. & Ferlie, E. 2000. Professionals: Back to the future? Human Relations 53: 713-739.
Hair Jr., J.F., Anderson, R.E., Tatham, R.L. & Black, W.C. 1998. Multivariate Data Analysis. Upper Saddle River, NJ: Prentice Hall.
Hinkin, T.R. 1995. A review of scale development practices in the study of organizations. Journal of Management 21: 967-988.
Hofstede, G. 1980. Culture’s Consequences: International Differences in Work-Related Values. Beverly Hills, CA: Sage.
Joyce, W.F. & Slocum, J. 1982. Climate discrepancy: Refining the concepts of psychological and organizational climate. Human Relations 35: 951-972.
Joyce, W.F., Slocum Jr., J.W. & Abelson, M. 1977. A causal analysis of psychological climate and leader behaviour relationships. Journal of Business Research 5: 261-273.
Judge, T.A. & Cable, D.M. 1997. Applicant personality, organizational culture and organization attraction. Personnel Psychology 50: 359-394.
Kalliath, T.J., Bluedorn, A.C. & Strube, M.J. 1999. A test of value congruence effects. Journal of Organizational Behaviour 20: 1175-1198.
Kamarul, Z.A. 2010. Person-environment fit: A critical review of the previous studies and a proposal for future research. International Journal of Psychological Studies 2(1): 71-78.
Kanungo, R.N. 1979. The concepts of alienation and involvement revisited. Psychological Bulletin 86: 119-138.
Kimura, T. 2011. Empowerment, P-O fit and work engagement - A mediated moderation model. European Journal of Economics, Finance and Administrative Science 38: 44-58.
Ko, J.W., Price, J.L. & Mueller, C.W. 1997. Assessment of Meyer and Allen’s three component model of organizational commitment in South Korea. Journal of Applied Psychology 82: 961-973.
Kristof, A.L. 1996. Person-organization fit: An integrative review of its conceptualizations, measurement and implications. Personnel Psychology 49: 1-49.
Kristof-Brown, A. 2007. Application of PE fit: A white paper for discussion. Paper presented at the 1st Global e-Conference on Fit. 19-21 November. www.fitconference.com.
Kuusio, H., Heponiemi, T., Sinervo, T. & Elovainio, M. 2010. Organizational commitment among general practitioners: A cross-sectional study of the role of psychosocial factors. Scandinavian Journal of Primary Health Care 28: 108-114.
Lindholm, J. 2003. Perceived organizational fit: Nurturing the minds, hearts, and personal ambitions of university faculty. Review of Higher Education 27: 125-139.
Liu, A.M.M., Fellows, R. & Chiu, W.M. 2006. Work empowerment as an antecedent to organizational commitment in the Hong Kong quantity surveying profession. Surveying and Built Environment 17(2): 63-72.
Livingstone, L.P., Nelson, D.L. & Barr, S.H. 1997. Person-environment fit and creativity: An examination of supply-value and demand-ability versions of fit. Journal of Management 23: 119-146.
Locke, E.A. 1991. The motivation sequence, the motivation hub, and the motivation core. Organizational Behavior and Human Decision Processes 50: 288-299.
Mathieu, J.E. & Zajac, D.M. 1990. A review and meta-analysis of the antecedents, correlates, and consequences of organizational commitment. Psychological Bulletin 108: 171-194.
484
McClelland, D.C. 1995. That urge to achieve. In The Organizational Behavior Reader, edited by Kolb, D.A., Osland, J.S. & Rubin, I.M. Englewood Cliffs, NJ: Prentice Hall. pp. 136-142.
McMillan-Capehart, A. 2007. Reconciling employee dissimilarity and P-O fit. Journal of Diversity Management 2(4): 33-42.
Meglino, B.M., Ravlin, E.C. & Adkins, C.L. 1989. A work values approach to corporate culture: A field test of the value congruence process and its relationship to individual outcomes. Journal of Applied Psychology 74: 424-432.
Meyer, J.P., Stanley, D.J., Herscovitch, L. & Topolnytsky, L. 2002. Affective, continuance, and normative commitment to the organization: A meta-analysis of antecedents, correlates, and consequences. Journal of Vocational Behaviour 61: 20-52.
Meyer, J.P., Irving, P.G. & Allen, N.J. 1998. Examination of the combined effects of work values and early work experiences on organizational commitment. Journal of Organizational Behavior 19: 29-52.
Meyer, J.P., Allen, N.J. & Smith, C.A. 1993. Commitment to organizations and occupations: Extension and test of a three-component conceptualization. Journal of Applied Psychology 78: 538-551.
Misra, S. & Kalro, A. 1972. Simulated organizational choice: Post-decision dissonance reduction and self-perception. Journal of Applied Psychology 56: 461-466.
Mooney, C.Z. & Duval, R.D. 1993. Bootstrapping: A nonparametric approach to statistical inference. Monograph of Sage University Paper Series on Quantitative Applications in the Social Sciences, 07 (Serial No. 095). Newbury Park, CA: Sage.
Morris, J.H. & Synder, R.A. 1979. A second look at need for achievement and need for autonomy as moderators of role perception-outcome relationships. Journal of Applied Psychology 64: 173-178.
Neter, J., Wasserman, W. & Kutner, M.H. 1990. Applied Linear Statistical Models: Regression, Analysis of Variance and Experimental Designs. Homewood, IL: Irwin.
Nunnally, J.C. 1978. Psychometric Theory. New York: McGraw Hill.
O’Reilly III, C.A., Chatman, J. & Caldwell, D.F. 1991. People and organizational culture: A profile comparison approach to assessing person-organization fit. Academy of Management Journal 34: 487-516.
Ostroff, C. 1993. The effects of climate and personal influences on individual behavior and attitudes in organizations. Organizational Behavior and Human Decision Processes 56: 56-90.
Parkes, L.P., Bochner, S. & Schneider, S.K. 2001. Person-organization fit across cultures: An empirical investigation of individualism and collectivism. Applied Psychology: An International Review 50: 81-108.
Pervin, L.A. 1989. Persons, situations, interactions: The history of a controversy and a discussion of theoretical models. Academy of Management Review 14: 350-360.
Schein, V.E. & Diamante, T. 1988. Organizational attraction and the person-environment fit. Psychological Reports 62: 167-173.
Schneider, B. & Snyder, R.A. 1975. Some relationships between job satisfaction and organizational climate. Journal of Applied Psychology 60: 318-328.
Schneider, B., Kristof-Brown, A.L., Goldstein, H.W. & Smith, D.B. 1997. What is this thing called fit? In Handbook of
Selection and Appraisal, edited by Anderson, N.R. & Herriot, P. London: John Wiley. pp. 393-412.
Schneider, B., Goldstein, H.W. & Smith, D.B. 1995. The ASA framework: An update. Personnel Psychology 48: 747-773.
Sekiguchi, T. 2004. Person-organization fit and person-job fit in employee selection: A review of the literature. Osaka Keidai Ronshu 54(6): 179-196.
Sheldon, K.M., Elliot, A.J. & Kim, Y.M. 2001. What is satisfying about satisfying events? Testing 10 candidate psychological needs. Journal of Personality and Social Psychology 80: 325-339.
Shore, L.M. & Wayne, S.J. 1993. Commitment and employee behavior: Comparison of affective commitment and continuance commitment with perceived organizational support. Journal of Applied Psychology 78: 774-780.
Steers, R.M. 1977. Antecedents and outcomes of organizational commitment. Administrative Science Quarterly 22: 46-56.
Steers, R.M. & Braunstein, D.N. 1976. A behaviorally-based measure of manifest needs in work settings. In The Experience of Work: A Conpendium and Review of 249 Measures and Their Use, edited by Cook, J.D., Hepworth, S.J., Wall, T.D. & Warr, P.B. London: Academic Press. pp. 159-160.
Stevens, F., Philipsen, H. & Diederiks, J. 1992. Organizational and professional predictors of physician satisfaction. Organizational Studies 13: 34-49.
Stine, R. 1990. An introduction to bootstrap methods: Examples and ideas. In Modern Methods of Data Analysis, edited by Fox, J. & Long, J.S. Newbury Park, CA: Sage. pp. 257-291.
Taris, R. & Feij, J.A. 2001. Longitudinal examination of the relationship between supplies-values fit and work outcomes. Applied Psychology: An International Review 50: 52-80.
Thompson, S.C. 1981. Will it hurt less if I can control it? A complex answer to a simple question. Psychological Bulletin 90: 89-101.
Uygur, A. & Kilic, G. 2009. A study into organizational commitment and job involvement: An application towards the personnel in the central organization for Ministry of Health in Turkey. Ozean Journal of Applied Sciences 2(1): 113-125.
Vancouver, J.B. & Schmitt, N.W. 1991. An exploratory examination of person-organization fit: Organizational goal congruence. Personnel Psychology 44: 333-352.
Van Vianen, A.E.M. 2000. Person-organization fit: The match between newcomers’ and recruiters’ preferences for organizational cultures. Personnel Psychology 53: 113-149.
Von Eye, A. & Schuster, C. 1998. Regression Analysis for Social Sciences. San Diego: Academic Press.
Wallace, J.E. 1995. Organizational and professional commitment in professional and nonprofessional organizations. Administrative Science Quarterly 40(2): 228-255.
Ximenex, M.C. 2000. Application of response surface methodology to the study of person-organization fit. Psicothema 12(1): 151-158.
Young, A.M. & Brymer, R.A. 2000. The role of individual differences in the referent selection process. Journal of Behavioral and Applied Management 1: 83-91.
Young, S.A. & Parker, C.P. 1999. Predicting collective climates: Assessing the role of shared work values, needs, employee interaction and work group membership. Journal of Organizational Behavior 20: 1199-1218.
Zheng, W.B., Kaur, S. & Zheng, W.J. 2010. New development of organizational commitment: A critical review (1960-2009). African Journal of Business Management 4(1): 12-20.

485
Allison Lee Gim Wah Research and Innovation DepartmentTeachers’ Training InstituteSultan Abdul Halim Campus08000 Sungai Petani, Kedah Darul AmanMalaysia
Nora Muda*School of Mathematical SciencesFaculty of Science and Technology43600 UKM Bangi, Selangor Darul Ehsan Malaysia
Abdul Rahman OthmanSchool of Distance EducationUniversiti Sains Malaysia11800 USM, PenangMalaysia
*Corresponding author; email: [email protected]
Received: 4 April 2018Accepted: 2 November 2018