Embed Size (px)
Citation preview
Texas Turnaround CenterTeam Lead Meeting
February 8‐9, 2016
Introductions & Celebrations
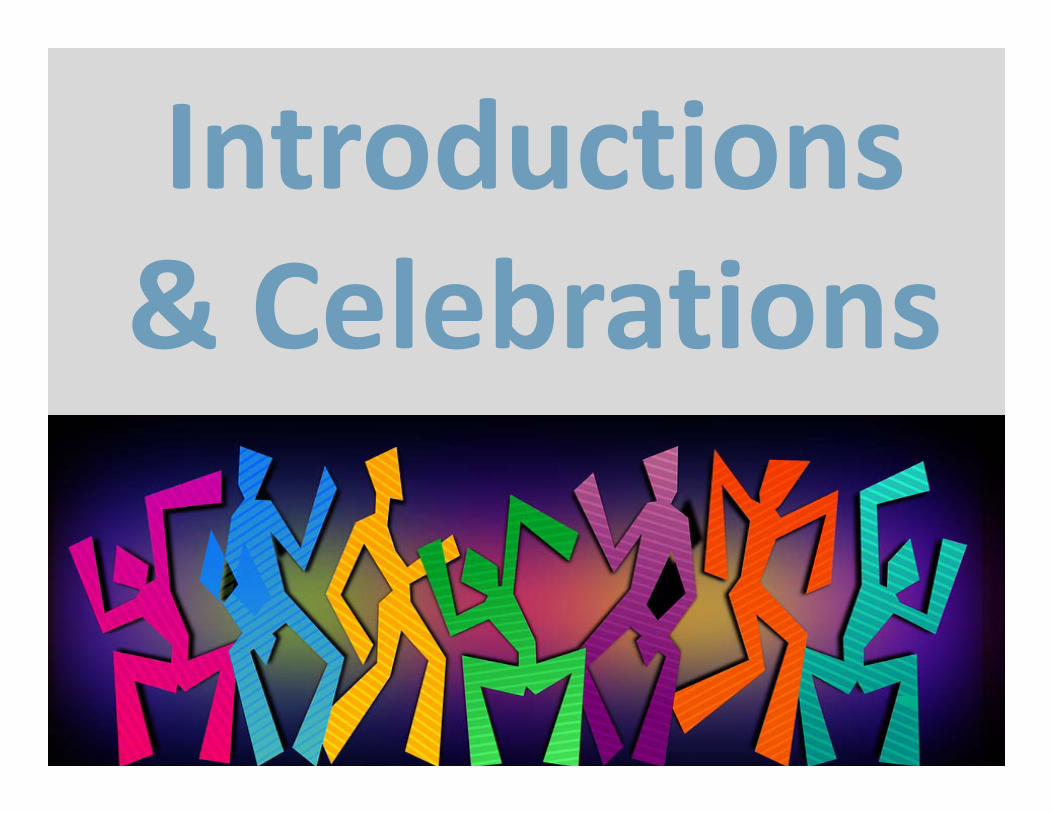
ESCs: Providing Support for the Main Thing
• Organizational Structure
• Processes/ Procedures
• Communications
• Capacity and Resources
Website Reviewhttp://www.tcdss.net/
• Organizational Structure
• Processes/ Procedures
• Communications
• Capacity and Resources

• Use “Search” feature for quick access to resources• Designed with the district/campus client in mind• Support & Guidance and Training categorized by client and partners
• Let’s walk through together:http://www.tcdss.net/
ESC Resource Center• Organizational Structure
• Processes/ Procedures
• Communications
• Capacity and Resources

Accountability Update
Welcome Ty Duncan

Accountability Update
TTC Meeting February 2016
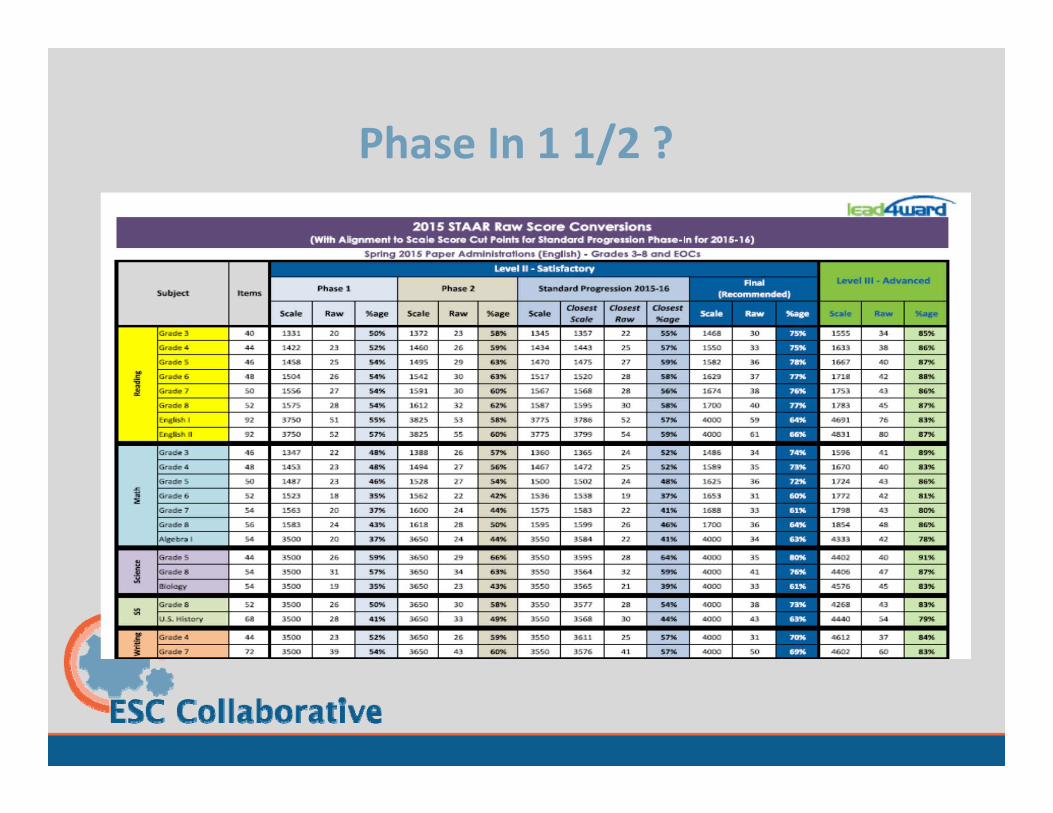
Phase In 1 1/2 ?
Issues That Will Impact Indices in 2016
• Inclusion of STAAR‐A and STAAR Alt into the system and which indices is it used?
• Full impact of STAAR Math 3‐8 on the system

2015 State Accountability 2016 State Accountability (Proposed) Very DRAFT!!Rating Each Index stands alone: Met Index 1 OR 2 AND Met Index 3 AND Met Index 4 Each Index stands alone: Met Index 1 OR 2 AND Met Index 3 AND Met Index 4
Index 1 Student
Achievement
All subjects, All students: Phase‐in 1 Level IIGrades Math 3‐8, all STAAR A and all STAAR ALternate 2 excluded
Algebra I, Biology, English I, English II and U.S. History taken July 2014, Fall 2014, Spring 2015Substitute Assessments Included
All subjects, All students: Phase‐in 1 Level IIGrades Math 3‐8, all STAAR A and all STAAR ALternate INCLDUDED????
Algebra I, Biology, English I, English II and U.S. History taken July 2014, Fall 2014, Spring 2015Substitute Assessments Included
Index 2 Student Progress
Reading, Math and WritingGrades Math 3‐8, all STAAR A and all STAAR ALternate 2 excluded
[10 groups: all students, seven race/ethnicity groups, special education & English Language Learners(ELL)] ELL subgroup will include both current and monitored students
One point for each percentage that Met growth expectation and One additional point for each percentage that Exceed growth expectation
STAAR Progress Measures and ELL Progress Measures included
Reading, Math and WritingGrades Math 3‐8, INCLUDED???????
[10 groups: all students, seven race/ethnicity groups, special education & English Language Learners(ELL)] ELL subgroup will include both current and monitored students
One point for each percentage that Met growth expectation and One additional point for each percentage that Exceed growth expectation
STAAR Progress Measures and ELL Progress Measures included
Index 3 Closing
Performance Gaps
All Subjects Grades Math 3‐8, all STAAR A and all STAAR ALternate 2 excluded
Economically Disadvantaged group and lowest two race/ethnicity groups based on % met standard 2014 Index 1 All subjects
(Ethnicity minimum size: 25 Reading tests and 25 Math tests in 2014)Algebra I, Biology, English I, English II and U.S. History: July 2014, Fall 2014, Spring 2015
One point for each percentage of students that meet Phase‐in 1 Level II One additional point for each percentage of students that meet Level III
All Subjects Grades Math 3‐8, all STAAR A and all STAAR Alt 2 INCLUDED
Economically Disadvantaged group and lowest two race/ethnicity groups based on % met standard 2014 Index 1 All subjects
(Ethnicity minimum size: 25 Reading tests and 25 Math tests in 2014)Algebra I, Biology, English I, English II and U.S. History: July 2014, Fall 2014, Spring 2015
One point for each percentage of students that meet Phase‐in 1 Level II One additional point for each percentage of students that meet Level III
Index 4 Post Secondary Readiness
STAAR: One point for each percentage of students that meet Final Level II on two or more tests
[8 groups] Grades Math 3‐8, all STAAR A and all STAAR ALternate 2 excludedSubstitute Assessments Included/Only first time EOC testers in 2014‐15 cycle Included
Graduation Rate: 4‐yr(Class '14) or 5‐yr(Class '13) [10 groups][AEA can also use 6‐year (Class '12)]
Diploma Plans: RHSP/DAP Longitudinal Rates [8 groups: All students & seven race/ethnic groups]
Postsecondary Readiness: TSI on both ELA and Math, Advanced/Dual Credit or CTE Coherent sequence [8 groups]
STAAR: One point for each percentage of students that meet Final Level II on two or more tests[8 groups] Grades Math 3‐8, all STAAR A INCLUDED and no STAAR Alt
Substitute Assessments Included/Only first time EOC testers in 2014‐15 cycle IncludedGraduation Rate: 4‐yr(Class '14) or 5‐yr(Class '13) [10 groups][AEA can also use 6‐year (Class '12)]Diploma Plans: RHSP/DAP Longitudinal Rates [8 groups: All students & seven race/ethnic groups]Postsecondary Readiness: TSI on both ELA and Math, Advanced/Dual Credit or CTE Coherent
sequence [8 groups]
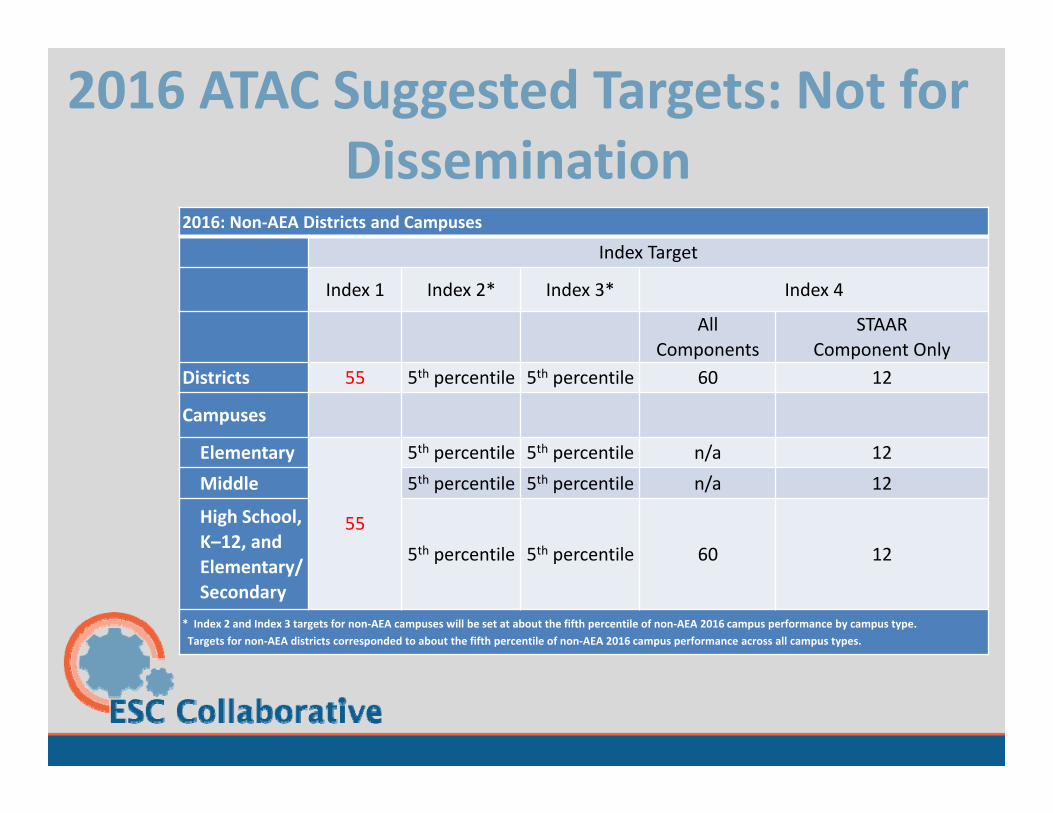
2016 ATAC Suggested Targets: Not for Dissemination
2016: Non‐AEA Districts and Campuses
Index Target
Index 1 Index 2* Index 3* Index 4
AllComponents
STAARComponent Only
Districts 55 5th percentile 5th percentile 60 12
Campuses
Elementary
55
5th percentile 5th percentile n/a 12Middle 5th percentile 5th percentile n/a 12
High School, K–12, and Elementary/Secondary
5th percentile 5th percentile 60 12
* Index 2 and Index 3 targets for non‐AEA campuses will be set at about the fifth percentile of non‐AEA 2016 campus performance by campus type. Targets for non‐AEA districts corresponded to about the fifth percentile of non‐AEA 2016 campus performance across all campus types.
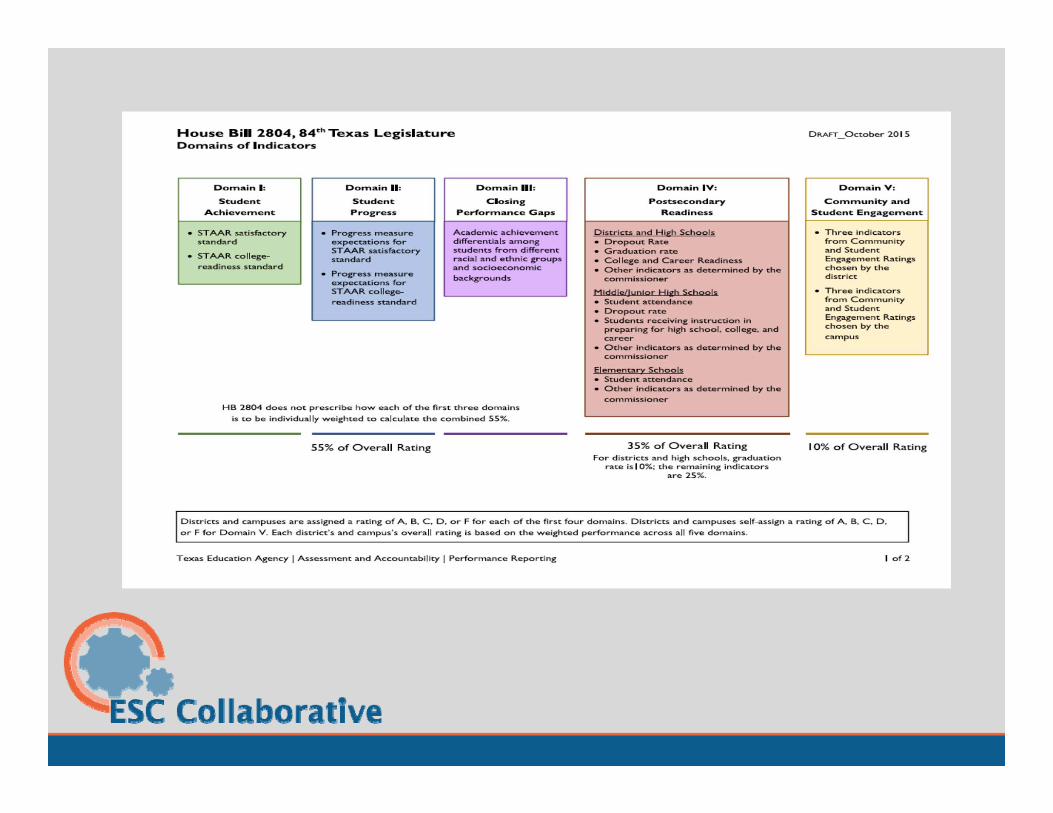
Which domains count more?
What exactly is this?
Can hard code this an “A” is my guess!
“other measures” must be quantifiable which leaves TSI, SAT, or ACT all of which are not funded
Also Dual Credit hours per student is a possibility
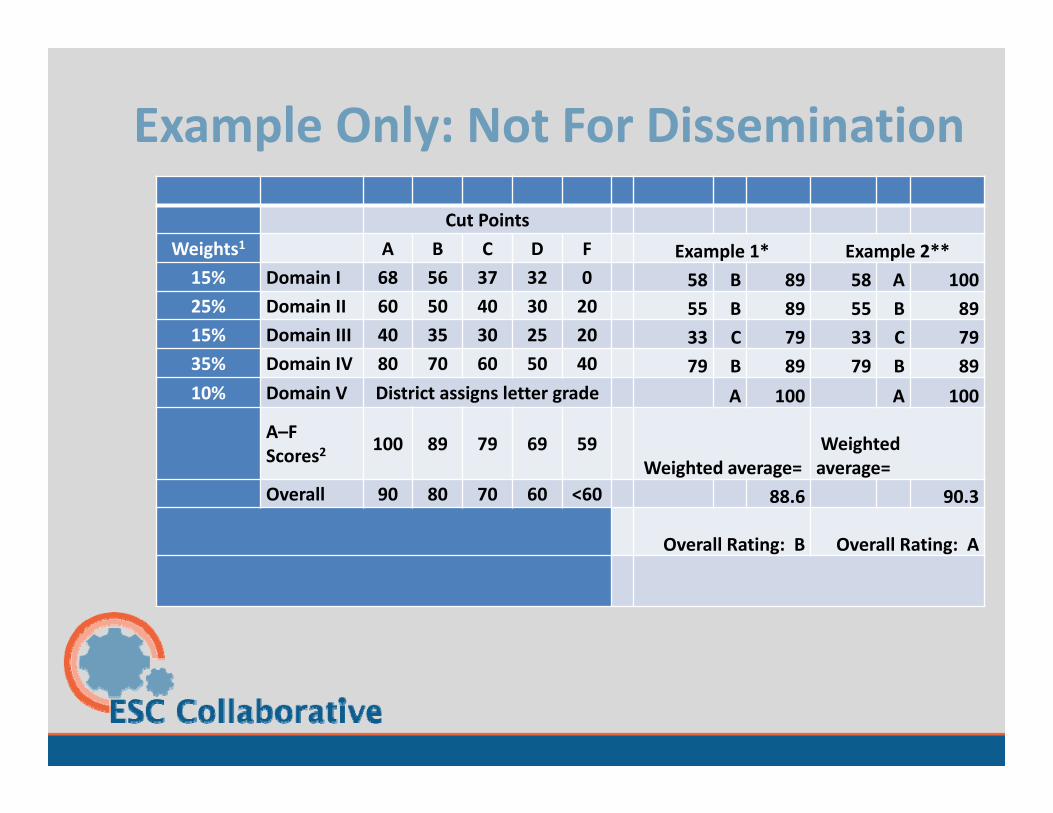
Example Only: Not For Dissemination
Cut PointsWeights1 A B C D F Example 1* Example 2** 15% Domain I 68 56 37 32 0 58 B 89 58 A 10025% Domain II 60 50 40 30 20 55 B 89 55 B 8915% Domain III 40 35 30 25 20 33 C 79 33 C 7935% Domain IV 80 70 60 50 40 79 B 89 79 B 8910% Domain V District assigns letter grade A 100 A 100
A–F Scores2 100 89 79 69 59
Weighted average=Weighted average=
Overall 90 80 70 60 <60 88.6 90.3
Overall Rating: B Overall Rating: A
ESSA & Focus School Update
Welcome Mark Baxter
Supporting the Work
• Organizational Structure
• Processes/ Procedures
• Communications
• Capacity and Resources
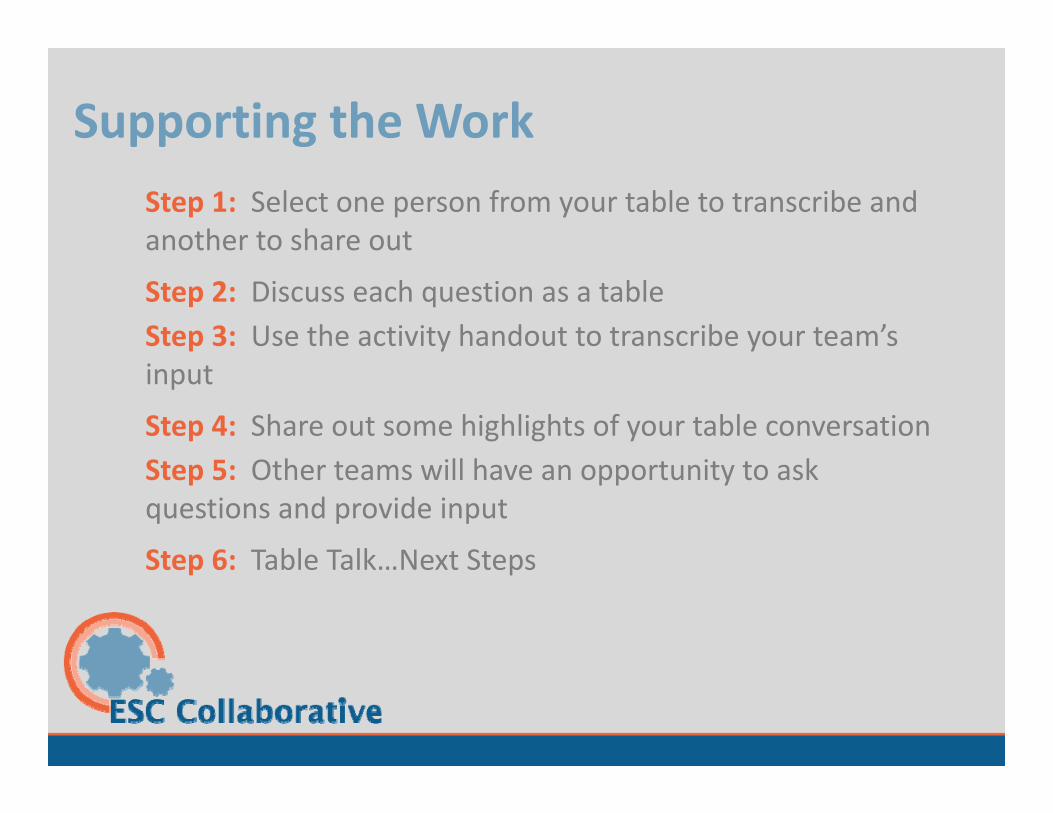
Supporting the WorkStep 1: Select one person from your table to transcribe and another to share out
Step 2: Discuss each question as a tableStep 3: Use the activity handout to transcribe your team’s input
Step 4: Share out some highlights of your table conversationStep 5: Other teams will have an opportunity to ask questions and provide input
Step 6: Table Talk…Next Steps

Enjoy Your Lunch!

Support System Dialogue
• Organizational Structure
• Processes/ Procedures
• Communications
• Capacity and Resources
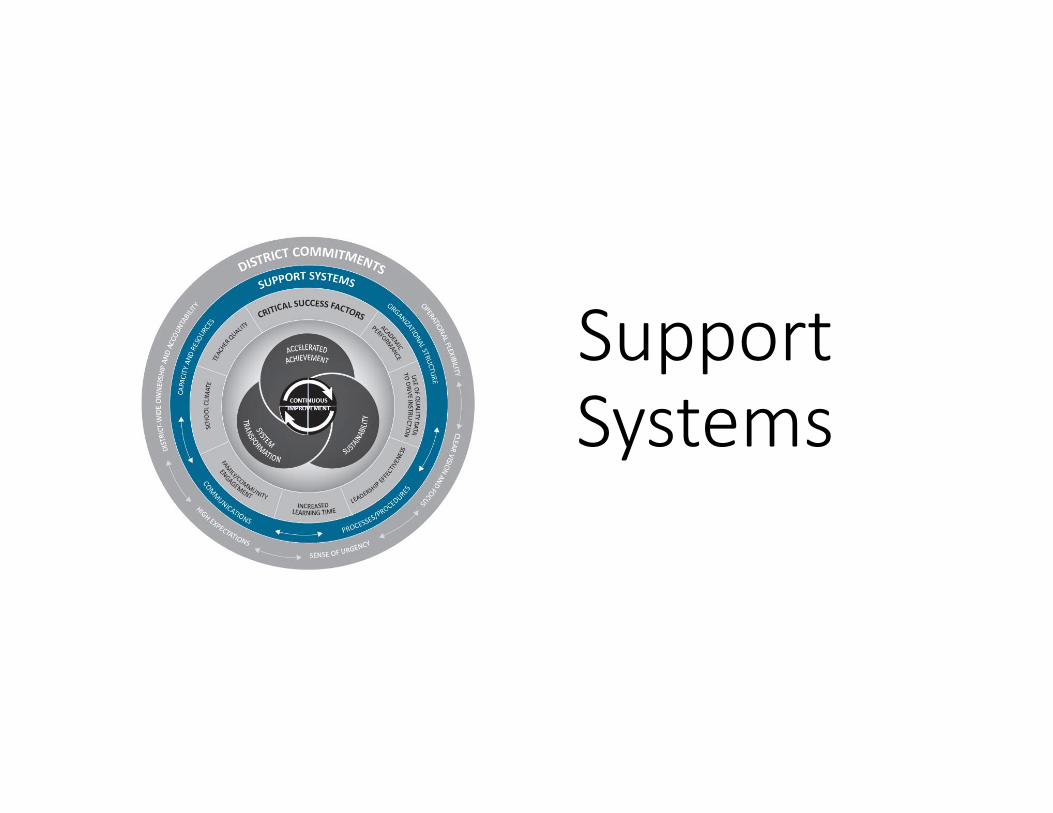
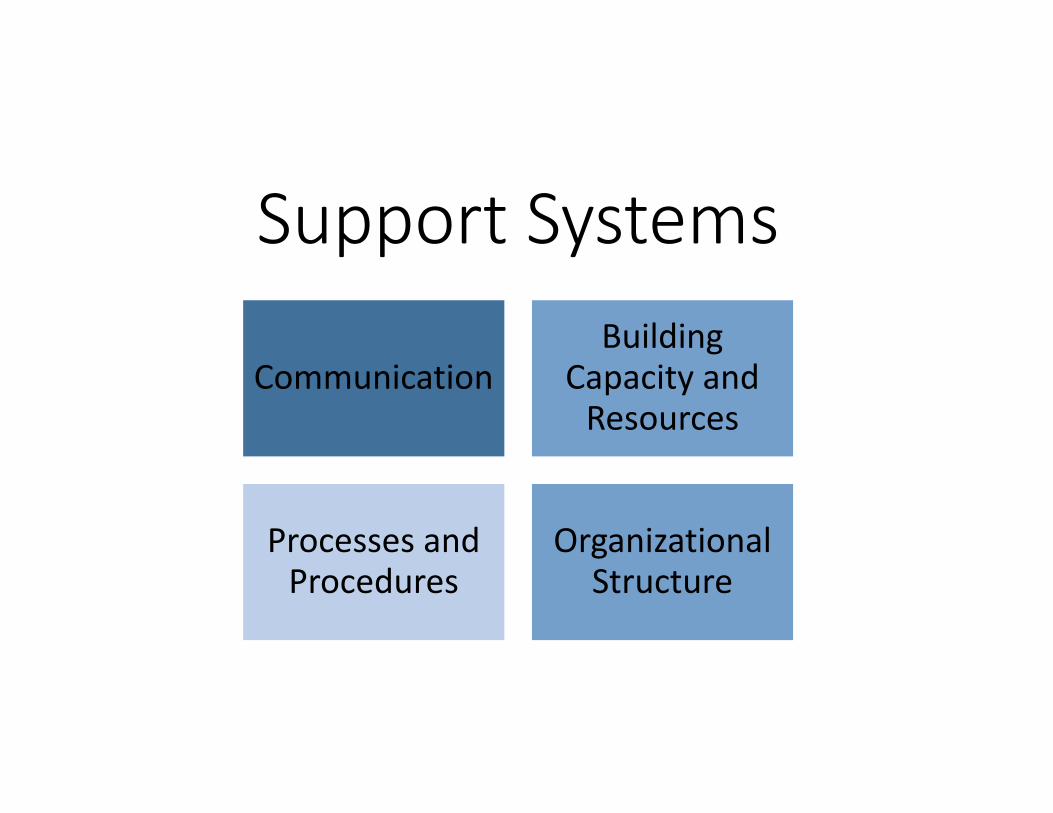
Support Systems
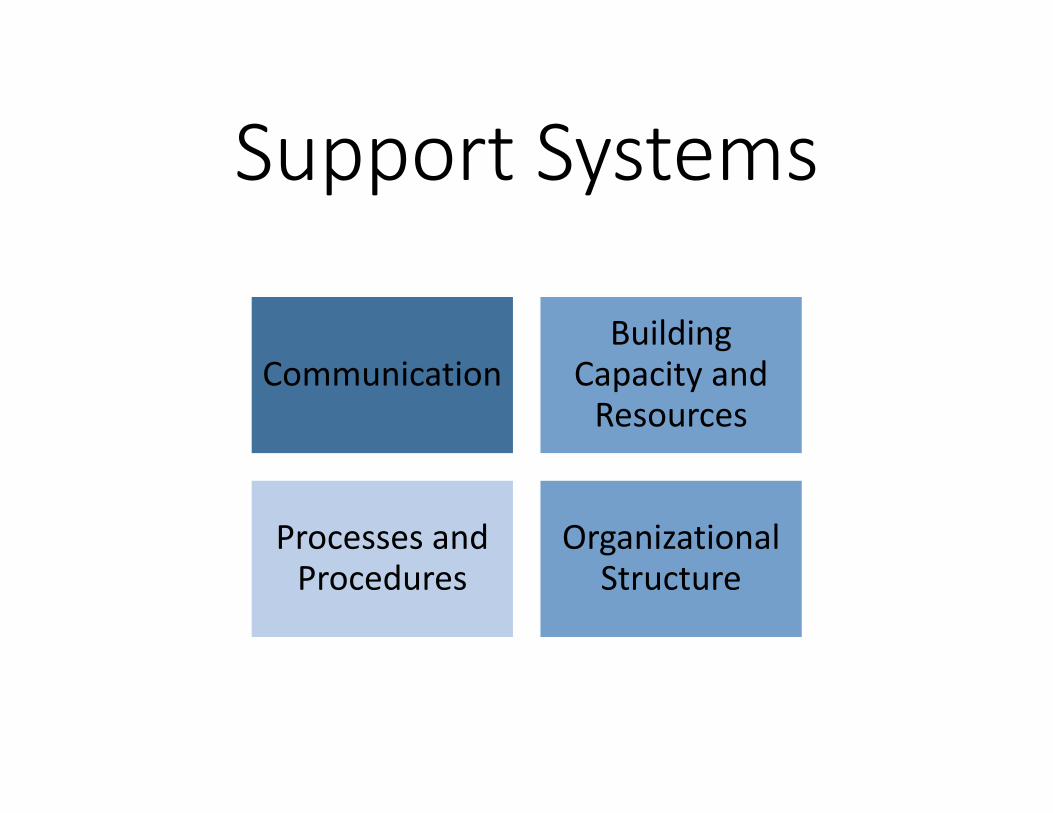
Support Systems
CommunicationBuilding
Capacity and Resources
Processes and Procedures
Organizational Structure
SUPPORT SYSTEMS
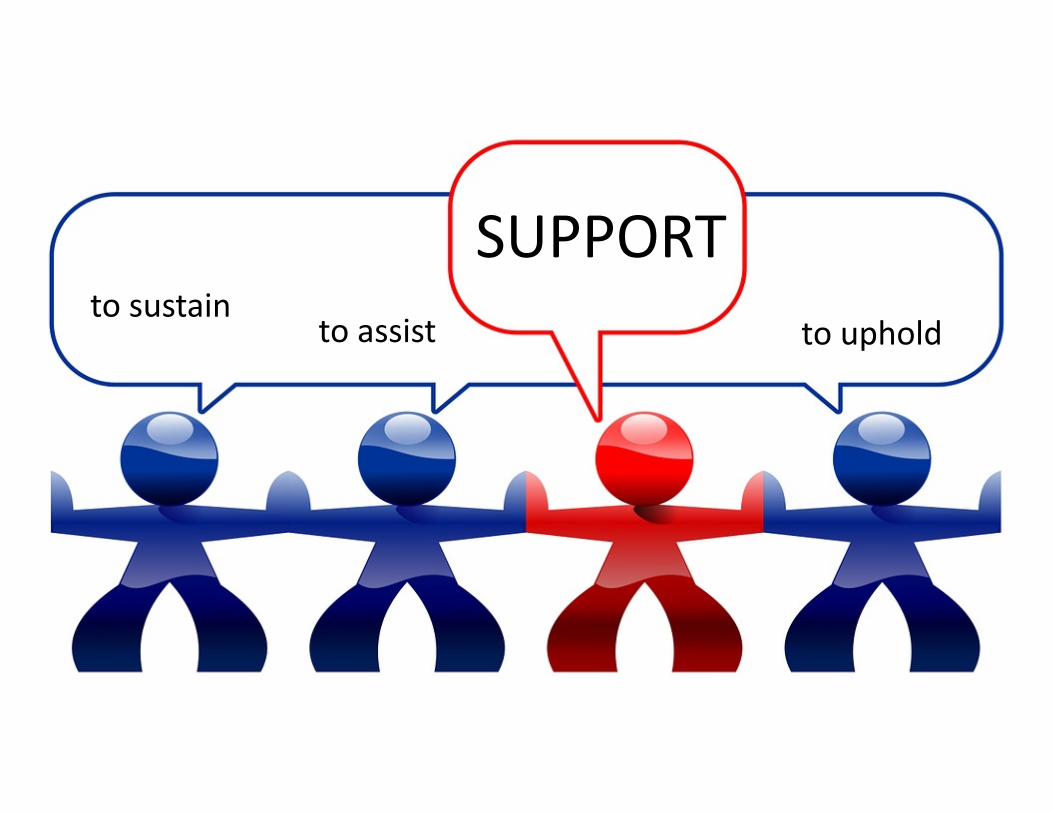
SUPPORTto sustain
to assist to uphold
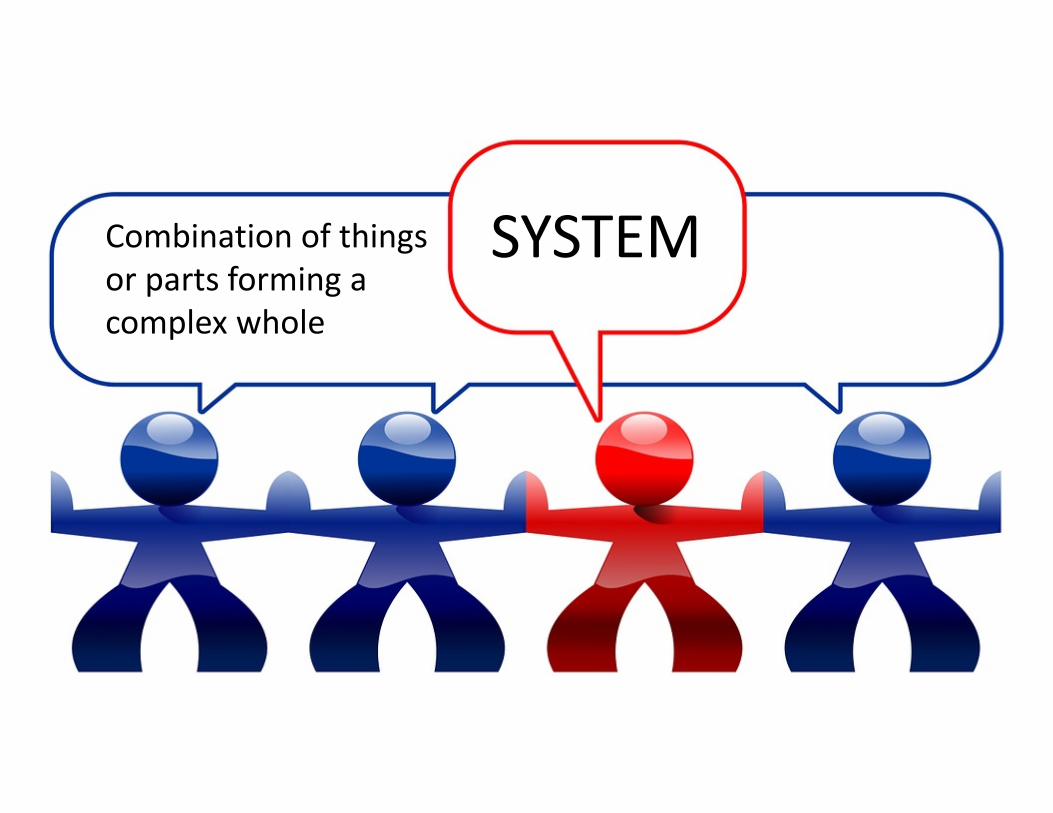
SYSTEMCombination of things or parts forming a complex whole
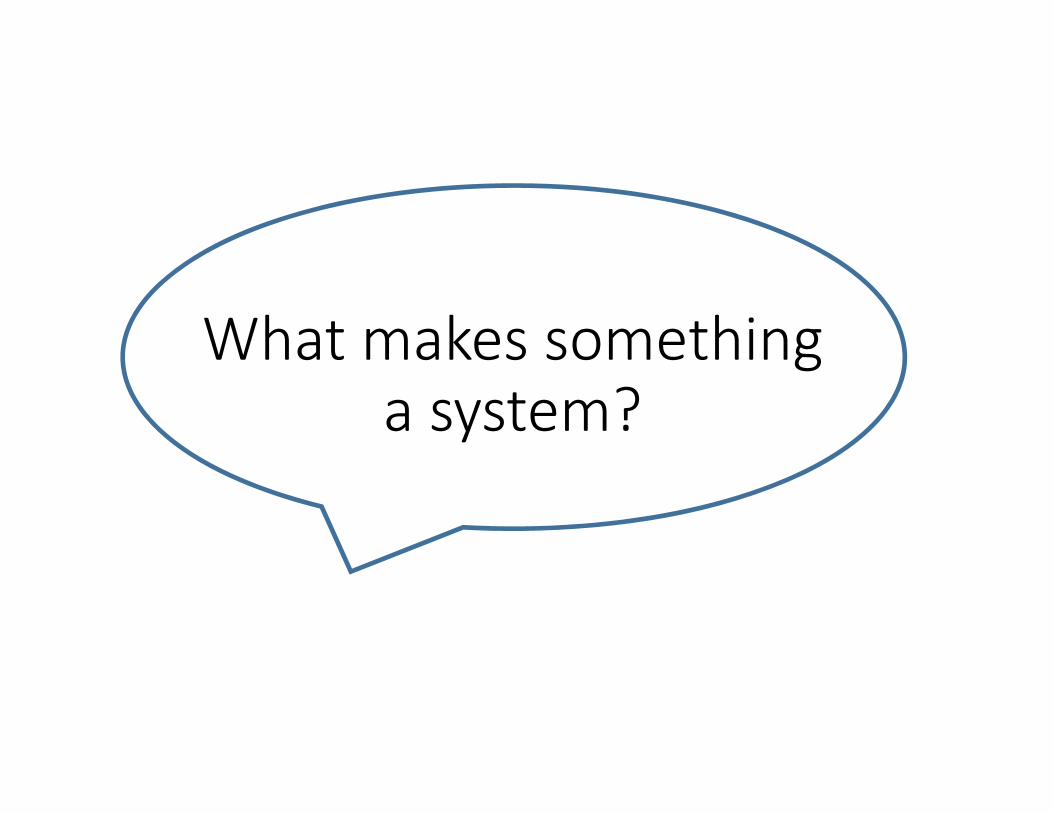
What makes something a system?
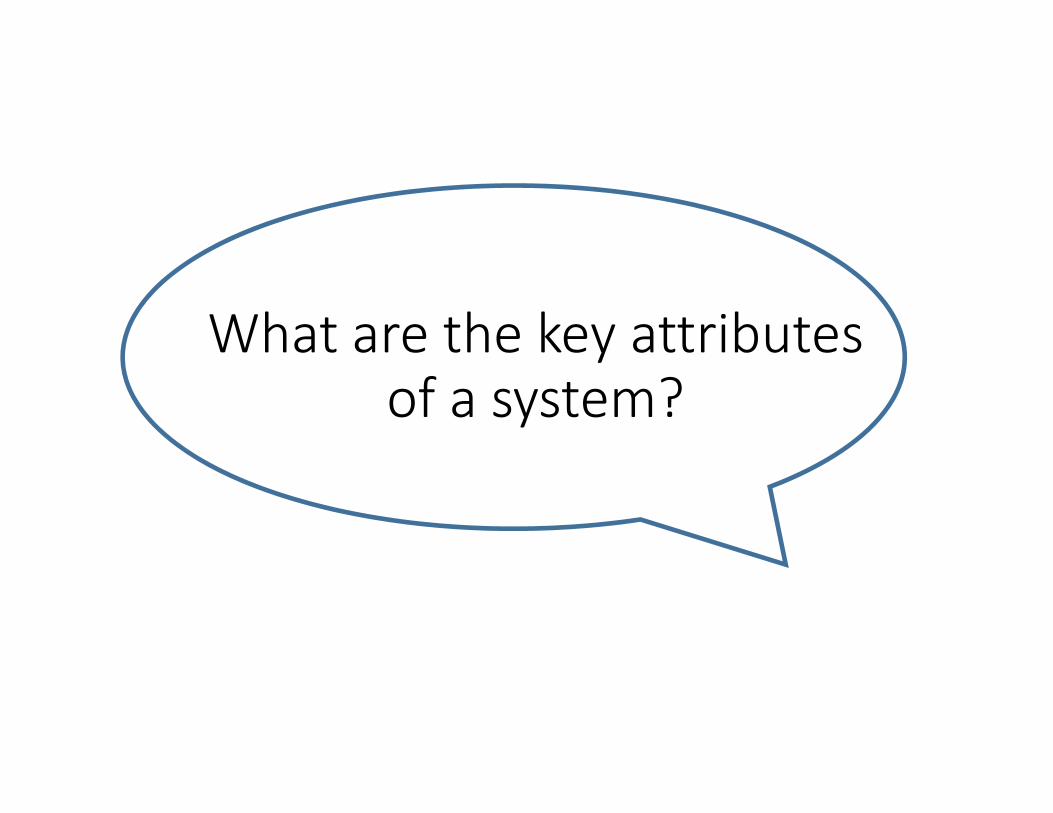
What are the key attributes of a system?

https://www.youtube.com/watch?v=OqEeIG8aPPk
Russ AckoffSystems’ Thinking
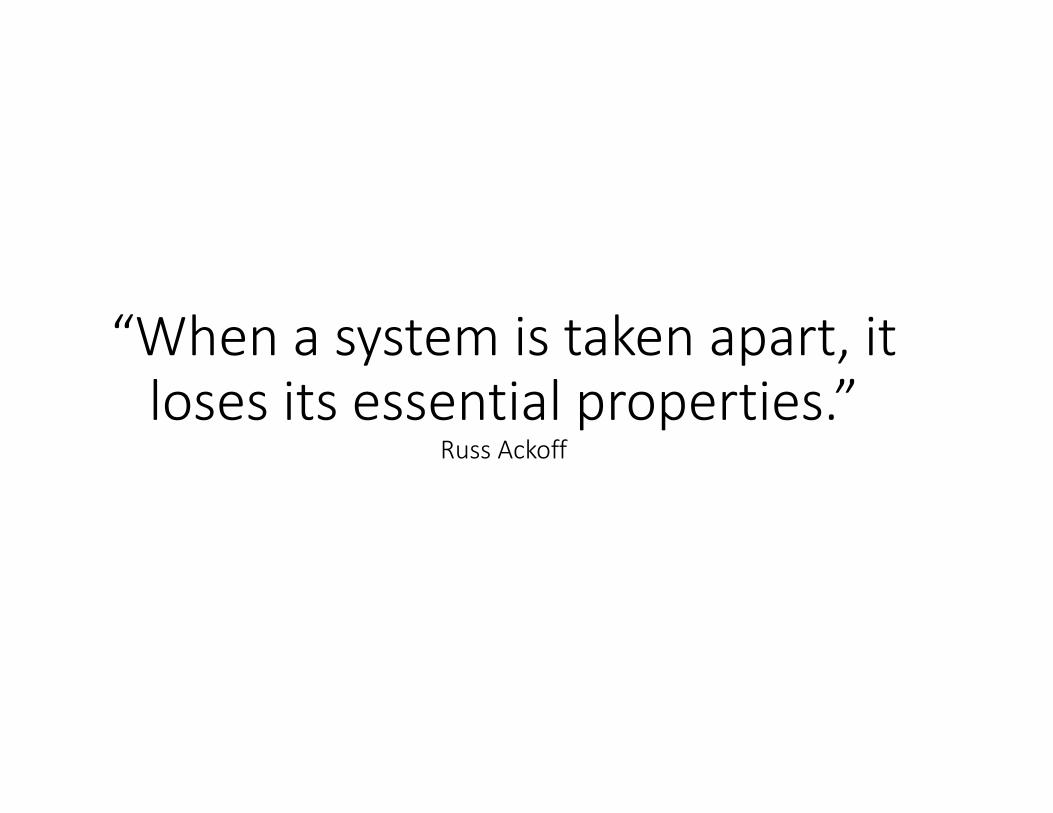
“When a system is taken apart, it loses its essential properties.”
Russ Ackoff
Support Systems
CommunicationBuilding
Capacity and Resources
Processes and Procedures
Organizational Structure
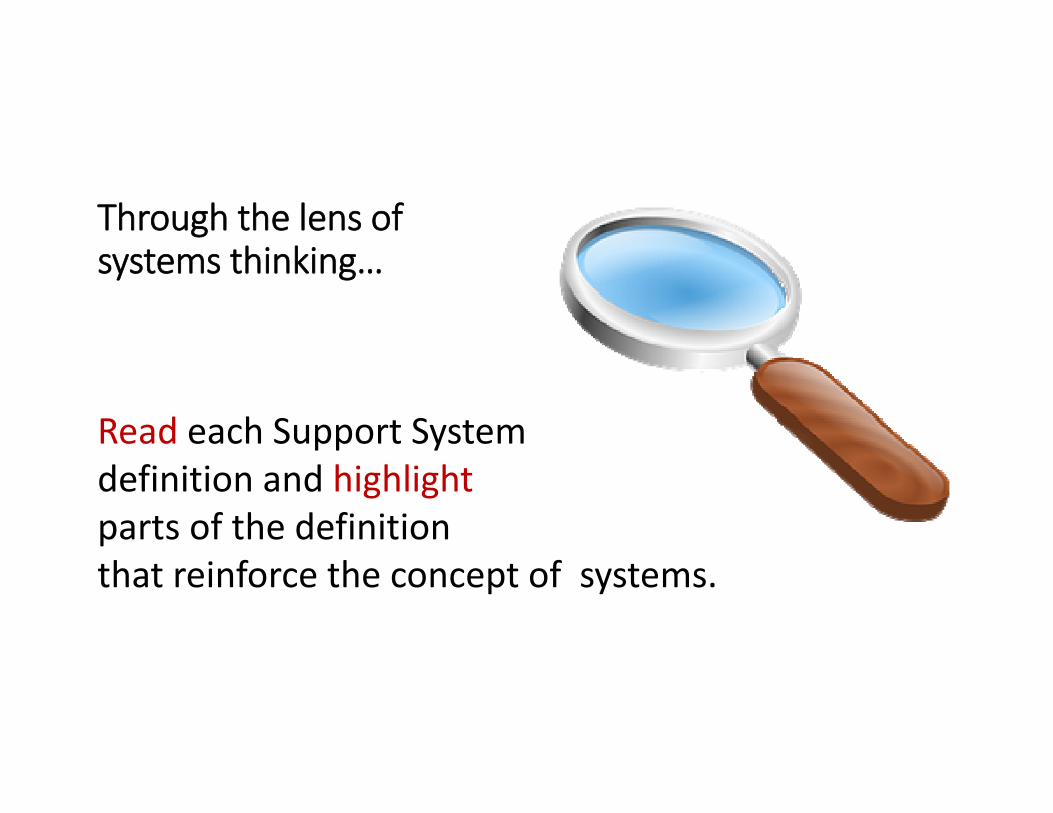
Through the lens of systems thinking…
Read each Support System definition and highlightparts of the definition that reinforce the concept of systems.
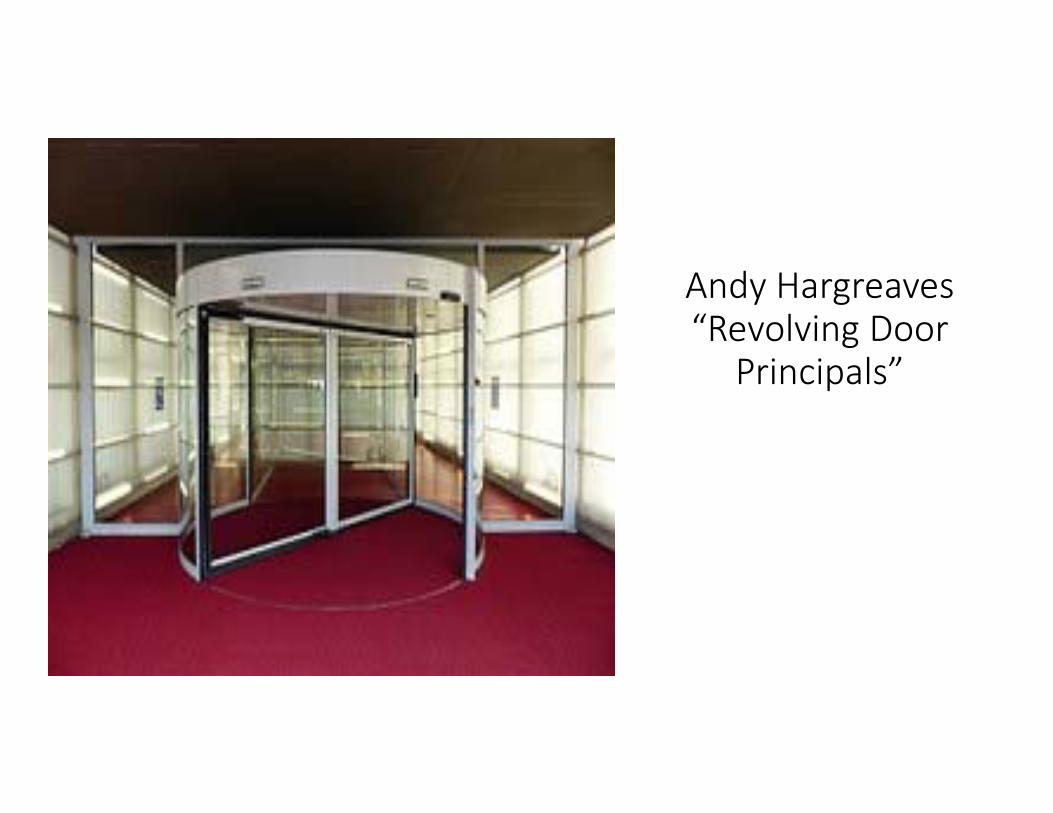
Andy Hargreaves“Revolving Door
Principals”

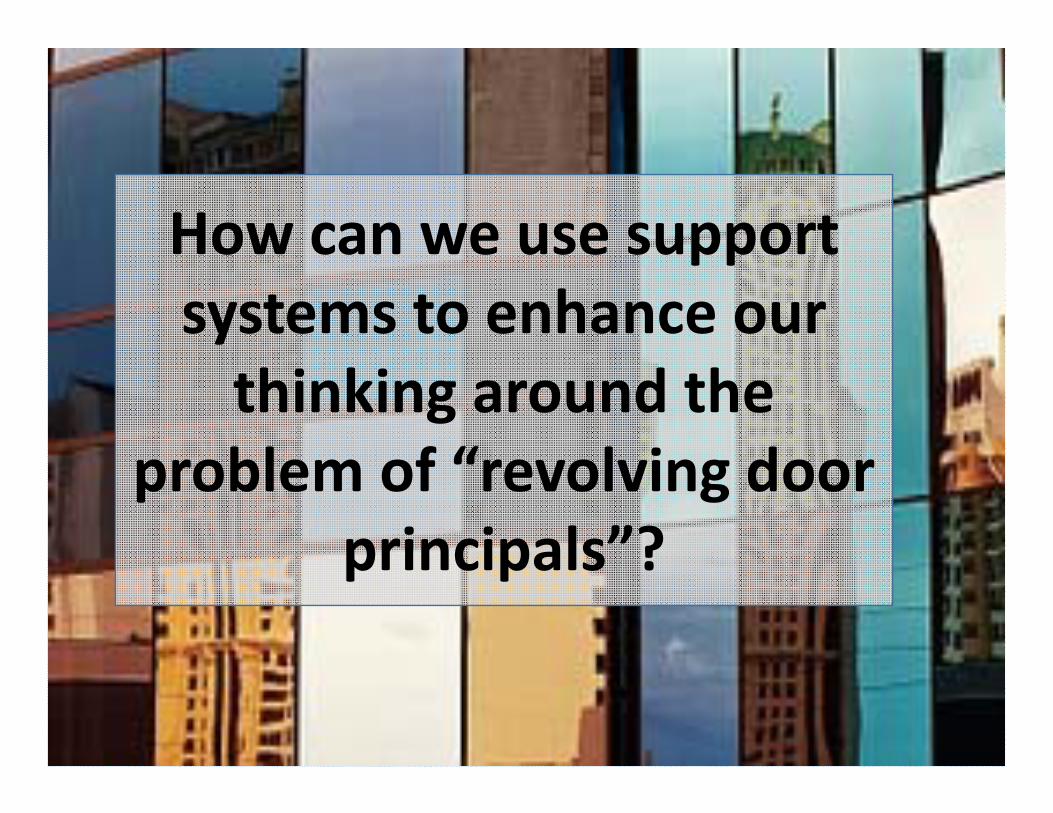
How can we use support systems to enhance our thinking around the
problem of “revolving door principals”?

How can we use support systems to enhance our thinking around growing and developing leaders?
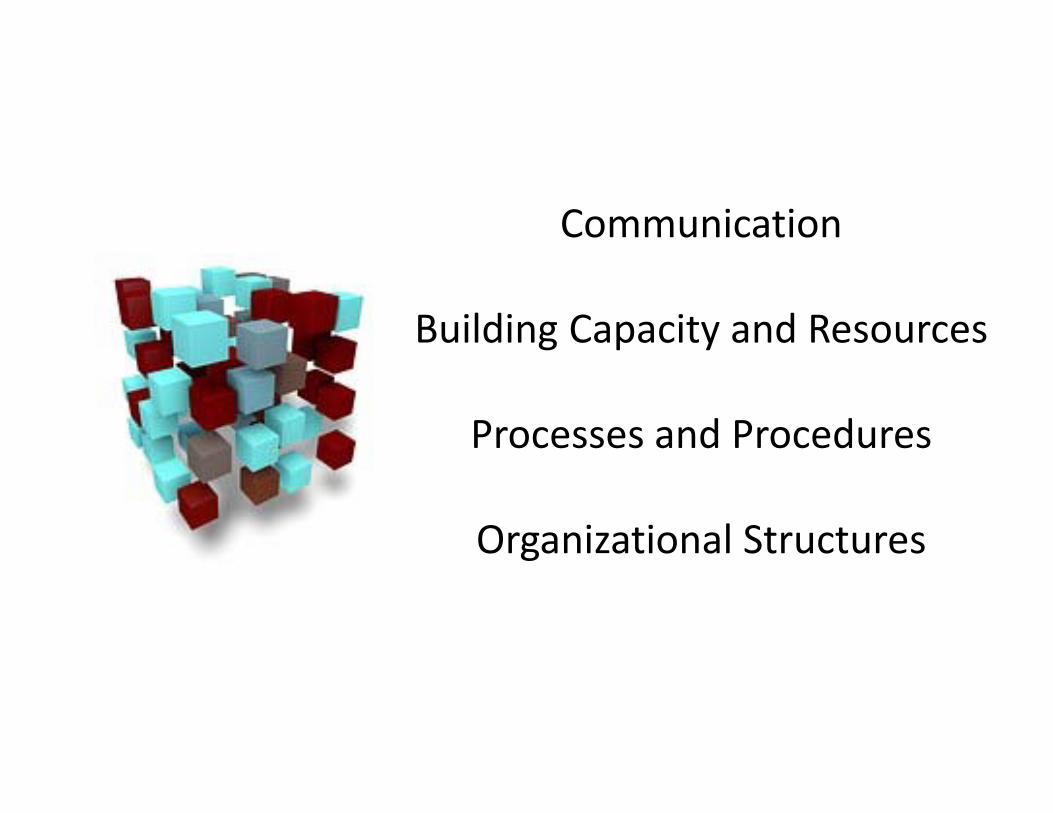
Communication
Building Capacity and Resources
Processes and Procedures
Organizational Structures
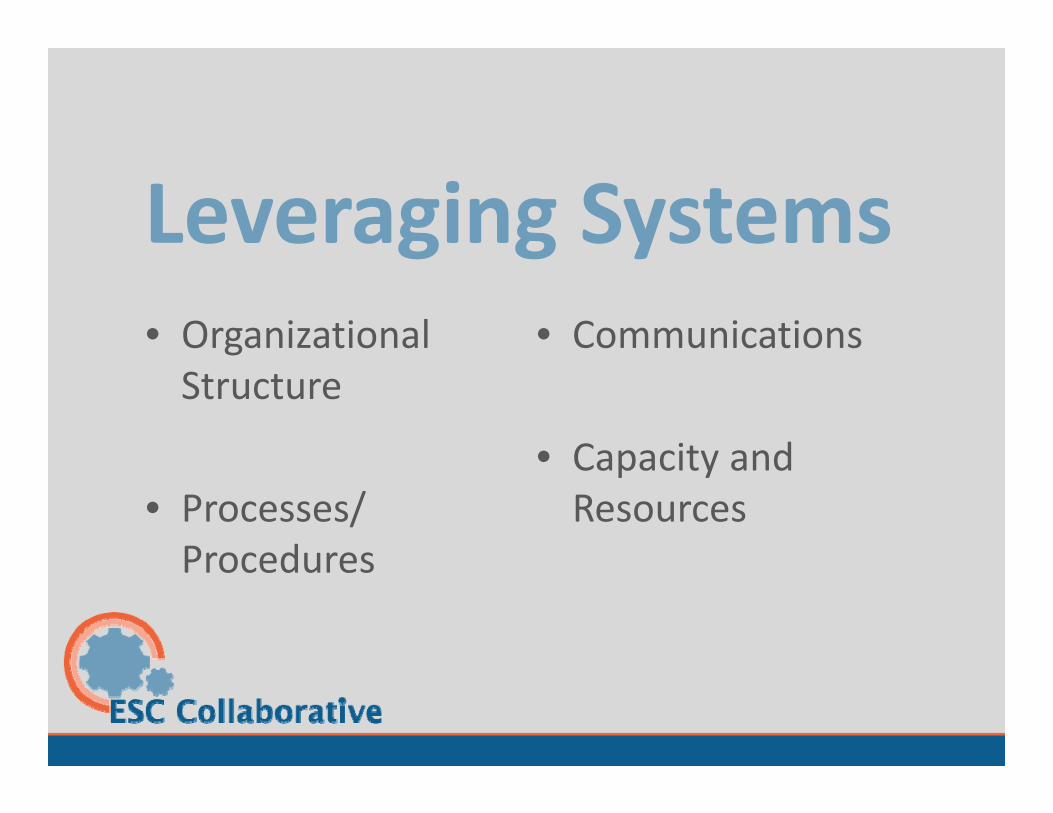
Leveraging Systems• Organizational Structure
• Processes/ Procedures
• Communications
• Capacity and Resources
TAIS, T-TESS,
and T-PESS
Education Service Center Region 13
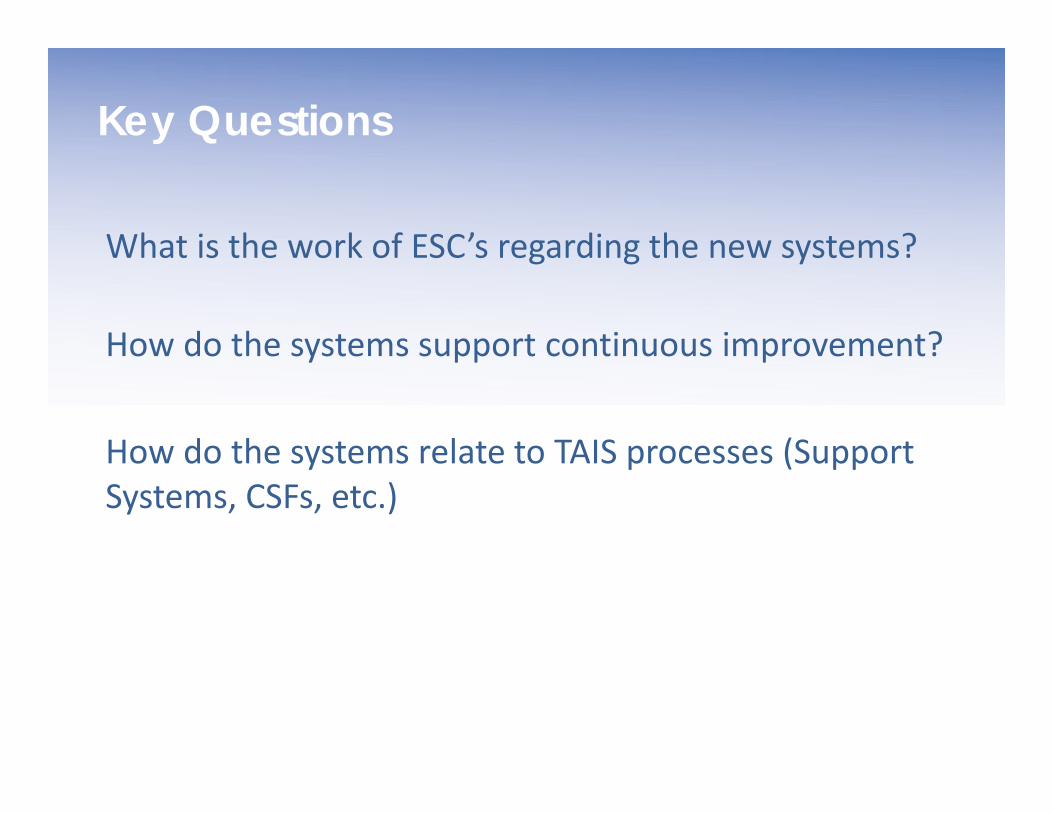
Key Questions
What is the work of ESC’s regarding the new systems?
How do the systems support continuous improvement?
How do the systems relate to TAIS processes (Support Systems, CSFs, etc.)

Role of ESCs so farDeliver TTESS 3 day Appraiser TrainingSupport Fidelity of Implementation
CalibrationSkill Development
Facilitate Key Processes/Best PracticesOrientationGoal SettingObservationsPre‐, Post, End of Year Conferences
Facilitate communications between TEA & districtsReceive evaluation data and feedback
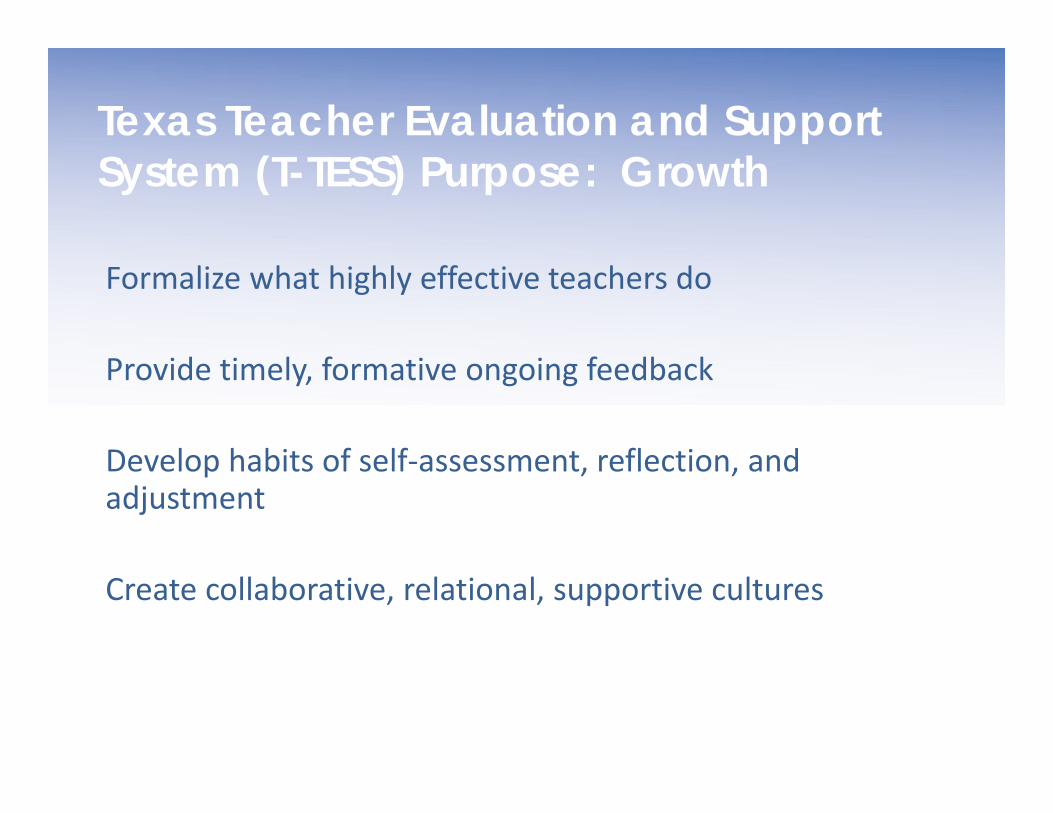
Texas Teacher Evaluation and Support System (T-TESS) Purpose: Growth
Formalize what highly effective teachers do
Provide timely, formative ongoing feedback
Develop habits of self‐assessment, reflection, and adjustment
Create collaborative, relational, supportive cultures
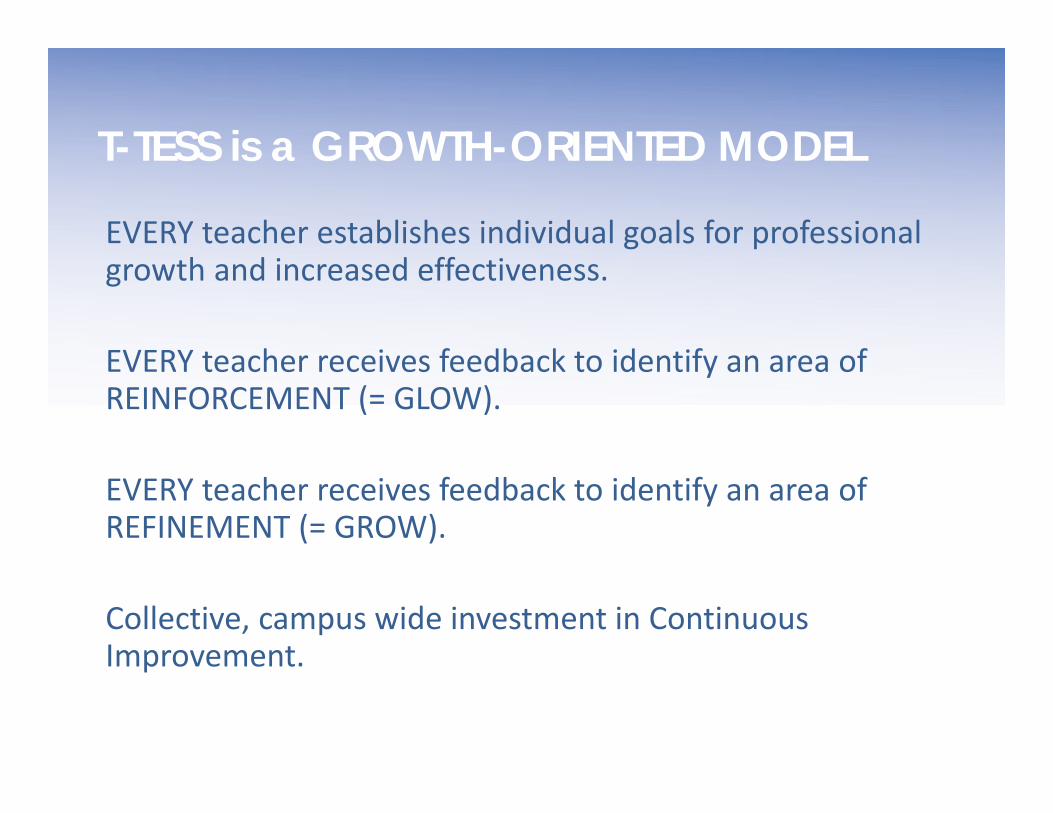
EVERY teacher establishes individual goals for professional growth and increased effectiveness.
EVERY teacher receives feedback to identify an area of REINFORCEMENT (= GLOW).
EVERY teacher receives feedback to identify an area of REFINEMENT (= GROW).
Collective, campus wide investment in Continuous Improvement.
T-TESS is a GROWTH-ORIENTED MODEL
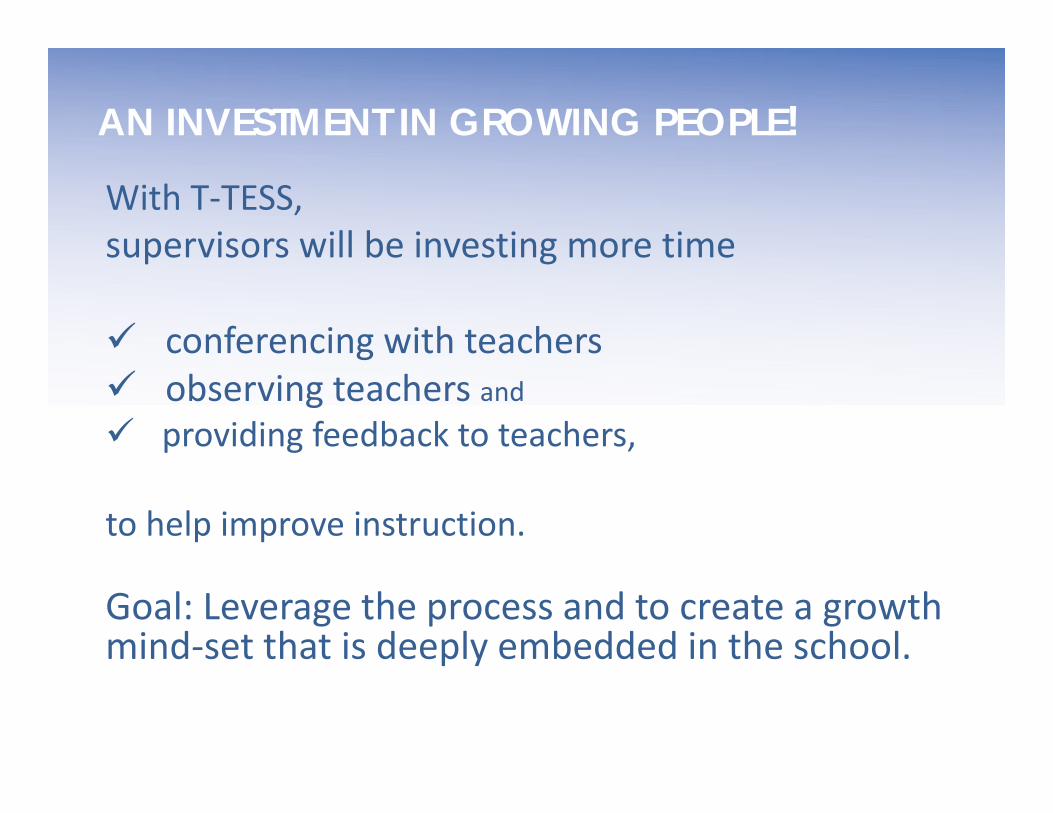
With T‐TESS, supervisors will be investing more time
conferencing with teachers observing teachers and providing feedback to teachers,
to help improve instruction.
Goal: Leverage the process and to create a growth mind‐set that is deeply embedded in the school.
AN INVESTMENT IN GROWING PEOPLE!
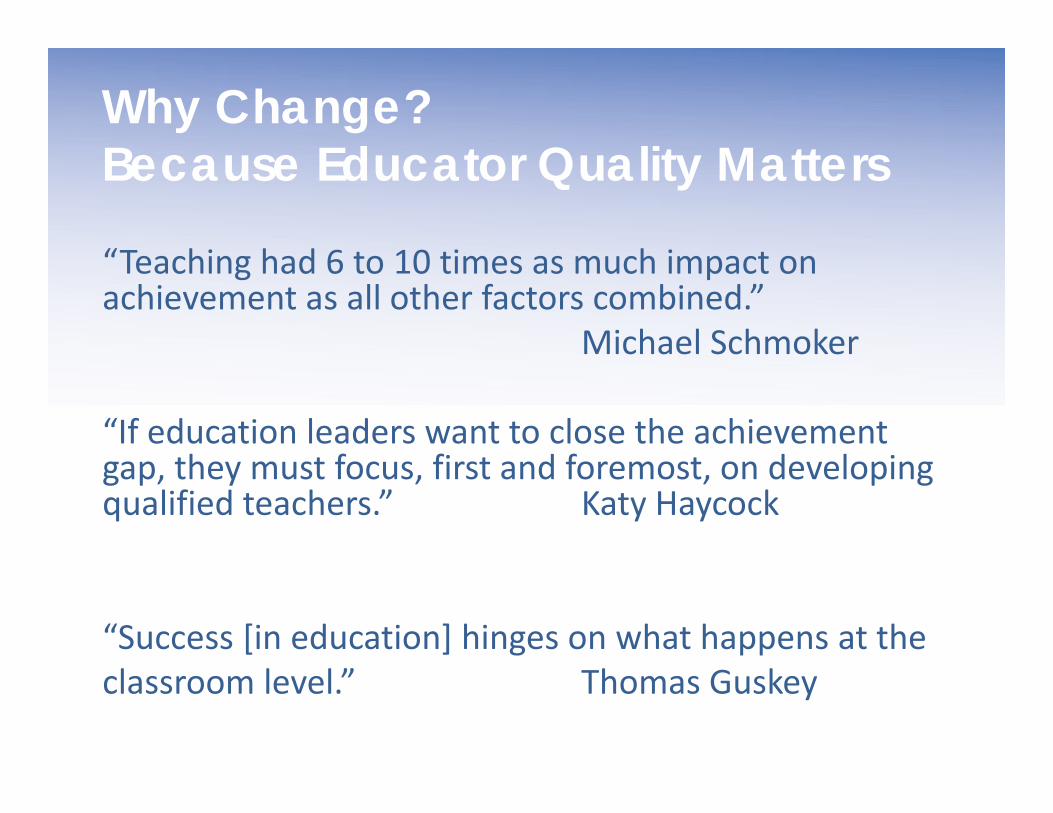
Why Change? Because Educator Quality Matters
“Teaching had 6 to 10 times as much impact on achievement as all other factors combined.”
Michael Schmoker
“If education leaders want to close the achievement gap, they must focus, first and foremost, on developing qualified teachers.” Katy Haycock
“Success [in education] hinges on what happens at the classroom level.” Thomas Guskey
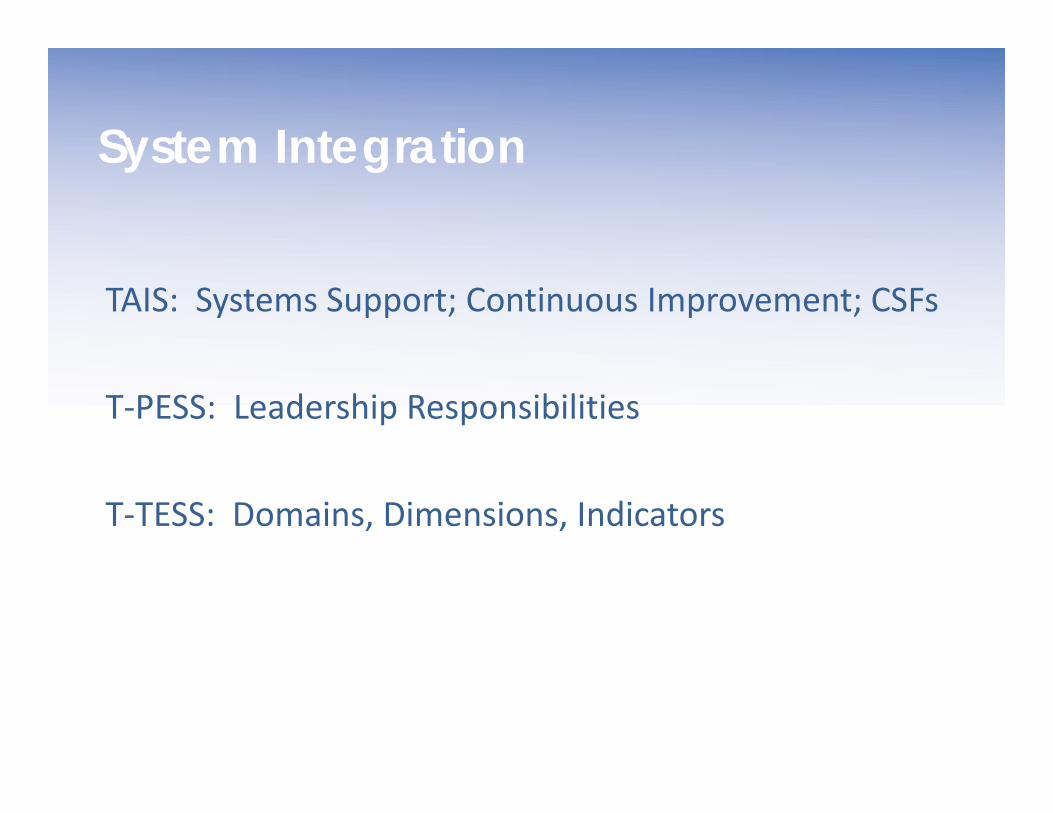
System Integration
TAIS: Systems Support; Continuous Improvement; CSFs
T‐PESS: Leadership Responsibilities
T‐TESS: Domains, Dimensions, Indicators
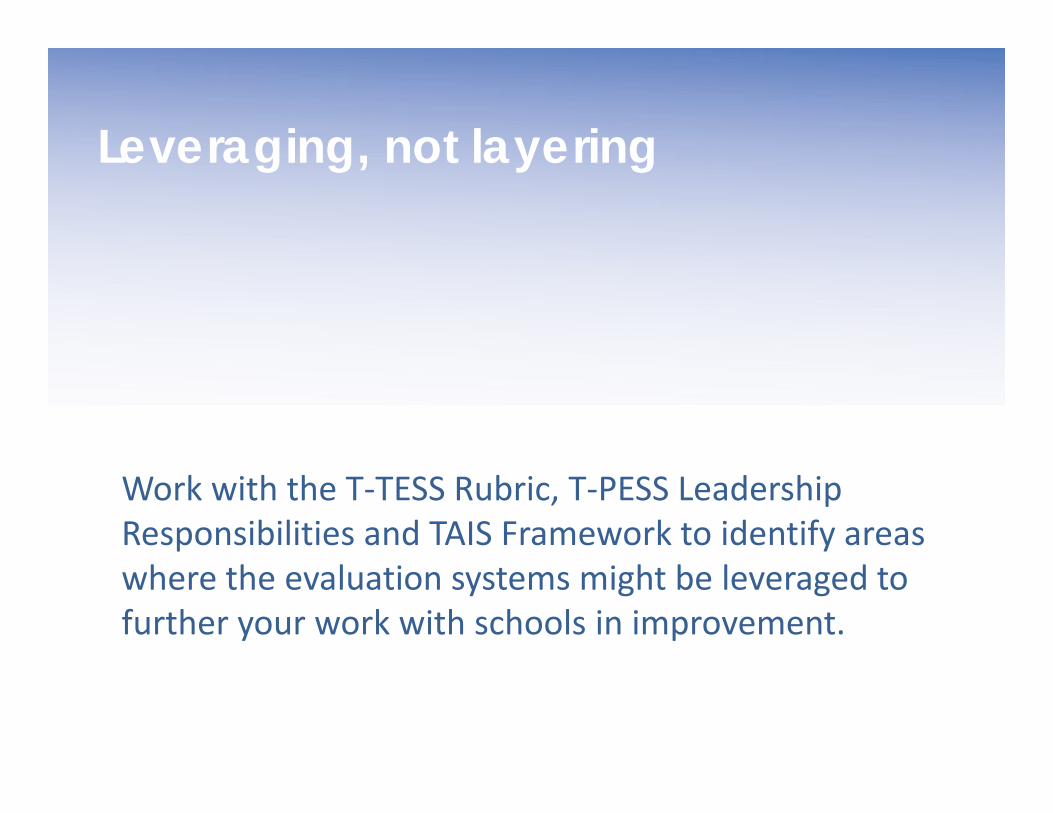
Leveraging, not layering
Work with the T‐TESS Rubric, T‐PESS Leadership Responsibilities and TAIS Framework to identify areas where the evaluation systems might be leveraged to further your work with schools in improvement.

Break
PSP Learning Plan Data
• Organizational Structure
• Processes/ Procedures
• Communications
• Capacity and Resources
Collaborative/ Statewide Partners Institute Input
• Organizational Structure
• Processes/ Procedures
• Communications
• Capacity and Resources
Open Forum Discussion
Thank you!See you Tuesday 8:30AM