Embed Size (px)
Citation preview
Texans for Lawsuit Reform
Texas Workplace Injury Compensation Analysis, Options, Impact
Stradian, January 2009
Rev. 1.0
Texans for Lawsuit Reform is a volunteer‐led organization working to restore fairness and balance to our civil justice system through political action; legal, academic, and market research; and grassroots initiatives. Texans for Lawsuit Reform commissioned this independent study by Stradian, LLC – an independent management consulting firm.
Stradian is a management consulting firm with national scope serving both corporations and non‐profit Institutions. Our core competency is in developing solutions to complex and challenging issues using an approach that meets the unique needs and goals of each client we serve.
Report Authors:
Jason Kirkpatrick [email protected]
Skye Jorden [email protected]
Dwayne Benn [email protected]
Stradian
3900 Essex Lane, Suite 250 Houston, Texas 77027
713.579.0060
Disclosure: Leo Linbeck, Jr. is Sr. Chairman and member of the Board of the Aquinas Companies, LLC, the parent company of Stradian. Mr. Linbeck has no equity ownership or executive responsibility at Aquinas Corporation or Stradian. Mr. Linbeck also holds a non‐executive position at TLR, where he serves as Sr. Chairman.
The Texans for Lawsuit Reform Foundation is a nonprofit research organization that provides objective analysis and
cutting edge solutions to the challenges presented by the Texas civil justice system. The Foundation’s publications
reflect the comprehensive and in-depth legal research necessary to assure that Texas develops and maintains a civil
justice system that serves every Texan. Texans for Lawsuit Reform Foundation commissioned this independent study
by Stradian, LLC to explore workplace injury compensation, the workers’ compensation system and third party law-
suits. Stradian, LLC is an independent management consulting firm.
Stradian is a management consulting firm with national scope serving both corporations and non‐profit Institutions.
Our core competency is in developing solutions to complex and challenging issues using an approach that meets the
unique needs and goals of each client we serve.
Report Authors:
Jason Kirkpatrick
Skye Jorden
Dwayne Benn
Stradian
3900 Essex Lane, Suite 250
Houston, Texas 77027
713.579.0060
Disclosure: Leo Linbeck, Jr. is Sr. Chairman and member of the Board of the Aquinas Companies, LLC, the parent company of
Stradian. Mr. Linbeck has no equity ownership or executive responsibility at Aquinas Corporation or Stradian. Mr. Linbeck
is Co-Chairman of the Board of the Texans for Lawsuit Reform Foundation.
Texas Workplace Injury Compensation: Analysis, Options, Impact Stradian, January 2009
ABSTRACT Workplace injuries affect nearly a quarter of a million1 Texas workers every year. Most of those injured workers have access to workers’ compensation coverage. The Texas workers’ compensation system is designed to be a “no‐fault” system where workers injured on the job can receive medical and wage benefits – regardless of fault – in exchange for granting employers immunity from liability litigation. This contract guarantees a safety net for Texas workers and financial security for Texas employers.
The system, though, has its flaws. When the Texas workers’ compensation law was first enacted in 1913, the structure of the Texas economy was relatively simple; employees arrived for work at a job‐site that was almost exclusively operated by their direct employer. However, the Texas economy has become more dynamic and business operations have become much more integrated. The new Texas economy features much more complex work environments, involving multiple employers working side‐by‐side at the same job site.
In a complex work environment, workplace injuries can be the result of any number of factors, and can potentially involve another party that is not the direct employer of the injured worker. The workers’ compensation system does not preclude an injured worker from seeking damages directly from any 3rd party that is deemed responsible for the injury. The one exception to this statute grants immunity to 3rd parties that directly purchase and administer the workers’ compensation policies of a subcontractor’s employees, though the administrative burden of this structure makes it seldom utilized.
As a result of the limit of immunity only to the direct employer or statutory employer, accidents where a 3rd party is involved can give rise to liability lawsuits. As a practical matter, therefore, the availability of legal recourse against 3rd parties limits the “no‐fault” intent of the system. While the risk for any individual business in becoming the subject of a 3rd party lawsuit is low, the cost and focus required for Texas employers to manage the risk is significant. Moreover, the litigation option is inefficient in distributing benefits to injured Texas workers.
This report presents a brief history of workers’ compensation in Texas, the costs of workplace injuries on subscribers to the system, and the inefficiencies of the 3rd party liability system. The report also discusses the deficiencies in the distribution of benefits to Texas workers with workers’ compensation insurance. Also highlighted throughout the report are the major levers available within the Texas system that are believed to impact workplace safety and contain costs. Because of the 3rd party exception in the Texas workers’ compensation system, significant attention is paid to the effects of litigation against 3rd parties and its impact on injured Texas workers and employers.
This report is a fact‐based analysis of the Texas workers’ compensation system, and does not intend to make specific policy recommendations. It does, however, discuss possible scenarios for addressing key deficiencies of the system. The scenarios presented take two principal factors into consideration: 1) How can benefits to injured Texas employees be improved, and 2) How can the “frictional” costs of the system be reduced? These questions are evaluated against the issue of primary importance to all Texas employers, employees, and government agencies – i.e., maximizing workplace safety.
1 (US Bureau of Labor Statistics (BLS))
i
Texas Workplace Injury Compensation: Analysis, Options, Impact Stradian, January 2009
Note: This analysis uses several sources of base level and compiled data from government agencies, industry research councils, and academic literature. These data provide comprehensive views of workplace injuries, workers’ compensation, lawsuits and settlements. To find answers to the two key questions posed above, it is essential to drill down on the available data, categorizing and summarizing it to extract useful information. In some cases, the data available from the source was at a sufficient level of detail, and/or could be captured in convenient analytical categories to make comparisons and draw conclusions. Some of the data was not directly disaggregated by the source, or not classified in a manner that could illustrate the salient features of the injury compensation system. As a result, this analysis uses a variety of techniques to derive information from the available data. All of the derivations made are based on the source data and use sound estimation techniques that present an accurate view of the data. Where applicable, the data and methodology used are presented within the document as sidebar commentaries. In addition, a detailed explanation of the complete methodology is presented in Appendix A: Methodology.
ii
Texas Workplace Injury Compensation: Analysis, Options, Impact Stradian, January 2009
iii
CONTENTS ABSTRACT ......................................................................................................................................................................... i INTRODUCTION................................................................................................................................................................ 1
The Spirit of the Workers’ Compensation System ................................................................................................................ 1 Administration of Workers’ Compensation in Texas ............................................................................................................ 1 Checks and Balances ............................................................................................................................................................. 3 Recent Reforms to the Texas Workers’ Compensation System ........................................................................................... 4 Policy Benefits to State Economic Development ................................................................................................................. 5 Complex Work Environments in a Dynamic Economy ......................................................................................................... 5
COST IMPACT OF WORK RELATED INJURIES ...................................................................................................................... 8 The Texas Workers’ Compensation System: Freedom of Choice ......................................................................................... 9 Workers’ Compensation System Cost Comparison: Texas, Florida, and California ............................................................ 10 Economic Impact of Workplace Injury and Illness on Texas Subscribers ........................................................................... 11 Economic Impact of Workplace Injury and Illness in Hazardous Industries ....................................................................... 13
WORK RELATED INJURY PROFILE .................................................................................................................................... 15 Workplace Safety................................................................................................................................................................ 15 Cost Impact of Occupational Injury/Illness ......................................................................................................................... 16 Injury Severity ..................................................................................................................................................................... 17 Fatal Occupational Injury/Illness ........................................................................................................................................ 19
3rd PARTY WORKPLACE INJURY LITIGATION .................................................................................................................... 20 Workplace Injury Case Outcomes ...................................................................................................................................... 20 Major Workplace Injuries and 3rd Party Lawsuits ............................................................................................................... 22 Unpredictability of Lawsuits Awards Leads to Over‐Insurance of Risk .............................................................................. 23 Asymmetric Distribution of Injury Benefits ........................................................................................................................ 23 The Case for 3rd Party Litigation Rights ............................................................................................................................... 24 The Impact of Litigation Rights on Employee Safety .......................................................................................................... 25 Risk / Reward Tradeoffs of 3rd Party Litigation ................................................................................................................... 25
REDUCING COSTS BENEFITS TEXAS WORKERS AND BUSINESS ......................................................................................... 27 KEY DEFICIENCIES IN THE TEXAS SYSTEM ........................................................................................................................ 28
Option 1: Increase the Maximum Weekly Wage Benefit for TIBs ...................................................................................... 28 Option 2: Relax Qualification Requirements for Lifetime Income Benefits ....................................................................... 29 Option 3: Redirect 3rd Party Lawsuit Costs to All Seriously Injured Workers .................................................................... 30
IN CONCLUSION ............................................................................................................................................................. 33 APPENDIX A: METHODOLOGY ........................................................................................................................................ 34 APPENDIX B: STATUTORY EMPLOYER AND EXCLUSIVE REMEDY ...................................................................................... 44
Labor Code Exclusive Remedy and “Statutory Employer” Provisions ................................................................................ 44 Case Law Defining the Scope of Statutory Employer ......................................................................................................... 44
APPENDIX C: DEFINED TERMS ........................................................................................................................................ 46 APPENDIX D: TABLE OF ACRONYMS ............................................................................................................................... 48 APPENDIX E: SELECTED JOB CLASSIFICATION RELATIVITIES ............................................................................................. 49 APPENDIX F: RESEARCH SOURCES .................................................................................................................................. 50

[BLANK PAGE]
Texas Workplace Injury Compensation: Analysis, Options, Impact Stradian, January 2009
INTRODUCTION In the early part of the 20th century, many states across the country began enacting workers’ compensation programs to protect the health and welfare of employees injured during the course of work in exchange for legal liability immunity for employers. In 1913, Texas enacted its first workers’ compensation law giving employers the option to subscribe to the workers’ compensation system. Today, Texas remains the only state with a truly optional workers’ compensation system2.
The Spirit of the Workers’ Compensation System
Today’s work environment is safer and more productive than in any previous decade. However, with a labor force of more than 9 million strong in the State of Texas3, one fact of life remains: workplace injuries and illnesses do and will happen.
Every employee who arrives at their job‐site duly expects to return home unharmed at the end of their day’s work. The workers’ compensation system is designed to compensate workers for accidental injuries and illnesses by providing timely medical care and supplementing the loss of wages due to extended recovery periods.
The implicit contract that the workers’ compensation system provides between an employee and his or her employer is that an insurance safety net is available for the employee to cover the financial cost of an accidental injury or illness suffered on the job. This safety net for the employee is intended to be a “no‐fault system” – i.e., it does not take into account any contributory actions on the part of either the employer or employee, exchanging medical and wage benefits for employer immunity from legal recourse. This system provides fundamental protection for workers who are injured as a result of their own actions, while simultaneously protecting employers from lawsuits for injuries in which the employer is responsible. The system puts the focus of all parties involved on timely treatment and recovery – a benefit to the injured party – rather than on litigation of liability.
Administration of Workers’ Compensation in Texas
The Texas Department of Insurance (TDI) is the state agency designated to oversee the workers’ compensation system in the State of Texas. The Division of Workers’ Compensation (DWC) is an established unit within the TDI that administers and operates the workers’ compensation system. The TDI Property and Casualty Division establishes the job classification relativities4 ,5 and expected loss rates to assist the National Council on Compensation Insurance (NCCI) in calculating experience modifiers4 used by insurance carriers to determine policy premiums. The DWC also provides workplace safety and health services as well as dispute resolution services by providing injured workers with an
No‐Fault System: A legal system designed to provide
standard benefits to an injured party regardless of
fault in exchange for immunity from legal liability for
the counterparty.
Workplace Safety and Cost Containment Levers 1 & 2
Classification Relativities: Job specific table of injury
relativities for determining insurance premiums. The
classification relativities table is determined by the TDI.
Experience Modifier: Applies to employers and
directly reflects an employer’s workplace safety
record including frequency and magnitude (cost) of
workplace injuries.
Workplace Safety and Cost Containment Levers:
The instruments of policy or market forces that have
an impact on outcomes. Speeding tickets, for
example, are a lever employed by law enforcement to
reduce excessive speeding and traffic fatalities.
2 All states except Texas and New Jersey mandate employer participation in their state’s workers’ compensation program. However, many states do have exemptions for small businesses, self employers, and particular job categories. For New Jersey, the restrictive nature of the opt out system has resulted in most New Jersey businesses choosing to participate in the State worker’s compensation system.
3 (US Bureau of Labor Statistics (BLS)) 4 The 2008 classification relativities table can be found on the Texas Department of Insurance (TDI) website at: http://www.tdi.state.tx.us/wc/regulation/wcrates08.html
5 For companies that operate in multiple states, the National Council on Compensation Insurance (NCCI) interstate modifiers are used.
1
Texas Workplace Injury Compensation: Analysis, Options, Impact Stradian, January 2009
ombudsman from the Office of Injured Employee Counsel (OIEC)6 to guide him or her through the resolution process.
There are four basic types of workers’ compensation benefits that are available to injured/ill workers: medical, income, death, and burial benefits7. Income benefits are gauged to the severity and differ according to the nature and duration of the injury or illness. The following is a description of the various benefits:
Medical Benefits – Employees who suffer a work‐related injury or illness receive medical care for the injury or illness for as long as necessary for full recovery until Maximum Medical Improvement (MMI).
Temporary Income Benefits (TIBs) – TIBs are income benefits paid to an employee who loses all or part of their wages for more than 7 days due to a work‐related injury or illness. TIBs are paid until the injured worker returns to work, reaches MMI, or has received 104 weeks of TIBs, whichever occurs first.
Maximum Medical Improvement: The earliest date
after which further material recovery from lasting
improvement to an injury can no longer be
reasonably anticipated. By code, MMI is also applied
at the expiration of 104 weeks from the date on
which income benefits begin to accrue.
Impairment Income Benefits (IIBs) – IIBs are income benefits paid to an employee who has sustained a permanent impairment (permanent damage to the body) from a work‐related injury or illness and who have reached MMI. For every percentage of impairment, an injured/ill employee receives three (3) weeks of IIBs. IIBs benefits expire after 401 weeks from the date of injury
Supplemental Income Benefits (SIBs) – SIBs are income benefits paid to an employee who has an impairment rating of 15 percent or more, and who has not returned to work or who has returned to work but is earning less than 80 percent of their average weekly wage prior to the injury. SIBs are paid to those injured/ill employees who have not received their IIBs in a lump sum payment. SIBs expire after 401 weeks from the date of injury.
Lifetime Income Benefits (LIBs) – LIBs are income benefits paid to employees who have sustained certain work – related injuries qualifying them for lifetime benefits – e.g., loss of sight in both eyes or loss of both hands at or above the wrist.
Death and Burial Benefits – Death benefits pay a portion of lost family income for dependent family members of employees killed on the job. Burial benefits pay for some of the deceased employee’s funeral expenses.
For injured workers, medical and wage replacement benefits are paid by workers’ compensation insurance carriers, by employers certified by the DWC to self‐insure, or by self‐insured governmental entities. Private insurers underwrite the liability for worker injuries under workers’ compensation provisions outlined in the Workers’ Compensation Act. They also provide claims management and administration functions.
Most private businesses in the State of Texas subscribe to the workers’ compensation system. Some very large employers bypass the insurance companies and operate as qualified self‐insureds as a way to manage costs. Businesses that opt to self‐insure are required by the State to prove financial stability and set aside reserves on their balance sheet. To protect assets from catastrophic loss, many self‐insured companies will purchase catastrophic loss coverage with exceptionally large limits.
6 The OIEC is an independent state agency not affiliated with the TDI. The ombudsman program assists unrepresented injured workers during DWC dispute proceedings and advocates for injured workers as a class.
7 (Texas Department of Insurance (TDI))
2
Texas Workplace Injury Compensation: Analysis, Options, Impact Stradian, January 2009
Checks and Balances
For injured workers, the workers’ compensation system is designed to provide complete medical coverage as well as adequate partial replacement of wages during the period of injury layoff. Properly designed, an injury recovery system should provide the necessary medical treatment and rehabilitation services required to return an injured worker to work in as short a time as possible.
While it is not the purpose of this report to identify the most successful or unsuccessful strategies for promoting injured worker recovery and eventual return to work, the evidence suggests that, in general, defined benefit and recovery systems have shown better success in increasing return to work rates and decreasing system abuses than earlier, less regulated systems. By offering incentives for injured workers to participate pro‐actively in their own recovery and return to work, quality benefits can be ensured while maintaining control over costs.
For employers who participate in the workers’ compensation program, insurance premiums paid are based on risk. Certain job categories are riskier than others and certain employers have better safety records than others. In Texas, the variance in risk profile for each employee by job category is determined by the TDI in its workers’ compensation job classification relativities table.
The risk is then adjusted further by an experience modifier assigned to each employer to account for their respective injury claims history. In other words, employers that offer a safer workplace are rewarded with lower workers’ compensation premiums.
From the employer perspective, the current rating system is designed to reward safe employers while penalizing those that are less safe. It provides a system of checks and balances that ensure employers institute effective safety programs and instill a culture of safety in the behavior of every employee while on the job. In addition, when major workplace injuries do occur, work‐stoppages are often employed to conduct additional inspections, investigations, and training. These work‐stoppages are costly and can lead to a significant amount of lost productivity.
The primary drawback of the “premium as enforcer” system is that it is a delayed, reactive system. The economic penalty for workplace accidents is realized by employers in future years with the adjustment in their experience modifier. Additionally, because the principle of insurance is to spread the risk among all policy holders in the insurance pool, the cost of a workplace injury is not always borne directly by every employer.
Employers do have alternatives to reduce their experience modifiers. Employers may work with their insurance carriers to determine a schedule rating based on the implementation of certain safety devices that have a documented positive impact on loss rates. Employers may also work with their insurance carriers to arrive at a negotiated experience modifier. This lever is a further adjustment to premiums paid based on an employer’s documented implementation of additional safety programs that would positively impact workplace safety.
Return to Work: Method by which an injured worker
recovers from an injury and returns to the workforce.
Workplace Safety and Cost Containment Lever 3
Defined Benefit and Recovery System: A benefits
system where a structured approach is taken to
deliver injury benefits and improve injury recovery
by a prescribed method.
Workplace Safety and Cost Containment Levers 4 & 5
Schedule Rating: A modification to premium based
on the relationship between certain physical
characteristics of the job class in question and the
possibility of loss.
Negotiated Experience Modifier: An experience
modifier negotiated directly between the employer
and insurance carrier that is a reduced modifier
based on improved loss ratios and/or improved
safety programs.
3
Texas Workplace Injury Compensation: Analysis, Options, Impact Stradian, January 2009
Recent Reforms to the Texas Workers’ Compensation System
Texas enacted the first workers’ compensation laws in 1913 with the principle that employers can choose to offer coverage to their employees. While the workers’ compensation system remained largely unchanged until the 1980s, the Texas legislature realized that reforms were necessary to deal with high injury rates, high medical costs, and high litigation costs that were driving workers’ compensation carriers out of the State. The Texas Legislature adopted the Texas Worker's Compensation Act – Senate Bill 1 – in 1989 to bring about these reforms.
Among its provisions, the Act created the Texas Workers' Compensation Commission (TWCC) to administer the workers' compensation system. The Act also improved benefit delivery and the dispute resolution process. Since rising medical costs were primarily responsible for the significant increase in Workers’ Compensation costs, the legislature called for the development of medical fee and treatment guidelines to control medical costs and limit attorneys’ fees. In addition to the development of these medical guidelines, the legislature aimed to decrease the incidence of workplace illness/injury rates by enhancing and expanding state‐administered workplace health and safety programs.
Despite the reforms of the 1989 Act, workers’ compensation medical costs continued to be significantly higher than the national average through the 1990s8 until additional rounds of reforms were enacted beginning in the early 2000s. The reforms sought at that time addressed the concerns raised by system participants about high medical costs, difficulties with access to medical care, and poor return‐to‐work outcomes.
These reforms of the early 2000s coincided with the scheduled Sunset review of TWCC in 2005 by the Sunset Advisory Commission which resulted in a series of significant legislative recommendations. In response to these Sunset recommendations and with input from system participants, the 79th Legislature adopted House Bill 7 in 2005 that detailed a number of reforms including:
Workplace Safety and Cost Containment Lever 7
Workplace Health and Safety Programs: Proactive
programs designed to create methods and actions for
ensuring safe work environments.
Workplace Safety and Cost Containment Lever 8
Healthcare Delivery Network: The redesign of the
healthcare delivery mechanism to resemble
traditional private insurance delivery networks.
Workplace Safety and Cost Containment Lever 6
Medical Fee and Treatment Guidelines: Defined
benefit and recovery system to reduce costs by
placing emphasis on state mandated treatment
guidelines and pre‐determined reimbursement
amounts for medical services thereby controlling the
use and cost of medical services.
Healthcare Delivery Networks – Following success in reducing medical costs through health networks in other states, workers’ compensation health care delivery networks were formed to improve the quality of medical care, reduce costs, and introduce more efficient cost containment measures. With the creation of these networks, the Division’s Approved Doctors’ List was abolished.
Creation of the DWC – The administration of the workers’ compensation system was transferred to the DWC at the TDI following the closing of the TWCC.
Creation of the OIEC – The OIEC was created to assist unrepresented injured workers during DWC dispute proceedings.
Administrative Improvements – A number of administrative changes were developed to streamline medical and income benefit dispute resolution processes and enhance continual improvements in return‐to‐work rates in Texas.
8 (National Council on Compensation Insurance (NCCI) Holdings, Inc.)
4
Texas Workplace Injury Compensation: Analysis, Options, Impact Stradian, January 2009
The impact of the 2005 reforms on workers’ compensation system cost, benefits administration and adequacy, and injured workers’ outcomes are expected to emerge in the coming years as data becomes available. The recent changes are expected to bring about a reduction in medical costs as medical services are integrated through these new healthcare delivery networks. These reforms are also expected to improve return to work rates, reducing loss time costs, and overall system costs.
The foregoing discussion applies to subscribers to the Texas workers’ compensation system; however, 1 in 4 Texas employees9 is working for an employer who does not subscribe to the workers’ compensation system. Injury and illness recovery of workers not covered by workers’ compensation insurance is managed through other employer‐defined arrangements. The difficulty in obtaining data on injured workers in non‐subscribing companies – in terms of costs, benefits, and return to work rates – makes it a challenge to compare their outcomes to injured workers whose employers are subscribers to the workers’ compensation system.
Policy Benefits to State Economic Development
A good workers’ compensation system can provide significant economic and social benefits to the health of the State’s overall economy. By providing medical treatment and income replacement to injured workers, Texans can rest assured that mortgages can continue to be paid and families will not be displaced as a result of an unfortunate workplace injury or illness. At the same time, a properly administered return‐to‐work program also benefits employers by curtailing productivity losses resulting from protracted leaves of absence due to workplace injury or illness.
The liability immunity that the workers’ compensation statute provides Texas employers also provides significant benefit to the Texas economy by lowering the frictional cost of defending and prosecuting liability litigation. In certain extraordinary instances, liability immunity could also be credited for preventing layoffs and/or bankruptcy that would possibly result from a severe legal judgment against a small or mid‐sized Texas company. The resulting savings are passed on to employees, direct customers, and ultimately to end consumers.
Complex Work Environments in a Dynamic Economy
The current worker’s compensation system creates a closed loop system of recourse for workers injured on the job, regardless of whether fault lies with the employee or the employer. This system, however, inadequately addresses the demands of a more integrated and dynamic economy with complex work environments, where multiple employers may be involved in working on the same job‐site.
Texas workers’ compensation law does allow 3rd party immunity where a primary employer – e.g., a general contractor – administers and pays directly for each covered employee’s workers’ compensation premium. However, because of the costs associated with administering this type of program, this structure is used only in rare occasions where the size of the operation is large enough to render the administrative costs effective. In other words, the administrative burden required to implement this particular structure makes it a minimally exercised solution. In addition, the immunity protections granted to the payer of the workers’ compensation premiums is not afforded universally to all non‐associated subcontractors participating at the same job‐site (See Appendix B for legal review of code and case history).
Frictional Cost: A cost borne by the system that
provides limited economic benefit.
Closed Loop System: A system in which injured workers
receive standard workers compensation benefits in
exchange for granting employers immunity from legal
liability.
Complex Work Environment: A job‐site where
multiple employers work side‐by‐side on a daily basis.
Job‐Site: The location where work is performed.
9 (Texas Department of Insurance (TDI))
5
Texas Workplace Injury Compensation: Analysis, Options, Impact Stradian, January 2009
Thus, the majority of workers’ compensation job‐site structures fall under the closed loop system described above. The discussion below describes a “normal” working environment in which each employer pays its own workers’ compensation premiums.
In some industries such construction and oil and gas drilling, multiple employers are engaged at the same job‐site and employ workers performing side‐by‐side duties. A typical construction project, for example, involves multiple subcontractors who have been hired by the general contractor or the developer to complete specific tasks. Employees of subcontractors are not considered the employees of the general contractor, developer, or owner. Thus while workers’ compensation provides a subcontractor protection from liability litigation by its own employee, the same protection does not accrue to any other employer on the job‐site.
To illustrate, an injured worker on a construction site is entitled to collect workers’ compensation benefits from his or her employer. Under the workers’ compensation agreement between employer and employee, this particular injured worker cannot initiate legal action against his/her direct employer. However, if he/she has cause to believe that the injury or illness was the direct result of any other employer engaged at the job‐site, the injured worker can initiate legal action. If the injured worker is not a direct employee of the general contractor or owner, the latter can be the target of a 3rd party action as well.
Workplace Safety and Cost Containment Lever 9
3rd Party Action: A lawsuit filed by an injured worker
against a party other than their direct employer in
order to recover compensation for their injury.
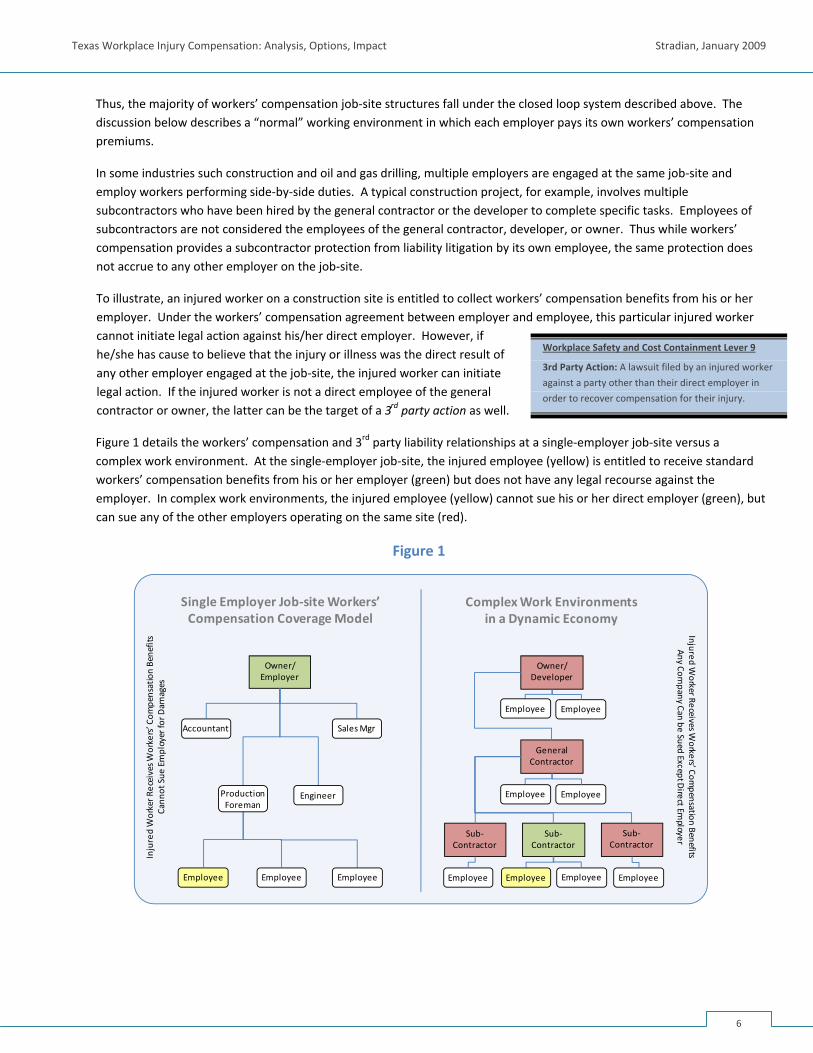
Figure 1 details the workers’ compensation and 3rd party liability relationships at a single‐employer job‐site versus a complex work environment. At the single‐employer job‐site, the injured employee (yellow) is entitled to receive standard workers’ compensation benefits from his or her employer (green) but does not have any legal recourse against the employer. In complex work environments, the injured employee (yellow) cannot sue his or her direct employer (green), but can sue any of the other employers operating on the same site (red).
Figure 1
Owner/Employer
Single Employer Job‐site Workers’ Compensation Coverage Model
Owner/Developer
General Contractor
Sub‐Contractor
Sub‐Contractor
Sub‐Contractor
Complex Work Environments in a Dynamic Economy
Employee Employee
Accountant Sales Mgr
Engineer
Employee Employee Employee
Production Foreman
Employee Employee
Employee EmployeeEmployee Employee
Injured Worker R
eceives W
orkers’ Com
pensation Benefits
Cann
ot Sue
Employer for D
amages
Injured Worker Receives W
orkers’ Compensation Benefits
Any Company Can be Sued Except D
irect Employer
6
Texas Workplace Injury Compensation: Analysis, Options, Impact Stradian, January 2009
In the case of an injury occurring as the result of the actions of a non‐related party, the system loses a significant amount of efficiency and effectiveness in dealing with workplace injuries. The system’s statutory protections for employers or property owners also begin to breakdown when 3rd party actors are involved.
For complex work environments, this limitation of the workers’ compensation statute poses many risk management challenges and creates a significant amount of frictional costs. Regardless of whether workers’ compensation insurance is available to the injured worker, immunity from legal liability does not extend beyond the injured worker’s direct employer. Under the current system, 3rd party liability claims are managed through each employer’s general liability or multi‐peril policy. Because liability for 3rd party injuries are not actuarially defined, frictional gaps exist for both the safety management of on‐site 3rd party participants and the level of general liability coverage needed – e.g., any individual claim could result in a liability payout of between zero and tens of millions of dollars.
On an industrial scale, large, complex projects involving multiple entities expose each participant to liability from workers not defined as their direct employees. Each company seeks to protect itself against 3rd party lawsuits by purchasing general liability insurance and/or requiring contractual indemnity protection from their business partners and subcontractors.
The impact of 3rd party lawsuits is also felt on a smaller scale. Individual homeowners and small business owners are especially at risk of 3rd party injury lawsuits resulting from the home or business becoming a temporary job‐site where non‐related workers are present. Employers that subscribe to the workers’ compensation system are protected from employee litigation if one of their employees slips and falls in the process of a home renovation or on‐site small business repair. However, the homeowner or small business owner may become the subject of litigation from the injured employee. While not part of this study, the potential impact and consequences of this litigation hazard are significant.
The threat of litigation increases a project’s cost as different entities in the hierarchy purchase multiple liability policies. As a result, the direct effect is an overall increase in the cost of insuring a job‐site, and the indirect effect is an increase in legal and administrative costs due to stringent scrutiny of contractual and insurance provisions with multiple layers of coverage. These increased project costs are eventually passed on to the end consumer, resulting in unnecessarily higher prices for goods and services.
7
Texas Workplace Injury Compensation: Analysis, Options, Impact Stradian, January 2009
COST IMPACT OF WORK RELATED INJURIES The most effective cost management tool for workplace injuries is prevention. The safe workplace benefits from lower insurance premiums and higher productivity. In 2007, however, subscribers paid roughly $2.5 Billion in premiums10. Third party lawsuits arising from workplace injuries added an estimated $0.24 Billion in cost on just under 400 cases11.
Managing work related injuries and illnesses represent a significant cost of doing business in the State of Texas. The Texas workers’ compensation system provides for the following remedies to an employee who suffers a workplace injury or illness:
1. Employees Covered by Workers’ Compensation: a. Statutory Medical and Wage Benefits – For injured employees whose employer subscribes to the Texas
workers’ compensation system – and becomes injured or ill as a result of their own actions or the actions of their employer – the injured employee’s sole remedy for compensation is limited to the statutory medical and income benefits of the Texas workers’ compensation system.
b. Legal Claim due to Intentional Act or Assault – In the case an employee is injured as a result of an intentional act by an employer or an assault committed by another employee that is directly attributable to the employer, an employee covered by workers’ compensation may pursue legal action against an employer.
c. Wrongful Death Claims – In the case of a workplace death, the family of the deceased has the right to sue the employer when the death was caused by gross negligence or the intentional act of the employer.
d. Legal Claim Against 3rd Party Cause of Injury or Illness – In cases where an employee suffers a workplace injury or illness attributable to an entity that is not the direct employer, the employee may pursue legal action against parties allegedly at fault.
2. Employees Not Covered by Workers’ Compensation: a. No Benefits – For injured employees whose employer is a non‐subscriber to the Texas workers’
compensation system and becomes injured or ill while at the workplace, the employer is under no legal obligation to provide medical or wage benefits to workers injured at the workplace. Some workers may receive no benefits as a result of a workplace injury.
b. Medical and Wage Benefits – For injured employees whose employer is a non‐subscriber to the Texas workers’ compensation system and becomes injured or ill while at the workplace, the injured employee may receive medical treatment or supplemental lost wage income provided by their employer.
c. Wrongful Death Claims – In the case of a workplace death, the family of the deceased has the right to sue the employer regardless of the death benefits provided by the employer.
d. Legal Claim Against Employer or 3rd Party – Any work‐related injury or illness suffered by an employee whose employer is a non‐subscriber to the Texas workers’ compensation system, the employee retains the right to pursue legal action against their employer or a 3rd party actor12.
10 (Texas Department of Insurance (TDI)) 11 Stradian analysis of Closed Claim Surveys from (Texas Department of Insurance (TDI)). Third Party Lawsuit figures for 2007 are estimates. 12 Some non‐subscribers limit their liability through ERISA plans or through the use of post‐injury liability waivers and binding arbitration agreements.
8
Texas Workplace Injury Compensation: Analysis, Options, Impact Stradian, January 2009
The Texas Workers’ Compensation System: Freedom of Choice
The Texas Workers’ Compensation system, along with New Jersey, is unique among its peers as the only systems in the nation that do not mandate compulsory participation by all employers13. This option system provides freedom of choice for both employer and employee to: participate in the statutory workers’ compensation system; or to create or participate in a customized program. Because of this dynamic, the statutory workers’ compensation system in the State of Texas represents a much smaller component of the state’s economy than in other states.
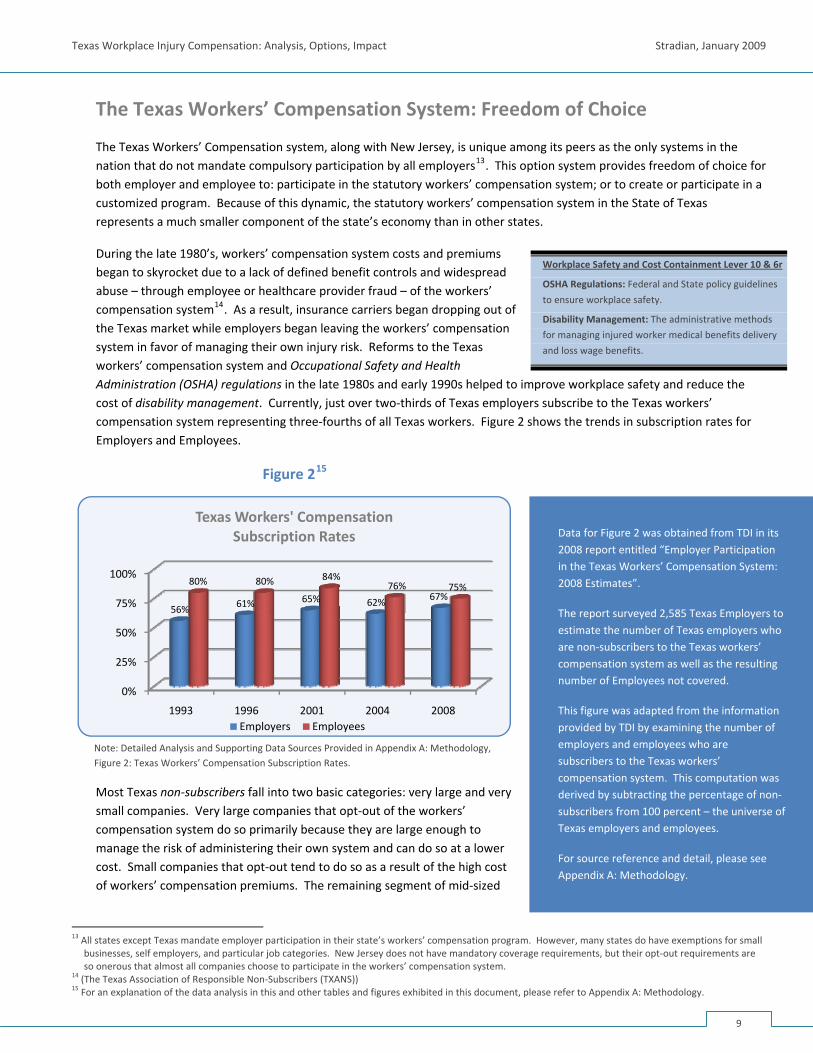
During the late 1980’s, workers’ compensation system costs and premiums began to skyrocket due to a lack of defined benefit controls and widespread abuse – through employee or healthcare provider fraud – of the workers’ compensation system14. As a result, insurance carriers began dropping out of the Texas market while employers began leaving the workers’ compensation system in favor of managing their own injury risk. Reforms to the Texas workers’ compensation system and Occupational Safety and Health Administration (OSHA) regulations in the late 1980s and early 1990s helped to improve workplace safety and reduce the cost of disability management. Currently, just over two‐thirds of Texas employers subscribe to the Texas workers’ compensation system representing three‐fourths of all Texas workers. Figure 2 shows the trends in subscription rates for Employers and Employees.
Workplace Safety and Cost Containment Lever 10 & 6r
OSHA Regulations: Federal and State policy guidelines
to ensure workplace safety.
Disability Management: The administrative methods
for managing injured worker medical benefits delivery
and loss wage benefits.
Data for Figure 2 was obtained from TDI in its 2008 report entitled “Employer Participation in the Texas Workers’ Compensation System: 2008 Estimates”.
The report surveyed 2,585 Texas Employers to estimate the number of Texas employers who are non‐subscribers to the Texas workers’ compensation system as well as the resulting number of Employees not covered.
This figure was adapted from the information provided by TDI by examining the number of employers and employees who are subscribers to the Texas workers’ compensation system. This computation was derived by subtracting the percentage of non‐subscribers from 100 percent – the universe of Texas employers and employees.
For source reference and detail, please see Appendix A: Methodology.
Figure 215
0%
25%
50%
75%
100%
1993 1996 2001 2004 2008
56% 61% 65% 62% 67%
80% 80% 84%76% 75%
Texas Workers' Compensation Subscription Rates
Employers Employees Note: Detailed Analysis and Supporting Data Sources Provided in Appendix A: Methodology, Figure 2: Texas Workers’ Compensation Subscription Rates.
Most Texas non‐subscribers fall into two basic categories: very large and very small companies. Very large companies that opt‐out of the workers’ compensation system do so primarily because they are large enough to manage the risk of administering their own system and can do so at a lower cost. Small companies that opt‐out tend to do so as a result of the high cost of workers’ compensation premiums. The remaining segment of mid‐sized
13 All states except Texas mandate employer participation in their state’s workers’ compensation program. However, many states do have exemptions for small
businesses, self employers, and particular job categories. New Jersey does not have mandatory coverage requirements, but their opt‐out requirements are so onerous that almost all companies choose to participate in the workers’ compensation system.
14 (The Texas Association of Responsible Non‐Subscribers (TXANS)) 15 For an explanation of the data analysis in this and other tables and figures exhibited in this document, please refer to Appendix A: Methodology.
9
Texas Workplace Injury Compensation: Analysis, Options, Impact Stradian, January 2009
companies accounts for the bulk of subscribers to the workers’ compensation system in the State of Texas.
Over a 15‐year period, subscription rates among Texas employers increased from 56 percent in 1993 to 67 percent in 2008. Over the same period, the number of Texas workers covered by workers’ compensation has decreased from 80 percent to 75 percent. The trends indicate growth in very large companies becoming non‐subscribers.
The remainder of this report will focus on subscribers to the Texas workers’ compensation system.
Workers’ Compensation System Cost Comparison: Texas, Florida, and California
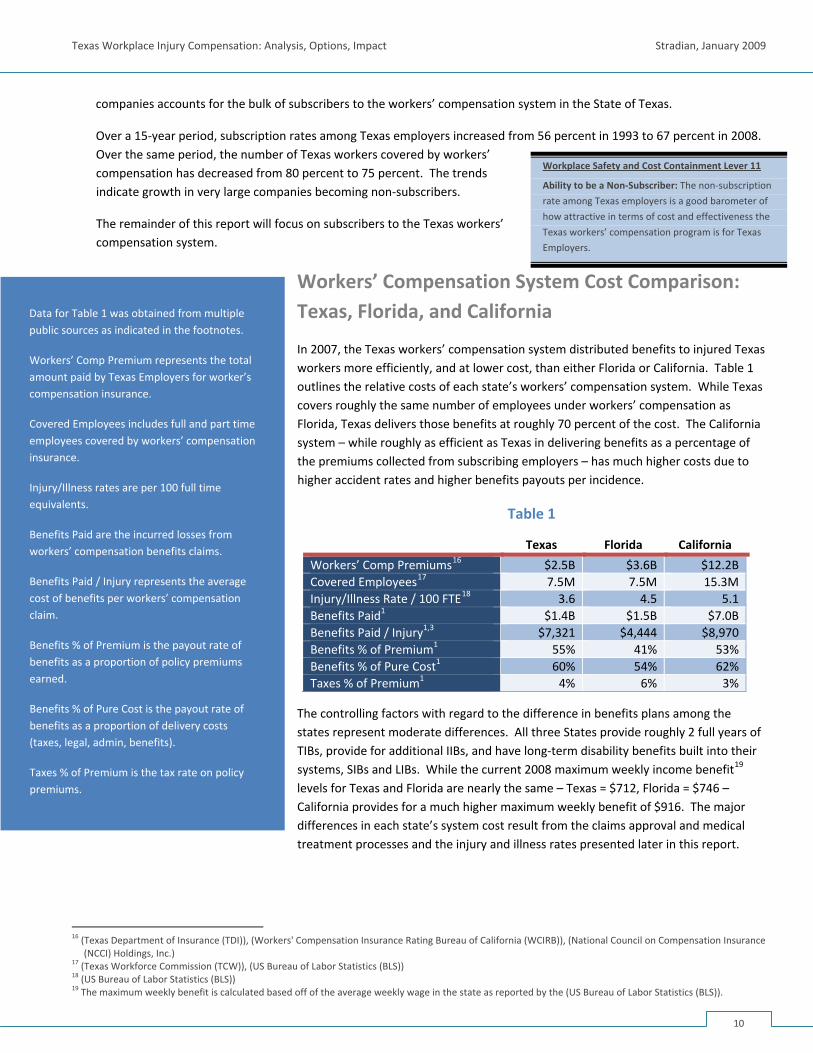
In 2007, the Texas workers’ compensation system distributed benefits to injured Texas workers more efficiently, and at lower cost, than either Florida or California. Table 1 outlines the relative costs of each state’s workers’ compensation system. While Texas covers roughly the same number of employees under workers’ compensation as Florida, Texas delivers those benefits at roughly 70 percent of the cost. The California system – while roughly as efficient as Texas in delivering benefits as a percentage of the premiums collected from subscribing employers – has much higher costs due to higher accident rates and higher benefits payouts per incidence.
Table 1
Texas Florida California
Workers’ Comp Premiums16 $2.5B $3.6B $12.2BCovered Employees17 7.5M 7.5M 15.3MInjury/Illness Rate / 100 FTE18 3.6 4.5 5.1Benefits Paid1 $1.4B $1.5B $7.0BBenefits Paid / Injury1,3 $7,321 $4,444 $8,970Benefits % of Premium1 55% 41% 53%Benefits % of Pure Cost1 60% 54% 62%Taxes % of Premium1 4% 6% 3%
The controlling factors with regard to the difference in benefits plans among the states represent moderate differences. All three States provide roughly 2 full years of TIBs, provide for additional IIBs, and have long‐term disability benefits built into their systems, SIBs and LIBs. While the current 2008 maximum weekly income benefit19 levels for Texas and Florida are nearly the same – Texas = $712, Florida = $746 – California provides for a much higher maximum weekly benefit of $916. The major differences in each state’s system cost result from the claims approval and medical treatment processes and the injury and illness rates presented later in this report.
Workplace Safety and Cost Containment Lever 11
Ability to be a Non‐Subscriber: The non‐subscription
rate among Texas employers is a good barometer of
how attractive in terms of cost and effectiveness the
Texas workers’ compensation program is for Texas
Employers.
Data for Table 1 was obtained from multiple public sources as indicated in the footnotes.
Workers’ Comp Premium represents the total amount paid by Texas Employers for worker’s compensation insurance.
Covered Employees includes full and part time employees covered by workers’ compensation insurance.
Injury/Illness rates are per 100 full time equivalents.
Benefits Paid are the incurred losses from workers’ compensation benefits claims.
Benefits Paid / Injury represents the average cost of benefits per workers’ compensation claim.
Benefits % of Premium is the payout rate of benefits as a proportion of policy premiums earned.
Benefits % of Pure Cost is the payout rate of benefits as a proportion of delivery costs (taxes, legal, admin, benefits).
Taxes % of Premium is the tax rate on policy premiums.
16 (Texas Department of Insurance (TDI)), (Workers' Compensation Insurance Rating Bureau of California (WCIRB)), (National Council on Compensation Insurance
(NCCI) Holdings, Inc.) 17 (Texas Workforce Commission (TCW)), (US Bureau of Labor Statistics (BLS)) 18 (US Bureau of Labor Statistics (BLS)) 19 The maximum weekly benefit is calculated based off of the average weekly wage in the state as reported by the (US Bureau of Labor Statistics (BLS)).
10
Texas Workplace Injury Compensation: Analysis, Options, Impact Stradian, January 2009
Economic Impact of Workplace Injury and Illness on Texas Subscribers
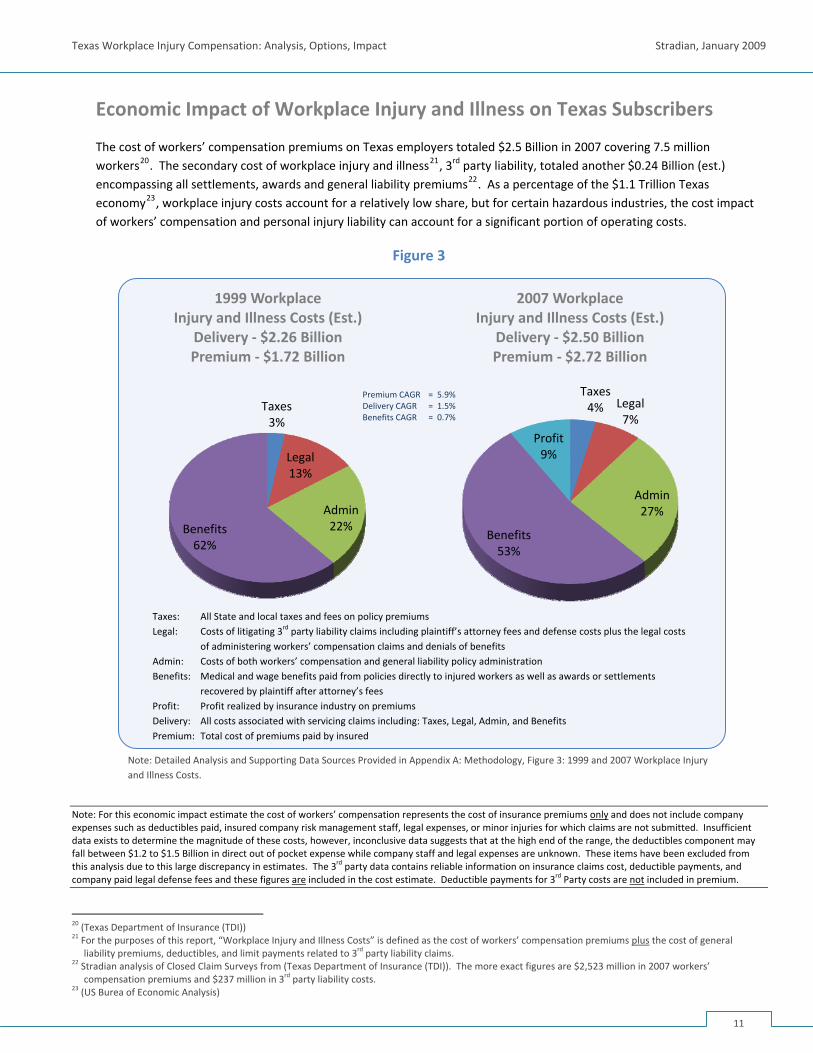
The cost of workers’ compensation premiums on Texas employers totaled $2.5 Billion in 2007 covering 7.5 million workers20. The secondary cost of workplace injury and illness21, 3rd party liability, totaled another $0.24 Billion (est.) encompassing all settlements, awards and general liability premiums22. As a percentage of the $1.1 Trillion Texas economy23, workplace injury costs account for a relatively low share, but for certain hazardous industries, the cost impact of workers’ compensation and personal injury liability can account for a significant portion of operating costs.
Figure 3
Taxes3%
Legal13%
Admin22%Benefits
62%
1999 Workplace Injury and Illness Costs (Est.)
Delivery ‐ $2.26 BillionPremium ‐ $1.72 Billion
Taxes4% Legal
7%
Admin27%
Benefits53%
Profit9%
2007 Workplace Injury and Illness Costs (Est.)
Delivery ‐ $2.50 BillionPremium ‐ $2.72 Billion
Premium CAGR = 5.9% Delivery CAGR = 1.5% Benefits CAGR = 0.7%
Taxes: All State and local taxes and fees on policy premiums Legal: Costs of litigating 3rd party liability claims including plaintiff’s attorney fees and defense costs plus the legal costs
of administering workers’ compensation claims and denials of benefits Admin: Costs of both workers’ compensation and general liability policy administration Benefits: Medical and wage benefits paid from policies directly to injured workers as well as awards or settlements
recovered by plaintiff after attorney’s fees Profit: Profit realized by insurance industry on premiums Delivery: All costs associated with servicing claims including: Taxes, Legal, Admin, and Benefits Premium: Total cost of premiums paid by insured
Note: Detailed Analysis and Supporting Data Sources Provided in Appendix A: Methodology, Figure 3: 1999 and 2007 Workplace Injury and Illness Costs.
Note: For this economic impact estimate the cost of workers’ compensation represents the cost of insurance premiums only and does not include company expenses such as deductibles paid, insured company risk management staff, legal expenses, or minor injuries for which claims are not submitted. Insufficient data exists to determine the magnitude of these costs, however, inconclusive data suggests that at the high end of the range, the deductibles component may fall between $1.2 to $1.5 Billion in direct out of pocket expense while company staff and legal expenses are unknown. These items have been excluded from this analysis due to this large discrepancy in estimates. The 3rd party data contains reliable information on insurance claims cost, deductible payments, and company paid legal defense fees and these figures are included in the cost estimate. Deductible payments for 3rd Party costs are not included in premium.
20 (Texas Department of Insurance (TDI)) 21 For the purposes of this report, “Workplace Injury and Illness Costs” is defined as the cost of workers’ compensation premiums plus the cost of general
liability premiums, deductibles, and limit payments related to 3rd party liability claims. 22 Stradian analysis of Closed Claim Surveys from (Texas Department of Insurance (TDI)). The more exact figures are $2,523 million in 2007 workers’
compensation premiums and $237 million in 3rd party liability costs. 23 (US Burea of Economic Analysis)
11
Texas Workplace Injury Compensation: Analysis, Options, Impact Stradian, January 2009
Figure 3 shows the change in workplace injury and illness cost to Texas businesses between 1999 and 2007. During the 8‐year study period, premiums increased an average of 5.9 percent per year while benefits, awards, and settlements accrued
to injured workers increased at only a 0.7 percent annual rate. Part of this dynamic is due to a combined ratio of greater than 1.0 during the late 1990s and early 2000s. Statewide profitability in workers’ compensation underwriting did not re‐emerge until 200424 and general liability underwriting for 3rd party liability did not show profitability again until 200625.
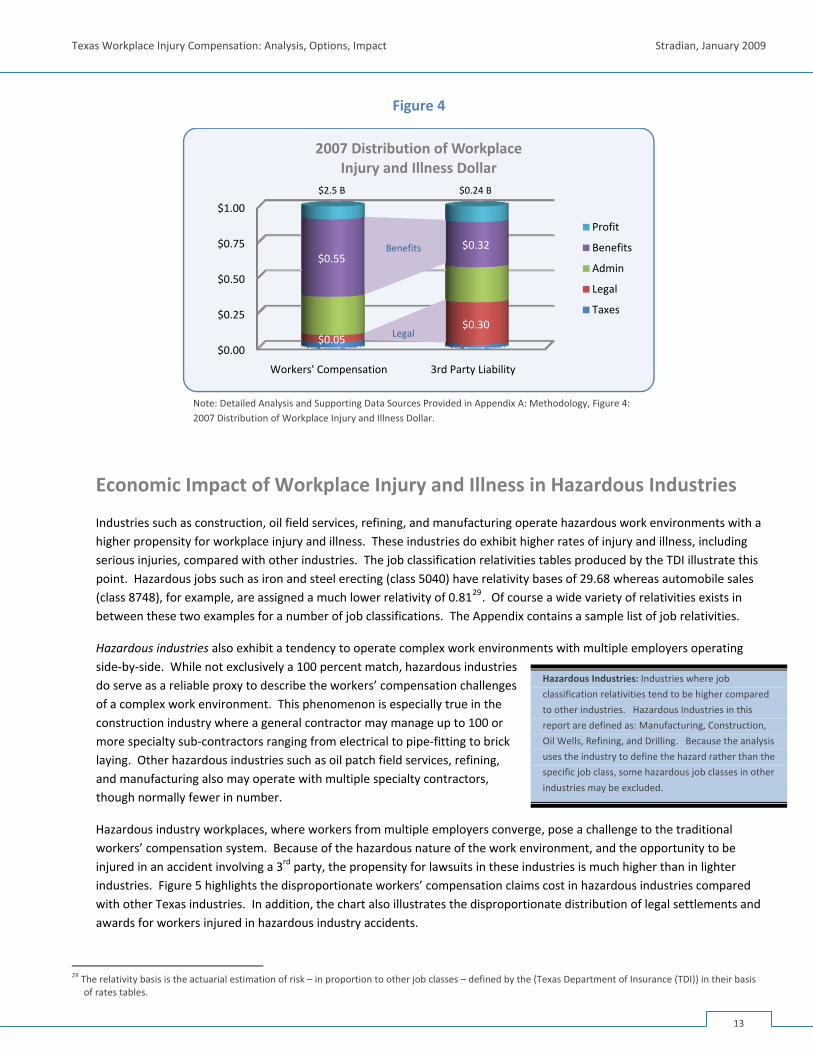
The charts in Figure 3 illustrate the composite breakdown of both workers’ compensation costs and benefits, as well as the costs and benefits for 3rd party liability claims26. The relative share of 3rd party liability was 13 percent in 1999 and 6 percent in 200727. However, only 32 cents of each dollar spent on 3rd party liability claims actually benefits the injured worker, whereas 55 cents of every workers’ compensation dollar spent benefits the injured worker27. Figure 4 breaks down these distributions by workers’ compensation and 3rd party liability27.
It is important to note the inefficiency of the 3rd party liability system. As a share of total dollars spent, the benefit that injured workers actually receive via 3rd party litigation is significantly less than their share of each workers’ compensation dollar. This high frictional cost is due to higher administrative costs and significantly higher legal fees resulting from defense and plaintiff’s fees28. In other words, the plaintiff or injured worker receives a very small portion of the total amount spent on their lawsuit as compensation for their injury.
Data for Figure 3 and Figure 4 was obtained from the TDI.
Workers’ compensation cost information was derived from the “Insurance Expense Exhibit Books” provided by TDI on their website. This data is factual and unaltered in the conduct of this analysis.
Third Party Liability costs are an estimate based on available data. Data sources include the “Insurance Expense Exhibit Books” to determine General Liability and Multi‐peril policy ratios.
These policy ratios are then applied to awards and settlement costs obtained from the Closed Claim Surveys for 1999 and estimated for 2007 based off of data for 2004 and 2005.
The Closed Claim Surveys were compiled into a database. The database was then pared down utilizing the following filters:
Injuries occurring in Texas General Liability or Multi‐peril
claims Employed while inju
3rd Party Liability System Inefficiency 1
Return on Dollar Spend: Only a small portion – 32
percent – of the money spent on 3rd Party Liability
claims actually benefits the injured worker compared
to 55 percent for workers’ compensation spend.
Combined Ratio: Insurance industry term used to
describe the profitability of a particular line of
underwriting business generally described as: (Incurred
Losses + Expenses) ÷ Earned Premiums.
red
nsation available to
Plaintiff’s attorney fees = 40%
ure
r dollar to develop the graphic in Figure 4 .
tail, please see
Injured on the job Workers’ compe
injured worker
The estimate for 3rd party liability claims and actual workers’ compensation data were then consolidated to produce the graphics in Fig3. These costs for each source – workers’ compensation or 3rd party liability – were then factored as cents pe
For source reference and de
24 Profitability on an accident year basis re‐emerged in 2002. 25 (National Association of Insurance Commissioners (NAIC)) 26 The cost of 3rd party liability claims is an estimate because no direct actual data exists. Please see Appendix A: Methodology for assumptions and explanation of methodology. Cost data for workers’ compensation are actual data.
27 Stradian analysis of Closed Claim Surveys from (Texas Department of Insurance (TDI)). 28 Plaintiff’s Attorney fees are traditionally calculated as a percentage of the total settlement or award. In our models we have used an attorney’s fee structure of 40 percent.
12
Texas Workplace Injury Compensation: Analysis, Options, Impact Stradian, January 2009
Figure 4
$0.00
$0.25
$0.50
$0.75
$1.00
Workers' Compensation 3rd Party Liability
$0.05 $0.30
$0.55 $0.32
2007 Distribution of WorkplaceInjury and Illness Dollar
Profit
Benefits
Admin
Legal
Taxes
$2.5 B $0.24 B
Benefits
Legal
Note: Detailed Analysis and Supporting Data Sources Provided in Appendix A: Methodology, Figure 4: 2007 Distribution of Workplace Injury and Illness Dollar.
Economic Impact of Workplace Injury and Illness in Hazardous Industries
Industries such as construction, oil field services, refining, and manufacturing operate hazardous work environments with a higher propensity for workplace injury and illness. These industries do exhibit higher rates of injury and illness, including serious injuries, compared with other industries. The job classification relativities tables produced by the TDI illustrate this point. Hazardous jobs such as iron and steel erecting (class 5040) have relativity bases of 29.68 whereas automobile sales (class 8748), for example, are assigned a much lower relativity of 0.8129. Of course a wide variety of relativities exists in between these two examples for a number of job classifications. The Appendix contains a sample list of job relativities.
Hazardous industries also exhibit a tendency to operate complex work environments with multiple employers operating side‐by‐side. While not exclusively a 100 percent match, hazardous industries do serve as a reliable proxy to describe the workers’ compensation challenges of a complex work environment. This phenomenon is especially true in the construction industry where a general contractor may manage up to 100 or more specialty sub‐contractors ranging from electrical to pipe‐fitting to brick laying. Other hazardous industries such as oil patch field services, refining, and manufacturing also may operate with multiple specialty contractors, though normally fewer in number.
Hazardous Industries: Industries where job
classification relativities tend to be higher compared
to other industries. Hazardous Industries in this
report are defined as: Manufacturing, Construction,
Oil Wells, Refining, and Drilling. Because the analysis
uses the industry to define the hazard rather than the
specific job class, some hazardous job classes in other
industries may be excluded.
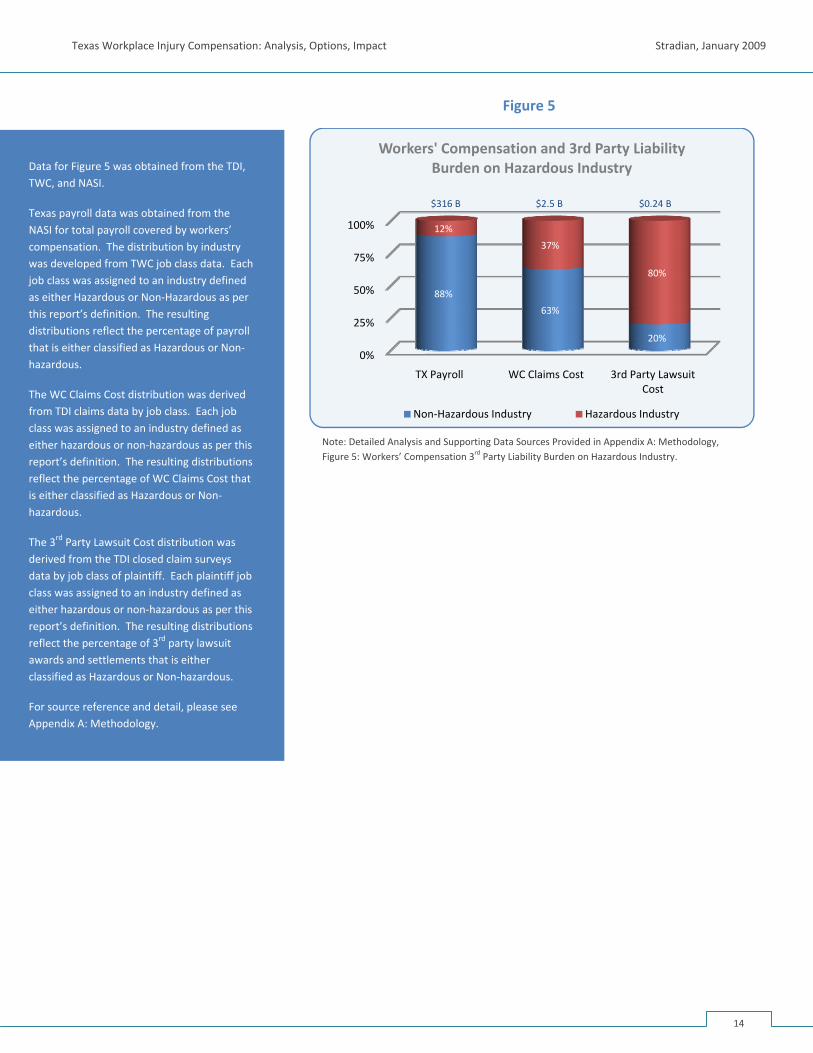
Hazardous industry workplaces, where workers from multiple employers converge, pose a challenge to the traditional workers’ compensation system. Because of the hazardous nature of the work environment, and the opportunity to be injured in an accident involving a 3rd party, the propensity for lawsuits in these industries is much higher than in lighter industries. Figure 5 highlights the disproportionate workers’ compensation claims cost in hazardous industries compared with other Texas industries. In addition, the chart also illustrates the disproportionate distribution of legal settlements and awards for workers injured in hazardous industry accidents.
29 The relativity basis is the actuarial estimation of risk – in proportion to other job classes – defined by the (Texas Department of Insurance (TDI)) in their basis
of rates tables.
13
Texas Workplace Injury Compensation: Analysis, Options, Impact Stradian, January 2009
Figure 5
0%
25%
50%
75%
100%
TX Payroll WC Claims Cost 3rd Party Lawsuit Cost
88%
63%
20%
12%
37%
80%
Workers' Compensation and 3rd Party Liability Burden on Hazardous Industry
Non‐Hazardous Industry Hazardous Industry
Data for Figure 5 was obtained from the TDI, TWC, and NASI.
Texas payroll data was obtained from the NASI for total payroll covered by workcompensation. The distribution by industry was developed from TWC job class data. Each job class was assigned to an industry defined as either Hazardous or Non‐Hazardous as per this report’s definition. The resulting distributions reflect the percentage of payroll that is either classified as Hazardous or Non‐hazardous.
$316 B $2.5 B $0.24 B
ers’
r this
The WC Claims Cost distribution was derived from TDI claims data by job class. Each job class was assigned to an industry defined as either hazardous or non‐hazardous as per this report’s definition. The resulting distributions reflect the percentage of WC Claims Cost that is either classified as Hazardous or Non‐hazardous.
The 3rd Party Lawsuit Cost distribution was derived from the TDI closed claim surveys data by job class of plaintiff. Each plaintiff job class was assigned to an industry defined as either hazardous or non‐hazardous as pereport’s definition. The resulting distributions reflect the percentage of 3rd party lawsuit awards and settlements that is either classified as Hazardous or Non‐hazardous.
For source reference and detail, please see Appendix A: Methodology.
Note: Detailed Analysis and Supporting Data Sources Provided in Appendix A: Methodology, Figure 5: Workers’ Compensation 3rd Party Liability Burden on Hazardous Industry.
14
Texas Workplace Injury Compensation: Analysis, Options, Impact Stradian, January 2009
WORK RELATED INJURY PROFILE Workplace safety and health standards are desgined to reduce the occurrence of personal injury and illness in the workplace. Occupational injury/illness rates increased in both number and severity throughout the 1970s and 1980s. The increases in accident rates prompted OSHA to intensify enforcement and education programs aimed at reducing injury rates (especially in hazardous industries). The primary benefit from these programs was a significant decline in injury/illness rates.
Improving workplace safety also impacts the cost of workers’ compensation insurance through a reduction of the direct cost of injuries – e.g., loss wage payments and medical care expenses. Safe workplaces also benefit from reductions in indirect costs – e.g., lost productivity and the cost of hiring or training overtime or temporary replacement workers. While there are a number of factors that determine the workers’ compensation system cost, injury/illness rates continue to have a significant impact – more injuries means higher cost.
Workplace Safety30
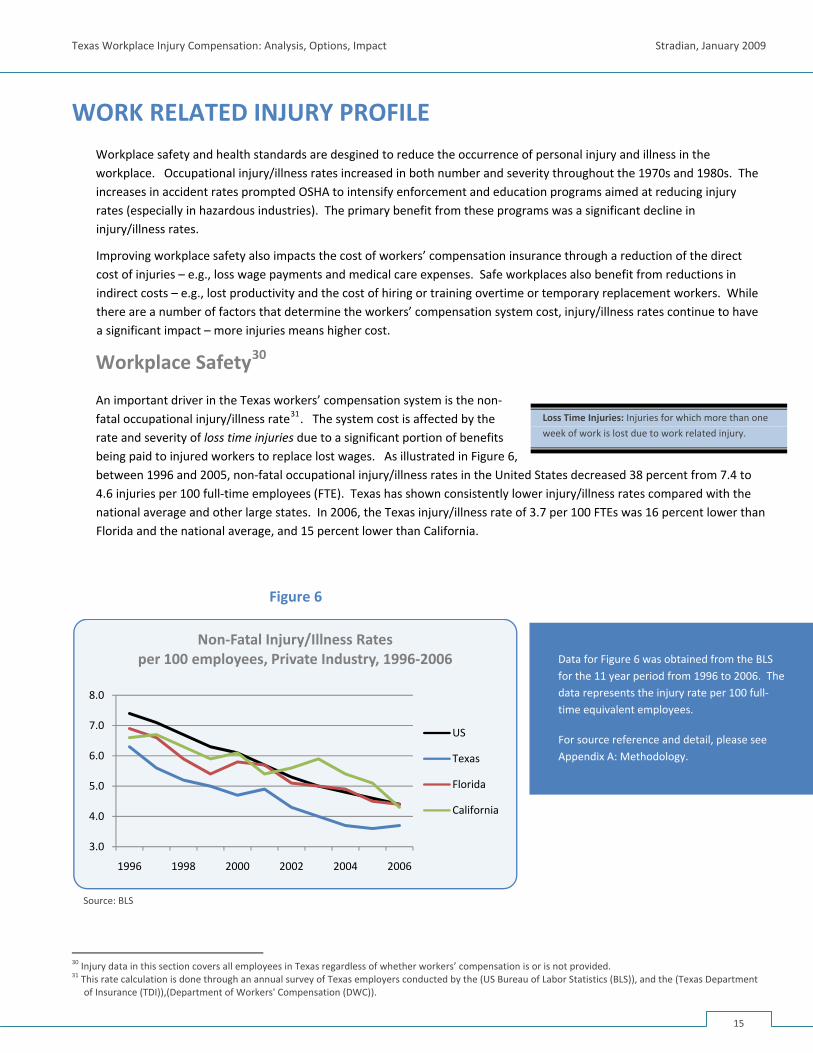
An important driver in the Texas workers’ compensation system is the non‐fatal occupational injury/illness rate31. The system cost is affected by the rate and severity of loss time injuries due to a significant portion of benefits being paid to injured workers to replace lost wages. As illustrated in Figure 6, between 1996 and 2005, non‐fatal occupational injury/illness rates in the United States decreased 38 percent from 7.4 to 4.6 injuries per 100 full‐time employees (FTE). Texas has shown consistently lower injury/illness rates compared with the national average and other large states. In 2006, the Texas injury/illness rate of 3.7 per 100 FTEs was 16 percent lower than Florida and the national average, and 15 percent lower than California.
Loss Time Injuries: Injuries for which more than one
week of work is lost due to work related injury.
Figure 6
3.0
4.0
5.0
6.0
7.0
8.0
1996 1998 2000 2002 2004 2006
Non‐Fatal Injury/Illness Rates per 100 employees, Private Industry, 1996‐2006
US
Texas
Florida
California
Data for Figure 6 was obtained from the BLS for the 11 year period from 1996 to 2006. The data represents the injury rate per 100 full‐time equivalent employees.
For source reference and detail, please see Appendix A: Methodology.
Source: BLS
30 Injury data in this section covers all employees in Texas regardless of whether workers’ compensation is or is not provided. 31 This rate calculation is done through an annual survey of Texas employers conducted by the (US Bureau of Labor Statistics (BLS)), and the (Texas Department
of Insurance (TDI)),(Department of Workers' Compensation (DWC)).
15
Texas Workplace Injury Compensation: Analysis, Options, Impact Stradian, January 2009
Hazardous industries have a higher risk of workplace injury and illness. They reported an illness/injury rate of 4.3 per 100 FTEs compared to 2.6 per 100 FTEs in non‐hazardous industries32 While these industries represent only 12 percent of payroll costs in the state of Texas, they represent 29 percent of non‐fatal occupational injury/illness cases (approximately 72,000 cases per year).
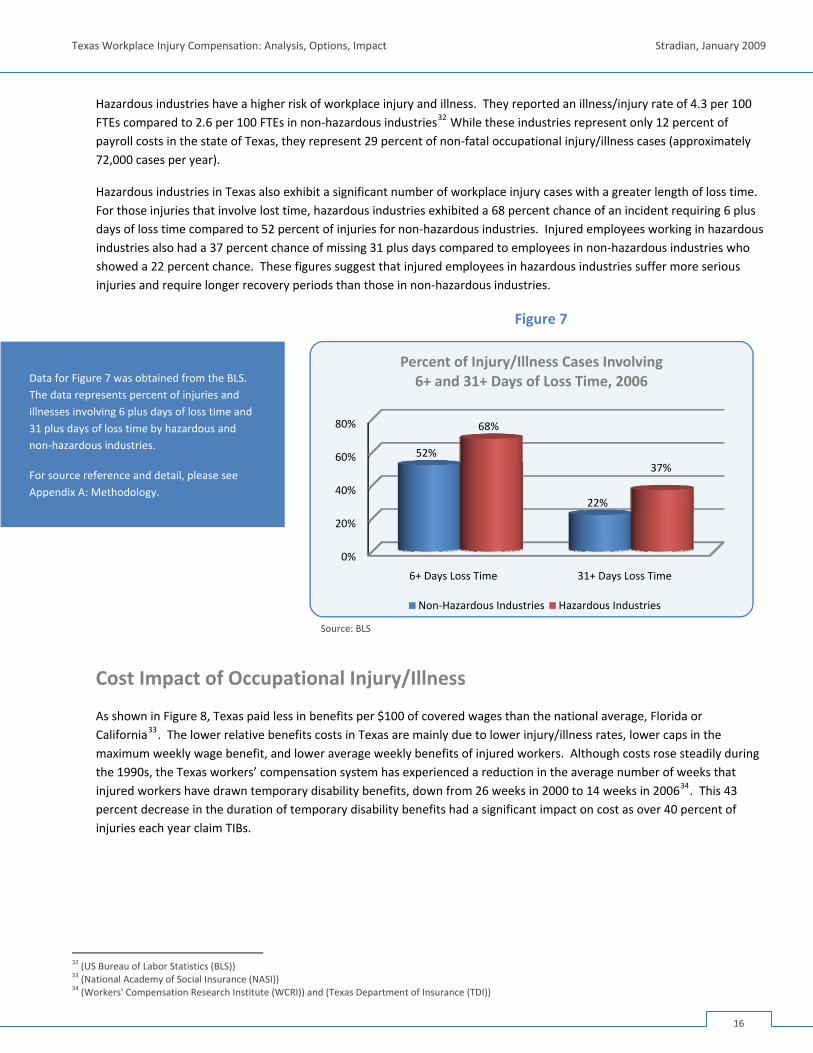
Hazardous industries in Texas also exhibit a significant number of workplace injury cases with a greater length of loss time. For those injuries that involve lost time, hazardous industries exhibited a 68 percent chance of an incident requiring 6 plus days of loss time compared to 52 percent of injuries for non‐hazardous industries. Injured employees working in hazardous industries also had a 37 percent chance of missing 31 plus days compared to employees in non‐hazardous industries who showed a 22 percent chance. These figures suggest that injured employees in hazardous industries suffer more serious injuries and require longer recovery periods than those in non‐hazardous industries.
Figure 7
0%
20%
40%
60%
80%
6+ Days Loss Time 31+ Days Loss Time
52%
22%
68%
37%
Percent of Injury/Illness Cases Involving 6+ and 31+ Days of Loss Time, 2006
Non‐Hazardous Industries Hazardous Industries
Data for Figure 7 was obtained from the BLS. The data represents percent of injuries and illnesses involving 6 plus days of loss time and 31 plus days of loss time by hazardous and non‐hazardous industries.
For source reference and detail, please see Appendix A: Methodology.
Source: BLS
Cost Impact of Occupational Injury/Illness
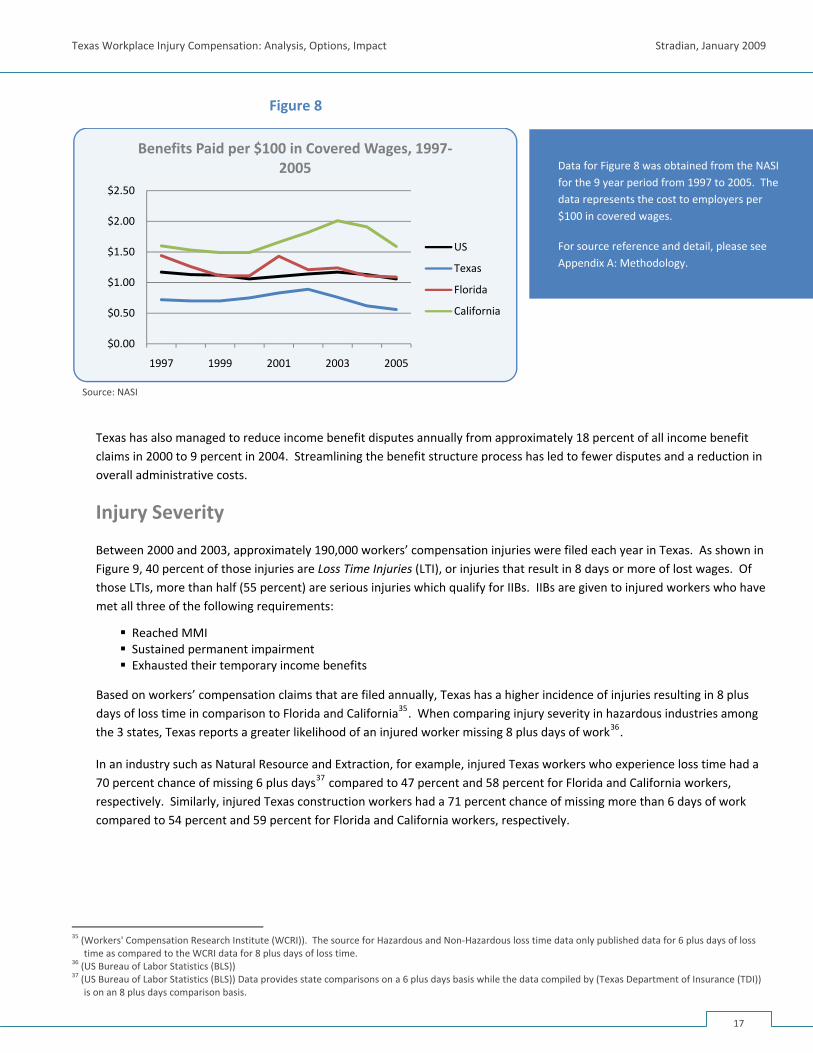
As shown in Figure 8, Texas paid less in benefits per $100 of covered wages than the national average, Florida or California33. The lower relative benefits costs in Texas are mainly due to lower injury/illness rates, lower caps in the maximum weekly wage benefit, and lower average weekly benefits of injured workers. Although costs rose steadily during the 1990s, the Texas workers’ compensation system has experienced a reduction in the average number of weeks that injured workers have drawn temporary disability benefits, down from 26 weeks in 2000 to 14 weeks in 200634. This 43 percent decrease in the duration of temporary disability benefits had a significant impact on cost as over 40 percent of injuries each year claim TIBs.
32 (US Bureau of Labor Statistics (BLS)) 33 (National Academy of Social Insurance (NASI)) 34 (Workers' Compensation Research Institute (WCRI)) and (Texas Department of Insurance (TDI))
16
Texas Workplace Injury Compensation: Analysis, Options, Impact Stradian, January 2009
Figure 8
$0.00
$0.50
$1.00
$1.50
$2.00
$2.50
1997 1999 2001 2003 2005
Benefits Paid per $100 in Covered Wages, 1997‐2005
US
Texas
Florida
California
Data for Figure 8 was obtained from the NASI for the 9 year period from 1997 to 2005. The data represents the cost to employers per $100 in covered wages.
For source reference and detail, please see Appendix A: Methodology.
Source: NASI
Texas has also managed to reduce income benefit disputes annually from approximately 18 percent of all income benefit claims in 2000 to 9 percent in 2004. Streamlining the benefit structure process has led to fewer disputes and a reduction in overall administrative costs.
Injury Severity
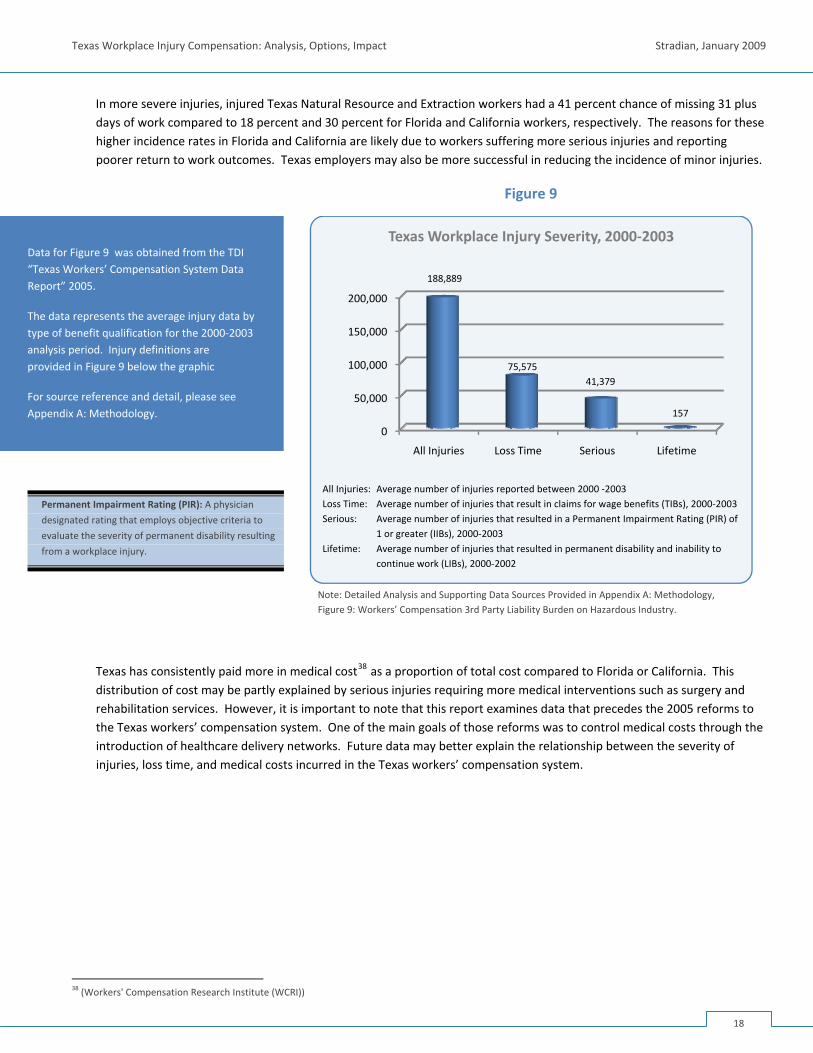
Between 2000 and 2003, approximately 190,000 workers’ compensation injuries were filed each year in Texas. As shown in Figure 9, 40 percent of those injuries are Loss Time Injuries (LTI), or injuries that result in 8 days or more of lost wages. Of those LTIs, more than half (55 percent) are serious injuries which qualify for IIBs. IIBs are given to injured workers who have met all three of the following requirements:
Reached MMI Sustained permanent impairment Exhausted their temporary income benefits
Based on workers’ compensation claims that are filed annually, Texas has a higher incidence of injuries resulting in 8 plus days of loss time in comparison to Florida and California35. When comparing injury severity in hazardous industries among the 3 states, Texas reports a greater likelihood of an injured worker missing 8 plus days of work36.
In an industry such as Natural Resource and Extraction, for example, injured Texas workers who experience loss time had a 70 percent chance of missing 6 plus days37 compared to 47 percent and 58 percent for Florida and California workers, respectively. Similarly, injured Texas construction workers had a 71 percent chance of missing more than 6 days of work compared to 54 percent and 59 percent for Florida and California workers, respectively.
35 (Workers' Compensation Research Institute (WCRI)). The source for Hazardous and Non‐Hazardous loss time data only published data for 6 plus days of loss
time as compared to the WCRI data for 8 plus days of loss time. 36 (US Bureau of Labor Statistics (BLS)) 37 (US Bureau of Labor Statistics (BLS)) Data provides state comparisons on a 6 plus days basis while the data compiled by (Texas Department of Insurance (TDI))
is on an 8 plus days comparison basis.
17
Texas Workplace Injury Compensation: Analysis, Options, Impact Stradian, January 2009
In more severe injuries, injured Texas Natural Resource and Extraction workers had a 41 percent chance of missing 31 plus days of work compared to 18 percent and 30 percent for Florida and California workers, respectively. The reasons for these higher incidence rates in Florida and California are likely due to workers suffering more serious injuries and reporting poorer return to work outcomes. Texas employers may also be more successful in reducing the incidence of minor injuries.
Figure 9
0
50,000
100,000
150,000
200,000
All Injuries Loss Time Serious Lifetime
188,889
75,57541,379
157
Texas Workplace Injury Severity, 2000‐2003Data for Figure 9 was obtained from the TDI “Texas Workers’ Compensation System Data Report” 2005.
The data represents the average injury data by type of benefit qualification for the 2000‐2003 analysis period. Injury definitions are provided in Figure 9 below the graphic
For source reference and detail, please see Appendix A: Methodology.
All Injuries: Average number of injuries reported between 2000 ‐2003 Loss Time: Average number of injuries that result in claims for wage benefits (TIBs), 2000‐2003 Serious: Average number of injuries that resulted in a Permanent Impairment Rating (PIR) of
1 or greater (IIBs), 2000‐2003 Lifetime: Average number of injuries that resulted in permanent disability and inability to
continue work (LIBs), 2000‐2002
Permanent Impairment Rating (PIR): A physician
designated rating that employs objective criteria to
evaluate the severity of permanent disability resulting
from a workplace injury.
Note: Detailed Analysis and Supporting Data Sources Provided in Appendix A: Methodology, Figure 9: Workers’ Compensation 3rd Party Liability Burden on Hazardous Industry.
Texas has consistently paid more in medical cost38 as a proportion of total cost compared to Florida or California. This distribution of cost may be partly explained by serious injuries requiring more medical interventions such as surgery and rehabilitation services. However, it is important to note that this report examines data that precedes the 2005 reforms to the Texas workers’ compensation system. One of the main goals of those reforms was to control medical costs through the introduction of healthcare delivery networks. Future data may better explain the relationship between the severity of injuries, loss time, and medical costs incurred in the Texas workers’ compensation system.
38 (Workers' Compensation Research Institute (WCRI))
18
Texas Workplace Injury Compensation: Analysis, Options, Impact Stradian, January 2009
Fatal Occupational Injury/Illness
Despite a continual reduction in the non‐fatal occupational injury/illness rate in Texas since 1992, the number of fatal occupational injuries has continued to vary over time. In 2005, construction and drilling industries accounted for 137 fatalities while transportation industries accounted for 135 fatalities39. The combination of these two industries accounted for 55 percent of all occupational fatalities in Texas. It is important to note that long term illnesses that eventually result in death – e.g., asbestos exposure – are not included in BLS fatality data. Since it is difficult to confirm the origin and triggers of these illnesses, the BLS counts traumatic occupational incidents only such as a worker falling at a site or perishing in a refinery explosion. OSHA and the State of Texas are undertaking initiatives to reduce workplace fatalities. Among these initiatives are increased education and training on safety at the workplace and effective worksite management, especially in hazardous industries.
39 (US Bureau of Labor Statistics (BLS))
19
Texas Workplace Injury Compensation: Analysis, Options, Impact Stradian, January 2009
3rd PARTY WORKPLACE INJURY LITIGATION Earlier, this report outlined the economic inefficiency of 3rd party lawsuits for injured workers seeking remedy through the courts. As noted, only 31 cents of every dollar spent on litigation actually accrues to the injured worked compared with nearly double that – 55 cents for every dollar spent – accrued from workers’ compensation benefits. This section identifies a second inefficiency with the current 3rd party liability system: asymmetric distribution of benefits.
Workplace Injury Case Outcomes
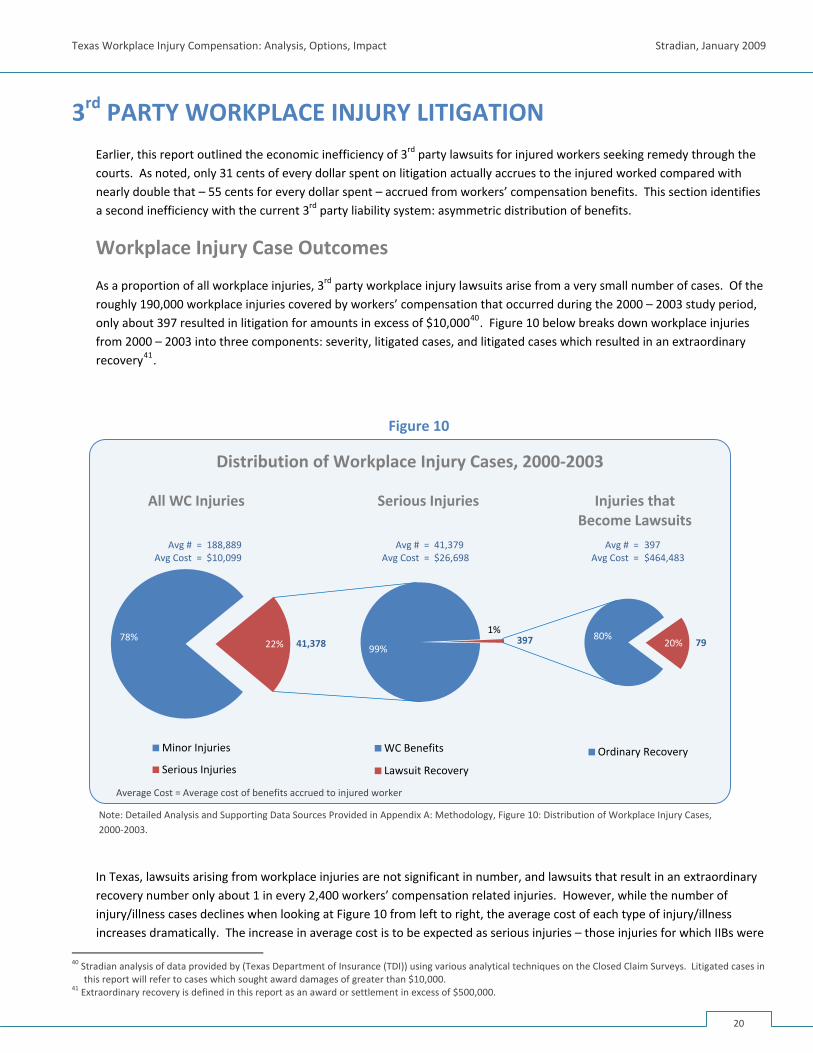
As a proportion of all workplace injuries, 3rd party workplace injury lawsuits arise from a very small number of cases. Of the roughly 190,000 workplace injuries covered by workers’ compensation that occurred during the 2000 – 2003 study period, only about 397 resulted in litigation for amounts in excess of $10,00040. Figure 10 below breaks down workplace injuries from 2000 – 2003 into three components: severity, litigated cases, and litigated cases which resulted in an extraordinary recovery41.
Figure 10
Distribution of Workplace Injury Cases, 2000‐2003
In Texas, lawsuits arising from workplace injuries are not significant in number, and lawsuits that result in an extraordinary recovery number only about 1 in every 2,400 workers’ compensation related injuries. However, while the number of injury/illness cases declines when looking at Figure 10 from left to right, the average cost of each type of injury/illness increases dramatically. The increase in average cost is to be expected as serious injuries – those injuries for which IIBs were
40 Stradian analysis of data provided by (Texas Department of Insurance (TDI)) using various analytical techniques on the Closed Claim Surveys. Litigated cases in
this report will refer to cases which sought award damages of greater than $10,000. 41 Extraordinary recovery is defined in this report as an award or settlement in excess of $500,000.
78%22%
All WC Injuries
Minor Injuries
Serious Injuries
99%
1%
Serious Injuries
WC Benefits
Lawsuit Recovery
80%20%
Injuries that Become Lawsuits
Ordinary Recovery
Avg # = 188,889 Avg # = 41,379 Avg # = 397 Avg Cost = $10,099 Avg Cost = $26,698 Avg Cost = $464,483
397 7941,378
Average Cost = Average cost of benefits accrued to injured worker
Note: Detailed Analysis and Supporting Data Sources Provided in Appendix A: Methodology, Figure 10: Distribution of Workplace Injury Cases, 2000‐2003.
20
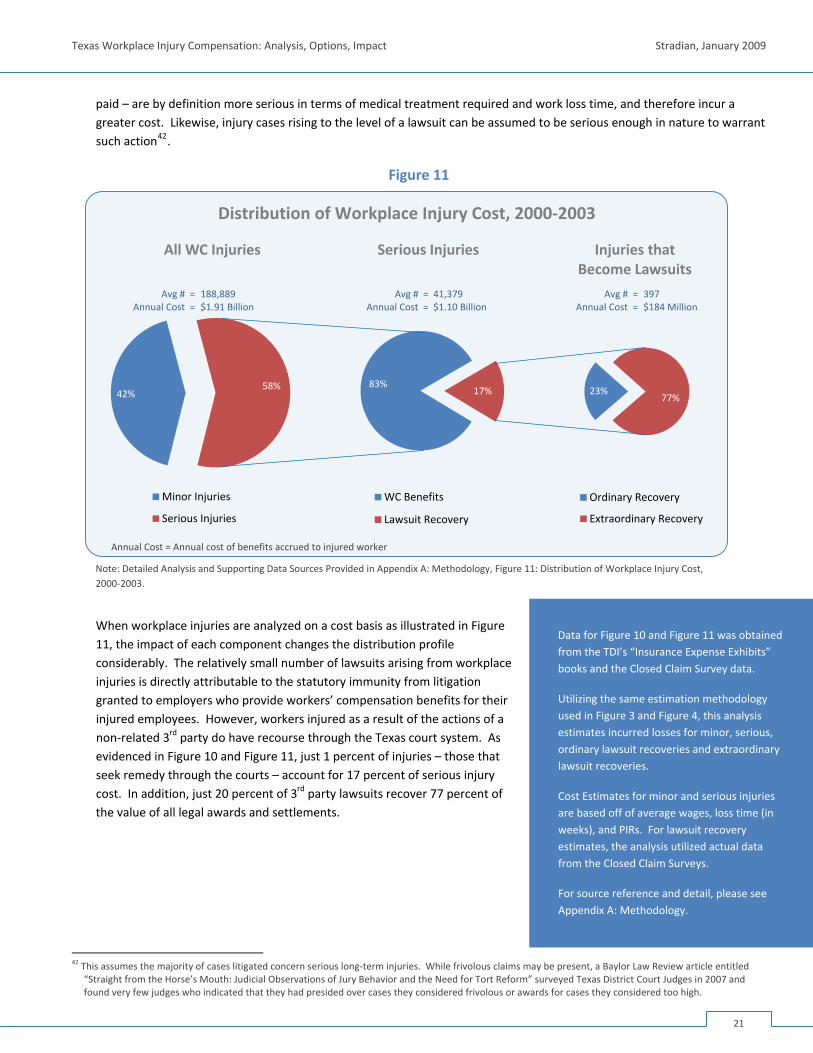
Texas Workplace Injury Compensation: Analysis, Options, Impact Stradian, January 2009
paid – are by definition more serious in terms of medical treatment required and work loss time, and therefore incur a greater cost. Likewise, injury cases rising to the level of a lawsuit can be assumed to be serious enough in nature to warrant such action42.
Figure 11
Distribution of Workplace Injury Cost, 2000‐2003
When workplace injuries are analyzed on a cost basis as illustrated in Figure 11, the impact of each component changes the distribution profile considerably. The relatively small number of lawsuits arising from workplace injuries is directly attributable to the statutory immunity from litigation granted to employers who provide workers’ compensation benefits for their injured employees. However, workers injured as a result of the actions of a non‐related 3rd party do have recourse through the Texas court system. As evidenced in Figure 10 and Figure 11, just 1 percent of injuries – those that seek remedy through the courts – account for 17 percent of serious injury cost. In addition, just 20 percent of 3rd party lawsuits recover 77 percent of the value of all legal awards and settlements.
42 This assumes the majority of cases litigated concern serious long‐term injuries. While frivolous claims may be present, a Baylor Law Review article entitled
“Straight from the Horse’s Mouth: Judicial Observations of Jury Behavior and the Need for Tort Reform” surveyed Texas District Court Judges in 2007 and found very few judges who indicated that they had presided over cases they considered frivolous or awards for cases they considered too high.
42%58%
All WC Injuries
Minor Injuries
Serious Injuries
83%17%
Serious Injuries
WC Benefits
Lawsuit Recovery
23%77%
Injuries that Become Lawsuits
Ordinary Recovery
Extraordinary Recovery
Avg # = 188,889 Avg # = 41,379 Avg # = 397 Annual Cost = $1.91 Billion Annual Cost = $1.10 Billion Annual Cost = $184 Million
Annual Cost = Annual cost of benefits accrued to injured worker
Note: Detailed Analysis and Supporting Data Sources Provided in Appendix A: Methodology, Figure 11: Distribution of Workplace Injury Cost, 2000‐2003.
Data for Figure 10 and Figure 11 was obtained from the TDI’s “Insurance Expense Exhibits” books and the Closed Claim Survey data.
Utilizing the same estimation methodology used in Figure 3 and Figure 4, this analysis estimates incurred losses for minor, serious, ordinary lawsuit recoveries and extraordinary lawsuit recoveries.
Cost Estimates for minor and serious injuries are based off of average wages, loss time (in weeks), and PIRs. For lawsuit recovery estimates, the analysis utilized actual data from the Closed Claim Surveys.
For source reference and detail, please see Appendix A: Methodology.
21
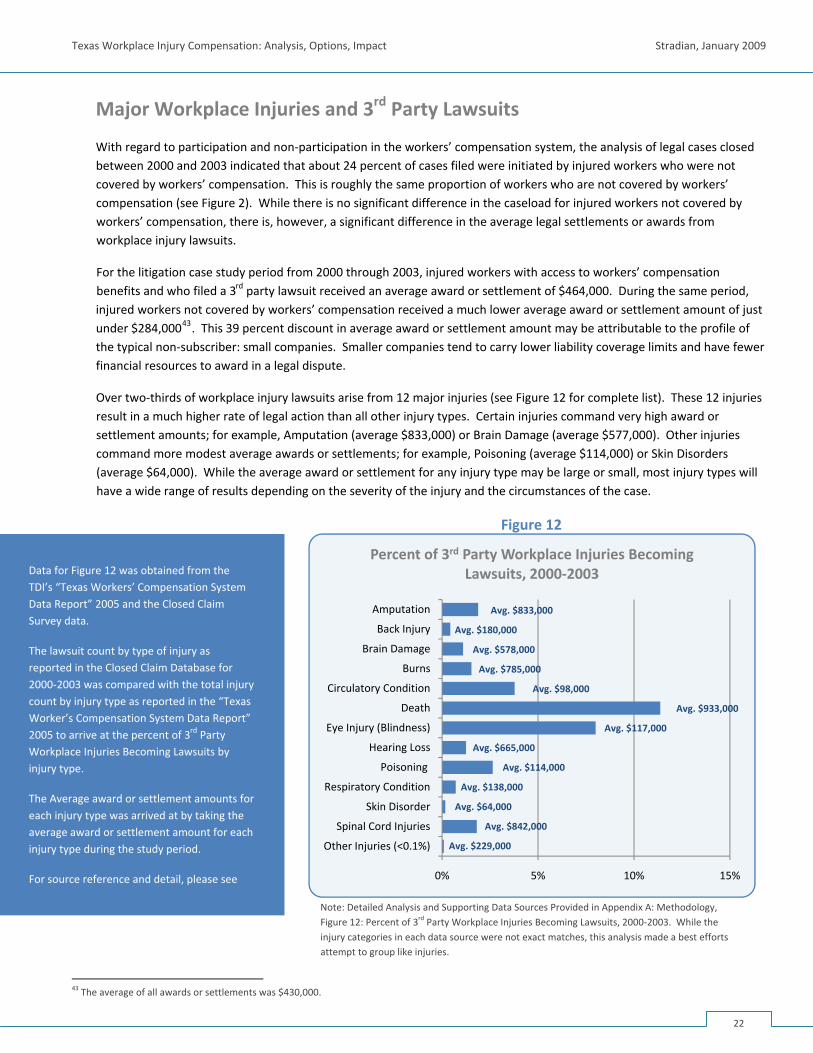
Texas Workplace Injury Compensation: Analysis, Options, Impact Stradian, January 2009
Major Workplace Injuries and 3rd Party Lawsuits
With regard to participation and non‐participation in the workers’ compensation system, the analysis of legal cases closed between 2000 and 2003 indicated that about 24 percent of cases filed were initiated by injured workers who were not covered by workers’ compensation. This is roughly the same proportion of workers who are not covered by workers’ compensation (see Figure 2). While there is no significant difference in the caseload for injured workers not covered by workers’ compensation, there is, however, a significant difference in the average legal settlements or awards from workplace injury lawsuits.
For the litigation case study period from 2000 through 2003, injured workers with access to workers’ compensation benefits and who filed a 3rd party lawsuit received an average award or settlement of $464,000. During the same period, injured workers not covered by workers’ compensation received a much lower average award or settlement amount of just under $284,00043. This 39 percent discount in average award or settlement amount may be attributable to the profile of the typical non‐subscriber: small companies. Smaller companies tend to carry lower liability coverage limits and have fewer financial resources to award in a legal dispute.
Over two‐thirds of workplace injury lawsuits arise from 12 major injuries (see Figure 12 for complete list). These 12 injuries result in a much higher rate of legal action than all other injury types. Certain injuries command very high award or settlement amounts; for example, Amputation (average $833,000) or Brain Damage (average $577,000). Other injuries command more modest average awards or settlements; for example, Poisoning (average $114,000) or Skin Disorders (average $64,000). While the average award or settlement for any injury type may be large or small, most injury types will have a wide range of results depending on the severity of the injury and the circumstances of the case.
Figure 12
0% 5% 10% 15%
Other Injuries (<0.1%)
Spinal Cord Injuries
Skin Disorder
Respiratory Condition
Poisoning
Hearing Loss
Eye Injury (Blindness)
Death
Circulatory Condition
Burns
Brain Damage
Back Injury
Amputation
Percent of 3rd Party Workplace Injuries Becoming Lawsuits, 2000‐2003Data for Figure 12 was obtained from the
TDI’s “Texas Workers’ Compensation System Data Report” 2005 and the Closed Claim Survey data.
The lawsuit count by type of injury as reported in the Closed Claim Database for 2000‐2003 was compared with the total injurycount by injury type as reported in the “Texas Worker’s Compensation System Data Report”2005 to arrive at the percent of 3rd Party Workplace Injuries Becoming Lawsuits by
Avg. $833,000
Avg. $180,000
Avg. $578,000
Avg. $785,000
Avg. $98,000
Avg. $933,000
Avg. $117,000
Avg. $665,000
Avg. $114,000
Avg. $138,000
Avg. $64,000
Avg. $842,000
Avg. $229,000
injury type.
r
t for each injury type during the study period.
tail, please see
The Average award or settlement amounts foeach injury type was arrived at by taking the average award or settlement amoun
For source reference and de
Note: Detailed Analysis and Supporting Data Sources Provided in Appendix A: Methodology, Figure 12: Percent of 3rd Party Workplace Injuries Becoming Lawsuits, 2000‐2003. While the injury categories in each data source were not exact matches, this analysis made a best efforts attempt to group like injuries.
43 The average of all awards or settlements was $430,000.
22
Texas Workplace Injury Compensation: Analysis, Options, Impact Stradian, January 2009
Unpredictability of Lawsuits Awards Leads to Over‐Insurance of Risk
Most companies in Texas carry some form of general liability or multi‐peril insurance policy. These policies cover a wide variety of risk, including 3rd party injury. Most companies will not see one workplace injury lawsuit levied against them this decade44; however, those companies pay a portion of their general liability premium to cover the risk of 3rd party workplace injury lawsuits. Because the range of lawsuit award and settlement amounts is so vast, many companies are forced to over‐insure themselves by purchasing ever higher liability coverage limits. This additional cost of doing business represents an unnecessary friction on a business’ operating structure.
While business operators most likely understand that their risk of having a 3rd party injury lawsuit brought against them is relatively low, they also understand the level of financial risk posed by a 3rd party injury lawsuit. While the average 3rd party injury lawsuit award or settlement was $464,000 for covered employees during the 2000 through 2003 analysis period, the median recovery was only $125,000. This spread represents the uneven nature of recovery amounts where the actual award or settlement in any case may amount to millions of dollars, or less than $125,000 as in most cases45. This dynamic encourages companies to focus on financial risk management – ensuring that a company has sufficient insurance or other protections – rather than on preventive safety.
Asymmetric Distribution of Injury Benefits
Figure 4 presented earlier outlined the economic inefficiency in the 3rd party liability system in returning only 26 cents on every dollar spent to injured workers. The second inefficiency that exists in the 3rd party liability system is the asymmetric distribution of benefits. Workers injured in incidents involving their own employers do not have the right to sue for damages; however, similarly injured workers involved in incidents with a company that is not their direct employer may be able to recover a significant damage award via the court system. This phenomenon creates an unequal distribution of injury compensation for severely injured Texas workers.
3rd Party Liability System Inefficiency 2
Cost of Over‐Insurance: Texas Business must
purchase high policy limits to cover the financial risk
of a very low risk 3rd party lawsuit.
3rd Party Liability System Inefficiency 3
Asymmetric Distribution of Benefits: Only a small
number of injured workers benefit from 3rd party
liability access and among those that benefit, there is
a wide disparity in the awards and settlements from
3rd party lawsuits.
As illustrated in Figure 10 and Figure 11, a very select group of injured workers receives a disproportionate share of benefits as the result of 3rd party liability suits (see Figure 346). Among the group of injured workers that pursue legal recourse, disproportionality in legal settlements and awards is even more pronounced. Figure 13 illustrates how even among lawsuit “winners”, a select few cases receive the bulk of the benefit.
44 The risk of any individual company being subject to a 3rd party lawsuit in the next 10 years is 1 in 74 or, viewed another way, 98.5 percent of Texas businesses
will not be subject to 3rd party injury lawsuits during the next decade. 45 Only 21 percent of all awards or settlements exceed the average recovery amount indicating a significant skew to the right as evidenced in Figure 13. 46 “Benefits” in this study are broadly defined as direct benefits received from workers’ compensation claims and recoveries – less legal and administrative
charges – from 3rd party lawsuits which “benefit” the plaintiff.
23
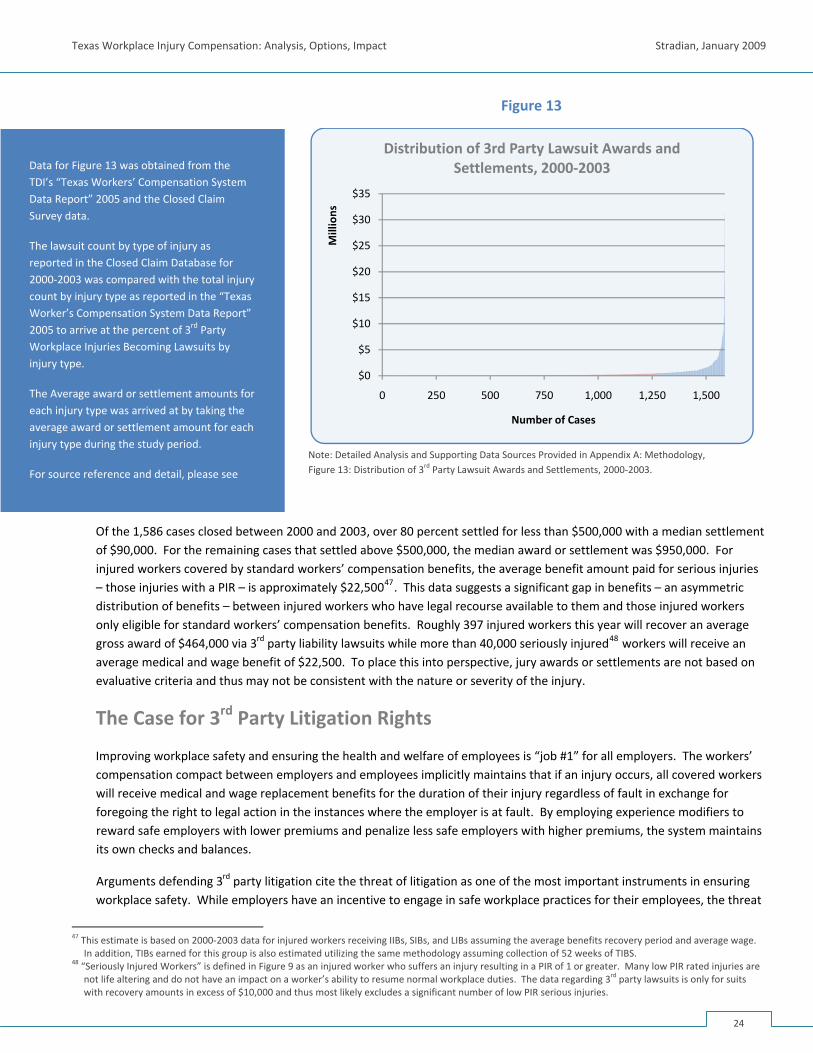
Texas Workplace Injury Compensation: Analysis, Options, Impact Stradian, January 2009
Figure 13
$0
$5
$10
$15
$20
$25
$30
$35
0 250 500 750 1,000 1,250 1,500
Millions
Number of Cases
Distribution of 3rd Party Lawsuit Awards and Settlements, 2000‐2003Data for Figure 13 was obtained from the
TDI’s “Texas Workers’ Compensation System Data Report” 2005 and the Closed Claim Survey data.
The lawsuit count by type of injury as reported in the Closed Claim Database for 2000‐2003 was compared with the total injurcount by injury type as reported in the “Texas Worker’s Compensation System Data Report”2005 to arrive at the percent of 3rd Party Workplace Injuries Becoming Lawsuits by
y
injury type.
r
t for each injury type during the study period.
tail, please see
The Average award or settlement amounts foeach injury type was arrived at by taking the average award or settlement amoun
For source reference and de
Note: Detailed Analysis and Supporting Data Sources Provided in Appendix A: Methodology, Figure 13: Distribution of 3rd Party Lawsuit Awards and Settlements, 2000‐2003.
Of the 1,586 cases closed between 2000 and 2003, over 80 percent settled for less than $500,000 with a median settlement of $90,000. For the remaining cases that settled above $500,000, the median award or settlement was $950,000. For injured workers covered by standard workers’ compensation benefits, the average benefit amount paid for serious injuries – those injuries with a PIR – is approximately $22,50047. This data suggests a significant gap in benefits – an asymmetric distribution of benefits – between injured workers who have legal recourse available to them and those injured workers only eligible for standard workers’ compensation benefits. Roughly 397 injured workers this year will recover an average gross award of $464,000 via 3rd party liability lawsuits while more than 40,000 seriously injured48 workers will receive an average medical and wage benefit of $22,500. To place this into perspective, jury awards or settlements are not based on evaluative criteria and thus may not be consistent with the nature or severity of the injury.
The Case for 3rd Party Litigation Rights
Improving workplace safety and ensuring the health and welfare of employees is “job #1” for all employers. The workers’ compensation compact between employers and employees implicitly maintains that if an injury occurs, all covered workers will receive medical and wage replacement benefits for the duration of their injury regardless of fault in exchange for foregoing the right to legal action in the instances where the employer is at fault. By employing experience modifiers to reward safe employers with lower premiums and penalize less safe employers with higher premiums, the system maintains its own checks and balances.
Arguments defending 3rd party litigation cite the threat of litigation as one of the most important instruments in ensuring workplace safety. While employers have an incentive to engage in safe workplace practices for their employees, the threat
47 This estimate is based on 2000‐2003 data for injured workers receiving IIBs, SIBs, and LIBs assuming the average benefits recovery period and average wage.
In addition, TIBs earned for this group is also estimated utilizing the same methodology assuming collection of 52 weeks of TIBS. 48 “Seriously Injured Workers” is defined in Figure 9 as an injured worker who suffers an injury resulting in a PIR of 1 or greater. Many low PIR rated injuries are
not life altering and do not have an impact on a worker’s ability to resume normal workplace duties. The data regarding 3rd party lawsuits is only for suits with recovery amounts in excess of $10,000 and thus most likely excludes a significant number of low PIR serious injuries.
24
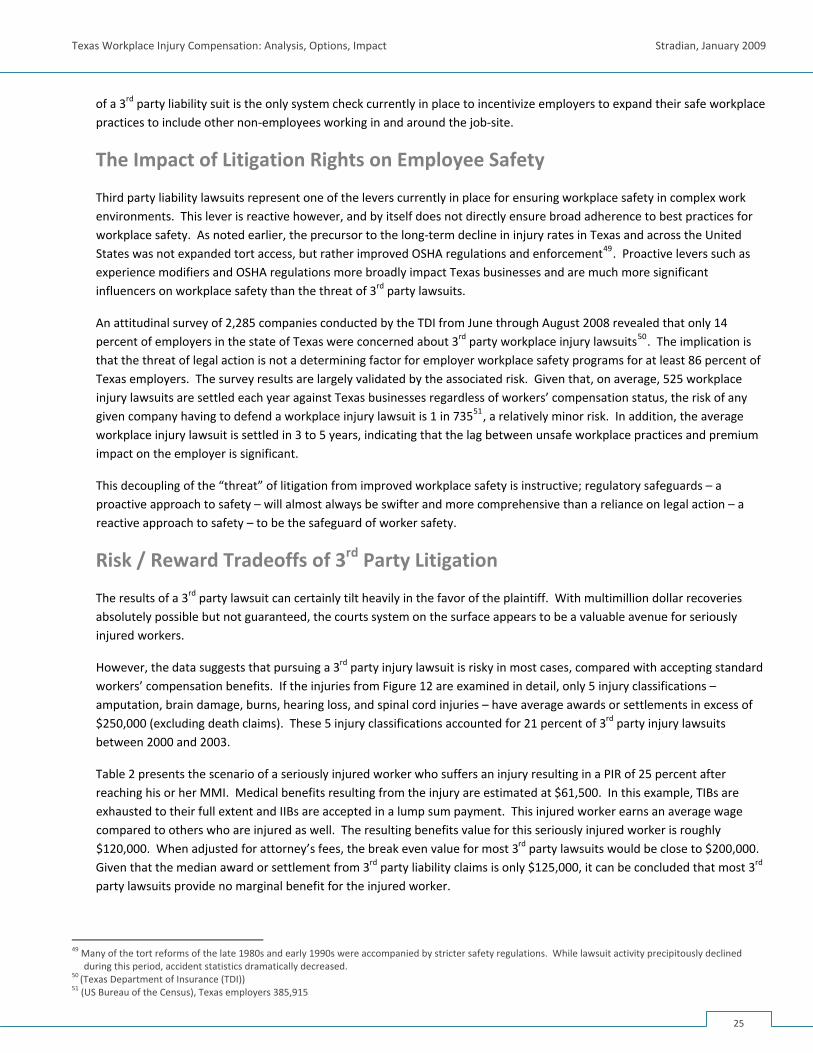
Texas Workplace Injury Compensation: Analysis, Options, Impact Stradian, January 2009
of a 3rd party liability suit is the only system check currently in place to incentivize employers to expand their safe workplace practices to include other non‐employees working in and around the job‐site.
The Impact of Litigation Rights on Employee Safety
Third party liability lawsuits represent one of the levers currently in place for ensuring workplace safety in complex work environments. This lever is reactive however, and by itself does not directly ensure broad adherence to best practices for workplace safety. As noted earlier, the precursor to the long‐term decline in injury rates in Texas and across the United States was not expanded tort access, but rather improved OSHA regulations and enforcement49. Proactive levers such as experience modifiers and OSHA regulations more broadly impact Texas businesses and are much more significant influencers on workplace safety than the threat of 3rd party lawsuits.
An attitudinal survey of 2,285 companies conducted by the TDI from June through August 2008 revealed that only 14 percent of employers in the state of Texas were concerned about 3rd party workplace injury lawsuits50. The implication is that the threat of legal action is not a determining factor for employer workplace safety programs for at least 86 percent of Texas employers. The survey results are largely validated by the associated risk. Given that, on average, 525 workplace injury lawsuits are settled each year against Texas businesses regardless of workers’ compensation status, the risk of any given company having to defend a workplace injury lawsuit is 1 in 73551, a relatively minor risk. In addition, the average workplace injury lawsuit is settled in 3 to 5 years, indicating that the lag between unsafe workplace practices and premium impact on the employer is significant.
This decoupling of the “threat” of litigation from improved workplace safety is instructive; regulatory safeguards – a proactive approach to safety – will almost always be swifter and more comprehensive than a reliance on legal action – a reactive approach to safety – to be the safeguard of worker safety.
Risk / Reward Tradeoffs of 3rd Party Litigation
The results of a 3rd party lawsuit can certainly tilt heavily in the favor of the plaintiff. With multimillion dollar recoveries absolutely possible but not guaranteed, the courts system on the surface appears to be a valuable avenue for seriously injured workers.
However, the data suggests that pursuing a 3rd party injury lawsuit is risky in most cases, compared with accepting standard workers’ compensation benefits. If the injuries from Figure 12 are examined in detail, only 5 injury classifications – amputation, brain damage, burns, hearing loss, and spinal cord injuries – have average awards or settlements in excess of $250,000 (excluding death claims). These 5 injury classifications accounted for 21 percent of 3rd party injury lawsuits between 2000 and 2003.
Table 2 presents the scenario of a seriously injured worker who suffers an injury resulting in a PIR of 25 percent after reaching his or her MMI. Medical benefits resulting from the injury are estimated at $61,500. In this example, TIBs are exhausted to their full extent and IIBs are accepted in a lump sum payment. This injured worker earns an average wage compared to others who are injured as well. The resulting benefits value for this seriously injured worker is roughly $120,000. When adjusted for attorney’s fees, the break even value for most 3rd party lawsuits would be close to $200,000. Given that the median award or settlement from 3rd party liability claims is only $125,000, it can be concluded that most 3rd party lawsuits provide no marginal benefit for the injured worker.
49 Many of the tort reforms of the late 1980s and early 1990s were accompanied by stricter safety regulations. While lawsuit activity precipitously declined
during this period, accident statistics dramatically decreased. 50 (Texas Department of Insurance (TDI)) 51 (US Bureau of the Census), Texas employers 385,915
25
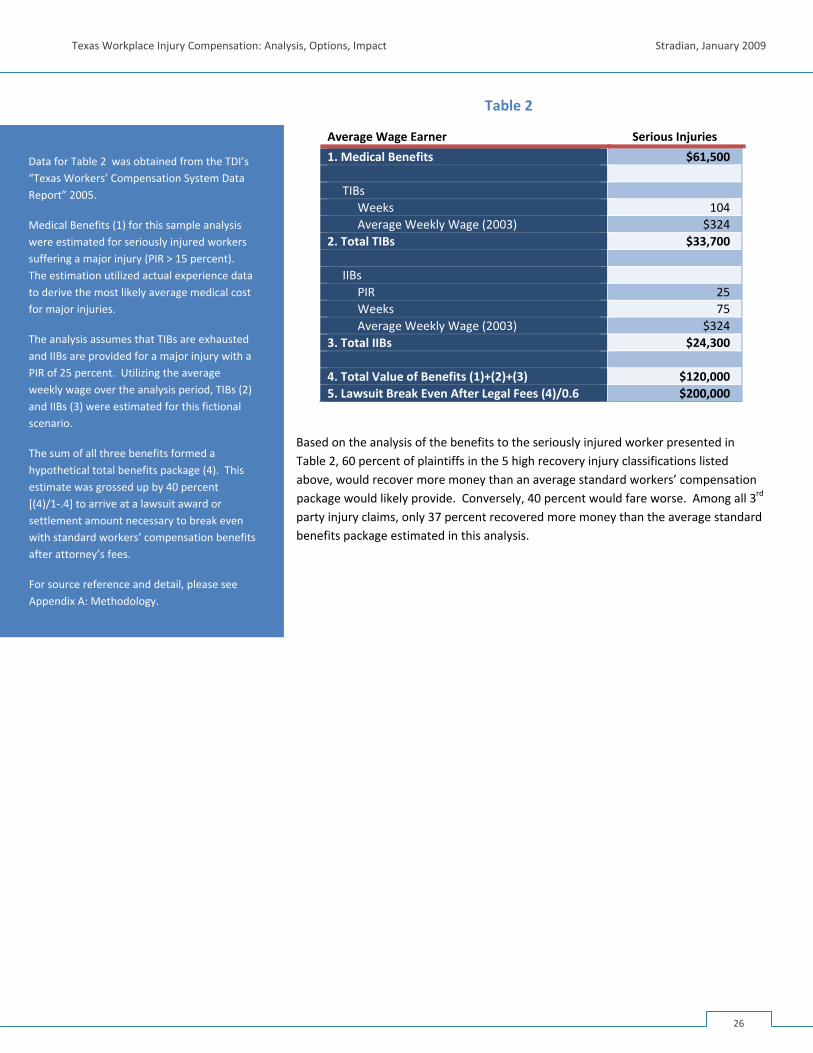
Texas Workplace Injury Compensation: Analysis, Options, Impact Stradian, January 2009
Table 2
Data for Table 2 was obtained from the TDI’s “Texas Workers’ Compensation System Data Report” 2005.
Medical Benefits (1) for this sample analysis were estimated for seriously injured workers suffering a major injury (PIR > 15 percent). The estimation utilized actual experience data to derive the most likely average medical cost for major injuries.
The analysis assumes that TIBs are exhausted and IIBs are provided for a major injury with a PIR of 25 percent. Utilizing the average weekly wage over the analysis period, TIBs (2) and IIBs (3) were estimated for this fictional scenario.
The sum of all three benefits formed a hypothetical total benefits package (4). This estimate was grossed up by 40 percent [(4)/1‐.4] to arrive at a lawsuit award or settlement amount necessary to break even with standard workers’ compensation benefits after attorney’s fees.
For source reference and detail, please see Appendix A: Methodology.
Average Wage Earner Serious Injuries
1. Medical Benefits $61,500
TIBs Weeks 104 Average Weekly Wage (2003) $3242. Total TIBs $33,700
IIBs PIR 25 Weeks 75 Average Weekly Wage (2003) $3243. Total IIBs $24,300
4. Total Value of Benefits (1)+(2)+(3) $120,0005. Lawsuit Break Even After Legal Fees (4)/0.6 $200,000
Based on the analysis of the benefits to the seriously injured worker presented in Table 2, 60 percent of plaintiffs in the 5 high recovery injury classifications listed above, would recover more money than an average standard workers’ compensation package would likely provide. Conversely, 40 percent would fare worse. Among all 3rd party injury claims, only 37 percent recovered more money than the average standard benefits package estimated in this analysis.
26
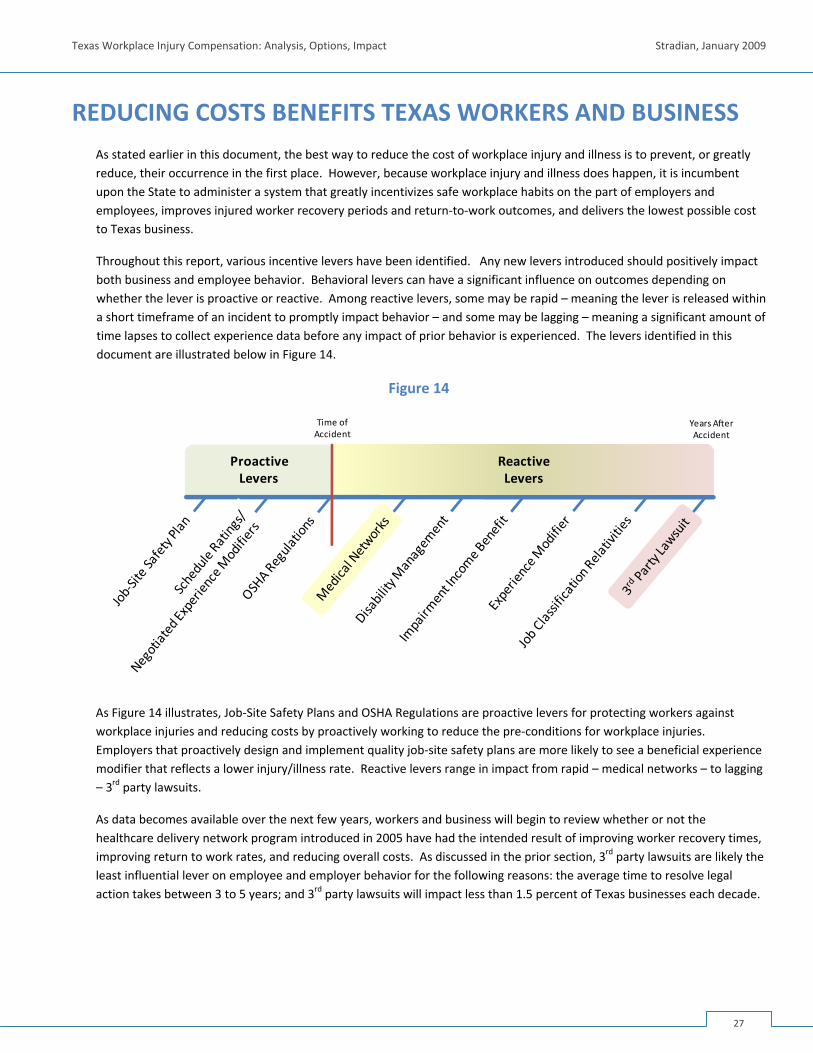
Texas Workplace Injury Compensation: Analysis, Options, Impact Stradian, January 2009
REDUCING COSTS BENEFITS TEXAS WORKERS AND BUSINESS As stated earlier in this document, the best way to reduce the cost of workplace injury and illness is to prevent, or greatly reduce, their occurrence in the first place. However, because workplace injury and illness does happen, it is incumbent upon the State to administer a system that greatly incentivizes safe workplace habits on the part of employers and employees, improves injured worker recovery periods and return‐to‐work outcomes, and delivers the lowest possible cost to Texas business.
Throughout this report, various incentive levers have been identified. Any new levers introduced should positively impact both business and employee behavior. Behavioral levers can have a significant influence on outcomes depending on whether the lever is proactive or reactive. Among reactive levers, some may be rapid – meaning the lever is released within a short timeframe of an incident to promptly impact behavior – and some may be lagging – meaning a significant amount of time lapses to collect experience data before any impact of prior behavior is experienced. The levers identified in this document are illustrated below in Figure 14.
Figure 14
ProactiveLevers
ReactiveLevers
Time of Accident
Years AfterAccident
As Figure 14 illustrates, Job‐Site Safety Plans and OSHA Regulations are proactive levers for protecting workers against workplace injuries and reducing costs by proactively working to reduce the pre‐conditions for workplace injuries. Employers that proactively design and implement quality job‐site safety plans are more likely to see a beneficial experience modifier that reflects a lower injury/illness rate. Reactive levers range in impact from rapid – medical networks – to lagging – 3rd party lawsuits.
As data becomes available over the next few years, workers and business will begin to review whether or not the healthcare delivery network program introduced in 2005 have had the intended result of improving worker recovery times, improving return to work rates, and reducing overall costs. As discussed in the prior section, 3rd party lawsuits are likely the least influential lever on employee and employer behavior for the following reasons: the average time to resolve legal action takes between 3 to 5 years; and 3rd party lawsuits will impact less than 1.5 percent of Texas businesses each decade.
27
Texas Workplace Injury Compensation: Analysis, Options, Impact Stradian, January 2009
KEY DEFICIENCIES IN THE TEXAS SYSTEM The benefits package of the Texas workers’ compensation system is similar to those provided in Florida and California. All three states offer full medical benefits and TIBs for up to two years of recovery post injury. Additionally, similar forms of impairment benefits and long term income benefits are also in place for injured workers in each state.
The design of the workers’ compensation benefits system is intended to provide swift access to medical care and rehabilitation so that injured workers can return to work as quickly as possible. Each state continually evaluates the success and weaknesses of their systems and makes improvements as needed to both improve care and reduce cost.
Throughout this report, a variety of weaknesses in the overall workplace injury compensation system were identified. The universal goal should be to provide adequate benefits to injured workers at the lowest cost, while also supporting a mechanism for ensuring worker safety. In analyzing the injury compensation system, it is evident that a major source of inefficiency is the 3rd party liability system. First and foremost, the cost of the 3rd party liability system leaves little for the injured worker. After administrative and legal costs are taken into consideration, plaintiffs, on average, recover just 32 cents of every dollar spent compared to the traditional workers’ compensation system – which returns 55 cents of every dollar spent to injured workers in the form of medical and wage replacement benefits. Secondly, the 3rd party liability system benefits very few injured workers, providing significant benefits for the very few – at a high cost to employers – while providing little incentive for employers to provide a safe work environment.
The analysis performed in this study of the system reveals that there are some potential opportunities to provide greater benefits to injured workers and reduce costs of the overall system – while also maximizing the opportunity to create a system of incentives that encourages greater safety awareness, concern, and action on the part of employers.
This section discusses three what if scenarios that offer ways to improve benefits paid to injured Texas employees and reduce frictional costs for employers. In addition to costs and benefits, another purpose of the discussion is to identify potential opportunities to improve the system of incentives that encourage increased safety on the part of employers.
Option 1: Increase the Maximum Weekly Wage Benefit for TIBs
The 2008 maximum weekly wage replacement benefit of $712 is calculated as 88 percent of the average weekly wage for all workers in the State of Texas covered by unemployment insurance. As implied by the term “average”, a significant portion of Texas workers earn more than this “average”. This creates a significant hardship for those specialized workers injured on the job but earning more than the wage replacement benefit.
At $712 per week, this benefit is equivalent to a gross annual wage of roughly $52,900. Specialists such as crane operators, pipe fitters and production engineers can easily earn twice this amount. For injured workers supporting families with mortgages, car payments, and children’s education, any serious injury that results in prolonged absence from work can mean financial disaster for the entire family.
In 2005, the percentage of injured workers earning TIBs and exceeding the maximum weekly wage benefit was 19 percent. While this statistic is based off of a much lower maximum weekly wage benefit ($537)52, the maximum wage benefit has increased 33 percent over the past 3 years. Due to the overall strength of the Texas economy led by high oil and gas prices and recent increases in the minimum wage, this analysis estimates that the increase in the wage benefit cap may have reduced by half the number of injured workers whose wages exceed this cap.
Table 3 outlines the range of incremental costs resulting from increasing the maximum weekly wage benefit. The scenarios presented display a matrix of possible incremental costs from the policy change of increasing the average weekly wage.
52 (Texas Department of Insurance (TDI)), 2005 is the most current year available.
28
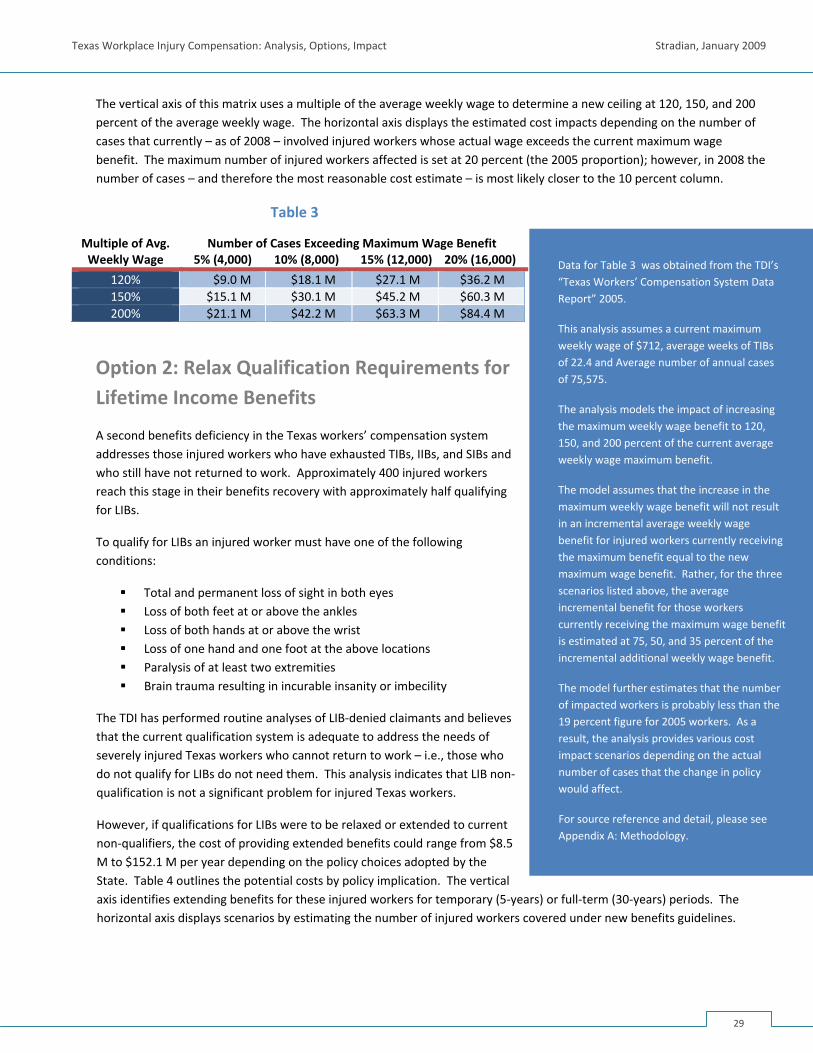
Texas Workplace Injury Compensation: Analysis, Options, Impact Stradian, January 2009
The vertical axis of this matrix uses a multiple of the average weekly wage to determine a new ceiling at 120, 150, and 200 percent of the average weekly wage. The horizontal axis displays the estimated cost impacts depending on the number of cases that currently – as of 2008 – involved injured workers whose actual wage exceeds the current maximum wage benefit. The maximum number of injured workers affected is set at 20 percent (the 2005 proportion); however, in 2008 the number of cases – and therefore the most reasonable cost estimate – is most likely closer to the 10 percent column.
Table 3
Multiple of Avg. Weekly Wage
Number of Cases Exceeding Maximum Wage Benefit 5% (4,000) 10% (8,000) 15% (12,000) 20% (16,000)
120% $9.0 M $18.1 M $27.1 M $36.2 M150% $15.1 M $30.1 M $45.2 M $60.3 M200% $21.1 M $42.2 M $63.3 M $84.4 M
Option 2: Relax Qualification Requirements for Lifetime Income Benefits
A second benefits deficiency in the Texas workers’ compensation system addresses those injured workers who have exhausted TIBs, IIBs, and SIBs and who still have not returned to work. Approximately 400 injured workers reach this stage in their benefits recovery with approximately half qualifying for LIBs.
To qualify for LIBs an injured worker must have one of the following conditions:
Total and permanent loss of sight in both eyes Loss of both feet at or above the ankles Loss of both hands at or above the wrist Loss of one hand and one foot at the above locations Paralysis of at least two extremities Brain trauma resulting in incurable insanity or imbecility
The TDI has performed routine analyses of LIB‐denied claimants and believes that the current qualification system is adequate to address the needs of severely injured Texas workers who cannot return to work – i.e., those who do not qualify for LIBs do not need them. This analysis indicates that LIB non‐qualification is not a significant problem for injured Texas workers.
However, if qualifications for LIBs were to be relaxed or extended to current non‐qualifiers, the cost of providing extended benefits could range from $8.5 M to $152.1 M per year depending on the policy choices adopted by the State. Table 4 outlines the potential costs by policy implication. The vertical axis identifies extending benefits for these injured workers for temporary (5‐years) or full‐term (30‐years) periods. The horizontal axis displays scenarios by estimating the number of injured workers covered under new benefits guidelines.
Data for Table 3 was obtained from the TDI’s “Texas Workers’ Compensation System Data Report” 2005.
This analysis assumes a current maximum weekly wage of $712, average weeks of TIBs of 22.4 and Average number of annual cases of 75,575.
The analysis models the impact of increasing the maximum weekly wage benefit to 120, 150, and 200 percent of the current average weekly wage maximum benefit.
The model assumes that the increase in the maximum weekly wage benefit will not result in an incremental average weekly wage benefit for injured workers currently receiving the maximum benefit equal to the new maximum wage benefit. Rather, for the three scenarios listed above, the average incremental benefit for those workers currently receiving the maximum wage benefit is estimated at 75, 50, and 35 percent of the incremental additional weekly wage benefit.
The model further estimates that the number of impacted workers is probably less than the 19 percent figure for 2005 workers. As a result, the analysis provides various cost impact scenarios depending on the actual number of cases that the change in policy would affect.
For source reference and detail, please see Appendix A: Methodology.
29
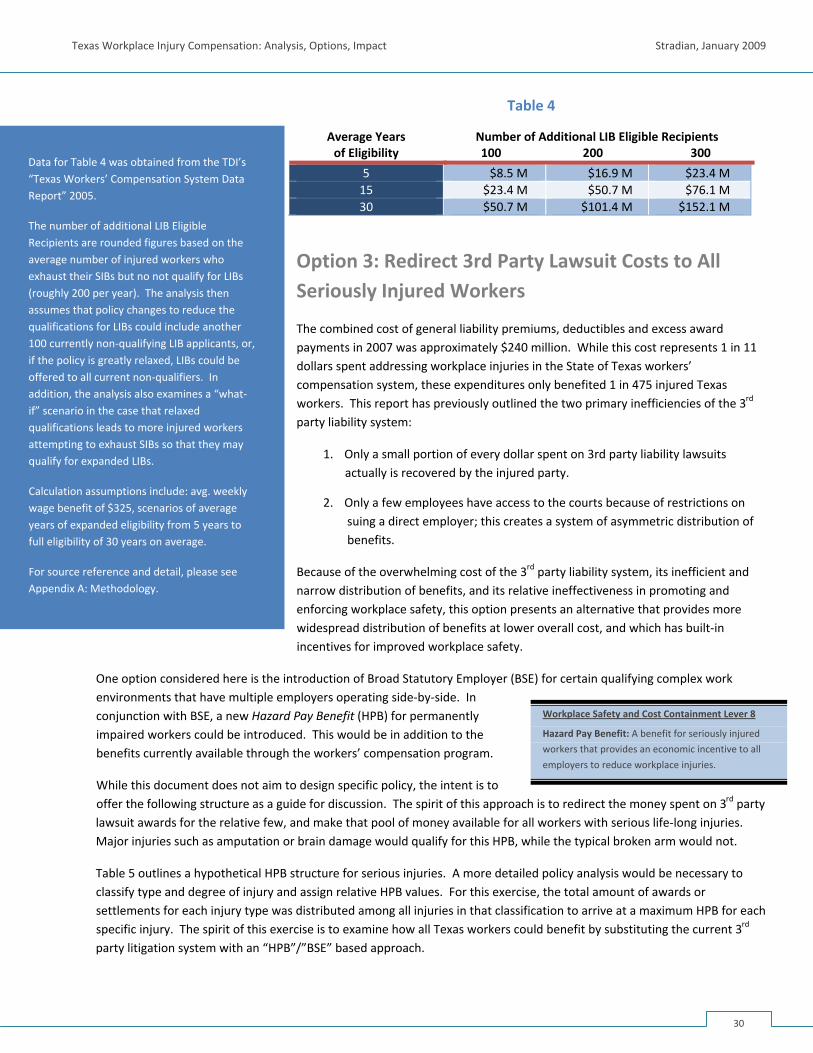
Texas Workplace Injury Compensation: Analysis, Options, Impact Stradian, January 2009
Table 4
Average Yearsof Eligibility
Number of Additional LIB Eligible Recipients 100 200 300
5 $8.5 M $16.9 M $23.4 M15 $23.4 M $50.7 M $76.1 M30 $50.7 M $101.4 M $152.1 M
Option 3: Redirect 3rd Party Lawsuit Costs to All Seriously Injured Workers
The combined cost of general liability premiums, deductibles and excess award payments in 2007 was approximately $240 million. While this cost represents 1 in 11 dollars spent addressing workplace injuries in the State of Texas workers’ compensation system, these expenditures only benefited 1 in 475 injured Texas workers. This report has previously outlined the two primary inefficiencies of the 3rd party liability system:
1. Only a small portion of every dollar spent on 3rd party liability lawsuits actually is recovered by the injured party.
2. Only a few employees have access to the courts because of restrictions on suing a direct employer; this creates a system of asymmetric distribution of benefits.
Because of the overwhelming cost of the 3rd party liability system, its inefficient and narrow distribution of benefits, and its relative ineffectiveness in promoting and enforcing workplace safety, this option presents an alternative that provides more widespread distribution of benefits at lower overall cost, and which has built‐in incentives for improved workplace safety.
One option considered here is the introduction of Broad Statutory Employer (BSE) for certain qualifying complex work environments that have multiple employers operating side‐by‐side. In conjunction with BSE, a new Hazard Pay Benefit (HPB) for permanently impaired workers could be introduced. This would be in addition to the benefits currently available through the workers’ compensation program.
While this document does not aim to design specific policy, the intent is to offer the following structure as a guide for discussion. The spirit of this approach is to redirect the money spent on 3rd party lawsuit awards for the relative few, and make that pool of money available for all workers with serious life‐long injuries. Major injuries such as amputation or brain damage would qualify for this HPB, while the typical broken arm would not.
Workplace Safety and Cost Containment Lever 8
Hazard Pay Benefit: A benefit for seriously injured
workers that provides an economic incentive to all
employers to reduce workplace injuries.
Data for Table 4 was obtained from the TDI’s “Texas Workers’ Compensation System Data Report” 2005.
The number of additional LIB Eligible Recipients are rounded figures based on the average number of injured workers who exhaust their SIBs but no not qualify for LIBs (roughly 200 per year). The analysis then assumes that policy changes to reduce the qualifications for LIBs could include another 100 currently non‐qualifying LIB applicants, or, if the policy is greatly relaxed, LIBs could be offered to all current non‐qualifiers. In addition, the analysis also examines a “what‐if” scenario in the case that relaxed qualifications leads to more injured workers attempting to exhaust SIBs so that they may qualify for expanded LIBs.
Calculation assumptions include: avg. weekly wage benefit of $325, scenarios of average years of expanded eligibility from 5 years to full eligibility of 30 years on average.
For source reference and detail, please see Appendix A: Methodology.
Table 5 outlines a hypothetical HPB structure for serious injuries. A more detailed policy analysis would be necessary to classify type and degree of injury and assign relative HPB values. For this exercise, the total amount of awards or settlements for each injury type was distributed among all injuries in that classification to arrive at a maximum HPB for each specific injury. The spirit of this exercise is to examine how all Texas workers could benefit by substituting the current 3rd party litigation system with an “HPB”/”BSE” based approach.
30
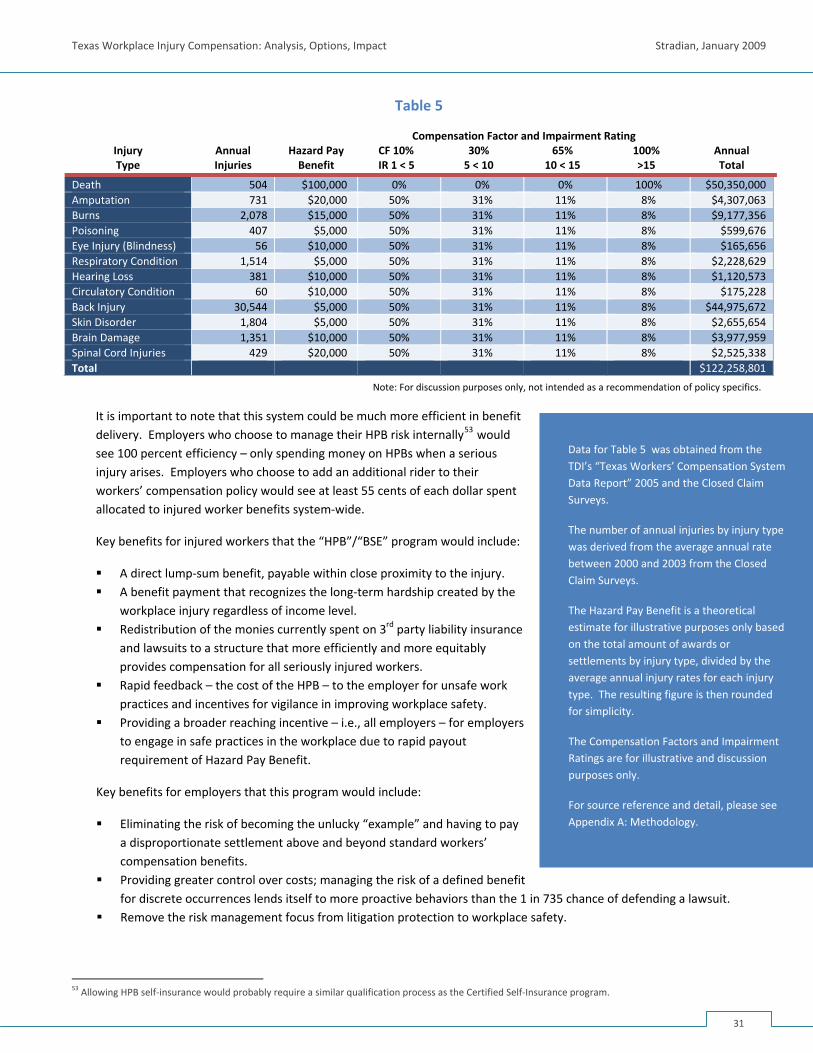
Texas Workplace Injury Compensation: Analysis, Options, Impact Stradian, January 2009
Table 5
Injury Type
Annual Injuries
Hazard Pay Benefit
Compensation Factor and Impairment Rating CF 10% 30% 65% 100% IR 1 < 5 5 < 10 10 < 15 >15
Annual Total
Death 504 $100,000 0% 0% 0% 100% $50,350,000 Amputation 731 $20,000 50% 31% 11% 8% $4,307,063 Burns 2,078 $15,000 50% 31% 11% 8% $9,177,356 Poisoning 407 $5,000 50% 31% 11% 8% $599,676 Eye Injury (Blindness) 56 $10,000 50% 31% 11% 8% $165,656 Respiratory Condition 1,514 $5,000 50% 31% 11% 8% $2,228,629 Hearing Loss 381 $10,000 50% 31% 11% 8% $1,120,573 Circulatory Condition 60 $10,000 50% 31% 11% 8% $175,228 Back Injury 30,544 $5,000 50% 31% 11% 8% $44,975,672 Skin Disorder 1,804 $5,000 50% 31% 11% 8% $2,655,654 Brain Damage 1,351 $10,000 50% 31% 11% 8% $3,977,959 Spinal Cord Injuries 429 $20,000 50% 31% 11% 8% $2,525,338 Total $122,258,801
Note: For discussion purposes only, not intended as a recommendation of policy specifics.
It is important to note that this system could be much more efficient in benefit delivery. Employers who choose to manage their HPB risk internally53 would see 100 percent efficiency – only spending money on HPBs when a serious injury arises. Employers who choose to add an additional rider to their workers’ compensation policy would see at least 55 cents of each dollar spent allocated to injured worker benefits system‐wide.
Data for Table 5 was obtained from the TDI’s “Texas Workers’ Compensation System Data Report” 2005 and the Closed Claim Surveys.
The number of annual injuries by injury type was derived from the average annual rate between 2000 and 2003 from the Closed Claim Surveys.
The Hazard Pay Benefit is a theoretical estimate for illustrative purposes only based on the total amount of awards or settlements by injury type, divided by the average annual injury rates for each injury type. The resulting figure is then rounded for simplicity.
The Compensation Factors and Impairment Ratings are for illustrative and discussion purposes only.
For source reference and detail, please see Appendix A: Methodology.
Key benefits for injured workers that the “HPB”/“BSE” program would include:
A direct lump‐sum benefit, payable within close proximity to the injury. A benefit payment that recognizes the long‐term hardship created by the
workplace injury regardless of income level. Redistribution of the monies currently spent on 3rd party liability insurance
and lawsuits to a structure that more efficiently and more equitably provides compensation for all seriously injured workers.
Rapid feedback – the cost of the HPB – to the employer for unsafe work practices and incentives for vigilance in improving workplace safety.
Providing a broader reaching incentive – i.e., all employers – for employers to engage in safe practices in the workplace due to rapid payout requirement of Hazard Pay Benefit.
Key benefits for employers that this program would include:
Eliminating the risk of becoming the unlucky “example” and having to pay a disproportionate settlement above and beyond standard workers’ compensation benefits.
Providing greater control over costs; managing the risk of a defined benefit for discrete occurrences lends itself to more proactive behaviors than the 1 in 735 chance of defending a lawsuit.
Remove the risk management focus from litigation protection to workplace safety.
53 Allowing HPB self‐insurance would probably require a similar qualification process as the Certified Self‐Insurance program.
31
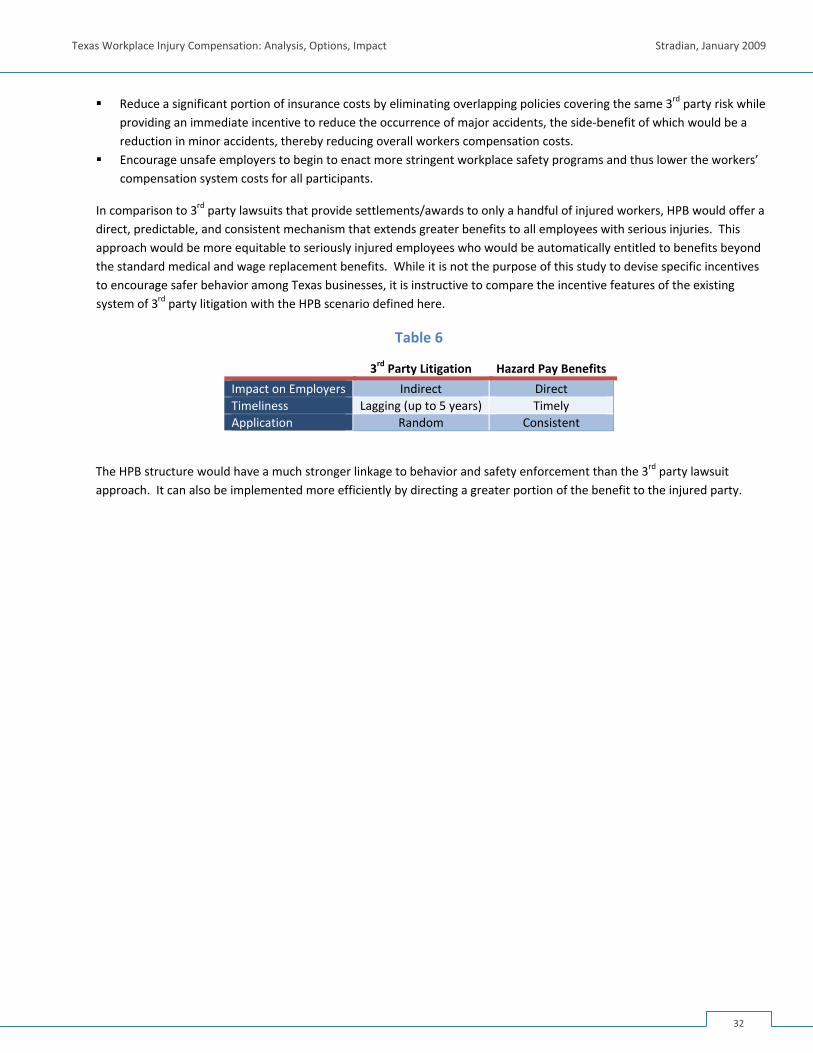
Texas Workplace Injury Compensation: Analysis, Options, Impact Stradian, January 2009
Reduce a significant portion of insurance costs by eliminating overlapping policies covering the same 3rd party risk while providing an immediate incentive to reduce the occurrence of major accidents, the side‐benefit of which would be a reduction in minor accidents, thereby reducing overall workers compensation costs.
Encourage unsafe employers to begin to enact more stringent workplace safety programs and thus lower the workers’ compensation system costs for all participants.
In comparison to 3rd party lawsuits that provide settlements/awards to only a handful of injured workers, HPB would offer a direct, predictable, and consistent mechanism that extends greater benefits to all employees with serious injuries. This approach would be more equitable to seriously injured employees who would be automatically entitled to benefits beyond the standard medical and wage replacement benefits. While it is not the purpose of this study to devise specific incentives to encourage safer behavior among Texas businesses, it is instructive to compare the incentive features of the existing system of 3rd party litigation with the HPB scenario defined here.
Table 6
3rd Party Litigation Hazard Pay Benefits
Impact on Employers Indirect DirectTimeliness Lagging (up to 5 years) TimelyApplication Random Consistent
The HPB structure would have a much stronger linkage to behavior and safety enforcement than the 3rd party lawsuit approach. It can also be implemented more efficiently by directing a greater portion of the benefit to the injured party.
32
Texas Workplace Injury Compensation: Analysis, Options, Impact Stradian, January 2009
IN CONCLUSION The title of this report, Texas Workplace Injury Compensation, purposefully does not include the term workers’ compensation precisely because the extent of workplace injury compensation does not begin or end with the workers’ compensation system. The Texas system is a freedom of choice system which includes businesses that subscribe and businesses that do not subscribe to the workers’ compensation system. The focus of this report is to explore the impact of workplace injury compensation on injured workers and businesses that subscribe to the workers’ compensation system. In addition, this study explores all the relevant major costs of managing workplace injuries, whether through the traditional workers’ compensation system or via 3rd party liability lawsuits. Central to the findings of this report is an analysis of the inefficiencies in the workers’ compensation and 3rd party liability systems. In summary, they are:
Return on dollar spend of the 3rd party liability system54 Cost of Over‐Insurance to protect against 3rd party liability claims Asymmetric distribution of benefits to injured workers
In addition, the report also identified nine workplace safety and cost containment levers including:
Job‐Site Safety Plan Schedule Ratings Negotiated Experience Modifiers OSHA Regulations Medical Networks Disability Management Impairment Income Benefits Experience Modifier Basis of Rate 3rd Party Lawsuits Ability to be a non‐subscriber55
As previously discussed some of these levers offer a proactive approach to workplace safety and/or cost containment such as Job‐Site Safety Plans and OSHA regulations. Other levers are rapidly reactive such as Medical Networks and Disability Management. Others lag significantly behind the occurrence of the injury and may be administered infrequently; these lagging levers have an almost inconsequential effect on workplace safety but disproportionately affect workplace injury compensation costs – 3rd Party Lawsuits.
The foregoing analysis identifies the strengths and weaknesses of the existing system, and explores potential options for addressing those weaknesses. Two relatively straightforward approaches for increasing benefits and reducing costs were discussed. The discussion around the third option – a hazard benefit pay that provides extra benefits to seriously injured employees – leads to the conclusion that this type of approach would be more efficient, and more effective, than the current 3rd party lawsuit system. For such a system to work, however, broader lawsuit immunity for participants in complex work environments would be necessary to shift the risk management focus from lawsuits to predictable and consistent additional benefits to all seriously injured employees. This kind of system would also potentially provide a more effective incentive for employers to provide a safe work environment for their employees, contracting partners, and guests.
The alternatives presented here provide a directional view of the range of possible outcomes; however, further analysis of these and other options would be necessary to define specific policy recommendations.
54 The amount of money received by the plaintiff after all expenses compared to the amount of total dollars spent on the case. 55 This lever that indicates whether the workers’ compensation system is working well for Texas businesses. This lever does not encourage a safe workplace.
33
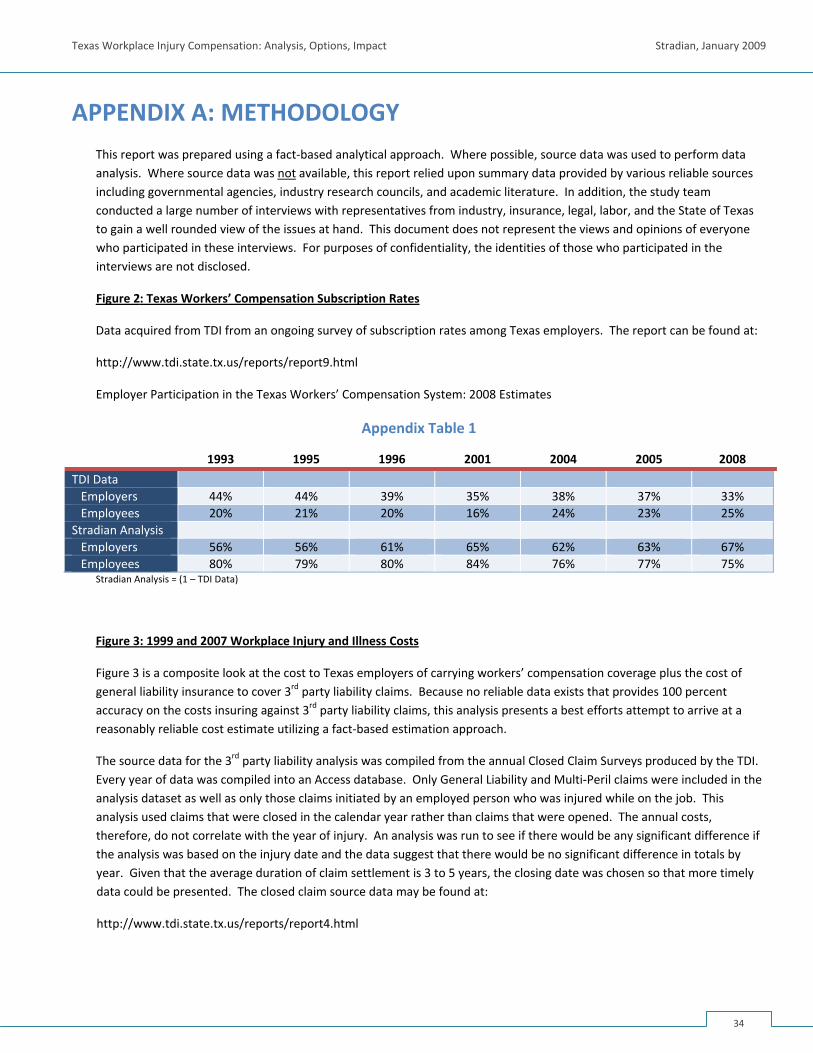
Texas Workplace Injury Compensation: Analysis, Options, Impact Stradian, January 2009
APPENDIX A: METHODOLOGY This report was prepared using a fact‐based analytical approach. Where possible, source data was used to perform data analysis. Where source data was not available, this report relied upon summary data provided by various reliable sources including governmental agencies, industry research councils, and academic literature. In addition, the study team conducted a large number of interviews with representatives from industry, insurance, legal, labor, and the State of Texas to gain a well rounded view of the issues at hand. This document does not represent the views and opinions of everyone who participated in these interviews. For purposes of confidentiality, the identities of those who participated in the interviews are not disclosed.
Figure 2: Texas Workers’ Compensation Subscription Rates
Data acquired from TDI from an ongoing survey of subscription rates among Texas employers. The report can be found at:
http://www.tdi.state.tx.us/reports/report9.html
Employer Participation in the Texas Workers’ Compensation System: 2008 Estimates
Appendix Table 1
1993 1995 1996 2001 2004 2005 2008
TDI Data Employers 44% 44% 39% 35% 38% 37% 33% Employees 20% 21% 20% 16% 24% 23% 25%Stradian Analysis Employers 56% 56% 61% 65% 62% 63% 67% Employees 80% 79% 80% 84% 76% 77% 75%
Stradian Analysis = (1 – TDI Data)
Figure 3: 1999 and 2007 Workplace Injury and Illness Costs
Figure 3 is a composite look at the cost to Texas employers of carrying workers’ compensation coverage plus the cost of general liability insurance to cover 3rd party liability claims. Because no reliable data exists that provides 100 percent accuracy on the costs insuring against 3rd party liability claims, this analysis presents a best efforts attempt to arrive at a reasonably reliable cost estimate utilizing a fact‐based estimation approach.
The source data for the 3rd party liability analysis was compiled from the annual Closed Claim Surveys produced by the TDI. Every year of data was compiled into an Access database. Only General Liability and Multi‐Peril claims were included in the analysis dataset as well as only those claims initiated by an employed person who was injured while on the job. This analysis used claims that were closed in the calendar year rather than claims that were opened. The annual costs, therefore, do not correlate with the year of injury. An analysis was run to see if there would be any significant difference if the analysis was based on the injury date and the data suggest that there would be no significant difference in totals by year. Given that the average duration of claim settlement is 3 to 5 years, the closing date was chosen so that more timely data could be presented. The closed claim source data may be found at:
http://www.tdi.state.tx.us/reports/report4.html
34
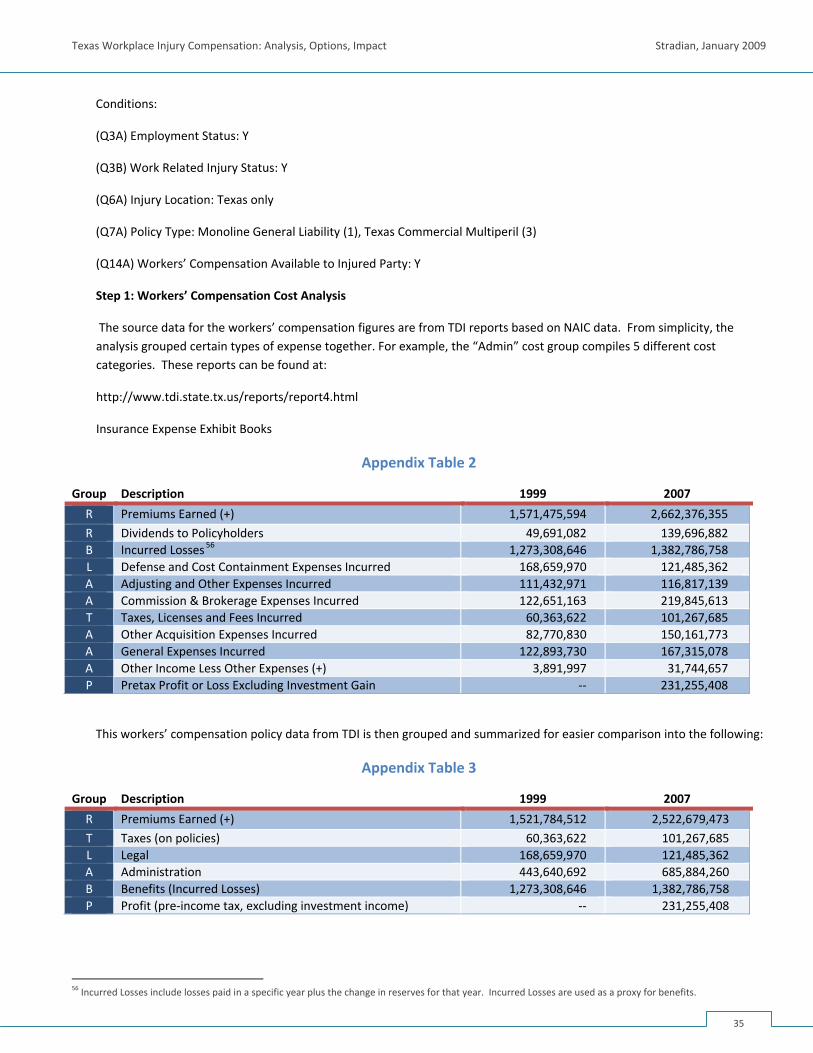
Texas Workplace Injury Compensation: Analysis, Options, Impact Stradian, January 2009
Conditions:
(Q3A) Employment Status: Y
(Q3B) Work Related Injury Status: Y
(Q6A) Injury Location: Texas only
(Q7A) Policy Type: Monoline General Liability (1), Texas Commercial Multiperil (3)
(Q14A) Workers’ Compensation Available to Injured Party: Y
Step 1: Workers’ Compensation Cost Analysis
The source data for the workers’ compensation figures are from TDI reports based on NAIC data. From simplicity, the analysis grouped certain types of expense together. For example, the “Admin” cost group compiles 5 different cost categories. These reports can be found at:
http://www.tdi.state.tx.us/reports/report4.html
Insurance Expense Exhibit Books
Appendix Table 2
Group Description 1999 2007
R Premiums Earned (+) 1,571,475,594 2,662,376,355
R Dividends to Policyholders 49,691,082 139,696,882B Incurred Losses56 1,273,308,646 1,382,786,758L Defense and Cost Containment Expenses Incurred 168,659,970 121,485,362A Adjusting and Other Expenses Incurred 111,432,971 116,817,139A Commission & Brokerage Expenses Incurred 122,651,163 219,845,613T Taxes, Licenses and Fees Incurred 60,363,622 101,267,685A Other Acquisition Expenses Incurred 82,770,830 150,161,773A General Expenses Incurred 122,893,730 167,315,078A Other Income Less Other Expenses (+) 3,891,997 31,744,657P Pretax Profit or Loss Excluding Investment Gain ‐‐ 231,255,408
This workers’ compensation policy data from TDI is then grouped and summarized for easier comparison into the following:
Appendix Table 3
Group Description 1999 2007
R Premiums Earned (+) 1,521,784,512 2,522,679,473
T Taxes (on policies) 60,363,622 101,267,685L Legal 168,659,970 121,485,362A Administration 443,640,692 685,884,260B Benefits (Incurred Losses) 1,273,308,646 1,382,786,758P Profit (pre‐income tax, excluding investment income) ‐‐ 231,255,408
56 Incurred Losses include losses paid in a specific year plus the change in reserves for that year. Incurred Losses are used as a proxy for benefits.
35
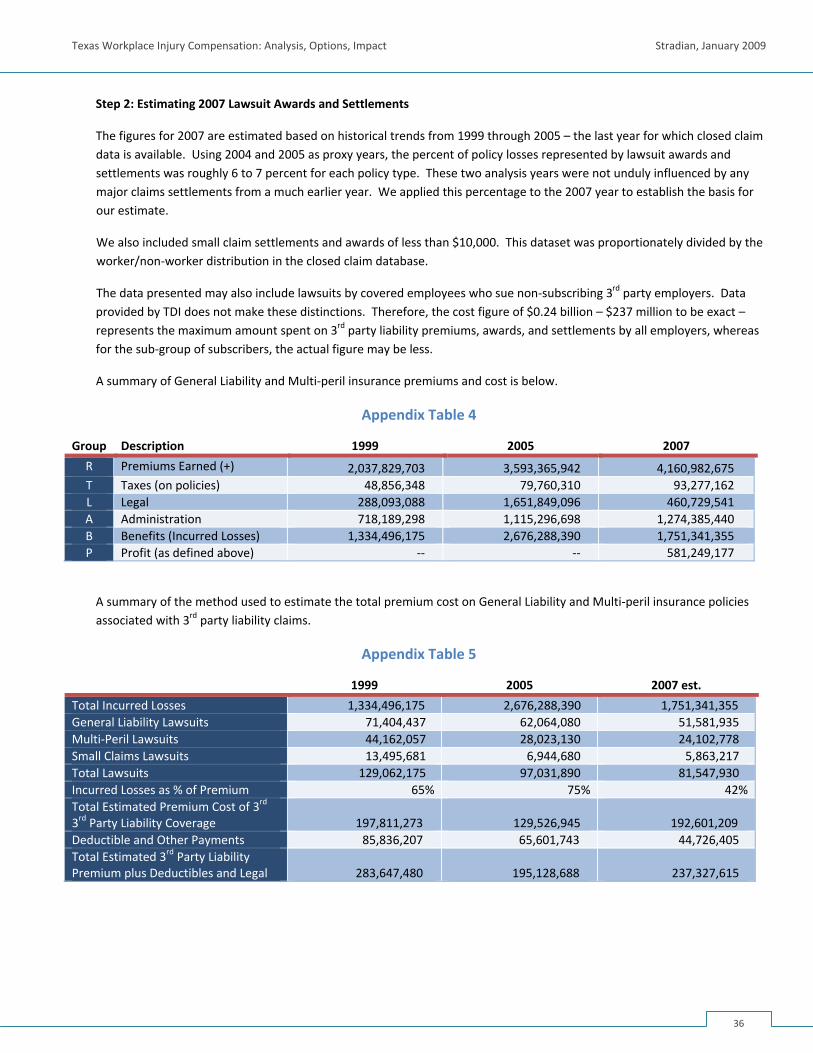
Texas Workplace Injury Compensation: Analysis, Options, Impact Stradian, January 2009
Step 2: Estimating 2007 Lawsuit Awards and Settlements
The figures for 2007 are estimated based on historical trends from 1999 through 2005 – the last year for which closed claim data is available. Using 2004 and 2005 as proxy years, the percent of policy losses represented by lawsuit awards and settlements was roughly 6 to 7 percent for each policy type. These two analysis years were not unduly influenced by any major claims settlements from a much earlier year. We applied this percentage to the 2007 year to establish the basis for our estimate.
We also included small claim settlements and awards of less than $10,000. This dataset was proportionately divided by the worker/non‐worker distribution in the closed claim database.
The data presented may also include lawsuits by covered employees who sue non‐subscribing 3rd party employers. Data provided by TDI does not make these distinctions. Therefore, the cost figure of $0.24 billion – $237 million to be exact – represents the maximum amount spent on 3rd party liability premiums, awards, and settlements by all employers, whereas for the sub‐group of subscribers, the actual figure may be less.
A summary of General Liability and Multi‐peril insurance premiums and cost is below.
Appendix Table 4
Group Description 1999 2005 2007
R Premiums Earned (+) 2,037,829,703 3,593,365,942 4,160,982,675 T Taxes (on policies) 48,856,348 79,760,310 93,277,162L Legal 288,093,088 1,651,849,096 460,729,541A Administration 718,189,298 1,115,296,698 1,274,385,440B Benefits (Incurred Losses) 1,334,496,175 2,676,288,390 1,751,341,355P Profit (as defined above) ‐‐ ‐‐ 581,249,177
A summary of the method used to estimate the total premium cost on General Liability and Multi‐peril insurance policies associated with 3rd party liability claims.
Appendix Table 5
1999 2005 2007 est.
Total Incurred Losses 1,334,496,175 2,676,288,390 1,751,341,355General Liability Lawsuits 71,404,437 62,064,080 51,581,935Multi‐Peril Lawsuits 44,162,057 28,023,130 24,102,778Small Claims Lawsuits 13,495,681 6,944,680 5,863,217Total Lawsuits 129,062,175 97,031,890 81,547,930Incurred Losses as % of Premium 65% 75% 42%Total Estimated Premium Cost of 3rd 3rd Party Liability Coverage 197,811,273
129,526,945 192,601,209
Deductible and Other Payments 85,836,207 65,601,743 44,726,405Total Estimated 3rd Party Liability Premium plus Deductibles and Legal 283,647,480 195,128,688 237,327,615
36
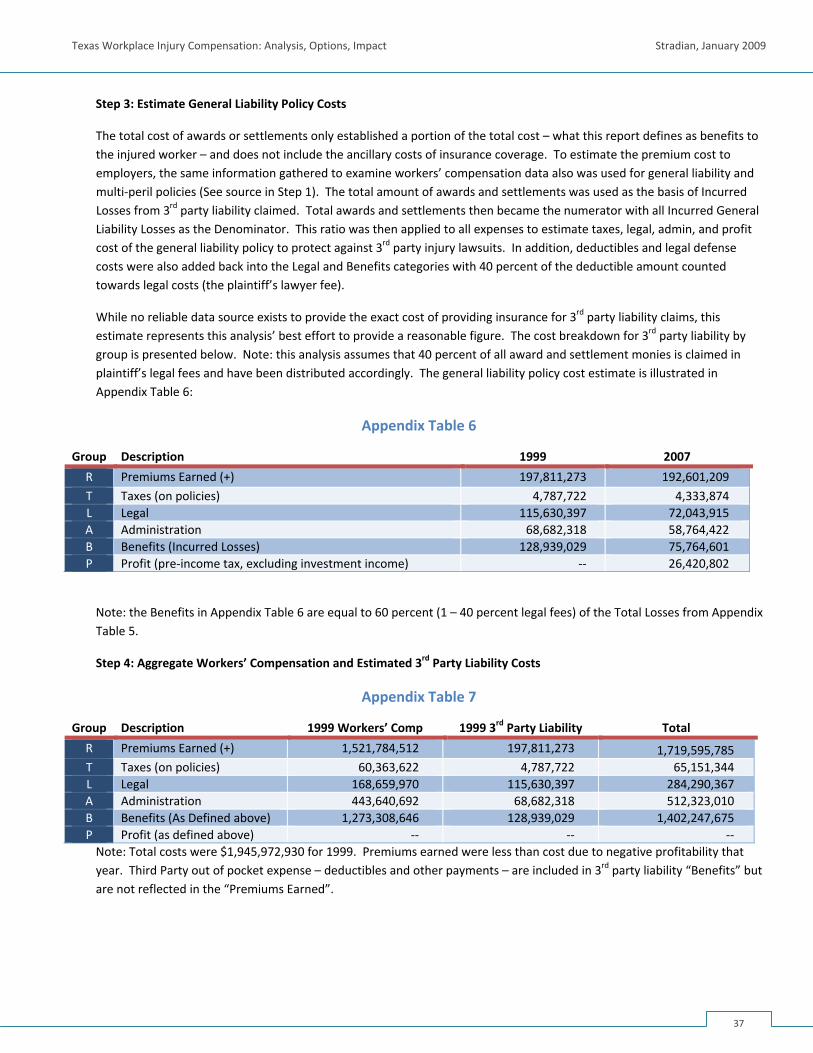
Texas Workplace Injury Compensation: Analysis, Options, Impact Stradian, January 2009
Step 3: Estimate General Liability Policy Costs
The total cost of awards or settlements only established a portion of the total cost – what this report defines as benefits to the injured worker – and does not include the ancillary costs of insurance coverage. To estimate the premium cost to employers, the same information gathered to examine workers’ compensation data also was used for general liability and multi‐peril policies (See source in Step 1). The total amount of awards and settlements was used as the basis of Incurred Losses from 3rd party liability claimed. Total awards and settlements then became the numerator with all Incurred General Liability Losses as the Denominator. This ratio was then applied to all expenses to estimate taxes, legal, admin, and profit cost of the general liability policy to protect against 3rd party injury lawsuits. In addition, deductibles and legal defense costs were also added back into the Legal and Benefits categories with 40 percent of the deductible amount counted towards legal costs (the plaintiff’s lawyer fee).
While no reliable data source exists to provide the exact cost of providing insurance for 3rd party liability claims, this estimate represents this analysis’ best effort to provide a reasonable figure. The cost breakdown for 3rd party liability by group is presented below. Note: this analysis assumes that 40 percent of all award and settlement monies is claimed in plaintiff’s legal fees and have been distributed accordingly. The general liability policy cost estimate is illustrated in Appendix Table 6:
Appendix Table 6
Group Description 1999 2007
R Premiums Earned (+) 197,811,273 192,601,209
T Taxes (on policies) 4,787,722 4,333,874L Legal 115,630,397 72,043,915A Administration 68,682,318 58,764,422B Benefits (Incurred Losses) 128,939,029 75,764,601P Profit (pre‐income tax, excluding investment income) ‐‐ 26,420,802
Note: the Benefits in Appendix Table 6 are equal to 60 percent (1 – 40 percent legal fees) of the Total Losses from Appendix Table 5.
Step 4: Aggregate Workers’ Compensation and Estimated 3rd Party Liability Costs
Appendix Table 7
Group Description 1999 Workers’ Comp 1999 3rd Party Liability Total
R Premiums Earned (+) 1,521,784,512 197,811,273 1,719,595,785 T Taxes (on policies) 60,363,622 4,787,722 65,151,344L Legal 168,659,970 115,630,397 284,290,367A Administration 443,640,692 68,682,318 512,323,010B Benefits (As Defined above) 1,273,308,646 128,939,029 1,402,247,675P Profit (as defined above) ‐‐ ‐‐ ‐‐Note: Total costs were $1,945,972,930 for 1999. Premiums earned were less than cost due to negative profitability that year. Third Party out of pocket expense – deductibles and other payments – are included in 3rd party liability “Benefits” but are not reflected in the “Premiums Earned”.
37
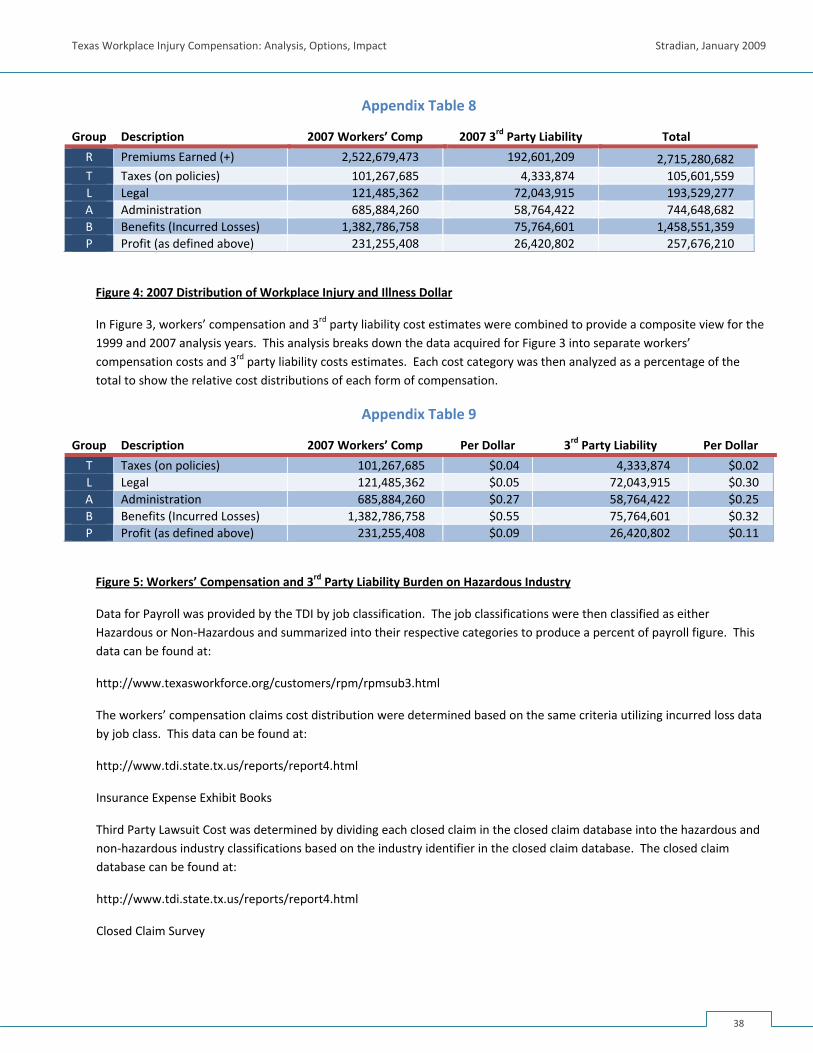
Texas Workplace Injury Compensation: Analysis, Options, Impact Stradian, January 2009
Appendix Table 8
Group Description 2007 Workers’ Comp 2007 3rd Party Liability Total
R Premiums Earned (+) 2,522,679,473 192,601,209 2,715,280,682 T Taxes (on policies) 101,267,685 4,333,874 105,601,559L Legal 121,485,362 72,043,915 193,529,277A Administration 685,884,260 58,764,422 744,648,682B Benefits (Incurred Losses) 1,382,786,758 75,764,601 1,458,551,359P Profit (as defined above) 231,255,408 26,420,802 257,676,210
Figure 4: 2007 Distribution of Workplace Injury and Illness Dollar
In Figure 3, workers’ compensation and 3rd party liability cost estimates were combined to provide a composite view for the 1999 and 2007 analysis years. This analysis breaks down the data acquired for Figure 3 into separate workers’ compensation costs and 3rd party liability costs estimates. Each cost category was then analyzed as a percentage of the total to show the relative cost distributions of each form of compensation.
Appendix Table 9
Group Description 2007 Workers’ Comp Per Dollar 3rd Party Liability Per Dollar
T Taxes (on policies) 101,267,685 $0.04 4,333,874 $0.02L Legal 121,485,362 $0.05 72,043,915 $0.30A Administration 685,884,260 $0.27 58,764,422 $0.25B Benefits (Incurred Losses) 1,382,786,758 $0.55 75,764,601 $0.32P Profit (as defined above) 231,255,408 $0.09 26,420,802 $0.11
Figure 5: Workers’ Compensation and 3rd Party Liability Burden on Hazardous Industry
Data for Payroll was provided by the TDI by job classification. The job classifications were then classified as either Hazardous or Non‐Hazardous and summarized into their respective categories to produce a percent of payroll figure. This data can be found at:
http://www.texasworkforce.org/customers/rpm/rpmsub3.html
The workers’ compensation claims cost distribution were determined based on the same criteria utilizing incurred loss data by job class. This data can be found at:
http://www.tdi.state.tx.us/reports/report4.html
Insurance Expense Exhibit Books
Third Party Lawsuit Cost was determined by dividing each closed claim in the closed claim database into the hazardous and non‐hazardous industry classifications based on the industry identifier in the closed claim database. The closed claim database can be found at:
http://www.tdi.state.tx.us/reports/report4.html
Closed Claim Survey
38
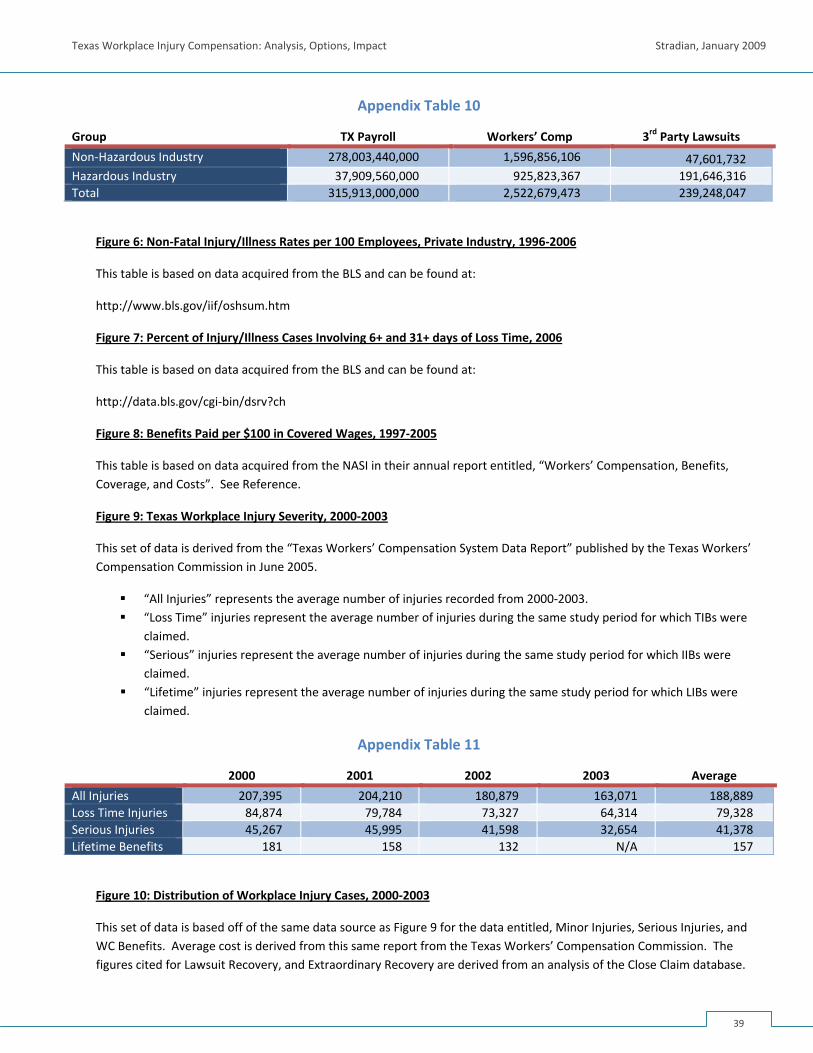
Texas Workplace Injury Compensation: Analysis, Options, Impact Stradian, January 2009
Appendix Table 10
Group TX Payroll Workers’ Comp 3rd Party Lawsuits
Non‐Hazardous Industry 278,003,440,000 1,596,856,106 47,601,732 Hazardous Industry 37,909,560,000 925,823,367 191,646,316Total 315,913,000,000 2,522,679,473 239,248,047
Figure 6: Non‐Fatal Injury/Illness Rates per 100 Employees, Private Industry, 1996‐2006
This table is based on data acquired from the BLS and can be found at:
http://www.bls.gov/iif/oshsum.htm
Figure 7: Percent of Injury/Illness Cases Involving 6+ and 31+ days of Loss Time, 2006
This table is based on data acquired from the BLS and can be found at:
http://data.bls.gov/cgi‐bin/dsrv?ch
Figure 8: Benefits Paid per $100 in Covered Wages, 1997‐2005
This table is based on data acquired from the NASI in their annual report entitled, “Workers’ Compensation, Benefits, Coverage, and Costs”. See Reference.
Figure 9: Texas Workplace Injury Severity, 2000‐2003
This set of data is derived from the “Texas Workers’ Compensation System Data Report” published by the Texas Workers’ Compensation Commission in June 2005.
“All Injuries” represents the average number of injuries recorded from 2000‐2003. “Loss Time” injuries represent the average number of injuries during the same study period for which TIBs were
claimed. “Serious” injuries represent the average number of injuries during the same study period for which IIBs were
claimed. “Lifetime” injuries represent the average number of injuries during the same study period for which LIBs were
claimed.
Appendix Table 11
2000 2001 2002 2003 Average
All Injuries 207,395 204,210 180,879 163,071 188,889Loss Time Injuries 84,874 79,784 73,327 64,314 79,328Serious Injuries 45,267 45,995 41,598 32,654 41,378Lifetime Benefits 181 158 132 N/A 157
Figure 10: Distribution of Workplace Injury Cases, 2000‐2003
This set of data is based off of the same data source as Figure 9 for the data entitled, Minor Injuries, Serious Injuries, and WC Benefits. Average cost is derived from this same report from the Texas Workers’ Compensation Commission. The figures cited for Lawsuit Recovery, and Extraordinary Recovery are derived from an analysis of the Close Claim database.
39
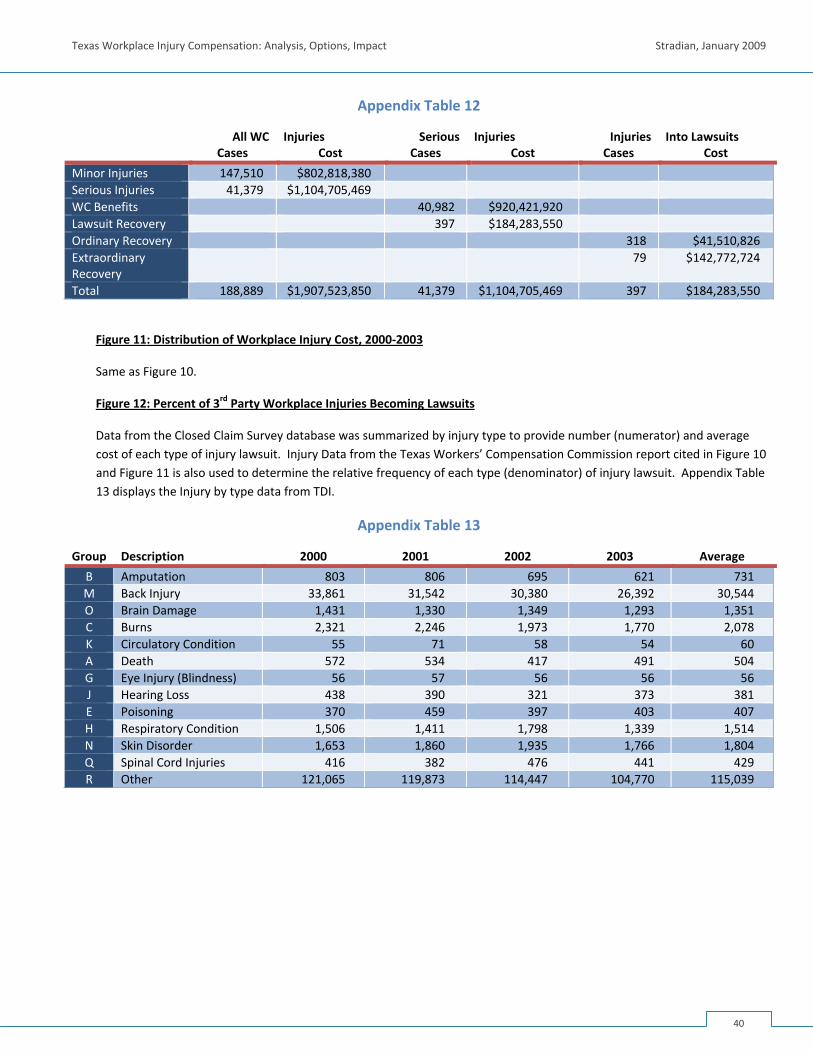
Texas Workplace Injury Compensation: Analysis, Options, Impact Stradian, January 2009
Appendix Table 12
All WC Cases
Injuries Cost
SeriousCases
InjuriesCost
Injuries Cases
Into LawsuitsCost
Minor Injuries 147,510 $802,818,380 Serious Injuries 41,379 $1,104,705,469 WC Benefits 40,982 $920,421,920 Lawsuit Recovery 397 $184,283,550 Ordinary Recovery 318 $41,510,826Extraordinary Recovery
79 $142,772,724
Total 188,889 $1,907,523,850 41,379 $1,104,705,469 397 $184,283,550
Figure 11: Distribution of Workplace Injury Cost, 2000‐2003
Same as Figure 10.
Figure 12: Percent of 3rd Party Workplace Injuries Becoming Lawsuits
Data from the Closed Claim Survey database was summarized by injury type to provide number (numerator) and average cost of each type of injury lawsuit. Injury Data from the Texas Workers’ Compensation Commission report cited in Figure 10 and Figure 11 is also used to determine the relative frequency of each type (denominator) of injury lawsuit. Appendix Table 13 displays the Injury by type data from TDI.
Appendix Table 13
Group Description 2000 2001 2002 2003 Average
B Amputation 803 806 695 621 731M Back Injury 33,861 31,542 30,380 26,392 30,544O Brain Damage 1,431 1,330 1,349 1,293 1,351C Burns 2,321 2,246 1,973 1,770 2,078K Circulatory Condition 55 71 58 54 60A Death 572 534 417 491 504G Eye Injury (Blindness) 56 57 56 56 56J Hearing Loss 438 390 321 373 381E Poisoning 370 459 397 403 407H Respiratory Condition 1,506 1,411 1,798 1,339 1,514N Skin Disorder 1,653 1,860 1,935 1,766 1,804Q Spinal Cord Injuries 416 382 476 441 429R Other 121,065 119,873 114,447 104,770 115,039
40
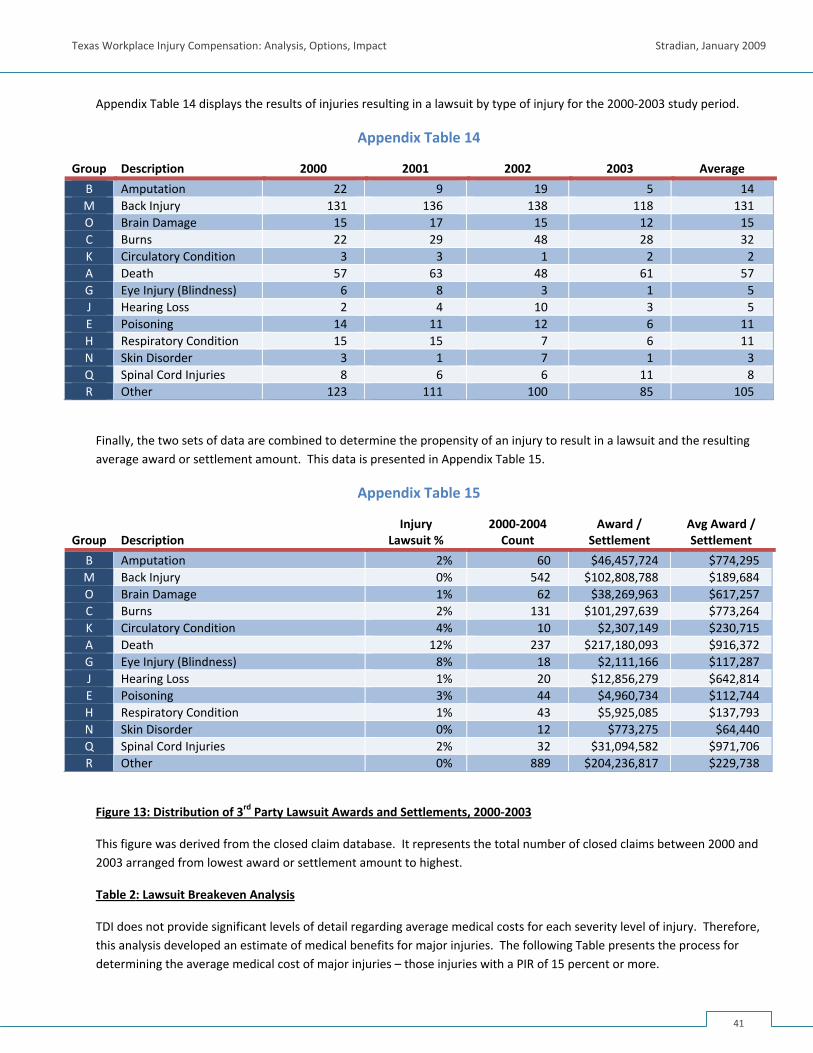
Texas Workplace Injury Compensation: Analysis, Options, Impact Stradian, January 2009
Appendix Table 14 displays the results of injuries resulting in a lawsuit by type of injury for the 2000‐2003 study period.
Appendix Table 14
Group Description 2000 2001 2002 2003 Average
B Amputation 22 9 19 5 14M Back Injury 131 136 138 118 131O Brain Damage 15 17 15 12 15C Burns 22 29 48 28 32K Circulatory Condition 3 3 1 2 2A Death 57 63 48 61 57G Eye Injury (Blindness) 6 8 3 1 5J Hearing Loss 2 4 10 3 5E Poisoning 14 11 12 6 11H Respiratory Condition 15 15 7 6 11N Skin Disorder 3 1 7 1 3Q Spinal Cord Injuries 8 6 6 11 8R Other 123 111 100 85 105
Finally, the two sets of data are combined to determine the propensity of an injury to result in a lawsuit and the resulting average award or settlement amount. This data is presented in Appendix Table 15.
Appendix Table 15
Group
Description
Injury Lawsuit %
2000‐2004 Count
Award / Settlement
Avg Award /Settlement
B Amputation 2% 60 $46,457,724 $774,295M Back Injury 0% 542 $102,808,788 $189,684O Brain Damage 1% 62 $38,269,963 $617,257C Burns 2% 131 $101,297,639 $773,264K Circulatory Condition 4% 10 $2,307,149 $230,715A Death 12% 237 $217,180,093 $916,372G Eye Injury (Blindness) 8% 18 $2,111,166 $117,287J Hearing Loss 1% 20 $12,856,279 $642,814E Poisoning 3% 44 $4,960,734 $112,744H Respiratory Condition 1% 43 $5,925,085 $137,793N Skin Disorder 0% 12 $773,275 $64,440Q Spinal Cord Injuries 2% 32 $31,094,582 $971,706R Other 0% 889 $204,236,817 $229,738
Figure 13: Distribution of 3rd Party Lawsuit Awards and Settlements, 2000‐2003
This figure was derived from the closed claim database. It represents the total number of closed claims between 2000 and 2003 arranged from lowest award or settlement amount to highest.
Table 2: Lawsuit Breakeven Analysis
TDI does not provide significant levels of detail regarding average medical costs for each severity level of injury. Therefore, this analysis developed an estimate of medical benefits for major injuries. The following Table presents the process for determining the average medical cost of major injuries – those injuries with a PIR of 15 percent or more.
41
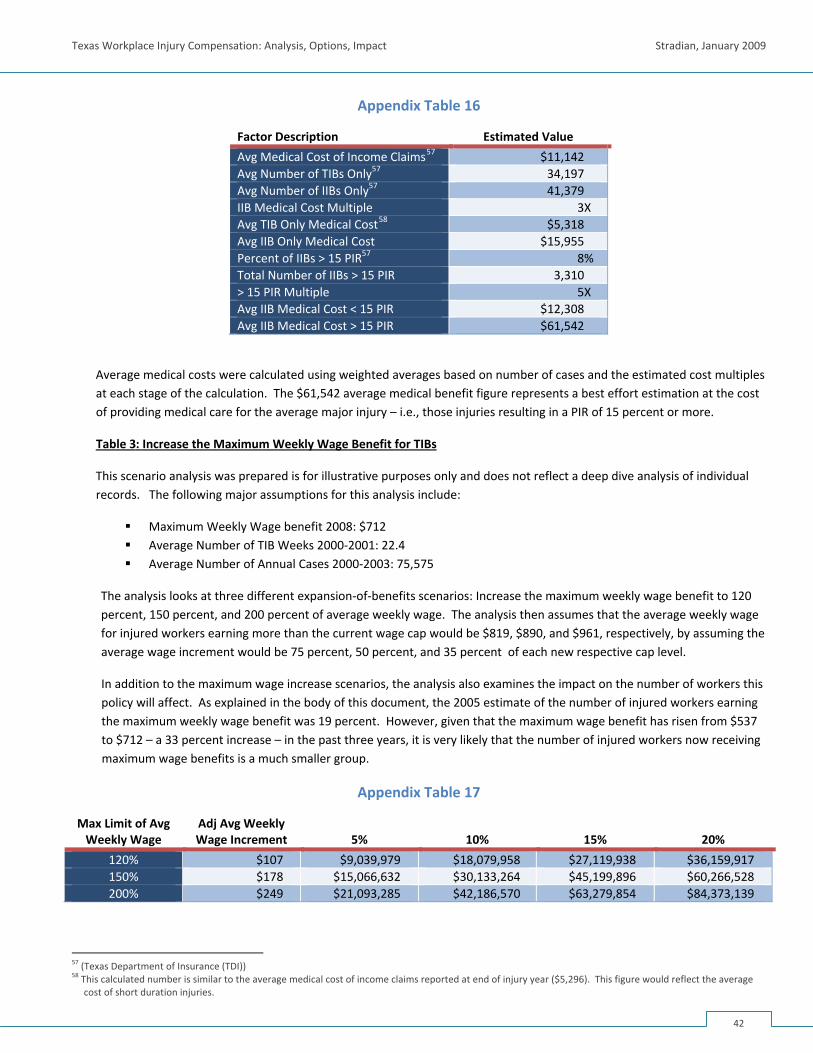
Texas Workplace Injury Compensation: Analysis, Options, Impact Stradian, January 2009
Appendix Table 16
Factor Description Estimated Value
Avg Medical Cost of Income Claims57 $11,142 Avg Number of TIBs Only57 34,197 Avg Number of IIBs Only57 41,379 IIB Medical Cost Multiple 3X Avg TIB Only Medical Cost58 $5,318 Avg IIB Only Medical Cost $15,955 Percent of IIBs > 15 PIR57
8% Total Number of IIBs > 15 PIR 3,310 > 15 PIR Multiple 5X Avg IIB Medical Cost < 15 PIR $12,308 Avg IIB Medical Cost > 15 PIR $61,542
Average medical costs were calculated using weighted averages based on number of cases and the estimated cost multiples at each stage of the calculation. The $61,542 average medical benefit figure represents a best effort estimation at the cost of providing medical care for the average major injury – i.e., those injuries resulting in a PIR of 15 percent or more.
Table 3: Increase the Maximum Weekly Wage Benefit for TIBs
This scenario analysis was prepared is for illustrative purposes only and does not reflect a deep dive analysis of individual records. The following major assumptions for this analysis include:
Maximum Weekly Wage benefit 2008: $712 Average Number of TIB Weeks 2000‐2001: 22.4 Average Number of Annual Cases 2000‐2003: 75,575
The analysis looks at three different expansion‐of‐benefits scenarios: Increase the maximum weekly wage benefit to 120 percent, 150 percent, and 200 percent of average weekly wage. The analysis then assumes that the average weekly wage for injured workers earning more than the current wage cap would be $819, $890, and $961, respectively, by assuming the average wage increment would be 75 percent, 50 percent, and 35 percent of each new respective cap level.
In addition to the maximum wage increase scenarios, the analysis also examines the impact on the number of workers this policy will affect. As explained in the body of this document, the 2005 estimate of the number of injured workers earning the maximum weekly wage benefit was 19 percent. However, given that the maximum wage benefit has risen from $537 to $712 – a 33 percent increase – in the past three years, it is very likely that the number of injured workers now receiving maximum wage benefits is a much smaller group.
Appendix Table 17
Max Limit of Avg Weekly Wage
Adj Avg Weekly Wage Increment 5% 10% 15% 20%
120% $107 $9,039,979 $18,079,958 $27,119,938 $36,159,917150% $178 $15,066,632 $30,133,264 $45,199,896 $60,266,528200% $249 $21,093,285 $42,186,570 $63,279,854 $84,373,139
57 (Texas Department of Insurance (TDI)) 58 This calculated number is similar to the average medical cost of income claims reported at end of injury year ($5,296). This figure would reflect the average
cost of short duration injuries.
42
Texas Workplace Injury Compensation: Analysis, Options, Impact Stradian, January 2009
This analysis only covers an increase in TIBs. A similar increase in IIBs, SIBs, and LIBs, would yield an increase in the number presented in Appendix Table 17 of 50 percent.
Sample calculation of LIB extension estimates is as follows:
[Maximum Weekly Wage Benefit] * [Maximum Weekly Wage Increment ‐ 1] * [Average Weekly Wage Increment] * [Number of Cases Currently Exceeding Maximum Weekly Wage Benefit] * [Average Weeks of TIB Benefits]
Table 4: Relax Qualification Requirements of Lifetime Income Benefits
This scenario analysis was prepared is for illustrative purposes only and does not reflect a deep dive analysis of individual records. The following major assumptions for this analysis include:
Average Weekly Wage benefit 2005: $325 Average Number of Annual Cases 2000‐2003: 200
The analysis looks at three different expansion‐of‐benefits scenarios: a modest expiring benefit that on average adds 5 years of additional eligibility, 15 years of additional eligibility, or a full LIB extension that adds 30 years of eligibility. The analysis then assumes that the number of additional LIB recipients could range from 100 additional beneficiaries, all current non‐qualifiers (roughly 200), or grow to 300 due to an increase in the number of applications for LIBs that may occur given the broadened qualification of benefit. This study does not examine the most likely outcome, but rather presents this cost data as instructional for policy discussion.
Sample calculation of LIB extension estimates is as follows:
[Average Weekly Wage Benefit] * [52 weeks] * [Average Years of Eligibility] * [Number of additional LIB recipients]
Table 5: Redirect 3rd Party Lawsuit Costs to All Seriously Injured Workers
This hypothetical scenario is a simplified version of what a more complex HPB plan might look like. The analysis takes the total award and settlement amount from 3rd party liability cases and distributes (divides) this amount among the annual injury totals by injury type. This action creates the Hazard Pay Benefit. The HPB under this scenario, would represent the maximum HPB for each serious injury. The scenario then distributes each injury type by severity applying an HPB discount to less severe injuries. TDI reports that 8 percent of all non‐fatal injuries result in a PIR of 15 percent or greater. For this scenario analysis, the breakdown of the incidences by injury type is not available.
In this table, each impairment rating group is assigned a compensation factor. The compensation factor reduces the HPB for less serious injuries. All injuries above a PIR of 15 percent receive full compensation. The distributions among the various impairment rating groups are best estimates of a likely injury distribution developed by Stradian.
43
Texas Workplace Injury Compensation: Analysis, Options, Impact Stradian, January 2009
APPENDIX B: STATUTORY EMPLOYER AND EXCLUSIVE REMEDY
Labor Code Exclusive Remedy and “Statutory Employer” Provisions
Texas law provides that no‐fault workers’ compensation benefits are the exclusive remedy to an injured employee where the employer provides workers’ compensation insurance coverage and such coverage has not been waived. Where there is workers’ compensation coverage, an injured employee cannot sue his or her employer for negligence or other common law tort remedies except under certain statutory exceptions.
Specifically, there are exceptions to this exclusivity for injuries resulting from intentional acts by an employer or co‐worker or gross negligence. For example, the Workers’ Compensation Act bars wrongful‐death actions by survivors for ordinary negligence, but not an action for exemplary damages based on an employer’s gross negligence or intentional act. The Act also does not exempt employers from common law liability for intentional injuries. Nor does the Act prevent an employee from bringing suit against an employer for an assault committed by another employee if the assault is attributable directly to the employer.
Subject to these exceptions, the statute extends the exclusive remedy provision beyond the traditional employer/employee relationship to instances where there is a written agreement between a general contractor and a subcontractor to provide workers’ compensation insurance. If there is a written agreement to provide workers’ compensation insurance, the covered employees of the general contractor is deemed the “statutory employer” of the employees of the subcontractor.
Case Law Defining the Scope of Statutory Employer
The courts have struggled with how to apply the concept of statutory employer where the owner of a project is also the general contractor and where a general contractor has obtained insurance for all of the workers at a job site. In Entergy Gulf States, Inc. v. Summers, an employee of a subcontractor (Summers) was injured and brought suit against Entergy, the owner of the construction project and also the general contractor. The question in the case was whether Entergy could claim the status of statutory employer, and reap the benefit of the exclusive remedy provision, where it was both the owner and general contractor. The Supreme Court construed the language of the statute as unambiguous and determined that nothing in the statutory definition of “general contractor” excluded owners from claiming such status. However, this opinion has been hotly contested and the Supreme Court is currently considering the case on re‐hearing.
In Etie v. Walsh & Albert Co., Ltd., the First District Court of Appeals in Houston considered whether a general contractor could be considered the statutory employer of an injured employee of a subcontractor that was hired by the general contractor’s subcontractor. The Court examined the statute and held that the statutory employer concept essentially transferred up the line of subcontractors to the general contractor that obtained workers’ compensation for the entire job site. The Court came to this conclusion through a somewhat attenuated holding that a midlevel subcontractor can be considered both a subcontractor and a general contractor under the statute and therefore, the statutory employee of a subcontractor/general contractor can be considered an “employee” for the purposes of determining statutory employer status of the primary general contractor.
A more recent decision by the Court of Appeals summarized the holding as allowing the exclusive remedy provision to apply where a general contractor provides workers’ compensation insurance for all workers at a job site. The Court reiterated that this broad interpretation of the statutory employer concept in complex construction projects server the legislative purpose of the Workers’ Compensation Act to “ensure injured workers could obtain reimbursement for medical expenses related to workplace injuries without the time, money, and difficultly of a negligence lawsuit.” However, this issue has yet to be finally decided by the Texas Supreme Court.
44
Texas Workplace Injury Compensation: Analysis, Options, Impact Stradian, January 2009
Notes:
1. See Texas Liability Code: §406.034 §408.001(a) §406.032 408.001(b) §406.123
2. The exclusive remedy provision applies absent certain statutory exceptions (See § 406.032). 3. Reference Cases:
Smith v. Atlantic Richfield Co., 927 S.W. 2d 85, 87 (Texas Appellate – Houston [1st District] 1996, writ denied); see Texas Constitution Article 16 § 26. Reed Tool Co. v. Copelin, 610 S.W. 2d 736 (Tex. 1980) Medina v. Herrera, 927 S.W. 2d 579, 601 (Tex. 1996) No. 05‐0272, 2007 WL 2458027 (Tex. 2007), reh’g granted 135 S.W. 3d 764 (Texas Appellate – Houston [1st District] 2004, petition denied)
45
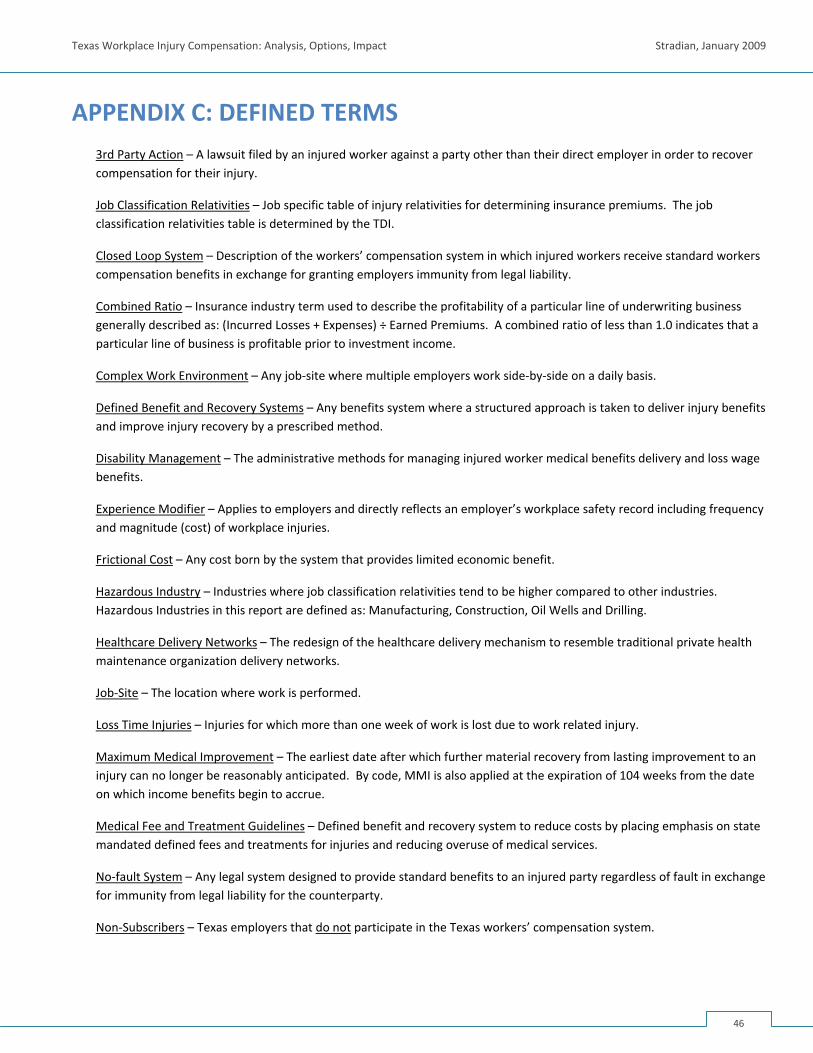
Texas Workplace Injury Compensation: Analysis, Options, Impact Stradian, January 2009
APPENDIX C: DEFINED TERMS 3rd Party Action – A lawsuit filed by an injured worker against a party other than their direct employer in order to recover compensation for their injury.
Job Classification Relativities – Job specific table of injury relativities for determining insurance premiums. The job classification relativities table is determined by the TDI.
Closed Loop System – Description of the workers’ compensation system in which injured workers receive standard workers compensation benefits in exchange for granting employers immunity from legal liability.
Combined Ratio – Insurance industry term used to describe the profitability of a particular line of underwriting business generally described as: (Incurred Losses + Expenses) ÷ Earned Premiums. A combined ratio of less than 1.0 indicates that a particular line of business is profitable prior to investment income.
Complex Work Environment – Any job‐site where multiple employers work side‐by‐side on a daily basis.
Defined Benefit and Recovery Systems – Any benefits system where a structured approach is taken to deliver injury benefits and improve injury recovery by a prescribed method.
Disability Management – The administrative methods for managing injured worker medical benefits delivery and loss wage benefits.
Experience Modifier – Applies to employers and directly reflects an employer’s workplace safety record including frequency and magnitude (cost) of workplace injuries.
Frictional Cost – Any cost born by the system that provides limited economic benefit.
Hazardous Industry – Industries where job classification relativities tend to be higher compared to other industries. Hazardous Industries in this report are defined as: Manufacturing, Construction, Oil Wells and Drilling.
Healthcare Delivery Networks – The redesign of the healthcare delivery mechanism to resemble traditional private health maintenance organization delivery networks.
Job‐Site – The location where work is performed.
Loss Time Injuries – Injuries for which more than one week of work is lost due to work related injury.
Maximum Medical Improvement – The earliest date after which further material recovery from lasting improvement to an injury can no longer be reasonably anticipated. By code, MMI is also applied at the expiration of 104 weeks from the date on which income benefits begin to accrue.
Medical Fee and Treatment Guidelines – Defined benefit and recovery system to reduce costs by placing emphasis on state mandated defined fees and treatments for injuries and reducing overuse of medical services.
No‐fault System – Any legal system designed to provide standard benefits to an injured party regardless of fault in exchange for immunity from legal liability for the counterparty.
Non‐Subscribers – Texas employers that do not participate in the Texas workers’ compensation system.
46
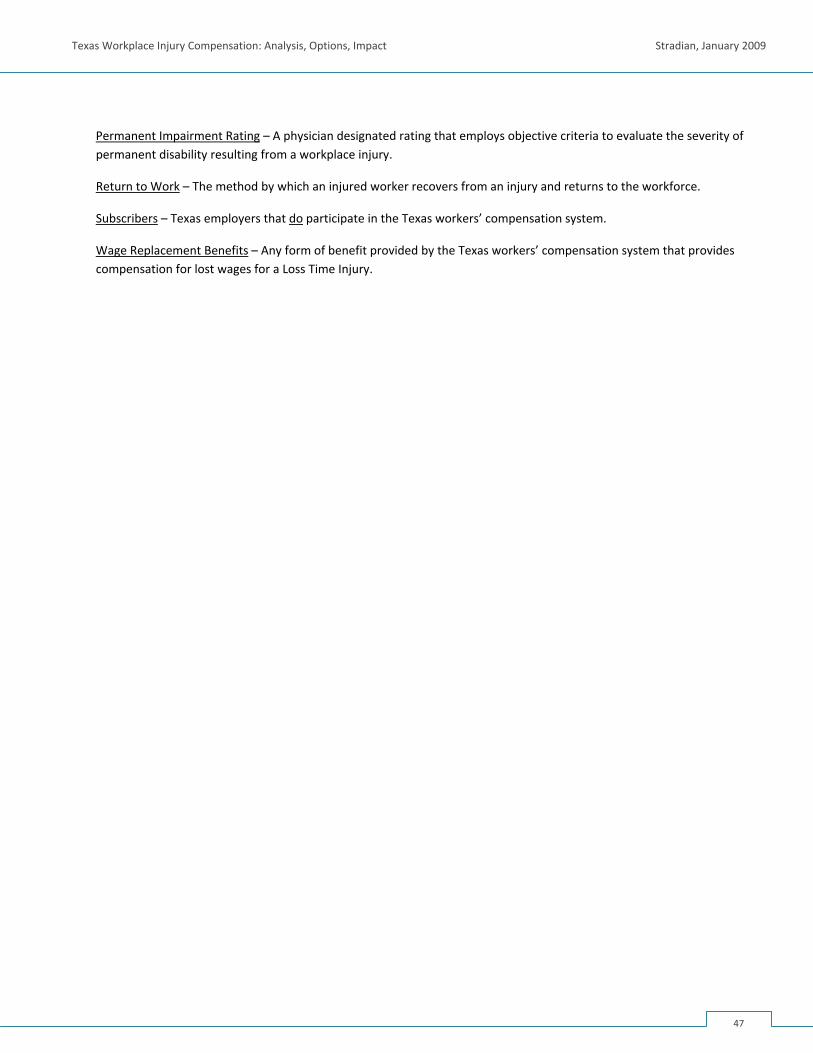
Texas Workplace Injury Compensation: Analysis, Options, Impact Stradian, January 2009
Permanent Impairment Rating – A physician designated rating that employs objective criteria to evaluate the severity of permanent disability resulting from a workplace injury.
Return to Work – The method by which an injured worker recovers from an injury and returns to the workforce.
Subscribers – Texas employers that do participate in the Texas workers’ compensation system.
Wage Replacement Benefits – Any form of benefit provided by the Texas workers’ compensation system that provides compensation for lost wages for a Loss Time Injury.
47
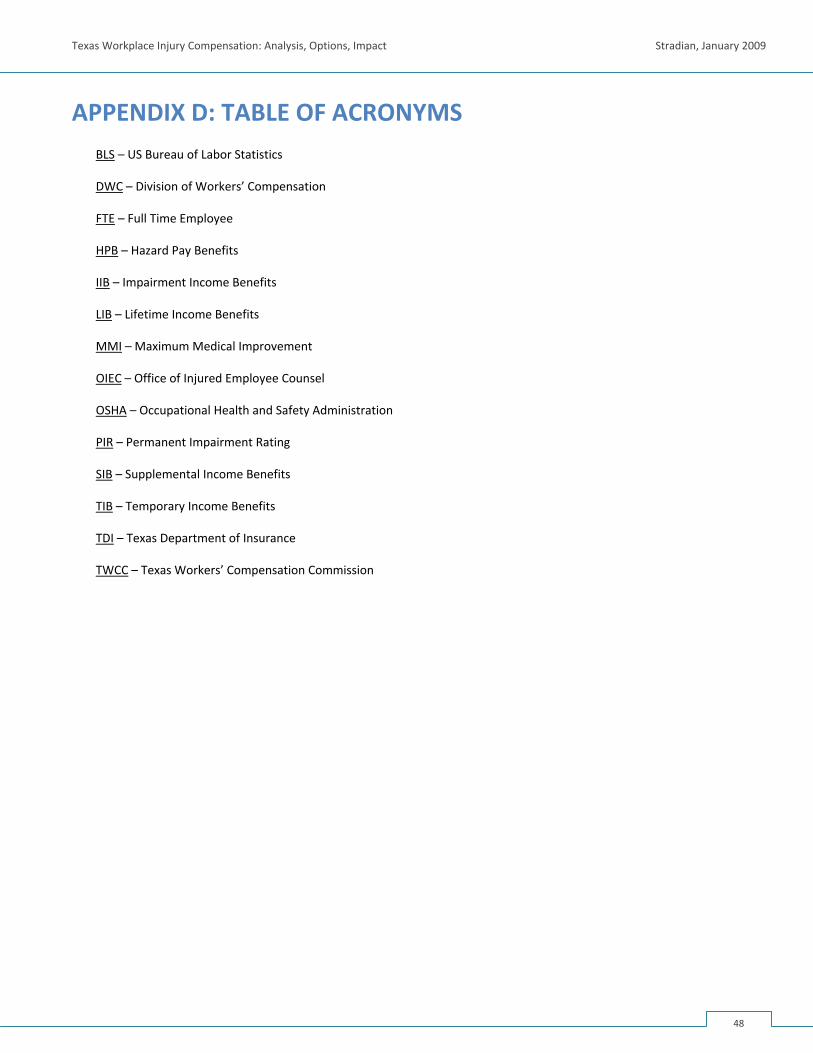
Texas Workplace Injury Compensation: Analysis, Options, Impact Stradian, January 2009
APPENDIX D: TABLE OF ACRONYMS BLS – US Bureau of Labor Statistics
DWC – Division of Workers’ Compensation
FTE – Full Time Employee
HPB – Hazard Pay Benefits
IIB – Impairment Income Benefits
LIB – Lifetime Income Benefits
MMI – Maximum Medical Improvement
OIEC – Office of Injured Employee Counsel
OSHA – Occupational Health and Safety Administration
PIR – Permanent Impairment Rating
SIB – Supplemental Income Benefits
TIB – Temporary Income Benefits
TDI – Texas Department of Insurance
TWCC – Texas Workers’ Compensation Commission
48
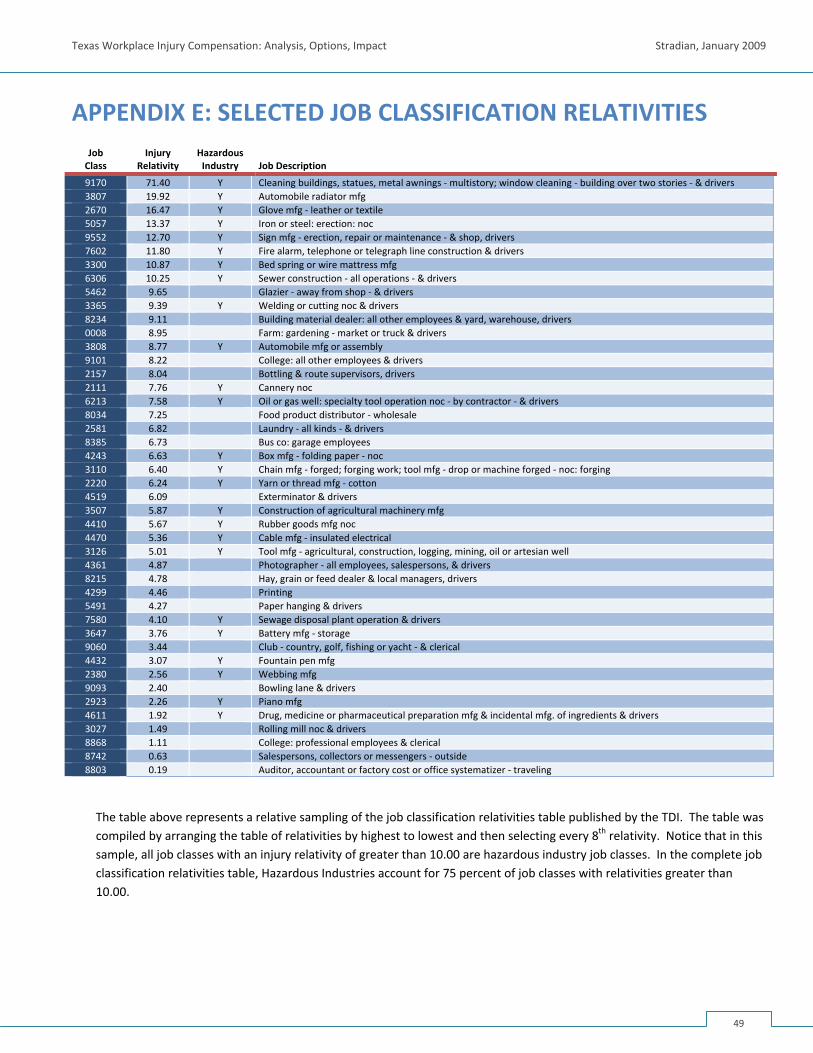
Texas Workplace Injury Compensation: Analysis, Options, Impact Stradian, January 2009
APPENDIX E: SELECTED JOB CLASSIFICATION RELATIVITIES Job Class
Injury Relativity
Hazardous Industry
Job Description
9170 71.40 Y Cleaning buildings, statues, metal awnings ‐multistory; window cleaning ‐ building over two stories ‐ & drivers3807 19.92 Y Automobile radiator mfg2670 16.47 Y Glove mfg ‐ leather or textile5057 13.37 Y Iron or steel: erection: noc9552 12.70 Y Sign mfg ‐ erection, repair or maintenance ‐ & shop, drivers7602 11.80 Y Fire alarm, telephone or telegraph line construction & drivers3300 10.87 Y Bed spring or wire mattress mfg6306 10.25 Y Sewer construction ‐ all operations ‐ & drivers5462 9.65 Glazier ‐ away from shop ‐ & drivers3365 9.39 Y Welding or cutting noc & drivers8234 9.11 Building material dealer: all other employees & yard, warehouse, drivers 0008 8.95 Farm: gardening ‐market or truck & drivers3808 8.77 Y Automobile mfg or assembly9101 8.22 College: all other employees & drivers2157 8.04 Bottling & route supervisors, drivers2111 7.76 Y Cannery noc 6213 7.58 Y Oil or gas well: specialty tool operation noc ‐ by contractor ‐ & drivers8034 7.25 Food product distributor ‐ wholesale2581 6.82 Laundry ‐ all kinds ‐ & drivers8385 6.73 Bus co: garage employees4243 6.63 Y Box mfg ‐ folding paper ‐ noc3110 6.40 Y Chain mfg ‐ forged; forging work; tool mfg ‐ drop or machine forged ‐ noc: forging 2220 6.24 Y Yarn or thread mfg ‐ cotton4519 6.09 Exterminator & drivers3507 5.87 Y Construction of agricultural machinery mfg4410 5.67 Y Rubber goods mfg noc4470 5.36 Y Cable mfg ‐ insulated electrical3126 5.01 Y Tool mfg ‐ agricultural, construction, logging, mining, oil or artesian well4361 4.87 Photographer ‐ all employees, salespersons, & drivers8215 4.78 Hay, grain or feed dealer & local managers, drivers4299 4.46 Printing 5491 4.27 Paper hanging & drivers7580 4.10 Y Sewage disposal plant operation & drivers3647 3.76 Y Battery mfg ‐ storage9060 3.44 Club ‐ country, golf, fishing or yacht ‐ & clerical4432 3.07 Y Fountain pen mfg2380 2.56 Y Webbing mfg 9093 2.40 Bowling lane & drivers2923 2.26 Y Piano mfg 4611 1.92 Y Drug, medicine or pharmaceutical preparation mfg & incidental mfg. of ingredients & drivers3027 1.49 Rolling mill noc & drivers8868 1.11 College: professional employees & clerical8742 0.63 Salespersons, collectors or messengers ‐ outside8803 0.19 Auditor, accountant or factory cost or office systematizer ‐ traveling
The table above represents a relative sampling of the job classification relativities table published by the TDI. The table was compiled by arranging the table of relativities by highest to lowest and then selecting every 8th relativity. Notice that in this sample, all job classes with an injury relativity of greater than 10.00 are hazardous industry job classes. In the complete job classification relativities table, Hazardous Industries account for 75 percent of job classes with relativities greater than 10.00.
49
Texas Workplace Injury Compensation: Analysis, Options, Impact Stradian, January 2009
APPENDIX F: RESEARCH SOURCES Barth, Peter (2004). Compensating Workers for Permanent Partial Disabilities. Social Security Bulletin, 65(4). Bernard Black and Charles Silver. Impact of Recent Civil Justice Reforms. Rejda, George E. (2008). Principles of Risk Management and Insurance. Pearson Addison‐Wesley. Barth, Peter, Helvacian, Mike, & Liu, Te‐Chun (2002). Who Obtains Permanent Partial Disability Benefits: A Six State Analysis. Cambridge, MA: Workers Compensation Research Institute. Barth, Peter, and Niss, Michael (1999). Permanent Partial Disability Benefits: Interstate Differences. Cambridge, MA: Workers Compensation Research Institute. Burton Jr., John F. (2005). Permanent Partial Disability Benefits. In Workplace Injuries and Diseases: Prevention and Compensation; Essays in Honor of Terry Thomason. Edited by Karen Roberts, John F. Burton, Jr., and Matthew M. Bodah. Kalamazoo, MI: W.E. Upjohn Institute for Employment Research. Burton Jr, John. F. (2007). Workers’ Compensation Insurance Industry Increase Profitability in 2006. Workers’ Compensation Policy Review, Vol.7(5), (September/ October): 29‐35. Lyon, Larry, Toben, Bradley J.B., Underwood, James M., Underwood, William D., & Wren, James (2007). Straight from the Horse’s Mouth: Judicial Observations of Jury Behavior and the Need for Tort Reform. Baylor Law Review. National Academy of Social Insurance Publications:
Workers’ Compensation: Benefits, Coverage, and Costs, 2006. Ishita Sengupta, Virginia Reno, and John F. Burton, Jr. with advice of the Study Panel on National Data on Workers’ Compensation. National Academy of Social Insurance. August 2008.
Workers’ Compensation: Benefits, Coverage, and Costs, 2006. Ishita Sengupta, Virginia Reno, and John F. Burton, Jr. with advice of the Study Panel on National Data on Workers’ Compensation. National Academy of Social Insurance. August 2008. Workers’ Compensation: Benefits, Coverage, and Costs, 2005. Ishita Sengupta, Virginia Reno, and John F. Burton, Jr. with advice of the Study Panel on National Data on Workers’ Compensation. National Academy of Social Insurance. August 2007. Workers’ Compensation: Benefits, Coverage, and Costs, 2004. Ishita Sengupta, Virginia Reno, and John F. Burton, Jr. with advice of the Study Panel on National Data on Workers’ Compensation. National Academy of Social Insurance. July 2006. Workers’ Compensation: Benefits, Coverage, and Costs, 2003. Ishita Sengupta, Virginia Reno, and John F. Burton, Jr. with advice of the Study Panel on National Data on Workers’ Compensation. National Academy of Social Insurance. July 2005. Workers’ Compensation: Benefits, Coverage, and Costs, 2002. Cecili Thompson Williams, Virginia Reno, and John F. Burton, Jr. with advice of the Study Panel on National Data on Workers’ Compensation. National Academy of Social Insurance. August 2004. Workers’ Compensation: Benefits, Coverage, and Costs, 2001. Cecili Thompson Williams, Virginia Reno, and John F. Burton, Jr. with advice of the Study Panel on National Data on Workers’ Compensation. National Academy of Social Insurance. July 2003.
50
Texas Workplace Injury Compensation: Analysis, Options, Impact Stradian, January 2009
Workers’ Compensation: Benefits, Coverage, and Costs, 2000, New Estimates. Cecili Thompson Williams, Virginia Reno, and John F. Burton, Jr. with advice of the Study Panel on National Data on Workers’ Compensation. National Academy of Social Insurance. June 2002.
Workers’ Compensation: Benefits, Coverage, and Costs, 1999, New Estimates, 1996‐1998. Daniel Mont, Virginia Reno, John F. Burton, Jr., Cecili Thompson with advice of the Study Panel on National Data on Workers’ Compensation. May 2001. Workers’ compensation in California and in the Nation: Benefits and Employer Cost Trends, 1989‐2005. Sengupta I, Virginia Reno, Christine Baker and Lachlan Taylor (2008). Washington DC: National Academy of Social Insurance.
National Council on Compensation Insurance, Inc. (2007). Annual Statistical Bulletin, 2006 Edition. Shields, J. and Campbell, D.C. (2001). Nonsubscription to the Texas Workers’ Compensation System: 2001 Estimates. Texas Monitor 6(4), pp 1‐6. Austin, TX: Texas Research and Oversight Council on Worker’s Compensation. Testimony to the Senate State Affairs Committee, April 28, 2008:
Evelyn Tobias‐Merrill, M.D. of the Texans Against Lawsuit Abuse Material for Presentation to Senate State of Affairs Committee, April 28, 2008. Compiled and Presented by Leo E. Linbeck, Jr. Steve Bresnen Testimony. Texas AFL‐CIO Concerning Entergy v. Summers.
Texas Association of Defense Counsel.
Texas Association of Responsible Nonsubscription (TXANS). An Overview of Nonsubscription to Workers’ Compensation in Texas. Texas Department of Insurance (TDI) – Division of Workers’ Compensation Publications:
2003 Annual Report to the Governor and Legislature Research and Oversight Council on Workers' Compensation (ROC). August 2003. 2005 Injured Worker Survey Results. March 2006. An Examination of the Medical Dispute Resolution Process (August 1999) Biennial Report of the Texas Department of Insurance To the 80th Legislature. Albert Betts and Mike Geeslin. December 2006. Comparison of State WC Systems. January 2004. Comparison of the State of Texas Workers’ Compensation Programs. August 2006 Employer Participation in the Texas Workers' Compensation System: 2008 Estimates. September 2008. Healthcare Costs in the Workers’ Compensation System. March 1999. Impairment Rating Trends in the Texas Workers' Compensation System (August 1999) Overview of Recent Workers’ Compensation Research Findings (Presentation for Committees on Business & Industry and Insurance). April 2008.
51
Texas Workplace Injury Compensation: Analysis, Options, Impact Stradian, January 2009
52
Medical Cost & Quality of Care Trends. January2004. Permanent Impairment Income Benefits in the Texas Workers’ Compensation System. April 2008 Workers’ Compensation Benefits: Information for Injured Employees from the Division of Workers’ Compensation. Return‐to‐Work Outcomes for Texas Injured Workers: 2007 Findings. January 2008.
Returning to Work: An Examination of Existing Disability Duration Guidelines and Their Application to the Texas Workers' Compensation System. January 2001. Striking the Balance: An Analysis of the Cost and Quality of Medical Care in the Texas Workers' Compensation System. January 2001. Summary of Legislation – 79th Legislature. Texas Workers’ Compensation Commission. Sunset Advisory Commission. July 2005. The Texas Workers' Compensation Impairment Rating System: Variations and Features. August 2000.
Texas Watch (2007). The False Choice: Doctors Or Accountability. The Real Impact of So‐Called Tort “Reform” in Texas. Thomason, Terry, Schmidle Timothy P., and John F. Burton Jr. (2001). Workers’ Compensation: Benefits, Costs, and Safety under Alternative Insurance Arrangements. Kalamazoo, MI: W.E.Upjohn Institute for Employment Research. Workers’ Compensation Research Institute Publications:
Baselines for Evaluating the Impact of the 2005 Reforms in Texas: Compscope™ Benchmarks, 6th Edition. Carol A. Telles, Dongchun Wang, and Ramona P. Tanabe, with the assistance of Igor Polevoy. June 2006. wc‐06‐10. Baselines for Evaluating the Impact of the 2005 Reforms in Texas and an Early Look at the Impact of the 2003 Fee Schedule Changes: The Anatomy of Workers’ Compensation Medical Costs and Utilization, 6th Edition. Stacey M. Eccleston, Petia Petrova, and Xiaoping Zhao. February 2007. WC‐07‐08. Compscope™ Benchmarks for Texas, 5th Edition. Carol A. Telles, Dongchun Wang, and Ramona P. Tanabe, with the assistance of Igor Polevoy and Andrew Kowalczyk. February 2005. wc‐05‐08.
Outcomes for Injured Workers in Texas. Peter S. Barth and Richard A. Victor with the assistance of Pinghui Li and Te‐Chun Liu, July 2003. Wc‐03‐02. The Anatomy of Workers’ Compensation Medical Costs and Utilization in Texas, 5th Edition. Stacey M. Eccleston and Xiaoping Zhao. November 2005. WC‐05‐26. The Impact of Initial Treatment by Network Providers on Workers’ Compensation Medical Costs and Disability Payments. Sharon E. Fox, Richard A. Victor, Xiaoping Zhao. August 2001. DM‐01‐01. WCRI Flashreport: Worker Outcomes in Texas by Types of Injury. Richard A. Victor. February 2005. FR‐05‐02.
U.S. Department of Labor (U.S. DOL).
Bureau of Labor Statistics. National Census of Fatal Occupational Injuries. Bureau of Labor Statistics. Non‐Fatal Workplace Injuries and Illnesses.