Embed Size (px)
Citation preview

GENERAL CHARACTERISTICS
. . . TGS #813 is a general purpose Sensor which has good sensitivity characteristicsto a wide range of gases.
. . . TGS ß813 is designed to operate with a stabilized 5V heater supply and acircuit voltage not exceeding 24V.
. ..The most suitable application for the TGS #813 is the detection of methane,propane and butane which makes it an excellent Sensor for domestic gas leakdetectors.
. ..The initial stabilization time of the TGS 8813 is very short and the relativeand elapsed characteristics are very good over a long period of Operation.
. . . TGS #813 has a very low sensitivity to 'noise-gases' which considerablyreduces the Problem of nuisance alarming.
The TGS 8813 is most practically employed in a circuit design which maintainscircuit voltages at fixed values under 24V (Ex. 5,6,12, or 24V are suitable)and with the heater voltage stabilized at 5V.
These voltage ratings are very practical when determining your design specificationsbecause of the wide range of available components. This makes the use of theTGS #813 an especially econimical way to design low-tost, highly reliable gasdetection circuits.
Because of its especially high sensitivity to methane, propane and butane, theTGS #813 is very practical for Town Gas and LPG monitoring. With the addedfeatures of a short-initial stabilization period and highly reliable elapsedcharacteristics, the TGS #813 represents a new generation of gas Sensors fromFigaro.
1. Structure and Configuration of the TGS #813
Resin moulding
FIG.l. TGS #813 CONFIGURATION.l(4) 3(6)
26)5(2)
@4(l) 601
FIG.2. TGS #813 DIAGRAM OF THECIRCUIT.l Remarks:
Pins numbered 1 and 3connected internally.Pins numbered 4 and 6connected internally.
ELECTRIC
are
are
Figs.l & 3 show the structure and configuration of the TGS ß813 Sensor.
Dimensions in millrmeter
FIG.3. TGS #813 STRUCTURALSPECIFICATIONS.
The TGS #813 is a sintered bulk semiconductor composed mainly of tio dioxide(Sn& ) l The semiconductor material and electrodes are deposited on a ceramictubular former.
T h e heater coil is located inside the ceramic former. This coil, made of 60micron diameter wire, has a resistance of 30R.
The lead wires from the Sensor electrodes are a gold alloy of 80 micron diameter.The heater and lead wires are spotwelded to the Sensor pins which are arrangedto fit a 7 pin miniature tube socket. The pins tan withstand a withdrawalforte in excess of 5Kg.
The Sensor base and cover are made of nylon 66 conforming to UL 94HB AuthorizedMaterial Standard. The deformation temperature for this material is in excessof 240°C.
The upper and lower openings in the Sensor case are covered with a flameproofdouble layer of 100 mesh stainless steel gauze conforming to SUS 316. Inde-pendent tests tonfirm that this mesh will prevent a spark produced inside theflameproof cover from igniting an explosive 2 : 1 mixture of hydrogen/oxygen.
The type 8813 Sensor meets the mechanical requirements listed in Table 1.
(2)

TABLE 1 VIBRATION AND SHOCK TEST
1. VIBRATION TEST 2. SHOCK TEST+ Condltlons: + Condltions:
Frequency 1 OOOcpm Acceleration 100G.Total amplitudes 4mm Number of lests 5Duration Ihr.Direction of Vibration Verticai
(3)
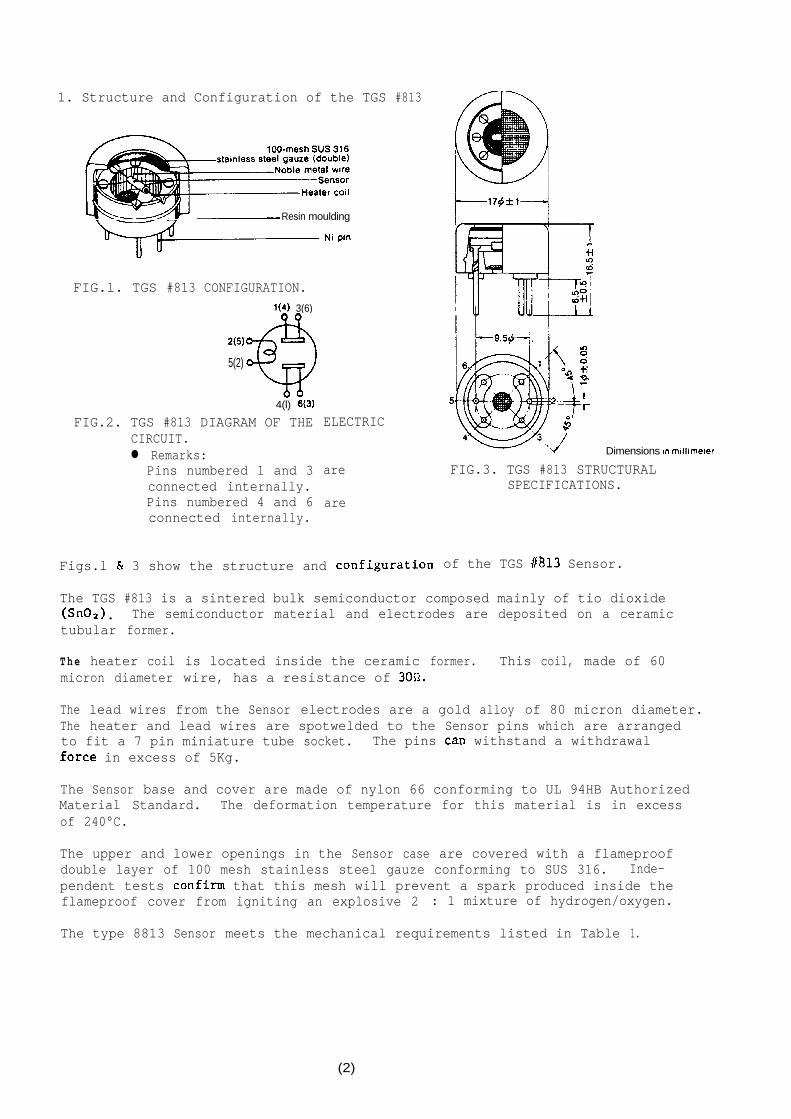
2. Basic Measuring Circuit
FIG. 4.
Vc : Circuit VoltageVn : Heater VoltageRL : Load Resistance
BASIC MEASURING CIRCUIT WITH TGS SENSOR.
Fig.4 Shows the basic test circuit for use with Sensor type 8813. The Variation inresistance of the TGS sensoris measuredindirectly as a Change in voltage appear-ing across the load resistor RL. In fresh air the current passing through theSensor and RL in series is steady, but when a combustible gas such as propane,methaoe etc. Comes in contact with the Sensor surface, the Sensor resistancedecreases in accordance with the gas concentration present. The voltage Changeacross RL is the same when VC and VH are supplied from AC or DC sources. Thecircuit must conform to the values listed in Table II.
We feel that this circuit is most suitable for evaluating th.e TGS #813 per-formante because of the ease in measuring the output signal. However, whenmeasuring the output Signal (VRL) of this circuit we suggest that you convertthis value into RS (Sensor resistance) by means of the following formula:
vc x RLRS = - RL
VRL,
Zn this way, the other data in this brothure will be readily available for youruse and your test results will be standardized in-line with other engioeeringdata available from FIGARO concerning TGS #813 Performance.
(4)
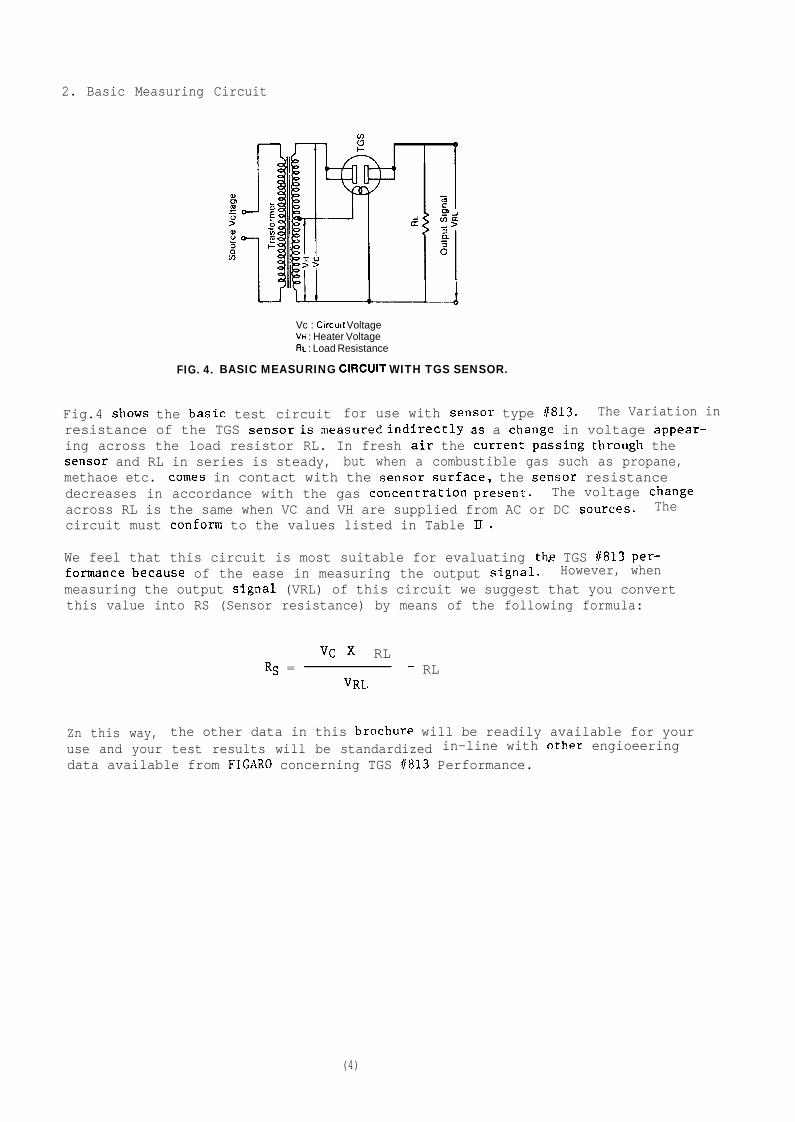
3. Circuit Configurations
Table II lists the safe operating area for type ß813 Sensor. The values ofVC, VH and PS cannot be exceeded. Subject to a maximum Sensor dissipationof 15 mW, the values of VC and RL tan be Chosen to meet design requirements.In practice VC tan be 5,6,12 or 24 Volts, and be supplied from a hattery orA.C. Source.
When using the basic circuit PS (Sensor power dissipation) becomes maximumwhen RS = RL. We strongly recommend that the value of PS be kept under 15mW. Therefore you must carefully decide VC and RL values so that the maximumPS value will not be exceeded.
TABLE 11 AREA OF SAFE OPERATION
+ SENSOR POWER DISSIPATION (Ps) Max. 15mW+ CIRCUIT VOLTAGE (Vc) Max. 24V+ HEATER VOLTAGE (VH) 5.OVt0.2V ,
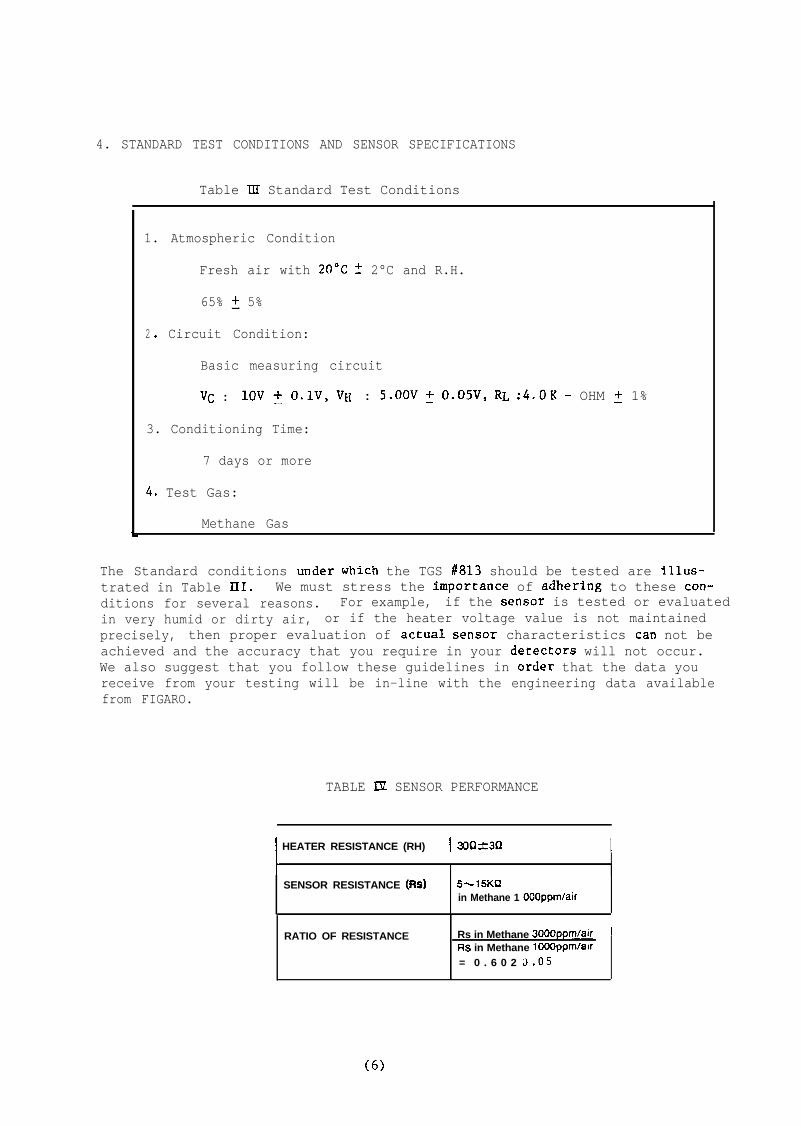
4. STANDARD TEST CONDITIONS AND SENSOR SPECIFICATIONS
Table TH Standard Test Conditions
The Standard conditions under which the TGS 8813 should be tested are illus-trated in Table III. We must stress the importante of adhering to these con-ditions for several reasons. For example, if the Sensor is tested or evaluatedin very humid or dirty air, or if the heater voltage value is not maintainedprecisely, then proper evaluation of actual Sensor characteristics tan not beachieved and the accuracy that you require in your detectors will not occur.We also suggest that you follow these guidelines in Order that the data youreceive from your testing will be in-line with the engineering data availablefrom FIGARO.
1. Atmospheric Condition
2 . Circuit Condition:
Fresh air with 20°C 2 2°C and R.H.
65% f 5%
Basic measuring circuit
vc : lov + o.lv, VH : 5.OOV + O.O5V, RL :4.OK - OHM 2 1%
3. Conditioning Time:
7 days or more
4. Test Gas:
Methane Gas
TABLE 19. SENSOR PERFORMANCE
1 HEATER RESISTANCE (RH) f 30Skt3Q I
SENSOR RESISTANCE (Rs) !+lSKQin Methane 1 OOOppm/air
RATIO OF RESISTANCE Rs in Methane 3000ppmfair 1RS in Methane lOOOppm/air= 0 . 6 0 2 U.05
(6)
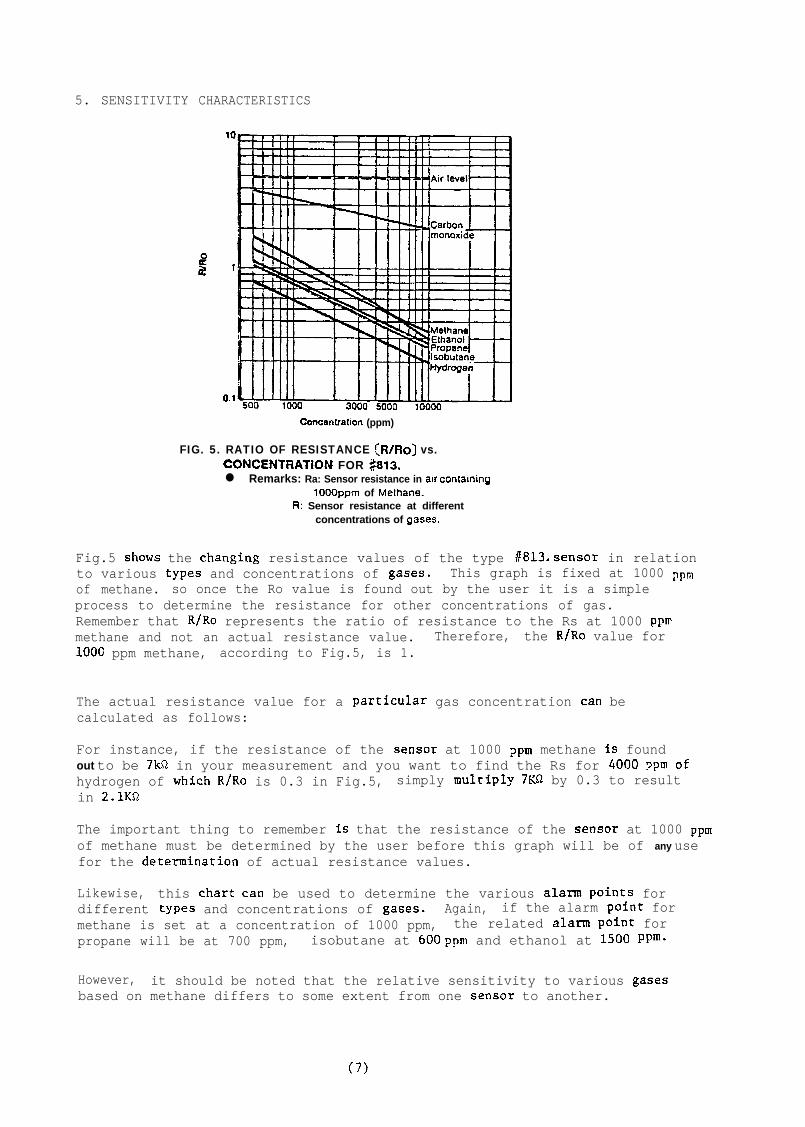
5. SENSITIVITY CHARACTERISTICS
Concentration (ppm)
FIG. 5. RATIO OF RESISTANCE (R/Ro) vs.CONCENTRATION FOR $813.l Remarks: Ra: Sensor resistance in air conlaming
1000ppm of Me!hane.Fl: Sensor resistance at different
concentrations of gases.
Fig.5 Shows the changing resistance values of the type 8813.sensor in relationto various types and concentrations of gases. This graph is fixed at 1000 ppmof methane. so once the Ro value is found out by the user it is a simpleprocess to determine the resistance for other concentrations of gas.Remember that R/Ro represents the ratio of resistance to the Rs at 1000 ppmmethane and not an actual resistance value. Therefore, the R/Ro value for1000 ppm methane, according to Fig.5, is 1.
The actual resistance value for a particular gas concentration tan becalculated as follows:
For instance, if the resistance of the Sensor at 1000 ppm methane is foundout to be 7kQ in your measurement and you want to find the Rs for 4000 ppm ofhydrogen of which R/Ro is 0.3 in Fig.5, simply multiply 7KR by 0.3 to resultin 2.1KR
The important thing to remember is that the resistance of the Sensor at 1000 ppmof methane must be determined by the user before this graph will be of any usefor the determination of actual resistance values.
Likewise, this Chart tan be used to determine the various alarm Points fordifferent types and concentrations of gases. Again, if the alarm Point formethane is set at a concentration of 1000 ppm, the related alarm Point forpropane will be at 700 ppm, isobutane at 600ppm and ethanol at 1500 PPm*
However, it should be noted that the relative sensitivity to various gasesbased on methane differs to some extent from one Sensor to another.
(7)
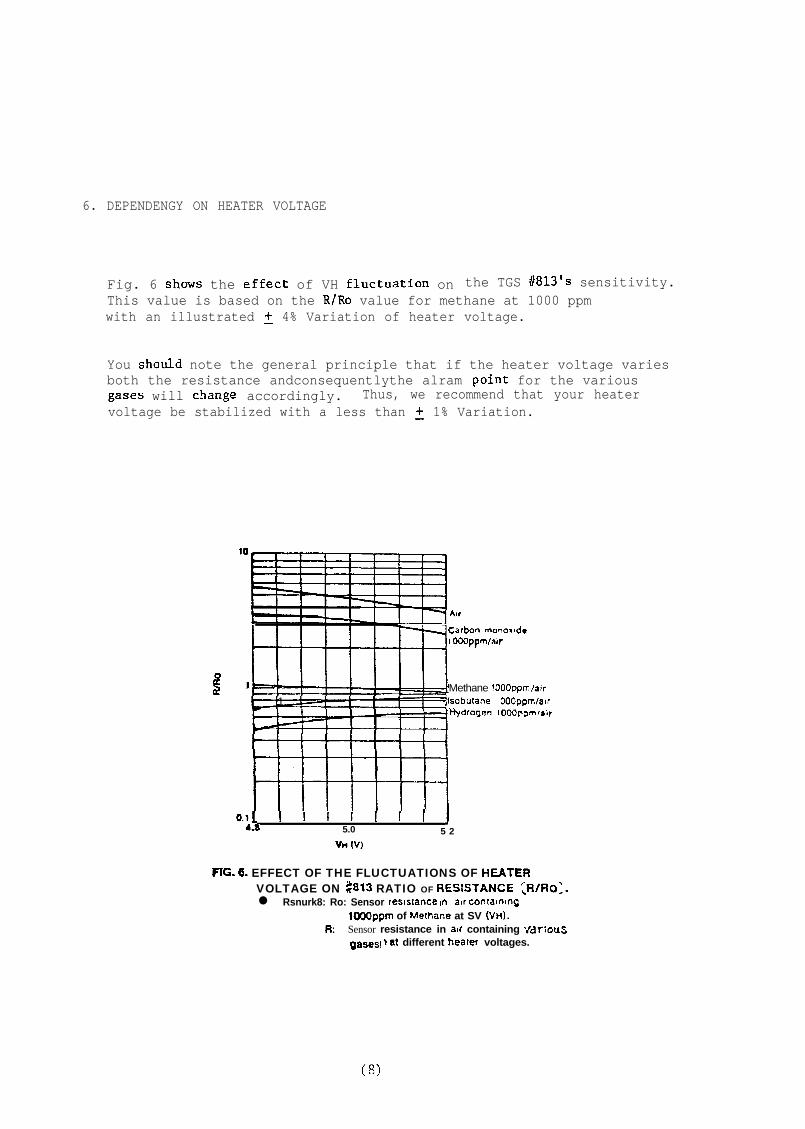
6. DEPENDENGY ON HEATER VOLTAGE
Fig. 6 Shows the effect of VH fluctuation on the TGS #813's sensitivity.This value is based on the R/Ro value for methane at 1000 ppmwith an illustrated + 4% Variation of heater voltage.
You should note the general principle that if the heater voltage variesboth the resistance andconsequentlythe alram Point for the variousgases will Change accordingly. Thus, we recommend that your heatervoltage be stabilized with a less than + 1% Variation.
Carbon monosade1 OWppm/air
P 1-7Tjlsobulane1 OOOppmlalr
Methane ! OOOppmi/alr
tiiiiiitl
O.l[ I I I I I I 148 5.0 5 2
FiG. 6. EFFECT OF THE FLUCTUATIONS OF KATERVOLTAGE ON $313 RATIO OF RESISTANCE C,R/R0:.l Rsnurk8: Ro: Sensor resstance an air contarning
1000ppm of Methake at SV (VH).R{ Sensor resistance in alr containing VdriouS
gases! b af different heatef voltages.
(8)
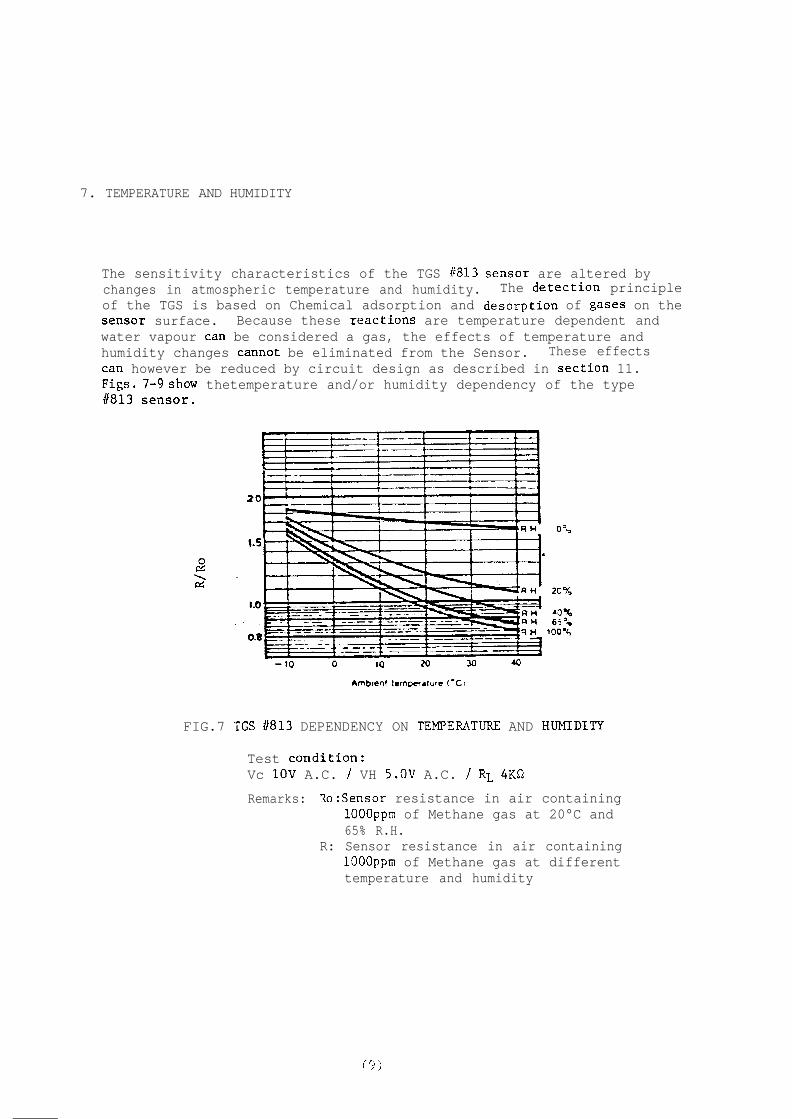
7. TEMPERATURE AND HUMIDITY
The sensitivity characteristics of the TGS $813 Sensor are altered bychanges in atmospheric temperature and humidity. The detection principleof the TGS is based on Chemical adsorption and desorption of gases on theSensor surface. Because these reactions are temperature dependent andwater vapour tan be considered a gas, the effects of temperature andhumidity changes cannot be eliminated from the Sensor. These effectstan however be reduced by circuit design as described in section 11.Figs. 7-9show thetemperature and/or humidity dependency of the type#813 Sensor.
Ambtent temperahe (‘C:
FIG.7 i"GS #813 DEPENDENCY ON TEMPERATURE AND HUMIDITY
Test condition:Vc 1OV A.C. / VH 5.0V A.C. / RL 4KQ
Remarks: Ro:Sensor resistance in air containing1000ppm of Methane gas at 20°C and65% R.H.
R: Sensor resistance in air containing1000ppm of Methane gas at differenttemperature and humidity
x1.21.2
1.11.1
..1.01.0
0.90.9
0.80.8Ambient temperature
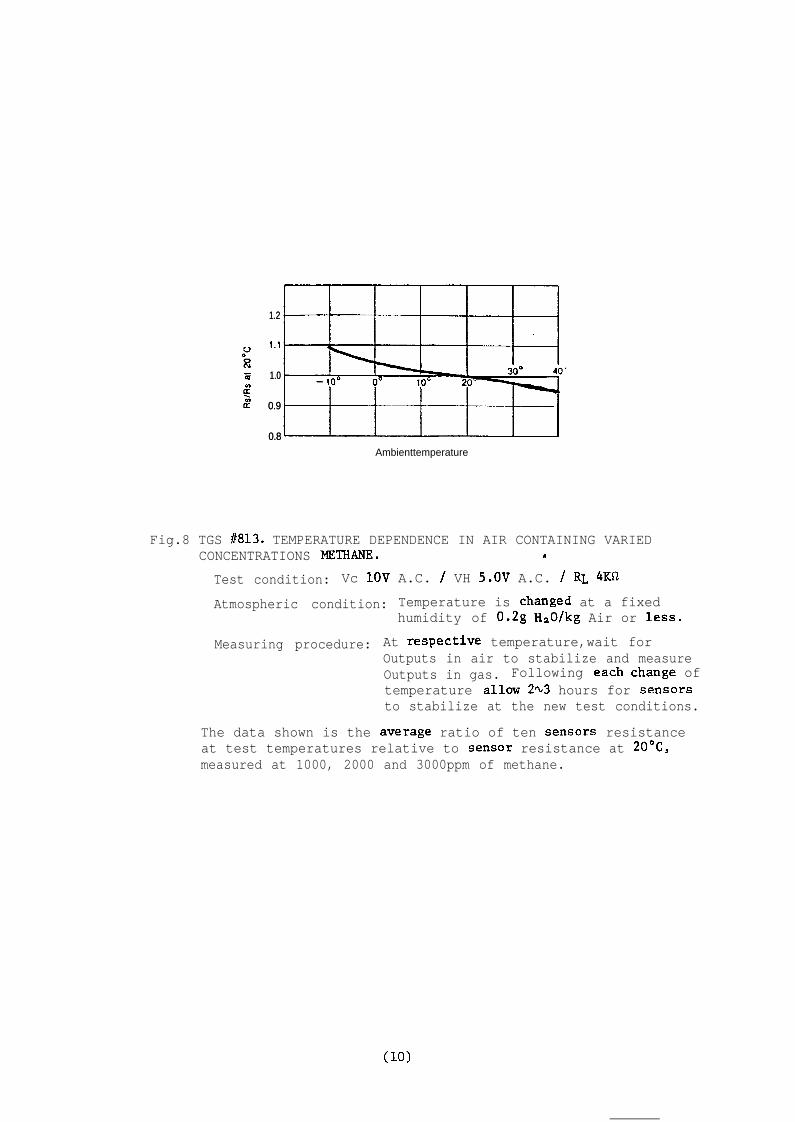
Fig.8 TGS #813. TEMPERATURE DEPENDENCE IN AIR CONTAINING VARIEDCONCENTRATIONS METHANE. L
Test condition: Vc 1OV A.C. / VH 5.0V A.C. / RL 4KQ
Atmospheric condition: Temperature is changed at a fixedhumidity of 0.2g HzO/kg Air or less.
Measuring procedure: At respective temperature,wait forOutputs in air to stabilize and measureOutputs in gas. Following each Change oftemperature allow 2~3 hours for Sensorsto stabilize at the new test conditions.
The data shown is the average ratio of ten Sensors resistanceat test temperatures relative to Sensor resistance at 20°C,measured at 1000, 2000 and 3000ppm of methane.
(10)
Iua90
82e
2oac-0 x 63’x lOO'% (R H. at 20°C)
40°C;.0% 20) 4OYo
9,z
1.0
09
0.8
0.7
0.6
0.50.4
0.3
Ambient humidity
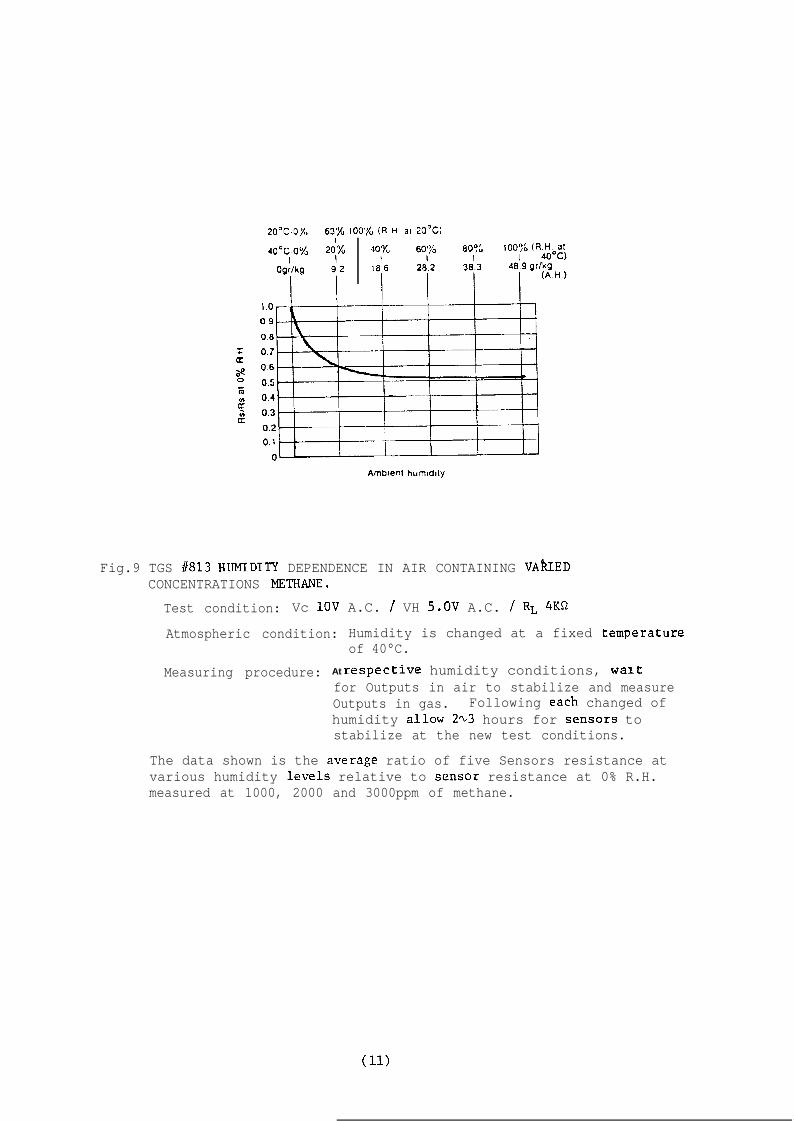
Fig.9 TGS #813 HUMIDITY DEPENDENCE IN AIR CONTAINING VAkIEDCONCENTRATIONS METHANE.
Test condition: Vc 1OV A.C. / VH 5.0V A.C. / RL 4KR
Atmospheric condition: Humidity is changed at a fixed temperatureof 40°C.
Measuring procedure: At respective humidity conditions, waitfor Outputs in air to stabilize and measureOutputs in gas. Following each changed ofhumidity allow 2~3 hours for Sensors tostabilize at the new test conditions.
The data shown is the average ratio of five Sensors resistance atvarious humidity levels relative to Sensor resistance at 0% R.H.measured at 1000, 2000 and 3000ppm of methane.
8. TIME FOR INITIAL STABILIZATION
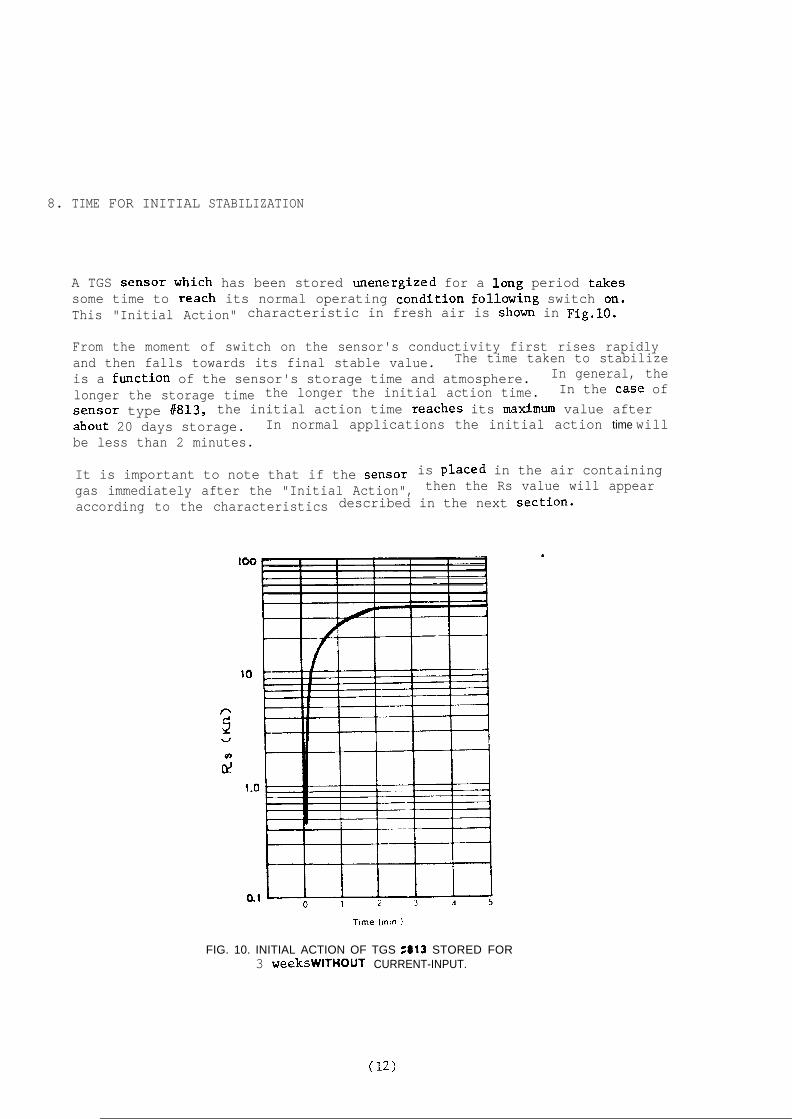
A TGS Sensor which has been stored unenergized for a lang period takessome time to resch its normal operating condition following switch on.This "Initial Action" characteristic in fresh air is shown in Fig.10.
From the moment of switch on the sensor's conductivity first rises rapidlyand then falls towards its final stable value. The time taken to stabilizeis a function of the sensor's storage time and atmosphere. In general, thelonger the storage time the longer the initial action time. In the case ofSensor type 8813, the initial action time reaches its maximum value afterabout 20 days storage. In normal applications the initial action time willbe less than 2 minutes.
It is important to note that if the Sensor is placed in the air containinggas immediately after the "Initial Action", then the Rs value will appearaccording to the characteristics described in the next section.
Time (min !
FIG. 10. INITIAL ACTION OF TGS 213 STORED FOR3 weeksWtTHOUT CURRENT-INPUT.
(12)
9. TIME DEPENDENCY CHARACTERISTICS
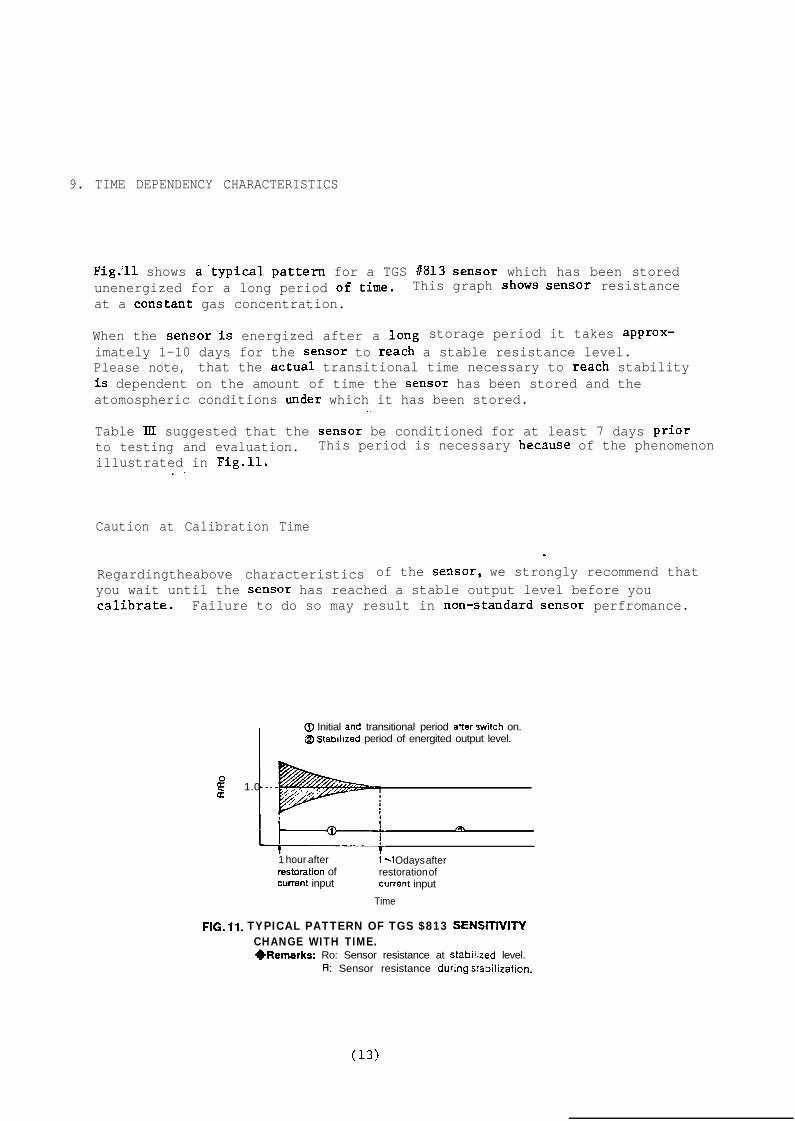
Fig:ll shows a.typical Pattern for a TGS #813 Sensor which has been storedunenergized for a long period of.time. This graph Shows Sensor resistanceat a constant gas concentration.
When the Sensor is energized after a lang storage period it takes approx-imately 1-10 days for the Sensor to resch a stable resistance level.Please note, that the actual transitional time necessary to resch stabilityis dependent on the amount of time the Sensor has been stored and theatomospheric conditions under which it has been stored.
.'Table ID suggested that the Sensor be conditioned for at least 7 days Priorto testing and evaluation. This period is necessary because of the phenomenonillustrated in Fig.11.. L
Caution at Calibration Time
.
Regardingtheabove characteristics of the Sensor, we strongly recommend thatyou wait until the Sensor has reached a stable output level before youcalibrate. Failure to do so may result in non-Standard Sensor perfromance.
I@ Initial and transitional period a?ter switch on.@ Stabillzed period of energited output level.
& 1.0 -.-a
Ib:
.+ ‘,.‘,. *, :,/
m
1 hour afterrestoration ofcurrent input
1-l Odays afterrestoration ofcunent input
Time
FIG. 11. TYPICAL PATTERN OF TGS $813 SENSITIVITYCHANGE WITH TIME.+Remarks; Ro: Sensor resistance at stabiiited level.
Fl: Sensor resistance during s?abilization.
(13)
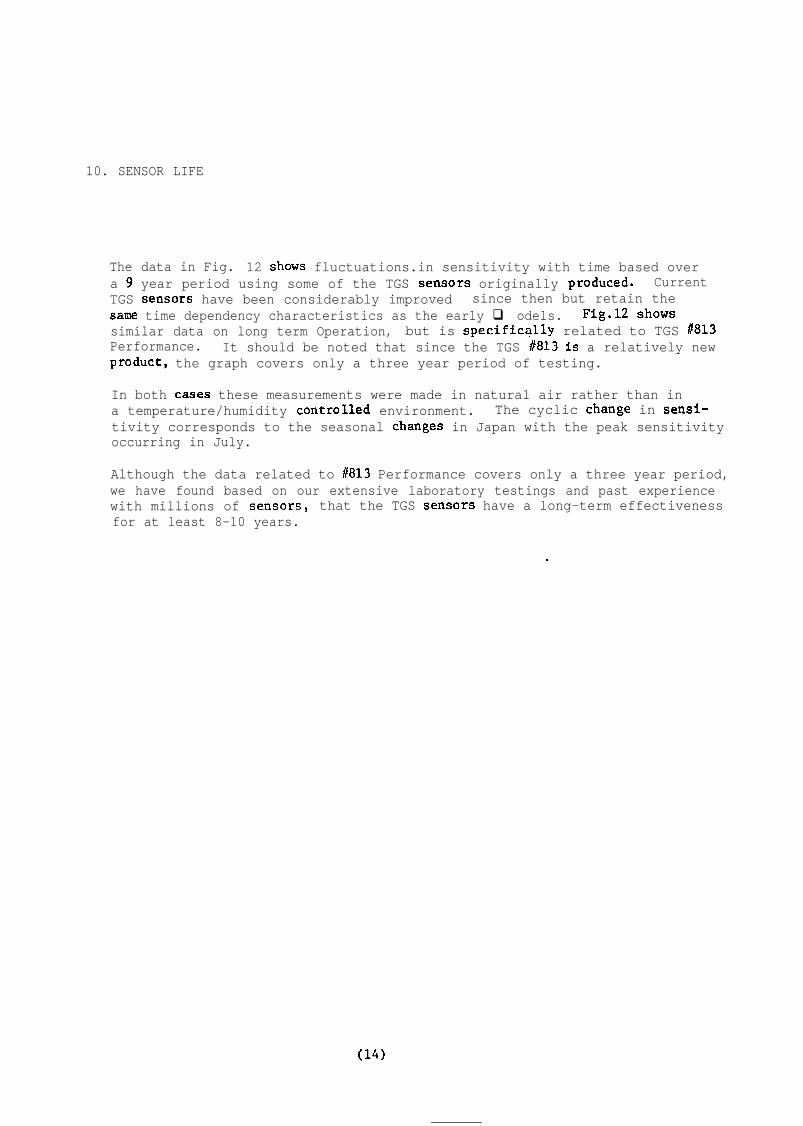
10. SENSOR LIFE
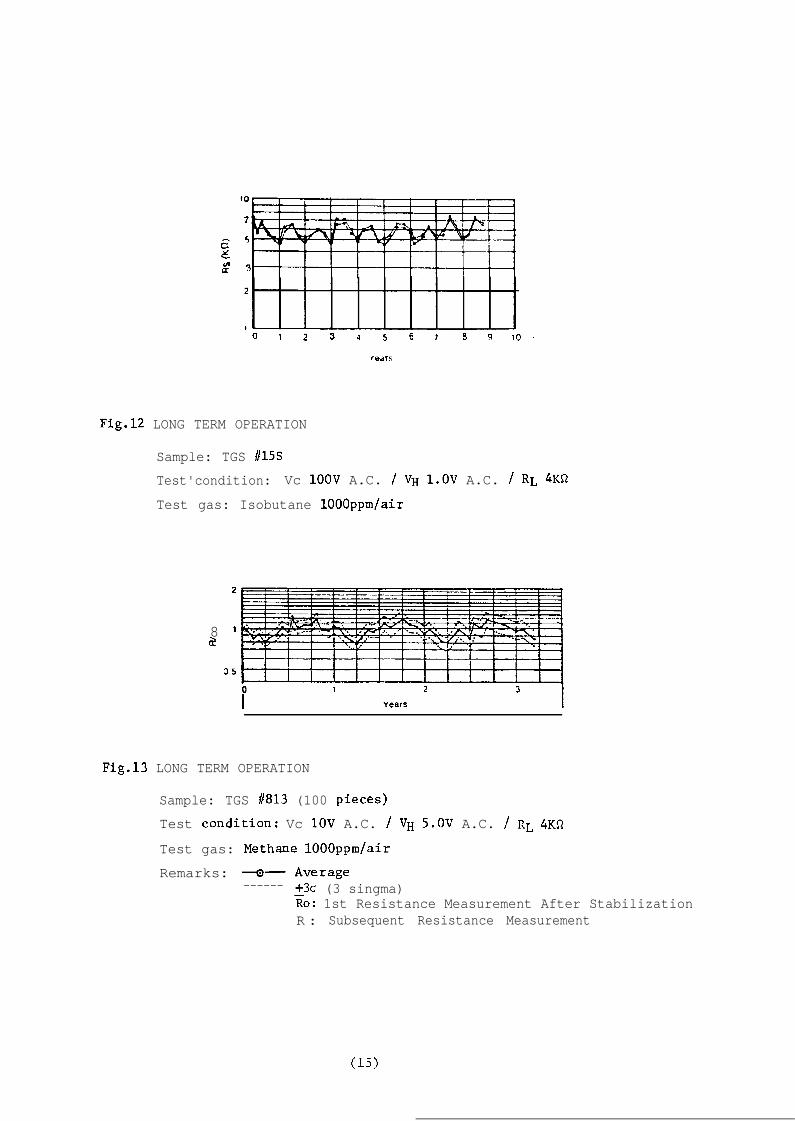
The data in Fig. 12 Shows fluctuations.in sensitivity with time based overa 9 year period using some of the TGS Sensors originally produced. CurrentTGS Sensors have been considerably improved since then but retain theSame time dependency characteristics as the early q odels. Fig.12 Showssimilar data on long term Operation, but is specifically related to TGS #813Performance. It should be noted that since the TGS #813 is a relatively newproduct, the graph covers only a three year period of testing.
In both cases these measurements were made in natura1 air rather than ina temperature/humidity controlled environment. The cyclic Change in sensi-tivity corresponds to the seasonal changes in Japan with the peak sensitivityoccurring in July.
Although the data related to #813 Performance covers only a three year period,we have found based on our extensive laboratory testings and past experiencewith millions of Sensors, that the TGS Sensors have a long-term effectivenessfor at least 8-10 years.
.
(14)
012 3 4 5 6 7 9 910.
‘feim
Fig.12 LONG TERM OPERATION
Sample: TGS #15S
Test'condition: Vc 1OOV A.C. / VH l.OV A.C. / RL 4KQ
Test gas: Isobutane lOOOppm/air
2
8 ’i?
3.5
P
1 2 3
Years I
Fig.13 LONG TERM OPERATION
Sample: TGS #813 (100 pieces)
Test condition: Vc 1OV A.C. / VH 5.OV A.C. / RL 4Kfi
Test gas: Methane lOOOppm/air
Remarks: u- Average------ +3o (3 singma)
zo: 1st Resistance Measurement After StabilizationR : Subsequent Resistance Measurement
(15)
11. PRACTICAL DETECTOR CIRCUIT USING THE #813 SENSOR
As was mentioned above the TGS #813 is suitable for use in the detection ofa wide range of gases such as naturalgas, L.P.G. and town gas. Wben youdesign a circuit employing the TGS #813 you must consider both the type andconcentration of gas you wish to detect.
Because of its sensitivity characteristics, the action of the Sensor willvary according to the type and concentration of gas it is detecting.Furthermore, the proper alarm Point for the detector should be determinedafter considering the following factors,
a. Where the Sensor is to be installedb. Purpose of detector (gas leak, automatic fan control, air monitoring, etc.)c. Operation of detector (Sound, light, fan control, valve control, etc.)d. Type of gas being detected or monitored.
When setting the actual alarm Point, we recommend that you calibrate thedetector for 5-10 % of the L.E.L. of the gas being detected.
This figure was decided to meet the requirements for high sensitivity whileat the same time reducing the Problem of nuisance alarming. This is anextremely important consideration for domestic gas-leak detectors becauseof the presence of 'noise gases' in the home enviroment such as those result-ing from hair-Spray, alcohol fumes or cooking fumes.
EXAMPLE CIRCUIT "
Fig. 14 is an example of a simple and economic circuit for a domestic gasleak detectors. It is designed primarily for the detection of approxi-mately 3000 ppm of methane (natura1 gas).
The constant 5V output of voltage regulator 1, is available for the heaterof the Sensor and the detecting circuit. The detecting circuit consistsof the TGS 11813, R1, and RADJ in series.
vRl# output, which is the output voltage across resistors R1 and R~J,enters the non-inverting input of the comparator.
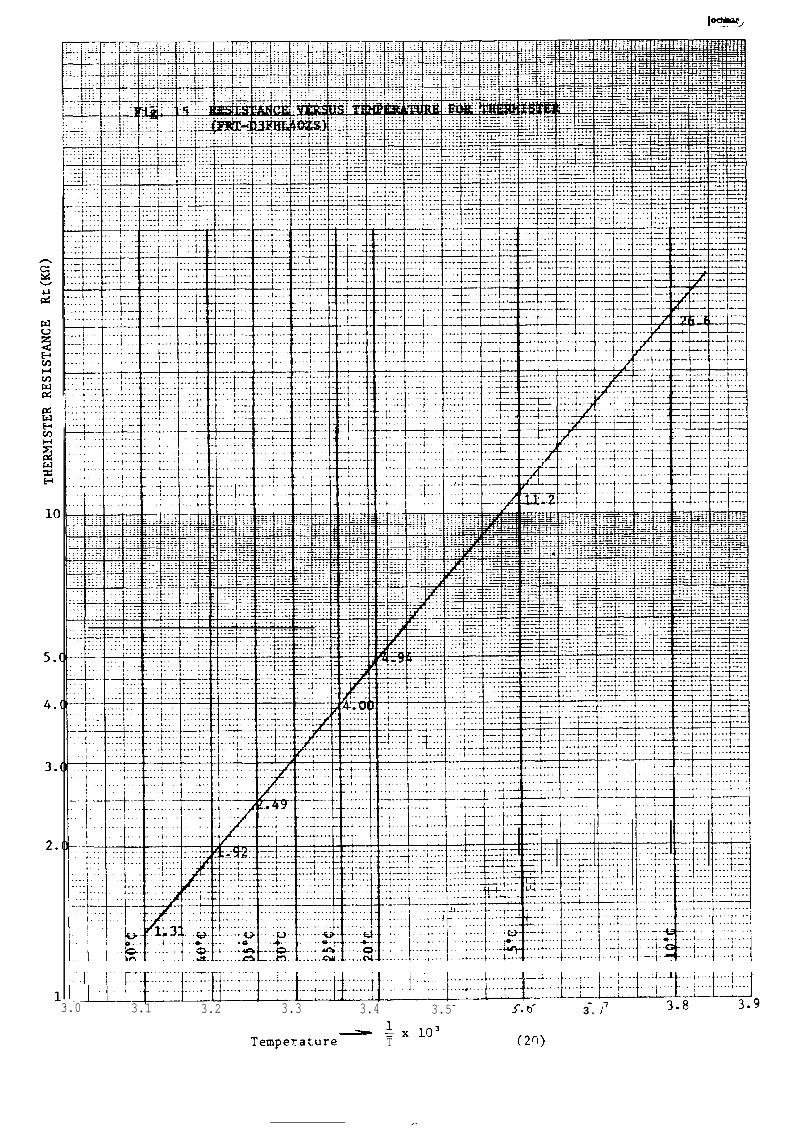
Vr, which is the reference voltage for the comparator, is measured acrossR4- This component is part of the Temperature Compensating Circuit whichalso consists- of RZ, R3 AND Rt (thermistor). The Vr value in this circuitis designed for 2.5V at 20°C.
Once you calibrate the detector at 3000 ppm by adjusting R~J (under theconditions 20°C at 65% R.H.) you tan get an approximate 2.5V(v~~) in aconcentration of 3000 ppm methane.
When a combustible gas such as natura1 gas contacts the Sensor and theoutput of the detection circuit (V,) exceeds the Vr, the output of thecomparator will go to 'High'. TR is then activated and the buzzer is1sounded.
TEMPERATURE AND HUMIDITY COMPENSATION METHOD
As was previously mentioned, Sensor resistance (Rs) is dependent upon theambient temperature and humidity. Accordingly, this phenomenon will resultin a fluctuation of the alarming Point. Possible variations in the effectsof temperature and humidity changes are illustrated in TableV.
This Variation in Sensor Performance, however, is primarily related to themeasure of Absolute Humidity in the detecting area. It is therefore rec-ommended that you determine the mean or average temperature and humidityvalues in your projected detector sales or distribution area, to be able tocompensate for seasonal variations in the alarming Point. The most effi-cient and economical way we have found to achieve this compensation is tocarefully control the temperature dependency of the circuit. This Point isdiscussed below.
Table V illustrates possible variations in alarming Points in both compen-sated and non-compensated circuits. Another way of interpreting these varia-tions is to say that if R/Ro = 1 at 20°C (65% R.H.) then at -10°C (65%R.H.) R/Ro is 1.6 and at 35°C (65% R.H.) is 0.9. The actual VRI can.beexpressed as: 2.5 V at ZOOC, 1.9V at-10°C and 2.6 V at 35OC.
To compensate for these variations in temperature and humidity we suggestusing a negative characteristic thermistor (Rt). In this example circuit,the Vr is automatically adjusted as a result of temperature changes. Aswas mentioned, Rt is set at 2.5V for 20°C in this circuit. At -10°C Vrwill self-adjust to 2,1V, while at 35°C it will go to 2.7V.
The differente between Vm and Vr is detected by the following Comparator 12.Therefore you tan get rid of the seasonal Variation of alarming Points
hich are caused by temperature and humidity fluctuations by adjusting Vr.
With the application of a temperature compensation circuit you will be ableto control the alarming Points as illustrated in Table V,
The temperature coefficient of the thermistor is larger than that of theSensor, therefore we have to adjust the coefficient of the thermistor byadjusting RZ and RS.
A final important consideration is the actual place where the thermistor isplaced in the circuit. You should not install it near heat dissipatingcomponents such as the transformer or the Sensor. Also it should not beinstalled in a Position where it is likely to receive a strong wind, asthis will also effect the temperature characteristics of the Sensor.
(17)
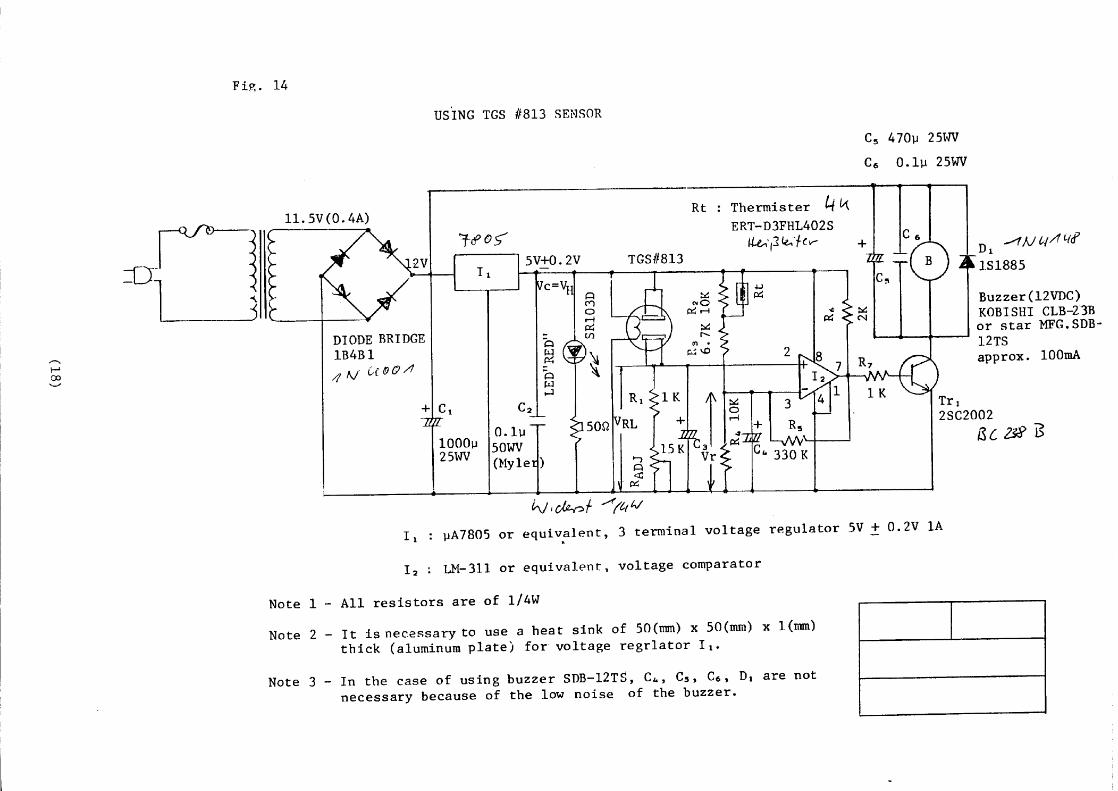
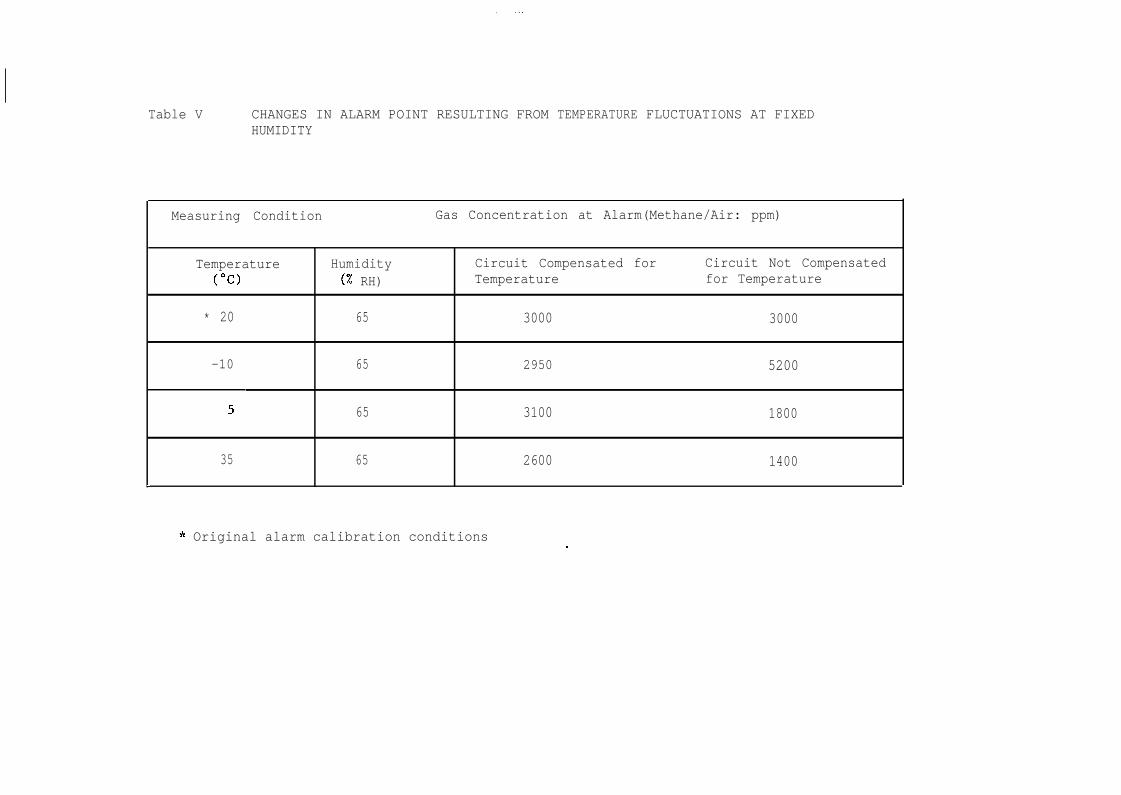
Table V CHANGES IN ALARM POINT RESULTING FROM TEMPERATURE FLUCTUATIONS AT FIXEDHUMIDITY
c
Measuring Condition Gas Concentration at Alarm(Methane/Air: ppm)
Temperature Humidity Circuit Compensated for Circuit Not Compensated("0 (% RH) Temperature for Temperature
* 20 65 3000 3000
-10 65 2950 5200
5, 65 3100 1800
35 65 2600 1400
* Original alarm calibration conditions
..:.]’ ..;...
3.0 3.1 3.2 3.3 3.4 3.5 3.b 3 . /
-1-x103Temperature T (20)