Embed Size (px)
Citation preview
Ann. Geophys., 27, 1989–1999, 2009www.ann-geophys.net/27/1989/2009/© Author(s) 2009. This work is distributed underthe Creative Commons Attribution 3.0 License.
AnnalesGeophysicae
The 8-h tide in the mesosphere and lower thermosphere over Maui(20.75◦ N, 156.43◦ W)
G. Jiang1, J. Xu1, and S. J. Franke2
1State Key Laboratory of Space Weather, Center for Space Science and Applied Research, Chinese Academy of Sciences,Beijing, China2Department of Electrical and Computer Engineering, University of Illinois at Urbana-Champaign, USA
Received: 6 October 2008 – Revised: 30 March 2009 – Accepted: 8 April 2009 – Published: 4 May 2009
Abstract. Wind data collected by the Maui meteor radar(20.75◦ N, 156.43◦ W) are used to study the 8-h tide in themesosphere and lower thermosphere (MLT) region at a low-latitude station. The data set spans the time interval from19 May 2002 to 24 May 2007. Our results show that the8-h tide is a regular and distinct feature over Maui. Themeridional component of this wave is significantly largerthan the zonal component. The meridional component ex-hibits a semiannual variation in amplitude, with peaks nearthe equinoxes, whereas the variation of the zonal compo-nent does not show this seasonal characteristic. The strongestwave motions mostly occur in the height range of 92–96 kmnear spring equinox (March) and at higher altitudes near au-tumn equinox (October). The vertical variations of 8-h tidalphase at Maui indicate an upward wave energy flux. The ver-tical wavelengths are≥54 km in equinox months.
Keywords. Meteorology and atmospheric dynamics (Mid-dle atmosphere dynamics; Thermospheric dynamics; Wavesand tides)
1 Introduction
The features and seasonal variabilities of the diurnal tideand semidiurnal tide in the mesosphere and lower thermo-sphere (MLT) have been quite well investigated through ob-servations and model simulations (Manson and Meek, 1986;Teitelbaum et al., 1989; Thayaparan, 1997; Pendleton et al.,2000; Smith, 2000; Smith and Ortland, 2001; Akmaev, 2001;Younger et al., 2002; Batista et al., 2004; Namboothiri et
Correspondence to:G. Jiang([email protected])
al., 2004; Taori et al., 2005; Zhao et al., 2005; Beldon etal., 2006; Tokumoto et al., 2007). Nevertheless, the 8-htide, as a distinct wave signature in the MLT region, is notwell understood, especially compared to the diurnal tide andsemidiurnal tide. Besides the work of Smith (2000) basedon the wind measurement of High Resolution Doppler In-terferometer (HRDI) instrument on the Upper AtmosphereResearch Satellite (UARS), the variations of the 8-h tidehave been investigated using ground-based observations inthe Northern Hemisphere at middle- and high-latitude (Man-son and Meek, 1986; Teitelbaum et al., 1989; Thayaparan,1997; Pendleton et al., 2000; Younger et al., 2002; Nam-boothiri et al., 2004; Taori et al., 2005; Zhao et al., 2005;Beldon et al., 2006). These studies showed that the sea-sonal behavior of the 8-h tide in the MLT region is dif-ferent at different latitudes. For example, maximum am-plitudes of the 8-h tide in the Northern Hemisphere wereobserved in the autumn (September–October) at the high-latitude station Esrange (68◦ N) (Younger et al., 2002), inautumn and early winter (September–November) at CastleEaton, UK (52.6◦ N, 2.2◦ W) (Beldon et al., 2006), in winterand early spring (January–March) at Garchy (47◦ N), Mont-pazier (44◦ N) and London, Canada (43◦ N) (Teitelbaum etal., 1989; Thayaparan, 1997), and in winter (December-February) at Wakkanai (45.4◦ N) (Namboothiri et al., 2004).Overall, the 8-h tides at mid-latitude stations in the NorthernHemisphere have similar seasonal features, with maximumamplitudes in the winter months.
Recently, the characteristics of the 8-h tide over CachoeiraPaulista, Brazil (22.7◦ S, 45◦ W) were reported by Batistaet al. (2004) and Tokumoto et al. (2007). At this low-latitude Southern Hemisphere site, the 8-h tide in the merid-ional wind peaked near the equinoxes (February–April andAugust–October) (Batista et al., 2004; Tokumoto et al.,
Published by Copernicus Publications on behalf of the European Geosciences Union.
1990 G. Jiang et al.: The 8-h tide in the mesosphere and lower thermosphere over Maui
Fig. 1. The distributions of the hourly wind data with time and altitude. The plots a and b are for the
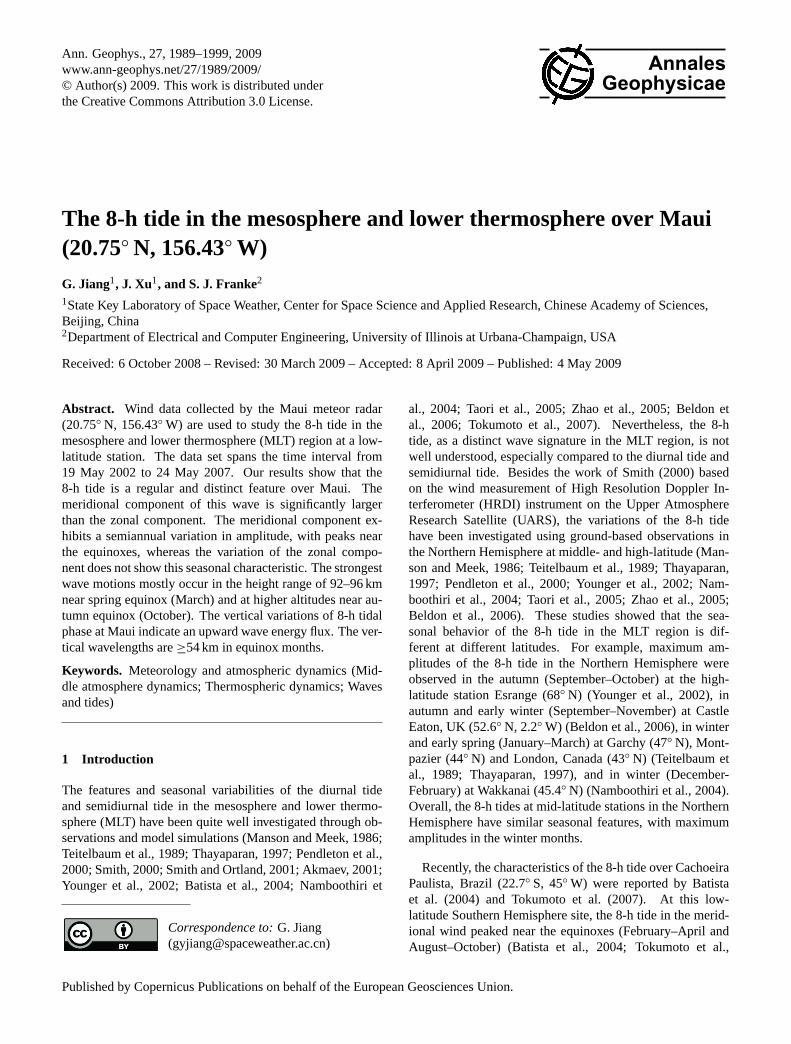
zonal wind and the meridional wind, respectively. Fig. 1. The distributions of the hourly wind data with time and altitude. The plots(a) and(b) are for the zonal wind and the meridional wind,respectively.
Ann. Geophys., 27, 1989–1999, 2009 www.ann-geophys.net/27/1989/2009/
G. Jiang et al.: The 8-h tide in the mesosphere and lower thermosphere over Maui 1991
2007). The HRDI/UARS satellite observations indicated thatthe 8-h tide amplitude was largest during autumn-middlewinter at mid-latitude (Smith, 2000).
The phase variation and the vertical wavelength of the 8-htide in the MLT region have also been found to differ be-tween the zonal and meridional components, and at differentlocations. For example, regular annual variation of the wavephase was observed in the meridional wind at Wuhan (30◦ N)and Wakkanai (45.4◦ N) (Namboothiri et al., 2004; Zhao etal., 2005), and in the zonal wind at London, Canada (43◦ N)(Thayaparan, 1997). The vertical wavelength reported by theprevious studies was found to vary widely, over a range from12 to more than 1000 km. At high-latitude, 68◦ N, the ver-tical wavelength was from 31 km to 91 km (Younger et al.,2002); at mid-latitudes,∼43–52◦ N, the vertical wavelengthvaried in a large range from 22 to≥1000 km (Thayaparan,1997; Namboothiri et al., 2004); and at the low latitude of22◦ S shorter vertical wavelengths∼12–32 km in the merid-ional wind were reported by Tokumoto et al. (2007).
At this time, the 8-h tide in the MLT region is still notwell understood. As mentioned above, the 8-h tide at a low-latitude Southern Hemisphere site (22.7◦ S) displayed differ-ent climatological characteristics than the wave at mid- andhigh-latitudes in the Northern Hemisphere. In this paper wewill present the features of the 8-h tide in the MLT regionat a low-latitude site in the Northern Hemisphere, over Maui(20.75◦ N, 156.43◦ W), obtained from analysis of wind datacollected by the Maui meteor radar from 19 May 2002 to24 May 2007. The radar and data analysis methods are de-scribed in Sect. 2. The features of the 8-h tide over Maui areshown in Sect. 3. The comparisons between Maui 8-h tideand other observational and numerical results are discussedin Sect. 4. The main results of our study are summarized inSect. 5.
2 Description of radar and data analysis
The Maui meteor radar was located in Kihei on Maui(20.75◦ N, 156.43◦ W), Hawaii. The system is a SKiYMETradar (Hocking et al., 2001) and operates at 40.92 MHz. Asingle three-element Yagi antenna directed toward the zenithis used to illuminate meteor trails. Meteor trail reflections arecoherently detected on five three-element Yagi antennas ori-ented along two orthogonal baselines, with one antenna in thecenter of the array common to both baselines. On each base-line the outer antennas are separated from the center antennaby 1.5 and 2.0 wavelengths. This configuration minimizesantenna coupling, provides enough redundancy to unambigu-ously determine the azimuth and elevation of most echoes,and provides excellent angular resolution for position deter-mination. The average transmitted power is approximately170 W, resulting from a 13.3 us pulse length, 6 kW peak en-velope power, and an interpulse period (IPP) of 466 us. Re-turns are sampled every 13.3 us, resulting in 2 km range res-
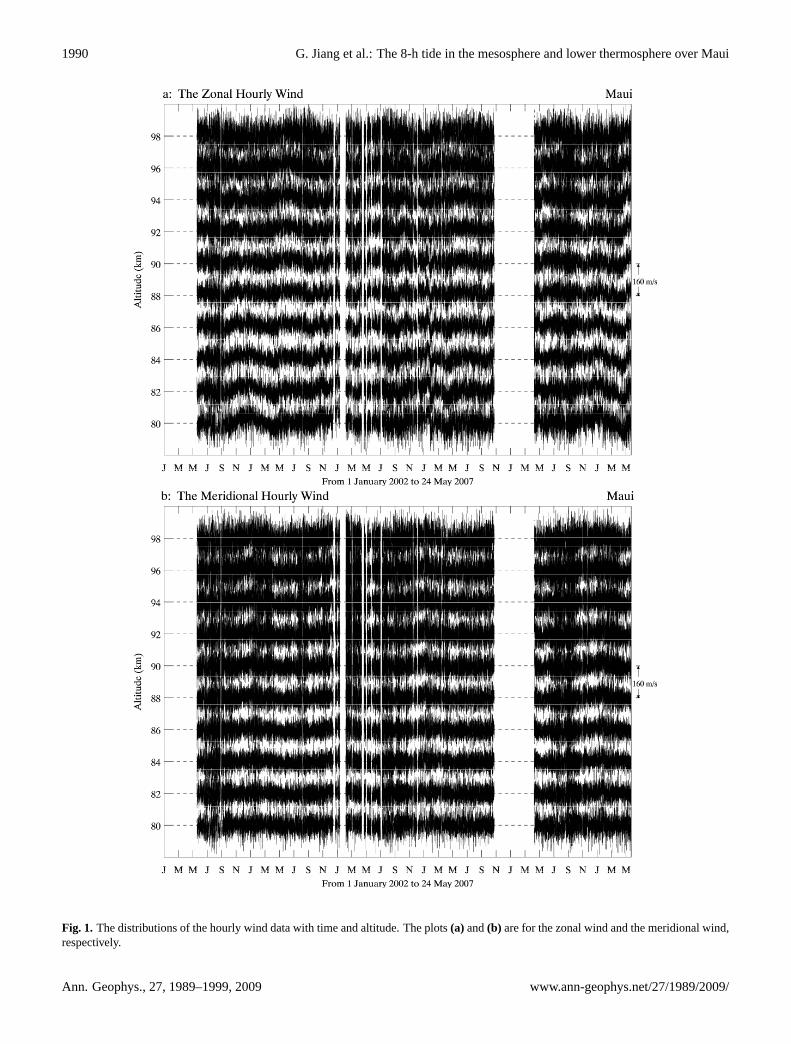
Fig. 2. Lomb-Scargle periodogram of the meridional wind (the top)and the zonal wind (the bottom) at 92 km from 19 May 2002–24May 2007. The dashed line denotes the 90% confidence level.
olution. The relatively high PRF causes meteor echoes tobe range aliased; however, the relatively narrow height dis-tribution of meteor echoes combined with precise azimuthand elevation angle determination allows any range ambigu-ities to be resolved. The algorithms used to determine themeteor trail position and Doppler shift are described in de-tail in the work of Hocking and Thayaparan (1997). Windvelocities are estimated from the trail positions and Dopplershifts using a weighted least squares fit to an assumed con-stant wind vector composed of eastward and northward com-ponents. (The vertical wind is assumed to be negligible.) Thewind vector fit is based on echoes collected within 1 h timebins. The more detailed description of Maui meteor radarand method of wind determination can be found in Franke etal. (2005).
The hourly wind data used in this paper are in the heightrange 80–98 km, and span a period of 5 years from 19 May2002–24 May 2007, during which there some short gaps andone significant gap (greater than 1 month) from late October2005 to early April 2006. Figure 1 shows the distributions ofthe hourly wind data with time and altitude. The plots a and bare for the zonal wind and the meridional wind, respectively.
The Lomb-Scargle periodogram method (Lomb, 1976;Scargle, 1982) is used to determine which waves are dom-inant in the meridional and zonal wind. The advantage ofthis method is that it can accept the unevenly sampled in-put data. Hence the Lomb-Scargle periodogram method iswidely applied to analyze geophysical data sets.
The harmonic fitting method with 4-day window slidingforward by 1 day is used to get the detailed information of theamplitude and phase of 2-day wave, diurnal tide, semidiur-nal tide and 8-h tide. The 4-day fitting window is selected to
www.ann-geophys.net/27/1989/2009/ Ann. Geophys., 27, 1989–1999, 2009
1992 G. Jiang et al.: The 8-h tide in the mesosphere and lower thermosphere over Maui
Fig. 3. Amplitude of the 8-hour tide in the meridional wind from 19 May 2002–24 May 2007. The
white blank represents no amplitude calculated from harmonic analysis because of no data or
insufficient data for fitting.
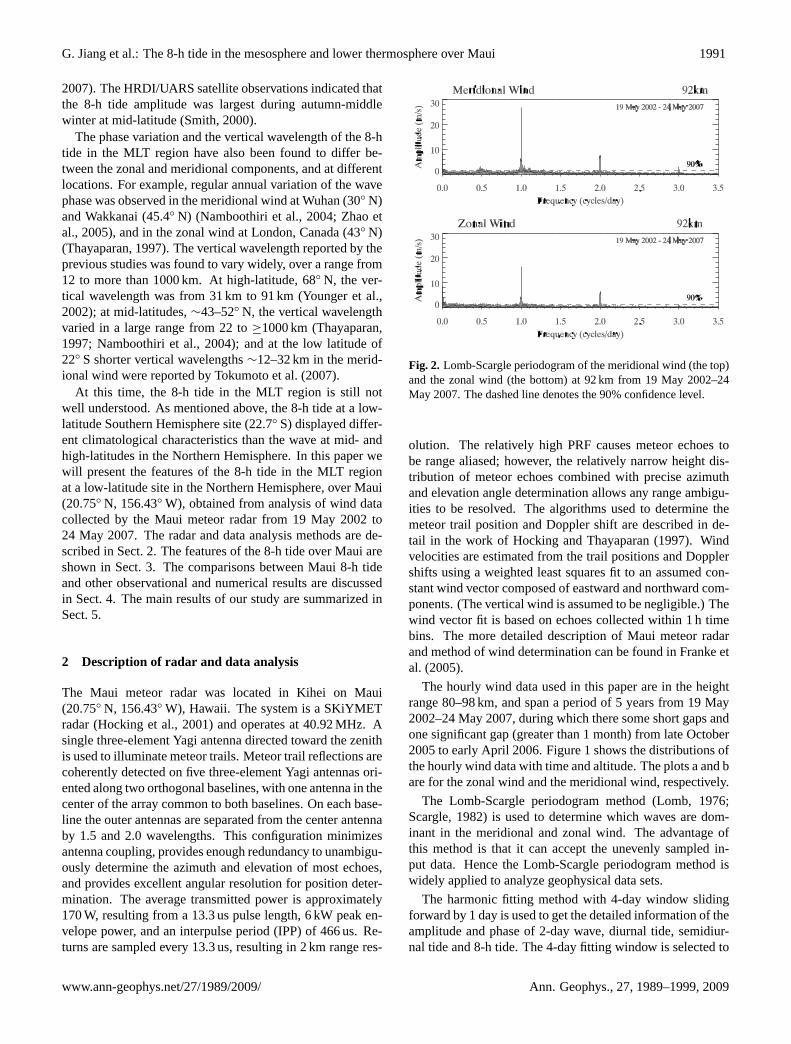
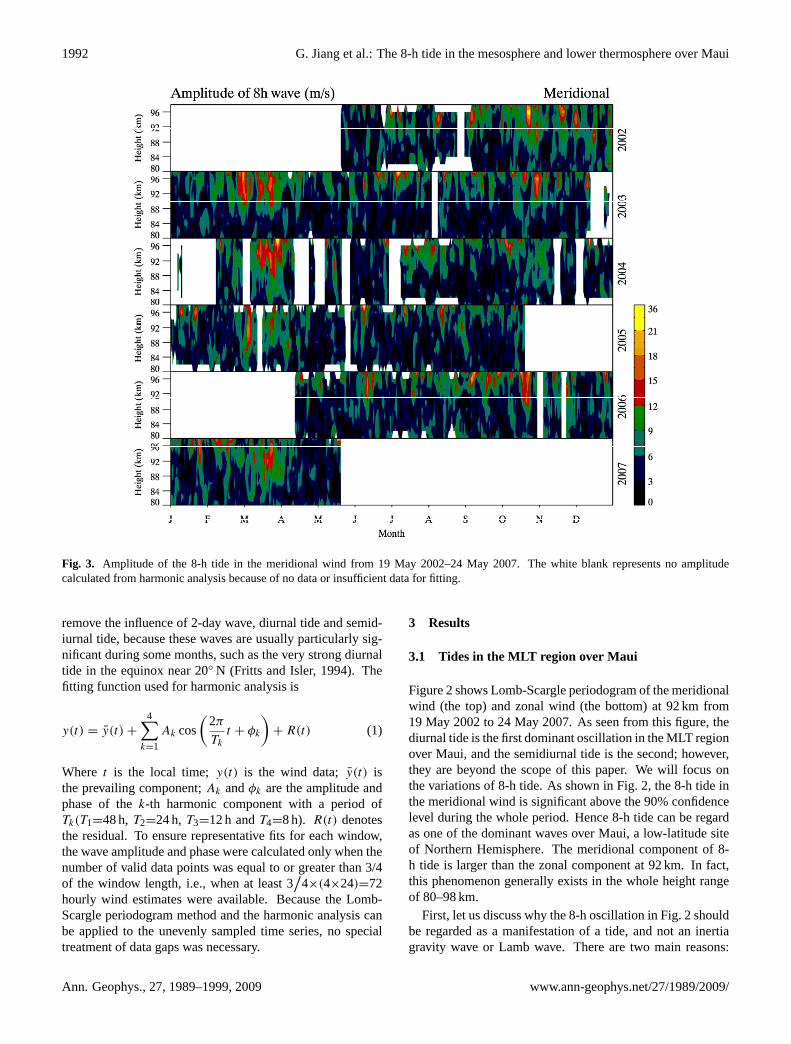
Fig. 3. Amplitude of the 8-h tide in the meridional wind from 19 May 2002–24 May 2007. The white blank represents no amplitudecalculated from harmonic analysis because of no data or insufficient data for fitting.
remove the influence of 2-day wave, diurnal tide and semid-iurnal tide, because these waves are usually particularly sig-nificant during some months, such as the very strong diurnaltide in the equinox near 20◦ N (Fritts and Isler, 1994). Thefitting function used for harmonic analysis is
y(t) = y(t) +
4∑k=1
Ak cos
(2π
Tk
t + φk
)+ R(t) (1)
Where t is the local time;y(t) is the wind data;y(t) isthe prevailing component;Ak andφk are the amplitude andphase of thek-th harmonic component with a period ofTk(T1=48 h,T2=24 h,T3=12 h andT4=8 h). R(t) denotesthe residual. To ensure representative fits for each window,the wave amplitude and phase were calculated only when thenumber of valid data points was equal to or greater than 3/4of the window length, i.e., when at least 3
/4×(4×24)=72
hourly wind estimates were available. Because the Lomb-Scargle periodogram method and the harmonic analysis canbe applied to the unevenly sampled time series, no specialtreatment of data gaps was necessary.
3 Results
3.1 Tides in the MLT region over Maui
Figure 2 shows Lomb-Scargle periodogram of the meridionalwind (the top) and zonal wind (the bottom) at 92 km from19 May 2002 to 24 May 2007. As seen from this figure, thediurnal tide is the first dominant oscillation in the MLT regionover Maui, and the semidiurnal tide is the second; however,they are beyond the scope of this paper. We will focus onthe variations of 8-h tide. As shown in Fig. 2, the 8-h tide inthe meridional wind is significant above the 90% confidencelevel during the whole period. Hence 8-h tide can be regardas one of the dominant waves over Maui, a low-latitude siteof Northern Hemisphere. The meridional component of 8-h tide is larger than the zonal component at 92 km. In fact,this phenomenon generally exists in the whole height rangeof 80–98 km.
First, let us discuss why the 8-h oscillation in Fig. 2 shouldbe regarded as a manifestation of a tide, and not an inertiagravity wave or Lamb wave. There are two main reasons:
Ann. Geophys., 27, 1989–1999, 2009 www.ann-geophys.net/27/1989/2009/
G. Jiang et al.: The 8-h tide in the mesosphere and lower thermosphere over Maui 1993
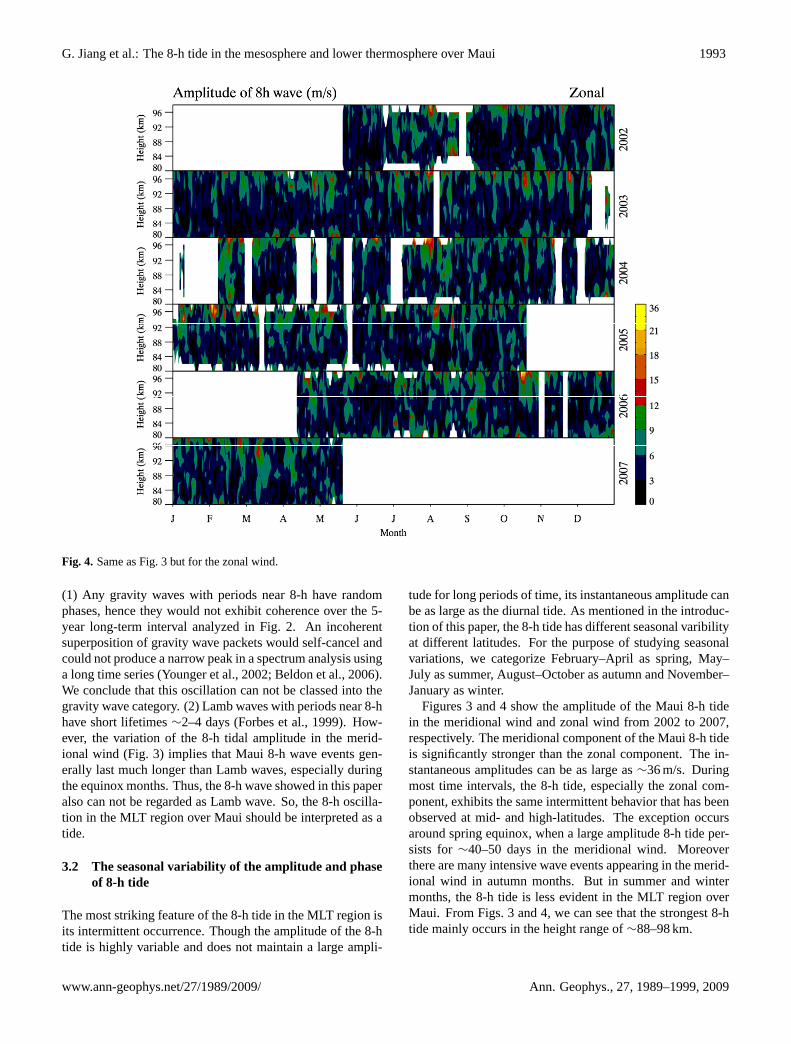
Fig. 4. Same as Fig. 3 but for the zonal wind. Fig. 4. Same as Fig. 3 but for the zonal wind.
(1) Any gravity waves with periods near 8-h have randomphases, hence they would not exhibit coherence over the 5-year long-term interval analyzed in Fig. 2. An incoherentsuperposition of gravity wave packets would self-cancel andcould not produce a narrow peak in a spectrum analysis usinga long time series (Younger et al., 2002; Beldon et al., 2006).We conclude that this oscillation can not be classed into thegravity wave category. (2) Lamb waves with periods near 8-hhave short lifetimes∼2–4 days (Forbes et al., 1999). How-ever, the variation of the 8-h tidal amplitude in the merid-ional wind (Fig. 3) implies that Maui 8-h wave events gen-erally last much longer than Lamb waves, especially duringthe equinox months. Thus, the 8-h wave showed in this paperalso can not be regarded as Lamb wave. So, the 8-h oscilla-tion in the MLT region over Maui should be interpreted as atide.
3.2 The seasonal variability of the amplitude and phaseof 8-h tide
The most striking feature of the 8-h tide in the MLT region isits intermittent occurrence. Though the amplitude of the 8-htide is highly variable and does not maintain a large ampli-
tude for long periods of time, its instantaneous amplitude canbe as large as the diurnal tide. As mentioned in the introduc-tion of this paper, the 8-h tide has different seasonal varibilityat different latitudes. For the purpose of studying seasonalvariations, we categorize February–April as spring, May–July as summer, August–October as autumn and November–January as winter.
Figures 3 and 4 show the amplitude of the Maui 8-h tidein the meridional wind and zonal wind from 2002 to 2007,respectively. The meridional component of the Maui 8-h tideis significantly stronger than the zonal component. The in-stantaneous amplitudes can be as large as∼36 m/s. Duringmost time intervals, the 8-h tide, especially the zonal com-ponent, exhibits the same intermittent behavior that has beenobserved at mid- and high-latitudes. The exception occursaround spring equinox, when a large amplitude 8-h tide per-sists for∼40–50 days in the meridional wind. Moreoverthere are many intensive wave events appearing in the merid-ional wind in autumn months. But in summer and wintermonths, the 8-h tide is less evident in the MLT region overMaui. From Figs. 3 and 4, we can see that the strongest 8-htide mainly occurs in the height range of∼88–98 km.
www.ann-geophys.net/27/1989/2009/ Ann. Geophys., 27, 1989–1999, 2009
1994 G. Jiang et al.: The 8-h tide in the mesosphere and lower thermosphere over Maui
Fig. 5. Phases of the 8-hour tide in the meridional wind at 6 height levels 88-98 km, where the
8-hour tide has significant amplitude. As shown at the bottom right corner, different colors
represent different heights.
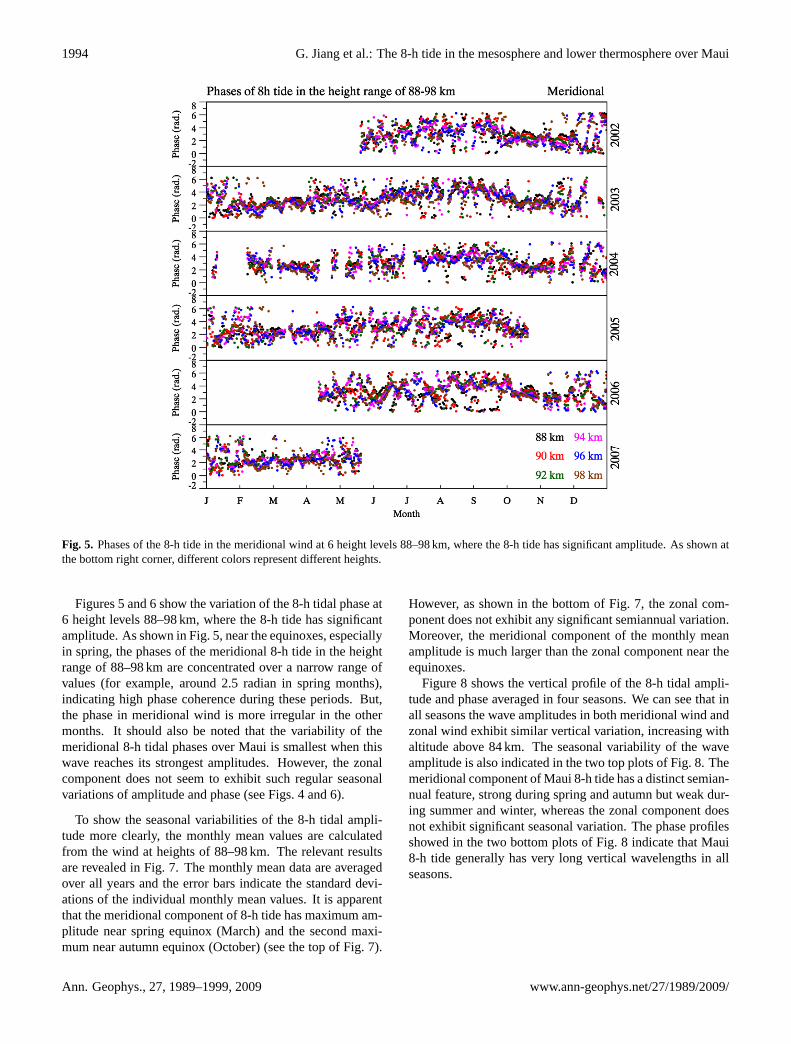
Fig. 5. Phases of the 8-h tide in the meridional wind at 6 height levels 88–98 km, where the 8-h tide has significant amplitude. As shown atthe bottom right corner, different colors represent different heights.
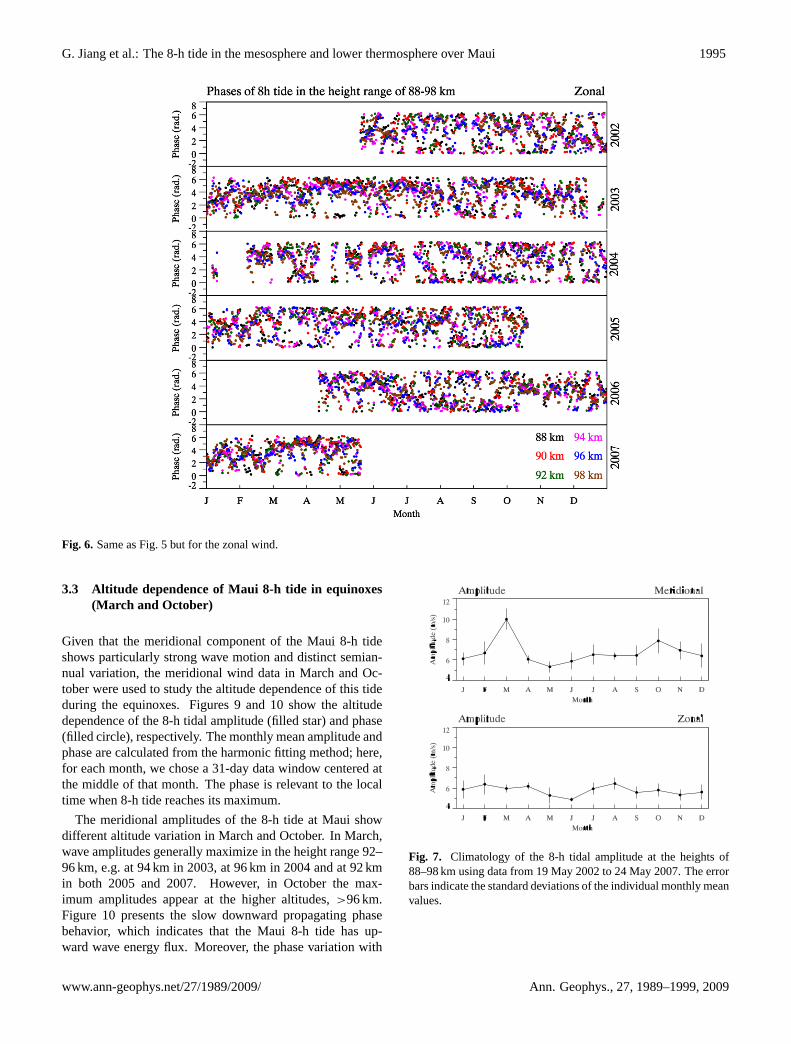
Figures 5 and 6 show the variation of the 8-h tidal phase at6 height levels 88–98 km, where the 8-h tide has significantamplitude. As shown in Fig. 5, near the equinoxes, especiallyin spring, the phases of the meridional 8-h tide in the heightrange of 88–98 km are concentrated over a narrow range ofvalues (for example, around 2.5 radian in spring months),indicating high phase coherence during these periods. But,the phase in meridional wind is more irregular in the othermonths. It should also be noted that the variability of themeridional 8-h tidal phases over Maui is smallest when thiswave reaches its strongest amplitudes. However, the zonalcomponent does not seem to exhibit such regular seasonalvariations of amplitude and phase (see Figs. 4 and 6).
To show the seasonal variabilities of the 8-h tidal ampli-tude more clearly, the monthly mean values are calculatedfrom the wind at heights of 88–98 km. The relevant resultsare revealed in Fig. 7. The monthly mean data are averagedover all years and the error bars indicate the standard devi-ations of the individual monthly mean values. It is apparentthat the meridional component of 8-h tide has maximum am-plitude near spring equinox (March) and the second maxi-mum near autumn equinox (October) (see the top of Fig. 7).
However, as shown in the bottom of Fig. 7, the zonal com-ponent does not exhibit any significant semiannual variation.Moreover, the meridional component of the monthly meanamplitude is much larger than the zonal component near theequinoxes.
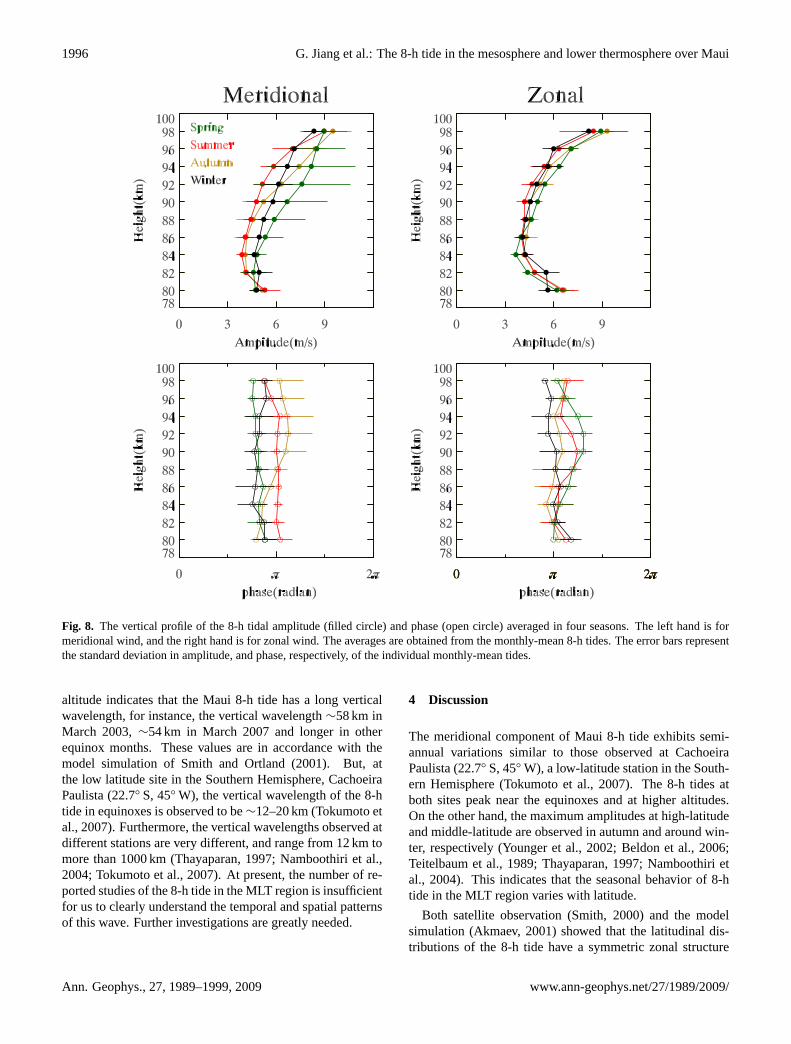
Figure 8 shows the vertical profile of the 8-h tidal ampli-tude and phase averaged in four seasons. We can see that inall seasons the wave amplitudes in both meridional wind andzonal wind exhibit similar vertical variation, increasing withaltitude above 84 km. The seasonal variability of the waveamplitude is also indicated in the two top plots of Fig. 8. Themeridional component of Maui 8-h tide has a distinct semian-nual feature, strong during spring and autumn but weak dur-ing summer and winter, whereas the zonal component doesnot exhibit significant seasonal variation. The phase profilesshowed in the two bottom plots of Fig. 8 indicate that Maui8-h tide generally has very long vertical wavelengths in allseasons.
Ann. Geophys., 27, 1989–1999, 2009 www.ann-geophys.net/27/1989/2009/
G. Jiang et al.: The 8-h tide in the mesosphere and lower thermosphere over Maui 1995
Fig. 6. Same as Fig. 5 but for the zonal wind.
Fig. 6. Same as Fig. 5 but for the zonal wind.
3.3 Altitude dependence of Maui 8-h tide in equinoxes(March and October)
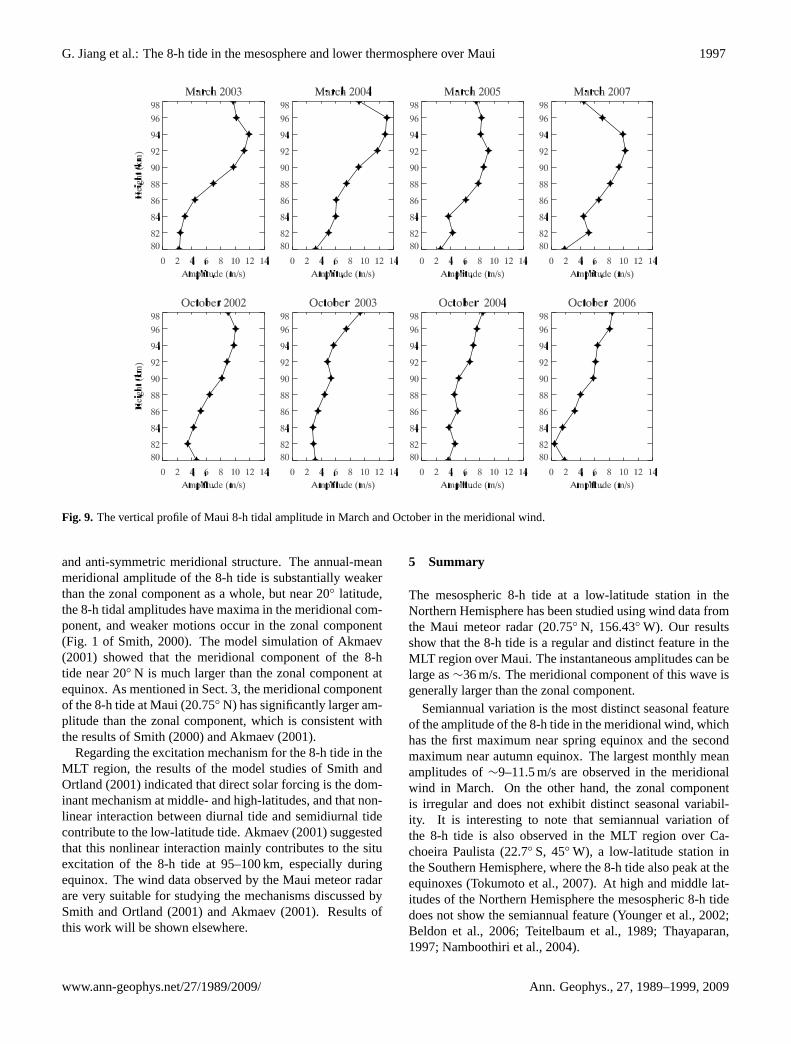
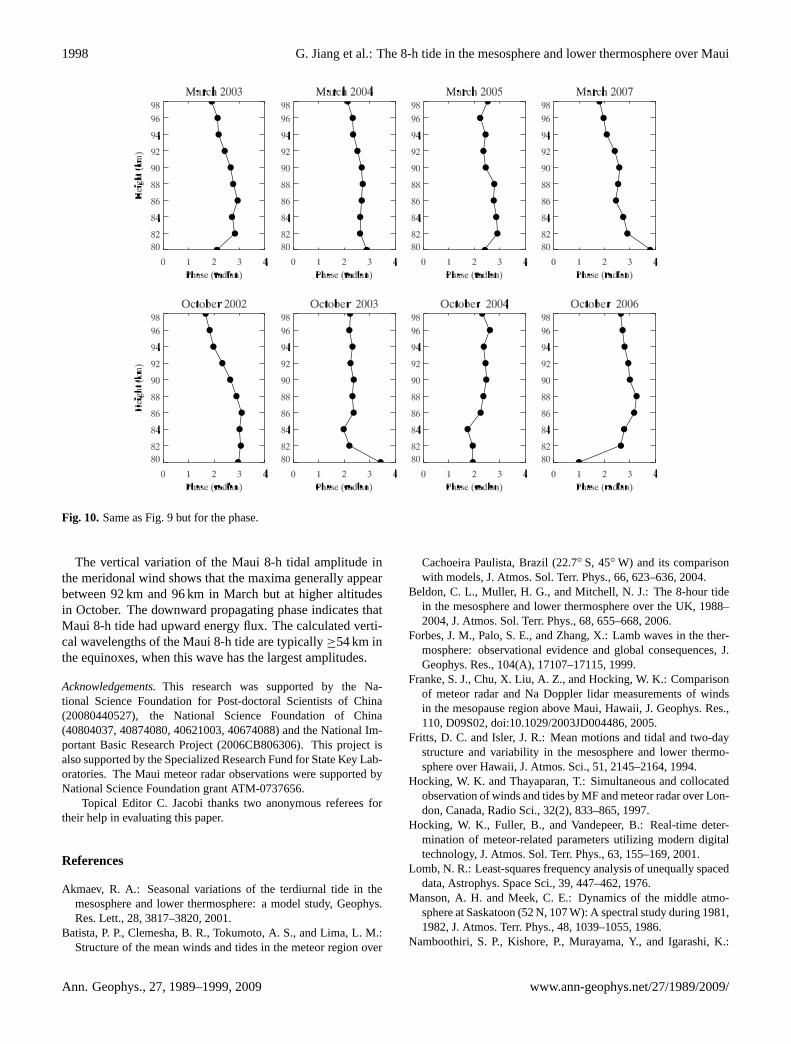
Given that the meridional component of the Maui 8-h tideshows particularly strong wave motion and distinct semian-nual variation, the meridional wind data in March and Oc-tober were used to study the altitude dependence of this tideduring the equinoxes. Figures 9 and 10 show the altitudedependence of the 8-h tidal amplitude (filled star) and phase(filled circle), respectively. The monthly mean amplitude andphase are calculated from the harmonic fitting method; here,for each month, we chose a 31-day data window centered atthe middle of that month. The phase is relevant to the localtime when 8-h tide reaches its maximum.
The meridional amplitudes of the 8-h tide at Maui showdifferent altitude variation in March and October. In March,wave amplitudes generally maximize in the height range 92–96 km, e.g. at 94 km in 2003, at 96 km in 2004 and at 92 kmin both 2005 and 2007. However, in October the max-imum amplitudes appear at the higher altitudes,>96 km.Figure 10 presents the slow downward propagating phasebehavior, which indicates that the Maui 8-h tide has up-ward wave energy flux. Moreover, the phase variation with
Fig. 7. Climatology of the 8-h tidal amplitude at the heights of88–98 km using data from 19 May 2002 to 24 May 2007. The errorbars indicate the standard deviations of the individual monthly meanvalues.
www.ann-geophys.net/27/1989/2009/ Ann. Geophys., 27, 1989–1999, 2009
1996 G. Jiang et al.: The 8-h tide in the mesosphere and lower thermosphere over Maui
Fig. 8. The vertical profile of the 8-h tidal amplitude (filled circle) and phase (open circle) averaged in four seasons. The left hand is formeridional wind, and the right hand is for zonal wind. The averages are obtained from the monthly-mean 8-h tides. The error bars representthe standard deviation in amplitude, and phase, respectively, of the individual monthly-mean tides.
altitude indicates that the Maui 8-h tide has a long verticalwavelength, for instance, the vertical wavelength∼58 km inMarch 2003,∼54 km in March 2007 and longer in otherequinox months. These values are in accordance with themodel simulation of Smith and Ortland (2001). But, atthe low latitude site in the Southern Hemisphere, CachoeiraPaulista (22.7◦ S, 45◦ W), the vertical wavelength of the 8-htide in equinoxes is observed to be∼12–20 km (Tokumoto etal., 2007). Furthermore, the vertical wavelengths observed atdifferent stations are very different, and range from 12 km tomore than 1000 km (Thayaparan, 1997; Namboothiri et al.,2004; Tokumoto et al., 2007). At present, the number of re-ported studies of the 8-h tide in the MLT region is insufficientfor us to clearly understand the temporal and spatial patternsof this wave. Further investigations are greatly needed.
4 Discussion
The meridional component of Maui 8-h tide exhibits semi-annual variations similar to those observed at CachoeiraPaulista (22.7◦ S, 45◦ W), a low-latitude station in the South-ern Hemisphere (Tokumoto et al., 2007). The 8-h tides atboth sites peak near the equinoxes and at higher altitudes.On the other hand, the maximum amplitudes at high-latitudeand middle-latitude are observed in autumn and around win-ter, respectively (Younger et al., 2002; Beldon et al., 2006;Teitelbaum et al., 1989; Thayaparan, 1997; Namboothiri etal., 2004). This indicates that the seasonal behavior of 8-htide in the MLT region varies with latitude.
Both satellite observation (Smith, 2000) and the modelsimulation (Akmaev, 2001) showed that the latitudinal dis-tributions of the 8-h tide have a symmetric zonal structure
Ann. Geophys., 27, 1989–1999, 2009 www.ann-geophys.net/27/1989/2009/
G. Jiang et al.: The 8-h tide in the mesosphere and lower thermosphere over Maui 1997
Fig. 9. The vertical profile of Maui 8-h tidal amplitude in March and October in the meridional wind.
and anti-symmetric meridional structure. The annual-meanmeridional amplitude of the 8-h tide is substantially weakerthan the zonal component as a whole, but near 20◦ latitude,the 8-h tidal amplitudes have maxima in the meridional com-ponent, and weaker motions occur in the zonal component(Fig. 1 of Smith, 2000). The model simulation of Akmaev(2001) showed that the meridional component of the 8-htide near 20◦ N is much larger than the zonal component atequinox. As mentioned in Sect. 3, the meridional componentof the 8-h tide at Maui (20.75◦ N) has significantly larger am-plitude than the zonal component, which is consistent withthe results of Smith (2000) and Akmaev (2001).
Regarding the excitation mechanism for the 8-h tide in theMLT region, the results of the model studies of Smith andOrtland (2001) indicated that direct solar forcing is the dom-inant mechanism at middle- and high-latitudes, and that non-linear interaction between diurnal tide and semidiurnal tidecontribute to the low-latitude tide. Akmaev (2001) suggestedthat this nonlinear interaction mainly contributes to the situexcitation of the 8-h tide at 95–100 km, especially duringequinox. The wind data observed by the Maui meteor radarare very suitable for studying the mechanisms discussed bySmith and Ortland (2001) and Akmaev (2001). Results ofthis work will be shown elsewhere.
5 Summary
The mesospheric 8-h tide at a low-latitude station in theNorthern Hemisphere has been studied using wind data fromthe Maui meteor radar (20.75◦ N, 156.43◦ W). Our resultsshow that the 8-h tide is a regular and distinct feature in theMLT region over Maui. The instantaneous amplitudes can belarge as∼36 m/s. The meridional component of this wave isgenerally larger than the zonal component.
Semiannual variation is the most distinct seasonal featureof the amplitude of the 8-h tide in the meridional wind, whichhas the first maximum near spring equinox and the secondmaximum near autumn equinox. The largest monthly meanamplitudes of∼9–11.5 m/s are observed in the meridionalwind in March. On the other hand, the zonal componentis irregular and does not exhibit distinct seasonal variabil-ity. It is interesting to note that semiannual variation ofthe 8-h tide is also observed in the MLT region over Ca-choeira Paulista (22.7◦ S, 45◦ W), a low-latitude station inthe Southern Hemisphere, where the 8-h tide also peak at theequinoxes (Tokumoto et al., 2007). At high and middle lat-itudes of the Northern Hemisphere the mesospheric 8-h tidedoes not show the semiannual feature (Younger et al., 2002;Beldon et al., 2006; Teitelbaum et al., 1989; Thayaparan,1997; Namboothiri et al., 2004).
www.ann-geophys.net/27/1989/2009/ Ann. Geophys., 27, 1989–1999, 2009
1998 G. Jiang et al.: The 8-h tide in the mesosphere and lower thermosphere over Maui
Fig. 10. Same as Fig. 9 but for the phase.
The vertical variation of the Maui 8-h tidal amplitude inthe meridonal wind shows that the maxima generally appearbetween 92 km and 96 km in March but at higher altitudesin October. The downward propagating phase indicates thatMaui 8-h tide had upward energy flux. The calculated verti-cal wavelengths of the Maui 8-h tide are typically≥54 km inthe equinoxes, when this wave has the largest amplitudes.
Acknowledgements.This research was supported by the Na-tional Science Foundation for Post-doctoral Scientists of China(20080440527), the National Science Foundation of China(40804037, 40874080, 40621003, 40674088) and the National Im-portant Basic Research Project (2006CB806306). This project isalso supported by the Specialized Research Fund for State Key Lab-oratories. The Maui meteor radar observations were supported byNational Science Foundation grant ATM-0737656.
Topical Editor C. Jacobi thanks two anonymous referees fortheir help in evaluating this paper.
References
Akmaev, R. A.: Seasonal variations of the terdiurnal tide in themesosphere and lower thermosphere: a model study, Geophys.Res. Lett., 28, 3817–3820, 2001.
Batista, P. P., Clemesha, B. R., Tokumoto, A. S., and Lima, L. M.:Structure of the mean winds and tides in the meteor region over
Cachoeira Paulista, Brazil (22.7◦ S, 45◦ W) and its comparisonwith models, J. Atmos. Sol. Terr. Phys., 66, 623–636, 2004.
Beldon, C. L., Muller, H. G., and Mitchell, N. J.: The 8-hour tidein the mesosphere and lower thermosphere over the UK, 1988–2004, J. Atmos. Sol. Terr. Phys., 68, 655–668, 2006.
Forbes, J. M., Palo, S. E., and Zhang, X.: Lamb waves in the ther-mosphere: observational evidence and global consequences, J.Geophys. Res., 104(A), 17107–17115, 1999.
Franke, S. J., Chu, X. Liu, A. Z., and Hocking, W. K.: Comparisonof meteor radar and Na Doppler lidar measurements of windsin the mesopause region above Maui, Hawaii, J. Geophys. Res.,110, D09S02, doi:10.1029/2003JD004486, 2005.
Fritts, D. C. and Isler, J. R.: Mean motions and tidal and two-daystructure and variability in the mesosphere and lower thermo-sphere over Hawaii, J. Atmos. Sci., 51, 2145–2164, 1994.
Hocking, W. K. and Thayaparan, T.: Simultaneous and collocatedobservation of winds and tides by MF and meteor radar over Lon-don, Canada, Radio Sci., 32(2), 833–865, 1997.
Hocking, W. K., Fuller, B., and Vandepeer, B.: Real-time deter-mination of meteor-related parameters utilizing modern digitaltechnology, J. Atmos. Sol. Terr. Phys., 63, 155–169, 2001.
Lomb, N. R.: Least-squares frequency analysis of unequally spaceddata, Astrophys. Space Sci., 39, 447–462, 1976.
Manson, A. H. and Meek, C. E.: Dynamics of the middle atmo-sphere at Saskatoon (52 N, 107 W): A spectral study during 1981,1982, J. Atmos. Terr. Phys., 48, 1039–1055, 1986.
Namboothiri, S. P., Kishore, P., Murayama, Y., and Igarashi, K.:
Ann. Geophys., 27, 1989–1999, 2009 www.ann-geophys.net/27/1989/2009/
G. Jiang et al.: The 8-h tide in the mesosphere and lower thermosphere over Maui 1999
MF radar observations of terdiurnal tide in the mesosphere andlower thermosphere at Wakkanai (45.4◦ N, 141.7◦ E), Japan, J.Atmos. Sol. Terr. Phys., 66, 241–250, 2004.
Pendleton Jr., W. R., Taylor, M. J., and Gardner, L. C.: Terdiurnaloscillations in OH Meinel rotational temperatures for fall con-ditions at northern midlatitude sites, Geophys. Res. Lett., 27,1799–1802, 2000.
Scargle, J. D.: Studies in astronomical time series analysis. II, Sta-tistical aspects of spectral analysis of unevenly spaced data, As-trophys. J., 263, 835–853, 1982.
Smith, A. K.: Structure of the terdiurnal tide at 95 km, Geophys.Res. Lett., 27, 177–180, 2000.
Smith, A. K. and Ortland, D. A.: Modeling and analysis of thestructure and generation of the terdiurnal tide, J. Atmos. Sci.,58, 3116–3134, 2001.
Taori, A., Taylor, M. J., and Franke, S.: Terdiurnal wave signaturesin the upper mesospheric temperature and their association withthe wind field at low latitudes (20◦ N), J. Geophys. Res., 110,D09S06, doi:10.1029/2004JD004564, 2005.
Teitelbaum, H., Vial, F., Manson, A. H., Giraldez, R., and Masse-beuf, M.: Non-linear interaction between the diurnal and semid-iurnal tides: Terdiurnal and diurnal secondary waves, J. Atmos.Terr. Phys., 51, 627–634, 1989.
Thayaparan, T.: The terdiurnal tide in the mesosphere and lowerthermosphere over London Canada (43◦ N, 81◦ W), J. Geophys.Res., 102, 21695–21708, 1997.
Tokumoto, A. S., Batiata, P. P., and Clemesha, B. R.: Terdiur-nal tides in the MLT region over Cachoeira Paulista (22.7◦ S,45◦ W), Revista Brasileira de Geofısica, 25, 69–78, 2007.
Younger, P. T., Pancheva, D., Middleton, H. R., and Mitchell, N. J.:The 8-h tide in the Arctic mesosphere and lower thermosphere,J. Geophys. Res., 107(A12), 1420, doi:10.1029/2001JA005086,2002.
Zhao, G., Liu, L., Ning, B., Wan, W., and Xiong, J.: The terdiur-nal tide in the mesosphere and lower thermosphere over Wuhan(30◦ N, 114◦ E), Earth Planets Space, 57, 393–398, 2005.
www.ann-geophys.net/27/1989/2009/ Ann. Geophys., 27, 1989–1999, 2009