Embed Size (px)
Citation preview
The Accuracy and Inter-Unit Reliability of
Devices
Jocelyn K. Mara
University of Canberra

2
Table of Contents
Project Aim ......................................................................................... 3
Method ................................................................................................ 3
Data Analysis ...................................................................................... 6
Results ................................................................................................ 8
Distance ...................................................................................... 8
High-speed distance ................................................................... 8
Average speed .......................................................................... 10
Maximum speed ........................................................................ 10
Acceleration .............................................................................. 13
Deceleration .............................................................................. 13
Counts ...................................................................................... 16
Practical Implications ....................................................................... 17
Reference List................................................................................... 18
3
Project Aim:
To assess the accuracy and inter-unit reliability of the AxSys GPS devices for measuring
total distance, distance at high-speeds, average and maximum speed, and acceleration and
decelerations.
Method:
Subjects
Ten subjects were recruited to participate in this study. Five subjects (males = 4, females =
1) were recreationally active and participated in the running protocol used to assess total
distance. The remaining five subjects (all males) were elite academy rugby union players and
participated in running protocols used to assess distance at high-speeds, maximum speed,
average speed, acceleration and decelerations. Each subject wore two AxSys GPS devices
simultaneously for the duration of the study.
Running Protocols
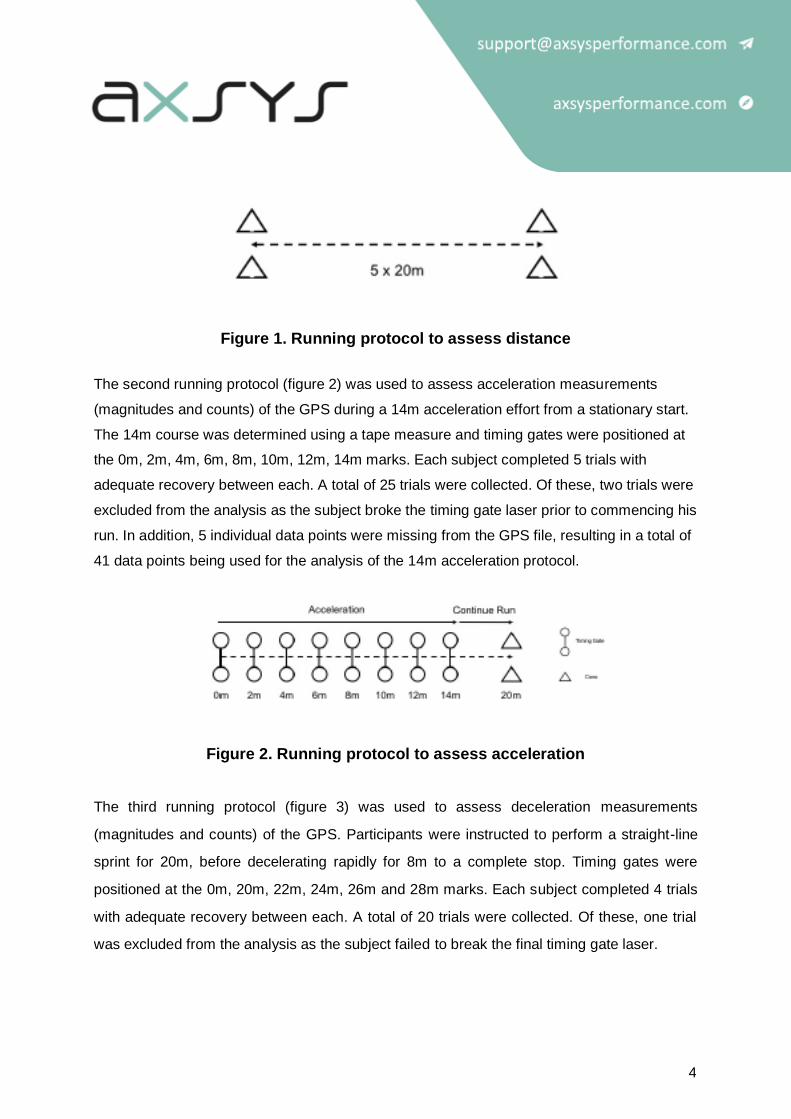
The first running protocol (figure 1) was used to assess total distance (m) measurements of
the GPS during change of direction movements. This protocol consisted of 5 x 20m repeated
running intervals with a 180° change of direction at a maximal effort pace. Each subject
completed 6 sets of the 5 x 20m intervals with adequate recovery between each set. This
resulted in 30 trials. Subjects were instructed to ensure that the GPS devices (fitted on the
upper back) were in line with the 20m markers when changing direction. If it was determined
that a subject’s GPS device was not in line with the 20m markers, this trial was noted and
excluded from the data analysis. Of the 30 trials collected for the 5x20m protocol, 6 trials
were excluded from data analysis as it had been determined during the running protocol that
the subject had not changed direction in line with the 20 markers, or the data was missing
from the GPS file. This resulted in 24 trials being used for the analysis of the 5x20m protocol
(48 total data points with 2 GPS data points for each trial).
4
Figure 1. Running protocol to assess distance
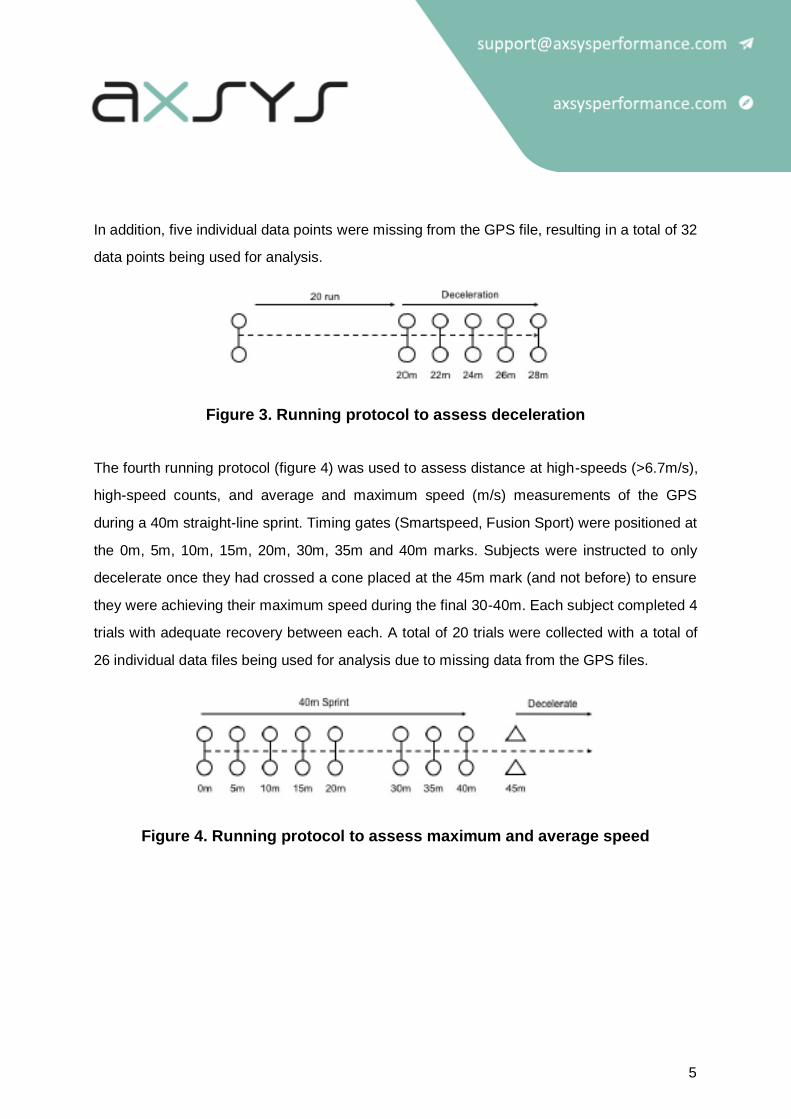
The second running protocol (figure 2) was used to assess acceleration measurements
(magnitudes and counts) of the GPS during a 14m acceleration effort from a stationary start.
The 14m course was determined using a tape measure and timing gates were positioned at
the 0m, 2m, 4m, 6m, 8m, 10m, 12m, 14m marks. Each subject completed 5 trials with
adequate recovery between each. A total of 25 trials were collected. Of these, two trials were
excluded from the analysis as the subject broke the timing gate laser prior to commencing his
run. In addition, 5 individual data points were missing from the GPS file, resulting in a total of
41 data points being used for the analysis of the 14m acceleration protocol.
Figure 2. Running protocol to assess acceleration
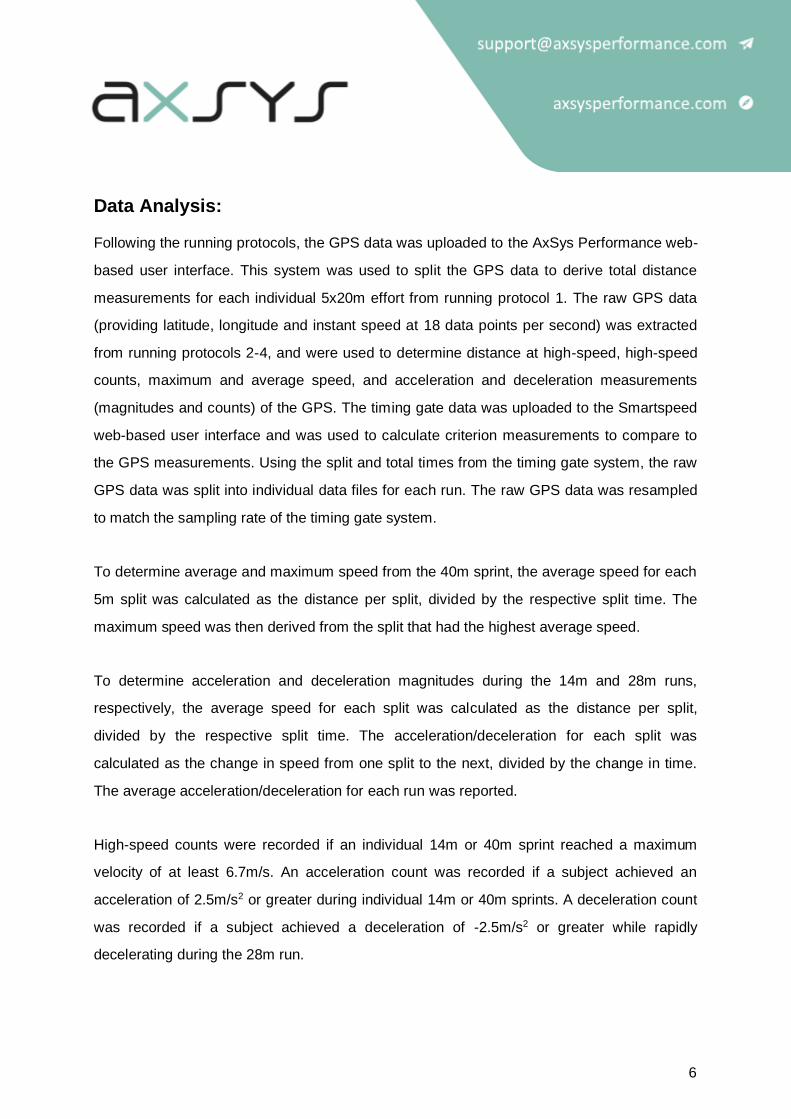
The third running protocol (figure 3) was used to assess deceleration measurements
(magnitudes and counts) of the GPS. Participants were instructed to perform a straight-line
sprint for 20m, before decelerating rapidly for 8m to a complete stop. Timing gates were
positioned at the 0m, 20m, 22m, 24m, 26m and 28m marks. Each subject completed 4 trials
with adequate recovery between each. A total of 20 trials were collected. Of these, one trial
was excluded from the analysis as the subject failed to break the final timing gate laser.
5
In addition, five individual data points were missing from the GPS file, resulting in a total of 32
data points being used for analysis.
Figure 3. Running protocol to assess deceleration
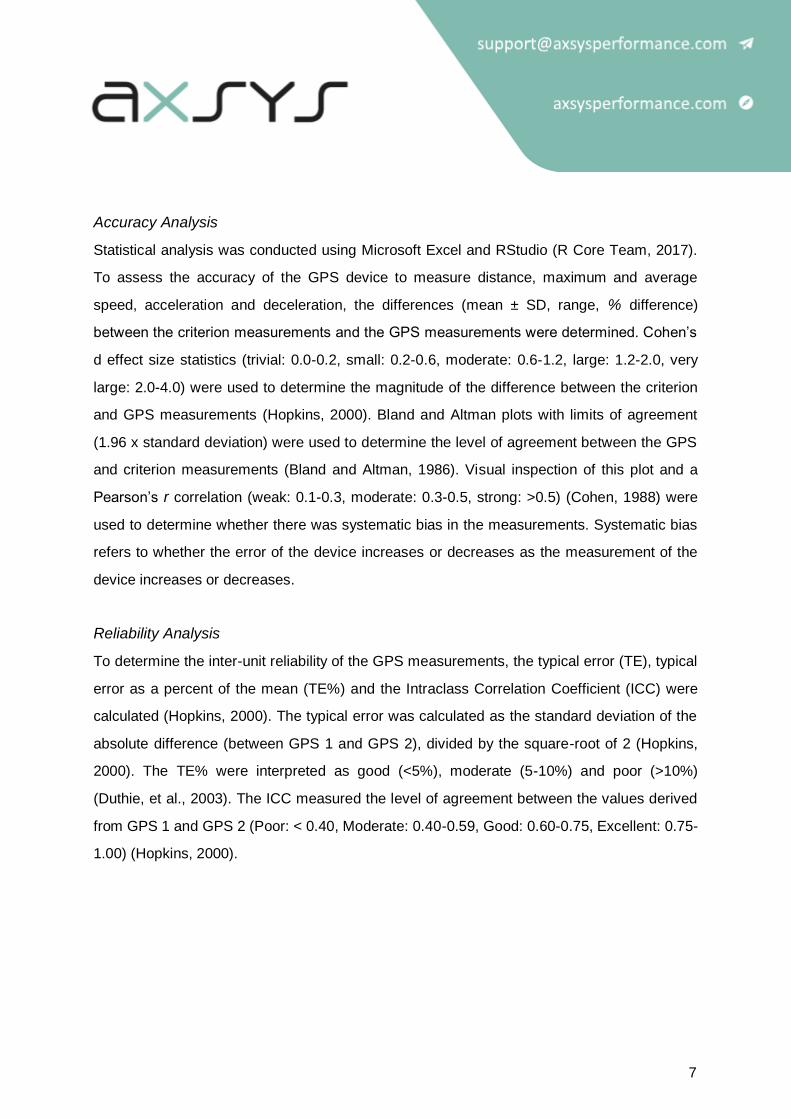
The fourth running protocol (figure 4) was used to assess distance at high-speeds (>6.7m/s),
high-speed counts, and average and maximum speed (m/s) measurements of the GPS
during a 40m straight-line sprint. Timing gates (Smartspeed, Fusion Sport) were positioned at
the 0m, 5m, 10m, 15m, 20m, 30m, 35m and 40m marks. Subjects were instructed to only
decelerate once they had crossed a cone placed at the 45m mark (and not before) to ensure
they were achieving their maximum speed during the final 30-40m. Each subject completed 4
trials with adequate recovery between each. A total of 20 trials were collected with a total of
26 individual data files being used for analysis due to missing data from the GPS files.
Figure 4. Running protocol to assess maximum and average speed
6
Data Analysis:
Following the running protocols, the GPS data was uploaded to the AxSys Performance web-
based user interface. This system was used to split the GPS data to derive total distance
measurements for each individual 5x20m effort from running protocol 1. The raw GPS data
(providing latitude, longitude and instant speed at 18 data points per second) was extracted
from running protocols 2-4, and were used to determine distance at high-speed, high-speed
counts, maximum and average speed, and acceleration and deceleration measurements
(magnitudes and counts) of the GPS. The timing gate data was uploaded to the Smartspeed
web-based user interface and was used to calculate criterion measurements to compare to
the GPS measurements. Using the split and total times from the timing gate system, the raw
GPS data was split into individual data files for each run. The raw GPS data was resampled
to match the sampling rate of the timing gate system.
To determine average and maximum speed from the 40m sprint, the average speed for each
5m split was calculated as the distance per split, divided by the respective split time. The
maximum speed was then derived from the split that had the highest average speed.
To determine acceleration and deceleration magnitudes during the 14m and 28m runs,
respectively, the average speed for each split was calculated as the distance per split,
divided by the respective split time. The acceleration/deceleration for each split was
calculated as the change in speed from one split to the next, divided by the change in time.
The average acceleration/deceleration for each run was reported.
High-speed counts were recorded if an individual 14m or 40m sprint reached a maximum
velocity of at least 6.7m/s. An acceleration count was recorded if a subject achieved an
acceleration of 2.5m/s2 or greater during individual 14m or 40m sprints. A deceleration count
was recorded if a subject achieved a deceleration of -2.5m/s2 or greater while rapidly
decelerating during the 28m run.
7
Accuracy Analysis
Statistical analysis was conducted using Microsoft Excel and RStudio (R Core Team, 2017).
To assess the accuracy of the GPS device to measure distance, maximum and average
speed, acceleration and deceleration, the differences (mean ± SD, range, % difference)
between the criterion measurements and the GPS measurements were determined. Cohen’s
d effect size statistics (trivial: 0.0-0.2, small: 0.2-0.6, moderate: 0.6-1.2, large: 1.2-2.0, very
large: 2.0-4.0) were used to determine the magnitude of the difference between the criterion
and GPS measurements (Hopkins, 2000). Bland and Altman plots with limits of agreement
(1.96 x standard deviation) were used to determine the level of agreement between the GPS
and criterion measurements (Bland and Altman, 1986). Visual inspection of this plot and a
Pearson’s r correlation (weak: 0.1-0.3, moderate: 0.3-0.5, strong: >0.5) (Cohen, 1988) were
used to determine whether there was systematic bias in the measurements. Systematic bias
refers to whether the error of the device increases or decreases as the measurement of the
device increases or decreases.
Reliability Analysis
To determine the inter-unit reliability of the GPS measurements, the typical error (TE), typical
error as a percent of the mean (TE%) and the Intraclass Correlation Coefficient (ICC) were
calculated (Hopkins, 2000). The typical error was calculated as the standard deviation of the
absolute difference (between GPS 1 and GPS 2), divided by the square-root of 2 (Hopkins,
2000). The TE% were interpreted as good (<5%), moderate (5-10%) and poor (>10%)
(Duthie, et al., 2003). The ICC measured the level of agreement between the values derived
from GPS 1 and GPS 2 (Poor: < 0.40, Moderate: 0.40-0.59, Good: 0.60-0.75, Excellent: 0.75-
1.00) (Hopkins, 2000).
8
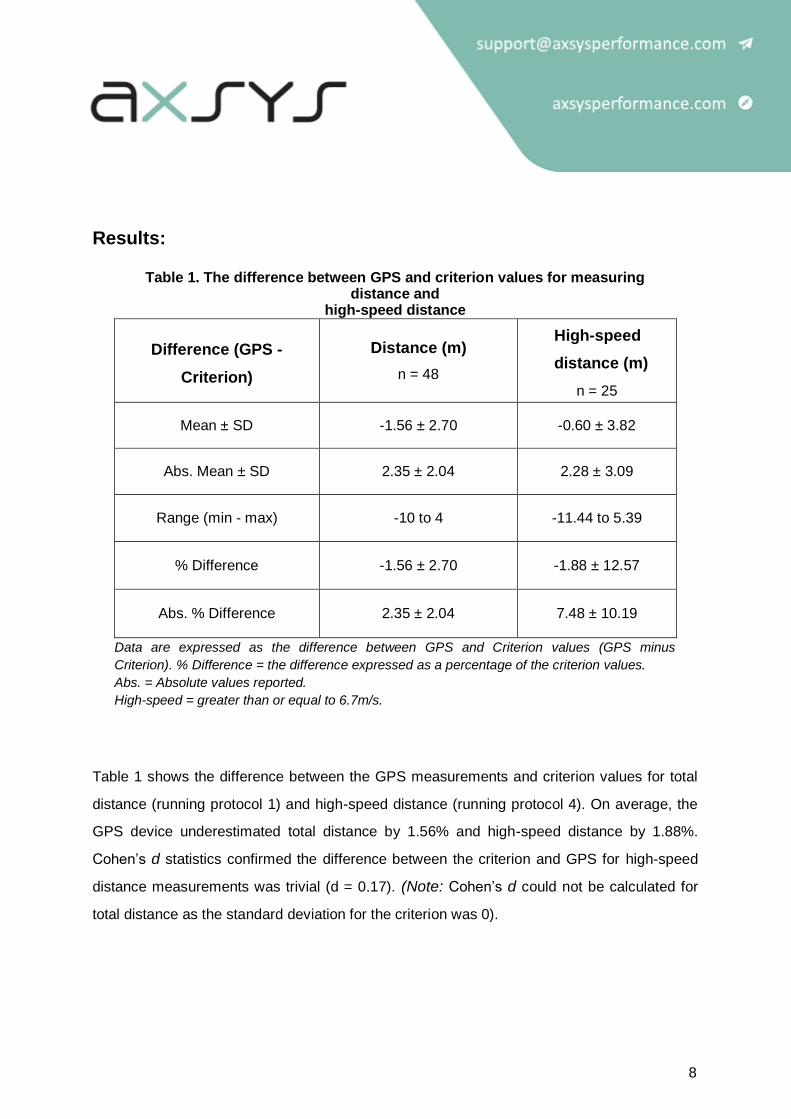
Results:
Table 1 shows the difference between the GPS measurements and criterion values for total
distance (running protocol 1) and high-speed distance (running protocol 4). On average, the
GPS device underestimated total distance by 1.56% and high-speed distance by 1.88%.
Cohen’s d statistics confirmed the difference between the criterion and GPS for high-speed
distance measurements was trivial (d = 0.17). (Note: Cohen’s d could not be calculated for
total distance as the standard deviation for the criterion was 0).
Table 1. The difference between GPS and criterion values for measuring distance and
high-speed distance
Difference (GPS -
Criterion)
Distance (m)
n = 48
High-speed
distance (m)
n = 25
Mean ± SD -1.56 ± 2.70 -0.60 ± 3.82
Abs. Mean ± SD 2.35 ± 2.04 2.28 ± 3.09
Range (min - max) -10 to 4 -11.44 to 5.39
% Difference -1.56 ± 2.70 -1.88 ± 12.57
Abs. % Difference 2.35 ± 2.04 7.48 ± 10.19
Data are expressed as the difference between GPS and Criterion values (GPS minus
Criterion). % Difference = the difference expressed as a percentage of the criterion values.
Abs. = Absolute values reported.
High-speed = greater than or equal to 6.7m/s.
9
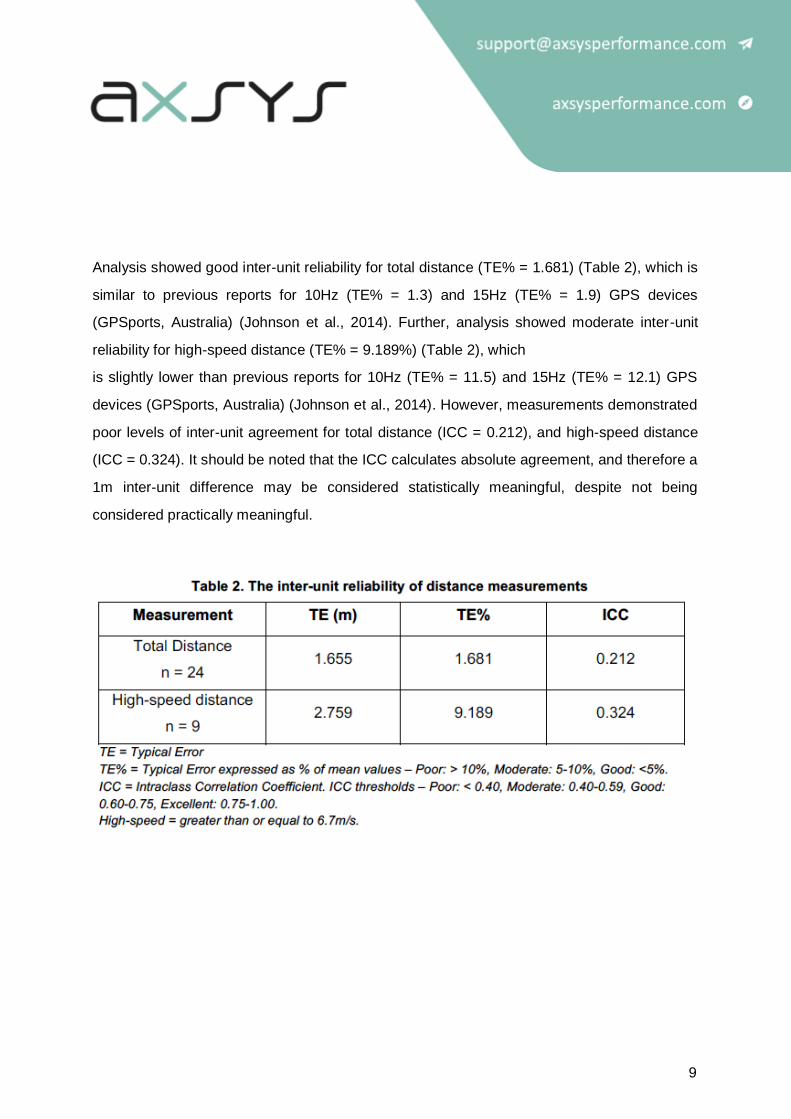
Analysis showed good inter-unit reliability for total distance (TE% = 1.681) (Table 2), which is
similar to previous reports for 10Hz (TE% = 1.3) and 15Hz (TE% = 1.9) GPS devices
(GPSports, Australia) (Johnson et al., 2014). Further, analysis showed moderate inter-unit
reliability for high-speed distance (TE% = 9.189%) (Table 2), which
is slightly lower than previous reports for 10Hz (TE% = 11.5) and 15Hz (TE% = 12.1) GPS
devices (GPSports, Australia) (Johnson et al., 2014). However, measurements demonstrated
poor levels of inter-unit agreement for total distance (ICC = 0.212), and high-speed distance
(ICC = 0.324). It should be noted that the ICC calculates absolute agreement, and therefore a
1m inter-unit difference may be considered statistically meaningful, despite not being
considered practically meaningful.
10
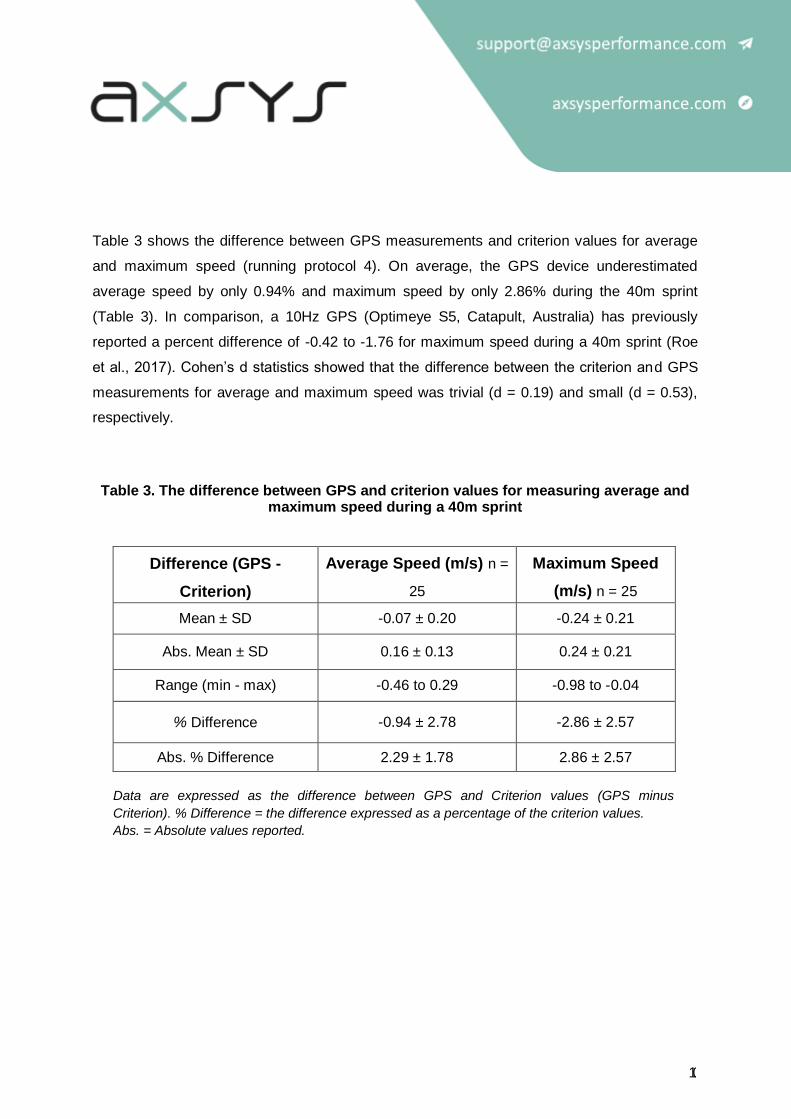
Table 3 shows the difference between GPS measurements and criterion values for average
and maximum speed (running protocol 4). On average, the GPS device underestimated
average speed by only 0.94% and maximum speed by only 2.86% during the 40m sprint
(Table 3). In comparison, a 10Hz GPS (Optimeye S5, Catapult, Australia) has previously
reported a percent difference of -0.42 to -1.76 for maximum speed during a 40m sprint (Roe
et al., 2017). Cohen’s d statistics showed that the difference between the criterion and GPS
measurements for average and maximum speed was trivial (d = 0.19) and small (d = 0.53),
respectively.
Table 3. The difference between GPS and criterion values for measuring average and maximum speed during a 40m sprint
Difference (GPS -
Criterion)
Average Speed (m/s) n =
25
Maximum Speed
(m/s) n = 25
Mean ± SD -0.07 ± 0.20 -0.24 ± 0.21
Abs. Mean ± SD 0.16 ± 0.13 0.24 ± 0.21
Range (min - max) -0.46 to 0.29 -0.98 to -0.04
% Difference -0.94 ± 2.78 -2.86 ± 2.57
Abs. % Difference 2.29 ± 1.78 2.86 ± 2.57
Data are expressed as the difference between GPS and Criterion values (GPS minus
Criterion). % Difference = the difference expressed as a percentage of the criterion values.
Abs. = Absolute values reported.

11
12
There was a weak relationship (r = 0.269) between the mean maximum speed values (of the
GPS and criterion measures), and the difference (between the GPS and criterion measures)
(Figure 1). Upon visual inspection of the Bland and Altman plot, there was evidence of
greater variation in the error among lower maximum speed measurements (less than 8 m/s),
compared to higher maximum speed measurements (greater than 8m/s). There was a
moderate relationship (r = 0.378) between the mean average speed values and the
difference, however there was no evidence of systematic bias when measuring average
speed upon inspection of the Bland and Altman Plot (Figure 2).
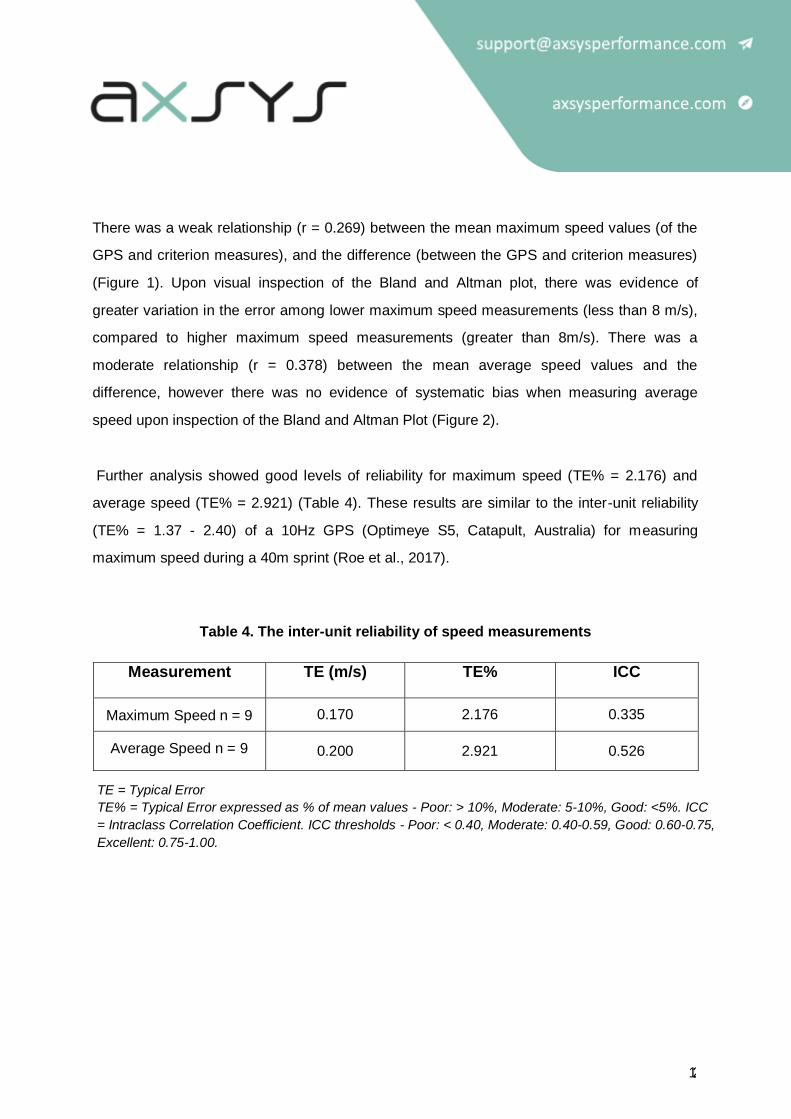
Further analysis showed good levels of reliability for maximum speed (TE% = 2.176) and
average speed (TE% = 2.921) (Table 4). These results are similar to the inter-unit reliability
(TE% = 1.37 - 2.40) of a 10Hz GPS (Optimeye S5, Catapult, Australia) for measuring
maximum speed during a 40m sprint (Roe et al., 2017).
Table 4. The inter-unit reliability of speed measurements
Measurement TE (m/s) TE% ICC
Maximum Speed n = 9 0.170 2.176 0.335
Average Speed n = 9 0.200 2.921 0.526
TE = Typical Error
TE% = Typical Error expressed as % of mean values - Poor: > 10%, Moderate: 5-10%, Good: <5%. ICC
= Intraclass Correlation Coefficient. ICC thresholds - Poor: < 0.40, Moderate: 0.40-0.59, Good: 0.60-0.75,
Excellent: 0.75-1.00.
13
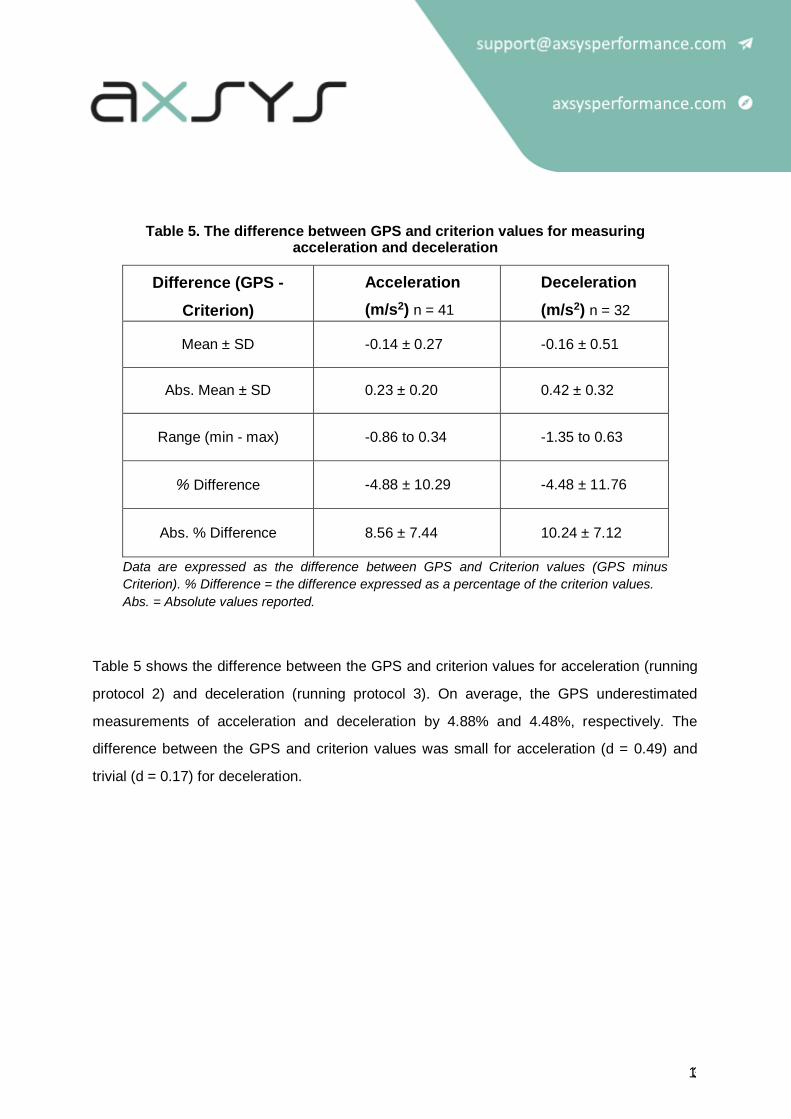
Table 5 shows the difference between the GPS and criterion values for acceleration (running
protocol 2) and deceleration (running protocol 3). On average, the GPS underestimated
measurements of acceleration and deceleration by 4.88% and 4.48%, respectively. The
difference between the GPS and criterion values was small for acceleration (d = 0.49) and
trivial (d = 0.17) for deceleration.
Table 5. The difference between GPS and criterion values for measuring acceleration and deceleration
Difference (GPS -
Criterion)
Acceleration
(m/s2) n = 41
Deceleration
(m/s2) n = 32
Mean ± SD -0.14 ± 0.27 -0.16 ± 0.51
Abs. Mean ± SD 0.23 ± 0.20 0.42 ± 0.32
Range (min - max) -0.86 to 0.34 -1.35 to 0.63
% Difference -4.88 ± 10.29 -4.48 ± 11.76
Abs. % Difference 8.56 ± 7.44 10.24 ± 7.12
Data are expressed as the difference between GPS and Criterion values (GPS minus
Criterion). % Difference = the difference expressed as a percentage of the criterion values.
Abs. = Absolute values reported.
14
15
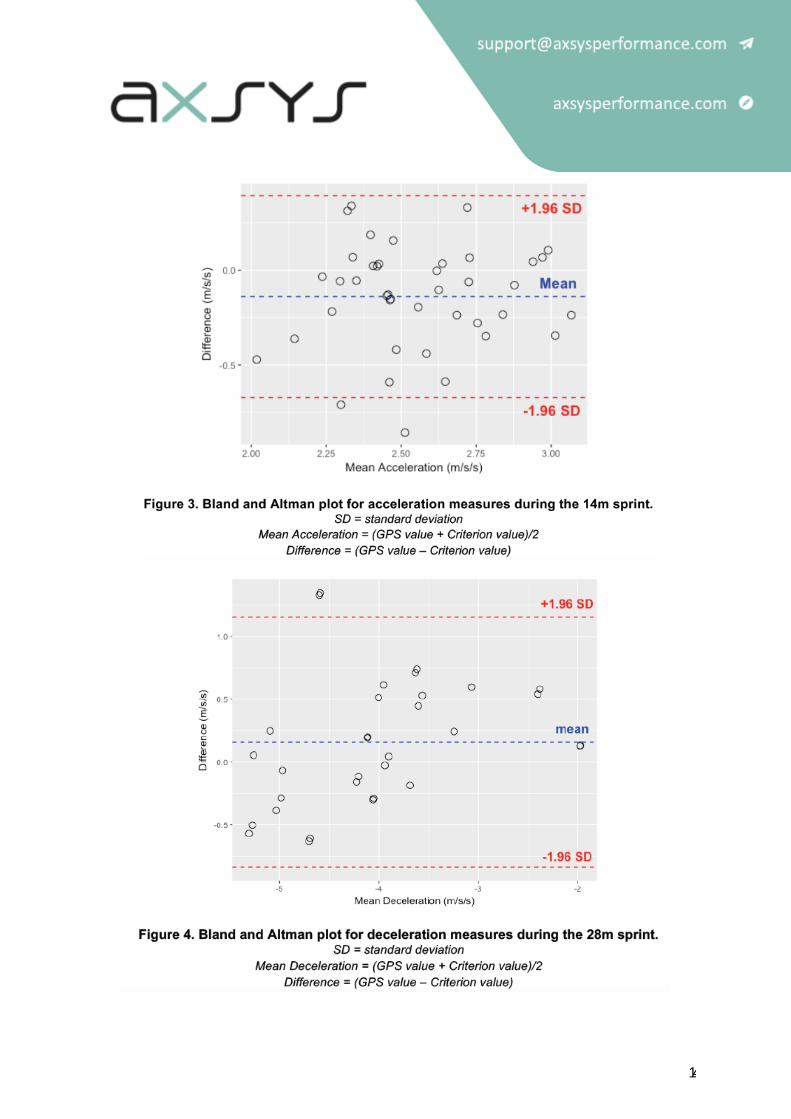
There was a weak relationship (r = 0.069) between the mean acceleration values and the
difference, and there was no evidence of systematic bias upon visual inspection of the Bland
and Altman Plot (Figure 3). There was a moderate relationship (r = 0.353) between the mean
deceleration values and the difference, with higher measurements (-4 to -5m/s2) tending to be
underestimated compared to lower measurements (-2.5 to -3.5) which tended to be
overestimated (Figure 4).
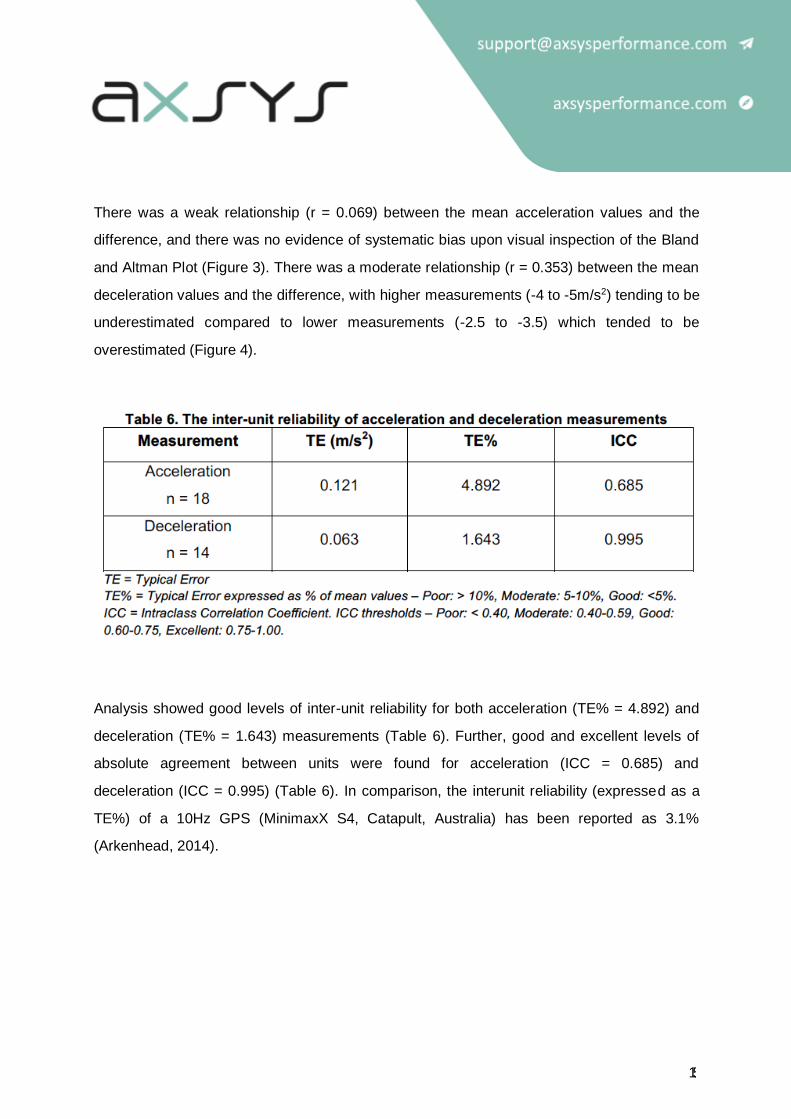
Analysis showed good levels of inter-unit reliability for both acceleration (TE% = 4.892) and
deceleration (TE% = 1.643) measurements (Table 6). Further, good and excellent levels of
absolute agreement between units were found for acceleration (ICC = 0.685) and
deceleration (ICC = 0.995) (Table 6). In comparison, the interunit reliability (expressed as a
TE%) of a 10Hz GPS (MinimaxX S4, Catapult, Australia) has been reported as 3.1%
(Arkenhead, 2014).
16
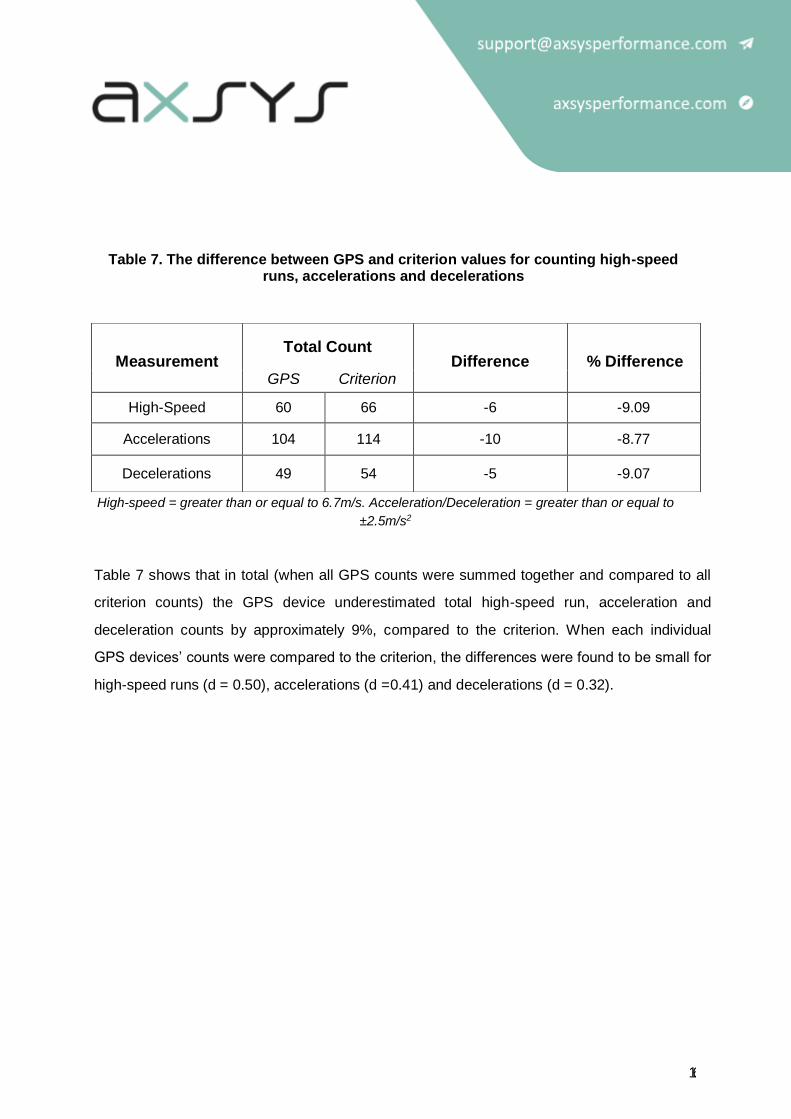
Table 7 shows that in total (when all GPS counts were summed together and compared to all
criterion counts) the GPS device underestimated total high-speed run, acceleration and
deceleration counts by approximately 9%, compared to the criterion. When each individual
GPS devices’ counts were compared to the criterion, the differences were found to be small for
high-speed runs (d = 0.50), accelerations (d =0.41) and decelerations (d = 0.32).
Measurement Total Count
Difference % Difference
GPS Criterion
High-Speed 60 66 -6 -9.09
Accelerations 104 114 -10 -8.77
Decelerations 49 54 -5 -9.07
High-speed = greater than or equal to 6.7m/s. Acceleration/Deceleration = greater than or equal to
±2.5m/s2
Table 7. The difference between GPS and criterion values for counting high-speed runs, accelerations and decelerations
17
Practical Implications:
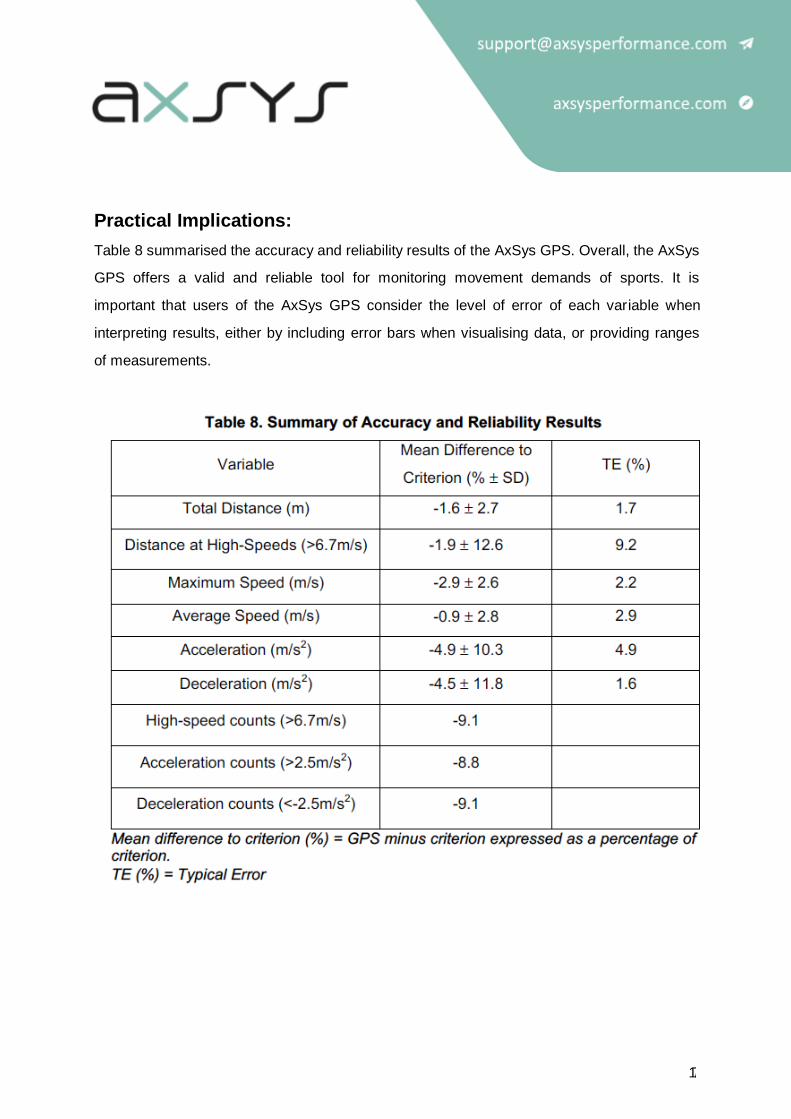
Table 8 summarised the accuracy and reliability results of the AxSys GPS. Overall, the AxSys
GPS offers a valid and reliable tool for monitoring movement demands of sports. It is
important that users of the AxSys GPS consider the level of error of each variable when
interpreting results, either by including error bars when visualising data, or providing ranges
of measurements.

18
Reference List:
1. Arkenhead, R., French, D., Thompson, KG., Hayes, PR. The acceleration dependent
validity and reliability of 10Hz GPS. Journal of Science and Medicine in Sport, 17: 562-
566.
2. Bland JM. & Altman DG. (1986). Statistical methods for assessing agreement between
two methods of clinical measurement. Lancet, 1: 307-10.
3. Cohen, J. (1988). Statistical power analysis for the behavioural sciences (2nd ed). New
York NY: Psychology Press.
4. Duthie, GM, Pyne, D, and Hooper, S. (2003). The reliability of video based time motion
analysis. Journal of Human Movement Studies, 44: 259-272.
5. Hopkins WG. (2000). A new view of statistics. Internet Society for Sport Science:
http://www.sportsci.org/resource/stats/
6. Johnson, RJ., Watsford, ML., Kelly, SJ., Pine, MJ. & Spurrs, RW. (2014). Validity and
interunit reliability of 10Hz and 15Hz GPS units for assessing athlete movement
demands. Journal of Strength and Conditioning Research, 28(6): 16491655.
7. R Core Team (2017). R: A language and environment for statistical computing. R
Foundation for Statistical Computing, Vienna, Austria. URL https://www.R- project.org/
8. Roe, G., Darral-Jones., Black, C., Shaw, W., Till, K., Jones, B. (2017). Validity of 10-Hz
GPS and timing-gates for assessing maximum velocity in professional rugby union
players. International Journal of Sports Physiology and Performance, 12: 836-839.