Embed Size (px)
Citation preview

The African e-Journals Project has digitized full text of articles of eleven social science and humanities journals. This item is from the digital archive maintained by Michigan State University Library. Find more at: http://digital.lib.msu.edu/projects/africanjournals/
Available through a partnership with
Scroll down to read the article.
- 76 -
LIVESTOCKPRODUCTION AND FOODSUPPLY TRENDS IN BOTSWANA
JMP ARNrlEN
Introduction
'!his paper describes trends in li vestock developnent and food
supply in Botswana. It deals firstly with a number of topics
relevant to livestock production. SUbsequently, links between
li vestock proouction and food supply are examined. '!hereafter,
constraints to livestock production are reviewed before a brieflook at the future is given.
Numberof Livestock
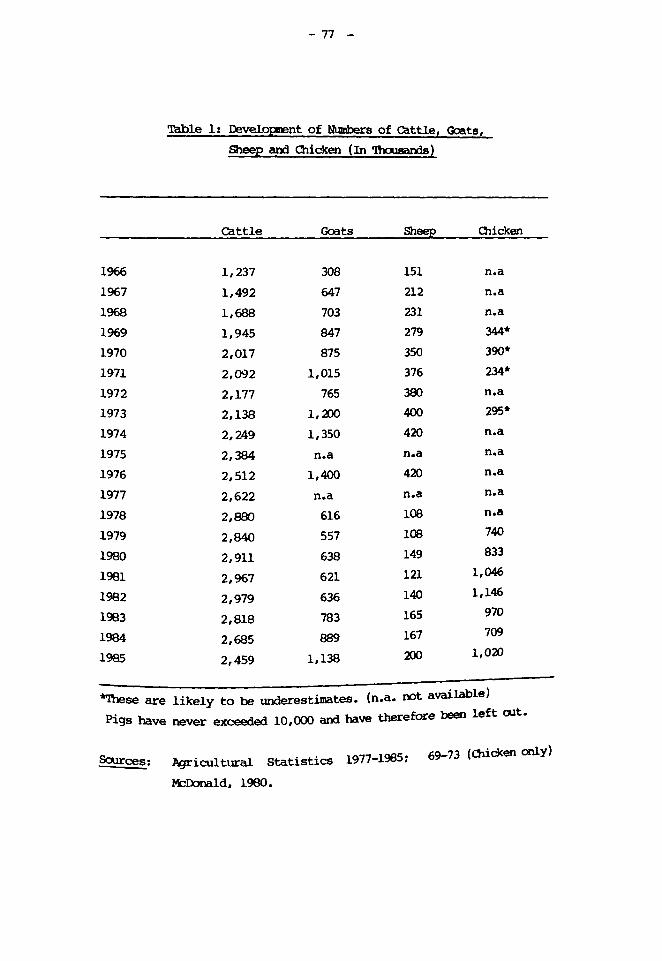
Table 1 sha.rs m.nnbers of cattle, goats, sheep and chicken in
the past twenty years (1966-85). In general, there was a
decline in the number of cattle rot a rapid increase in the
numberof goats during the four years 1982-85 towards the end
of the drooght. Overall, livestock numbers have increasedSUbstantially since independence. 'Ibis is especially true for
cattle. 'lhe average growth rate in the period 1971-1981 has
been 3.6 percent which is CCIIparable to the human population
gra.tth rate (estimated to be between 3.4 and 3.7 percent). '!he
drOJght has lXlt a (teuporary?) halt to the cattle p:>pUl.ationgra.tth rate. It has caUSed17 percent decrease over the period1982-1985. Overall, LivestOCk developnent has been heavilyinfluenced by .
government intervention thrcugh vetennarycaDpaigns, breeding programmes, the Tribal Grazing Land Policy,etc.
- 77 -
Table 1: Deve10pnent of Numbers of Cattie, Goats,Sheep alXi Chicken (In 'lbaJsards)
Cattle Goats Sheep Chicken
1966 1,237 308 151 n.a1967 1,492 647 212 n.a1968 1,688 703 231 n.a1969 1,945 847 279 344*1970 2,017 875 350 390*1971 2,092 1,015 376 234*1972 2,177 765 380 n.a1973 2,138 I,m 400 295*1974 2,249 1,350 420 n.a1975 2,384 n.a n.a n.a1976 2,512 1,400 420 n.a1977 2,622 n.a n.a n.a1978 2,880 616 108 n.a1979 2,840 557 lOB 7401980 2,911 638 149 8331981 2,967 621 121 1,0461982 2,979 636 140 1,1461983 2,818 783 165 9701984 2,685 8B9 167 7091985 2,459 1,138 200 1,020
*'Ibeseare likely to be underestimates. (n.a. not available)Pigs have never exceeded 10,000 and have therefore been left alt.
SQrrces: Agricultural Statistics 1977-1985: 69-73 (Chicken only)
M::Ibnald, 1980.
- 78
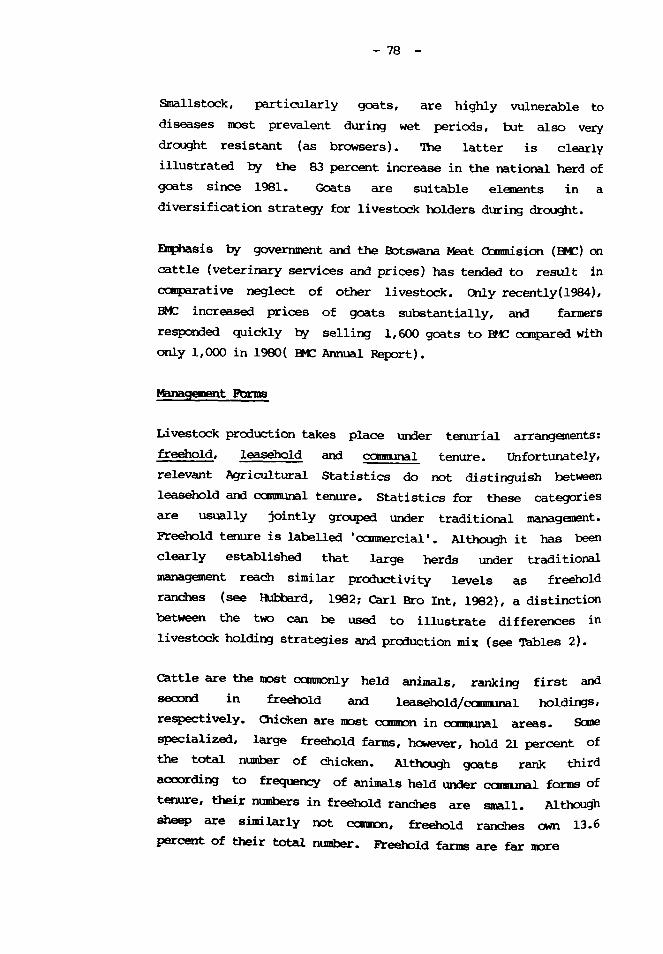
Smallstock, particularly goats, are highly vulnerable to
diseases nvst prevalent during wet periods, but also very
drought resistant (as browsers). The latter is clearly
illustrated by the 83 Percent increase in the national herd of
goats since 1981. Goats are suitable elements in a
diversification strategy for livestock holders during drought.
Emphasis by government and the Botswana Meat Camnision (ItC) on
cattle (veterinary services and prices) has tended to result in
ccmparative neglect of other livestock. Q1ly recently(l984),
1M: increased prices of goats substantially, and farmers
responded quickly by selling 1,600 goats to Bt£ canpared with
only 1,000 in 1980( 1M: Annual Report).
Management Pbrms
Livestock production takes place uooer tenurial arrangements:
freehold, leasehold and cannunal tenure. Unfortunately,
relevant Agricultural Statistics do not distinguish between
leasehold and CCIIIIIIUnal tenure. Statistics for these categories
are usually jointly grouped under traditional management.
Freehold tenure is labelled 'camnercial'. Although it has been
clearly established that large herds under tradi tiona!
management reach similar productivity levels as freehold
ranches (see Hul:bard, 1982: Carl Bro Int, 1982), a distinction
between the t1«l can be used to illustrate differences in
Iivestock holding strategies and production mix (see Tables 2).
Cattle are the most camoonly held animals, ranking first and
secorrl in freehold and 1easeho1d/CCIIIIIl1llalholdings,respectively. Chicken are nost camron in camm.ma1areas. Sane
specialized, large freehold farms, however, hold 21 percent of
the total m.miber of chicken. Altha1gh goats rank third
according to frequency of animals held under CCIIIIIl1llalforms of
tenure, their numbers in freehold ranches are small. Although
sheep are similarly not canmon, freehold ranches CMn 13.6
percent of their total number. Freehold farms are far nore
- 79 -
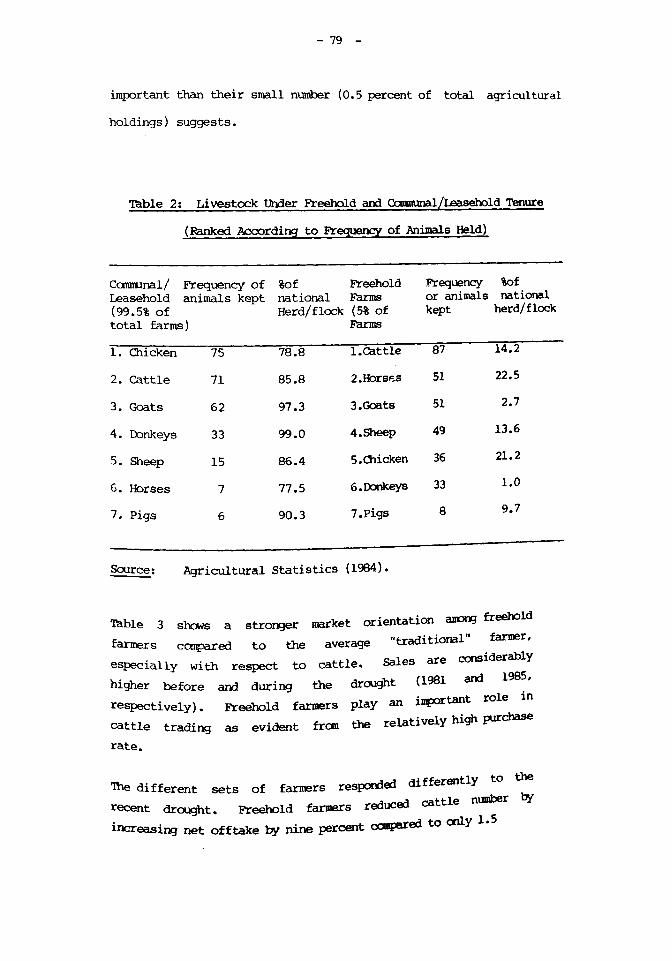
important than their small number (0.5 percent of total agricultural
holdings) suggests.
Table 2: Livestock UOOerFreehold am Ccmmmal/LeaseholdTenure
(Ranked According to Frequency of Animals Held)
Canrrunal/ Frequency of %of Freehold Frequency %ofLeasehold animals kept national Farms or animals national(99.5% of Herd/ flock (5%of kept herd/flocktotal farms) Farms
l. Olicken 75 78.8 1.Cattle 87 14.2
2. Cattle 71 85.8 2.lbrsF-s 51 22.5
3. Goats 62 97.3 3.Goats 51 2.7
4. D::>nkeys 33 99.0 4.Sheep 49 13.6
5. Sheep 15 86.4 5.Olicken 36 21.2
6. Horses 7 77.5 6.Lbnkeys 33 1.0
7. Pigs 6 90.3 7.pigs 8 9.7
Source: Agricultural Statistics (1984).
Table 3 shaNs a strol'¥Jer market orientation ~ freero1dfarmers ccmpared to the average "traditional" £armer,
especially with respect to cattle. Sales are considerably
higher before am duril'¥J the drought (1981 an:! 1985,
respectively). Freehold farmers play an iJJllOrtant role in
cattle trading as evident fran the relatively high purchaSe
rate.
'!he different sets of farmers resporded differently to the
recent drought. Freehold farmers reduced cattle number by
increasil'¥J net offtake by nine percent ocmparedto only 1.5
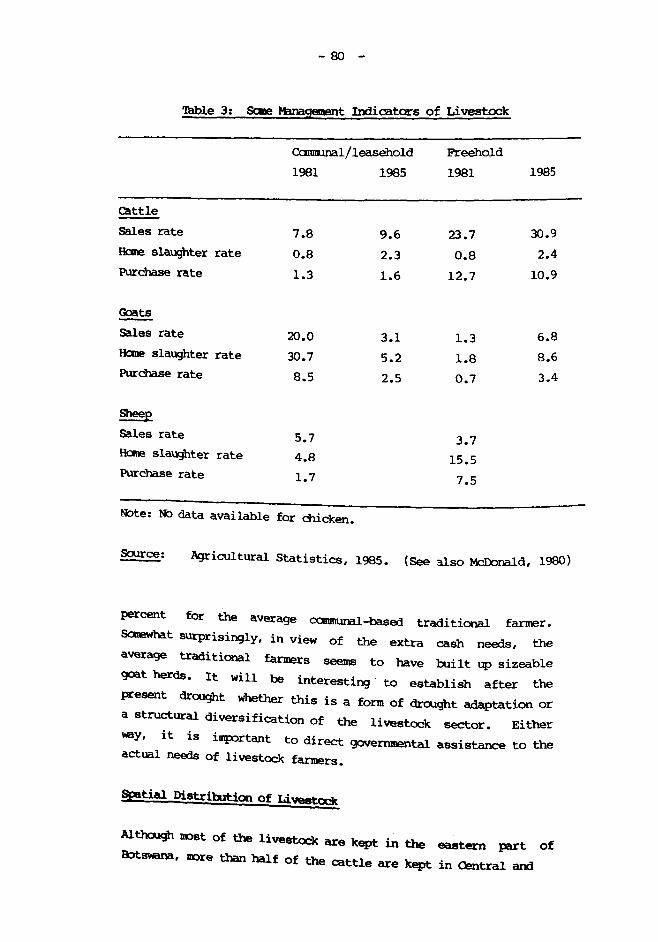
- 80 -
Table 3: Scme ManagementIndicators of Livestock
Carmuna1/1easeho1d
1981 1985
Freehold
1981 1985
CattleSales rate
Halle slaughter rate
Purchase rate
~Sales rate
Hane slaughter ratePurchase rate
Sheep
Sales rate
Hane slaughter ratePurchase rate
7.80.81.3
20.0
30.78.5
5.74.81.7
9.62.31.6
3.15.22.5
23.7
0.812.7
1.31.8
0.7
3.715.5
7.5
30.92.4
10.9
6.88.63.4
~te: ~ data available for chicJc:en.
Salrce:- Agricultural Statistics, 1985. (See :Uso M:::D.:>nald,1980)
percent for the average CCJnmunal-based traditional farmer.
Salewhat surprisingly, in view of the extra cash needs, the
average traditional farmers seems to have tAIilt up sizeable
goat herds. It will be interesting to establish after the
present drought whether this is a fonn of drooght adaptation or
a structural diversification of the livestock sector. Either
leY, it is important to direct governmental assistance to theactual needs of livestock farmers.
Spatial Distribution of Liveatock
Althoogh rost of the 1ivestock are kept in the eastern part of
&:>tswana, IlDre than half of the cattle are kept in Central and
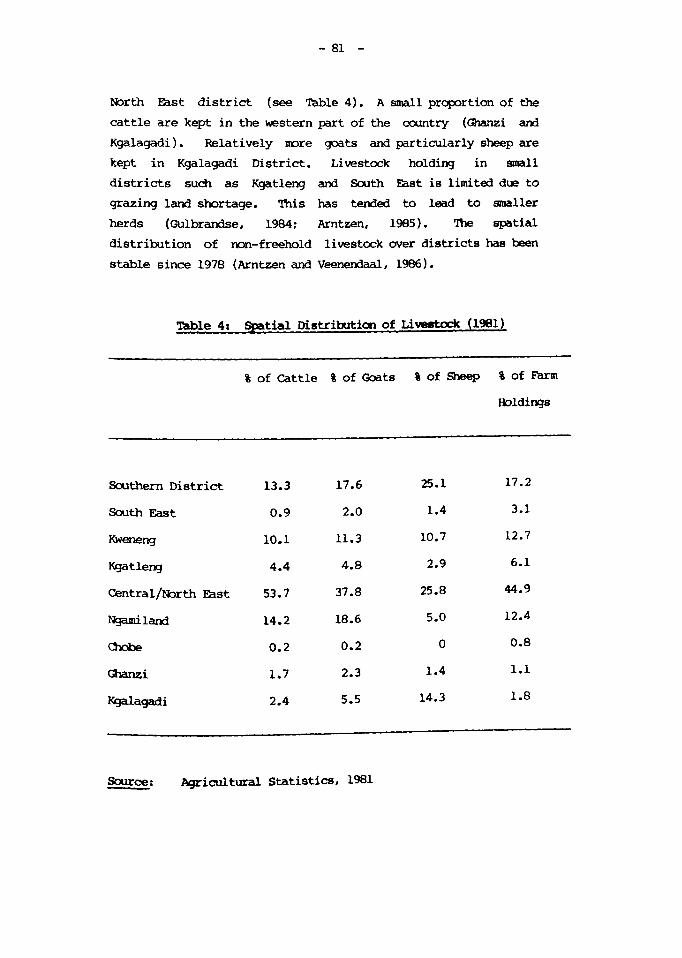
- 81 -
tbrth East district (see Table 4). A small prqx>rtion of the
cattle are kept in the western part of the ca.mtry (Ghanzi and
Kgalagadi). Relatively uore goats and particularly sheep are
kept in Kgalagadi District. Livestock holding in small
districts such as Kgatleng and Sooth East is Hmi ted due to
grazing land shortage. 'Ibis has tended to lead to smaller
herds (Gulbrandse, 1984: Arntzen, 1985). '!be spatial
distribution of ron-freehold livestock over districts has been
stable since 1978 (Arntzen and VeeneOOaa1,1986).
Table 4: Spatial Distribution of Livestock (1981)
% of Cattle % of Goats % of Sheep % of Farm
fbldings
Soothern District 13.3 17.6 25.1 17.2
South East 0.9 2.0 1.4 3.1
Kweneng 10.1 11.3 10.7 12.7
Kgatleng 4.4 4.8 2.9 6.1
Centraljtbrth East 53.7 37.8 25.8 44.9
Ngamiland 14.2 18.6 5.0 12.4
Chobe 0.2 0.2 0 0.8
Ghanzi 1.7 2.3 1.4 1.1
Kgalagadi 2.4 5.5 14.3 1.8
Salrce: Agricultural Statistics, 1981
- 82
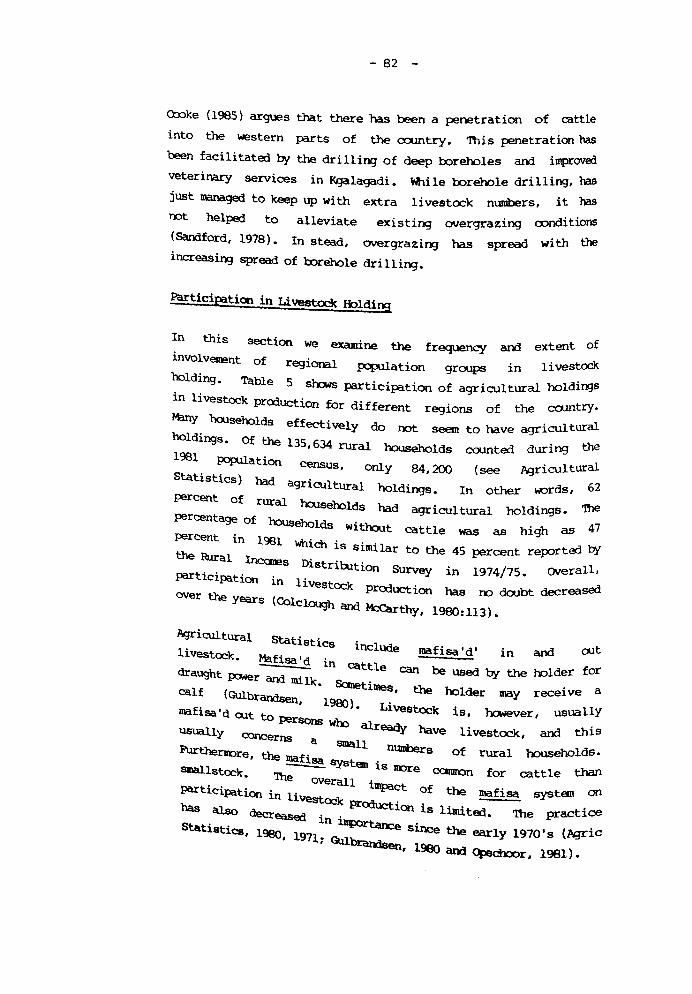
Cooke (l985) argues that there has been a penetration of cattle
--' penetration hasinto the western parts of the CXJUntry. lIIl s
. ovoobeen facilitated by the drilling of deep boreholes am lmpr
veterinary services in Kgalagadi. While borehole drilling, has
just managedto keep up with extra livestock numbers, it has
. " rgrazing condi tionsnot helped to allevlate eXlstlng ove
'th the(SaMford, 1978). In stead, overgrazing has spread Wl
increasing spread of oorehole drilling.
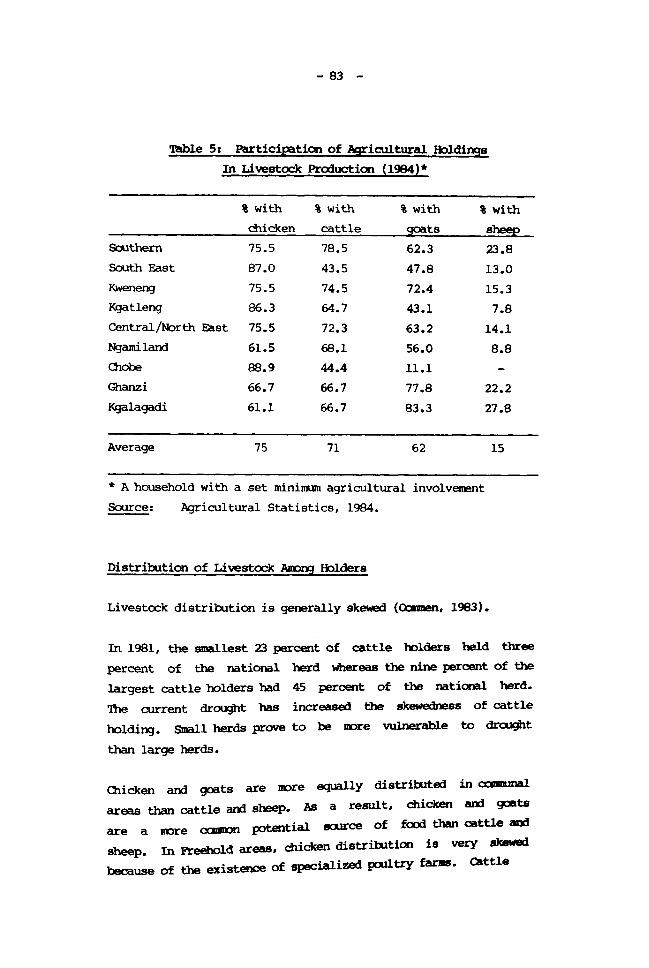
Participation in Livestock ft:>lding
In this section we examine the frequency arx3 extent of, 1 . , . livestocklnvo Vettent of reglonal pcp.llahon groups ln
holding. Table 5 sh::Msparticipation of agricultural holdings
in livestock prcxiuction for different regions of the ca.mtry.
Many households effectively do not seem to have agriculturalholdings. Of the 135,634 rural households counted during the
1981 pop.liation census, only 84,200 (see Agricultural
Statistics) bad agricultural holdings. In other \<lOrds, 62
percent of rural households had agricultural holdings. 'llle
percentage of households without cattle was as high as 47
percent in 1981 which is similar to the 45 percent refX)rted by
the Rural Incates Distrib.1tion Survey in 1974/75. OIlerall,participation in livestOCk production has 00 da.tbt decreasedover the years (Colclough and ~thy, 1980: 113) •
Agricultural Statistics include mafisa'd' in arx3 out
livestock. Mafisa'd in cattle can be used by the holder for
draught IX7rierand milk. Sanetimes, the holder may receive a
calf (Gulbrandsen, 1980). Livestock is however, usuallyf' , ,ma lsa d oot to perSOns Woo already have livestock. arx3 thisUSually ooncerns d
a SIIlall numbers of rural househo1 s.Furthernnre, the mafisa syst ......... _""
~ E!Ill 1S nnre cannon for cattle WI,Q<'smallstOCk. 'lb ,", e overall lmpact of the mafisa system onpartlclpahon in l' _
has lvestock production is limited. The practicealso decreased ' ,Statistics, 1980 :n lllp)rtance since the early 1970' s (hJric
• 1971. Gulbrandsen, 1980 and <Ptd1cx:>r, 1981).
- 83 -
'Dlble 5: Participation of J\gricultural Holdings
In Livestock Production (1984)*
% with % with % with % withchicken cattle goats sheep
Southern 75.5 78.5 62.3 23.8South East 87.0 43.5 47.8 13.0Kweneng 75.5 74.5 72.4 15.3Kgatleng 86.3 64.7 43.1 7.8Central/North East 75.5 72.3 63.2 14.1N:Jamiland 61.5 68.1 56.0 8.8Olobe 88.9 44.4 11.1Ghanzi 66.7 66.7 17.8 22.2Kgalagadi 61.1 66.7 83.3 27.8
Average 75 71 62 15
* Ahousehold with a set miniJl\Ulllagricultural involvement
Source: Agricultural Statistics, 1984.
Distriootion of Livestock AiIInJ Holders
Livestock distriootion is generally skewed (<kJnmen, 1983).
In 1981, the smallest 23 percent of cattle holders held three
percent of the national herd whereas the nine percent of the
largest cattle holders had 45 percent of the national herd.'!he current drought has increased the skewedness of cattle
holding. Small herds prove to be DOre wlnerable to draJght
than large herds.
Chicken and goats are rore equally distriOOted in 0CIIIIIl.IJlal
areas than cattle and sheep. As a result, chicken and goats
are a rore CCIIIIIX1potential soorce of food than cattle and
sheep. In Freehold areas, chicken distriootion is very skewedbecause of the existence of specialized poultry farlllS. Cattle
- 84 -
distribution is rore skewed than in camnunal areas. Goats and
sheep are least skewedly distributed.
Daaestic Food Production And SltIPly
Since imepemence, rapid population grCMth, urbanization,
increased overall inccme levels have led to increased and rore
varied food consumption patterns, and to the emergence of
canmercial food sUWly systems for urban areas where rost
people are no lOBJer involved in food production. While the
camtry is generally self sufficient in meat production,
danestic production of dairy products falls far short of
oonsunption needs. In addition, data on meat production for
local consumption is not well documented. Beef production is
rostly for export prrposes (+80 percent) whereas goats, sheep
and chicken are primarily produced for danestic household
oonsunption (goats: 90 percent, sheep: 60 percent, chicken:
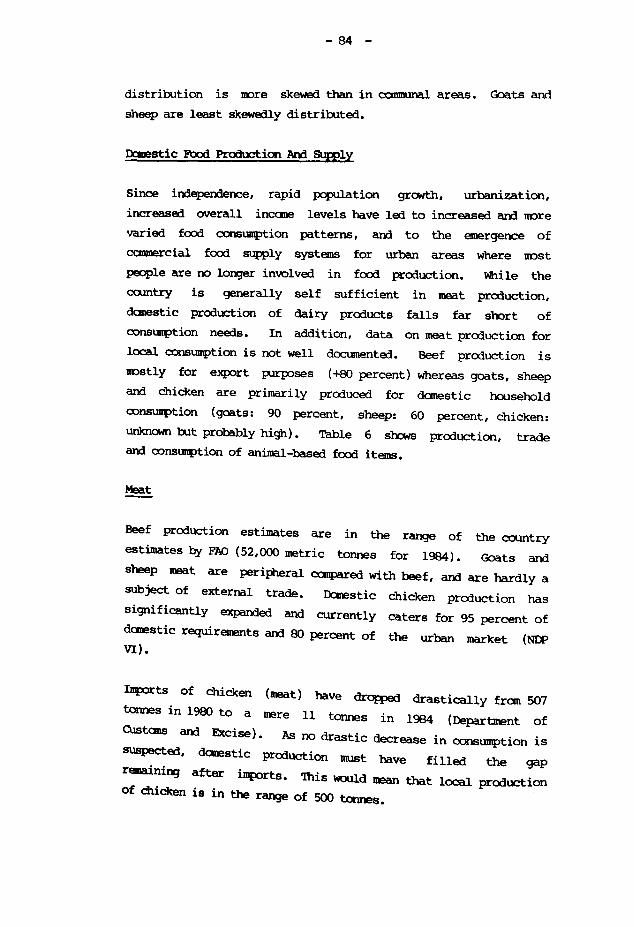
unknCHl but probably high) • Table 6 shMs production, tradeand oonsunption of animal-based food items.
Beef production estimates are in the range of the country
estimates by FAO(52,000 metric tonnes for 1984). Goats and
sheep meat are periP'1eral canpared with beef, and are hardly a
subject of external trade. Dcmestic chicken production has
significantly expanded and currently caters for 95 percent ofdanestic requirements and 80 percent of the urban market (NDPVI) •
Imports of chicken (meat) have drOWed drastically fran 507
tonnes in 1980 to a mere 11 tonnes in 1984 (Department of
Custans and Excise). As no drastic decrease in consumption issuspected, daoestic production llDJSt have filled the gap
remaining after imports. 'Ibis WOUldmean that local productionof dticken is in the range of 500 tomes.
- 85 -
'nlble 6: Production, Trade am O:>nsuIIptionOf
Animal-Based Food ItE!lllS (1984)
a) In volume (metric tonnes)
(1) (2) (3) (4)*Locally Imports Exports CbnsumptionProduced
Meat beef 58,000 41 29,019 29,022goats 1,900 0 7 1,893sheep 494 13 16 491chicken 209 11 2 218others n.a 177 n.a n.aTotal 60,603 242 29,044 31,801
or 83g1/p/dMilk +27,800 7,249 0+35,000 or 0.091t/p/dDJgs 2,147 113 0 2,260
b) In value (P.OOO**)
Meat beef 120,073 96 60,076 60,093goats 257 0 1 256sheep 1,235 48 40 1,243chicken 439 32 5 466others n.a 518 2,004 n.aTotal 122,004 694 62,126 60,572
Milk +18,785 5,251 12 +24,024
DJgs 3,420 180 0 3,600
* 4 = 1+ 2 - 3.** IDeal production valued at export pricesSources: Calculations based on J\gricultural Statistics arrl
External Trade Statistics.
- 86 -
Table 6: Productiat, Trade am. O:lnsuDptiatOf
Animal-Based Food Items (1984)
a) In volume (metric tonnes)
(1) (2) (3) (4)*Locally Imports Exports CbnsumptionProduced
Meat beef 58,000 41 29,019 29,022goats 1,900 0 7 1,893sheep 494 13 16 491chicken 209 11 2 218others n.a 177 n.a n.aTotal 60,603 242 29,044 31,801
or 83g1/p/dMilk +27,800 7,249 0+35,000 or 0.091t/p/dEggs 2,147 113 0 2,260
b) In value (P.OOO**)
Meat beef 120,073 96 60,076 60,093goats 257 0 1 256sheep 1,235 48 40 1,243chicken 439 32 5 466others n.a 51B 2,004 n.aTotal 122,004 694 62,126 60,572Milk +lB,7B5 5,251 12 +24,024Eggs 3,420 18:> 0 3,600
* 4 = 1+ 2 - 3.** Uxal production valued at export pricesSources: Calculations based on Agricultural Statistics am.
External Trade Statistics.
- 87 -
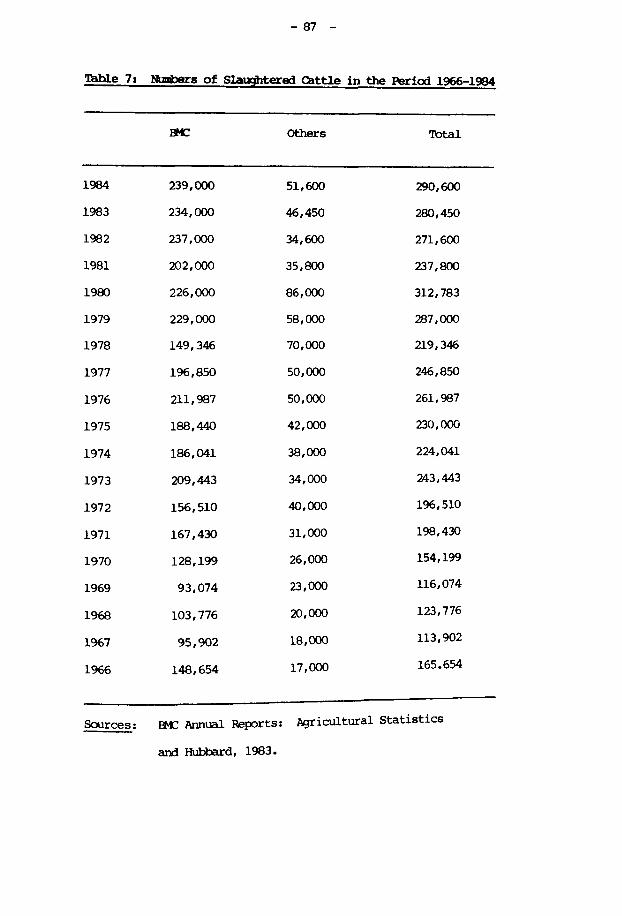
Table 7: Numbers of Slaughtered Cattle in the Period 1966-1984
Others Total
1984 239,000 51,600 290,600
1983 234,000 46,450 280,450
1982 237,000 34,600 271,600
1981 202,000 35,800 237,800
1980 226,000 86,000 312,783
1979 229,000 58,000 287,000
1978 149,346 70,000 219,346
1977 196,850 50,000 246,850
1976 211,987 50,000 261,987
1975 188,440 42,000 230,000
1974 186,041 38,000 224,041
1973 209,443 34,000 243,443
1972 156,510 40,000 196,510
1971 167,430 31,000 198,430
1970 128,199 26,000 154,199
1969 93,074 23,000 116,074
1968 103,776 20,000 123,776
1967 95,902 18,000 113,902
1966 148,654 17,000 165.654
Sources: ~ Annual Reports: Agricultural Statistics
and Hubbard, 1983.
- 88 -
Table 8: Numbers of slaughtered Goats in the Period 1966-1984
others Total
1984 8,216 55,200 63,416
1983 4,127 43,400 47,527
1982 384 41,000 41,3841981 296 51,400 51,6961980 309 33,200 33,5091979 416 35,300 35,7161978 323 n.a n.a.
1977 3,533 II II
1976 5,137 II
1975 16,010 II II
1974 42,756 II
1973 4,476 II II
1972 14,838 II II
1971 25,244 "1970 26,359 II "1969 17,573 II "1968 19,853 II "1967 3,323 " II
1966 538 II "
n.a.= Not Available
Salrces: Be Annual Reports: J\gricultural Statistics
and Hulilard, 1983.
- 89 -
Table 9: Numbers of Slaughtered Sheep in the Period 1966-1984
Others Total
1984 7,965 8,500 16,465
1983 3,382 13,000 16,382
1982 264 9,300 9,564
1981 178 14,590 14,678
1980 198 33,200 33,398
1979 331 6,100 6,431
1978 440 n.a n.a
1977 1,910
1976 2,990
1975 5,364 II II
1974 14,989 II
1973 4,240 II
8,096 " "1972
16,622 "1971
1970 7,427II II1969 17,387II "1968 12,543
" II
1967 3,903
" "1966 2,812
n.a.= Not Available
Sources: ~ Annual Report, l\gricultural Statistics
and HuJ:j)ard, 1983.
- 90 -
rairy Products
Rural milk production is IlOStly non-commercial. It is used as
the primary diet for young children (Carl Bro Int, 1982). '!he
Integrated Farming Pilot Project fourrl that in Mathethe,
Southern District, only 20 percent of the cc::MSwere milked.
Milk production fluctuates considerably from season to season
(0.5-1.6 liters per day). The Agricultural Technological
Improvement Project found goats to be an important source of
milk in the Tutlnlleregion providing an average 1.5 Liters per
farmer per day with a meandaily production per goat of 284ml
in 1986. '!he number of milking farmers fluctuated I1Dnthlybetween 35 and 85 percent (Gray, 1987).
Milk production is affected by drought. Drought conditions
lead to l<Xo/ercalving rates and a lCMeraverage milk production
per CCM. Since milk in rural areas is used for household
consUllptionneeds only, we have asstmled a proportinately lCM'ermilk production for large herds in communal holdings. '!he
importation of milk remains important particularly for urban
areas. Large anount of milk are imported in powder form (7,963
tonnes in 1984 catpared with 6,217 fresh milk). Milk based
products such as butter and cheese are allOC>stentirely imported.
Distribution Of Animal Based Food
Incane and cattle CMtlership are closely linked. Similarly,small stock and cattle CMtlership appear positively related(Litschauer and Kelly, 1981). '!able 10 slUlUllarizes availability
of meat and milk availability as well as incane fran holdingsin different herdsize categories. Benefits in terms of milk
and food availability are positively correlated to herdsize.M;)reover, meat fran hane slaughter increases during a period of
drought as the COlparison between 1981 and 1984 illustrates.Milk availability increases aIOC>ng small herds, however, furtherstudies are required before final conclusions can be made.
- 91 -
Table 10: Meat am. Milk Availabilityper herdsize by holding (1981-1984)
a) CattleHerdsize Number of Meat fran Milk Availability Net Incane
Agriculture bane slaugh (mlt/pers/day Iblding* (p)(XOOO) (GriPer/day)
1981 1984 1981 1984 1981 1984 1984
0 26.5 23 0 0 0 0 01 - 10 13.4 17 7 25 89 244 8211-20 14.0 12 16 56 188 298 16141 - 100 10.3 10 44 48 433 672 611100+ 5.3 4.7 86 198 306 148 2,093
Total withCattle 57.7 57.7 31 62 200 203 424Canmercial .3 .3 1366 2149 1695 1265 55,835
!?LGoats
0 34.6 30.8 0 0 0 0 0
1 - 10 28.2 21.1 5 8 22 22 P-2
11- 20 12.3 13.9 11 14 52 50 P-1
21-40 5.6 21 21 19 30 P1310.640+ 31 30 26 10 p29
1.B 4.0
Total wi9 14 33 P4
Goats 46.9 49.6205 19 41 P320
Camnercia1 .2 .2 132
*Sales Minus PurchaseSources: Agricultural Statistics 1981, 1984.
- 92
Incane is measured simply as sales minus purchases (without
assessl1l8nt of expenditures) and is generally positively
correlated to herdsize (also found by the Livestock Hanagement
SUrvey). Incane fran livestock can be used to suwlement
incane losses incurred fran elsewhere due to, for example,
drought (Kgathi and cpschoor, 1981). 'Ibis fact probably
explains the relatively high incane fran cattle in small cattle
herds. In contrast, investments seem to be channelled to the
building up of larger herds of goats.
Cbnstraints on Livestock Developnent
'Ibe country and its people face a m.nnber of socio-economic and
environmental constraints in developing livestock relatedresources. Low and erratic rainfall in canbination with soil
characteristics make large parts of the country to be unsuited
for extensive forms of grazing. Carrying capacity estimates
range fran 12 16ha/Lsu in the eastern hardveld to 16 - 20
ha/Lsu in the western sandveld. Flexibility and IIDbility are
important adaptation mechanisms which have, horever, lost
relevance due to increased land pressure. Despite the large
size of the country, the prevailing environmental oonditionsand other land use activities set long term limits.
Land has becane a scarce resource, particularly in smalldistricts. Expansion of livestock can no longer take place
unless at the expense of other activities such as hunting and
gathering. OVer utilization of grazing throughout the country,reduces herd performance (see LivestOCk ManagementSUrvey) and
endangers long term perspecti ves of livestock. Under such
circumstances, grazing has becane the IIDst serious constraint
which is difficult to ease. Droughts reduce carrying capacity
and IIDst seriously affect herds of less than 20 head (Carl BraInt, 1982). As a result, the distribution of cattle becanes
IIDre skewed as small herd owners lose or sell their cattle with
very little chances of being able to ever rebuilt their herds.In addition, land pressure has increased the tendency taerds
privatization of groundwatersources and surroonding grazing to
- 93 -
the detriment of the small holders woo have to keep herds in
more congested mixed farming areas (Peters, 1983~ Arntzen,
1985). Expansion into the less congested western parts ofBotswana is only affordable for large cattle omers.
Future IDplications
It is obviously not possible to indicate where the livestocksector will be in another 20 years. '!here are too many
uncertainties and factors which are (partly) beyond goverrunent
control (e.g. access to export facilities and the regional
political situation). In addition, the direction of government
intervention cannot easily be predicted in detail. Hcwever, it
afPeCl.rs possible to predict what may ha~n if no drastic
changes occur. '!he anticipated contribution of rapid
population growth will in principle increase livestock m.unbers
(as there are few alternatives). Cbnsequently, envirorunental
and socio-econanic constraints will be IIDre felt. land may
becane more degraded, more econanic inputs will be needed for
livestock production (e.g. fodjer, lalxlur) aM access to
production assets such as waterpoints will be vital. As these
requirements cannot be met by small livestock holders, the
result will be an increased drop out rate of small livestock
holders and an increasingly skewed distribution of cattle.
Goats could play the role of "fX'OrmanI s cattle" IIDre than at
present, but they are not able to replace cattle as draught
power. In general, rural incane distribution is likely tobecane more skewed unless the I drop-outs I fran livestock
production will find alternative incane sources.
Artnzen, J.W.1985 "Agricultural Developnent and ram use..in ~tern
Carmllnal Botswana: 'lhe case of Kgatleng. Natl0r:w-Institute of Research and Documentation. Worklngpaper No. SO, University of Botswana.
Arntzen J.W.1986
- 94 -
and E.M. Veenerrlaal,"A Profile of Environment and Development inBotswana". Institute for Environmental Studies, TheFree Universi ty, Amsterdam.
Department of Agricultural Research1986 "ATIPProgress Report 1985-1986". Government Printer.
Gray,1987 "Goat Production in the future region.
Technology Improvement Project" ,Agriculture.
AgriculturalMinistry of
Gulbrandsen Q,1980
Gulbrandsen, Q.1985
Hubbard, M.1982
Agro-pastoral Production and Canrnuna1 Land Use: ASocio-Econanic Study of the I3ang1.aketse. Universityof Bergen/Ministry of Agriculture, Botswana.
"Access to Agricultural Land and Canrnunal LandManagement in Eastern Botswana". Applied ResearchUnit, Ministry of Local Government and Lands.
"'lhe 1979 and 1980 Agricultural Statistics". In:Hitchcock, R.K. (ed.) "Botswana First LivestockDevelopment Project and its Future Implications" ,National Institute of Research and Ih::umentation.
Hubbard, M.1983 "Botswana and the International Beef
1900-1981" Ph.D. 'n1esis, University of Sussex.Trade
Litschauer,1981
J.G. arrl W.F. Kelly,"'!he Structure of Tradi tiona1Botswana. Division of PlanningMinistry of Agriculture.
Agriculture inand Statistics,
McD:>nald,I.1980
"AHandbook of Livestock Statistics", Ministry ofAgriCUlture.
Ministry of Agriculture1965 Agricultural Statistics. 1985
Murray, M.1978 "wildlife
WesternIndustry.
- 95
UtilizationBotswana"•
Investigation and Planning inMinistry of Commerce and
Claturen, M.A.1983
Opschoor, J.D.1981
Sandford S,1978
"GrOW"thwith Equity: Some explanatory !iyp:)thesisbased on the Structure and pattern of Distributionin Botswana". In M.A Cbmmen, et. al Botswana'sEconomySince Independence. Tata Ma.Graw-Hall.
"Environmental Resources Utilization in CommunalEastern Botswana. National Institute of Researchand TbclllTlentation. I'larking paper No. 38.University of Botswana.
"D:aling with Drought aJ1d Livestock in Botswana: A"Overseas Development Institute, U.K.