Embed Size (px)
Citation preview
1850 M Street NW, Suite 300 Washington, DC 20036 Telephone 202 223 8196 Facsimile 202 872 1948 www.actuary.org
Report from the joint American Academy of Actuaries/Society of Actuaries Payout Annuity Table Team,
a joint subgroup of the Life Experience Subcommittee
2012 Individual Annuity Reserving Table
Presented to the National Association of Insurance Commissioners’
Life Actuarial Task Force
September 2011
The American Academy of Actuaries is a 17,000-member professional association whose mission is to serve
the public and the U.S. actuarial profession. The Academy assists public policymakers on all levels by providing leadership, objective expertise, and actuarial advice on risk and financial security issues. The
Academy also sets qualification, practice, and professionalism standards for actuaries in the United States.
Payout Annuity Table Team
Mary Bahna-Nolan, FSA, CERA, MAAA, Chair
Special thanks to Korrel Rosenberg, SOA, Vivek Mishra, Towers-Watson and Wun Wong, PhD for assistance with the modeling.
William Albright, FSA, MAAA James Lamson, FSA, MAAA Frederick Andersen, FSA, MAAA Joseph Lu, MPhil, FIA William Carmello, FSA, MAAA Jack Luff, FSA, FCIA, MAAA Scott Claflin, FSA, MAAA Cynthia MacDonald, FSA, MAAA Donna Claire, FSA, CERA, MAAA Stephen Neill, ASA, MAAA Barry Corday, ASA, MAAA Link Richardson, FSA, CERA, MAAA Douglas Doll, FSA, MAAA Eric Sherman, FSA, MAAA Bruce Friedland, FSA, MAAA Joel Sklar, ASA, MAAA Jill Garofalo, FSA, MAAA Martin Snow, FSA, MAAA Zachary Granovetter, FSA James Thompson, FSA, MAAA Robert Johansen, FSA, MAAA David Tovson, FSA, MAAA
2
Table of Contents I - Background and Scope ................................................................................................................................. 3 II - Table Development and Approach .............................................................................................................. 3 III - Graduation.................................................................................................................................................. 3 IV - Younger and Older Age Adjustments........................................................................................................ 5 IV.A - Younger Ages ........................................................................................................................................ 5 IV.B - Older Ages ............................................................................................................................................. 7 V - The 2012 Individual Annuity Mortality Basic Table ................................................................................ 10 VI - The 2012 Individual Annuity Mortality Period Table ............................................................................. 15 VII - The 2012 Individual Annuity Reserve Table and Projection Factors .................................................... 16 VIII - Validation of 2012 IAM Table.............................................................................................................. 16 IX - Impact to Reserves ................................................................................................................................... 17 EXHIBIT I....................................................................................................................................................... 24 EXHIBIT II ..................................................................................................................................................... 27 EXHIBIT III .................................................................................................................................................... 30 EXHIBIT IV .................................................................................................................................................... 33
3
I - Background and Scope
The objective of the Payout Annuity Table Team (Team), as requested by the NAIC’s Life Actuarial Task Force (LATF), was to produce a new annuity valuation mortality table, including projection scales and margins necessary to make the table suitable for standard valuation purposes for individual annuities. This report documents the data, assumptions and process the Team used to develop the 2012 Individual Annuity Reserve Table (2012 IAR Table). The Team began with data and information from the mortality experience analysis, as described in the Society of Actuaries 2000-2004 Individual Payout Annuity Experience Report, dated April 2009. From this, the Team developed a basic table (2012 IAM Table), projection scale (Scale G2). Lastly, the Team explored various approaches and levels of margin which were discussed and ultimately recommended by LATF. The IAR Table is comprised of these three components, which are discussed throughout this report. In addition, the Team recommended and LATF concluded it made sense to develop a generational mortality table through the use of projection factors. While this represents a departure from previous individual annuitant mortality tables, it overcomes the disadvantage of using a static table that can become dated more quickly than a generational table.
II - Table Development and Approach
The 2000-2004 Payout Annuity Mortality Experience Study includes experience for immediate annuities, annuitizations and life settlement options of individual life insurance and annuity death claims. The experience analyzed excluded substandard annuities, structured settlement annuities and variable payout annuities. The experience represented 16 companies over the exposure period. The aggregated annuitant data (male, female) provided for the periods 2000-2004 included death, exposure (initial exposed to risk) and amount of annual income for ages 50 to 113. The data presented some evidence of selection in the form of lower Actual-to-Expected ratios for non-refund (i.e., life only with no certain period) immediate annuities at higher annual income levels. However, the Team decided that due to the limited data at these higher income levels and the narrow scope of this finding (unique to immediate annuities), it would avoid unnecessary complexity and not seek to differentiate mortality by annual income level. For the purpose of developing the 2002 experience table, the age range was subsequently limited to ages 50 to 99 due to lack of credible experience at younger and older ages. To account for differences in data (extract) periods by the contributing companies, the death, exposure and amount of annual income data were summed across the 2000-2004 period. This data was then smoothed using a graduation approach which is described in detail in this report. Mortality rates were then developed for ages younger than 50 and older than 95, and further adjustments were made to grade the rates for ages 50 to 65 up to the experience-based rates at age 65. The methods used to develop or extrapolate the mortality rates for ages under 50 and above 95, as well as other refinements and adjustments, are described within this report. See Section IV, Younger and Older Age Adjustments. The result of these efforts was a 2002 experience table. The next step was to project this table with improvement factors to 2012 to create the 2012 Individual Annuity Mortality Basic Table (2012 IAM Basic Table). Once the decision was reached on the merits of creating a generational mortality table, the Team then proceeded with the development of an improvement scale to be used for years 2013 and beyond. Following the development of this scale, labelled projection Scale G2, a methodology to reflect mortality improvement between 2002 and 2012 was determined. Margin levels were then established and added to the 2012 IAM Basic Table to derive the 2012 IAM Period Table. The 2012 IAR Table consists of this 2012 IAM Period Table along with the use of Scale G2 to project future mortality improvements beyond 2012.
III - Graduation
The Team analyzed various graduation approaches to create a preliminary table and ultimately decided to create a preliminary table using confidence intervals by applying the P-Spline methodology. The Team chose the P-Spline method as it was a practical statistical package designed and used by actuaries for mortality data, the output of the package is a statistically robust fitted life ("best estimate") table and the output provides a measure of uncertainty of the fitted table in the form of confidence intervals. The P-Spline method was used to fit the dataset and provide a graduated life table with the mortality rates (qx) weighted by amount of annual income. Initially described by Eilers and Marx1, P-Splines comprise a subset of a class
4
of (piecewise) polynomial functions. They combine the use of P-Splines and difference penalties (e.g., on the estimated coefficients of a generalized linear regression model) to smooth and provide projections of the data.
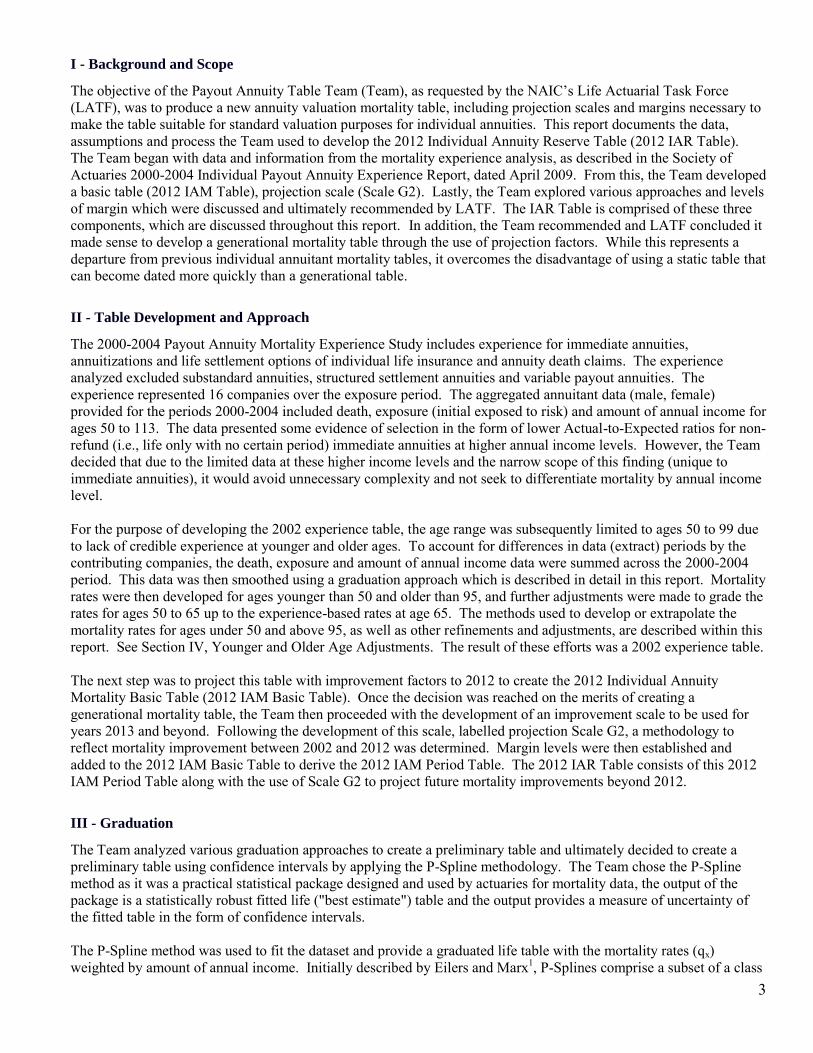
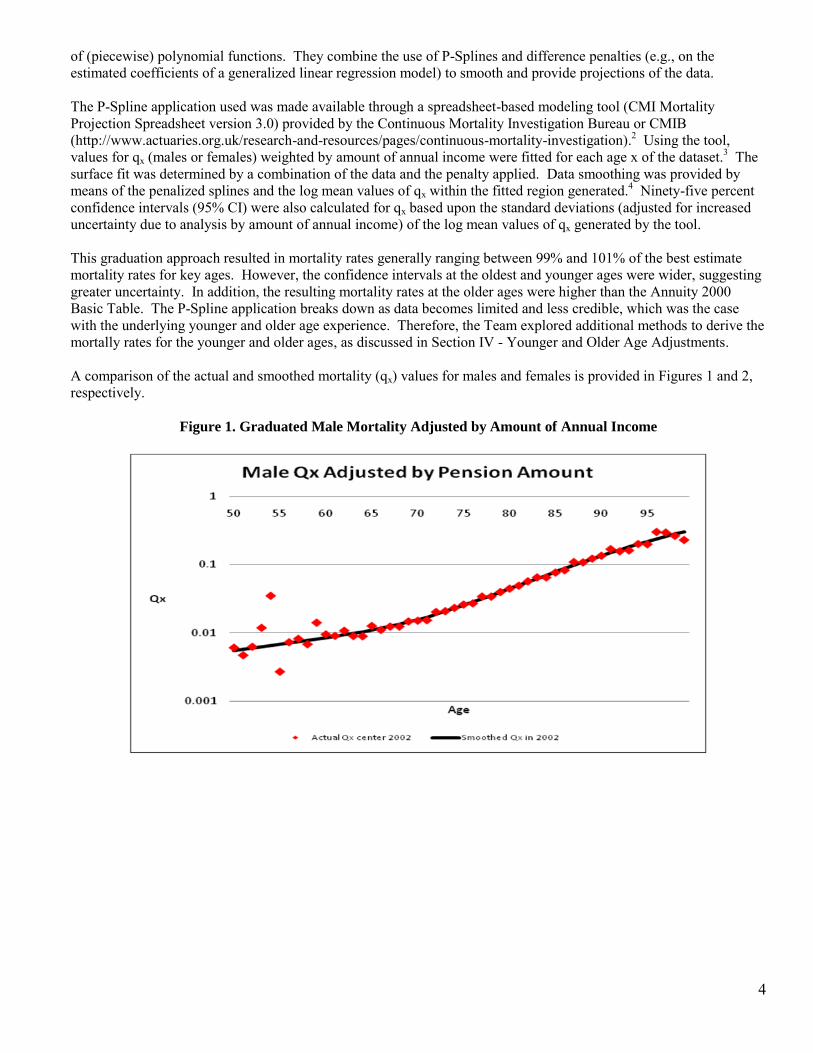
The P-Spline application used was made available through a spreadsheet-based modeling tool (CMI Mortality Projection Spreadsheet version 3.0) provided by the Continuous Mortality Investigation Bureau or CMIB (http://www.actuaries.org.uk/research-and-resources/pages/continuous-mortality-investigation).2 Using the tool, values for qx (males or females) weighted by amount of annual income were fitted for each age x of the dataset.3 The surface fit was determined by a combination of the data and the penalty applied. Data smoothing was provided by means of the penalized splines and the log mean values of qx within the fitted region generated.4 Ninety-five percent confidence intervals (95% CI) were also calculated for qx based upon the standard deviations (adjusted for increased uncertainty due to analysis by amount of annual income) of the log mean values of qx generated by the tool. This graduation approach resulted in mortality rates generally ranging between 99% and 101% of the best estimate mortality rates for key ages. However, the confidence intervals at the oldest and younger ages were wider, suggesting greater uncertainty. In addition, the resulting mortality rates at the older ages were higher than the Annuity 2000 Basic Table. The P-Spline application breaks down as data becomes limited and less credible, which was the case with the underlying younger and older age experience. Therefore, the Team explored additional methods to derive the mortally rates for the younger and older ages, as discussed in Section IV - Younger and Older Age Adjustments. A comparison of the actual and smoothed mortality (qx) values for males and females is provided in Figures 1 and 2, respectively.
Figure 1. Graduated Male Mortality Adjusted by Amount of Annual Income
5
Figure 2. Graduated Female Mortality Adjusted by Amount of Annual Income
IV - Younger and Older Age Adjustments
The mortality experience at both the younger and older ages was limited. In analyzing the experience, the Team identified that the mortality rates at these ages had little impact on the final reserve. Therefore, the Team compared the results at specific ages to several existing industry tables, including: the 1994 Group Annuity Mortality Basic Table (GAM) projected with Scale AA to 2002 (the mid-point of the payout annuity experience period), the 2008 Valuation Basic RR100 Table (2008 VBT), the Annuity 2000 Basic Table (a2000 Table) and the 2006 U.S. Life Tables. Both the 1994 GAM and the a2000 Table had a reasonable fit for ages 20 and 35; however, the tables exhibited significant divergence from the underlying experience by age 50. In addition, the 1994 GAM was lower than the population mortality (2006 U.S. Life Tables) and the a2000 rates were significantly lower than both the population mortality rates and the more recent life experience table at the highest ages for the male risks.
IV.A - Younger Ages
The Team researched the development of the a2000 Table and predecessor tables and found that the a2000 Table rates, at the younger ages, could reasonably be described as being based on group annuity active life experience from 1939-1947, projected with various mortality improvement scales for almost 60 years. For attained ages 50-59, the 2000-2004 experience shows ratios to the a2000 Table of 191% for males (245 deaths), and 231% for females (201 deaths). The Team considered that these high ratios might be caused by early retirements due to poor health. Past committees were not concerned about the actual experience for ages 50-59 being significantly higher than the valuation table. The Team attributed this lack of concern to the fact that there was not much payout annuity business at these ages, and the lack of material impact of mortality rates at these ages on the reserves. The lack of material impact at younger ages stems from the fact that annuity reserves are a function of probability of survival, which is near 1 at younger ages. For instance, using the a2000 table, using two times a mortality rate at age 20 (1.10 per 1,000 instead of 0.55 per 1,000) means the probability of survival (or receiving the next payment) would only decrease from 0.99945 to 0.99890, or a 0.055% reduction in actuarial value. In addition, there probably was a desire that the annuity valuation mortality appear consistent with other tables, e.g., life insurance and population life tables. Based on the report for the 1983 IAM Table, the a1983 Committee seemed to desire having the annuity mortality rates generally be lower than ultimate life insurance table mortality.
6
Table 1 below compares the mortality rates for ages 20, 35 and 50, for the following tables: 1. a2000 Table 2. 1994 GAM Basic projected to 2002 using Projection Scale AA 3. 2008 VBT, Nonsmoker, Ultimate 4. 2006 Social Security Administration (SSA) Experience
Table 1 - Comparison of Mortality Rates (1000qx) at Low Attained Ages
Age 20 Age 35 Age 50
Table Male Female Male Female Male Female a2000 Table 0.55 0.28 0.79 0.52 3.33 1.71 1994 GAM Basic projected to 2002 0.47 0.27 0.88 0.47 2.40 1.34 2008 VBT, NS 0.88 0.31 1.02 0.50 2.48 1.77 2006 SSA 1.34 0.46 1.67 0.90 5.66 3.28
The 1994 GAM Table projected to year 2002 is reasonably close to the a2000 table for ages 20 and 35, and moderately lower at age 50. The 1994 GAM rates were developed as follows: • Ages 1-12 are from the 1990 Life Tables published in SSA 107. • Ages 13-24 are graded up to the age 25 experience rate for the Civil Service Retirement System (CSRS) active life
experience. • Ages 25-50 are the CSRS active life experience. • Ages 51-65 are weighted averages between CSRS active and retired life experience, with the weights for active
lives grading down from age 51 to 65. • Ages 66+ used group annuity actual experience. There was not a large disconnect between age 65 and 66, and
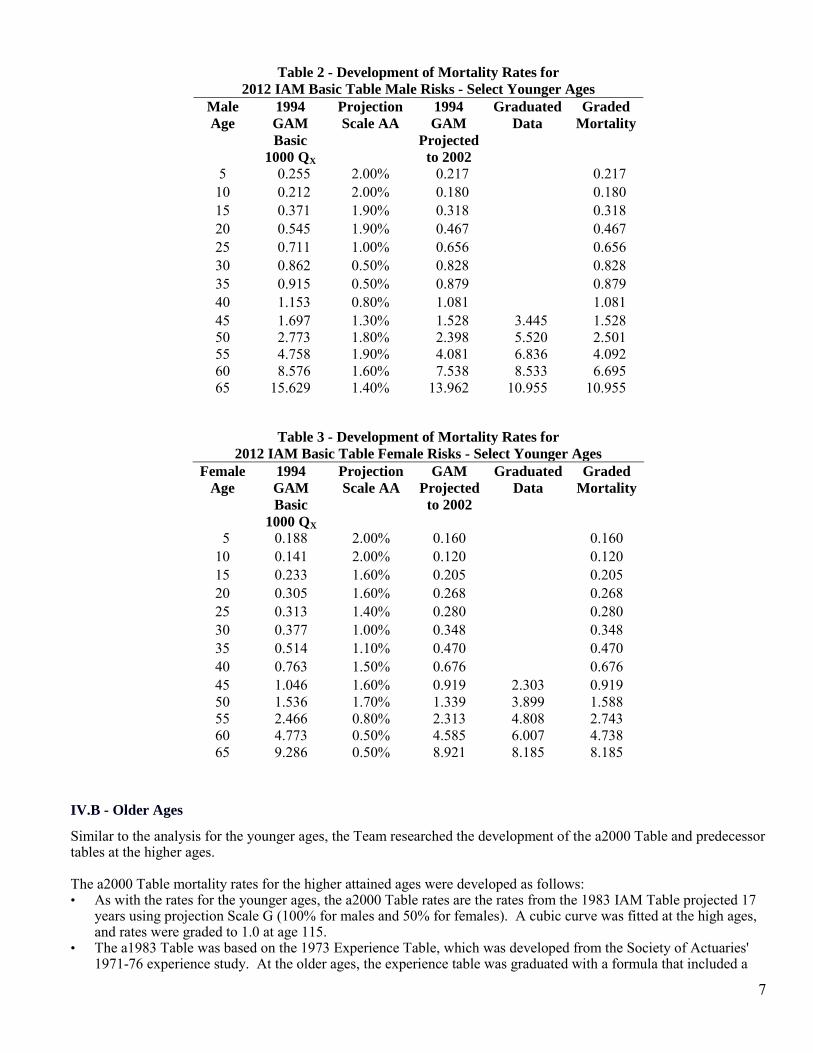
later graduation smoothed the resulting table. • All the experience rates were projected to 1994 prior to graduation. After reviewing the various tables, the Team decided to use the 1994 GAM table, projected to 2002 using projection Scale AA for ages 1 through 45, and graded to the graduated (experience-based) rates at age 65. The grading was done such that the mortality rates have a constant percentage increase from age 50 to age 65. Age 0 was set equal to four times the age 1 rate, which was consistent with the approach taken for developing the age 0 mortality for the 2008 VBT. Tables 2 and 3 below illustrate the development of the 2012 IAM Basic Table rates at younger ages for quinquennial ages for male and female risks, respectively.
7
Table 2 - Development of Mortality Rates for
2012 IAM Basic Table Male Risks - Select Younger Ages Male
Age 1994
GAM
Basic
1000 QX
Projection
Scale AA 1994
GAM
Projected
to 2002
Graduated
Data Graded
Mortality
5 0.255 2.00% 0.217 0.217 10 0.212 2.00% 0.180 0.180 15 0.371 1.90% 0.318 0.318 20 0.545 1.90% 0.467 0.467 25 0.711 1.00% 0.656 0.656 30 0.862 0.50% 0.828 0.828 35 0.915 0.50% 0.879 0.879 40 1.153 0.80% 1.081 1.081 45 1.697 1.30% 1.528 3.445 1.528 50 2.773 1.80% 2.398 5.520 2.501 55 4.758 1.90% 4.081 6.836 4.092 60 8.576 1.60% 7.538 8.533 6.695 65 15.629 1.40% 13.962 10.955 10.955
Table 3 - Development of Mortality Rates for 2012 IAM Basic Table Female Risks - Select Younger Ages
Female
Age 1994
GAM
Basic
1000 QX
Projection
Scale AA GAM
Projected
to 2002
Graduated
Data Graded
Mortality
5 0.188 2.00% 0.160 0.160 10 0.141 2.00% 0.120 0.120 15 0.233 1.60% 0.205 0.205 20 0.305 1.60% 0.268 0.268 25 0.313 1.40% 0.280 0.280 30 0.377 1.00% 0.348 0.348 35 0.514 1.10% 0.470 0.470 40 0.763 1.50% 0.676 0.676 45 1.046 1.60% 0.919 2.303 0.919 50 1.536 1.70% 1.339 3.899 1.588 55 2.466 0.80% 2.313 4.808 2.743 60 4.773 0.50% 4.585 6.007 4.738 65 9.286 0.50% 8.921 8.185 8.185
IV.B - Older Ages
Similar to the analysis for the younger ages, the Team researched the development of the a2000 Table and predecessor tables at the higher ages. The a2000 Table mortality rates for the higher attained ages were developed as follows: • As with the rates for the younger ages, the a2000 Table rates are the rates from the 1983 IAM Table projected 17
years using projection Scale G (100% for males and 50% for females). A cubic curve was fitted at the high ages, and rates were graded to 1.0 at age 115.
• The a1983 Table was based on the 1973 Experience Table, which was developed from the Society of Actuaries' 1971-76 experience study. At the older ages, the experience table was graduated with a formula that included a
8
cubic equation to grade to 1.0 by age 115. These rates were then projected 9.5 years to 1983, using 1.5% annual improvement. These rates were then re-graduated.
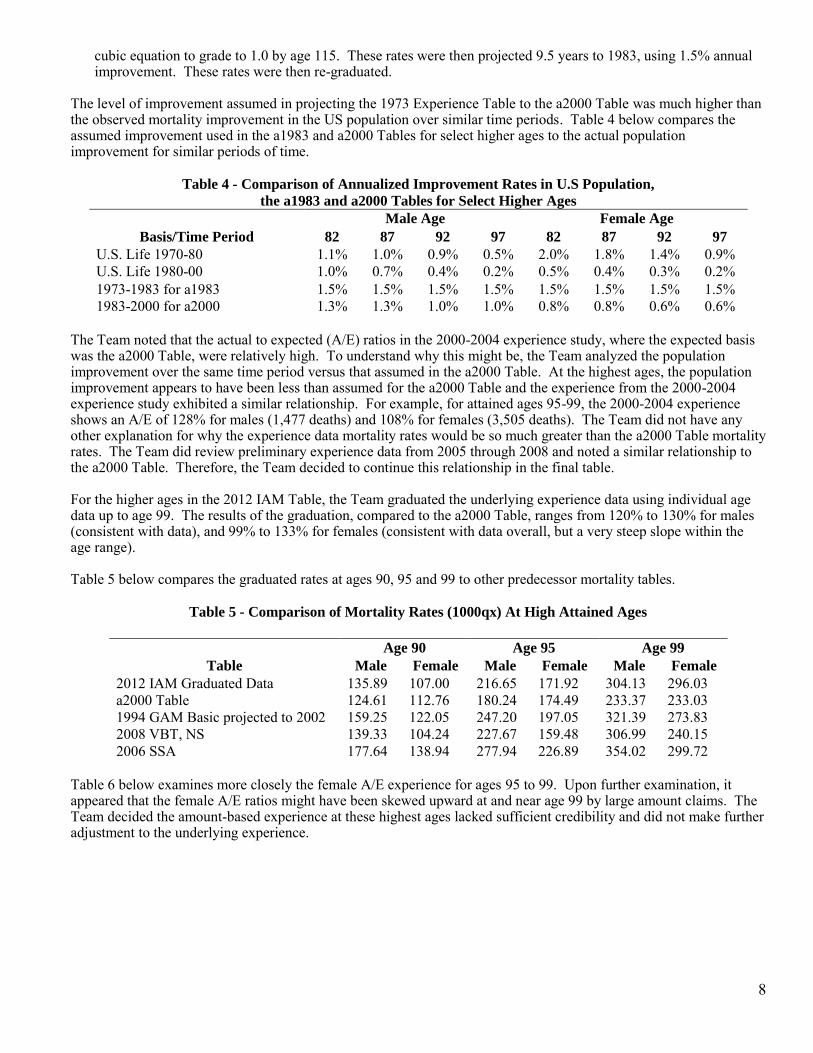
The level of improvement assumed in projecting the 1973 Experience Table to the a2000 Table was much higher than the observed mortality improvement in the US population over similar time periods. Table 4 below compares the assumed improvement used in the a1983 and a2000 Tables for select higher ages to the actual population improvement for similar periods of time.
Table 4 - Comparison of Annualized Improvement Rates in U.S Population, the a1983 and a2000 Tables for Select Higher Ages
Male Age Female Age
Basis/Time Period 82 87 92 97 82 87 92 97 U.S. Life 1970-80 1.1% 1.0% 0.9% 0.5% 2.0% 1.8% 1.4% 0.9% U.S. Life 1980-00 1.0% 0.7% 0.4% 0.2% 0.5% 0.4% 0.3% 0.2% 1973-1983 for a1983 1.5% 1.5% 1.5% 1.5% 1.5% 1.5% 1.5% 1.5% 1983-2000 for a2000 1.3% 1.3% 1.0% 1.0% 0.8% 0.8% 0.6% 0.6%
The Team noted that the actual to expected (A/E) ratios in the 2000-2004 experience study, where the expected basis was the a2000 Table, were relatively high. To understand why this might be, the Team analyzed the population improvement over the same time period versus that assumed in the a2000 Table. At the highest ages, the population improvement appears to have been less than assumed for the a2000 Table and the experience from the 2000-2004 experience study exhibited a similar relationship. For example, for attained ages 95-99, the 2000-2004 experience shows an A/E of 128% for males (1,477 deaths) and 108% for females (3,505 deaths). The Team did not have any other explanation for why the experience data mortality rates would be so much greater than the a2000 Table mortality rates. The Team did review preliminary experience data from 2005 through 2008 and noted a similar relationship to the a2000 Table. Therefore, the Team decided to continue this relationship in the final table. For the higher ages in the 2012 IAM Table, the Team graduated the underlying experience data using individual age data up to age 99. The results of the graduation, compared to the a2000 Table, ranges from 120% to 130% for males (consistent with data), and 99% to 133% for females (consistent with data overall, but a very steep slope within the age range). Table 5 below compares the graduated rates at ages 90, 95 and 99 to other predecessor mortality tables.
Table 5 - Comparison of Mortality Rates (1000qx) At High Attained Ages
Age 90 Age 95 Age 99
Table Male Female Male Female Male Female 2012 IAM Graduated Data 135.89 107.00 216.65 171.92 304.13 296.03 a2000 Table 124.61 112.76 180.24 174.49 233.37 233.03 1994 GAM Basic projected to 2002 159.25 122.05 247.20 197.05 321.39 273.83 2008 VBT, NS 139.33 104.24 227.67 159.48 306.99 240.15 2006 SSA 177.64 138.94 277.94 226.89 354.02 299.72
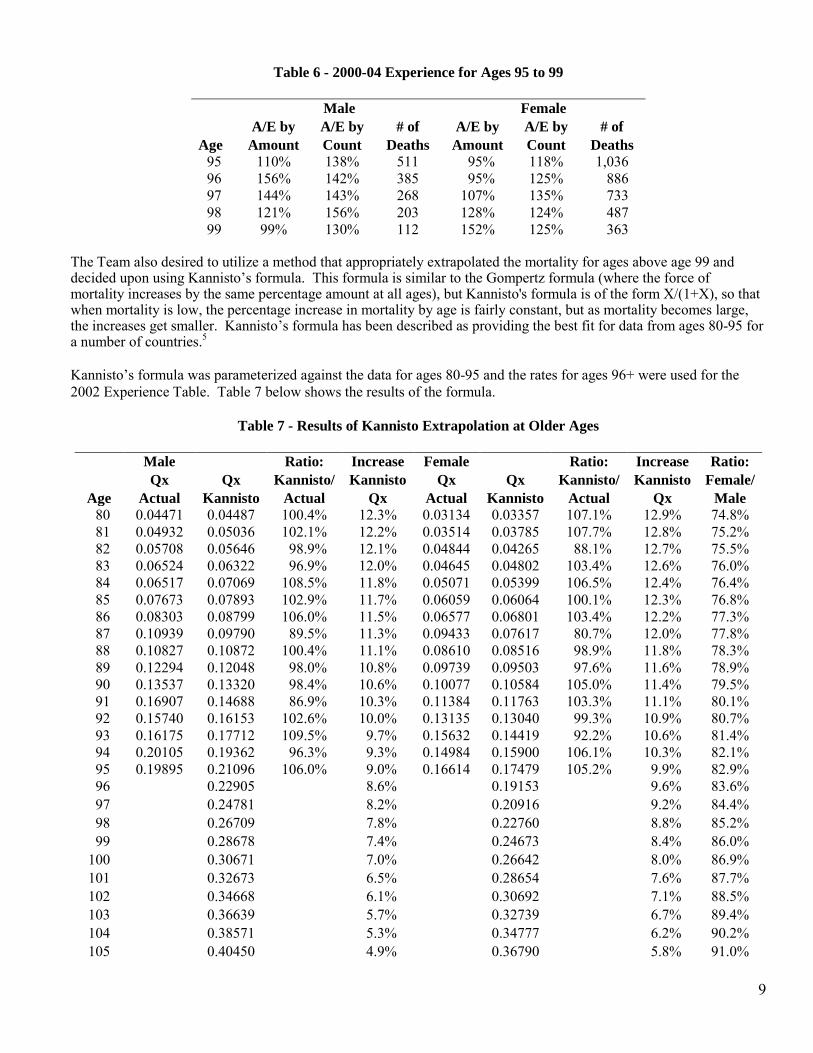
Table 6 below examines more closely the female A/E experience for ages 95 to 99. Upon further examination, it appeared that the female A/E ratios might have been skewed upward at and near age 99 by large amount claims. The Team decided the amount-based experience at these highest ages lacked sufficient credibility and did not make further adjustment to the underlying experience.
9
Table 6 - 2000-04 Experience for Ages 95 to 99
Male Female
A/E by A/E by # of A/E by A/E by # of
Age Amount Count Deaths Amount Count Deaths 95 110% 138% 511 95% 118% 1,036 96 156% 142% 385 95% 125% 886 97 144% 143% 268 107% 135% 733 98 121% 156% 203 128% 124% 487 99 99% 130% 112 152% 125% 363
The Team also desired to utilize a method that appropriately extrapolated the mortality for ages above age 99 and decided upon using Kannisto’s formula. This formula is similar to the Gompertz formula (where the force of mortality increases by the same percentage amount at all ages), but Kannisto's formula is of the form X/(1+X), so that when mortality is low, the percentage increase in mortality by age is fairly constant, but as mortality becomes large, the increases get smaller. Kannisto’s formula has been described as providing the best fit for data from ages 80-95 for a number of countries.5 Kannisto’s formula was parameterized against the data for ages 80-95 and the rates for ages 96+ were used for the 2002 Experience Table. Table 7 below shows the results of the formula.
Table 7 - Results of Kannisto Extrapolation at Older Ages
Male Ratio: Increase Female Ratio: Increase Ratio:
Qx Qx Kannisto/ Kannisto Qx Qx Kannisto/ Kannisto Female/
Age Actual Kannisto Actual Qx Actual Kannisto Actual Qx Male 80 0.04471 0.04487 100.4% 12.3% 0.03134 0.03357 107.1% 12.9% 74.8% 81 0.04932 0.05036 102.1% 12.2% 0.03514 0.03785 107.7% 12.8% 75.2% 82 0.05708 0.05646 98.9% 12.1% 0.04844 0.04265 88.1% 12.7% 75.5% 83 0.06524 0.06322 96.9% 12.0% 0.04645 0.04802 103.4% 12.6% 76.0% 84 0.06517 0.07069 108.5% 11.8% 0.05071 0.05399 106.5% 12.4% 76.4% 85 0.07673 0.07893 102.9% 11.7% 0.06059 0.06064 100.1% 12.3% 76.8% 86 0.08303 0.08799 106.0% 11.5% 0.06577 0.06801 103.4% 12.2% 77.3% 87 0.10939 0.09790 89.5% 11.3% 0.09433 0.07617 80.7% 12.0% 77.8% 88 0.10827 0.10872 100.4% 11.1% 0.08610 0.08516 98.9% 11.8% 78.3% 89 0.12294 0.12048 98.0% 10.8% 0.09739 0.09503 97.6% 11.6% 78.9% 90 0.13537 0.13320 98.4% 10.6% 0.10077 0.10584 105.0% 11.4% 79.5% 91 0.16907 0.14688 86.9% 10.3% 0.11384 0.11763 103.3% 11.1% 80.1% 92 0.15740 0.16153 102.6% 10.0% 0.13135 0.13040 99.3% 10.9% 80.7% 93 0.16175 0.17712 109.5% 9.7% 0.15632 0.14419 92.2% 10.6% 81.4% 94 0.20105 0.19362 96.3% 9.3% 0.14984 0.15900 106.1% 10.3% 82.1% 95 0.19895 0.21096 106.0% 9.0% 0.16614 0.17479 105.2% 9.9% 82.9% 96 0.22905 8.6% 0.19153 9.6% 83.6% 97 0.24781 8.2% 0.20916 9.2% 84.4% 98 0.26709 7.8% 0.22760 8.8% 85.2% 99 0.28678 7.4% 0.24673 8.4% 86.0% 100 0.30671 7.0% 0.26642 8.0% 86.9% 101 0.32673 6.5% 0.28654 7.6% 87.7% 102 0.34668 6.1% 0.30692 7.1% 88.5% 103 0.36639 5.7% 0.32739 6.7% 89.4% 104 0.38571 5.3% 0.34777 6.2% 90.2% 105 0.40450 4.9% 0.36790 5.8% 91.0%
10
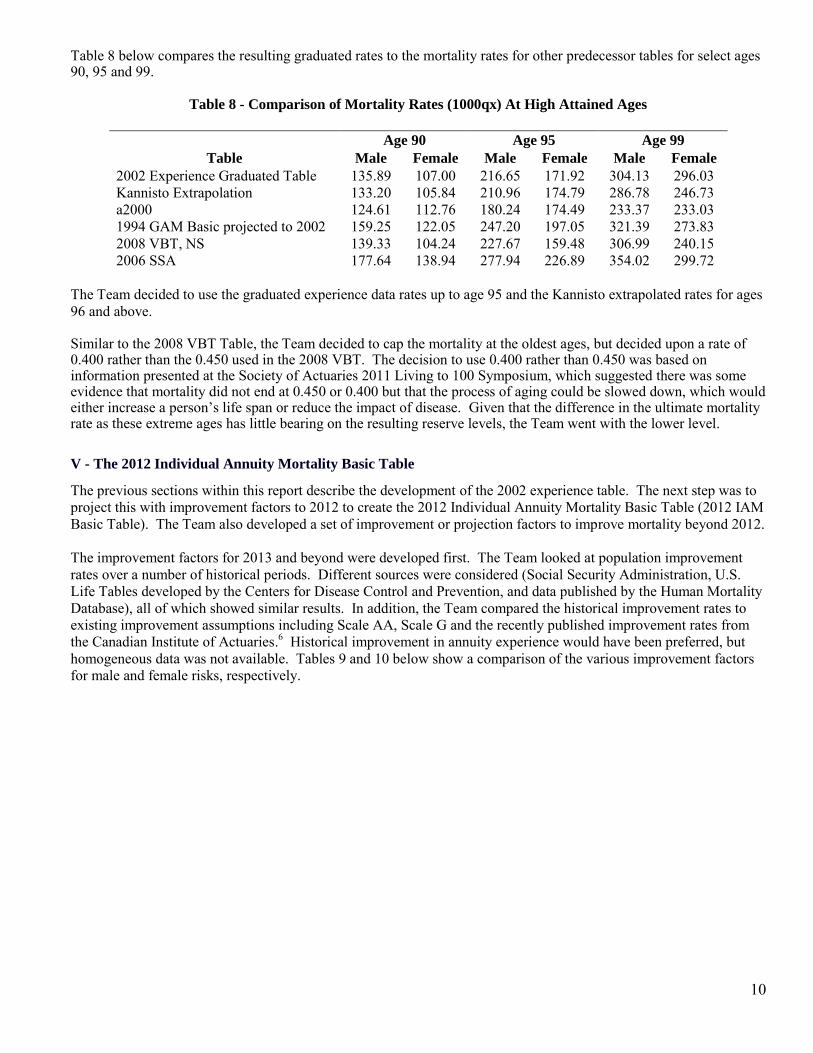
Table 8 below compares the resulting graduated rates to the mortality rates for other predecessor tables for select ages 90, 95 and 99.
Table 8 - Comparison of Mortality Rates (1000qx) At High Attained Ages
Age 90 Age 95 Age 99
Table Male Female Male Female Male Female 2002 Experience Graduated Table 135.89 107.00 216.65 171.92 304.13 296.03 Kannisto Extrapolation 133.20 105.84 210.96 174.79 286.78 246.73 a2000 124.61 112.76 180.24 174.49 233.37 233.03 1994 GAM Basic projected to 2002 159.25 122.05 247.20 197.05 321.39 273.83 2008 VBT, NS 139.33 104.24 227.67 159.48 306.99 240.15 2006 SSA 177.64 138.94 277.94 226.89 354.02 299.72
The Team decided to use the graduated experience data rates up to age 95 and the Kannisto extrapolated rates for ages 96 and above. Similar to the 2008 VBT Table, the Team decided to cap the mortality at the oldest ages, but decided upon a rate of 0.400 rather than the 0.450 used in the 2008 VBT. The decision to use 0.400 rather than 0.450 was based on information presented at the Society of Actuaries 2011 Living to 100 Symposium, which suggested there was some evidence that mortality did not end at 0.450 or 0.400 but that the process of aging could be slowed down, which would either increase a person’s life span or reduce the impact of disease. Given that the difference in the ultimate mortality rate as these extreme ages has little bearing on the resulting reserve levels, the Team went with the lower level.
V - The 2012 Individual Annuity Mortality Basic Table
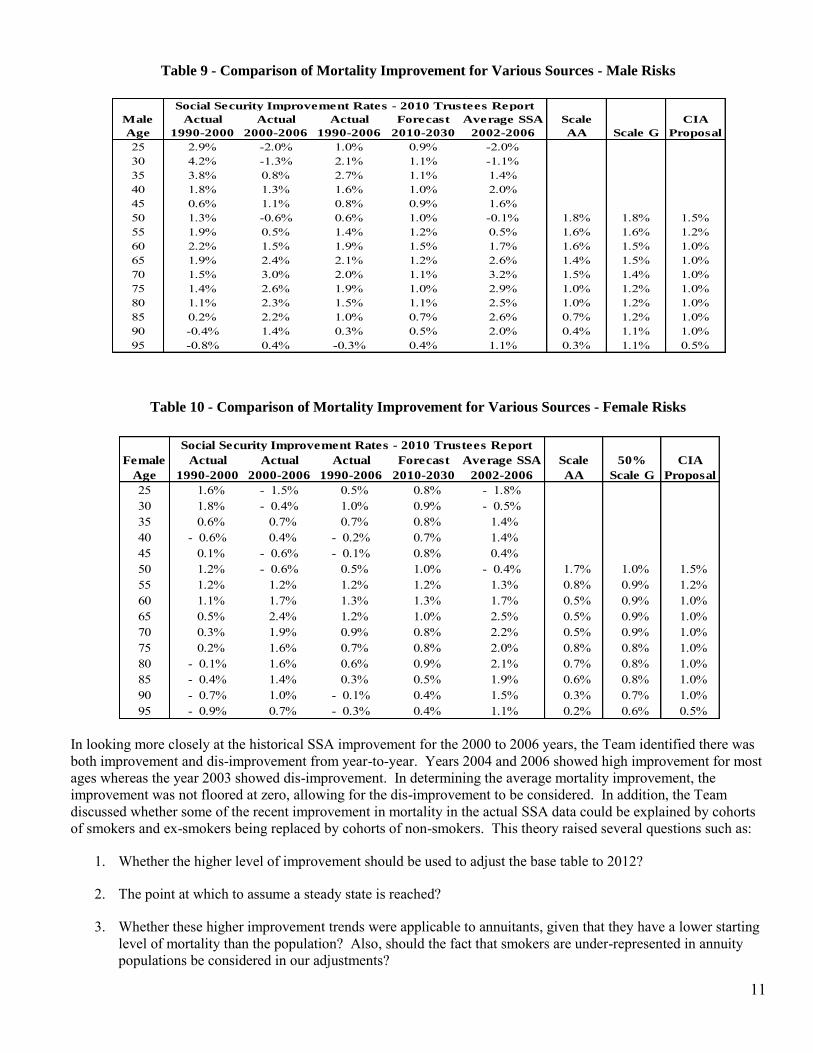
The previous sections within this report describe the development of the 2002 experience table. The next step was to project this with improvement factors to 2012 to create the 2012 Individual Annuity Mortality Basic Table (2012 IAM Basic Table). The Team also developed a set of improvement or projection factors to improve mortality beyond 2012. The improvement factors for 2013 and beyond were developed first. The Team looked at population improvement rates over a number of historical periods. Different sources were considered (Social Security Administration, U.S. Life Tables developed by the Centers for Disease Control and Prevention, and data published by the Human Mortality Database), all of which showed similar results. In addition, the Team compared the historical improvement rates to existing improvement assumptions including Scale AA, Scale G and the recently published improvement rates from the Canadian Institute of Actuaries.6 Historical improvement in annuity experience would have been preferred, but homogeneous data was not available. Tables 9 and 10 below show a comparison of the various improvement factors for male and female risks, respectively.
11
In looking more closely at the historical SSA improvement for the 2000 to 2006 years, the Team identified there was both improvement and dis-improvement from year-to-year. Years 2004 and 2006 showed high improvement for most ages whereas the year 2003 showed dis-improvement. In determining the average mortality improvement, the improvement was not floored at zero, allowing for the dis-improvement to be considered. In addition, the Team discussed whether some of the recent improvement in mortality in the actual SSA data could be explained by cohorts of smokers and ex-smokers being replaced by cohorts of non-smokers. This theory raised several questions such as:
1. Whether the higher level of improvement should be used to adjust the base table to 2012?
2. The point at which to assume a steady state is reached?
3. Whether these higher improvement trends were applicable to annuitants, given that they have a lower starting level of mortality than the population? Also, should the fact that smokers are under-represented in annuity populations be considered in our adjustments?
Male Actual Actual Actual Forecast Average SSA Scale CIA
Age 1990-2000 2000-2006 1990-2006 2010-2030 2002-2006 AA Scale G Proposal
25 2.9% -2.0% 1.0% 0.9% -2.0%30 4.2% -1.3% 2.1% 1.1% -1.1%35 3.8% 0.8% 2.7% 1.1% 1.4%40 1.8% 1.3% 1.6% 1.0% 2.0%45 0.6% 1.1% 0.8% 0.9% 1.6%50 1.3% -0.6% 0.6% 1.0% -0.1% 1.8% 1.8% 1.5%55 1.9% 0.5% 1.4% 1.2% 0.5% 1.6% 1.6% 1.2%60 2.2% 1.5% 1.9% 1.5% 1.7% 1.6% 1.5% 1.0%65 1.9% 2.4% 2.1% 1.2% 2.6% 1.4% 1.5% 1.0%70 1.5% 3.0% 2.0% 1.1% 3.2% 1.5% 1.4% 1.0%75 1.4% 2.6% 1.9% 1.0% 2.9% 1.0% 1.2% 1.0%80 1.1% 2.3% 1.5% 1.1% 2.5% 1.0% 1.2% 1.0%85 0.2% 2.2% 1.0% 0.7% 2.6% 0.7% 1.2% 1.0%90 -0.4% 1.4% 0.3% 0.5% 2.0% 0.4% 1.1% 1.0%95 -0.8% 0.4% -0.3% 0.4% 1.1% 0.3% 1.1% 0.5%
Social Security Improvement Rates - 2010 Trustees Report
Female Actual Actual Actual Forecast Average SSA Scale 50% CIA
Age 1990-2000 2000-2006 1990-2006 2010-2030 2002-2006 AA Scale G Proposal
25 1.6% - 1.5% 0.5% 0.8% - 1.8%30 1.8% - 0.4% 1.0% 0.9% - 0.5%35 0.6% 0.7% 0.7% 0.8% 1.4%40 - 0.6% 0.4% - 0.2% 0.7% 1.4%45 0.1% - 0.6% - 0.1% 0.8% 0.4%50 1.2% - 0.6% 0.5% 1.0% - 0.4% 1.7% 1.0% 1.5%55 1.2% 1.2% 1.2% 1.2% 1.3% 0.8% 0.9% 1.2%60 1.1% 1.7% 1.3% 1.3% 1.7% 0.5% 0.9% 1.0%65 0.5% 2.4% 1.2% 1.0% 2.5% 0.5% 0.9% 1.0%70 0.3% 1.9% 0.9% 0.8% 2.2% 0.5% 0.9% 1.0%75 0.2% 1.6% 0.7% 0.8% 2.0% 0.8% 0.8% 1.0%80 - 0.1% 1.6% 0.6% 0.9% 2.1% 0.7% 0.8% 1.0%85 - 0.4% 1.4% 0.3% 0.5% 1.9% 0.6% 0.8% 1.0%90 - 0.7% 1.0% - 0.1% 0.4% 1.5% 0.3% 0.7% 1.0%95 - 0.9% 0.7% - 0.3% 0.4% 1.1% 0.2% 0.6% 0.5%
Social Security Improvement Rates - 2010 Trustees Report
Table 10 - Comparison of Mortality Improvement for Various Sources - Female Risks
Table 9 - Comparison of Mortality Improvement for Various Sources - Male Risks
12
An additional consideration of the Team was that recent group annuity experience from 1993 – 2002 exhibited mortality improvement in line with scale AA. The Team believed that group annuity mortality would be lower than population but would not have the same level of anti-selection as individual annuity mortality.
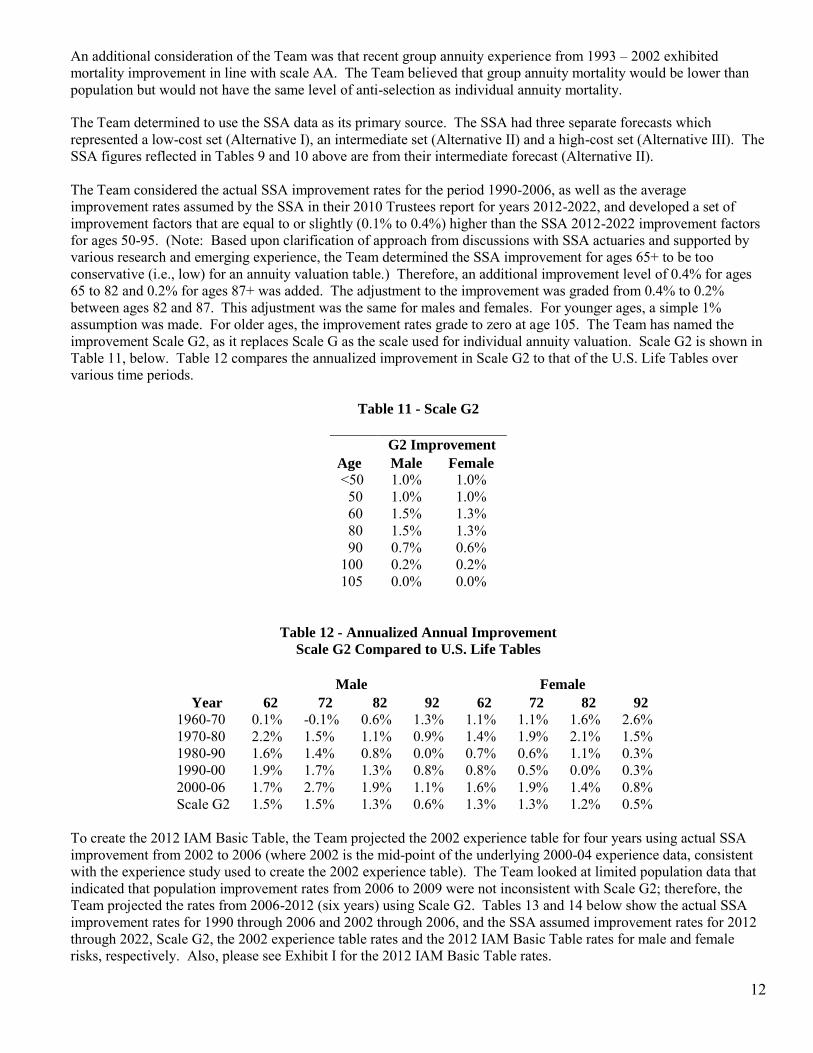
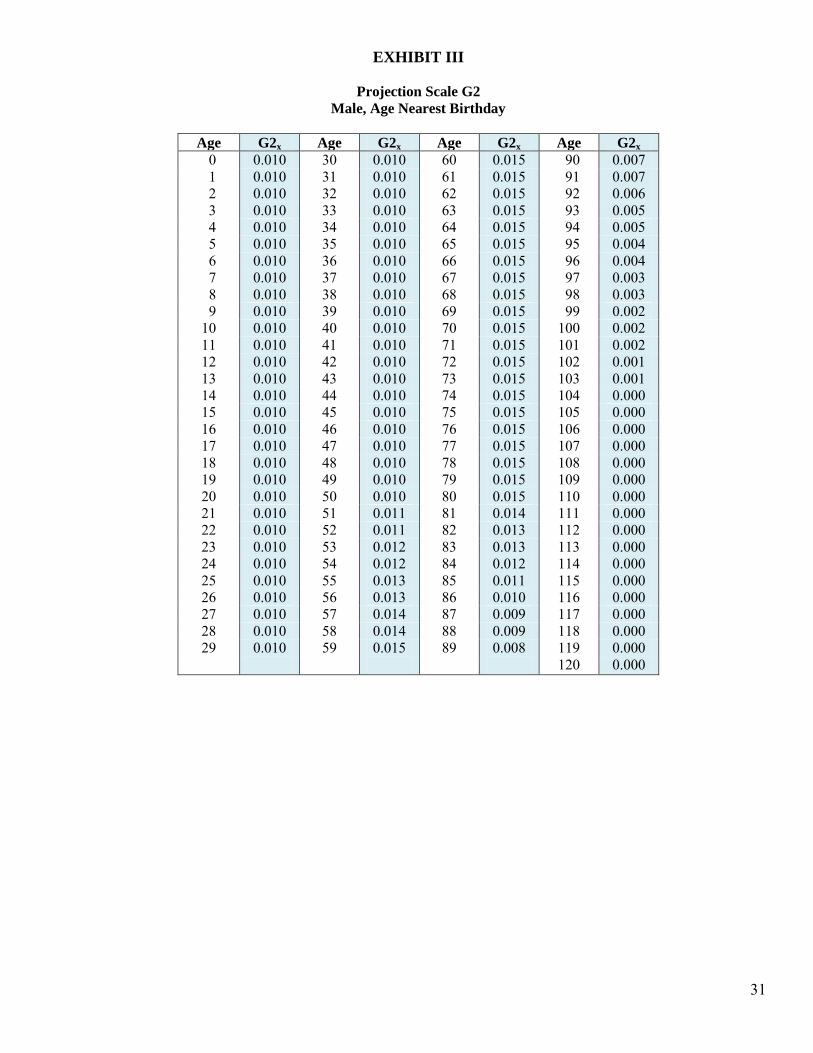
The Team determined to use the SSA data as its primary source. The SSA had three separate forecasts which represented a low-cost set (Alternative I), an intermediate set (Alternative II) and a high-cost set (Alternative III). The SSA figures reflected in Tables 9 and 10 above are from their intermediate forecast (Alternative II). The Team considered the actual SSA improvement rates for the period 1990-2006, as well as the average improvement rates assumed by the SSA in their 2010 Trustees report for years 2012-2022, and developed a set of improvement factors that are equal to or slightly (0.1% to 0.4%) higher than the SSA 2012-2022 improvement factors for ages 50-95. (Note: Based upon clarification of approach from discussions with SSA actuaries and supported by various research and emerging experience, the Team determined the SSA improvement for ages 65+ to be too conservative (i.e., low) for an annuity valuation table.) Therefore, an additional improvement level of 0.4% for ages 65 to 82 and 0.2% for ages 87+ was added. The adjustment to the improvement was graded from 0.4% to 0.2% between ages 82 and 87. This adjustment was the same for males and females. For younger ages, a simple 1% assumption was made. For older ages, the improvement rates grade to zero at age 105. The Team has named the improvement Scale G2, as it replaces Scale G as the scale used for individual annuity valuation. Scale G2 is shown in Table 11, below. Table 12 compares the annualized improvement in Scale G2 to that of the U.S. Life Tables over various time periods.
Table 11 - Scale G2
G2 Improvement
Age Male Female <50 1.0% 1.0% 50 1.0% 1.0% 60 1.5% 1.3% 80 1.5% 1.3% 90 0.7% 0.6% 100 0.2% 0.2% 105 0.0% 0.0%
Table 12 - Annualized Annual Improvement Scale G2 Compared to U.S. Life Tables
Male Female
Year 62 72 82 92 62 72 82 92 1960-70 0.1% -0.1% 0.6% 1.3% 1.1% 1.1% 1.6% 2.6% 1970-80 2.2% 1.5% 1.1% 0.9% 1.4% 1.9% 2.1% 1.5% 1980-90 1.6% 1.4% 0.8% 0.0% 0.7% 0.6% 1.1% 0.3% 1990-00 1.9% 1.7% 1.3% 0.8% 0.8% 0.5% 0.0% 0.3% 2000-06 1.7% 2.7% 1.9% 1.1% 1.6% 1.9% 1.4% 0.8% Scale G2 1.5% 1.5% 1.3% 0.6% 1.3% 1.3% 1.2% 0.5%
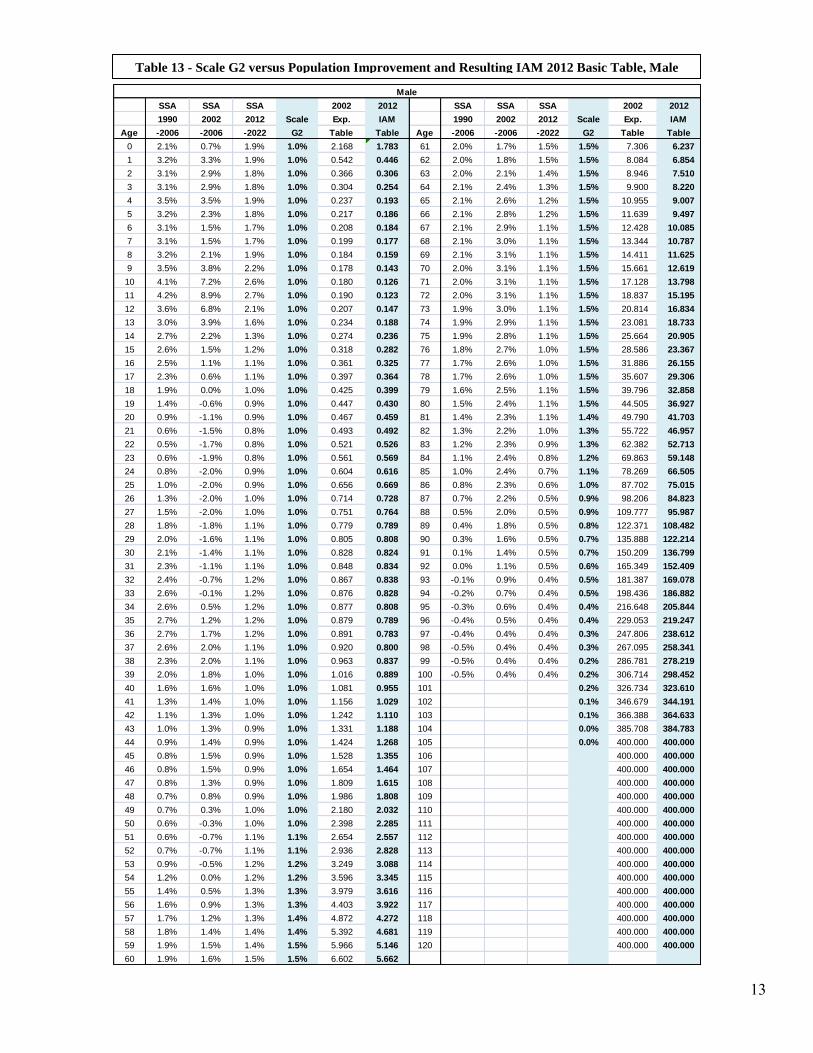
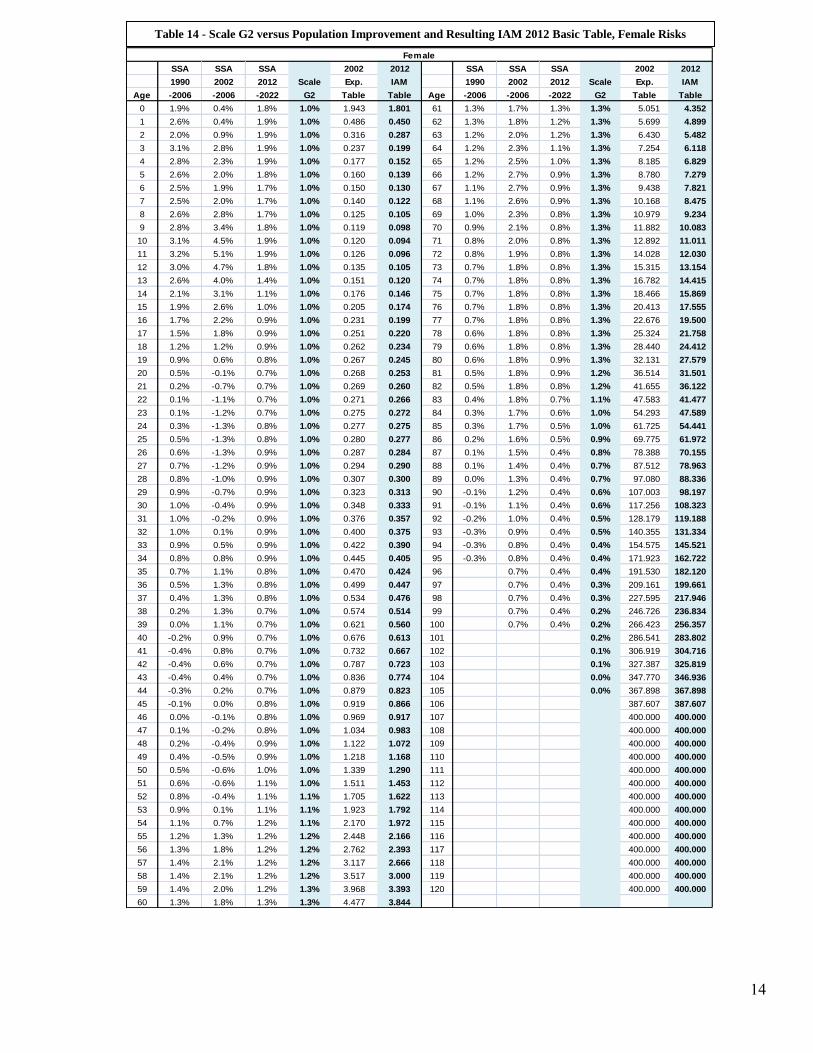
To create the 2012 IAM Basic Table, the Team projected the 2002 experience table for four years using actual SSA improvement from 2002 to 2006 (where 2002 is the mid-point of the underlying 2000-04 experience data, consistent with the experience study used to create the 2002 experience table). The Team looked at limited population data that indicated that population improvement rates from 2006 to 2009 were not inconsistent with Scale G2; therefore, the Team projected the rates from 2006-2012 (six years) using Scale G2. Tables 13 and 14 below show the actual SSA improvement rates for 1990 through 2006 and 2002 through 2006, and the SSA assumed improvement rates for 2012 through 2022, Scale G2, the 2002 experience table rates and the 2012 IAM Basic Table rates for male and female risks, respectively. Also, please see Exhibit I for the 2012 IAM Basic Table rates.
13
Table 13 - Scale G2 versus Population Improvement and Resulting IAM 2012 Basic Table, Male
Risks
SSA SSA SSA 2002 2012 SSA SSA SSA 2002 2012
1990 2002 2012 Scale Exp. IAM 1990 2002 2012 Scale Exp. IAM
Age -2006 -2006 -2022 G2 Table Table Age -2006 -2006 -2022 G2 Table Table
0 2.1% 0.7% 1.9% 1.0% 2.168 1.783 61 2.0% 1.7% 1.5% 1.5% 7.306 6.237
1 3.2% 3.3% 1.9% 1.0% 0.542 0.446 62 2.0% 1.8% 1.5% 1.5% 8.084 6.854
2 3.1% 2.9% 1.8% 1.0% 0.366 0.306 63 2.0% 2.1% 1.4% 1.5% 8.946 7.510
3 3.1% 2.9% 1.8% 1.0% 0.304 0.254 64 2.1% 2.4% 1.3% 1.5% 9.900 8.220
4 3.5% 3.5% 1.9% 1.0% 0.237 0.193 65 2.1% 2.6% 1.2% 1.5% 10.955 9.007
5 3.2% 2.3% 1.8% 1.0% 0.217 0.186 66 2.1% 2.8% 1.2% 1.5% 11.639 9.497
6 3.1% 1.5% 1.7% 1.0% 0.208 0.184 67 2.1% 2.9% 1.1% 1.5% 12.428 10.085
7 3.1% 1.5% 1.7% 1.0% 0.199 0.177 68 2.1% 3.0% 1.1% 1.5% 13.344 10.787
8 3.2% 2.1% 1.9% 1.0% 0.184 0.159 69 2.1% 3.1% 1.1% 1.5% 14.411 11.625
9 3.5% 3.8% 2.2% 1.0% 0.178 0.143 70 2.0% 3.1% 1.1% 1.5% 15.661 12.619
10 4.1% 7.2% 2.6% 1.0% 0.180 0.126 71 2.0% 3.1% 1.1% 1.5% 17.128 13.798
11 4.2% 8.9% 2.7% 1.0% 0.190 0.123 72 2.0% 3.1% 1.1% 1.5% 18.837 15.195
12 3.6% 6.8% 2.1% 1.0% 0.207 0.147 73 1.9% 3.0% 1.1% 1.5% 20.814 16.834
13 3.0% 3.9% 1.6% 1.0% 0.234 0.188 74 1.9% 2.9% 1.1% 1.5% 23.081 18.733
14 2.7% 2.2% 1.3% 1.0% 0.274 0.236 75 1.9% 2.8% 1.1% 1.5% 25.664 20.905
15 2.6% 1.5% 1.2% 1.0% 0.318 0.282 76 1.8% 2.7% 1.0% 1.5% 28.586 23.367
16 2.5% 1.1% 1.1% 1.0% 0.361 0.325 77 1.7% 2.6% 1.0% 1.5% 31.886 26.155
17 2.3% 0.6% 1.1% 1.0% 0.397 0.364 78 1.7% 2.6% 1.0% 1.5% 35.607 29.306
18 1.9% 0.0% 1.0% 1.0% 0.425 0.399 79 1.6% 2.5% 1.1% 1.5% 39.796 32.858
19 1.4% -0.6% 0.9% 1.0% 0.447 0.430 80 1.5% 2.4% 1.1% 1.5% 44.505 36.927
20 0.9% -1.1% 0.9% 1.0% 0.467 0.459 81 1.4% 2.3% 1.1% 1.4% 49.790 41.703
21 0.6% -1.5% 0.8% 1.0% 0.493 0.492 82 1.3% 2.2% 1.0% 1.3% 55.722 46.957
22 0.5% -1.7% 0.8% 1.0% 0.521 0.526 83 1.2% 2.3% 0.9% 1.3% 62.382 52.713
23 0.6% -1.9% 0.8% 1.0% 0.561 0.569 84 1.1% 2.4% 0.8% 1.2% 69.863 59.148
24 0.8% -2.0% 0.9% 1.0% 0.604 0.616 85 1.0% 2.4% 0.7% 1.1% 78.269 66.505
25 1.0% -2.0% 0.9% 1.0% 0.656 0.669 86 0.8% 2.3% 0.6% 1.0% 87.702 75.015
26 1.3% -2.0% 1.0% 1.0% 0.714 0.728 87 0.7% 2.2% 0.5% 0.9% 98.206 84.823
27 1.5% -2.0% 1.0% 1.0% 0.751 0.764 88 0.5% 2.0% 0.5% 0.9% 109.777 95.987
28 1.8% -1.8% 1.1% 1.0% 0.779 0.789 89 0.4% 1.8% 0.5% 0.8% 122.371 108.482
29 2.0% -1.6% 1.1% 1.0% 0.805 0.808 90 0.3% 1.6% 0.5% 0.7% 135.888 122.214
30 2.1% -1.4% 1.1% 1.0% 0.828 0.824 91 0.1% 1.4% 0.5% 0.7% 150.209 136.799
31 2.3% -1.1% 1.1% 1.0% 0.848 0.834 92 0.0% 1.1% 0.5% 0.6% 165.349 152.409
32 2.4% -0.7% 1.2% 1.0% 0.867 0.838 93 -0.1% 0.9% 0.4% 0.5% 181.387 169.078
33 2.6% -0.1% 1.2% 1.0% 0.876 0.828 94 -0.2% 0.7% 0.4% 0.5% 198.436 186.882
34 2.6% 0.5% 1.2% 1.0% 0.877 0.808 95 -0.3% 0.6% 0.4% 0.4% 216.648 205.844
35 2.7% 1.2% 1.2% 1.0% 0.879 0.789 96 -0.4% 0.5% 0.4% 0.4% 229.053 219.247
36 2.7% 1.7% 1.2% 1.0% 0.891 0.783 97 -0.4% 0.4% 0.4% 0.3% 247.806 238.612
37 2.6% 2.0% 1.1% 1.0% 0.920 0.800 98 -0.5% 0.4% 0.4% 0.3% 267.095 258.341
38 2.3% 2.0% 1.1% 1.0% 0.963 0.837 99 -0.5% 0.4% 0.4% 0.2% 286.781 278.219
39 2.0% 1.8% 1.0% 1.0% 1.016 0.889 100 -0.5% 0.4% 0.4% 0.2% 306.714 298.452
40 1.6% 1.6% 1.0% 1.0% 1.081 0.955 101 0.2% 326.734 323.610
41 1.3% 1.4% 1.0% 1.0% 1.156 1.029 102 0.1% 346.679 344.191
42 1.1% 1.3% 1.0% 1.0% 1.242 1.110 103 0.1% 366.388 364.633
43 1.0% 1.3% 0.9% 1.0% 1.331 1.188 104 0.0% 385.708 384.783
44 0.9% 1.4% 0.9% 1.0% 1.424 1.268 105 0.0% 400.000 400.000
45 0.8% 1.5% 0.9% 1.0% 1.528 1.355 106 400.000 400.000
46 0.8% 1.5% 0.9% 1.0% 1.654 1.464 107 400.000 400.000
47 0.8% 1.3% 0.9% 1.0% 1.809 1.615 108 400.000 400.000
48 0.7% 0.8% 0.9% 1.0% 1.986 1.808 109 400.000 400.000
49 0.7% 0.3% 1.0% 1.0% 2.180 2.032 110 400.000 400.000
50 0.6% -0.3% 1.0% 1.0% 2.398 2.285 111 400.000 400.000
51 0.6% -0.7% 1.1% 1.1% 2.654 2.557 112 400.000 400.000
52 0.7% -0.7% 1.1% 1.1% 2.936 2.828 113 400.000 400.000
53 0.9% -0.5% 1.2% 1.2% 3.249 3.088 114 400.000 400.000
54 1.2% 0.0% 1.2% 1.2% 3.596 3.345 115 400.000 400.000
55 1.4% 0.5% 1.3% 1.3% 3.979 3.616 116 400.000 400.000
56 1.6% 0.9% 1.3% 1.3% 4.403 3.922 117 400.000 400.000
57 1.7% 1.2% 1.3% 1.4% 4.872 4.272 118 400.000 400.000
58 1.8% 1.4% 1.4% 1.4% 5.392 4.681 119 400.000 400.000
59 1.9% 1.5% 1.4% 1.5% 5.966 5.146 120 400.000 400.000
60 1.9% 1.6% 1.5% 1.5% 6.602 5.662
Male
14
SSA SSA SSA 2002 2012 SSA SSA SSA 2002 2012
1990 2002 2012 Scale Exp. IAM 1990 2002 2012 Scale Exp. IAM
Age -2006 -2006 -2022 G2 Table Table Age -2006 -2006 -2022 G2 Table Table
0 1.9% 0.4% 1.8% 1.0% 1.943 1.801 61 1.3% 1.7% 1.3% 1.3% 5.051 4.352
1 2.6% 0.4% 1.9% 1.0% 0.486 0.450 62 1.3% 1.8% 1.2% 1.3% 5.699 4.899
2 2.0% 0.9% 1.9% 1.0% 0.316 0.287 63 1.2% 2.0% 1.2% 1.3% 6.430 5.482
3 3.1% 2.8% 1.9% 1.0% 0.237 0.199 64 1.2% 2.3% 1.1% 1.3% 7.254 6.118
4 2.8% 2.3% 1.9% 1.0% 0.177 0.152 65 1.2% 2.5% 1.0% 1.3% 8.185 6.829
5 2.6% 2.0% 1.8% 1.0% 0.160 0.139 66 1.2% 2.7% 0.9% 1.3% 8.780 7.279
6 2.5% 1.9% 1.7% 1.0% 0.150 0.130 67 1.1% 2.7% 0.9% 1.3% 9.438 7.821
7 2.5% 2.0% 1.7% 1.0% 0.140 0.122 68 1.1% 2.6% 0.9% 1.3% 10.168 8.475
8 2.6% 2.8% 1.7% 1.0% 0.125 0.105 69 1.0% 2.3% 0.8% 1.3% 10.979 9.234
9 2.8% 3.4% 1.8% 1.0% 0.119 0.098 70 0.9% 2.1% 0.8% 1.3% 11.882 10.083
10 3.1% 4.5% 1.9% 1.0% 0.120 0.094 71 0.8% 2.0% 0.8% 1.3% 12.892 11.011
11 3.2% 5.1% 1.9% 1.0% 0.126 0.096 72 0.8% 1.9% 0.8% 1.3% 14.028 12.030
12 3.0% 4.7% 1.8% 1.0% 0.135 0.105 73 0.7% 1.8% 0.8% 1.3% 15.315 13.154
13 2.6% 4.0% 1.4% 1.0% 0.151 0.120 74 0.7% 1.8% 0.8% 1.3% 16.782 14.415
14 2.1% 3.1% 1.1% 1.0% 0.176 0.146 75 0.7% 1.8% 0.8% 1.3% 18.466 15.869
15 1.9% 2.6% 1.0% 1.0% 0.205 0.174 76 0.7% 1.8% 0.8% 1.3% 20.413 17.555
16 1.7% 2.2% 0.9% 1.0% 0.231 0.199 77 0.7% 1.8% 0.8% 1.3% 22.676 19.500
17 1.5% 1.8% 0.9% 1.0% 0.251 0.220 78 0.6% 1.8% 0.8% 1.3% 25.324 21.758
18 1.2% 1.2% 0.9% 1.0% 0.262 0.234 79 0.6% 1.8% 0.8% 1.3% 28.440 24.412
19 0.9% 0.6% 0.8% 1.0% 0.267 0.245 80 0.6% 1.8% 0.9% 1.3% 32.131 27.579
20 0.5% -0.1% 0.7% 1.0% 0.268 0.253 81 0.5% 1.8% 0.9% 1.2% 36.514 31.501
21 0.2% -0.7% 0.7% 1.0% 0.269 0.260 82 0.5% 1.8% 0.8% 1.2% 41.655 36.122
22 0.1% -1.1% 0.7% 1.0% 0.271 0.266 83 0.4% 1.8% 0.7% 1.1% 47.583 41.477
23 0.1% -1.2% 0.7% 1.0% 0.275 0.272 84 0.3% 1.7% 0.6% 1.0% 54.293 47.589
24 0.3% -1.3% 0.8% 1.0% 0.277 0.275 85 0.3% 1.7% 0.5% 1.0% 61.725 54.441
25 0.5% -1.3% 0.8% 1.0% 0.280 0.277 86 0.2% 1.6% 0.5% 0.9% 69.775 61.972
26 0.6% -1.3% 0.9% 1.0% 0.287 0.284 87 0.1% 1.5% 0.4% 0.8% 78.388 70.155
27 0.7% -1.2% 0.9% 1.0% 0.294 0.290 88 0.1% 1.4% 0.4% 0.7% 87.512 78.963
28 0.8% -1.0% 0.9% 1.0% 0.307 0.300 89 0.0% 1.3% 0.4% 0.7% 97.080 88.336
29 0.9% -0.7% 0.9% 1.0% 0.323 0.313 90 -0.1% 1.2% 0.4% 0.6% 107.003 98.197
30 1.0% -0.4% 0.9% 1.0% 0.348 0.333 91 -0.1% 1.1% 0.4% 0.6% 117.256 108.323
31 1.0% -0.2% 0.9% 1.0% 0.376 0.357 92 -0.2% 1.0% 0.4% 0.5% 128.179 119.188
32 1.0% 0.1% 0.9% 1.0% 0.400 0.375 93 -0.3% 0.9% 0.4% 0.5% 140.355 131.334
33 0.9% 0.5% 0.9% 1.0% 0.422 0.390 94 -0.3% 0.8% 0.4% 0.4% 154.575 145.521
34 0.8% 0.8% 0.9% 1.0% 0.445 0.405 95 -0.3% 0.8% 0.4% 0.4% 171.923 162.722
35 0.7% 1.1% 0.8% 1.0% 0.470 0.424 96 0.7% 0.4% 0.4% 191.530 182.120
36 0.5% 1.3% 0.8% 1.0% 0.499 0.447 97 0.7% 0.4% 0.3% 209.161 199.661
37 0.4% 1.3% 0.8% 1.0% 0.534 0.476 98 0.7% 0.4% 0.3% 227.595 217.946
38 0.2% 1.3% 0.7% 1.0% 0.574 0.514 99 0.7% 0.4% 0.2% 246.726 236.834
39 0.0% 1.1% 0.7% 1.0% 0.621 0.560 100 0.7% 0.4% 0.2% 266.423 256.357
40 -0.2% 0.9% 0.7% 1.0% 0.676 0.613 101 0.2% 286.541 283.802
41 -0.4% 0.8% 0.7% 1.0% 0.732 0.667 102 0.1% 306.919 304.716
42 -0.4% 0.6% 0.7% 1.0% 0.787 0.723 103 0.1% 327.387 325.819
43 -0.4% 0.4% 0.7% 1.0% 0.836 0.774 104 0.0% 347.770 346.936
44 -0.3% 0.2% 0.7% 1.0% 0.879 0.823 105 0.0% 367.898 367.898
45 -0.1% 0.0% 0.8% 1.0% 0.919 0.866 106 387.607 387.607
46 0.0% -0.1% 0.8% 1.0% 0.969 0.917 107 400.000 400.000
47 0.1% -0.2% 0.8% 1.0% 1.034 0.983 108 400.000 400.000
48 0.2% -0.4% 0.9% 1.0% 1.122 1.072 109 400.000 400.000
49 0.4% -0.5% 0.9% 1.0% 1.218 1.168 110 400.000 400.000
50 0.5% -0.6% 1.0% 1.0% 1.339 1.290 111 400.000 400.000
51 0.6% -0.6% 1.1% 1.0% 1.511 1.453 112 400.000 400.000
52 0.8% -0.4% 1.1% 1.1% 1.705 1.622 113 400.000 400.000
53 0.9% 0.1% 1.1% 1.1% 1.923 1.792 114 400.000 400.000
54 1.1% 0.7% 1.2% 1.1% 2.170 1.972 115 400.000 400.000
55 1.2% 1.3% 1.2% 1.2% 2.448 2.166 116 400.000 400.000
56 1.3% 1.8% 1.2% 1.2% 2.762 2.393 117 400.000 400.000
57 1.4% 2.1% 1.2% 1.2% 3.117 2.666 118 400.000 400.000
58 1.4% 2.1% 1.2% 1.2% 3.517 3.000 119 400.000 400.000
59 1.4% 2.0% 1.2% 1.3% 3.968 3.393 120 400.000 400.000
60 1.3% 1.8% 1.3% 1.3% 4.477 3.844
Female
Table 14 - Scale G2 versus Population Improvement and Resulting IAM 2012 Basic Table, Female Risks
15
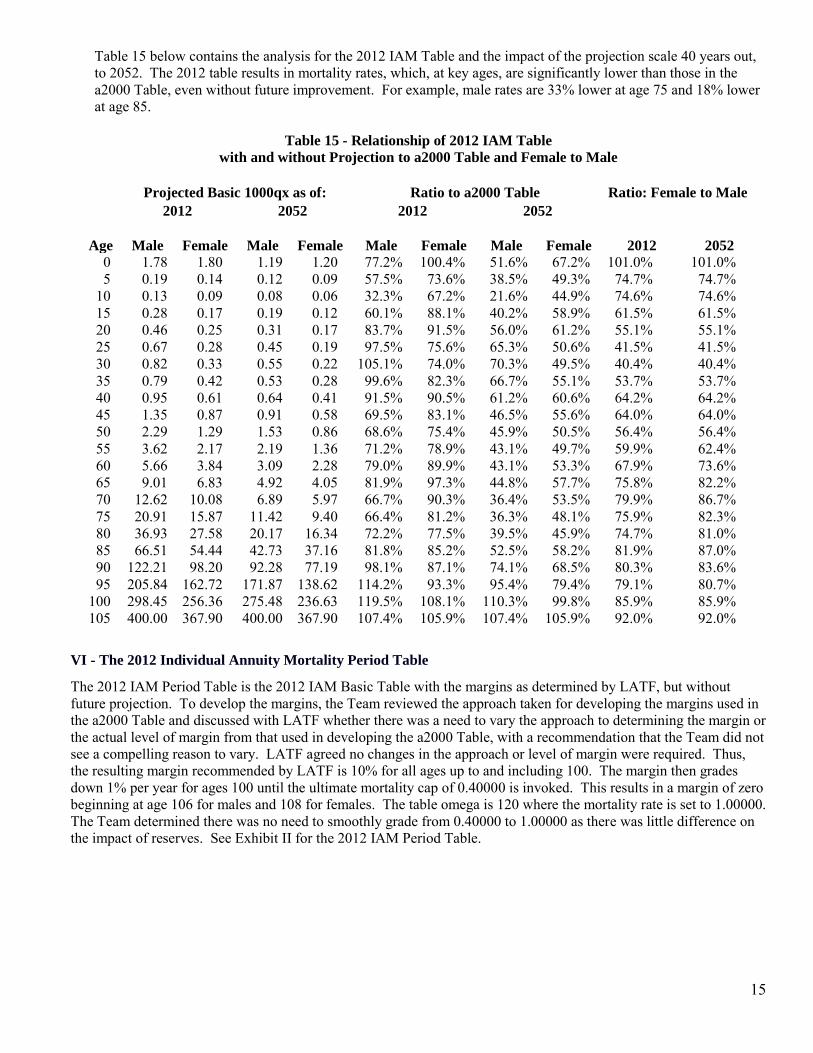
Table 15 below contains the analysis for the 2012 IAM Table and the impact of the projection scale 40 years out, to 2052. The 2012 table results in mortality rates, which, at key ages, are significantly lower than those in the a2000 Table, even without future improvement. For example, male rates are 33% lower at age 75 and 18% lower at age 85.
Table 15 - Relationship of 2012 IAM Table with and without Projection to a2000 Table and Female to Male
Projected Basic 1000qx as of: Ratio to a2000 Table Ratio: Female to Male
2012 2052 2012 2052
Age Male Female Male Female Male Female Male Female 2012 2052 0 1.78 1.80 1.19 1.20 77.2% 100.4% 51.6% 67.2% 101.0% 101.0% 5 0.19 0.14 0.12 0.09 57.5% 73.6% 38.5% 49.3% 74.7% 74.7% 10 0.13 0.09 0.08 0.06 32.3% 67.2% 21.6% 44.9% 74.6% 74.6% 15 0.28 0.17 0.19 0.12 60.1% 88.1% 40.2% 58.9% 61.5% 61.5% 20 0.46 0.25 0.31 0.17 83.7% 91.5% 56.0% 61.2% 55.1% 55.1% 25 0.67 0.28 0.45 0.19 97.5% 75.6% 65.3% 50.6% 41.5% 41.5% 30 0.82 0.33 0.55 0.22 105.1% 74.0% 70.3% 49.5% 40.4% 40.4% 35 0.79 0.42 0.53 0.28 99.6% 82.3% 66.7% 55.1% 53.7% 53.7% 40 0.95 0.61 0.64 0.41 91.5% 90.5% 61.2% 60.6% 64.2% 64.2% 45 1.35 0.87 0.91 0.58 69.5% 83.1% 46.5% 55.6% 64.0% 64.0% 50 2.29 1.29 1.53 0.86 68.6% 75.4% 45.9% 50.5% 56.4% 56.4% 55 3.62 2.17 2.19 1.36 71.2% 78.9% 43.1% 49.7% 59.9% 62.4% 60 5.66 3.84 3.09 2.28 79.0% 89.9% 43.1% 53.3% 67.9% 73.6% 65 9.01 6.83 4.92 4.05 81.9% 97.3% 44.8% 57.7% 75.8% 82.2% 70 12.62 10.08 6.89 5.97 66.7% 90.3% 36.4% 53.5% 79.9% 86.7% 75 20.91 15.87 11.42 9.40 66.4% 81.2% 36.3% 48.1% 75.9% 82.3% 80 36.93 27.58 20.17 16.34 72.2% 77.5% 39.5% 45.9% 74.7% 81.0% 85 66.51 54.44 42.73 37.16 81.8% 85.2% 52.5% 58.2% 81.9% 87.0% 90 122.21 98.20 92.28 77.19 98.1% 87.1% 74.1% 68.5% 80.3% 83.6% 95 205.84 162.72 171.87 138.62 114.2% 93.3% 95.4% 79.4% 79.1% 80.7% 100 298.45 256.36 275.48 236.63 119.5% 108.1% 110.3% 99.8% 85.9% 85.9% 105 400.00 367.90 400.00 367.90 107.4% 105.9% 107.4% 105.9% 92.0% 92.0%
VI - The 2012 Individual Annuity Mortality Period Table
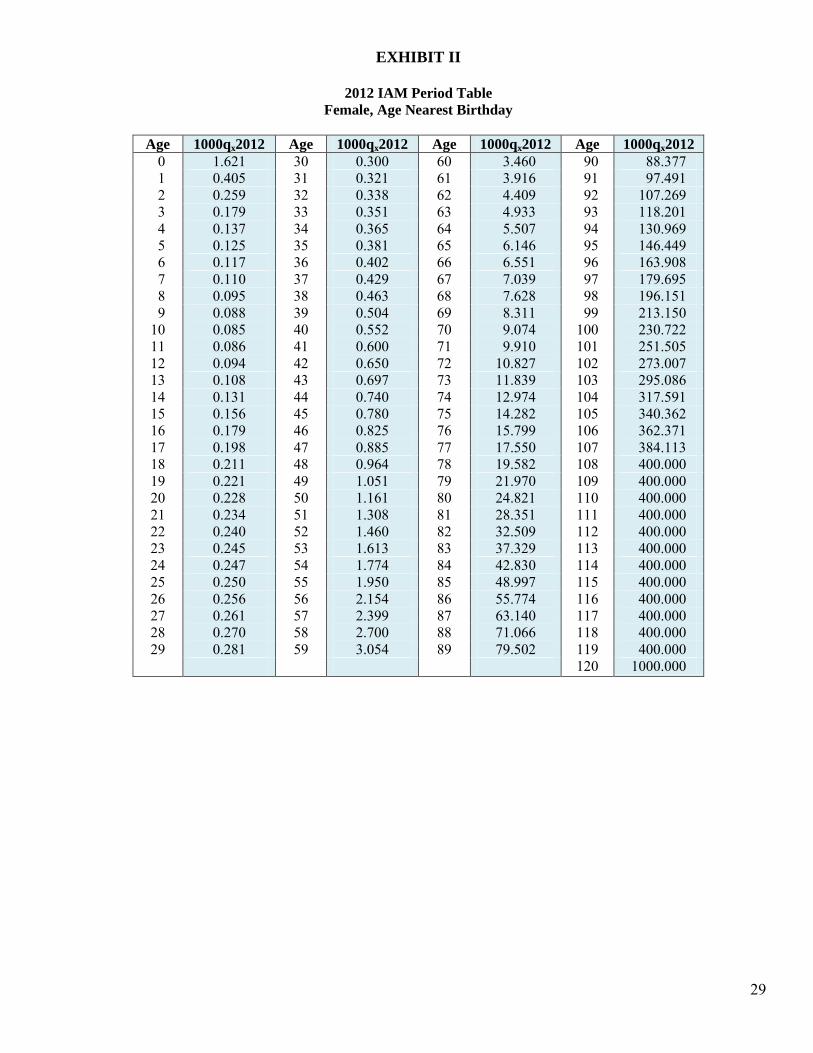
The 2012 IAM Period Table is the 2012 IAM Basic Table with the margins as determined by LATF, but without future projection. To develop the margins, the Team reviewed the approach taken for developing the margins used in the a2000 Table and discussed with LATF whether there was a need to vary the approach to determining the margin or the actual level of margin from that used in developing the a2000 Table, with a recommendation that the Team did not see a compelling reason to vary. LATF agreed no changes in the approach or level of margin were required. Thus, the resulting margin recommended by LATF is 10% for all ages up to and including 100. The margin then grades down 1% per year for ages 100 until the ultimate mortality cap of 0.40000 is invoked. This results in a margin of zero beginning at age 106 for males and 108 for females. The table omega is 120 where the mortality rate is set to 1.00000. The Team determined there was no need to smoothly grade from 0.40000 to 1.00000 as there was little difference on the impact of reserves. See Exhibit II for the 2012 IAM Period Table.
16
VII - The 2012 Individual Annuity Reserve Table and Projection Factors
To develop the 2012 Individual Annuity Reserve Table (2012 IAR Table), the Team concluded it made sense to create a generational mortality table through the use of projection factors. These projection factors are applied to the table each valuation year, rather than using a static table which can become dated more quickly. The Team used the same approach as for the improvement factors described in Section VI of this report. For future projection, the Team decided to use Scale G2, without further modification. An example of the development of a generational mortality table through application of projection factors is shown in Exhibit IV.
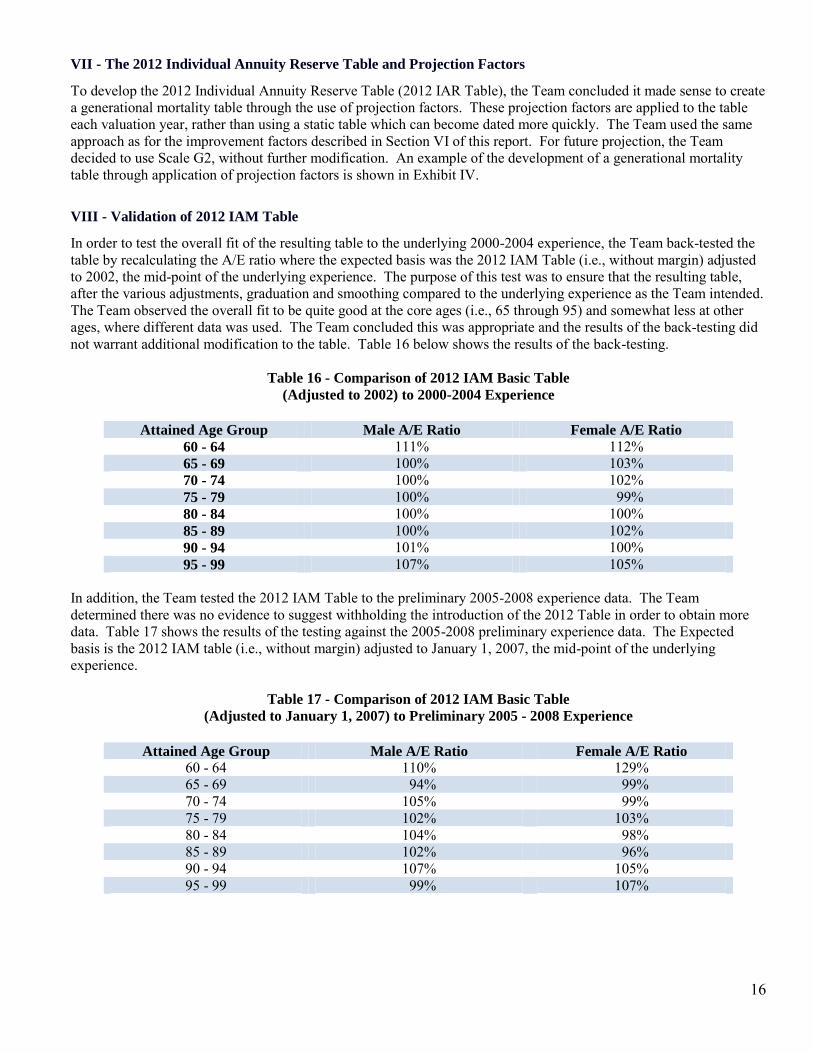
VIII - Validation of 2012 IAM Table
In order to test the overall fit of the resulting table to the underlying 2000-2004 experience, the Team back-tested the table by recalculating the A/E ratio where the expected basis was the 2012 IAM Table (i.e., without margin) adjusted to 2002, the mid-point of the underlying experience. The purpose of this test was to ensure that the resulting table, after the various adjustments, graduation and smoothing compared to the underlying experience as the Team intended. The Team observed the overall fit to be quite good at the core ages (i.e., 65 through 95) and somewhat less at other ages, where different data was used. The Team concluded this was appropriate and the results of the back-testing did not warrant additional modification to the table. Table 16 below shows the results of the back-testing.
Table 16 - Comparison of 2012 IAM Basic Table
(Adjusted to 2002) to 2000-2004 Experience
Attained Age Group Male A/E Ratio Female A/E Ratio
60 - 64 111% 112% 65 - 69 100% 103% 70 - 74 100% 102% 75 - 79 100% 99% 80 - 84 100% 100% 85 - 89 100% 102% 90 - 94 101% 100% 95 - 99 107% 105%
In addition, the Team tested the 2012 IAM Table to the preliminary 2005-2008 experience data. The Team determined there was no evidence to suggest withholding the introduction of the 2012 Table in order to obtain more data. Table 17 shows the results of the testing against the 2005-2008 preliminary experience data. The Expected basis is the 2012 IAM table (i.e., without margin) adjusted to January 1, 2007, the mid-point of the underlying experience.
Table 17 - Comparison of 2012 IAM Basic Table (Adjusted to January 1, 2007) to Preliminary 2005 - 2008 Experience
Attained Age Group Male A/E Ratio Female A/E Ratio
60 - 64 110% 129% 65 - 69 94% 99% 70 - 74 105% 99% 75 - 79 102% 103% 80 - 84 104% 98% 85 - 89 102% 96% 90 - 94 107% 105% 95 - 99 99% 107%
17
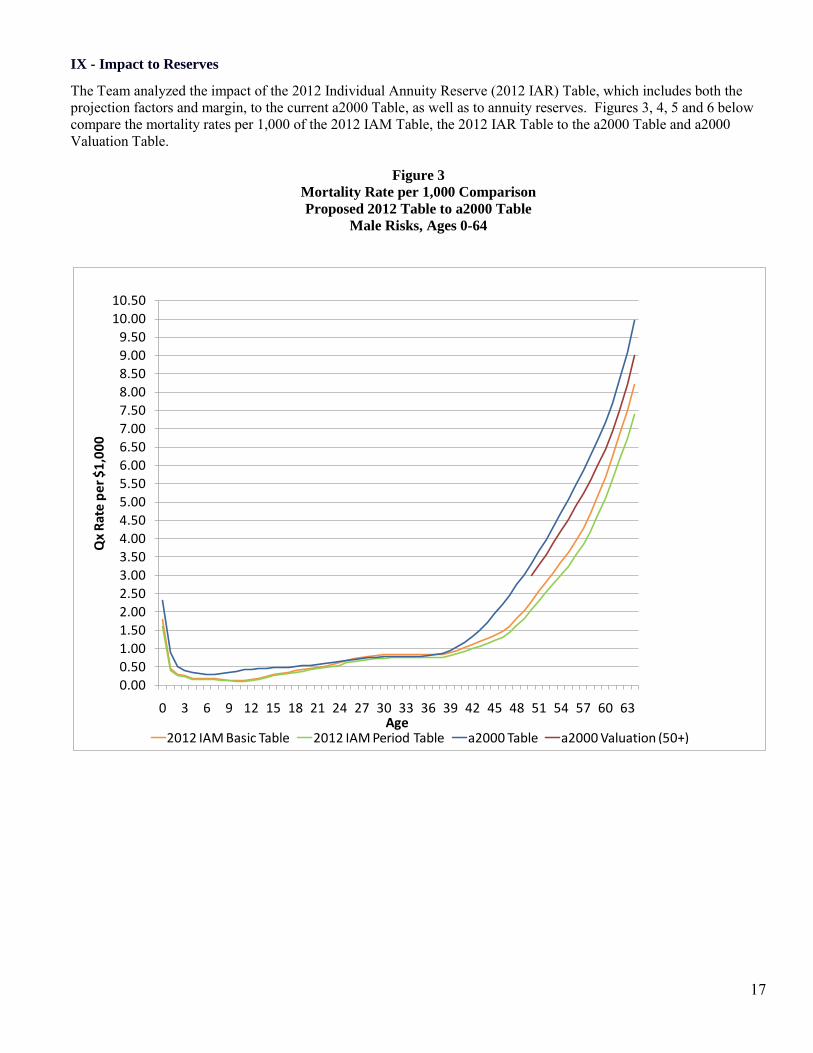
IX - Impact to Reserves
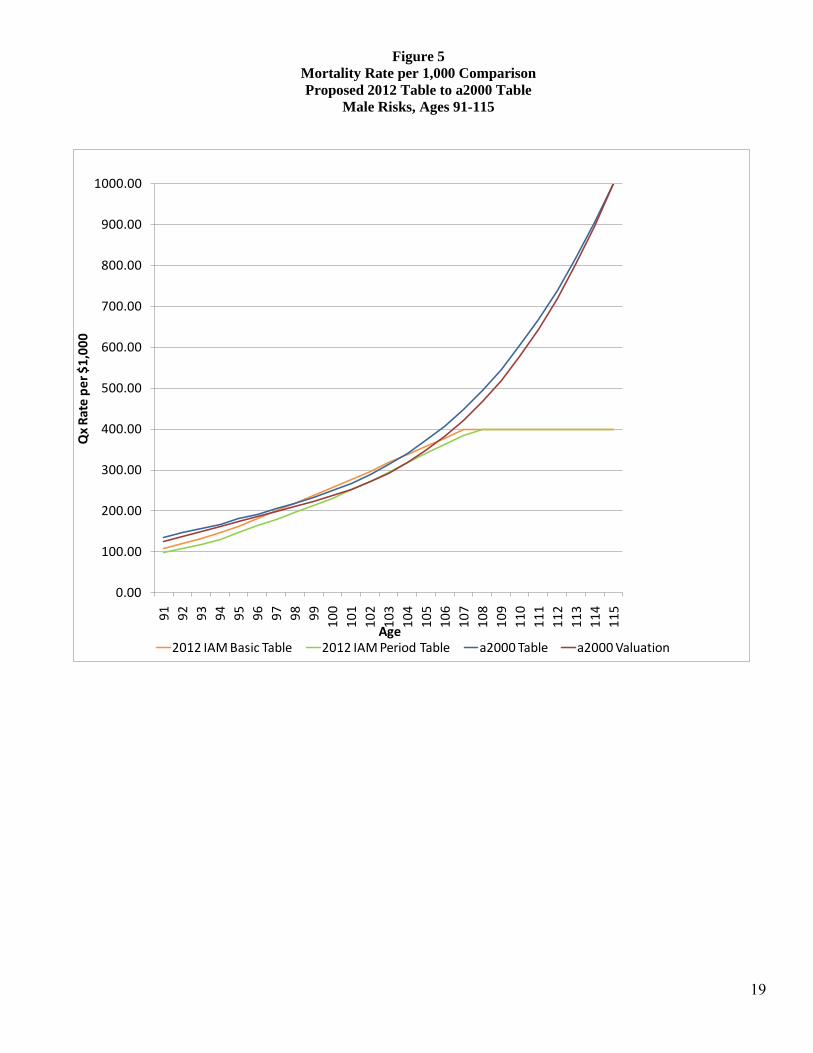
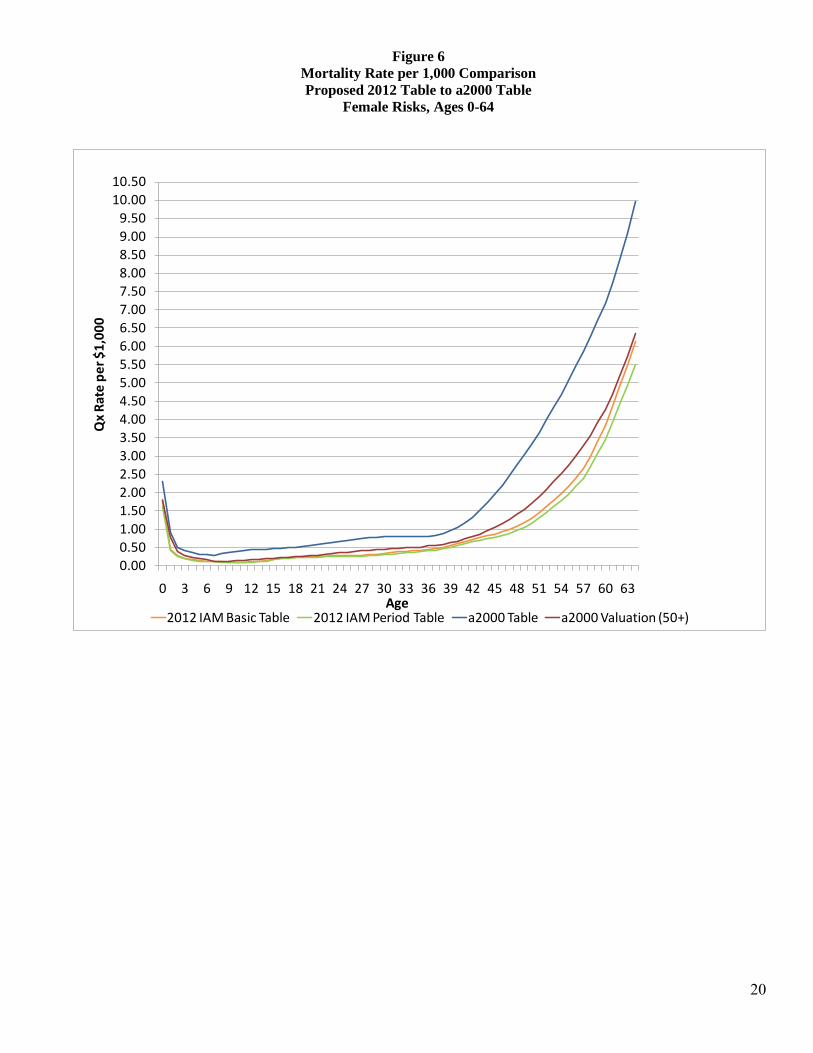
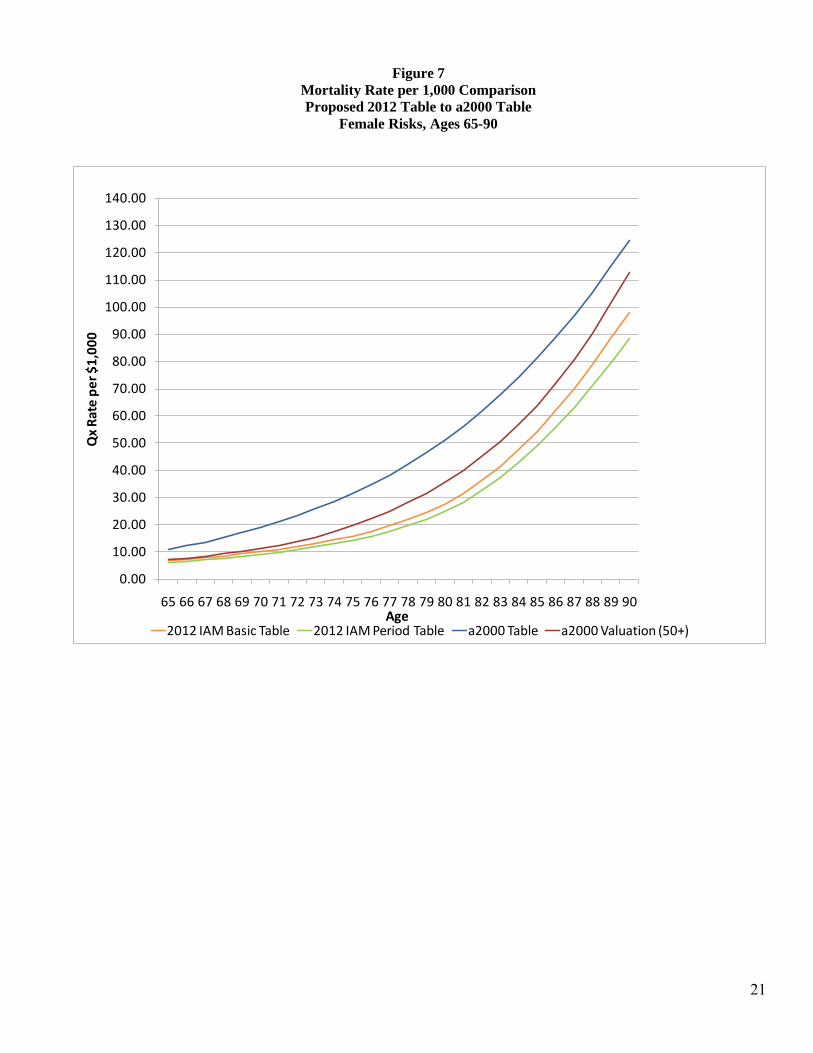
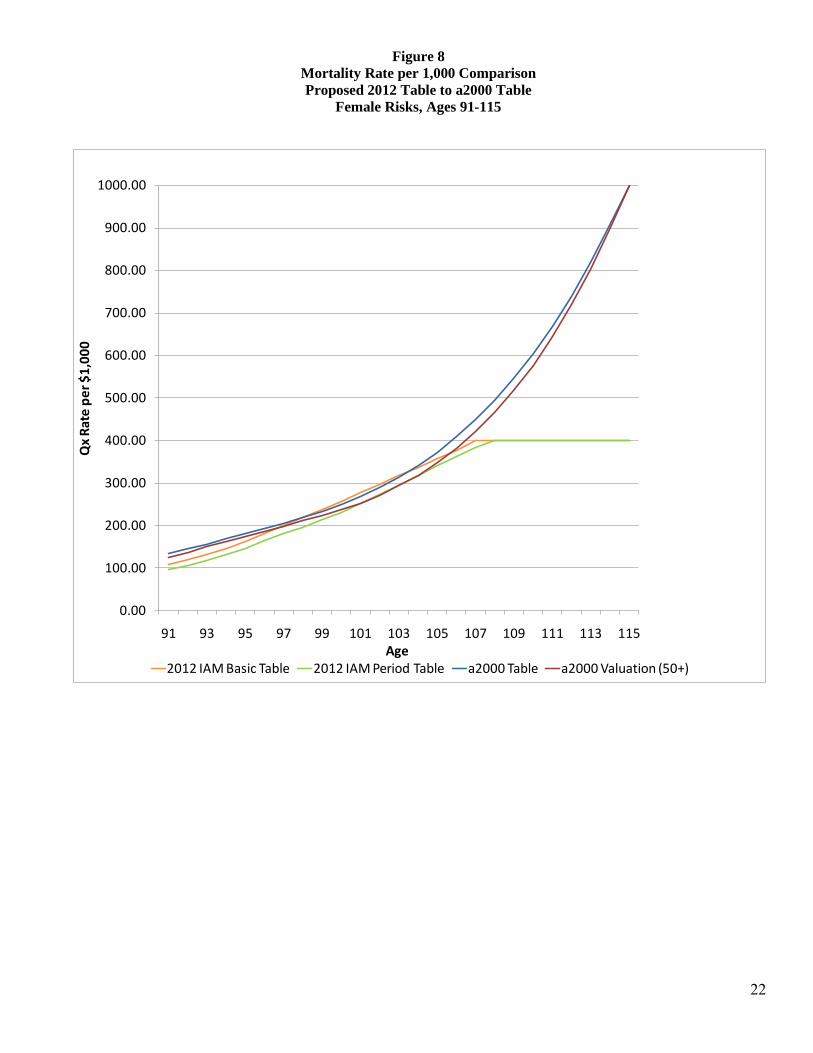
The Team analyzed the impact of the 2012 Individual Annuity Reserve (2012 IAR) Table, which includes both the projection factors and margin, to the current a2000 Table, as well as to annuity reserves. Figures 3, 4, 5 and 6 below compare the mortality rates per 1,000 of the 2012 IAM Table, the 2012 IAR Table to the a2000 Table and a2000 Valuation Table.
Figure 3
Mortality Rate per 1,000 Comparison
Proposed 2012 Table to a2000 Table
Male Risks, Ages 0-64
0.00
0.50
1.00
1.50
2.00
2.50
3.00
3.50
4.00
4.50
5.00
5.50
6.00
6.50
7.00
7.50
8.00
8.50
9.00
9.50
10.00
10.50
0 3 6 9 12 15 18 21 24 27 30 33 36 39 42 45 48 51 54 57 60 63
Qx
Rat
e p
er
$1
,00
0
Age2012 IAM Basic Table 2012 IAM Period Table a2000 Table a2000 Valuation (50+)
18
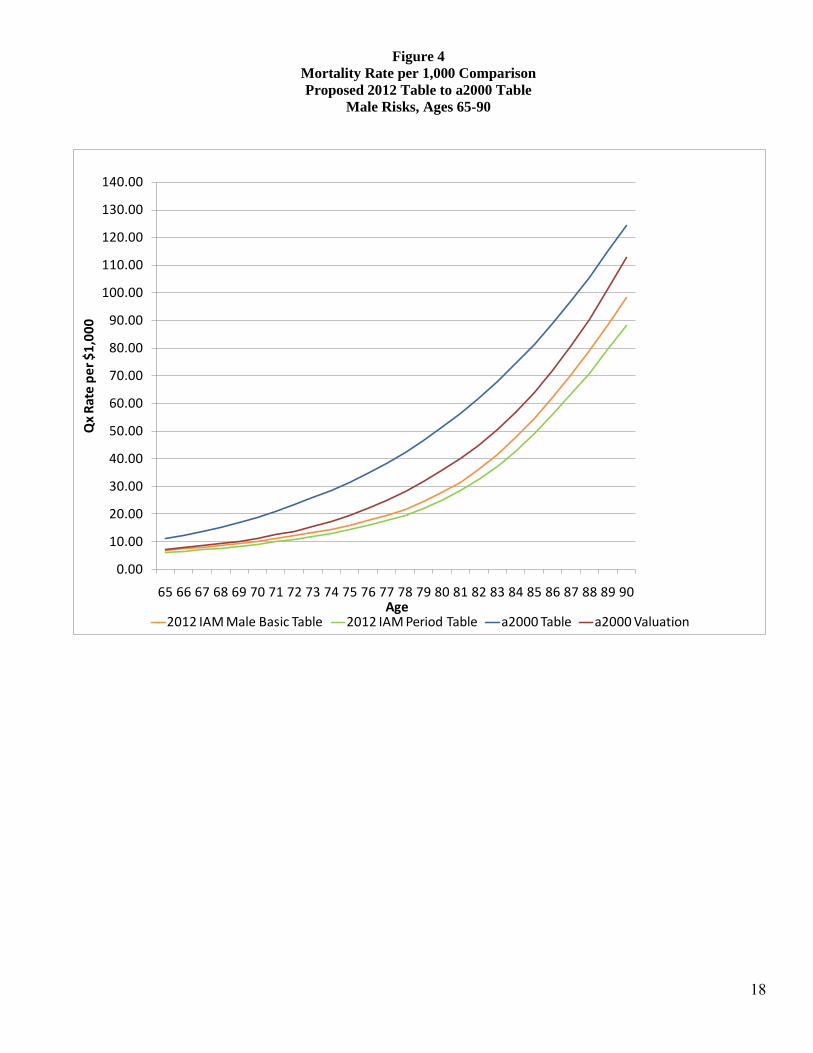
Figure 4
Mortality Rate per 1,000 Comparison
Proposed 2012 Table to a2000 Table
Male Risks, Ages 65-90
0.00
10.00
20.00
30.00
40.00
50.00
60.00
70.00
80.00
90.00
100.00
110.00
120.00
130.00
140.00
65 66 67 68 69 70 71 72 73 74 75 76 77 78 79 80 81 82 83 84 85 86 87 88 89 90
Qx
Rat
e p
er
$1
,00
0
Age2012 IAM Male Basic Table 2012 IAM Period Table a2000 Table a2000 Valuation
19
Figure 5
Mortality Rate per 1,000 Comparison
Proposed 2012 Table to a2000 Table
Male Risks, Ages 91-115
0.00
100.00
200.00
300.00
400.00
500.00
600.00
700.00
800.00
900.00
1000.00
91
92
93
94
95
96
97
98
99
10
0
10
1
10
2
10
3
10
4
10
5
10
6
10
7
10
8
10
9
11
0
11
1
11
2
11
3
11
4
11
5
Qx
Rat
e p
er
$1
,00
0
Age2012 IAM Basic Table 2012 IAM Period Table a2000 Table a2000 Valuation
20
Figure 6
Mortality Rate per 1,000 Comparison
Proposed 2012 Table to a2000 Table
Female Risks, Ages 0-64
0.00
0.50
1.00
1.50
2.00
2.50
3.00
3.50
4.00
4.50
5.00
5.50
6.00
6.50
7.00
7.50
8.00
8.50
9.00
9.50
10.00
10.50
0 3 6 9 12 15 18 21 24 27 30 33 36 39 42 45 48 51 54 57 60 63
Qx
Rat
e p
er
$1
,00
0
Age2012 IAM Basic Table 2012 IAM Period Table a2000 Table a2000 Valuation (50+)
21
Figure 7
Mortality Rate per 1,000 Comparison
Proposed 2012 Table to a2000 Table
Female Risks, Ages 65-90
0.00
10.00
20.00
30.00
40.00
50.00
60.00
70.00
80.00
90.00
100.00
110.00
120.00
130.00
140.00
65 66 67 68 69 70 71 72 73 74 75 76 77 78 79 80 81 82 83 84 85 86 87 88 89 90
Qx
Rat
e p
er
$1
,00
0
Age2012 IAM Basic Table 2012 IAM Period Table a2000 Table a2000 Valuation (50+)
22
Figure 8
Mortality Rate per 1,000 Comparison
Proposed 2012 Table to a2000 Table
Female Risks, Ages 91-115
0.00
100.00
200.00
300.00
400.00
500.00
600.00
700.00
800.00
900.00
1000.00
91 93 95 97 99 101 103 105 107 109 111 113 115
Qx
Rat
e p
er
$1
,00
0
Age2012 IAM Basic Table 2012 IAM Period Table a2000 Table a2000 Valuation (50+)
23
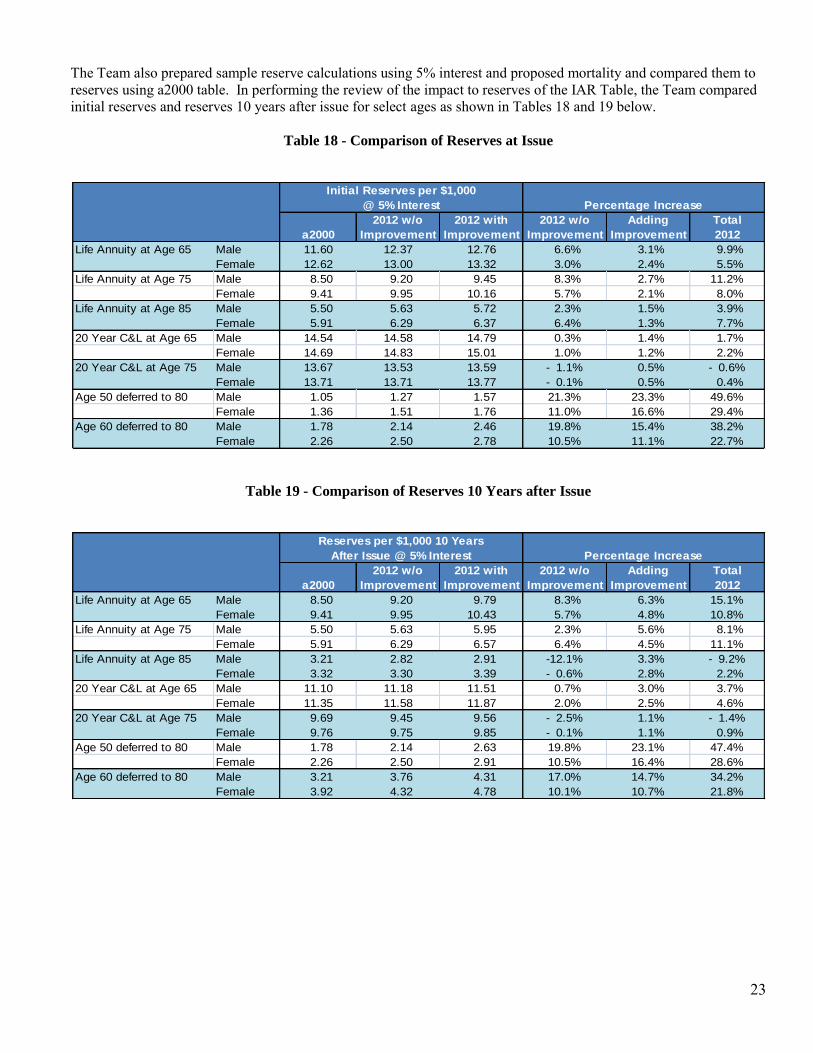
The Team also prepared sample reserve calculations using 5% interest and proposed mortality and compared them to reserves using a2000 table. In performing the review of the impact to reserves of the IAR Table, the Team compared initial reserves and reserves 10 years after issue for select ages as shown in Tables 18 and 19 below.
Table 18 - Comparison of Reserves at Issue
Table 19 - Comparison of Reserves 10 Years after Issue
2012 w/o 2012 with 2012 w/o Adding Total
a2000 Improvement Improvement Improvement Improvement 2012
Life Annuity at Age 65 Male 11.60 12.37 12.76 6.6% 3.1% 9.9%
Female 12.62 13.00 13.32 3.0% 2.4% 5.5%
Life Annuity at Age 75 Male 8.50 9.20 9.45 8.3% 2.7% 11.2%
Female 9.41 9.95 10.16 5.7% 2.1% 8.0%
Life Annuity at Age 85 Male 5.50 5.63 5.72 2.3% 1.5% 3.9%
Female 5.91 6.29 6.37 6.4% 1.3% 7.7%
20 Year C&L at Age 65 Male 14.54 14.58 14.79 0.3% 1.4% 1.7%
Female 14.69 14.83 15.01 1.0% 1.2% 2.2%
20 Year C&L at Age 75 Male 13.67 13.53 13.59 - 1.1% 0.5% - 0.6%
Female 13.71 13.71 13.77 - 0.1% 0.5% 0.4%
Age 50 deferred to 80 Male 1.05 1.27 1.57 21.3% 23.3% 49.6%
Female 1.36 1.51 1.76 11.0% 16.6% 29.4%
Age 60 deferred to 80 Male 1.78 2.14 2.46 19.8% 15.4% 38.2%
Female 2.26 2.50 2.78 10.5% 11.1% 22.7%
Initial Reserves per $1,000
@ 5% Interest Percentage Increase
2012 w/o 2012 with 2012 w/o Adding Total
a2000 Improvement Improvement Improvement Improvement 2012
Life Annuity at Age 65 Male 8.50 9.20 9.79 8.3% 6.3% 15.1%
Female 9.41 9.95 10.43 5.7% 4.8% 10.8%
Life Annuity at Age 75 Male 5.50 5.63 5.95 2.3% 5.6% 8.1%
Female 5.91 6.29 6.57 6.4% 4.5% 11.1%
Life Annuity at Age 85 Male 3.21 2.82 2.91 -12.1% 3.3% - 9.2%
Female 3.32 3.30 3.39 - 0.6% 2.8% 2.2%
20 Year C&L at Age 65 Male 11.10 11.18 11.51 0.7% 3.0% 3.7%
Female 11.35 11.58 11.87 2.0% 2.5% 4.6%
20 Year C&L at Age 75 Male 9.69 9.45 9.56 - 2.5% 1.1% - 1.4%
Female 9.76 9.75 9.85 - 0.1% 1.1% 0.9%
Age 50 deferred to 80 Male 1.78 2.14 2.63 19.8% 23.1% 47.4%
Female 2.26 2.50 2.91 10.5% 16.4% 28.6%
Age 60 deferred to 80 Male 3.21 3.76 4.31 17.0% 14.7% 34.2%
Female 3.92 4.32 4.78 10.1% 10.7% 21.8%
Reserves per $1,000 10 Years
After Issue @ 5% Interest Percentage Increase

24
EXHIBIT I
2012 Individual Annuity Mortality Table Basic Rates

25
EXHIBIT I
2012 IAM Basic Table
Male, Age Nearest Birthday
Age 1000qx2012 Age 1000qx2012 Age 1000qx2012 Age 1000qx2012 0 1.783 30 0.824 60 5.662 90 122.214 1 0.446 31 0.834 61 6.237 91 136.799 2 0.306 32 0.838 62 6.854 92 152.409 3 0.254 33 0.828 63 7.510 93 169.078 4 0.193 34 0.808 64 8.220 94 186.882 5 0.186 35 0.789 65 9.007 95 205.844 6 0.184 36 0.783 66 9.497 96 219.247 7 0.177 37 0.800 67 10.085 97 238.612 8 0.159 38 0.837 68 10.787 98 258.341 9 0.143 39 0.889 69 11.625 99 278.219 10 0.126 40 0.955 70 12.619 100 298.452 11 0.123 41 1.029 71 13.798 101 323.610 12 0.147 42 1.110 72 15.195 102 344.191 13 0.188 43 1.188 73 16.834 103 364.633 14 0.236 44 1.268 74 18.733 104 384.783 15 0.282 45 1.355 75 20.905 105 400.000 16 0.325 46 1.464 76 23.367 106 400.000 17 0.364 47 1.615 77 26.155 107 400.000 18 0.399 48 1.808 78 29.306 108 400.000 19 0.430 49 2.032 79 32.858 109 400.000 20 0.459 50 2.285 80 36.927 110 400.000 21 0.492 51 2.557 81 41.703 111 400.000 22 0.526 52 2.828 82 46.957 112 400.000 23 0.569 53 3.088 83 52.713 113 400.000 24 0.616 54 3.345 84 59.148 114 400.000 25 0.669 55 3.616 85 66.505 115 400.000 26 0.728 56 3.922 86 75.015 116 400.000 27 0.764 57 4.272 87 84.823 117 400.000 28 0.789 58 4.681 88 95.987 118 400.000 29 0.808 59 5.146 89 108.482 119 400.000
120 400.000
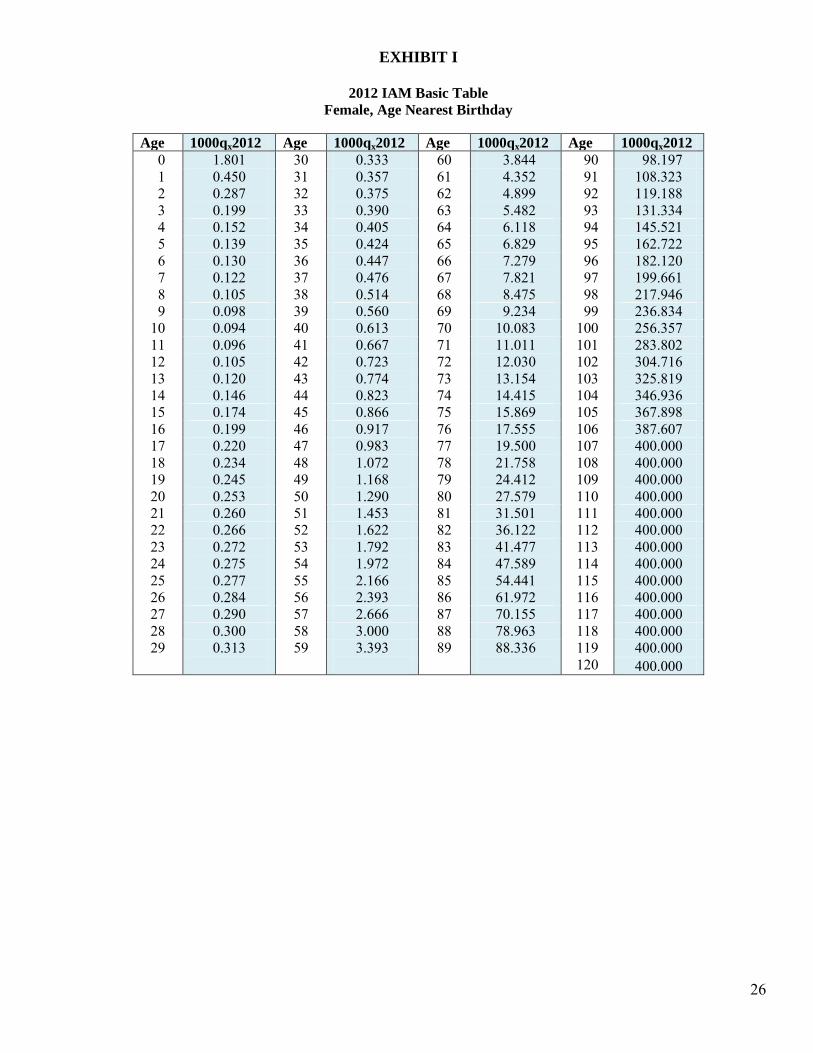
26
EXHIBIT I
2012 IAM Basic Table
Female, Age Nearest Birthday
Age 1000qx2012 Age 1000qx2012 Age 1000qx2012 Age 1000qx2012 0 1.801 30 0.333 60 3.844 90 98.197 1 0.450 31 0.357 61 4.352 91 108.323 2 0.287 32 0.375 62 4.899 92 119.188 3 0.199 33 0.390 63 5.482 93 131.334 4 0.152 34 0.405 64 6.118 94 145.521 5 0.139 35 0.424 65 6.829 95 162.722 6 0.130 36 0.447 66 7.279 96 182.120 7 0.122 37 0.476 67 7.821 97 199.661 8 0.105 38 0.514 68 8.475 98 217.946 9 0.098 39 0.560 69 9.234 99 236.834 10 0.094 40 0.613 70 10.083 100 256.357 11 0.096 41 0.667 71 11.011 101 283.802 12 0.105 42 0.723 72 12.030 102 304.716 13 0.120 43 0.774 73 13.154 103 325.819 14 0.146 44 0.823 74 14.415 104 346.936 15 0.174 45 0.866 75 15.869 105 367.898 16 0.199 46 0.917 76 17.555 106 387.607 17 0.220 47 0.983 77 19.500 107 400.000 18 0.234 48 1.072 78 21.758 108 400.000 19 0.245 49 1.168 79 24.412 109 400.000 20 0.253 50 1.290 80 27.579 110 400.000 21 0.260 51 1.453 81 31.501 111 400.000 22 0.266 52 1.622 82 36.122 112 400.000 23 0.272 53 1.792 83 41.477 113 400.000 24 0.275 54 1.972 84 47.589 114 400.000 25 0.277 55 2.166 85 54.441 115 400.000 26 0.284 56 2.393 86 61.972 116 400.000 27 0.290 57 2.666 87 70.155 117 400.000 28 0.300 58 3.000 88 78.963 118 400.000 29 0.313 59 3.393 89 88.336 119 400.000 120 400.000

27
EXHIBIT II
2012 Individual Annuity Mortality Period Table Rates

28
EXHIBIT II
2012 IAM Period Table
Male, Age Nearest Birthday
Age 1000qx2012 Age 1000qx2012 Age 1000qx2012 Age 1000qx2012 0 1.605 30 0.741 60 5.096 90 109.993 1 0.401 31 0.751 61 5.614 91 123.119 2 0.275 32 0.754 62 6.169 92 137.168 3 0.229 33 0.756 63 6.759 93 152.171 4 0.174 34 0.756 64 7.398 94 168.194 5 0.168 35 0.756 65 8.106 95 185.260 6 0.165 36 0.756 66 8.548 96 197.322 7 0.159 37 0.756 67 9.076 97 214.751 8 0.143 38 0.756 68 9.708 98 232.507 9 0.129 39 0.800 69 10.463 99 250.397 10 0.113 40 0.859 70 11.357 100 268.607 11 0.111 41 0.926 71 12.418 101 290.016 12 0.132 42 0.999 72 13.675 102 311.849 13 0.169 43 1.069 73 15.150 103 333.962 14 0.213 44 1.142 74 16.860 104 356.207 15 0.254 45 1.219 75 18.815 105 380.000 16 0.293 46 1.318 76 21.031 106 400.000 17 0.328 47 1.454 77 23.540 107 400.000 18 0.359 48 1.627 78 26.375 108 400.000 19 0.387 49 1.829 79 29.572 109 400.000 20 0.414 50 2.057 80 33.234 110 400.000 21 0.443 51 2.302 81 37.533 111 400.000 22 0.473 52 2.545 82 42.261 112 400.000 23 0.513 53 2.779 83 47.441 113 400.000 24 0.554 54 3.011 84 53.233 114 400.000 25 0.602 55 3.254 85 59.855 115 400.000 26 0.655 56 3.529 86 67.514 116 400.000 27 0.688 57 3.845 87 76.340 117 400.000 28 0.710 58 4.213 88 86.388 118 400.000 29 0.727 59 4.631 89 97.634 119 400.000 120 1000.000
29
EXHIBIT II
2012 IAM Period Table
Female, Age Nearest Birthday
Age 1000qx2012 Age 1000qx2012 Age 1000qx2012 Age 1000qx2012 0 1.621 30 0.300 60 3.460 90 88.377 1 0.405 31 0.321 61 3.916 91 97.491 2 0.259 32 0.338 62 4.409 92 107.269 3 0.179 33 0.351 63 4.933 93 118.201 4 0.137 34 0.365 64 5.507 94 130.969 5 0.125 35 0.381 65 6.146 95 146.449 6 0.117 36 0.402 66 6.551 96 163.908 7 0.110 37 0.429 67 7.039 97 179.695 8 0.095 38 0.463 68 7.628 98 196.151 9 0.088 39 0.504 69 8.311 99 213.150 10 0.085 40 0.552 70 9.074 100 230.722 11 0.086 41 0.600 71 9.910 101 251.505 12 0.094 42 0.650 72 10.827 102 273.007 13 0.108 43 0.697 73 11.839 103 295.086 14 0.131 44 0.740 74 12.974 104 317.591 15 0.156 45 0.780 75 14.282 105 340.362 16 0.179 46 0.825 76 15.799 106 362.371 17 0.198 47 0.885 77 17.550 107 384.113 18 0.211 48 0.964 78 19.582 108 400.000 19 0.221 49 1.051 79 21.970 109 400.000 20 0.228 50 1.161 80 24.821 110 400.000 21 0.234 51 1.308 81 28.351 111 400.000 22 0.240 52 1.460 82 32.509 112 400.000 23 0.245 53 1.613 83 37.329 113 400.000 24 0.247 54 1.774 84 42.830 114 400.000 25 0.250 55 1.950 85 48.997 115 400.000 26 0.256 56 2.154 86 55.774 116 400.000 27 0.261 57 2.399 87 63.140 117 400.000 28 0.270 58 2.700 88 71.066 118 400.000 29 0.281 59 3.054 89 79.502 119 400.000 120 1000.000

30
EXHIBIT III
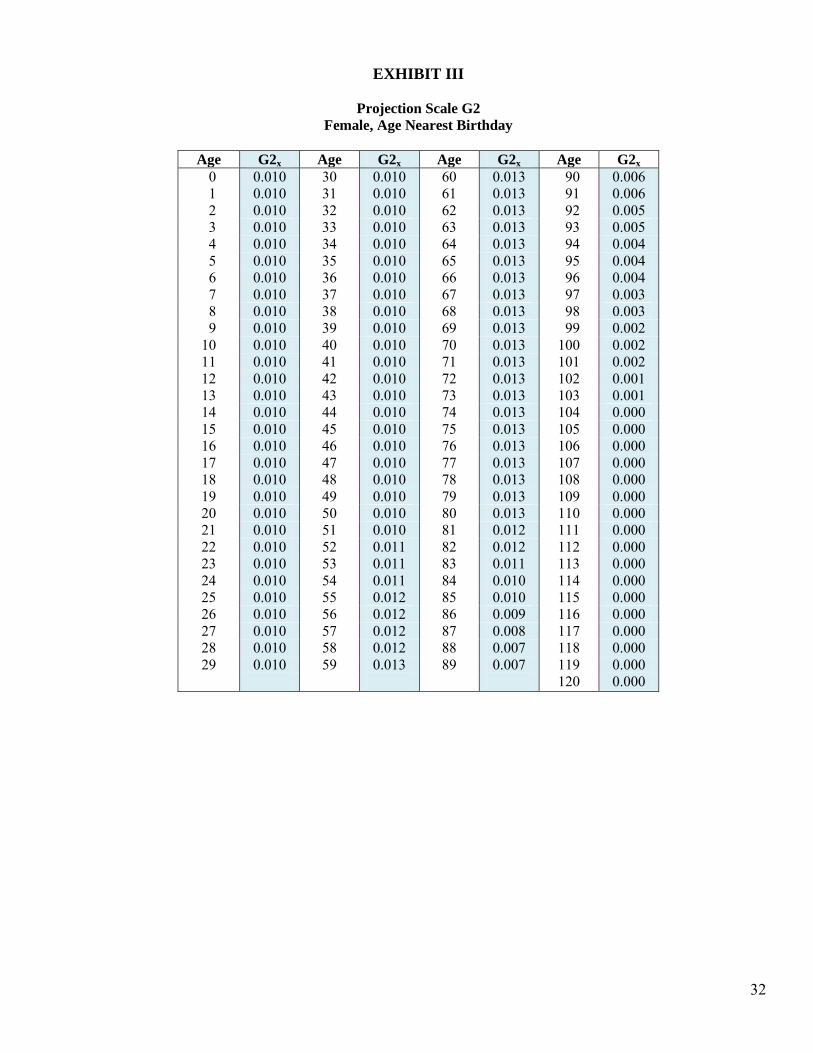
Projection Scale G2
31
EXHIBIT III
Projection Scale G2
Male, Age Nearest Birthday
Age G2x Age G2x Age G2x Age G2x 0 0.010 30 0.010 60 0.015 90 0.007 1 0.010 31 0.010 61 0.015 91 0.007 2 0.010 32 0.010 62 0.015 92 0.006 3 0.010 33 0.010 63 0.015 93 0.005 4 0.010 34 0.010 64 0.015 94 0.005 5 0.010 35 0.010 65 0.015 95 0.004 6 0.010 36 0.010 66 0.015 96 0.004 7 0.010 37 0.010 67 0.015 97 0.003 8 0.010 38 0.010 68 0.015 98 0.003 9 0.010 39 0.010 69 0.015 99 0.002 10 0.010 40 0.010 70 0.015 100 0.002 11 0.010 41 0.010 71 0.015 101 0.002 12 0.010 42 0.010 72 0.015 102 0.001 13 0.010 43 0.010 73 0.015 103 0.001 14 0.010 44 0.010 74 0.015 104 0.000 15 0.010 45 0.010 75 0.015 105 0.000 16 0.010 46 0.010 76 0.015 106 0.000 17 0.010 47 0.010 77 0.015 107 0.000 18 0.010 48 0.010 78 0.015 108 0.000 19 0.010 49 0.010 79 0.015 109 0.000 20 0.010 50 0.010 80 0.015 110 0.000 21 0.010 51 0.011 81 0.014 111 0.000 22 0.010 52 0.011 82 0.013 112 0.000 23 0.010 53 0.012 83 0.013 113 0.000 24 0.010 54 0.012 84 0.012 114 0.000 25 0.010 55 0.013 85 0.011 115 0.000 26 0.010 56 0.013 86 0.010 116 0.000 27 0.010 57 0.014 87 0.009 117 0.000 28 0.010 58 0.014 88 0.009 118 0.000 29 0.010 59 0.015 89 0.008 119 0.000 120 0.000
32
EXHIBIT III
Projection Scale G2
Female, Age Nearest Birthday
Age G2x Age G2x Age G2x Age G2x 0 0.010 30 0.010 60 0.013 90 0.006 1 0.010 31 0.010 61 0.013 91 0.006 2 0.010 32 0.010 62 0.013 92 0.005 3 0.010 33 0.010 63 0.013 93 0.005 4 0.010 34 0.010 64 0.013 94 0.004 5 0.010 35 0.010 65 0.013 95 0.004 6 0.010 36 0.010 66 0.013 96 0.004 7 0.010 37 0.010 67 0.013 97 0.003 8 0.010 38 0.010 68 0.013 98 0.003 9 0.010 39 0.010 69 0.013 99 0.002 10 0.010 40 0.010 70 0.013 100 0.002 11 0.010 41 0.010 71 0.013 101 0.002 12 0.010 42 0.010 72 0.013 102 0.001 13 0.010 43 0.010 73 0.013 103 0.001 14 0.010 44 0.010 74 0.013 104 0.000 15 0.010 45 0.010 75 0.013 105 0.000 16 0.010 46 0.010 76 0.013 106 0.000 17 0.010 47 0.010 77 0.013 107 0.000 18 0.010 48 0.010 78 0.013 108 0.000 19 0.010 49 0.010 79 0.013 109 0.000 20 0.010 50 0.010 80 0.013 110 0.000 21 0.010 51 0.010 81 0.012 111 0.000 22 0.010 52 0.011 82 0.012 112 0.000 23 0.010 53 0.011 83 0.011 113 0.000 24 0.010 54 0.011 84 0.010 114 0.000 25 0.010 55 0.012 85 0.010 115 0.000 26 0.010 56 0.012 86 0.009 116 0.000 27 0.010 57 0.012 87 0.008 117 0.000 28 0.010 58 0.012 88 0.007 118 0.000 29 0.010 59 0.013 89 0.007 119 0.000 120 0.000

33
EXHIBIT IV
Generational Mortality Table Development
34
EXHIBIT IV
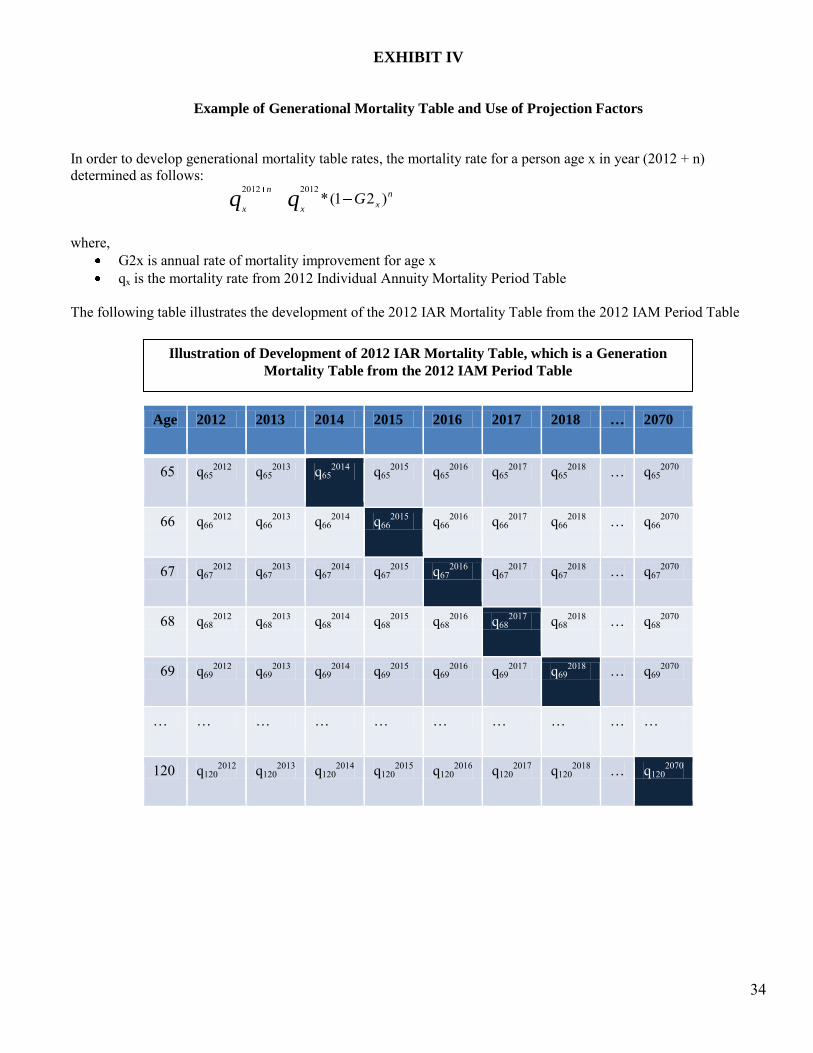
Example of Generational Mortality Table and Use of Projection Factors
In order to develop generational mortality table rates, the mortality rate for a person age x in year (2012 + n) determined as follows: where,
G2x is annual rate of mortality improvement for age x qx is the mortality rate from 2012 Individual Annuity Mortality Period Table
The following table illustrates the development of the 2012 IAR Mortality Table from the 2012 IAM Period Table
Age 2012 2013 2014 2015 2016 2017 2018 … 2070
65 q652012
q652013
q652014
q652015
q652016
q652017 q65
2018 … q652070
66 q662012
q662013
q662014
q662015
q662016
q662017 q66
2018 … q662070
67 q672012
q672013
q672014
q672015
q672016
q672017 q67
2018 … q672070
68 q682012
q682013
q682014
q682015
q682016
q682017 q68
2018 … q682070
69 q692012
q692013
q692014
q692015
q692016
q692017 q69
2018 … q692070
… … … … … … … … … …
120 q1202012
q1202013
q1202014
q1202015
q1202016
q1202017 q120
2018 … q1202070
n
xx
n
xGqq )21(*
20122012
Illustration of Development of 2012 IAR Mortality Table, which is a Generation
Mortality Table from the 2012 IAM Period Table
35
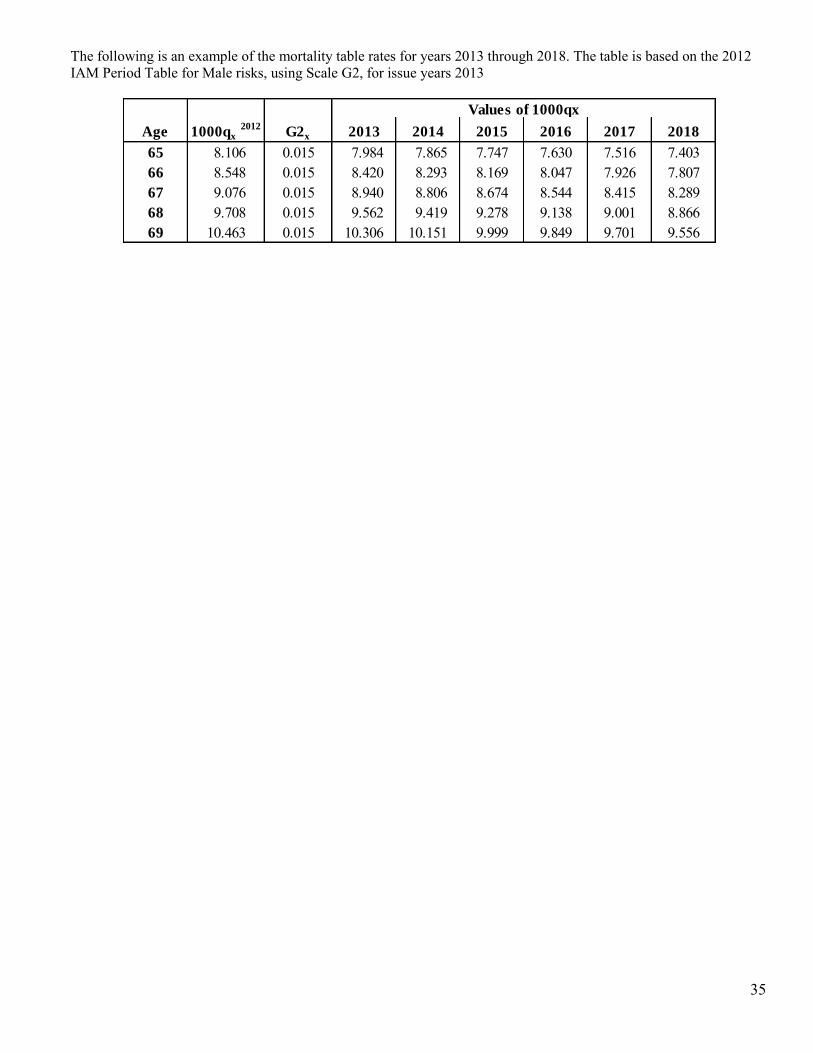
The following is an example of the mortality table rates for years 2013 through 2018. The table is based on the 2012 IAM Period Table for Male risks, using Scale G2, for issue years 2013
Age 1000qx 2012
G2x 2013 2014 2015 2016 2017 2018
65 8.106 0.015 7.984 7.865 7.747 7.630 7.516 7.40366 8.548 0.015 8.420 8.293 8.169 8.047 7.926 7.80767 9.076 0.015 8.940 8.806 8.674 8.544 8.415 8.28968 9.708 0.015 9.562 9.419 9.278 9.138 9.001 8.86669 10.463 0.015 10.306 10.151 9.999 9.849 9.701 9.556
Values of 1000qx
36
1 Eilers, P.H.C., and Marx, B.D. 1996. “Flexible Smoothing with B-splines and Penalties.” Statistical Science 11(2): 89-121. 2 P-Spline formula denoted as q(i)x,t = exp{log(q(i)x,t) + Z x Ŝx,t} whereby q(i)x,t is the force of mortality for each age x and for each year t. Ŝx,t is the standard deviation of the log mean value of q(i)x,t. Z is a standard normal variable for use in generating scenarios. Further details on the P-Spline methodology and the Mortality Projection Spreadsheet v3.0 can be found in the Continuous Mortality Investigation Working Paper 15 (2005), pp. 12-15 and Revised Working Paper 20 produced by The Faculty of Actuaries and Institute of Actuaries. 3 Continuous Mortality Investigation. 2005. “Working Paper 15. Projecting Future Mortality: Towards a Proposal for a Stochastic Methodology.” and Continuous Mortality Investigation. 2007. “Revised Working Paper 20. Stochastic Projection Methodologies: further progress and P-Spline Model features, example results and implications.” The Faculty of Actuaries and Institute of Actuaries. 4 Currie, I.D., Durban, M., and Eilers, P.H.C. 2004. “Smoothing and Forecasting Mortality Rates.” Statistical Modeling 4: 279-298 5 Inference for Logistic-type Models for the Force of Mortality”, Louis G. Doray, Living to 100 and Beyond Symposium, 2008 6 Canadian Institute of Actuaries, "Mortality Improvement Research Paper," Committee of Life Insurance Financial Reporting, September 2010
W:\National Meetings\2011\Fall\TF\LA\Payout Annuity Report 0928.pdf