Embed Size (px)
Citation preview
Page 1
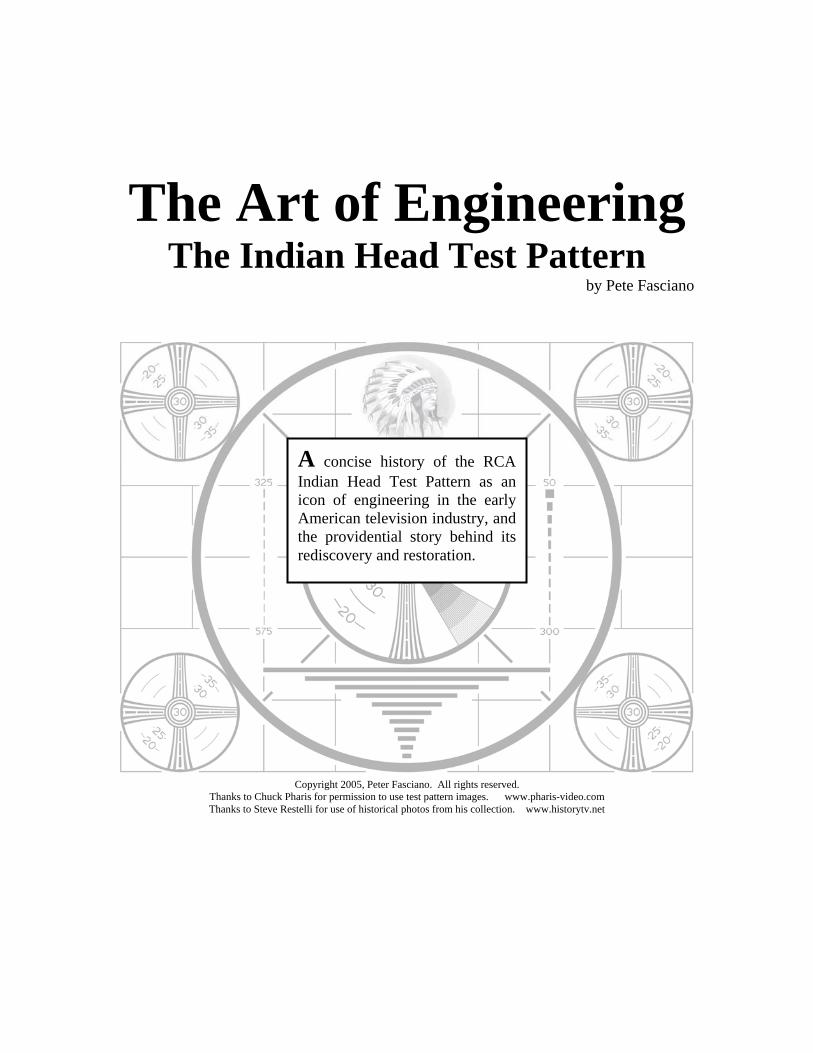
The Art of Engineering The Indian Head Test Pattern
by Pete Fasciano
A concise history of the RCA Indian Head Test Pattern as an icon of engineering in the early American television industry, and the providential story behind its rediscovery and restoration.
Copyright 2005, Peter Fasciano. All rights reserved. Thanks to Chuck Pharis for permission to use test pattern images. www.pharis-video.com Thanks to Steve Restelli for use of historical photos from his collection. www.historytv.net
Page 2
The Art of Engineering The Indian Head Test Pattern
We are all collectors. Snow globes, baseball cards, Barbies, Magic Cards, all forms of somewhat interesting, more-or-less memorable, highly prized and valuable (maybe) what have you. At some point in our lives just about all of us take a fancy to collecting something. Sometimes this disease strikes early. “Hey, kids, collect the entire set. Trade ‘em with your friends”. Nostalgia is often a factor. We gather up the kitsch and flotsam bobbing in the wake of our lives. Some of us are dabblers; just curious about curios. There are those who get serious, becoming curators of a sort. Then there’s Chuck Pharis. Chuck and I share an interest in early TV technology. For Chuck it’s mostly about old television cameras. His collection is extensive, impressive, with one-of-a-kind prototype cameras in both black-and-white and color. His knowledge is even more extensive. Great website: http://www.pharis-video.com/ My specialty is early television technical books, and my even more arcane specialty-within-a-specialty; test patterns. Through some forensic analysis the early test patterns can inform us about the history and who knew what and when among the competing developers of television technology.
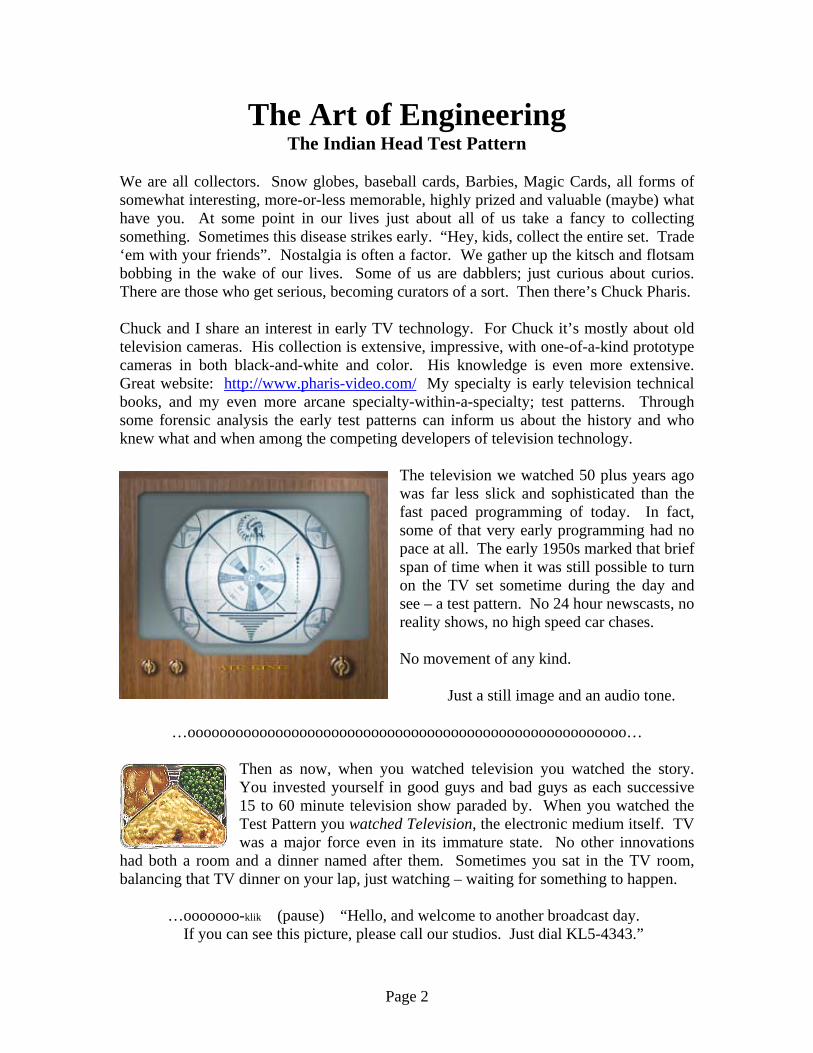
The television we watched 50 plus years ago was far less slick and sophisticated than the fast paced programming of today. In fact, some of that very early programming had no pace at all. The early 1950s marked that brief span of time when it was still possible to turn on the TV set sometime during the day and see – a test pattern. No 24 hour newscasts, no reality shows, no high speed car chases. No movement of any kind. Just a still image and an audio tone.
…ooooooooooooooooooooooooooooooooooooooooooooooooooooooo…
Then as now, when you watched television you watched the story. You invested yourself in good guys and bad guys as each successive 15 to 60 minute television show paraded by. When you watched the Test Pattern you watched Television, the electronic medium itself. TV was a major force even in its immature state. No other innovations
had both a room and a dinner named after them. Sometimes you sat in the TV room, balancing that TV dinner on your lap, just watching – waiting for something to happen.
…ooooooo-klik (pause) “Hello, and welcome to another broadcast day. If you can see this picture, please call our studios. Just dial KL5-4343.”
Page 3
The great grand-daddy of all TV test patterns – the one most of us remember, was created by RCA engineers in 1939, and was dubbed “The Indian Head Test Pattern”. Through the 50s this purely technical illustration became an icon of the nascent television industry. Almost every waking hour of every day someone somewhere was transmitting it. And, yes, someone somewhere else was actually watching it. The TV shop on Main St. needed a signal to show that the TV sets in the showroom actually worked. The repair crew out back often used the local TV station’s on-air test pattern to adjust repaired sets. Before World War II the corporate laboratories of RCA, Farnsworth, DuMont, GE and other electronics giants of the day were busy developing the first crude production tools of television. All through the 30s there was great technical progress. Engineers were working as true pioneers, charting new territory across a variety of disciplines. The first practical TV cameras were often tested simply by looking at familiar subjects. Staff engineers studied and tweaked video images of each other. Sometimes department store mannequins or porcelain dolls were recruited. They offered more patience under the hot TV lights. However, these subject tests were just that – subjective. Televising a co-worker or a china doll setup couldn’t provide precise data to accurately measure an experimental TV system’s performance in technical terms such as luminance amplitude, scanning linearity and frequency response.
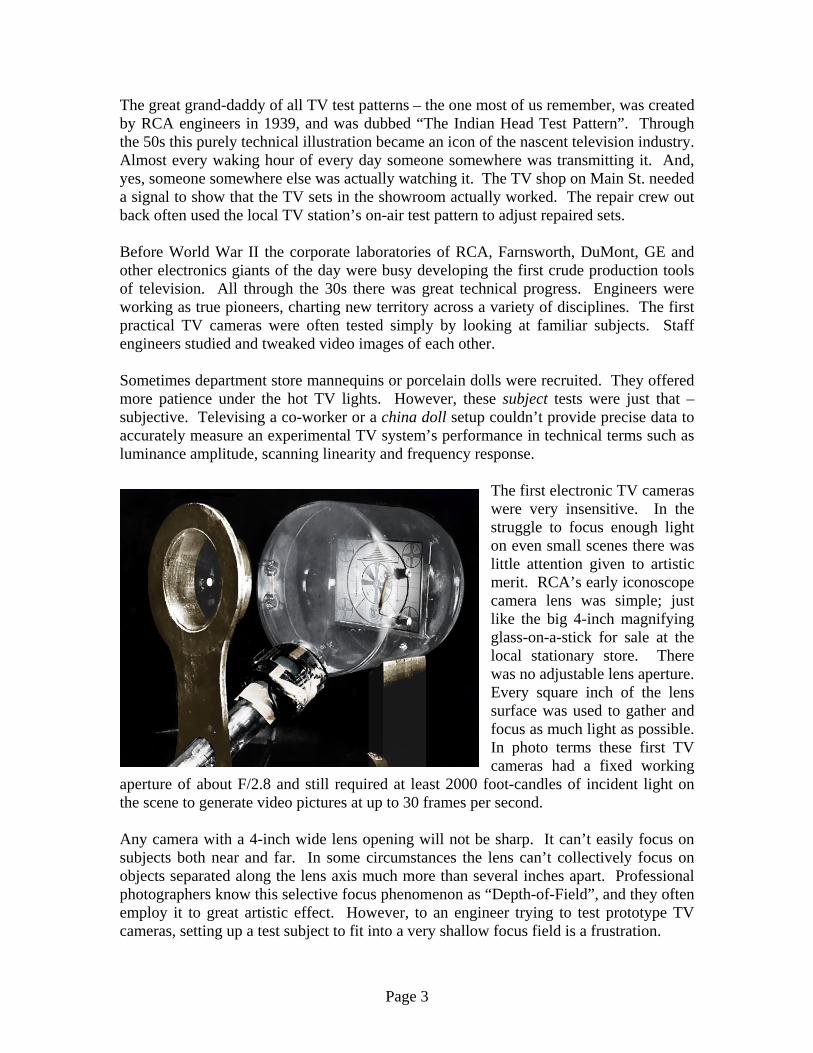
The first electronic TV cameras were very insensitive. In the struggle to focus enough light on even small scenes there was little attention given to artistic merit. RCA’s early iconoscope camera lens was simple; just like the big 4-inch magnifying glass-on-a-stick for sale at the local stationary store. There was no adjustable lens aperture. Every square inch of the lens surface was used to gather and focus as much light as possible. In photo terms these first TV cameras had a fixed working
aperture of about F/2.8 and still required at least 2000 foot-candles of incident light on the scene to generate video pictures at up to 30 frames per second. Any camera with a 4-inch wide lens opening will not be sharp. It can’t easily focus on subjects both near and far. In some circumstances the lens can’t collectively focus on objects separated along the lens axis much more than several inches apart. Professional photographers know this selective focus phenomenon as “Depth-of-Field”, and they often employ it to great artistic effect. However, to an engineer trying to test prototype TV cameras, setting up a test subject to fit into a very shallow focus field is a frustration.
Page 4
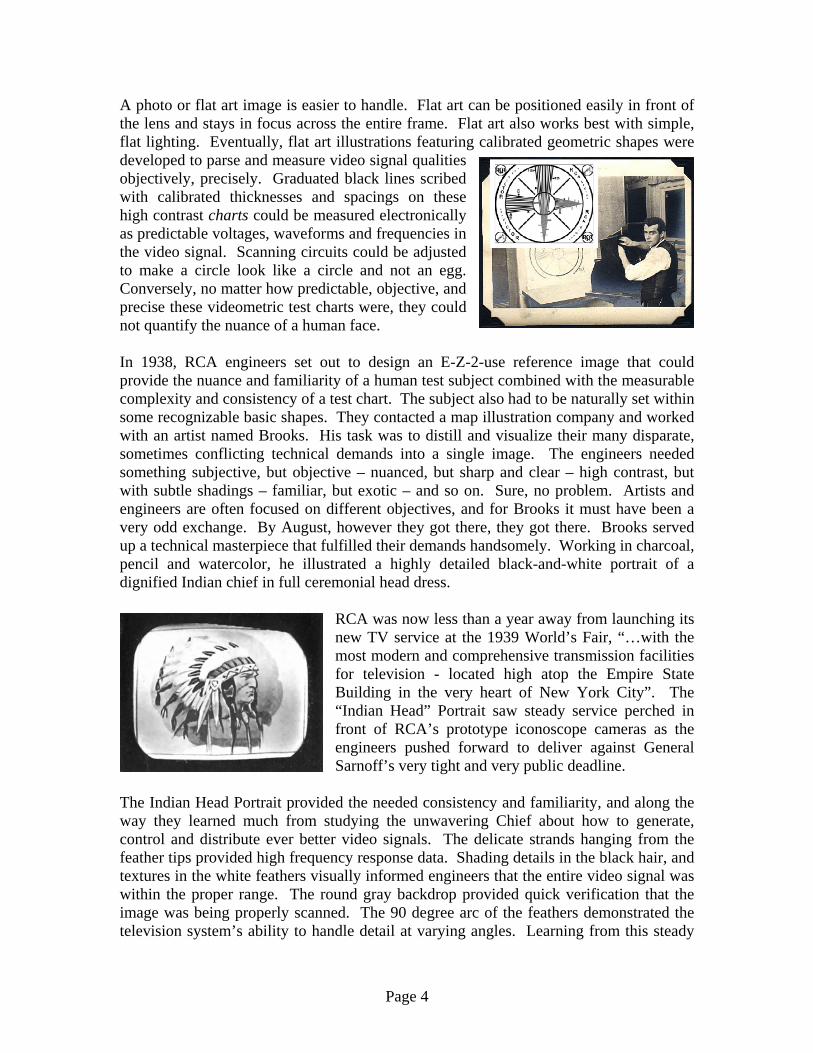
A photo or flat art image is easier to handle. Flat art can be positioned easily in front of the lens and stays in focus across the entire frame. Flat art also works best with simple, flat lighting. Eventually, flat art illustrations featuring calibrated geometric shapes were developed to parse and measure video signal qualities objectively, precisely. Graduated black lines scribed with calibrated thicknesses and spacings on these high contrast charts could be measured electronically as predictable voltages, waveforms and frequencies in the video signal. Scanning circuits could be adjusted to make a circle look like a circle and not an egg. Conversely, no matter how predictable, objective, and precise these videometric test charts were, they could not quantify the nuance of a human face. In 1938, RCA engineers set out to design an E-Z-2-use reference image that could provide the nuance and familiarity of a human test subject combined with the measurable complexity and consistency of a test chart. The subject also had to be naturally set within some recognizable basic shapes. They contacted a map illustration company and worked with an artist named Brooks. His task was to distill and visualize their many disparate, sometimes conflicting technical demands into a single image. The engineers needed something subjective, but objective – nuanced, but sharp and clear – high contrast, but with subtle shadings – familiar, but exotic – and so on. Sure, no problem. Artists and engineers are often focused on different objectives, and for Brooks it must have been a very odd exchange. By August, however they got there, they got there. Brooks served up a technical masterpiece that fulfilled their demands handsomely. Working in charcoal, pencil and watercolor, he illustrated a highly detailed black-and-white portrait of a dignified Indian chief in full ceremonial head dress.
RCA was now less than a year away from launching its new TV service at the 1939 World’s Fair, “…with the most modern and comprehensive transmission facilities for television - located high atop the Empire State Building in the very heart of New York City”. The “Indian Head” Portrait saw steady service perched in front of RCA’s prototype iconoscope cameras as the engineers pushed forward to deliver against General Sarnoff’s very tight and very public deadline.
The Indian Head Portrait provided the needed consistency and familiarity, and along the way they learned much from studying the unwavering Chief about how to generate, control and distribute ever better video signals. The delicate strands hanging from the feather tips provided high frequency response data. Shading details in the black hair, and textures in the white feathers visually informed engineers that the entire video signal was within the proper range. The round gray backdrop provided quick verification that the image was being properly scanned. The 90 degree arc of the feathers demonstrated the television system’s ability to handle detail at varying angles. Learning from this steady
Page 5
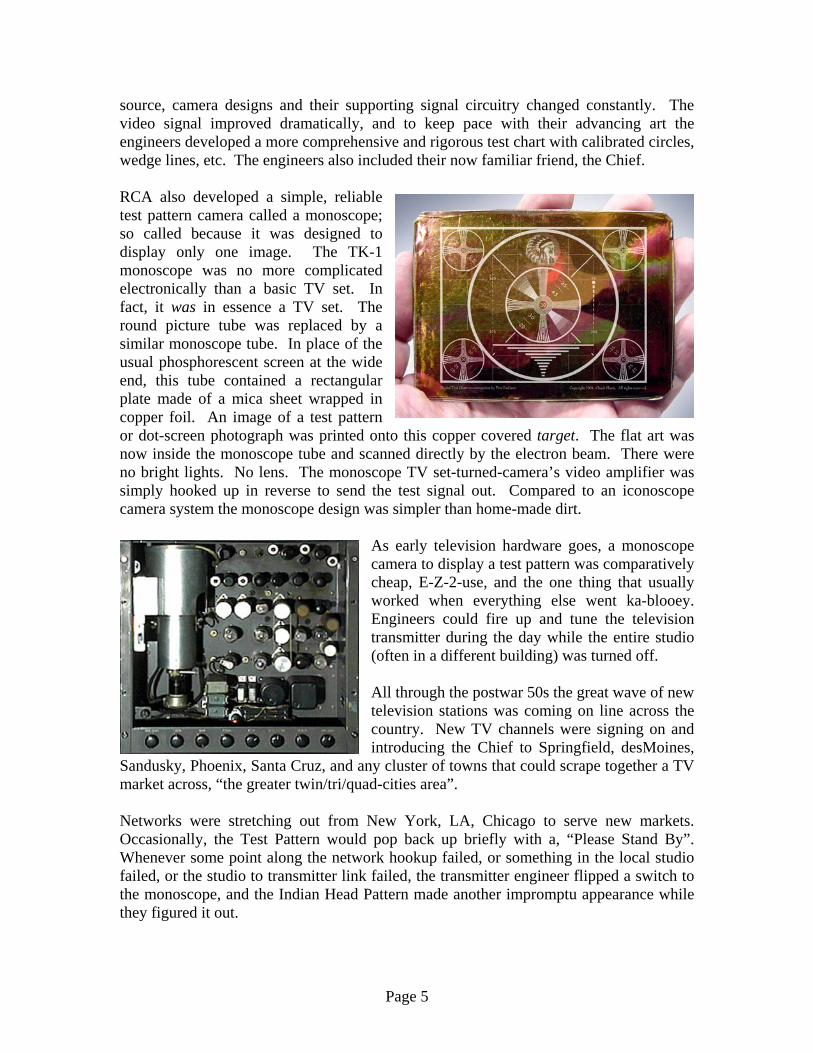
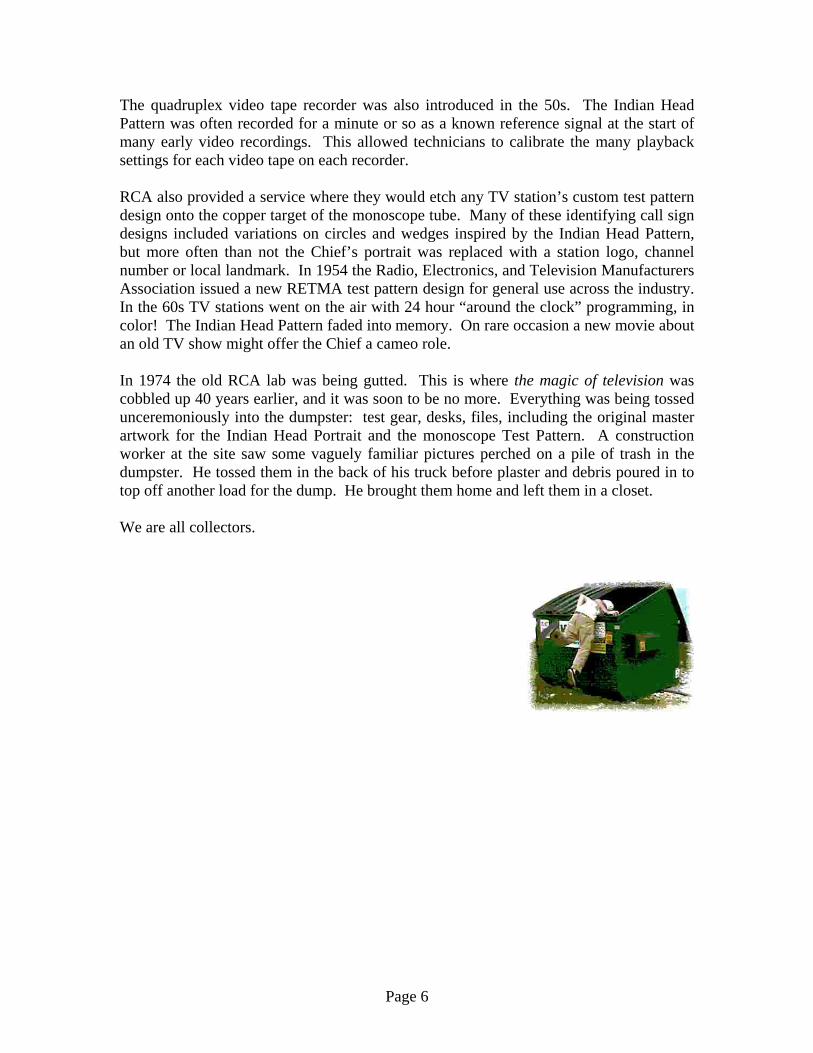
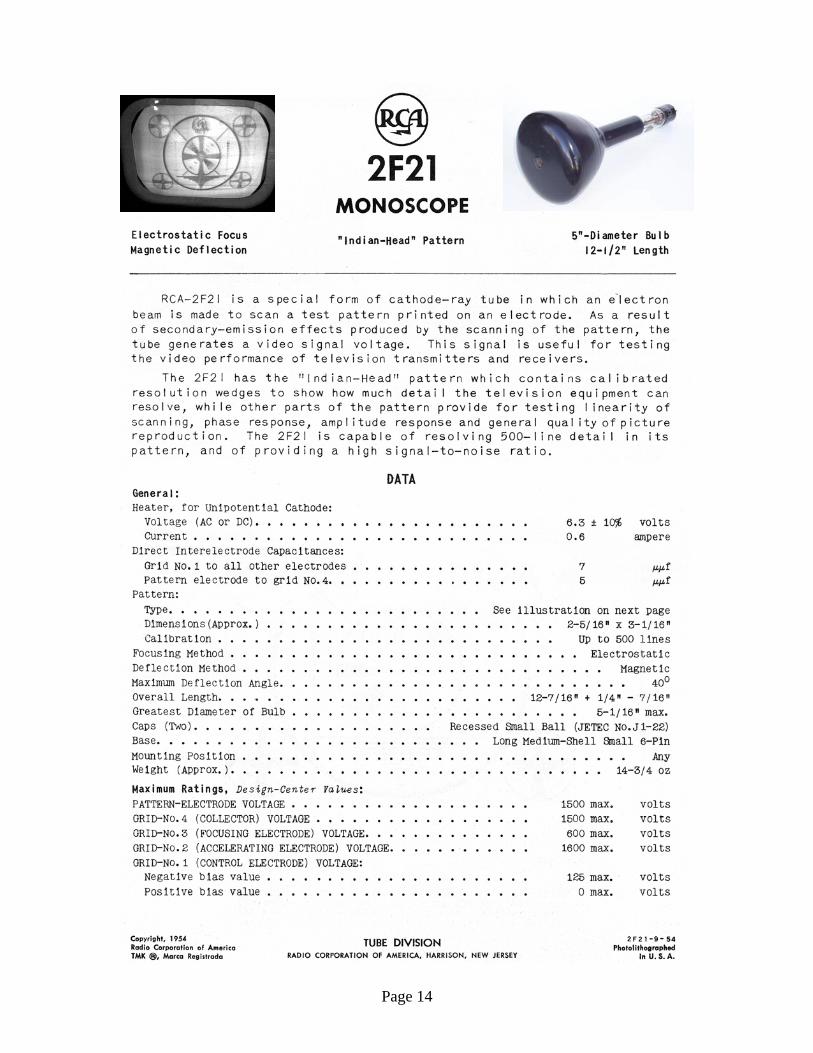
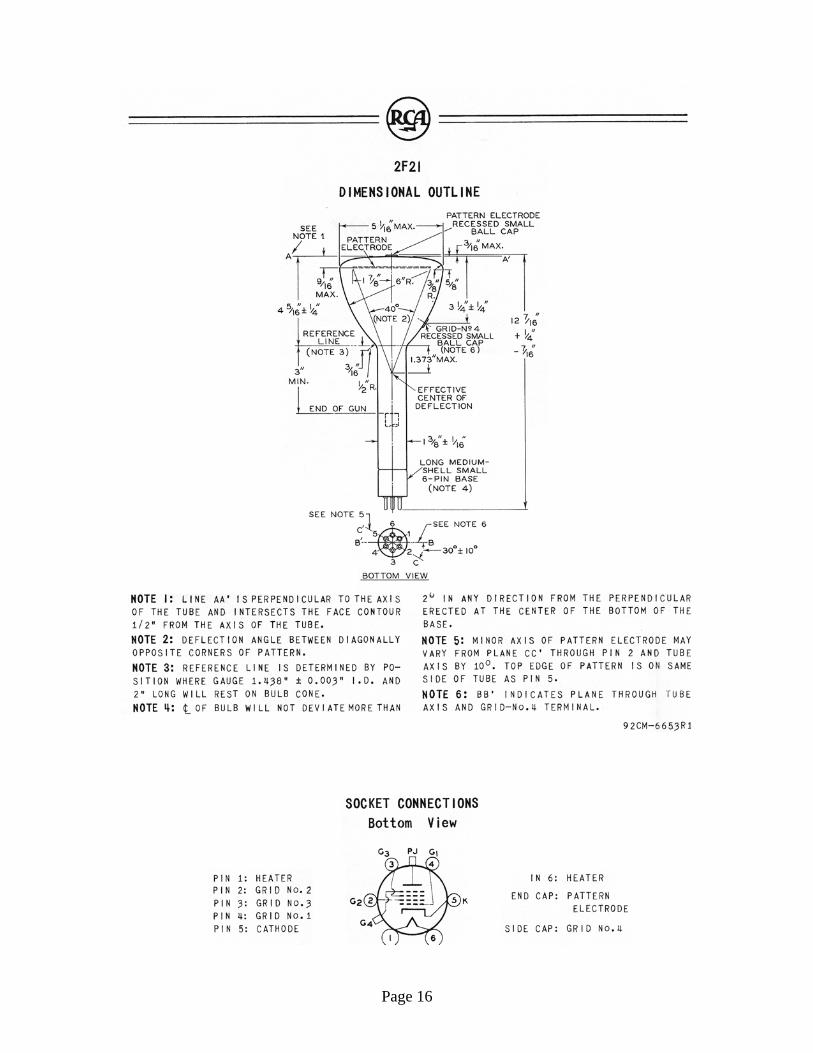
source, camera designs and their supporting signal circuitry changed constantly. The video signal improved dramatically, and to keep pace with their advancing art the engineers developed a more comprehensive and rigorous test chart with calibrated circles, wedge lines, etc. The engineers also included their now familiar friend, the Chief. RCA also developed a simple, reliable test pattern camera called a monoscope; so called because it was designed to display only one image. The TK-1 monoscope was no more complicated electronically than a basic TV set. In fact, it was in essence a TV set. The round picture tube was replaced by a similar monoscope tube. In place of the usual phosphorescent screen at the wide end, this tube contained a rectangular plate made of a mica sheet wrapped in copper foil. An image of a test pattern or dot-screen photograph was printed onto this copper covered target. The flat art was now inside the monoscope tube and scanned directly by the electron beam. There were no bright lights. No lens. The monoscope TV set-turned-camera’s video amplifier was simply hooked up in reverse to send the test signal out. Compared to an iconoscope camera system the monoscope design was simpler than home-made dirt.
As early television hardware goes, a monoscope camera to display a test pattern was comparatively cheap, E-Z-2-use, and the one thing that usually worked when everything else went ka-blooey. Engineers could fire up and tune the television transmitter during the day while the entire studio (often in a different building) was turned off. All through the postwar 50s the great wave of new television stations was coming on line across the country. New TV channels were signing on and introducing the Chief to Springfield, desMoines,
Sandusky, Phoenix, Santa Cruz, and any cluster of towns that could scrape together a TV market across, “the greater twin/tri/quad-cities area”. Networks were stretching out from New York, LA, Chicago to serve new markets. Occasionally, the Test Pattern would pop back up briefly with a, “Please Stand By”. Whenever some point along the network hookup failed, or something in the local studio failed, or the studio to transmitter link failed, the transmitter engineer flipped a switch to the monoscope, and the Indian Head Pattern made another impromptu appearance while they figured it out.
Page 6
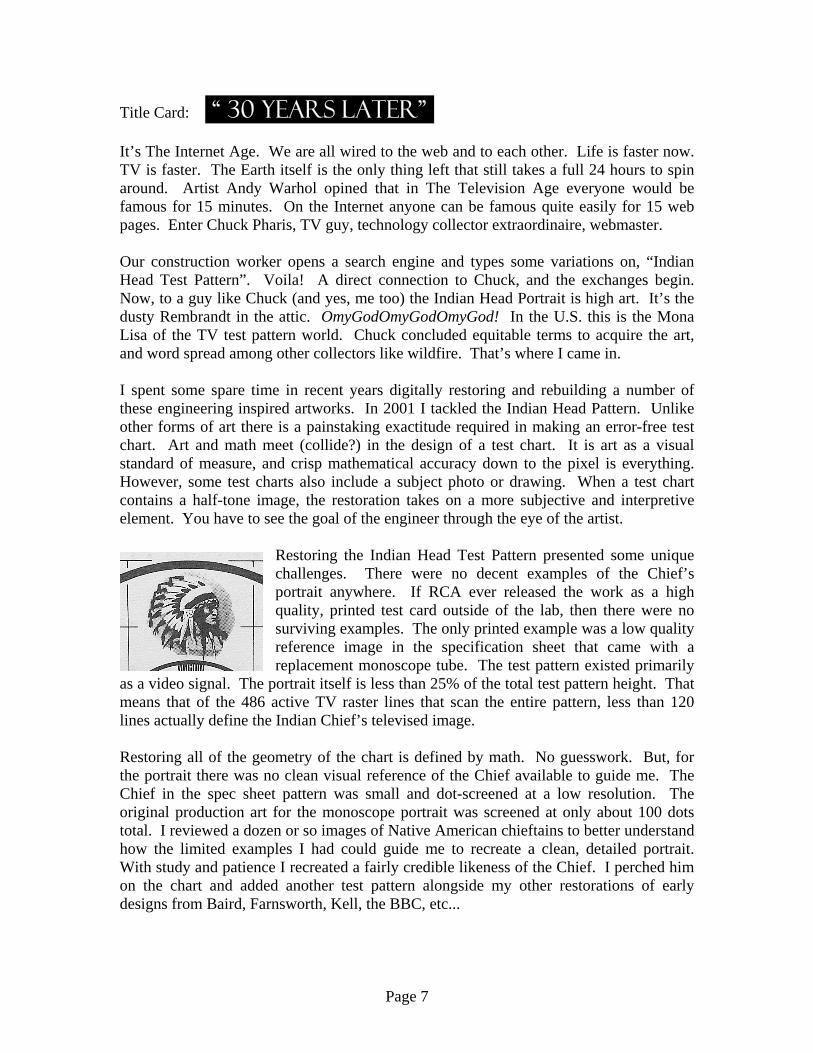
The quadruplex video tape recorder was also introduced in the 50s. The Indian Head Pattern was often recorded for a minute or so as a known reference signal at the start of many early video recordings. This allowed technicians to calibrate the many playback settings for each video tape on each recorder. RCA also provided a service where they would etch any TV station’s custom test pattern design onto the copper target of the monoscope tube. Many of these identifying call sign designs included variations on circles and wedges inspired by the Indian Head Pattern, but more often than not the Chief’s portrait was replaced with a station logo, channel number or local landmark. In 1954 the Radio, Electronics, and Television Manufacturers Association issued a new RETMA test pattern design for general use across the industry. In the 60s TV stations went on the air with 24 hour “around the clock” programming, in color! The Indian Head Pattern faded into memory. On rare occasion a new movie about an old TV show might offer the Chief a cameo role. In 1974 the old RCA lab was being gutted. This is where the magic of television was cobbled up 40 years earlier, and it was soon to be no more. Everything was being tossed unceremoniously into the dumpster: test gear, desks, files, including the original master artwork for the Indian Head Portrait and the monoscope Test Pattern. A construction worker at the site saw some vaguely familiar pictures perched on a pile of trash in the dumpster. He tossed them in the back of his truck before plaster and debris poured in to top off another load for the dump. He brought them home and left them in a closet. We are all collectors.
Page 7
Title Card: “ 30 Years Later”.. It’s The Internet Age. We are all wired to the web and to each other. Life is faster now. TV is faster. The Earth itself is the only thing left that still takes a full 24 hours to spin around. Artist Andy Warhol opined that in The Television Age everyone would be famous for 15 minutes. On the Internet anyone can be famous quite easily for 15 web pages. Enter Chuck Pharis, TV guy, technology collector extraordinaire, webmaster. Our construction worker opens a search engine and types some variations on, “Indian Head Test Pattern”. Voila! A direct connection to Chuck, and the exchanges begin. Now, to a guy like Chuck (and yes, me too) the Indian Head Portrait is high art. It’s the dusty Rembrandt in the attic. OmyGodOmyGodOmyGod! In the U.S. this is the Mona Lisa of the TV test pattern world. Chuck concluded equitable terms to acquire the art, and word spread among other collectors like wildfire. That’s where I came in. I spent some spare time in recent years digitally restoring and rebuilding a number of these engineering inspired artworks. In 2001 I tackled the Indian Head Pattern. Unlike other forms of art there is a painstaking exactitude required in making an error-free test chart. Art and math meet (collide?) in the design of a test chart. It is art as a visual standard of measure, and crisp mathematical accuracy down to the pixel is everything. However, some test charts also include a subject photo or drawing. When a test chart contains a half-tone image, the restoration takes on a more subjective and interpretive element. You have to see the goal of the engineer through the eye of the artist.
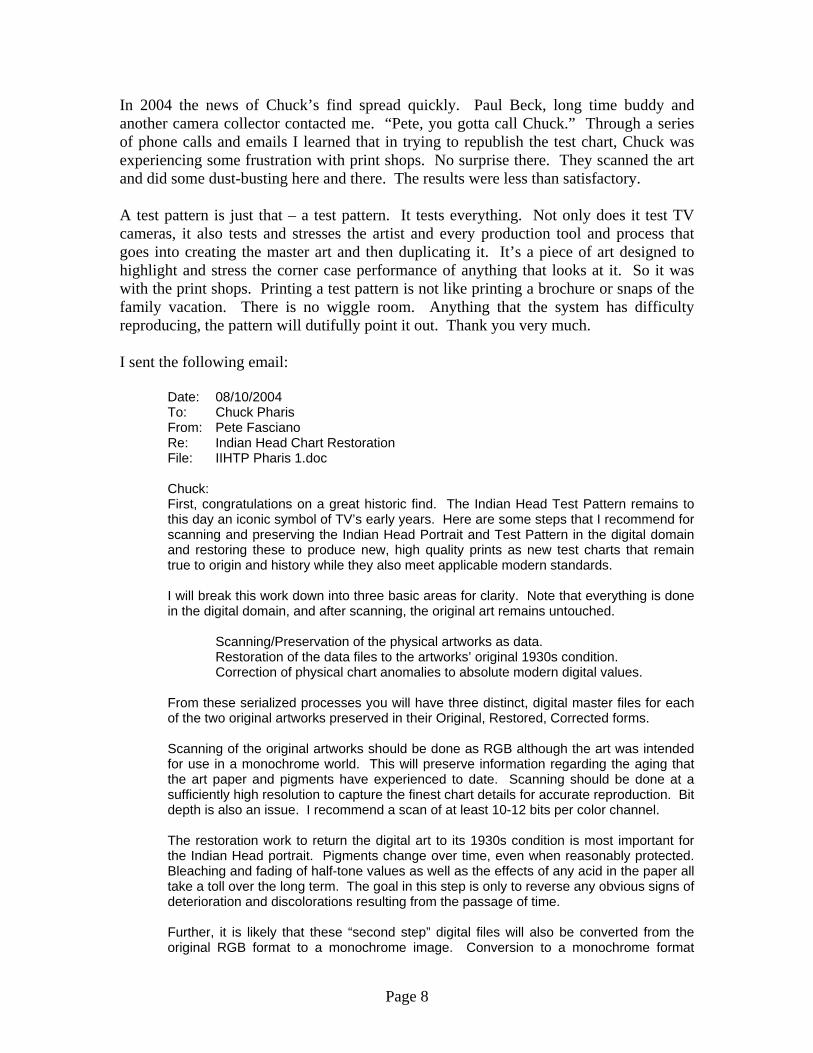
Restoring the Indian Head Test Pattern presented some unique challenges. There were no decent examples of the Chief’s portrait anywhere. If RCA ever released the work as a high quality, printed test card outside of the lab, then there were no surviving examples. The only printed example was a low quality reference image in the specification sheet that came with a replacement monoscope tube. The test pattern existed primarily
as a video signal. The portrait itself is less than 25% of the total test pattern height. That means that of the 486 active TV raster lines that scan the entire pattern, less than 120 lines actually define the Indian Chief’s televised image. Restoring all of the geometry of the chart is defined by math. No guesswork. But, for the portrait there was no clean visual reference of the Chief available to guide me. The Chief in the spec sheet pattern was small and dot-screened at a low resolution. The original production art for the monoscope portrait was screened at only about 100 dots total. I reviewed a dozen or so images of Native American chieftains to better understand how the limited examples I had could guide me to recreate a clean, detailed portrait. With study and patience I recreated a fairly credible likeness of the Chief. I perched him on the chart and added another test pattern alongside my other restorations of early designs from Baird, Farnsworth, Kell, the BBC, etc...
Page 8
In 2004 the news of Chuck’s find spread quickly. Paul Beck, long time buddy and another camera collector contacted me. “Pete, you gotta call Chuck.” Through a series of phone calls and emails I learned that in trying to republish the test chart, Chuck was experiencing some frustration with print shops. No surprise there. They scanned the art and did some dust-busting here and there. The results were less than satisfactory. A test pattern is just that – a test pattern. It tests everything. Not only does it test TV cameras, it also tests and stresses the artist and every production tool and process that goes into creating the master art and then duplicating it. It’s a piece of art designed to highlight and stress the corner case performance of anything that looks at it. So it was with the print shops. Printing a test pattern is not like printing a brochure or snaps of the family vacation. There is no wiggle room. Anything that the system has difficulty reproducing, the pattern will dutifully point it out. Thank you very much. I sent the following email:
Date: 08/10/2004 To: Chuck Pharis From: Pete Fasciano Re: Indian Head Chart Restoration File: IIHTP Pharis 1.doc Chuck: First, congratulations on a great historic find. The Indian Head Test Pattern remains to this day an iconic symbol of TV’s early years. Here are some steps that I recommend for scanning and preserving the Indian Head Portrait and Test Pattern in the digital domain and restoring these to produce new, high quality prints as new test charts that remain true to origin and history while they also meet applicable modern standards. I will break this work down into three basic areas for clarity. Note that everything is done in the digital domain, and after scanning, the original art remains untouched.
Scanning/Preservation of the physical artworks as data. Restoration of the data files to the artworks’ original 1930s condition. Correction of physical chart anomalies to absolute modern digital values.
From these serialized processes you will have three distinct, digital master files for each of the two original artworks preserved in their Original, Restored, Corrected forms. Scanning of the original artworks should be done as RGB although the art was intended for use in a monochrome world. This will preserve information regarding the aging that the art paper and pigments have experienced to date. Scanning should be done at a sufficiently high resolution to capture the finest chart details for accurate reproduction. Bit depth is also an issue. I recommend a scan of at least 10-12 bits per color channel. The restoration work to return the digital art to its 1930s condition is most important for the Indian Head portrait. Pigments change over time, even when reasonably protected. Bleaching and fading of half-tone values as well as the effects of any acid in the paper all take a toll over the long term. The goal in this step is only to reverse any obvious signs of deterioration and discolorations resulting from the passage of time. Further, it is likely that these “second step” digital files will also be converted from the original RGB format to a monochrome image. Conversion to a monochrome format
Page 9
might be performed later as the final step. An inspection of the physical art will give me some indication as to what the best course would be. Finally, there is the correction of physical chart anomalies to absolute digital values. Early test charts were meticulously created by hand, but do contain minute errors. These are in the form of lines and scores that might be positioned slightly off, or densitometric target gray values in the artwork that should be set to an equivalent absolute digital value, etc. These minor issues can be corrected easily in the digital domain. The final result will be a digitally perfected representation of the original art precisely as the creators intended, but which achieves tighter linearity, frequency and density tolerances than were possible in the 1930s. Prints made from this master file will fulfill all modern standards and expectations for actual use in the field as true test standards. In replicating the images the paper/card stock should be an acid-free, 90% reflective, spectrally neutral matte finish. It might be appropriate to print the Indian Head Portrait in color, but the test pattern should be printed with a monochromatic black ink. Again, an inspection of the original art will indicate what might be best. There will also be target print densities to monitor for the concentric circles that make up the test chart gray scale. Chuck, as we have discussed, I’ve already digitally restored a number of historic test charts from the U.S., England and Japan. All of these have gone through painstaking steps to preserve the accuracy of the original designs while also considering how these should be best represented in modern digital and photometric terms. I am offering to help in meticulously restoring and preserving these important works. I look forward to reviewing the original art and perhaps making further recommendations. My best regards. Pete
We met at Chuck’s place north of LA in August. He showed me the original art, and I could see that there was some pigment deterioration in the portrait, but nothing irreversible. Otherwise, the originals were in decent condition. I discovered one surprise. The grayscale wedges were not actually shades of gray at all. They were very finely scribed concentric rings of white and black. The thickness ratio of white to black (the duty cycle) determined the overall brightness. It turns out that the monoscope tube had difficulty generating accurate half-tones, and the engineers cleverly controlled the luminance signal (grays) by varying the white/black thicknesses of the very closely spaced lines which were smaller than the scanning beam’s electronic circle of confusion. Cute trick. What we all saw at home were steps of gray. Who knew? Recreating these fine circular lines accurately in exactly the right white/black thickness ratios was not going to be easy. It became clear to me that another reason why the engineers took this approach to describing specific gray values is that the accuracy of the photometric and print processes of the day was limited at best. Using an orthographic technique to express a desired gray as a black/white ratio was a clever way to more accurately maintain that gray through the reproduction processes. What other secrets did the artwork have?
Page 10
Chuck and I talked cameras and memories. I fired up my laptop and took him through a quick tour of some of my restoration work to date. Conveniently, Chuck was scheduled to work an upcoming golf game in New England so we arranged to scan the art at very high resolution in Boston. On Thursday evening, Sept 2nd Paul Beck, Chuck and I met at a professional photo service, and several careful scans later we moved the art cleanly into the digital world. This was the relatively easy part. I spent the first Saturday down-sampling the original art to lower resolution, 300 dpi working proxies. Practicing with these much smaller files would allow me to refine some techniques quickly without having to crunch and slog through the GigaByte-sized original files. By September 23rd I had assessed how best to address most of the task at hand, and brought Chuck some encouraging first samples. We had another detailed discussion about what artifacts and details needed further attention, what the final goals were, and how we could best get there. Plan in place, I then started working with the larger original files, tackling the geometry of the test chart; circles, lines, wedges, etc. I began by building the chart’s 8h x 6v square background grid as the first PhotoShop layer. Placements for all the other geometric elements were tightly aligned to the grid. These were slowly built up in 24 or so more layers. I created most of the chart elements such as the corner circles, the fine resolution lines, the wedges, etc. as separate pieces of art at resolutions 3x higher than the master chart artwork. Working digitally this way is reminiscent of how some of the early charts were first hand drawn as kitchen-table sized illustrations that could be crafted in large scale with great accuracy, and then photo reduced to create production masters.
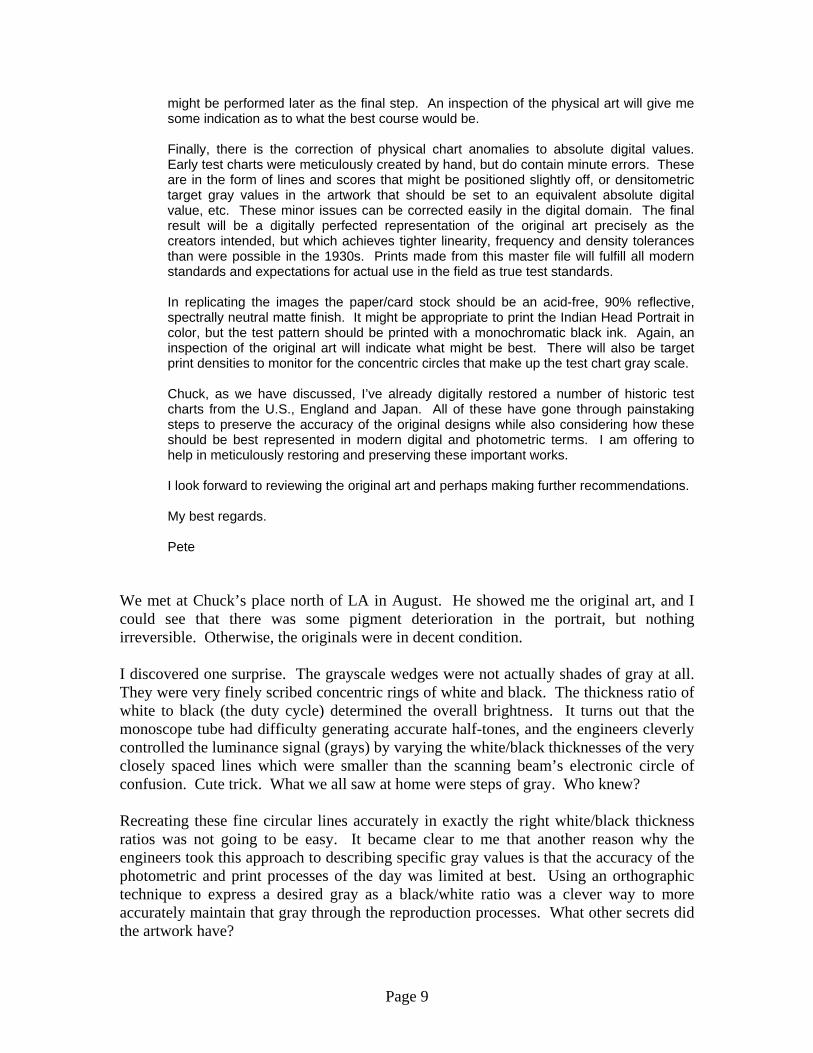
I also constructed the grayscale wedges at 3x the resolution. Once all the black/white circular lines were properly sized to the pixel, spaced and aligned, I cut 2 pie slices for the wedges.
I tested the “grayness” of the 25/50/75% wedge steps by matching them to a digital palette of grays at target values of 63/127/191. As a test, I ran the grayscale wedges through a 100 pixel blur to average the black/white lines to their target gray values. The averaged results were a spot-on match to the digital target values. Logically, you know it should work, but it’s still a pleasant reassurance when it all falls together perfectly. Another challenge was finding the right approach to generate the graduated resolution wedges. Almost all other test charts prior and since incorporated wedges of evenly spaced, converging straight lines to test camera resolution. But, converging straight lines don’t translate directly into a straightforward frequency response through the scanning system. Earlier charts simply marked where known frequencies should be along their linear wedges as a more or less log function scale. The RCA engineers opted to design a new, complex curve wedge where the frequency progression along the wedge could be evenly marked on a linear scale. Clever.
Page 11
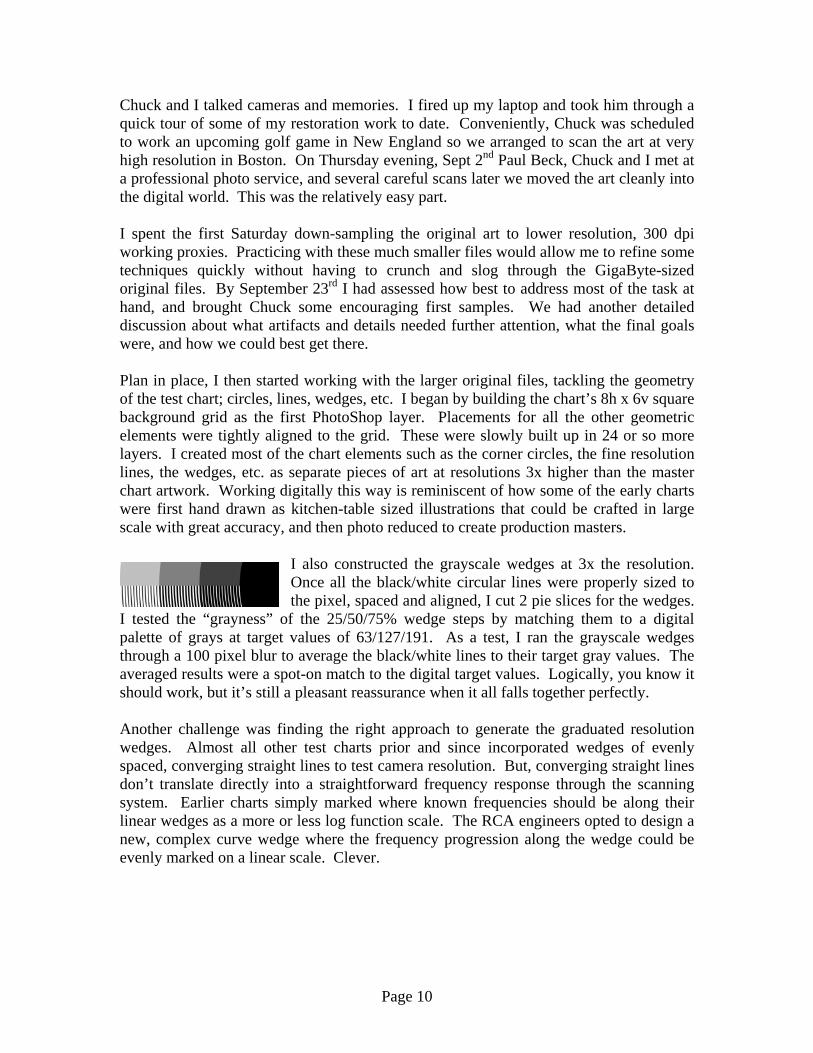
As mentioned, a test chart is where art meets math. I simply worked the problem in reverse. Knowing the desired spacing and target frequencies, I cobbled a visual algorithm that I could
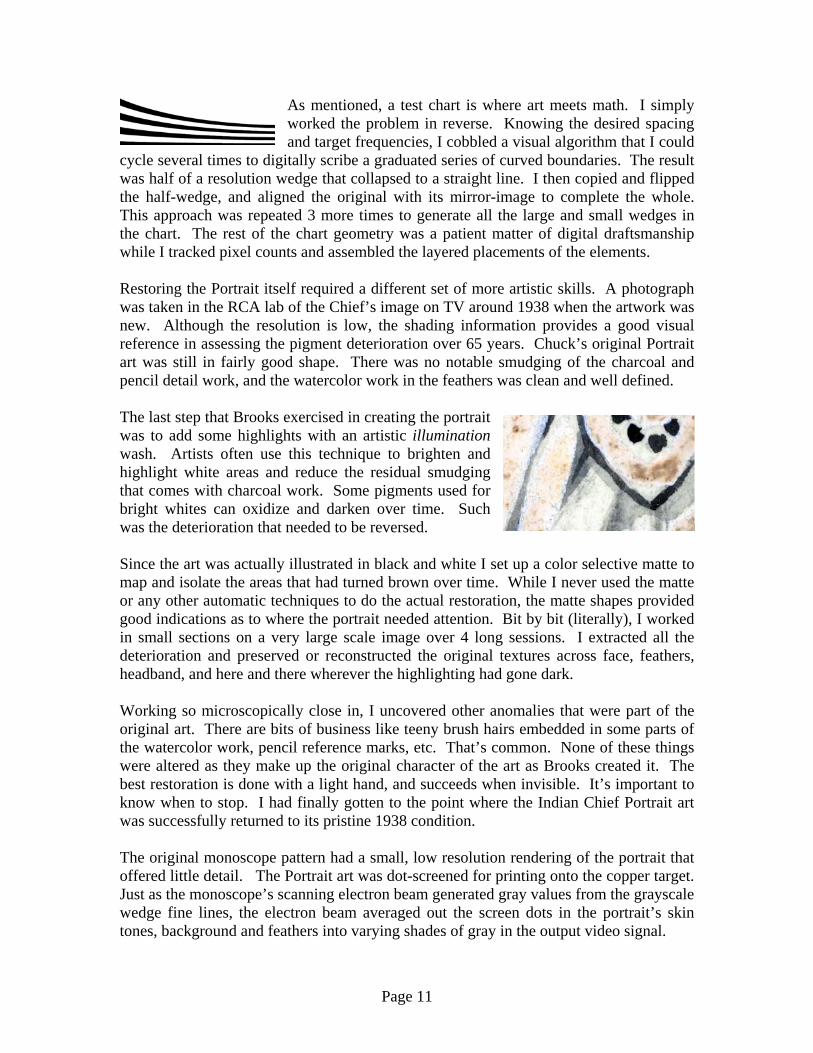
cycle several times to digitally scribe a graduated series of curved boundaries. The result was half of a resolution wedge that collapsed to a straight line. I then copied and flipped the half-wedge, and aligned the original with its mirror-image to complete the whole. This approach was repeated 3 more times to generate all the large and small wedges in the chart. The rest of the chart geometry was a patient matter of digital draftsmanship while I tracked pixel counts and assembled the layered placements of the elements. Restoring the Portrait itself required a different set of more artistic skills. A photograph was taken in the RCA lab of the Chief’s image on TV around 1938 when the artwork was new. Although the resolution is low, the shading information provides a good visual reference in assessing the pigment deterioration over 65 years. Chuck’s original Portrait art was still in fairly good shape. There was no notable smudging of the charcoal and pencil detail work, and the watercolor work in the feathers was clean and well defined. The last step that Brooks exercised in creating the portrait was to add some highlights with an artistic illumination wash. Artists often use this technique to brighten and highlight white areas and reduce the residual smudging that comes with charcoal work. Some pigments used for bright whites can oxidize and darken over time. Such was the deterioration that needed to be reversed. Since the art was actually illustrated in black and white I set up a color selective matte to map and isolate the areas that had turned brown over time. While I never used the matte or any other automatic techniques to do the actual restoration, the matte shapes provided good indications as to where the portrait needed attention. Bit by bit (literally), I worked in small sections on a very large scale image over 4 long sessions. I extracted all the deterioration and preserved or reconstructed the original textures across face, feathers, headband, and here and there wherever the highlighting had gone dark. Working so microscopically close in, I uncovered other anomalies that were part of the original art. There are bits of business like teeny brush hairs embedded in some parts of the watercolor work, pencil reference marks, etc. That’s common. None of these things were altered as they make up the original character of the art as Brooks created it. The best restoration is done with a light hand, and succeeds when invisible. It’s important to know when to stop. I had finally gotten to the point where the Indian Chief Portrait art was successfully returned to its pristine 1938 condition. The original monoscope pattern had a small, low resolution rendering of the portrait that offered little detail. The Portrait art was dot-screened for printing onto the copper target. Just as the monoscope’s scanning electron beam generated gray values from the grayscale wedge fine lines, the electron beam averaged out the screen dots in the portrait’s skin tones, background and feathers into varying shades of gray in the output video signal.
Page 12
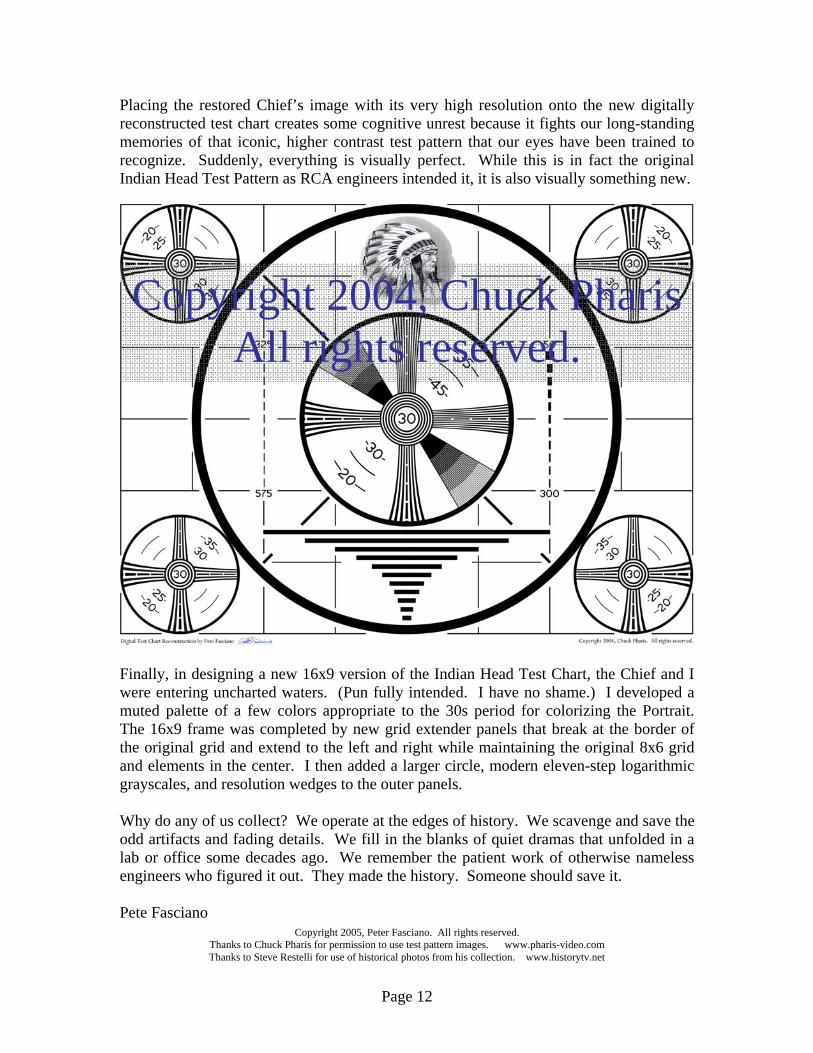
Placing the restored Chief’s image with its very high resolution onto the new digitally reconstructed test chart creates some cognitive unrest because it fights our long-standing memories of that iconic, higher contrast test pattern that our eyes have been trained to recognize. Suddenly, everything is visually perfect. While this is in fact the original Indian Head Test Pattern as RCA engineers intended it, it is also visually something new.
Finally, in designing a new 16x9 version of the Indian Head Test Chart, the Chief and I were entering uncharted waters. (Pun fully intended. I have no shame.) I developed a muted palette of a few colors appropriate to the 30s period for colorizing the Portrait. The 16x9 frame was completed by new grid extender panels that break at the border of the original grid and extend to the left and right while maintaining the original 8x6 grid and elements in the center. I then added a larger circle, modern eleven-step logarithmic grayscales, and resolution wedges to the outer panels. Why do any of us collect? We operate at the edges of history. We scavenge and save the odd artifacts and fading details. We fill in the blanks of quiet dramas that unfolded in a lab or office some decades ago. We remember the patient work of otherwise nameless engineers who figured it out. They made the history. Someone should save it. Pete Fasciano
Copyright 2004, Chuck PharisAll rights reserved.
Copyright 2005, Peter Fasciano. All rights reserved. Thanks to Chuck Pharis for permission to use test pattern images. www.pharis-video.com Thanks to Steve Restelli for use of historical photos from his collection. www.historytv.net
Page 13
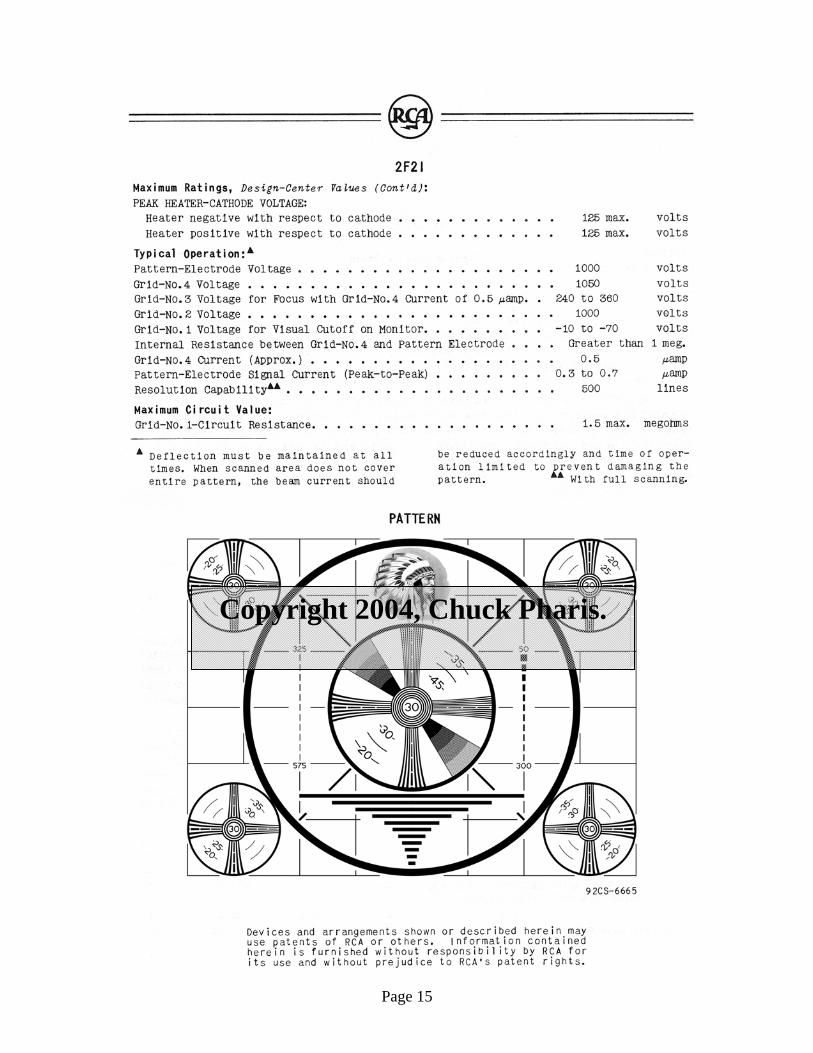
How to use the Indian Head Test Pattern So, what went into the design? What were the RCA engineers measuring and adjusting? Let’s review the individual elements of the chart and how they are used. Through the 30s many experimental systems scanned in a 5x4 aspect ratio. The Indian Head Test Pattern has the standardized NTSC system “M” aspect ratio of 4x3. This is shown clearly by the background grid scribed in 8x6 square units. The large center circle and the four corner circles together with the grid provide a clear visual basis to determine how linearly the horizontal and vertical raster scanning circuits sweep across the chart. Begin by optically positioning the chart; sizing and centering it so that it falls squarely within, and fills most of the iconoscope tube’s target. The chart should be lit evenly from both sides with bright, flat light from 45 degrees to avoid creating hot spots from specular reflections. When the black, gray and white signal levels are properly calibrated the diagonal grayscale wedges should display distinct shades of gray at about 25%, 50%, and 75% of the white level. Note that neither the earliest camera designs nor the monoscope scanner had gamma adjustment circuits. The raster H & V scan edges should be centered electronically to align with the edges of the chart. The iconoscope’s electron gun scans its target at an angle. This generates a pronounced keystone effect. There are a number of scanning and signal modulation adjustments (H & V sawtooth, H & V parabola) required to square up the raster with the chart and remove signal shading errors. The scanning is properly aligned when the large center circle and all four small corner circles appear round and their outer edges are just within the active raster. Overall optical and electron beam focus as well as beam astigmatism may be adjusted by observing the sharpness of the small concentric circles in the chart center as well as those located in the four corners. The raster vertical resolution may be observed along the horizontal wedges. The raster horizontal resolution is observed along the vertical wedges. Add a zero “0” to the wedge numbers to read the scanning resolution in TV lines. The diagonal lines within the center circle serve as a good indicator for proper H scan interlacing for the even-odd fields. The video signal’s low frequency response or tilt may be measured by observing the wide black stripes on the bottom area of the chart. The widest stripe is half of one H active line, or approximately 26 microseconds. The columns of fine lines to the left and right of the center circle may be observed to adjust the video signal’s high frequency response.
Page 14
Page 15
Copyright 2004, Chuck Pharis.
Page 16