Embed Size (px)
Citation preview

Consulting
The Benefits of Store Clustering
7 Garrick StCovent Garden
LondonWC2E 9AR
T - +44 (0)203 051 1375 www.riverheadconsulting.com
Simon SmallwoodDirectorEmail – [email protected] - +44 7786 387793
Page: 2
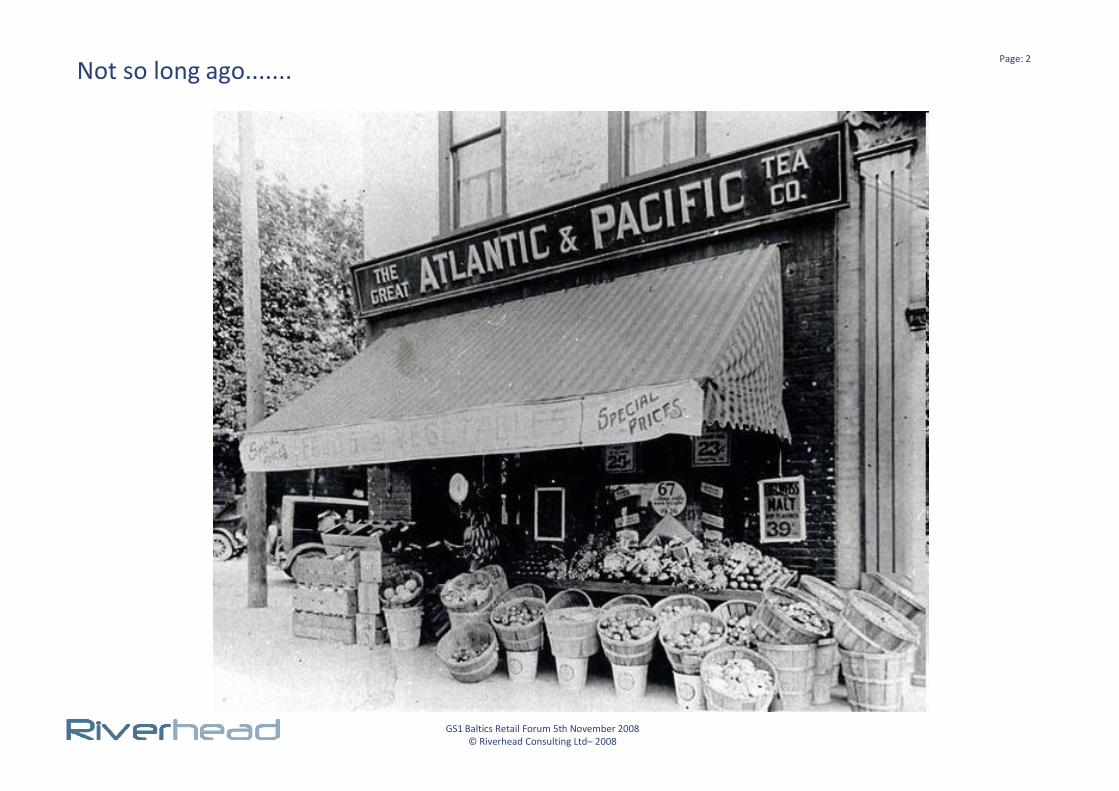
Not so long ago.......
GS1 Baltics Retail Forum 5th November 2008© Riverhead Consulting Ltd– 2008
Page: 3
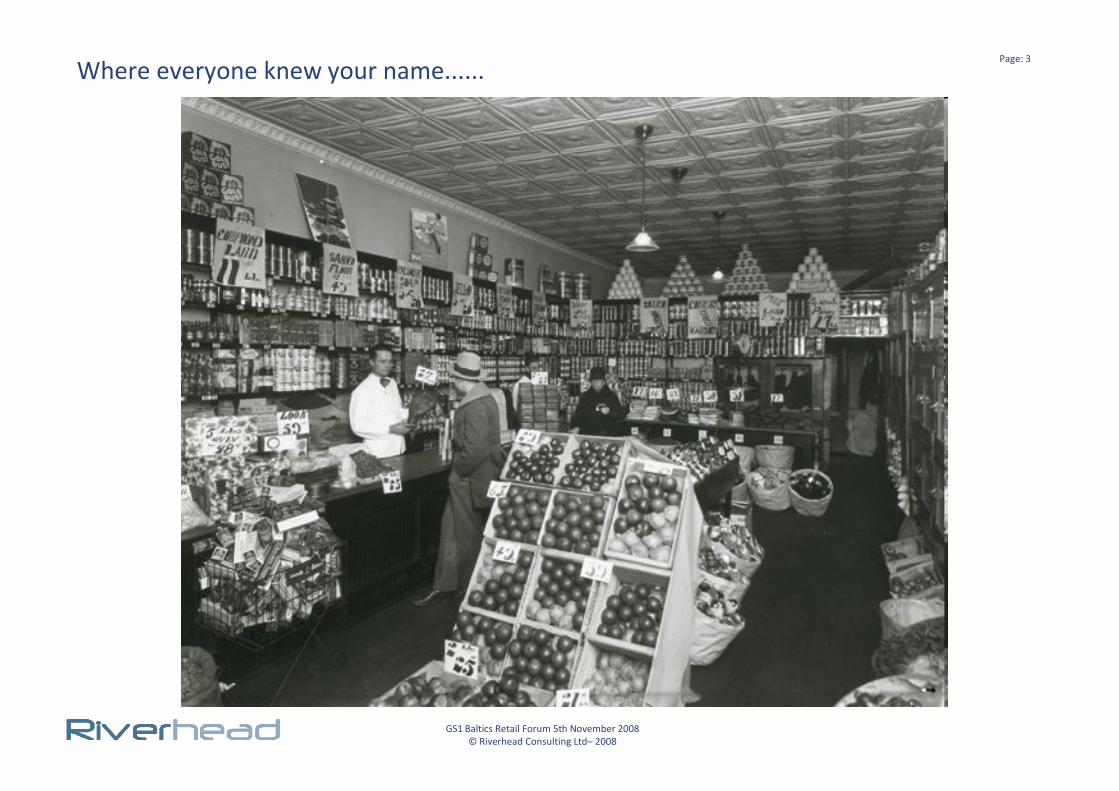
Where everyone knew your name......
GS1 Baltics Retail Forum 5th November 2008© Riverhead Consulting Ltd– 2008
Page: 4
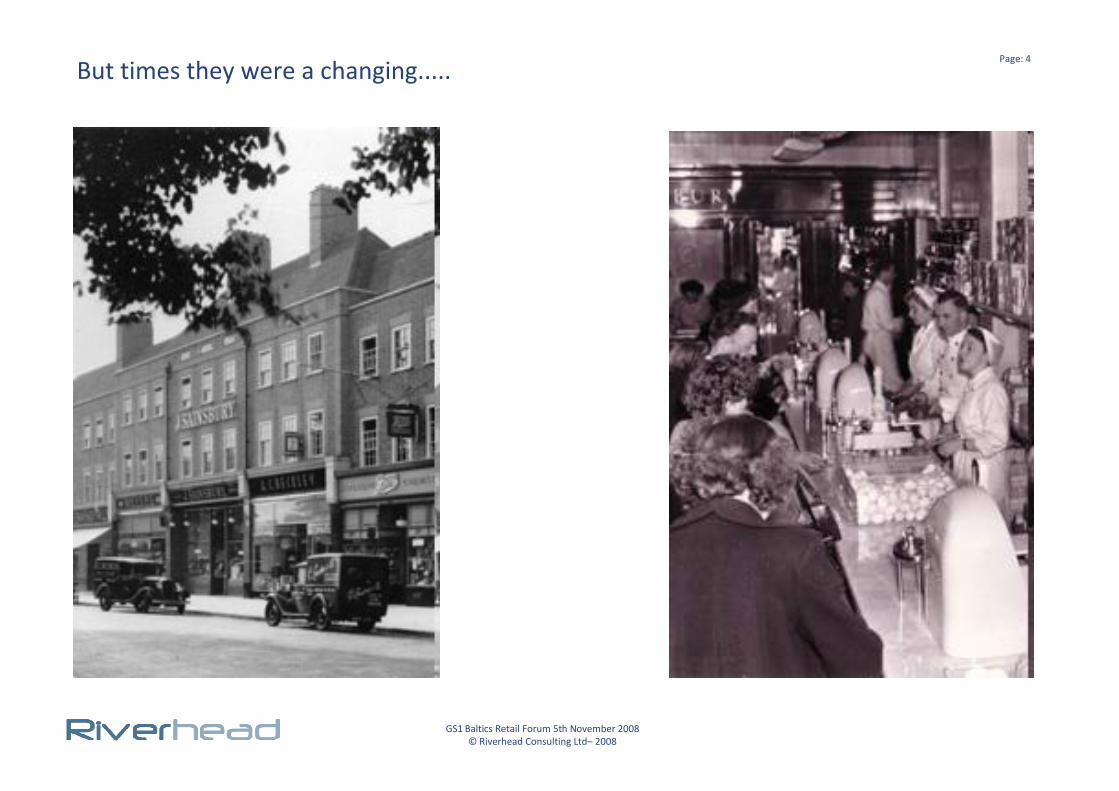
But times they were a changing.....
GS1 Baltics Retail Forum 5th November 2008© Riverhead Consulting Ltd– 2008
Page: 5
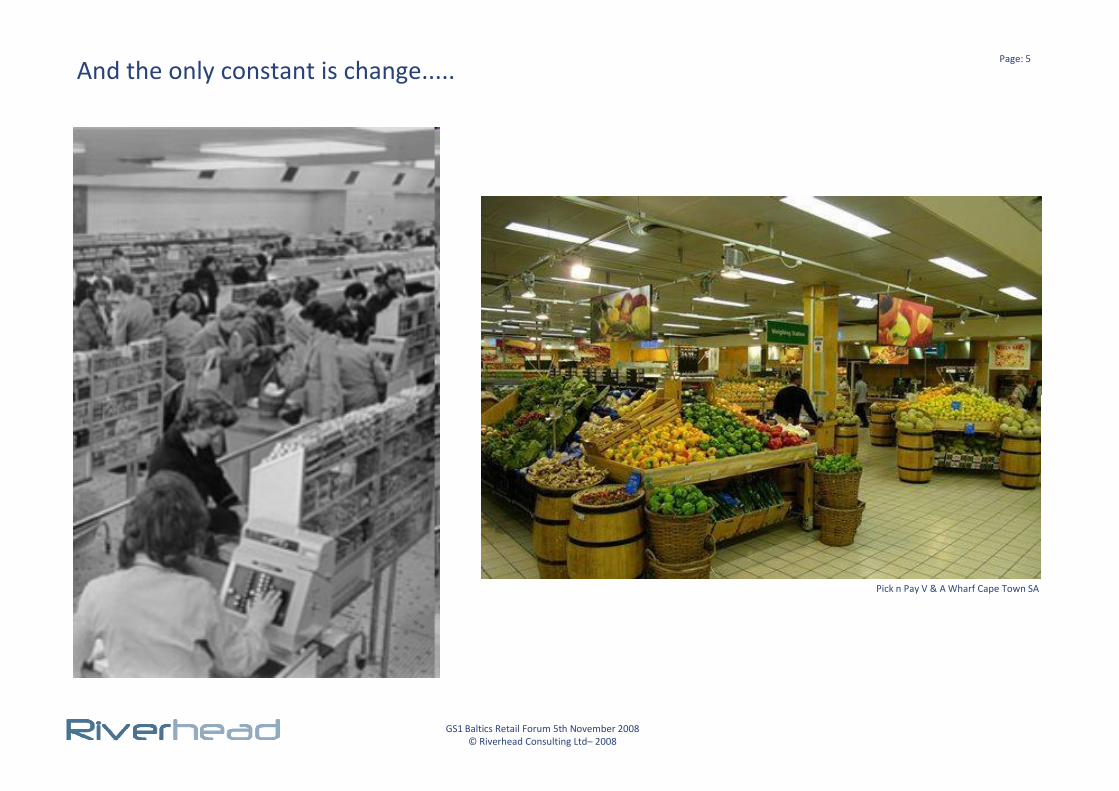
And the only constant is change.....
GS1 Baltics Retail Forum 5th November 2008© Riverhead Consulting Ltd– 2008
Pick n Pay V & A Wharf Cape Town SA

Page: 6
Mass Merchandise, Mass Market, Mass Range, Mass Inventory...
GS1 Baltics Retail Forum 5th November 2008© Riverhead Consulting Ltd– 2008
Page: 7
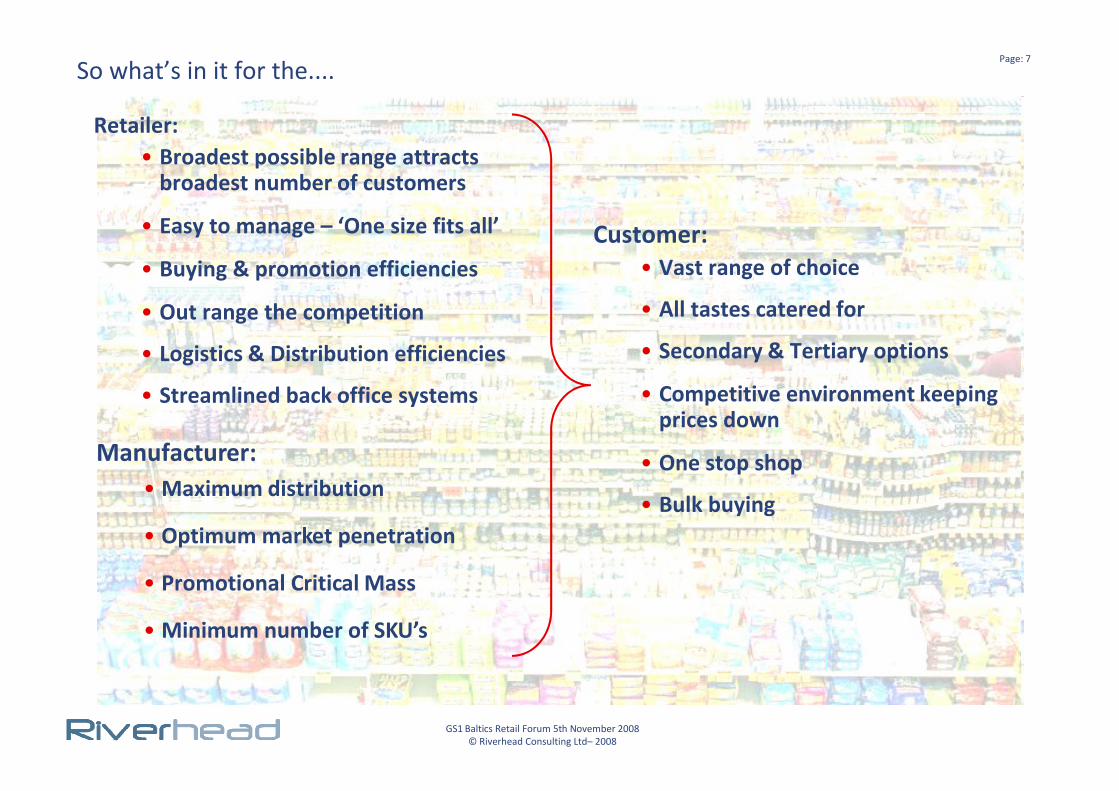
So what’s in it for the....
Retailer:• Broadest possible range attracts
broadest number of customers
• Easy to manage – ‘One size fits all’
• Buying & promotion efficiencies
• Out range the competition
• Logistics & Distribution efficiencies
• Streamlined back office systems
Customer:• Vast range of choice
• All tastes catered for
• Secondary & Tertiary options
• Competitive environment keeping
GS1 Baltics Retail Forum 5th November 2008© Riverhead Consulting Ltd– 2008
• Streamlined back office systems • Competitive environment keeping prices down
• One stop shop
• Bulk buying
Manufacturer:• Maximum distribution
• Optimum market penetration
• Promotional Critical Mass
• Minimum number of SKU’s
Page: 8
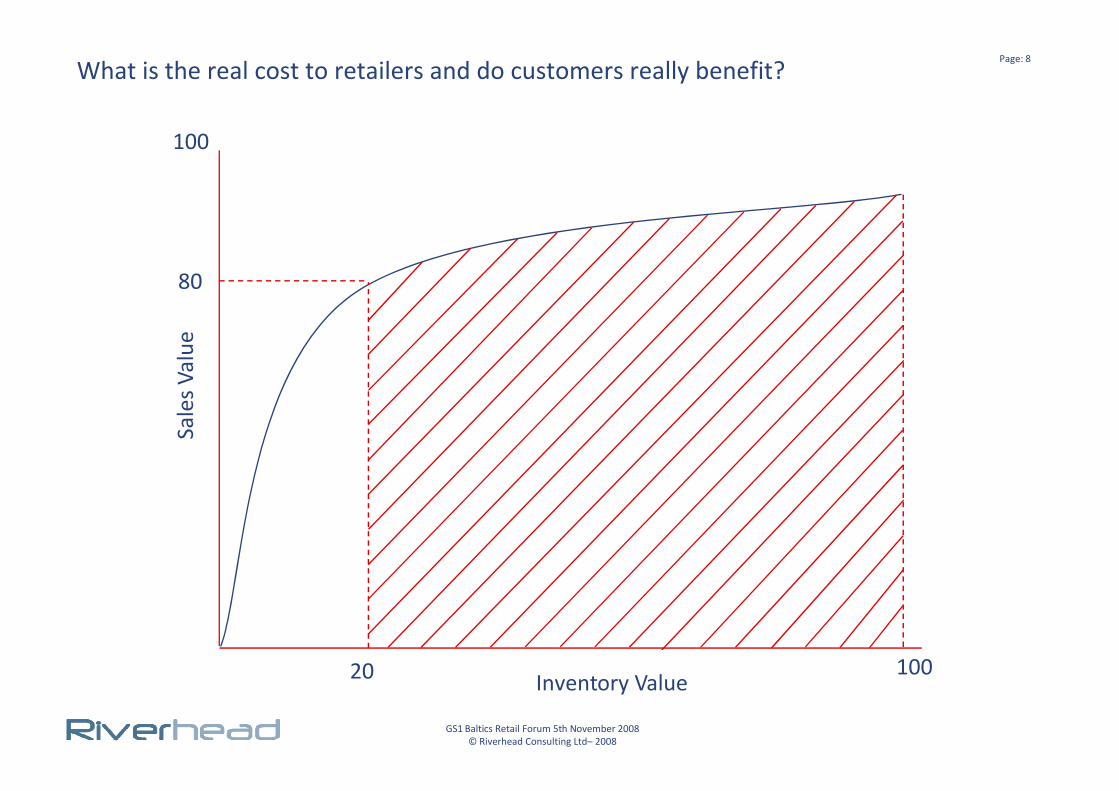
What is the real cost to retailers and do customers really benefit?
80
100
Sale
s Va
lue
GS1 Baltics Retail Forum 5th November 2008© Riverhead Consulting Ltd– 2008
20 100
Sale
s Va
lue
Inventory Value
Page: 9
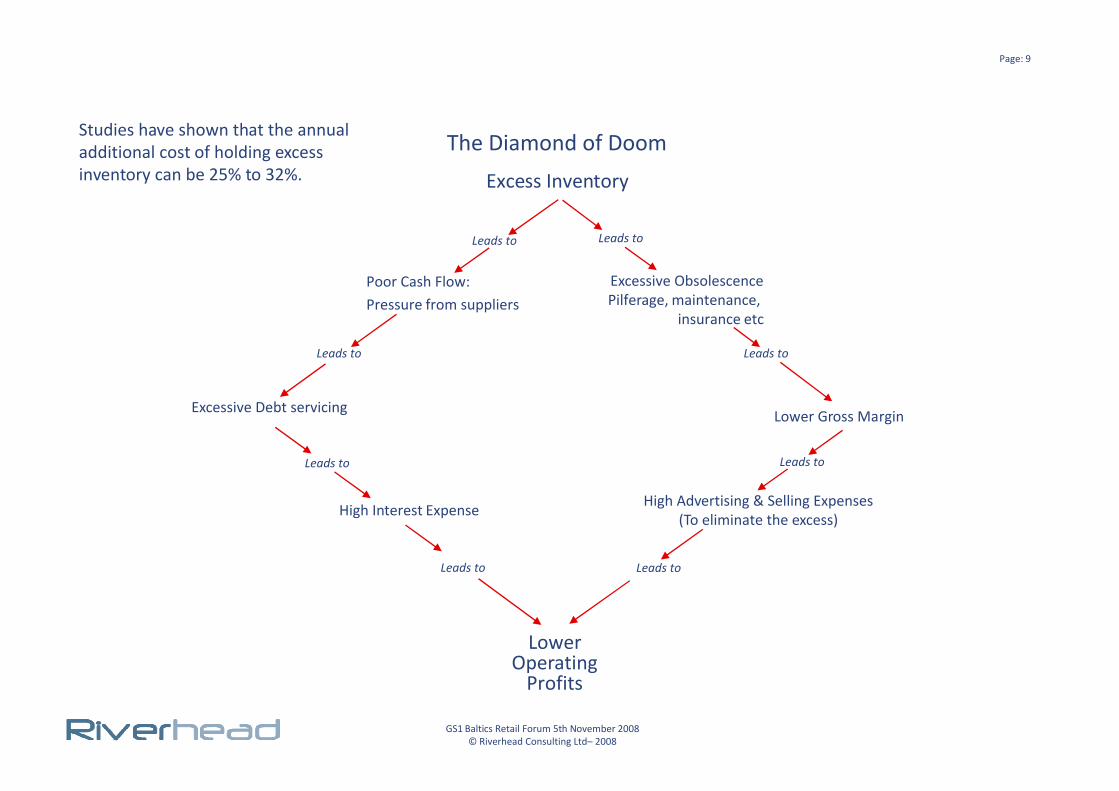
The Diamond of Doom
Excess Inventory
Leads to
Poor Cash Flow:Pressure from suppliers
Leads to
Leads to
Excessive ObsolescencePilferage, maintenance,
insurance etc
Leads to
Studies have shown that the annual additional cost of holding excess inventory can be 25% to 32%.
GS1 Baltics Retail Forum 5th November 2008© Riverhead Consulting Ltd– 2008
Excessive Debt servicing
Leads to
High Interest Expense
Leads to
LowerOperating
Profits
Lower Gross Margin
Leads to
High Advertising & Selling Expenses(To eliminate the excess)
Leads to
Page: 10
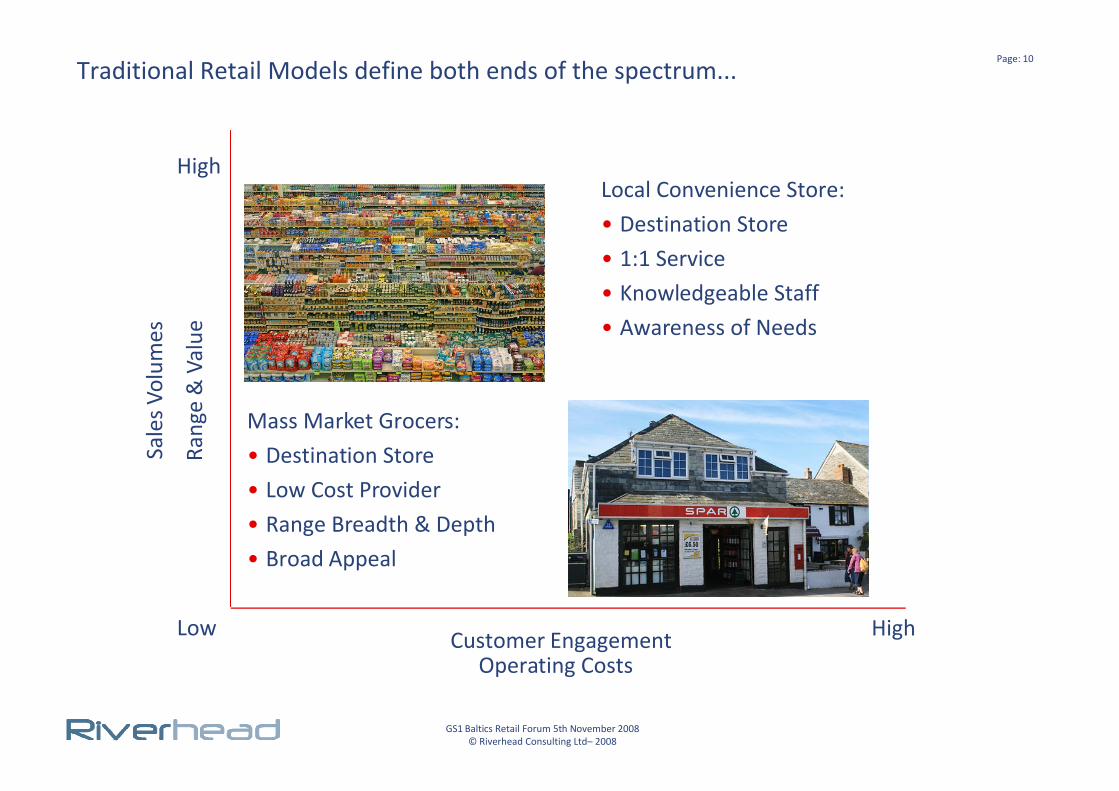
Traditional Retail Models define both ends of the spectrum...
HighRa
nge
& V
alue
Local Convenience Store:• Destination Store• 1:1 Service• Knowledgeable Staff• Awareness of Needs
Sale
s Vo
lum
es
GS1 Baltics Retail Forum 5th November 2008© Riverhead Consulting Ltd– 2008
Low High
Rang
e &
Val
ue
Customer Engagement
Mass Market Grocers:• Destination Store• Low Cost Provider• Range Breadth & Depth• Broad Appeal
Sale
s Vo
lum
es
Operating Costs
Page: 11
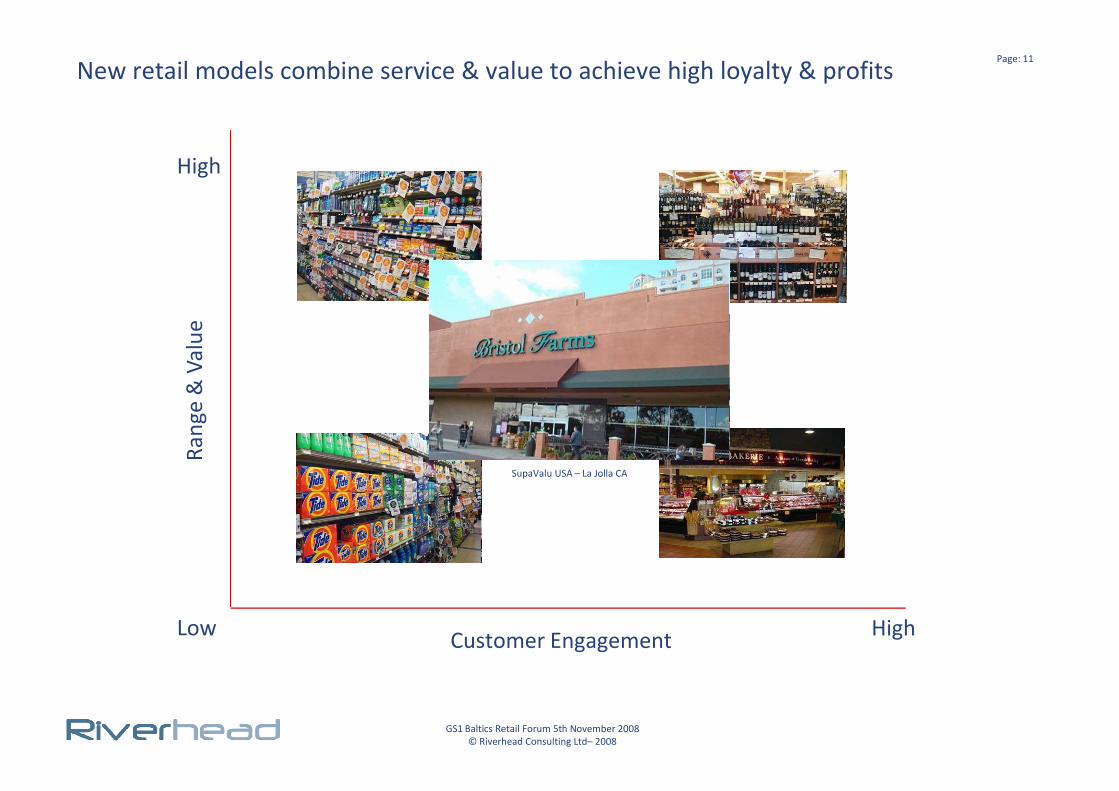
New retail models combine service & value to achieve high loyalty & profits
HighRa
nge
& V
alue
GS1 Baltics Retail Forum 5th November 2008© Riverhead Consulting Ltd– 2008
Low High
Rang
e &
Val
ue
Customer Engagement
SupaValu USA – La Jolla CA
Page: 12
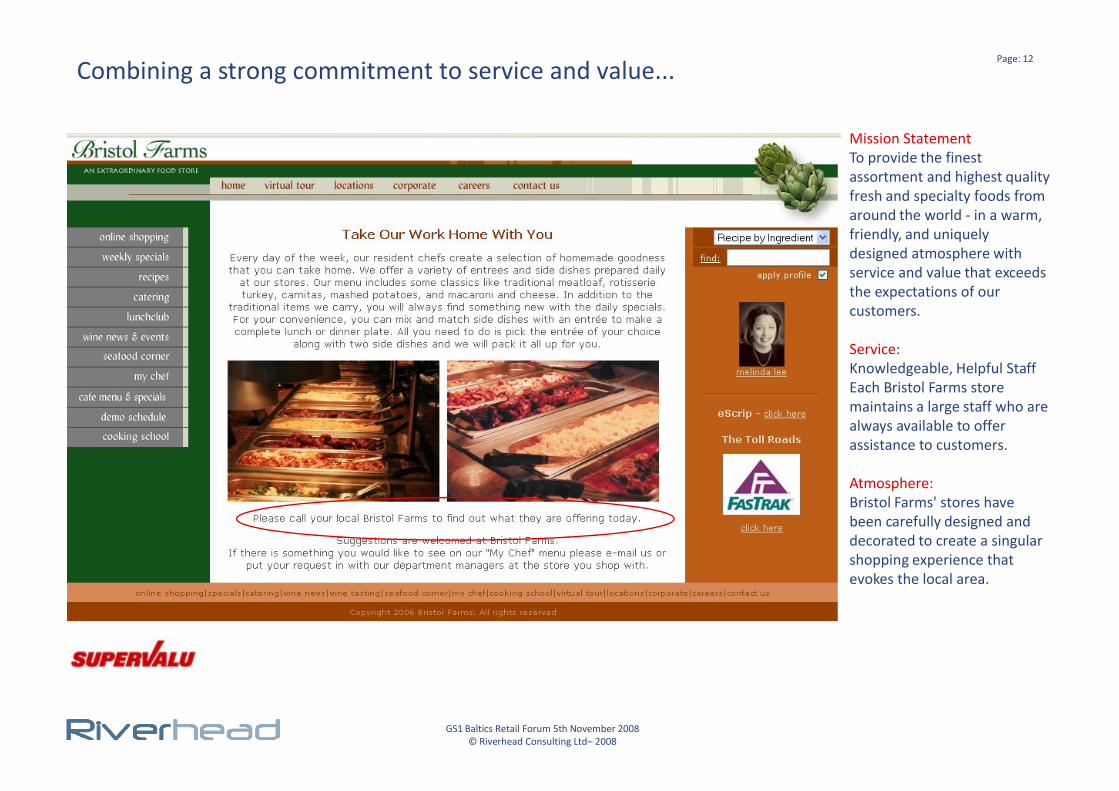
Combining a strong commitment to service and value...
Mission StatementTo provide the finest assortment and highest quality fresh and specialty foods from around the world - in a warm, friendly, and uniquely designed atmosphere with service and value that exceeds the expectations of our customers.
Service:Knowledgeable, Helpful StaffEach Bristol Farms store
GS1 Baltics Retail Forum 5th November 2008© Riverhead Consulting Ltd– 2008
Each Bristol Farms store maintains a large staff who are always available to offer assistance to customers.
Atmosphere:Bristol Farms' stores have been carefully designed and decorated to create a singular shopping experience that evokes the local area.
Page: 13Store Clustering - Why do it?
• Introduce a ‘common language’ describing stores across the business
• Improve store planning, assortment and merchandising• Tailor store space to match customer demand within each cluster• Provides the potential to offer differential cluster specific promotions
• At category and sub-category level determine optimum assortment• Enable informed predictions on demand levels for core range and new titles• Optimise stockholding v demand• Minimise overstocking
GS1 Baltics Retail Forum 5th November 2008© Riverhead Consulting Ltd– 2008
• Minimise overstocking• Eliminate/reduce expensive returns of redundant stock
• Identify the external attributes that drive cluster performance to achieve a closer match to the needs of the customer profile store by store
• Results in a higher rate of sale from a lower stock holding – improved ROCE
• Identify the internal factors driving optimum performance and enable the sharing of ‘best practice’ within the group
Page: 14
The Dynamics of Store Clustering
GS1 Baltics Retail Forum 5th November 2008© Riverhead Consulting Ltd– 2008

Page: 15
The dynamics of store clusteringStores within a group do not perform in the same way despite how similar the product and price offers
Both internal and external factors impact the performance of every store more or less
In an ideal world we would treat every store as unique and range and merchandise to
GS1 Baltics Retail Forum 5th November 2008© Riverhead Consulting Ltd– 2008
and range and merchandise to suit the customers who walk through each store
In the real world we must seek to cluster stores by common attributes and performance patterns
The right store clustering programme results in increased customer satisfaction, compliance and improved supply chain efficiency
Critical success factor – Simplicity. The entire company should be able to understand the clusters and describe the people and the stores that each cluster most strongly represents
Page: 16
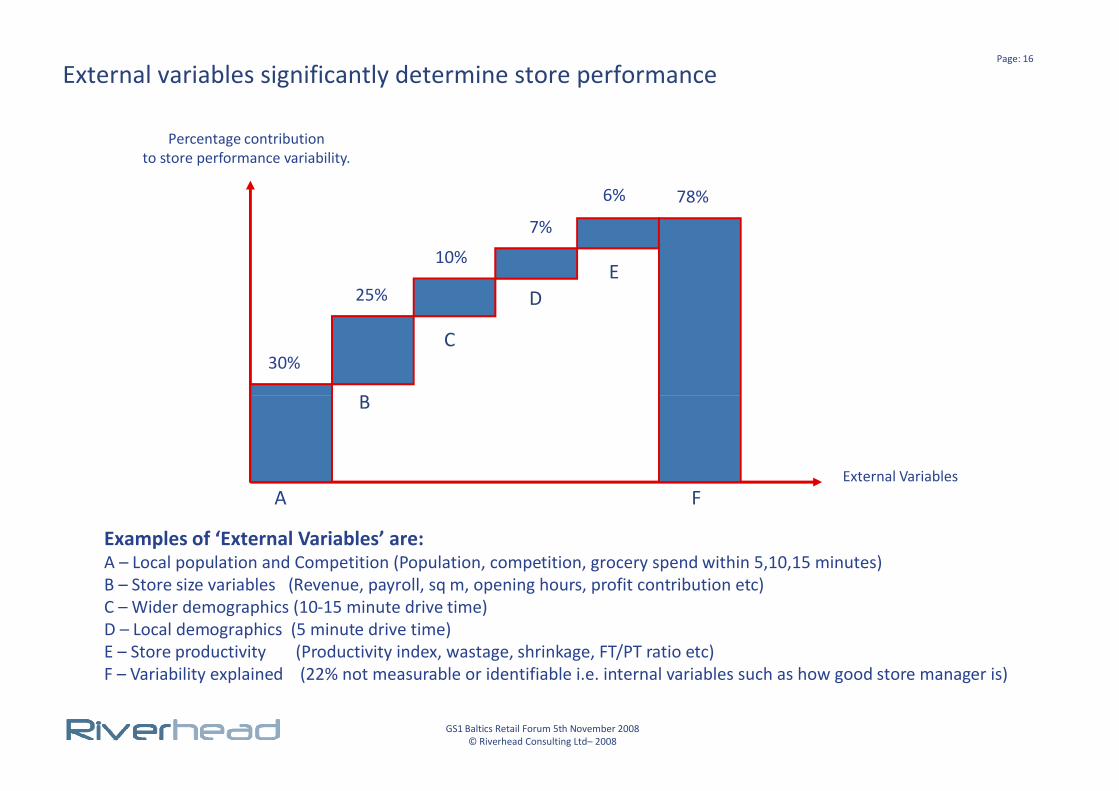
External variables significantly determine store performance
Percentage contributionto store performance variability.
30%
25%
10%
7%
6% 78%
B
C
DE
GS1 Baltics Retail Forum 5th November 2008© Riverhead Consulting Ltd– 2008
External VariablesA
Examples of ‘External Variables’ are:A – Local population and Competition (Population, competition, grocery spend within 5,10,15 minutes)B – Store size variables (Revenue, payroll, sq m, opening hours, profit contribution etc)C – Wider demographics (10-15 minute drive time) D – Local demographics (5 minute drive time)E – Store productivity (Productivity index, wastage, shrinkage, FT/PT ratio etc)F – Variability explained (22% not measurable or identifiable i.e. internal variables such as how good store manager is)
B
F
Page: 17
There are several approaches to store clustering used by retailers...
GS1 Baltics Retail Forum 5th November 2008© Riverhead Consulting Ltd– 2008
Page: 18
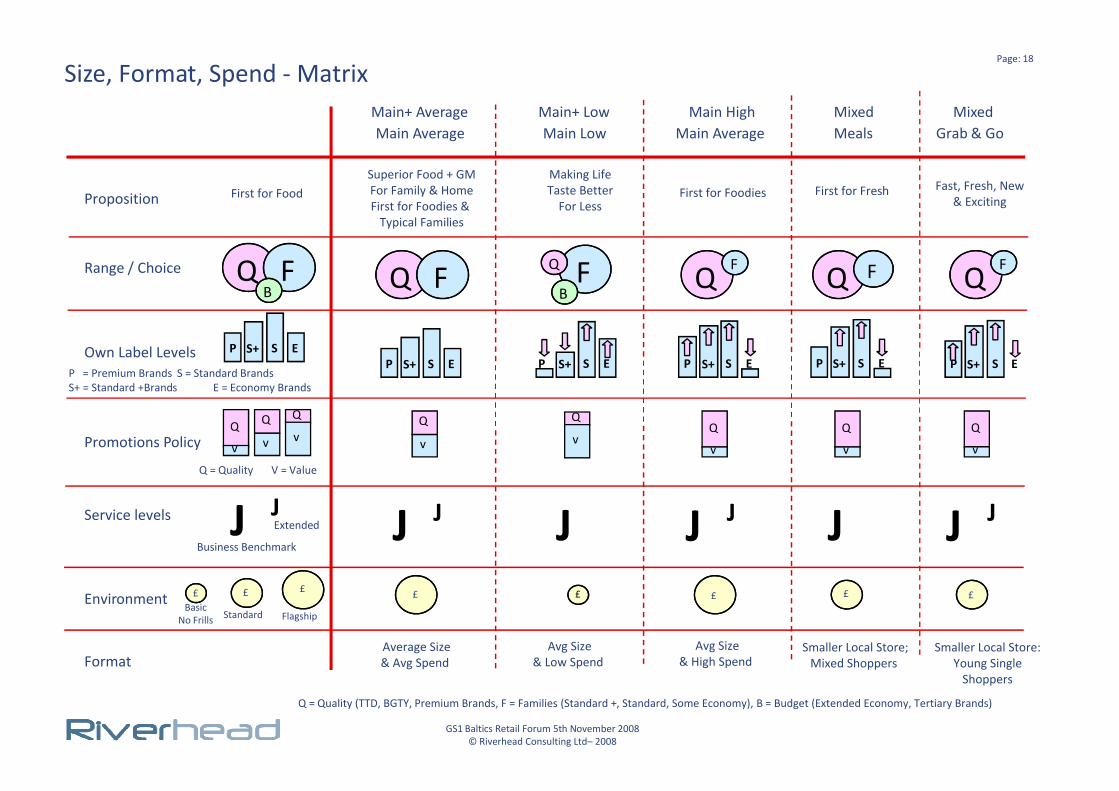
Size, Format, Spend - MatrixMain+ AverageMain Average
Main HighMain Average
MixedGrab & Go
MixedMeals
Proposition
Own Label Levels
Range / Choice
Main LowMain+ Low
First for Food First for FreshSuperior Food + GMFor Family & HomeFirst for Foodies &
Typical Families
Making LifeTaste Better
For LessFirst for Foodies Fast, Fresh, New
& Exciting
Q FB Q F Q FQ F Q FF
B
Q
P S+ ES P S+ ES P S+ ES P S+ ESP S+ ESP S+ ES
P = Premium Brands S = Standard BrandsS+ = Standard +Brands E = Economy Brands
GS1 Baltics Retail Forum 5th November 2008© Riverhead Consulting Ltd– 2008
Promotions Policy
Environment
Service levels
Format
Q = Quality (TTD, BGTY, Premium Brands, F = Families (Standard +, Standard, Some Economy), B = Budget (Extended Economy, Tertiary Brands)
Q
vQ
v
Q
v
Q
v
Q
vQ
v
Q
vQ
v
Q = Quality V = Value
J J J J J J J J JJBusiness Benchmark
Extended
££ £
BasicNo Frills Standard Flagship
££ £ ££
Average Size& Avg Spend
Avg Size& Low Spend
Avg Size& High Spend
Smaller Local Store;Mixed Shoppers
Smaller Local Store:Young Single
Shoppers
Page: 19
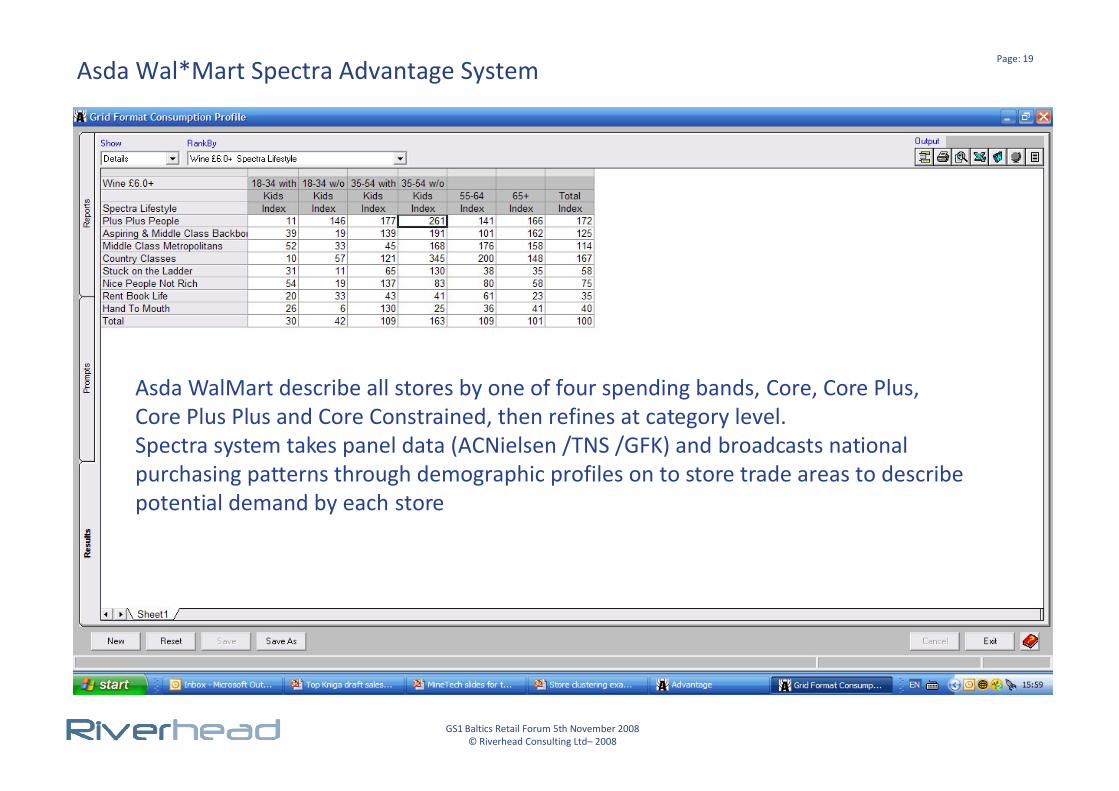
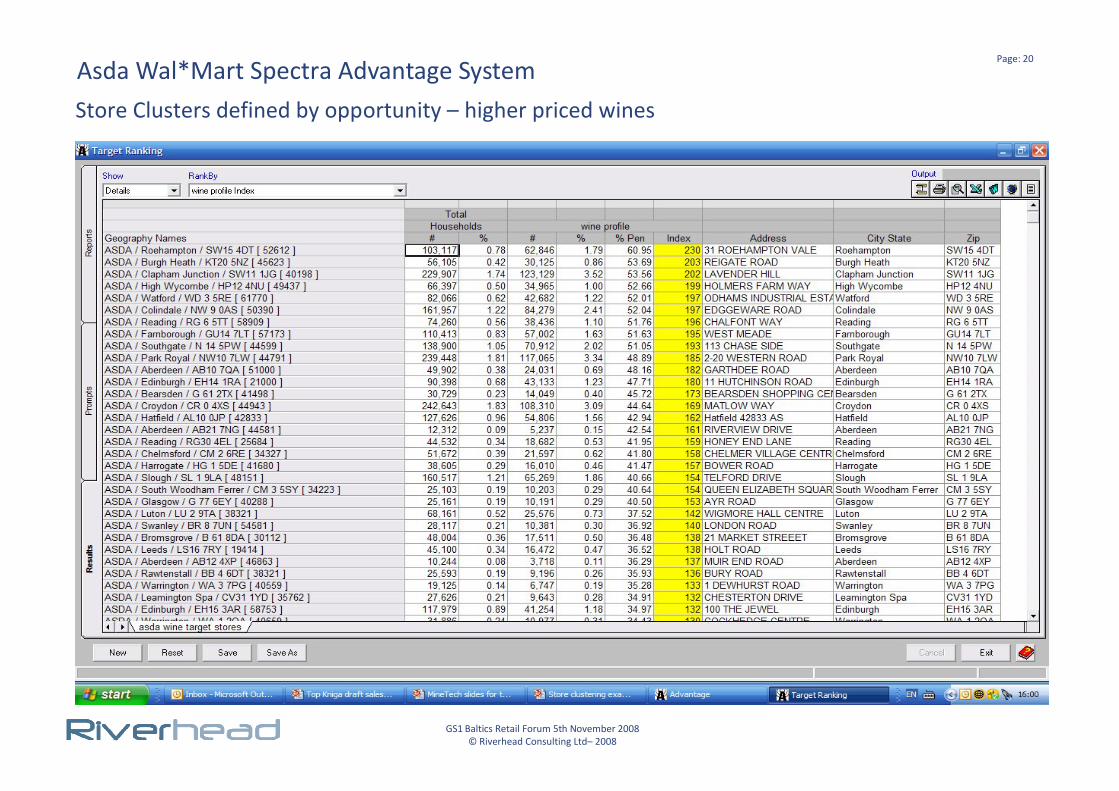
Asda Wal*Mart Spectra Advantage System
Asda WalMart describe all stores by one of four spending bands, Core, Core Plus,
GS1 Baltics Retail Forum 5th November 2008© Riverhead Consulting Ltd– 2008
Asda WalMart describe all stores by one of four spending bands, Core, Core Plus, Core Plus Plus and Core Constrained, then refines at category level.Spectra system takes panel data (ACNielsen /TNS /GFK) and broadcasts national purchasing patterns through demographic profiles on to store trade areas to describe potential demand by each store
Page: 20
Store Clusters defined by opportunity – higher priced wines
Asda Wal*Mart Spectra Advantage System
GS1 Baltics Retail Forum 5th November 2008© Riverhead Consulting Ltd– 2008
Page: 21
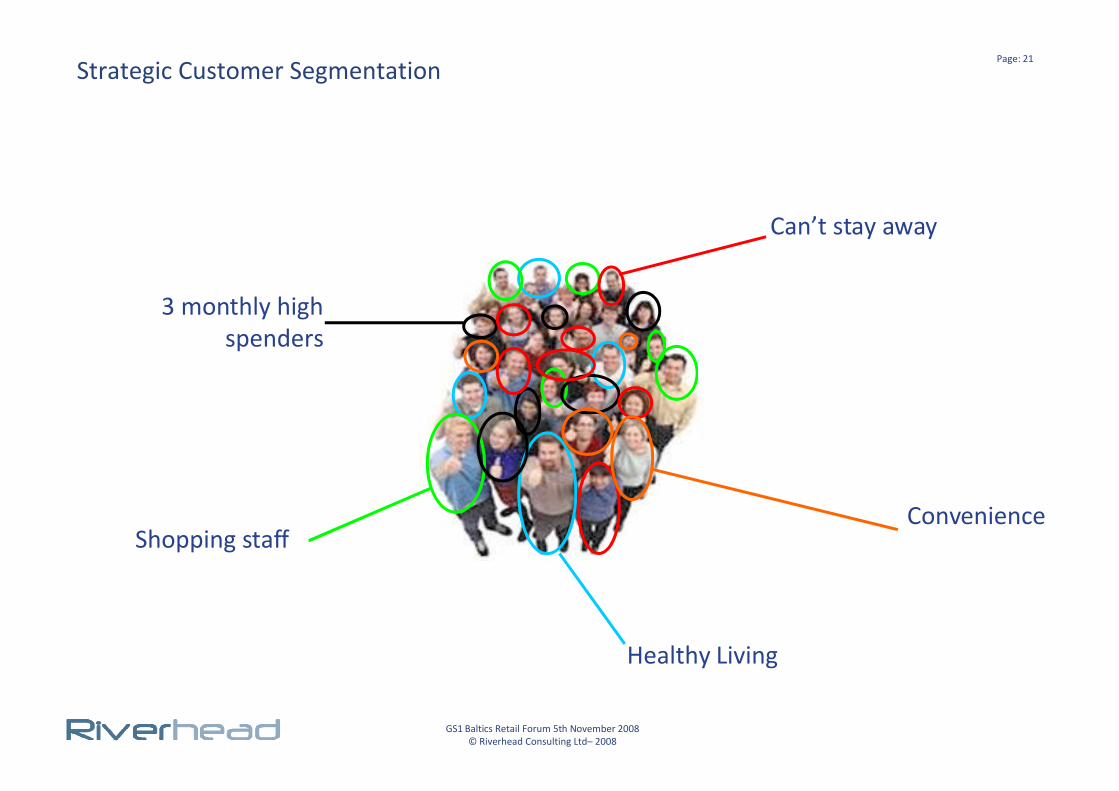
Strategic Customer Segmentation
3 monthly highspenders
Can’t stay away
GS1 Baltics Retail Forum 5th November 2008© Riverhead Consulting Ltd– 2008
Healthy Living
Shopping staffConvenience
Page: 22
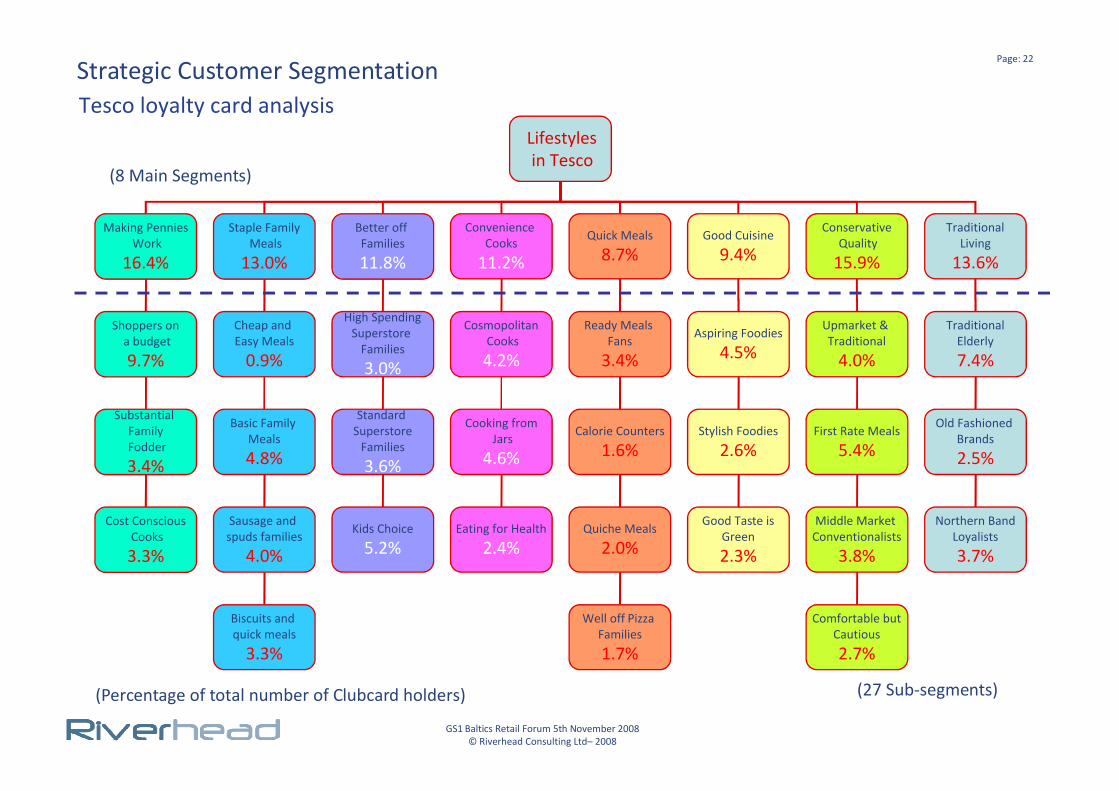
Tesco loyalty card analysisLifestylesin Tesco
Making PenniesWork
16.4%
Staple FamilyMeals
13.0%
Better off Families
11.8%
Shoppers ona budget
9.7%
Cheap and Easy Meals
0.9%
Convenience Cooks
11.2%
Quick Meals
8.7%Good Cuisine
9.4%
ConservativeQuality
15.9%
TraditionalLiving
13.6%
High SpendingSuperstore
Families
3.0%
CosmopolitanCooks
4.2%
Ready Meals Fans
3.4%
Aspiring Foodies
4.5%
Upmarket & Traditional
4.0%
TraditionalElderly
7.4%
(8 Main Segments)
Strategic Customer Segmentation
GS1 Baltics Retail Forum 5th November 2008© Riverhead Consulting Ltd– 2008
Substantial FamilyFodder
3.4%
Cost ConsciousCooks
3.3%
Basic Family Meals
4.8%
Sausage and spuds families
4.0%
Biscuits and quick meals
3.3%
Standard Superstore
Families
3.6%
Kids Choice
5.2%
Cooking fromJars
4.6%
Eating for Health
2.4%
Calorie Counters
1.6%
Quiche Meals
2.0%
Well off Pizza Families
1.7%
Stylish Foodies
2.6%
Good Taste isGreen
2.3%
First Rate Meals
5.4%
Middle Market Conventionalists
3.8%
Comfortable butCautious
2.7%
Old Fashioned Brands
2.5%
Northern BandLoyalists
3.7%
(27 Sub-segments)(Percentage of total number of Clubcard holders)
Page: 23
Case Study
GS1 Baltics Retail Forum 5th November 2008© Riverhead Consulting Ltd– 2008
Page: 24
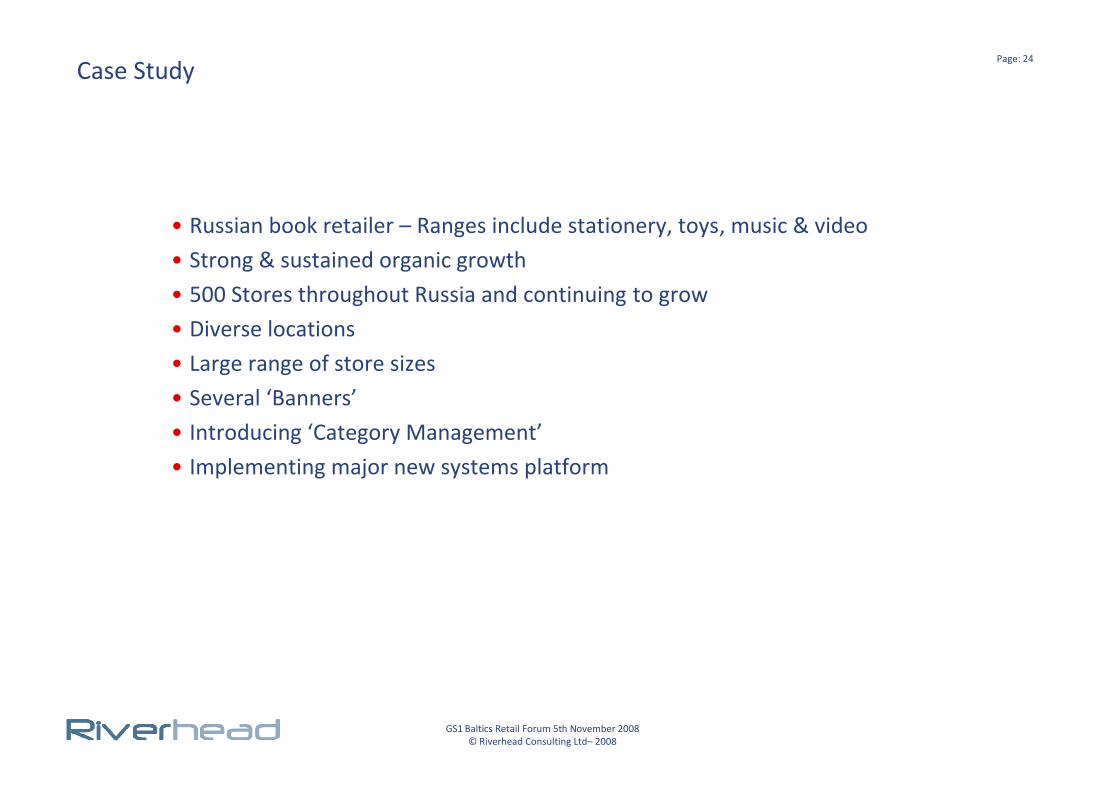
Case Study
• Russian book retailer – Ranges include stationery, toys, music & video• Strong & sustained organic growth• 500 Stores throughout Russia and continuing to grow• Diverse locations• Large range of store sizes• Several ‘Banners’
GS1 Baltics Retail Forum 5th November 2008© Riverhead Consulting Ltd– 2008
• Several ‘Banners’• Introducing ‘Category Management’• Implementing major new systems platform
Page: 25
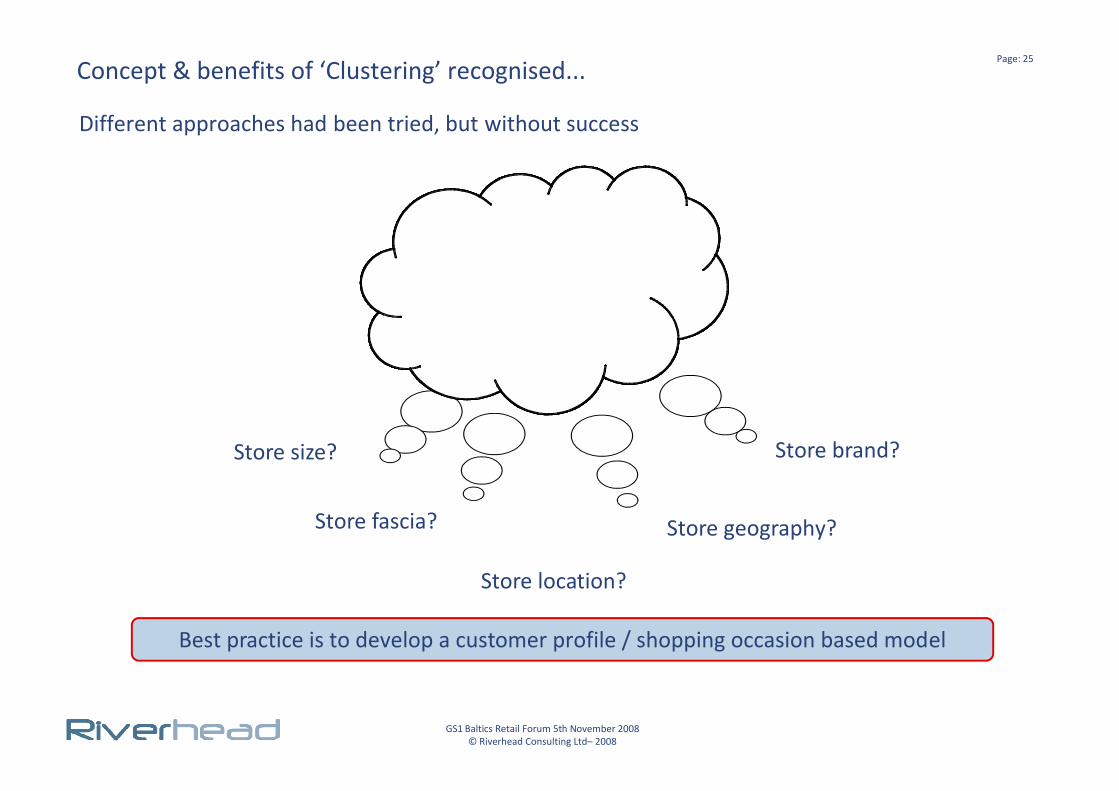
Concept & benefits of ‘Clustering’ recognised...
Different approaches had been tried, but without success
GS1 Baltics Retail Forum 5th November 2008© Riverhead Consulting Ltd– 2008
Store size?
Store location?
Store geography?Store fascia?
Store brand?
Best practice is to develop a customer profile / shopping occasion based model

Page: 26
Diverse people, lifestyles & cultureDiverse people, lifestyles & culture --how do you profile & group them?how do you profile & group them?
GS1 Baltics Retail Forum 5th November 2008© Riverhead Consulting Ltd– 2008
how do you profile & group them?how do you profile & group them?
Page: 27
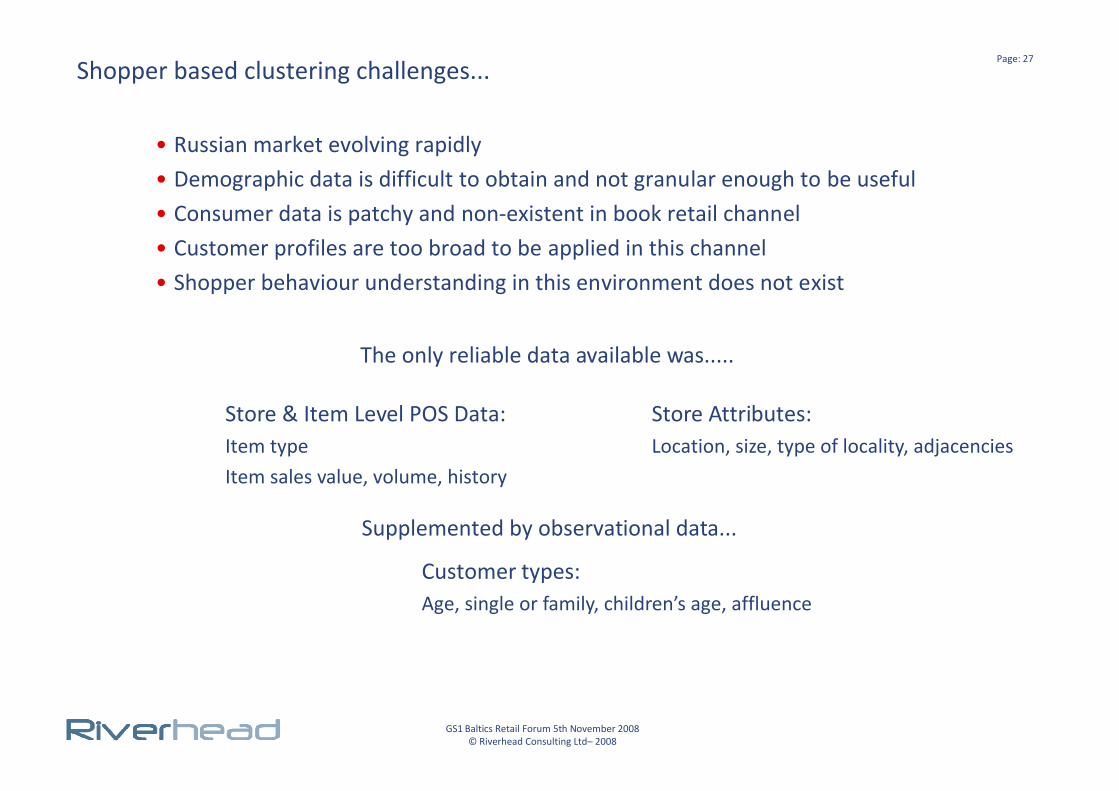
Shopper based clustering challenges...
• Russian market evolving rapidly• Demographic data is difficult to obtain and not granular enough to be useful• Consumer data is patchy and non-existent in book retail channel• Customer profiles are too broad to be applied in this channel• Shopper behaviour understanding in this environment does not exist
The only reliable data available was.....
GS1 Baltics Retail Forum 5th November 2008© Riverhead Consulting Ltd– 2008
Store & Item Level POS Data:Item typeItem sales value, volume, history
Store Attributes:Location, size, type of locality, adjacencies
Supplemented by observational data...
Customer types:Age, single or family, children’s age, affluence
Page: 28
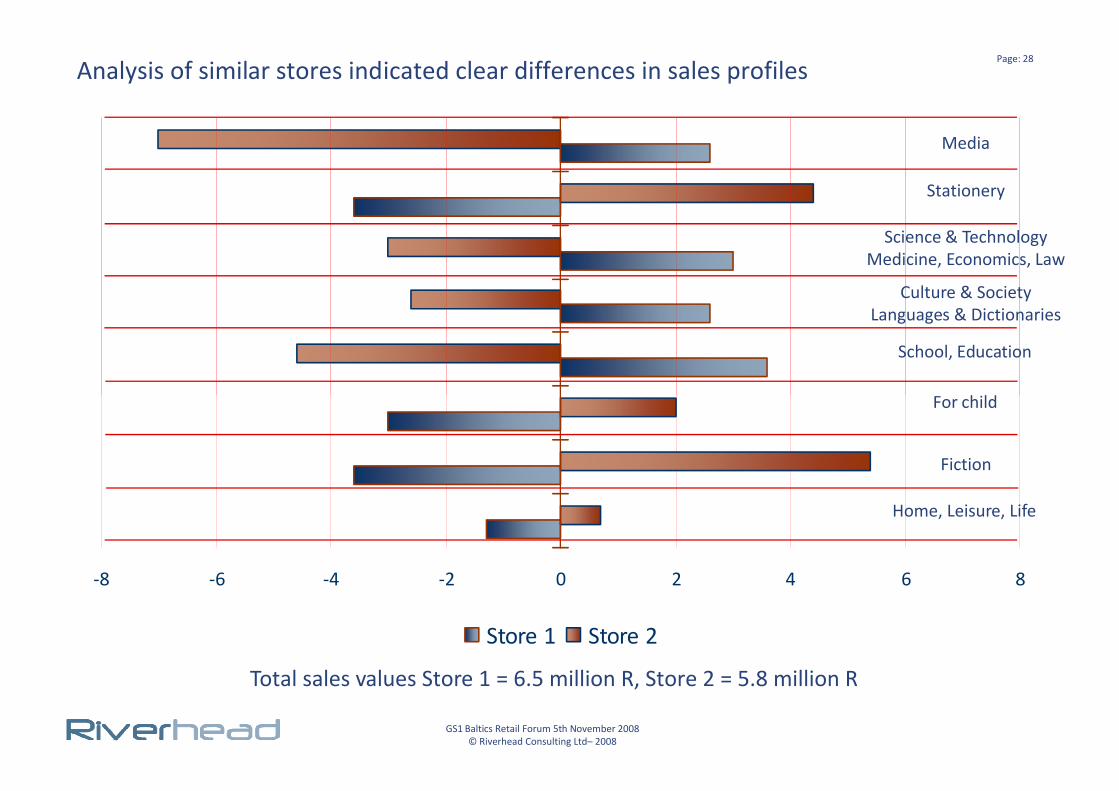
Analysis of similar stores indicated clear differences in sales profiles
For child
School, Education
Culture & SocietyLanguages & Dictionaries
Science & TechnologyMedicine, Economics, Law
Stationery
Media
GS1 Baltics Retail Forum 5th November 2008© Riverhead Consulting Ltd– 2008
-8 -6 -4 -2 0 2 4 6 8
Store 1 Store 2
Total sales values Store 1 = 6.5 million R, Store 2 = 5.8 million R
Home, Leisure, Life
Fiction
For child
Page: 29
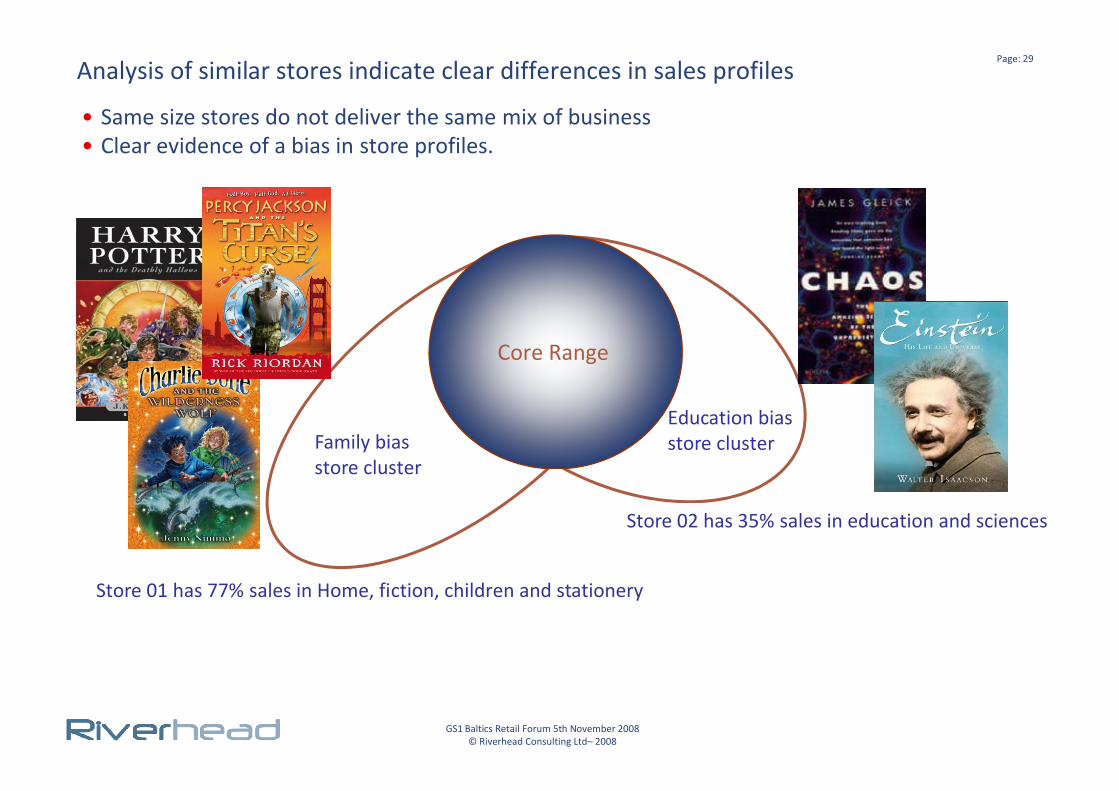
Analysis of similar stores indicate clear differences in sales profiles
• Same size stores do not deliver the same mix of business• Clear evidence of a bias in store profiles.
Core Range
GS1 Baltics Retail Forum 5th November 2008© Riverhead Consulting Ltd– 2008
Education biasstore clusterFamily bias
store cluster
Store 01 has 77% sales in Home, fiction, children and stationery
Store 02 has 35% sales in education and sciences
Page: 30
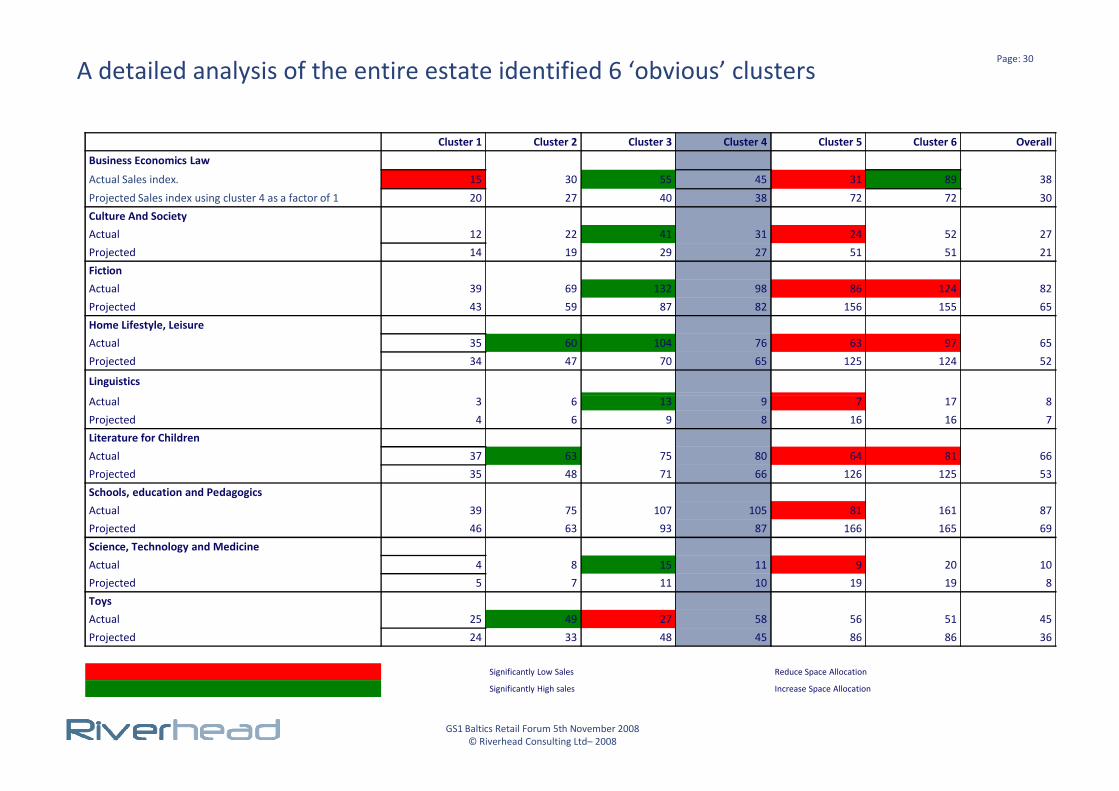
A detailed analysis of the entire estate identified 6 ‘obvious’ clusters
Cluster 1 Cluster 2 Cluster 3 Cluster 4 Cluster 5 Cluster 6 Overall
Business Economics Law
Actual Sales index. 15 30 55 45 31 89 38
Projected Sales index using cluster 4 as a factor of 1 20 27 40 38 72 72 30Culture And SocietyActual 12 22 41 31 24 52 27Projected 14 19 29 27 51 51 21FictionActual 39 69 132 98 86 124 82Projected 43 59 87 82 156 155 65Home Lifestyle, LeisureActual 35 60 104 76 63 97 65Projected 34 47 70 65 125 124 52
Linguistics
Actual 3 6 13 9 7 17 8
GS1 Baltics Retail Forum 5th November 2008© Riverhead Consulting Ltd– 2008
Actual 3 6 13 9 7 17 8Projected 4 6 9 8 16 16 7Literature for ChildrenActual 37 63 75 80 64 81 66Projected 35 48 71 66 126 125 53Schools, education and PedagogicsActual 39 75 107 105 81 161 87Projected 46 63 93 87 166 165 69Science, Technology and MedicineActual 4 8 15 11 9 20 10Projected 5 7 11 10 19 19 8ToysActual 25 49 27 58 56 51 45Projected 24 33 48 45 86 86 36
Significantly Low Sales Reduce Space Allocation
Significantly High sales Increase Space Allocation
Page: 31
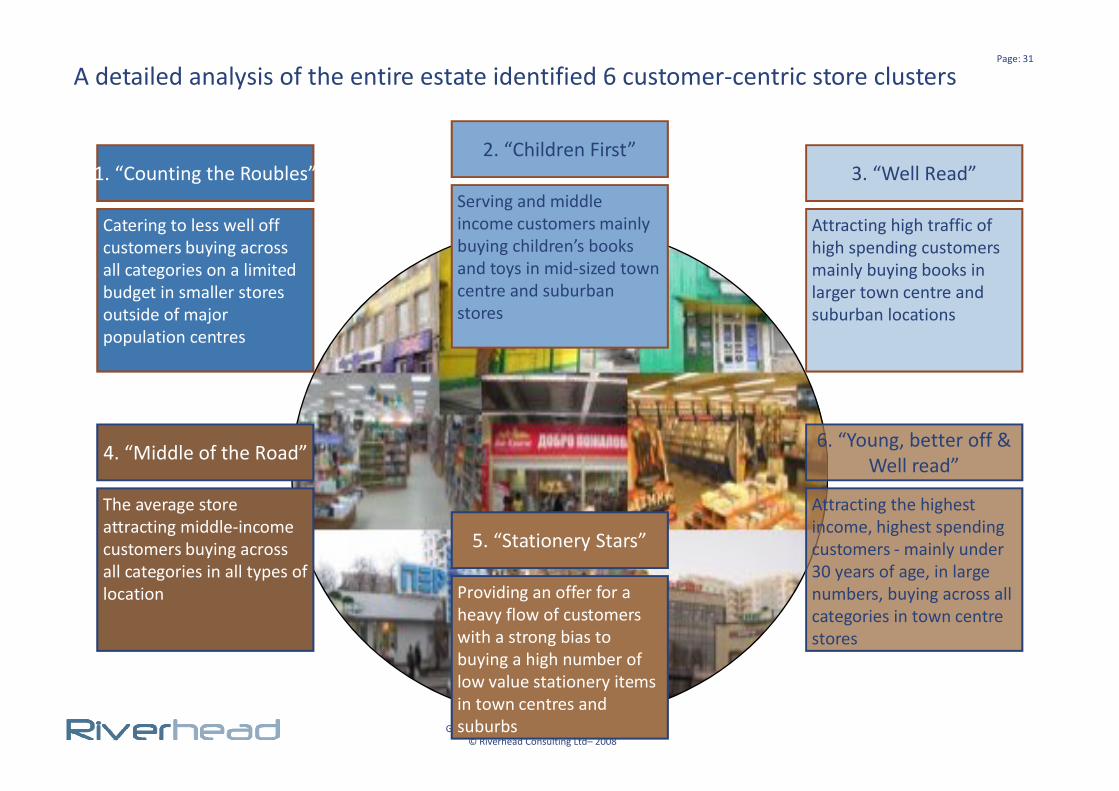
Catering to less well off customers buying across all categories on a limited budget in smaller stores outside of major population centres
1. “Counting the Roubles”Serving and middle income customers mainly buying children’s books and toys in mid-sized town centre and suburban stores
2. “Children First”
Attracting high traffic of high spending customers mainly buying books in larger town centre and suburban locations
3. “Well Read”
A detailed analysis of the entire estate identified 6 customer-centric store clusters
GS1 Baltics Retail Forum 5th November 2008© Riverhead Consulting Ltd– 2008
The average store attracting middle-income customers buying across all categories in all types of location
4. “Middle of the Road”
Providing an offer for a heavy flow of customers with a strong bias to buying a high number of low value stationery items in town centres and suburbs
5. “Stationery Stars”
Attracting the highest income, highest spending customers - mainly under 30 years of age, in large numbers, buying across all categories in town centre stores
6. “Young, better off &Well read”
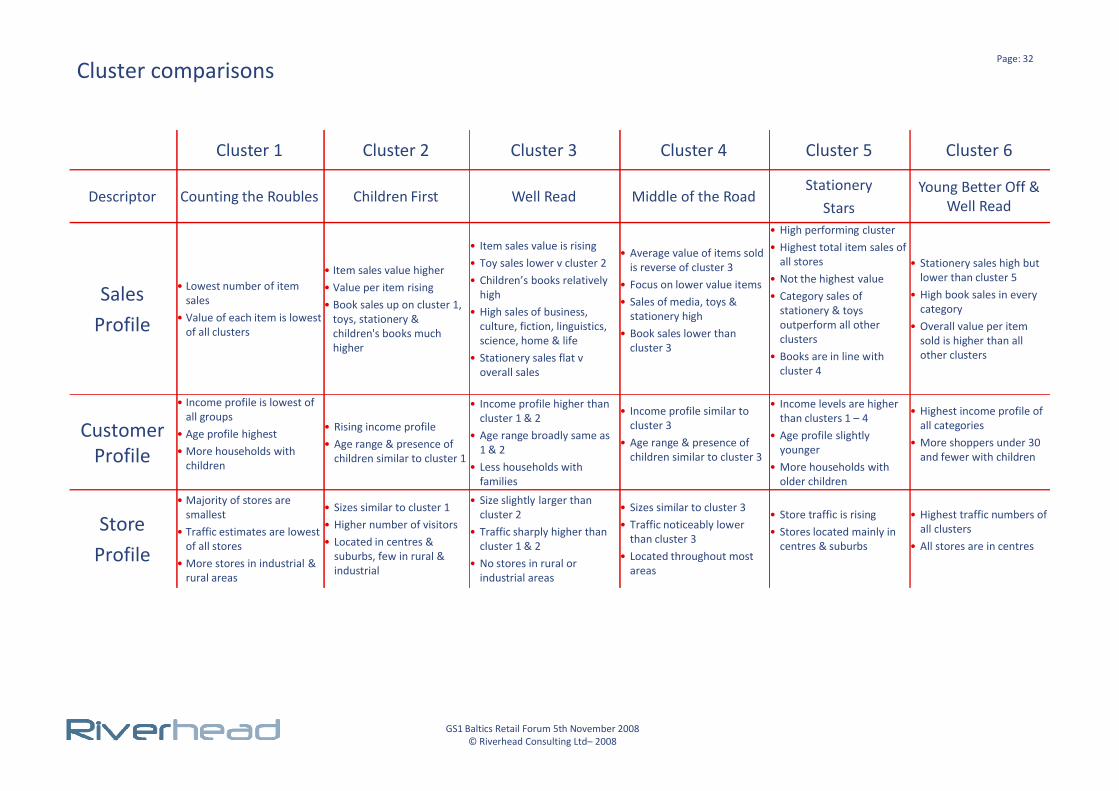
Page: 32Cluster comparisons
Cluster 1 Cluster 2 Cluster 3 Cluster 4 Cluster 5 Cluster 6
Descriptor Counting the Roubles Children First Well Read Middle of the RoadStationery
StarsYoung Better Off &
Well Read
SalesProfile
• Lowest number of item sales
• Value of each item is lowest of all clusters
• Item sales value higher• Value per item rising• Book sales up on cluster 1,
toys, stationery & children's books much higher
• Item sales value is rising• Toy sales lower v cluster 2• Children’s books relatively
high• High sales of business,
culture, fiction, linguistics, science, home & life
• Stationery sales flat v overall sales
• Average value of items sold is reverse of cluster 3
• Focus on lower value items• Sales of media, toys &
stationery high• Book sales lower than
cluster 3
• High performing cluster• Highest total item sales of
all stores• Not the highest value• Category sales of
stationery & toys outperform all other clusters
• Books are in line with cluster 4
• Stationery sales high but lower than cluster 5
• High book sales in every category
• Overall value per item sold is higher than all other clusters
• Income profile is lowest of
GS1 Baltics Retail Forum 5th November 2008© Riverhead Consulting Ltd– 2008
Customer Profile
• Income profile is lowest of all groups
• Age profile highest• More households with
children
• Rising income profile• Age range & presence of
children similar to cluster 1
• Income profile higher than cluster 1 & 2
• Age range broadly same as 1 & 2
• Less households with families
• Income profile similar to cluster 3
• Age range & presence of children similar to cluster 3
• Income levels are higher than clusters 1 – 4
• Age profile slightly younger
• More households with older children
• Highest income profile of all categories
• More shoppers under 30 and fewer with children
StoreProfile
• Majority of stores are smallest
• Traffic estimates are lowest of all stores
• More stores in industrial & rural areas
• Sizes similar to cluster 1• Higher number of visitors• Located in centres &
suburbs, few in rural & industrial
• Size slightly larger than cluster 2
• Traffic sharply higher than cluster 1 & 2
• No stores in rural or industrial areas
• Sizes similar to cluster 3• Traffic noticeably lower
than cluster 3• Located throughout most
areas
• Store traffic is rising• Stores located mainly in
centres & suburbs
• Highest traffic numbers of all clusters
• All stores are in centres

Page: 33
Cluster development...
• Clusters were not developed...
• ...based on store size
• ...using only sales value or volume sales
• Clusters were developed...
GS1 Baltics Retail Forum 5th November 2008© Riverhead Consulting Ltd– 2008
• ...based on item sales mix of categories
• ...using customer profile (customers who shopped in the store)
• ...store attributes that determine the customer profile
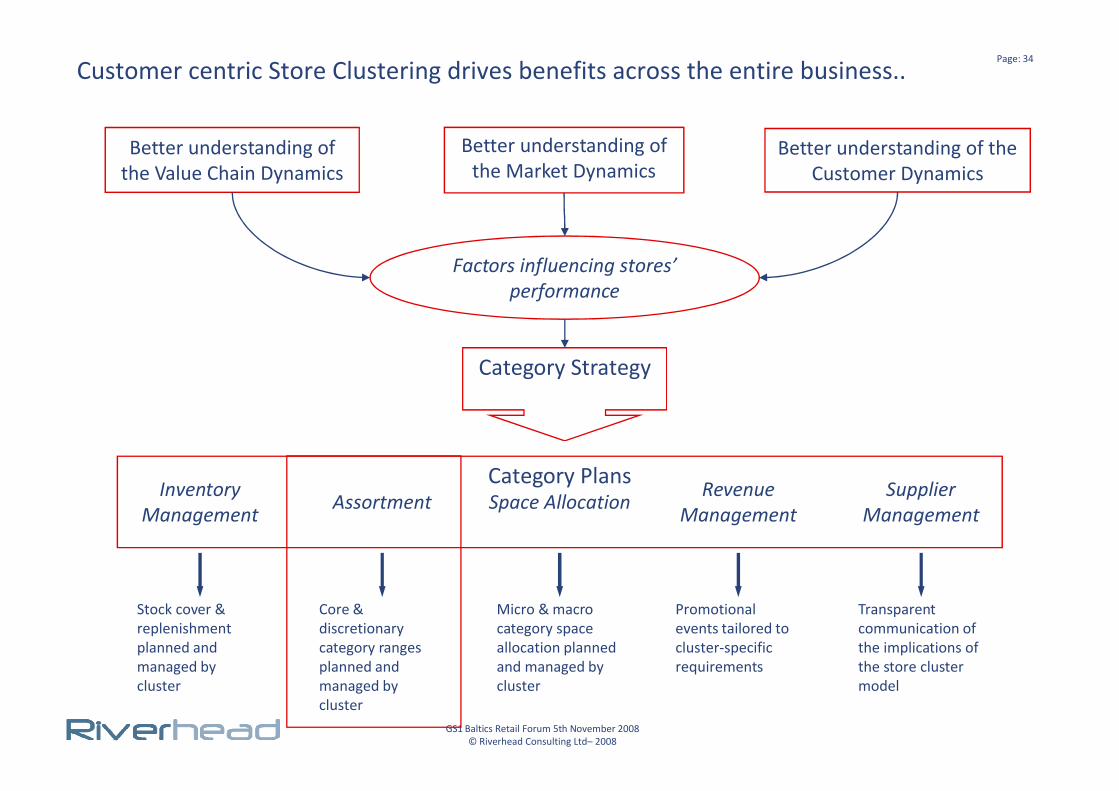
Page: 34
Better understanding of the Market Dynamics
Better understanding of the Value Chain Dynamics
Better understanding of the Customer Dynamics
Category Strategy
Factors influencing stores’ performance
Customer centric Store Clustering drives benefits across the entire business..
GS1 Baltics Retail Forum 5th November 2008© Riverhead Consulting Ltd– 2008
Category PlansInventory Management Assortment Space Allocation Revenue
ManagementSupplier
Management
Stock cover & replenishment planned and managed by cluster
Core & discretionary category ranges planned and managed by cluster
Micro & macro category space allocation planned and managed by cluster
Promotional events tailored to cluster-specific requirements
Transparent communication of the implications of the store cluster model
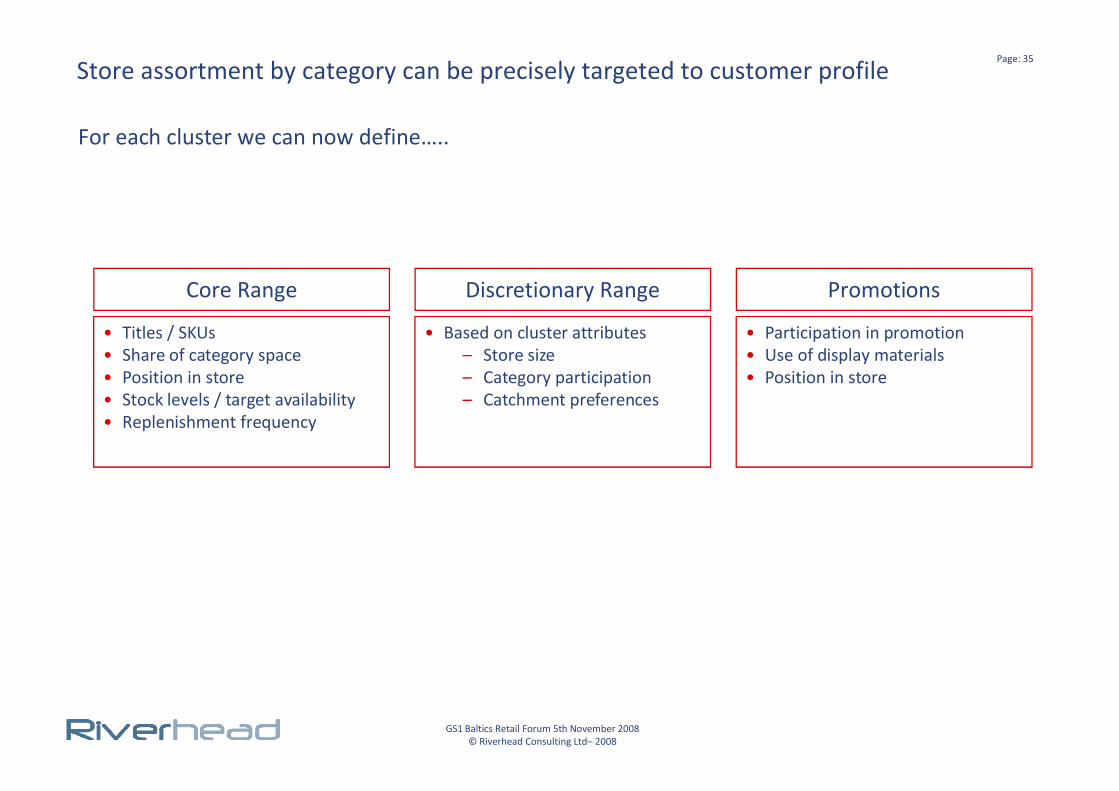
Page: 35
For each cluster we can now define…..
Core Range
• Titles / SKUs• Share of category space• Position in store• Stock levels / target availability
Discretionary Range
• Based on cluster attributes– Store size– Category participation– Catchment preferences
Promotions
• Participation in promotion• Use of display materials• Position in store
Store assortment by category can be precisely targeted to customer profile
GS1 Baltics Retail Forum 5th November 2008© Riverhead Consulting Ltd– 2008
• Stock levels / target availability• Replenishment frequency
– Catchment preferences
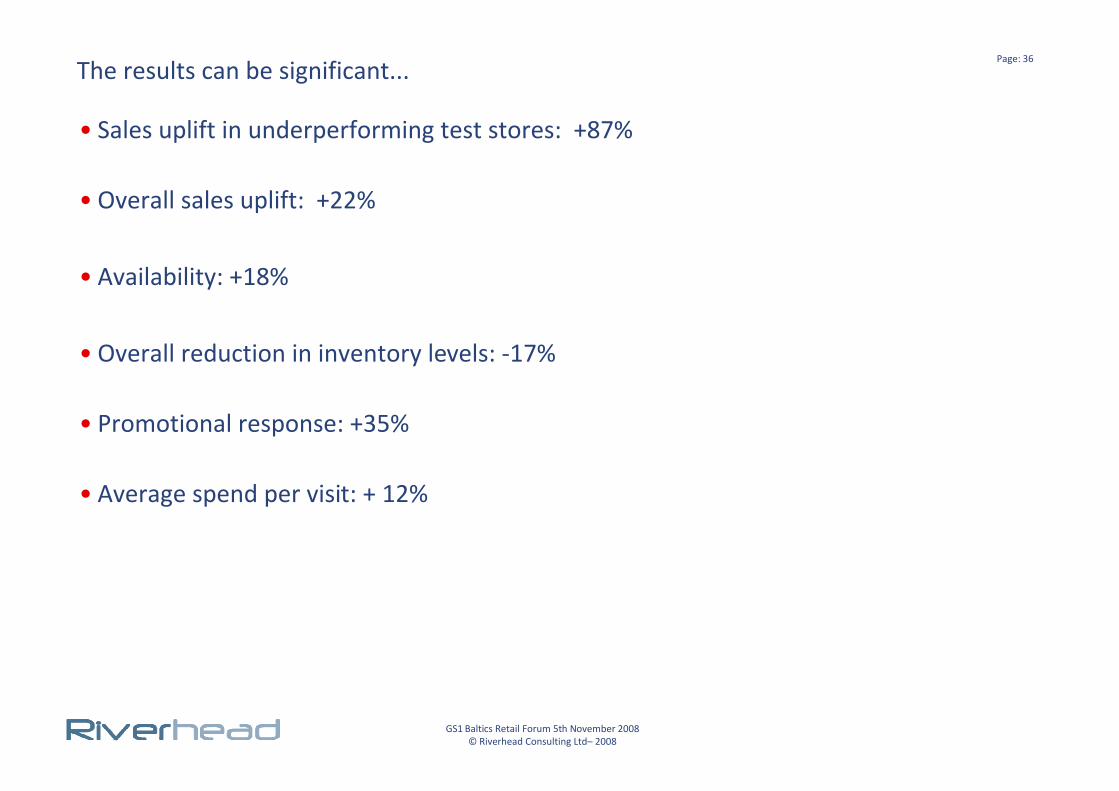
Page: 36
The results can be significant...
• Sales uplift in underperforming test stores: +87%
• Overall sales uplift: +22%
• Availability: +18%
• Overall reduction in inventory levels: -17%
GS1 Baltics Retail Forum 5th November 2008© Riverhead Consulting Ltd– 2008
• Promotional response: +35%
• Average spend per visit: + 12%
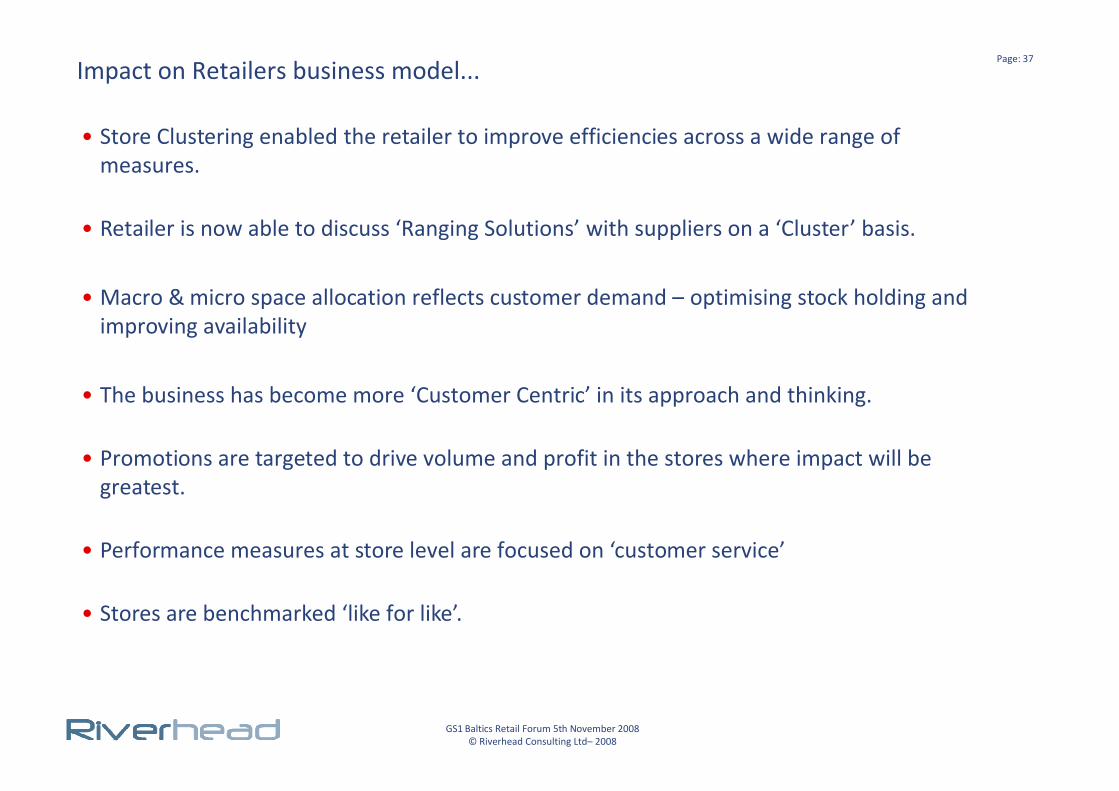
Page: 37
• Store Clustering enabled the retailer to improve efficiencies across a wide range of measures.
• Retailer is now able to discuss ‘Ranging Solutions’ with suppliers on a ‘Cluster’ basis.
• Macro & micro space allocation reflects customer demand – optimising stock holding and improving availability
• The business has become more ‘Customer Centric’ in its approach and thinking.
Impact on Retailers business model...
GS1 Baltics Retail Forum 5th November 2008© Riverhead Consulting Ltd– 2008
• The business has become more ‘Customer Centric’ in its approach and thinking.
• Promotions are targeted to drive volume and profit in the stores where impact will be greatest.
• Performance measures at store level are focused on ‘customer service’
• Stores are benchmarked ‘like for like’.
Page: 38
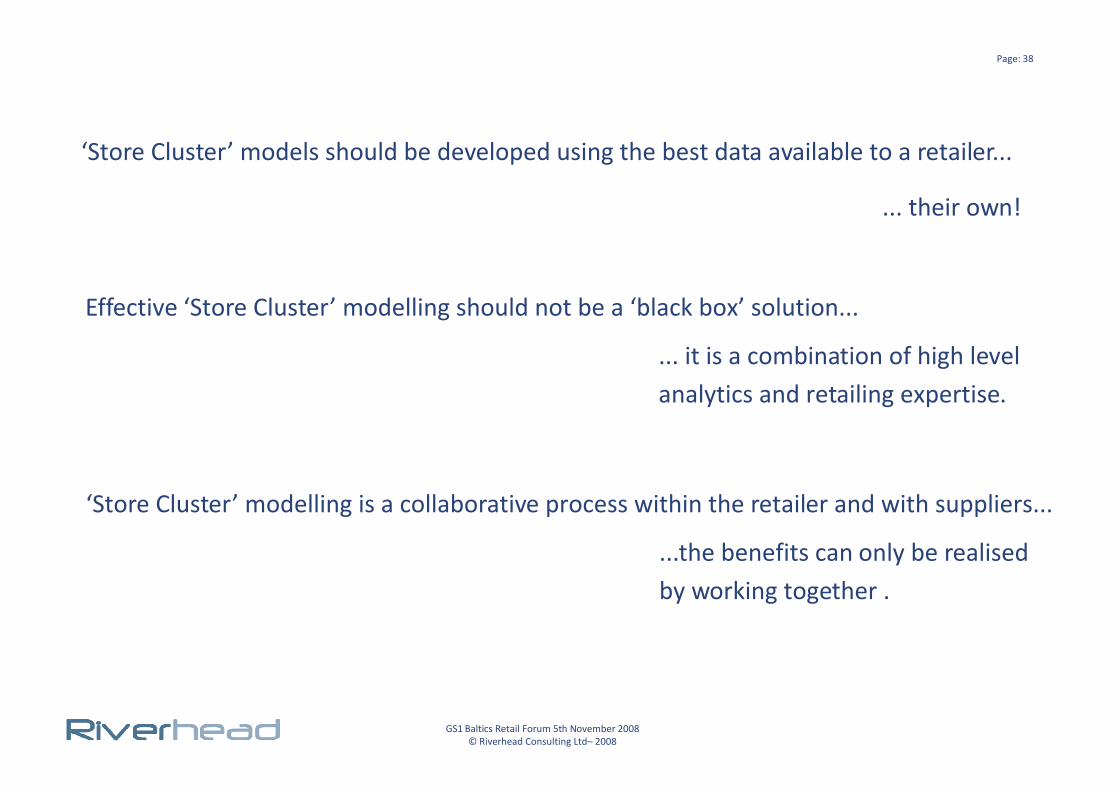
‘Store Cluster’ models should be developed using the best data available to a retailer...
... their own!
Effective ‘Store Cluster’ modelling should not be a ‘black box’ solution...
... it is a combination of high levelanalytics and retailing expertise.
GS1 Baltics Retail Forum 5th November 2008© Riverhead Consulting Ltd– 2008
analytics and retailing expertise.
‘Store Cluster’ modelling is a collaborative process within the retailer and with suppliers...
...the benefits can only be realisedby working together .

Page: 39
Effort, this is. But worth it, effort is. Interesting this may become.
GS1 Baltics Retail Forum 5th November 2008© Riverhead Consulting Ltd– 2008
Consulting
The Benefits of Store Clustering
7 Garrick StCovent Garden
LondonWC2E 9AR
T - +44 (0)203 051 1375 www.riverheadconsulting.com
Simon SmallwoodDirectorEmail – [email protected] - +44 7786 387793