Embed Size (px)
Citation preview

The Binomial Probability DistributionMATH 130, Elements of Statistics I
J. Robert Buchanan
Department of Mathematics
Fall 2018
Objectives
After this lesson we will be able to:I determine whether a probability experiment is a binomial
experiment,I compute probabilities of binomial experiments,I compute the mean and standard deviation of a binomial
random variable,I construct binomial probability histograms.
Binomial Experiments
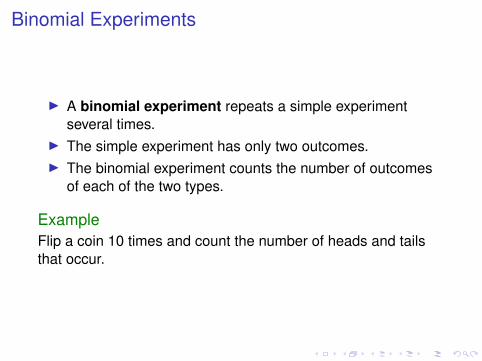
I A binomial experiment repeats a simple experimentseveral times.
I The simple experiment has only two outcomes.I The binomial experiment counts the number of outcomes
of each of the two types.
ExampleFlip a coin 10 times and count the number of heads and tailsthat occur.
Criteria
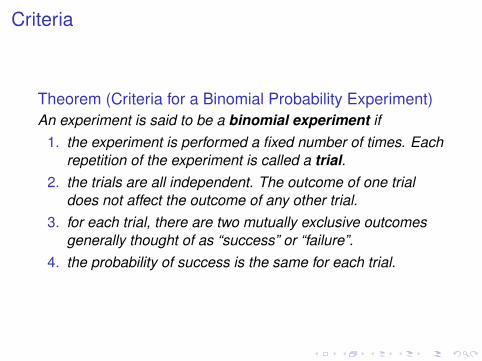
Theorem (Criteria for a Binomial Probability Experiment)An experiment is said to be a binomial experiment if
1. the experiment is performed a fixed number of times. Eachrepetition of the experiment is called a trial.
2. the trials are all independent. The outcome of one trialdoes not affect the outcome of any other trial.
3. for each trial, there are two mutually exclusive outcomesgenerally thought of as “success” or “failure”.
4. the probability of success is the same for each trial.
Notation
I Let n be the number of independent trials of theexperiment.
I Let p be the probability of success (and 1− p be theprobability of failure).
I Let X be the random variable denoting the number ofsuccesses in the n trials of the binomial experiment.
0 ≤ X ≤ n
Examples (1 of 2)
Which if the following situations describe binomialexperiments?
1. A test consists of 10 True/False questions and Xrepresents the number of questions answered correctly byguessing.
2. A test consists of 10 multiple choice (5 choices perquestion) questions and X represents the number ofquestions answered correctly by guessing.
Examples (2 of 2)
Which if the following situations describe binomialexperiments?
1. An experiment consists of drawing five cards from awell-shuffled deck with replacement. The drawn card isidentified as a “heart” or “not a heart”. Random variable Xrepresents the number of hearts drawn.
2. An experiment consists of drawing five cards from awell-shuffled deck without replacement. The drawn card isidentified as a “heart” or “not a heart”. Random variable Xrepresents the number of hearts drawn.
Binomial Probabilities
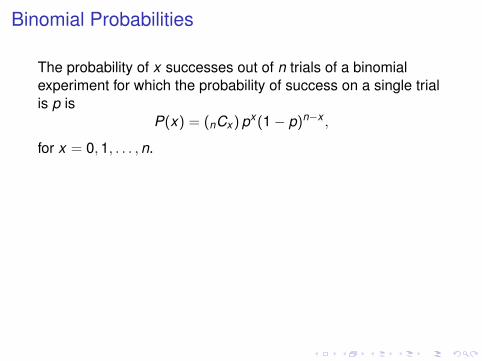
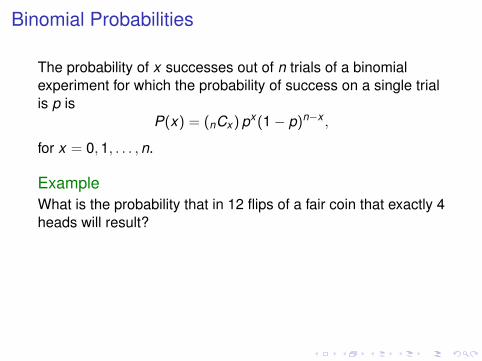
The probability of x successes out of n trials of a binomialexperiment for which the probability of success on a single trialis p is
P(x) = (nCx)px(1− p)n−x ,
for x = 0,1, . . . ,n.
ExampleWhat is the probability that in 12 flips of a fair coin that exactly 4heads will result?
P(4) = (12C4)(0.5)4(1− 0.5)12−4 = (495)(0.5)4(0.5)8 = 0.1208
Binomial Probabilities
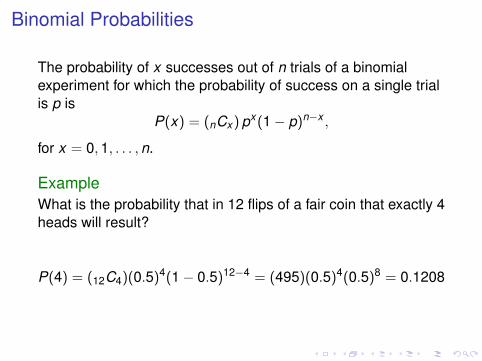
The probability of x successes out of n trials of a binomialexperiment for which the probability of success on a single trialis p is
P(x) = (nCx)px(1− p)n−x ,
for x = 0,1, . . . ,n.
ExampleWhat is the probability that in 12 flips of a fair coin that exactly 4heads will result?
P(4) = (12C4)(0.5)4(1− 0.5)12−4 = (495)(0.5)4(0.5)8 = 0.1208
Binomial Probability Tables (1 of 2)
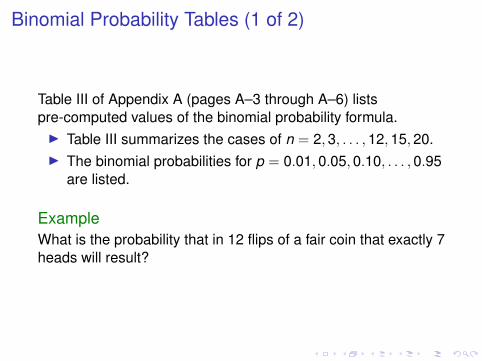
Table III of Appendix A (pages A–3 through A–6) listspre-computed values of the binomial probability formula.I Table III summarizes the cases of n = 2,3, . . . ,12,15,20.I The binomial probabilities for p = 0.01,0.05,0.10, . . . ,0.95
are listed.
ExampleWhat is the probability that in 12 flips of a fair coin that exactly 7heads will result?
Binomial Probability Tables (1 of 2)
Table III of Appendix A (pages A–3 through A–6) listspre-computed values of the binomial probability formula.I Table III summarizes the cases of n = 2,3, . . . ,12,15,20.I The binomial probabilities for p = 0.01,0.05,0.10, . . . ,0.95
are listed.
ExampleWhat is the probability that in 12 flips of a fair coin that exactly 7heads will result?
Binomial Probability Tables (2 of 2)
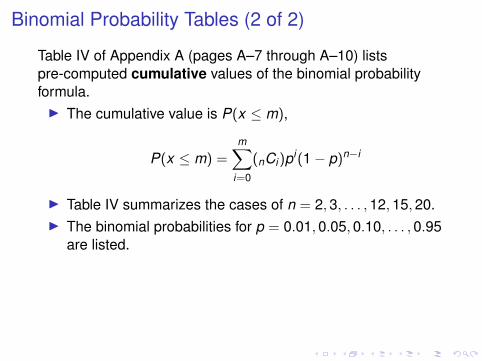
Table IV of Appendix A (pages A–7 through A–10) listspre-computed cumulative values of the binomial probabilityformula.I The cumulative value is P(x ≤ m),
P(x ≤ m) =m∑
i=0
(nCi)pi(1− p)n−i
I Table IV summarizes the cases of n = 2,3, . . . ,12,15,20.I The binomial probabilities for p = 0.01,0.05,0.10, . . . ,0.95
are listed.
ExampleWhat is the probability that in 12 flips of a fair coin that 7 orfewer heads will result?

Binomial Probability Tables (2 of 2)
Table IV of Appendix A (pages A–7 through A–10) listspre-computed cumulative values of the binomial probabilityformula.I The cumulative value is P(x ≤ m),
P(x ≤ m) =m∑
i=0
(nCi)pi(1− p)n−i
I Table IV summarizes the cases of n = 2,3, . . . ,12,15,20.I The binomial probabilities for p = 0.01,0.05,0.10, . . . ,0.95
are listed.
ExampleWhat is the probability that in 12 flips of a fair coin that 7 orfewer heads will result?

Example
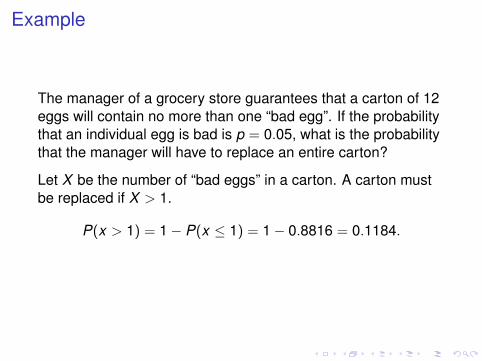
The manager of a grocery store guarantees that a carton of 12eggs will contain no more than one “bad egg”. If the probabilitythat an individual egg is bad is p = 0.05, what is the probabilitythat the manager will have to replace an entire carton?
Let X be the number of “bad eggs” in a carton. A carton mustbe replaced if X > 1.
P(x > 1) = 1− P(x ≤ 1) = 1− 0.8816 = 0.1184.
Example
The manager of a grocery store guarantees that a carton of 12eggs will contain no more than one “bad egg”. If the probabilitythat an individual egg is bad is p = 0.05, what is the probabilitythat the manager will have to replace an entire carton?
Let X be the number of “bad eggs” in a carton. A carton mustbe replaced if X > 1.
P(x > 1) = 1− P(x ≤ 1) = 1− 0.8816 = 0.1184.
Mean and Standard Deviation
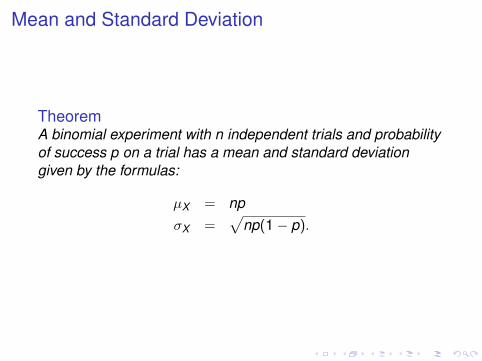
TheoremA binomial experiment with n independent trials and probabilityof success p on a trial has a mean and standard deviationgiven by the formulas:
µX = npσX =
√np(1− p).
Examples
There is a 90% chance that a pizza from TelePizza will bedelivered in less that 30 minutes. If a pizza is not delivered inless than 30 minutes, the next order is free. Suppose TelePizzamust process 300 delivery orders per day. What is the meanand standard deviation in the number of pizzas delivered ontime?
µX = n p = (300)(0.90) = 270.0σX =
√n p(1− p) =
√(300)(0.90)(1− 0.90) ≈ 5.2
Examples
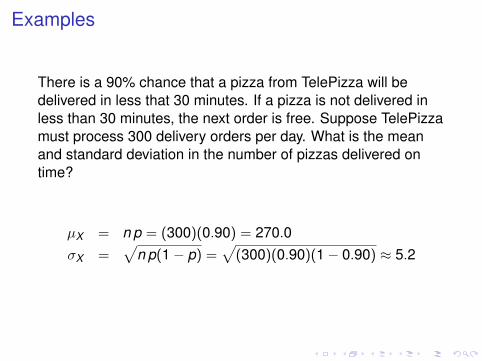
There is a 90% chance that a pizza from TelePizza will bedelivered in less that 30 minutes. If a pizza is not delivered inless than 30 minutes, the next order is free. Suppose TelePizzamust process 300 delivery orders per day. What is the meanand standard deviation in the number of pizzas delivered ontime?
µX = n p = (300)(0.90) = 270.0σX =
√n p(1− p) =
√(300)(0.90)(1− 0.90) ≈ 5.2
Histograms
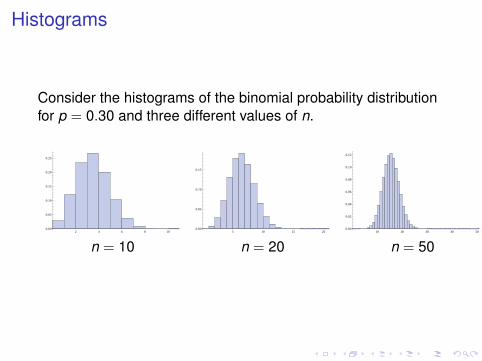
Consider the histograms of the binomial probability distributionfor p = 0.30 and three different values of n.
2 4 6 8 100.00
0.05
0.10
0.15
0.20
0.25
5 10 15 200.00
0.05
0.10
0.15
10 20 30 40 500.00
0.02
0.04
0.06
0.08
0.10
0.12
n = 10 n = 20 n = 50
Observation
As the number of trials n of a binomial experiment increases,the probability distribution of the random variable X becomesbell-shaped. If np(1− p) ≥ 10, the probability distribution willbe bell-shaped.
Hence when np(1− p) ≥ 10 we may use the Empirical Rule toidentify unusual observations in a binomial experiment.
Example
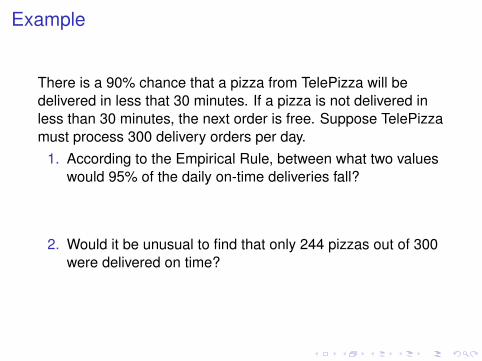
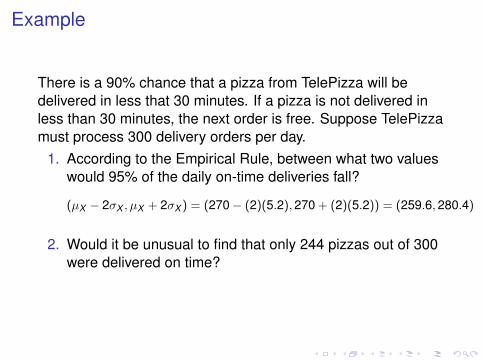
There is a 90% chance that a pizza from TelePizza will bedelivered in less that 30 minutes. If a pizza is not delivered inless than 30 minutes, the next order is free. Suppose TelePizzamust process 300 delivery orders per day.
1. According to the Empirical Rule, between what two valueswould 95% of the daily on-time deliveries fall?
(µX − 2σX , µX + 2σX ) = (270− (2)(5.2),270 + (2)(5.2)) = (259.6,280.4)
2. Would it be unusual to find that only 244 pizzas out of 300were delivered on time?
Yes, since 244 is 5 standard deviations below the mean.
Example
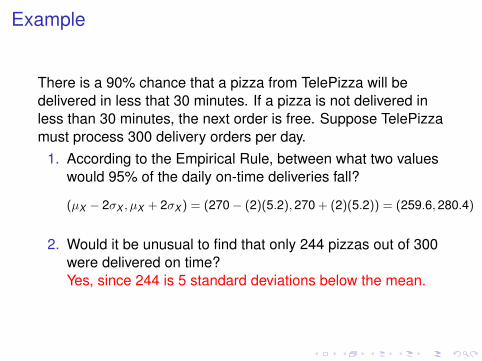
There is a 90% chance that a pizza from TelePizza will bedelivered in less that 30 minutes. If a pizza is not delivered inless than 30 minutes, the next order is free. Suppose TelePizzamust process 300 delivery orders per day.
1. According to the Empirical Rule, between what two valueswould 95% of the daily on-time deliveries fall?
(µX − 2σX , µX + 2σX ) = (270− (2)(5.2),270 + (2)(5.2)) = (259.6,280.4)
2. Would it be unusual to find that only 244 pizzas out of 300were delivered on time?Yes, since 244 is 5 standard deviations below the mean.
Example
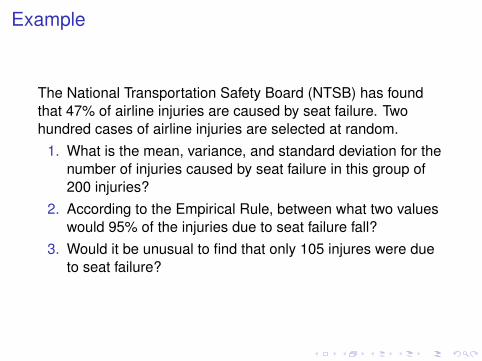
The National Transportation Safety Board (NTSB) has foundthat 47% of airline injuries are caused by seat failure. Twohundred cases of airline injuries are selected at random.
1. What is the mean, variance, and standard deviation for thenumber of injuries caused by seat failure in this group of200 injuries?
2. According to the Empirical Rule, between what two valueswould 95% of the injuries due to seat failure fall?
3. Would it be unusual to find that only 105 injures were dueto seat failure?
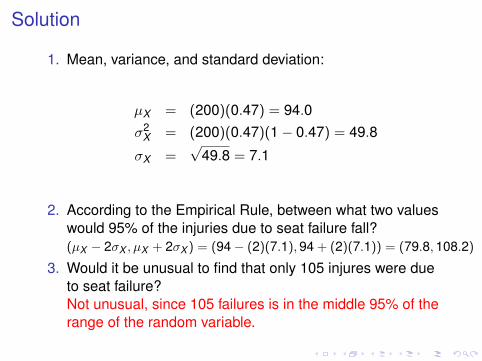
Solution
1. Mean, variance, and standard deviation:
µX = (200)(0.47) = 94.0σ2
X = (200)(0.47)(1− 0.47) = 49.8
σX =√
49.8 = 7.1
2. According to the Empirical Rule, between what two valueswould 95% of the injuries due to seat failure fall?(µX − 2σX , µX + 2σX ) = (94− (2)(7.1),94 + (2)(7.1)) = (79.8,108.2)
3. Would it be unusual to find that only 105 injures were dueto seat failure?Not unusual, since 105 failures is in the middle 95% of therange of the random variable.