Embed Size (px)
Citation preview
The Budding Yeast Point Ce
Current Biology 23, 770–774, May 6, 2013 ª2013 Elsevier Ltd All rights reserved http://dx.doi.org/10.1016/j.cub.2013.03.042
Reportntromere
Associates with Two Cse4Molecules during Mitosis
Pavithra Aravamudhan,1 Isabella Felzer-Kim,2
and Ajit P. Joglekar1,2,*1Department of Biophysics, University of Michigan, Ann Arbor,MI 48109, USA2Cell & Developmental Biology, University of MichiganMedicalSchool, Ann Arbor, MI 48109, USA
Summary
The centromere is defined by the incorporation of the centro-
mere-specific histone H3 variant centromere protein A(CENP-A). Like histone H3, CENP-A can form CENP-A-H4
heterotetramers in vitro [1]. However, the in vivo conforma-tion of CENP-A chromatin has been proposed by different
studies as hemisomes, canonical, or heterotypic nucleo-somes [2–8]. A clear understanding of the in vivo architec-
ture of CENP-A chromatin is important, because it influencesthe molecular mechanisms of the assembly and mainte-
nance of the centromere and its function in kinetochorenucleation. A key determinant of this architecture is the num-
ber of CENP-Amolecules bound to the centromere. Accuratemeasurement of this number can limit possible centromere
architectures. The genetically defined point centromere inthe budding yeast Saccharomyces cerevisiae provides a
unique opportunity to define this number accurately, asthis 120-bp-long centromere can at themost form one nucle-
osome or hemisome. Using novel live-cell fluorescence
microscopy assays, we demonstrate that the budding yeastcentromere recruits two Cse4 (ScCENP-A) molecules. These
molecules are deposited during S phase and they remainstably bound through late anaphase. Our studies suggest
that the budding yeast centromere incorporates a Cse4-H4tetramer.
Results and Discussion
The Budding Yeast Centromere BindsMore ThanOneCse4
from S Phase OnwardPrevious studies have proposed conflicting numbers of Cse4molecules per centromere with counts ranging from only oneto up to eight [5–7]. A previous study also concluded that whilethere is only one Cse4 molecule per centromere prior toanaphase, this number doubles in anaphase [5]. To resolvethis discrepancy, we wanted to determine whether thebudding yeast centromere can incorporate more than oneCse4 prior to anaphase. To this end, we developed an assaybased on bimolecular fluorescence complementation (BiFC).In this technique, two proteins of interest are fused to comple-menting fragments of a fluorescent protein. These fragmentsgenerate a fluorophore only if the proteins of interest physi-cally interact [9]. In crystallographic data, the carboxyl terminiof either H3 or Cse4 are situatedw2 nm apart, suggesting thatthese termini should facilitate robust BiFC maturation (Fig-ure 1A [8]). Development of BiFC fluorescence can then
*Correspondence: [email protected]
provide clear, real-time confirmation of close physical prox-imity of more than one H3 or Cse4 molecule in live cells.To determine whether more than one Cse4 molecule can
bind to the centromere prior to anaphase, we constructedtwo haploid strains of opposite mating type. Each strain ex-pressed Cse4 (or H3) fused with one BiFC fragment (VC orVN, corresponding to Venus carboxyl or amino fragment,respectively, [Figure 1B]). BiFC is possible only after thesestrains are allowed to mate and form diploid cells. As ex-pected, we observed robust BiFC signal when the BiFC frag-ments were fused to H3, after two haploid cells were allowedto mate (Movie S1, available online). Surprisingly, we also de-tected BiFC signal with Cse4 within the zygote during the firstmitotic division, soon after bud emergence (Figure 1C, n = 5/5,Movie S2). This fluorescence was located between two spin-dle-pole bodies, coincident with centromere distribution dur-ing mitosis (Figure 1D). We also applied BiFC to two knownheterodimers within the Mtw1 and the Ndc80 complexes ofthe kinetochore. These heterodimers showed similar kineticsof BiFC fluorescence development in the zygote (Figure 1D).Therefore, the development of Cse4 BiFC fluorescence isconsistentwith the deposition ofmore than oneCse4moleculein close physical proximity to the centromere.To ensure that BiFC does not lead to nonnative dimerization,
we fused VC and VN to the C termini of Nuf2 and Spc24, whichare in the same complex but more than 10 nm apart, and his-tone H3 and Cse4. BiFC fluorescence could not be detectedin either case. We also verified the presence of more thanoneCse4 per centromerewithin close physical proximity usingForster resonance energy transfer (FRET, Figure S1).
High BiFC Maturation Efficiency Reveals UniformCentromere Composition
Next, we investigated whether every centromere associateswith more than one Cse4. To this end, we needed to determinethe efficiency of Cse4-BiFC formation in live cells. This effi-ciency can be determined by measuring the ratio of fluores-cence from a set number of molecules of Venus and from thesame number of molecules of BiFC-Venus.To generate strains with the same number of Venus and
BiFC-Venusmolecules, we labeled the Spc24/Spc25 heterodi-meric subunits of the Ndc80 complex. The C termini of Spc24pandSpc25p are 2.4 nmapart, a separation similar inmagnitudeto the separation between Cse4 C termini in the Cse4-H4heterotetramer (inset, Figure 2A). Furthermore, because thenumber of Spc24/Spc25molecules per kinetochore is uniform,kinetochores in different strains will have the same number ofSpc24/Spc25molecules [10, 11]. Thus, strains carrying Spc24-Venus should have the same Venus intensity as those express-ing both Spc24-VC and Spc25-VN, assuming 100% BiFCmaturation efficiency (Figure 2A). We also constructed a het-erozygous diploid strain (SPC24/SPC24-VC, SPC25-VN/SPC25). In this strain, the BiFC/Venus ratio should not exceed0.5. This is because only 25% of Spc24/Spc25 dimers possessthe complementary BiFC fragments to form a Venus molecule,but the diploid contains twice as many kinetochores.The ratio of BiFC fluorescence from the haploid strain to
Spc24-Venus fluorescence was 0.65 6 0.16 in metaphase,
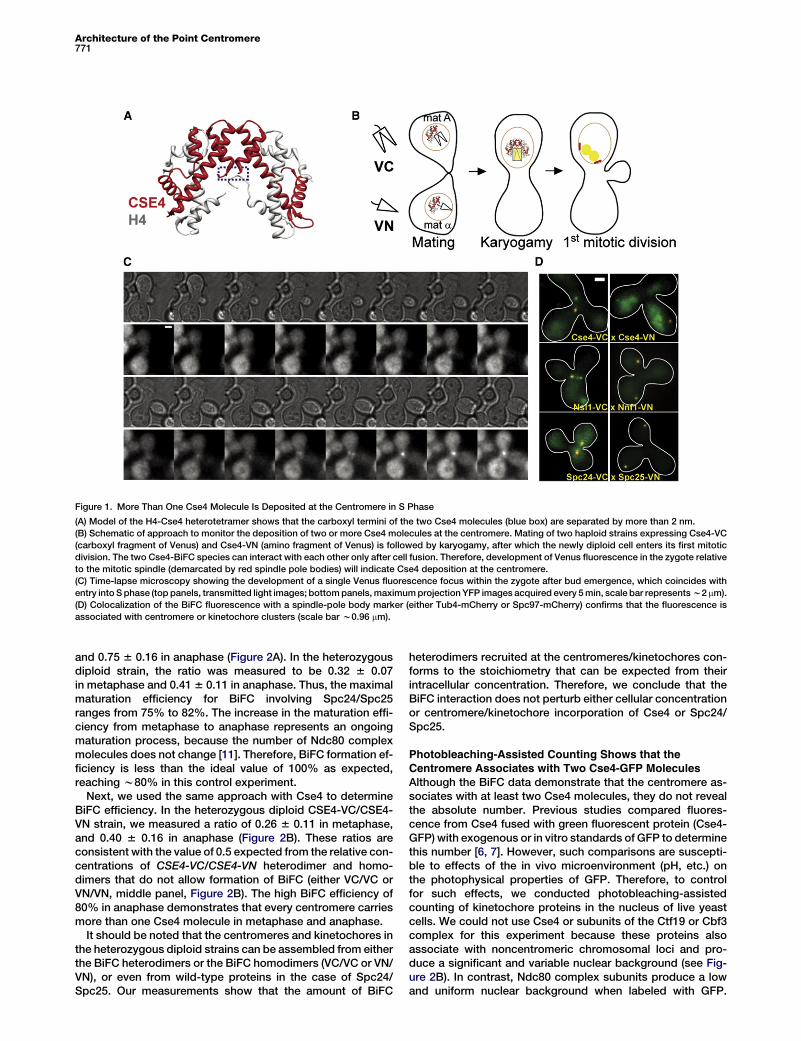
Figure 1. More Than One Cse4 Molecule Is Deposited at the Centromere in S Phase
(A) Model of the H4-Cse4 heterotetramer shows that the carboxyl termini of the two Cse4 molecules (blue box) are separated by more than 2 nm.
(B) Schematic of approach to monitor the deposition of two or more Cse4 molecules at the centromere. Mating of two haploid strains expressing Cse4-VC
(carboxyl fragment of Venus) and Cse4-VN (amino fragment of Venus) is followed by karyogamy, after which the newly diploid cell enters its first mitotic
division. The two Cse4-BiFC species can interact with each other only after cell fusion. Therefore, development of Venus fluorescence in the zygote relative
to the mitotic spindle (demarcated by red spindle pole bodies) will indicate Cse4 deposition at the centromere.
(C) Time-lapse microscopy showing the development of a single Venus fluorescence focus within the zygote after bud emergence, which coincides with
entry into Sphase (top panels, transmitted light images; bottompanels,maximumprojection YFP images acquired every 5min, scale bar representsw2 mm).
(D) Colocalization of the BiFC fluorescence with a spindle-pole body marker (either Tub4-mCherry or Spc97-mCherry) confirms that the fluorescence is
associated with centromere or kinetochore clusters (scale bar w0.96 mm).
Architecture of the Point Centromere771
and 0.75 6 0.16 in anaphase (Figure 2A). In the heterozygousdiploid strain, the ratio was measured to be 0.32 6 0.07in metaphase and 0.416 0.11 in anaphase. Thus, the maximalmaturation efficiency for BiFC involving Spc24/Spc25ranges from 75% to 82%. The increase in the maturation effi-ciency from metaphase to anaphase represents an ongoingmaturation process, because the number of Ndc80 complexmolecules does not change [11]. Therefore, BiFC formation ef-ficiency is less than the ideal value of 100% as expected,reaching w80% in this control experiment.
Next, we used the same approach with Cse4 to determineBiFC efficiency. In the heterozygous diploid CSE4-VC/CSE4-VN strain, we measured a ratio of 0.26 6 0.11 in metaphase,and 0.40 6 0.16 in anaphase (Figure 2B). These ratios areconsistent with the value of 0.5 expected from the relative con-centrations of CSE4-VC/CSE4-VN heterodimer and homo-dimers that do not allow formation of BiFC (either VC/VC orVN/VN, middle panel, Figure 2B). The high BiFC efficiency of80% in anaphase demonstrates that every centromere carriesmore than one Cse4 molecule in metaphase and anaphase.
It should be noted that the centromeres and kinetochores inthe heterozygous diploid strains can be assembled from eitherthe BiFC heterodimers or the BiFC homodimers (VC/VC or VN/VN), or even from wild-type proteins in the case of Spc24/Spc25. Our measurements show that the amount of BiFC
heterodimers recruited at the centromeres/kinetochores con-forms to the stoichiometry that can be expected from theirintracellular concentration. Therefore, we conclude that theBiFC interaction does not perturb either cellular concentrationor centromere/kinetochore incorporation of Cse4 or Spc24/Spc25.
Photobleaching-Assisted Counting Shows that theCentromere Associates with Two Cse4-GFP Molecules
Although the BiFC data demonstrate that the centromere as-sociates with at least two Cse4 molecules, they do not revealthe absolute number. Previous studies compared fluores-cence from Cse4 fused with green fluorescent protein (Cse4-GFP) with exogenous or in vitro standards of GFP to determinethis number [6, 7]. However, such comparisons are suscepti-ble to effects of the in vivo microenvironment (pH, etc.) onthe photophysical properties of GFP. Therefore, to controlfor such effects, we conducted photobleaching-assistedcounting of kinetochore proteins in the nucleus of live yeastcells. We could not use Cse4 or subunits of the Ctf19 or Cbf3complex for this experiment because these proteins alsoassociate with noncentromeric chromosomal loci and pro-duce a significant and variable nuclear background (see Fig-ure 2B). In contrast, Ndc80 complex subunits produce a lowand uniform nuclear background when labeled with GFP.
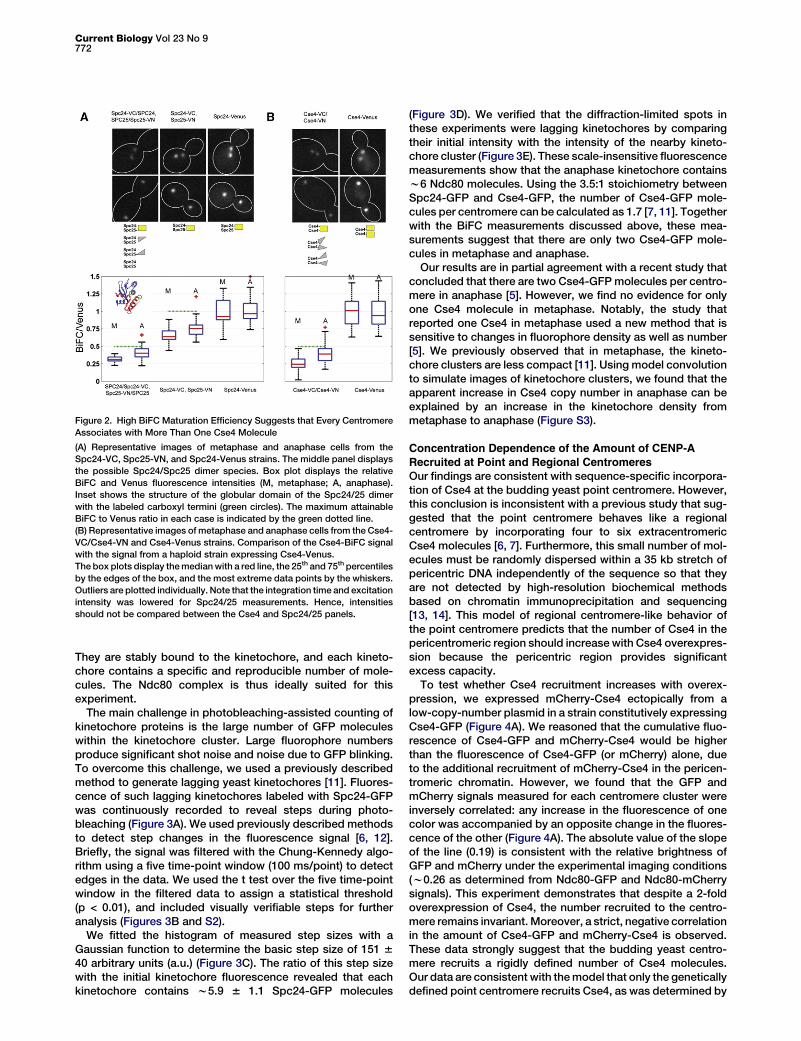
Figure 2. High BiFC Maturation Efficiency Suggests that Every Centromere
Associates with More Than One Cse4 Molecule
(A) Representative images of metaphase and anaphase cells from the
Spc24-VC, Spc25-VN, and Spc24-Venus strains. The middle panel displays
the possible Spc24/Spc25 dimer species. Box plot displays the relative
BiFC and Venus fluorescence intensities (M, metaphase; A, anaphase).
Inset shows the structure of the globular domain of the Spc24/25 dimer
with the labeled carboxyl termini (green circles). The maximum attainable
BiFC to Venus ratio in each case is indicated by the green dotted line.
(B) Representative images of metaphase and anaphase cells from the Cse4-
VC/Cse4-VN and Cse4-Venus strains. Comparison of the Cse4-BiFC signal
with the signal from a haploid strain expressing Cse4-Venus.
The box plots display themedianwith a red line, the 25th and 75th percentiles
by the edges of the box, and the most extreme data points by the whiskers.
Outliers are plotted individually. Note that the integration time and excitation
intensity was lowered for Spc24/25 measurements. Hence, intensities
should not be compared between the Cse4 and Spc24/25 panels.
Current Biology Vol 23 No 9772
They are stably bound to the kinetochore, and each kineto-chore contains a specific and reproducible number of mole-cules. The Ndc80 complex is thus ideally suited for thisexperiment.
The main challenge in photobleaching-assisted counting ofkinetochore proteins is the large number of GFP moleculeswithin the kinetochore cluster. Large fluorophore numbersproduce significant shot noise and noise due to GFP blinking.To overcome this challenge, we used a previously describedmethod to generate lagging yeast kinetochores [11]. Fluores-cence of such lagging kinetochores labeled with Spc24-GFPwas continuously recorded to reveal steps during photo-bleaching (Figure 3A). We used previously described methodsto detect step changes in the fluorescence signal [6, 12].Briefly, the signal was filtered with the Chung-Kennedy algo-rithm using a five time-point window (100 ms/point) to detectedges in the data. We used the t test over the five time-pointwindow in the filtered data to assign a statistical threshold(p < 0.01), and included visually verifiable steps for furtheranalysis (Figures 3B and S2).
We fitted the histogram of measured step sizes with aGaussian function to determine the basic step size of 151 640 arbitrary units (a.u.) (Figure 3C). The ratio of this step sizewith the initial kinetochore fluorescence revealed that eachkinetochore contains w5.9 6 1.1 Spc24-GFP molecules
(Figure 3D). We verified that the diffraction-limited spots inthese experiments were lagging kinetochores by comparingtheir initial intensity with the intensity of the nearby kineto-chore cluster (Figure 3E). These scale-insensitive fluorescencemeasurements show that the anaphase kinetochore containsw6 Ndc80 molecules. Using the 3.5:1 stoichiometry betweenSpc24-GFP and Cse4-GFP, the number of Cse4-GFP mole-cules per centromere can be calculated as 1.7 [7, 11]. Togetherwith the BiFC measurements discussed above, these mea-surements suggest that there are only two Cse4-GFP mole-cules in metaphase and anaphase.Our results are in partial agreement with a recent study that
concluded that there are two Cse4-GFPmolecules per centro-mere in anaphase [5]. However, we find no evidence for onlyone Cse4 molecule in metaphase. Notably, the study thatreported one Cse4 in metaphase used a new method that issensitive to changes in fluorophore density as well as number[5]. We previously observed that in metaphase, the kineto-chore clusters are less compact [11]. Using model convolutionto simulate images of kinetochore clusters, we found that theapparent increase in Cse4 copy number in anaphase can beexplained by an increase in the kinetochore density frommetaphase to anaphase (Figure S3).
Concentration Dependence of the Amount of CENP-A
Recruited at Point and Regional CentromeresOur findings are consistent with sequence-specific incorpora-tion of Cse4 at the budding yeast point centromere. However,this conclusion is inconsistent with a previous study that sug-gested that the point centromere behaves like a regionalcentromere by incorporating four to six extracentromericCse4 molecules [6, 7]. Furthermore, this small number of mol-ecules must be randomly dispersed within a 35 kb stretch ofpericentric DNA independently of the sequence so that theyare not detected by high-resolution biochemical methodsbased on chromatin immunoprecipitation and sequencing[13, 14]. This model of regional centromere-like behavior ofthe point centromere predicts that the number of Cse4 in thepericentromeric region should increase with Cse4 overexpres-sion because the pericentric region provides significantexcess capacity.To test whether Cse4 recruitment increases with overex-
pression, we expressed mCherry-Cse4 ectopically from alow-copy-number plasmid in a strain constitutively expressingCse4-GFP (Figure 4A). We reasoned that the cumulative fluo-rescence of Cse4-GFP and mCherry-Cse4 would be higherthan the fluorescence of Cse4-GFP (or mCherry) alone, dueto the additional recruitment of mCherry-Cse4 in the pericen-tromeric chromatin. However, we found that the GFP andmCherry signals measured for each centromere cluster wereinversely correlated: any increase in the fluorescence of onecolor was accompanied by an opposite change in the fluores-cence of the other (Figure 4A). The absolute value of the slopeof the line (0.19) is consistent with the relative brightness ofGFP and mCherry under the experimental imaging conditions(w0.26 as determined from Ndc80-GFP and Ndc80-mCherrysignals). This experiment demonstrates that despite a 2-foldoverexpression of Cse4, the number recruited to the centro-mere remains invariant. Moreover, a strict, negative correlationin the amount of Cse4-GFP and mCherry-Cse4 is observed.These data strongly suggest that the budding yeast centro-mere recruits a rigidly defined number of Cse4 molecules.Our data are consistent with themodel that only the geneticallydefined point centromere recruits Cse4, as was determined by
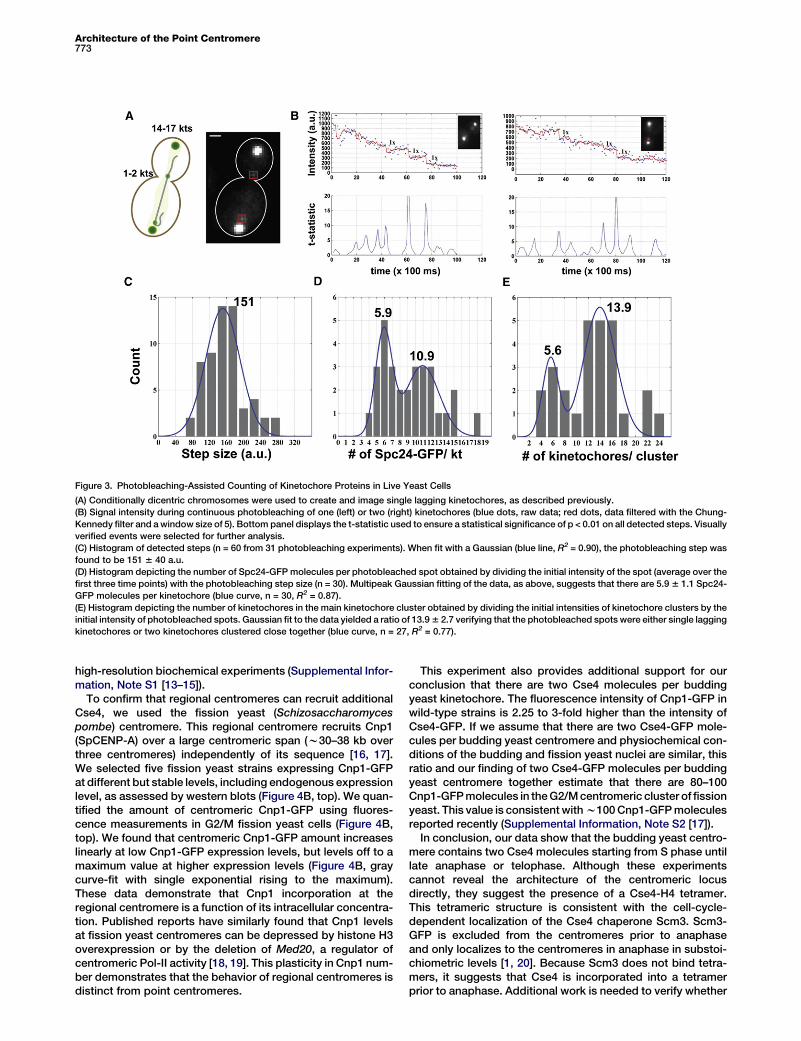
Figure 3. Photobleaching-Assisted Counting of Kinetochore Proteins in Live Yeast Cells
(A) Conditionally dicentric chromosomes were used to create and image single lagging kinetochores, as described previously.
(B) Signal intensity during continuous photobleaching of one (left) or two (right) kinetochores (blue dots, raw data; red dots, data filtered with the Chung-
Kennedy filter and awindow size of 5). Bottom panel displays the t-statistic used to ensure a statistical significance of p < 0.01 on all detected steps. Visually
verified events were selected for further analysis.
(C) Histogram of detected steps (n = 60 from 31 photobleaching experiments). When fit with a Gaussian (blue line, R2 = 0.90), the photobleaching step was
found to be 151 6 40 a.u.
(D) Histogram depicting the number of Spc24-GFP molecules per photobleached spot obtained by dividing the initial intensity of the spot (average over the
first three time points) with the photobleaching step size (n = 30). Multipeak Gaussian fitting of the data, as above, suggests that there are 5.96 1.1 Spc24-
GFP molecules per kinetochore (blue curve, n = 30, R2 = 0.87).
(E) Histogram depicting the number of kinetochores in the main kinetochore cluster obtained by dividing the initial intensities of kinetochore clusters by the
initial intensity of photobleached spots. Gaussian fit to the data yielded a ratio of 13.96 2.7 verifying that the photobleached spots were either single lagging
kinetochores or two kinetochores clustered close together (blue curve, n = 27, R2 = 0.77).
Architecture of the Point Centromere773
high-resolution biochemical experiments (Supplemental Infor-mation, Note S1 [13–15]).
To confirm that regional centromeres can recruit additionalCse4, we used the fission yeast (Schizosaccharomycespombe) centromere. This regional centromere recruits Cnp1(SpCENP-A) over a large centromeric span (w30–38 kb overthree centromeres) independently of its sequence [16, 17].We selected five fission yeast strains expressing Cnp1-GFPat different but stable levels, including endogenous expressionlevel, as assessed by western blots (Figure 4B, top). We quan-tified the amount of centromeric Cnp1-GFP using fluores-cence measurements in G2/M fission yeast cells (Figure 4B,top). We found that centromeric Cnp1-GFP amount increaseslinearly at low Cnp1-GFP expression levels, but levels off to amaximum value at higher expression levels (Figure 4B, graycurve-fit with single exponential rising to the maximum).These data demonstrate that Cnp1 incorporation at theregional centromere is a function of its intracellular concentra-tion. Published reports have similarly found that Cnp1 levelsat fission yeast centromeres can be depressed by histone H3overexpression or by the deletion of Med20, a regulator ofcentromeric Pol-II activity [18, 19]. This plasticity in Cnp1 num-ber demonstrates that the behavior of regional centromeres isdistinct from point centromeres.
This experiment also provides additional support for ourconclusion that there are two Cse4 molecules per buddingyeast kinetochore. The fluorescence intensity of Cnp1-GFP inwild-type strains is 2.25 to 3-fold higher than the intensity ofCse4-GFP. If we assume that there are two Cse4-GFP mole-cules per budding yeast centromere and physiochemical con-ditions of the budding and fission yeast nuclei are similar, thisratio and our finding of two Cse4-GFP molecules per buddingyeast centromere together estimate that there are 80–100Cnp1-GFPmolecules in theG2/Mcentromeric cluster of fissionyeast. This value is consistentwithw100Cnp1-GFPmoleculesreported recently (Supplemental Information, Note S2 [17]).In conclusion, our data show that the budding yeast centro-
mere contains two Cse4 molecules starting from S phase untillate anaphase or telophase. Although these experimentscannot reveal the architecture of the centromeric locusdirectly, they suggest the presence of a Cse4-H4 tetramer.This tetrameric structure is consistent with the cell-cycle-dependent localization of the Cse4 chaperone Scm3. Scm3-GFP is excluded from the centromeres prior to anaphaseand only localizes to the centromeres in anaphase in substoi-chiometric levels [1, 20]. Because Scm3 does not bind tetra-mers, it suggests that Cse4 is incorporated into a tetramerprior to anaphase. Additional work is needed to verify whether
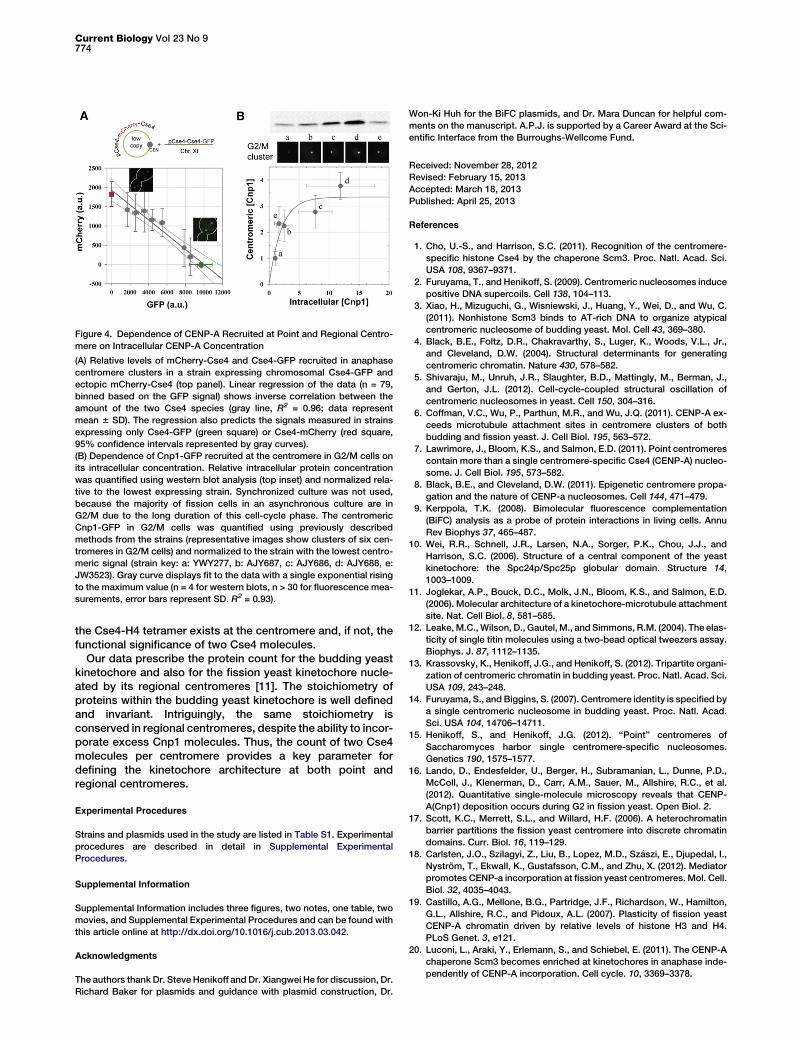
Figure 4. Dependence of CENP-A Recruited at Point and Regional Centro-
mere on Intracellular CENP-A Concentration
(A) Relative levels of mCherry-Cse4 and Cse4-GFP recruited in anaphase
centromere clusters in a strain expressing chromosomal Cse4-GFP and
ectopic mCherry-Cse4 (top panel). Linear regression of the data (n = 79,
binned based on the GFP signal) shows inverse correlation between the
amount of the two Cse4 species (gray line, R2 = 0.96; data represent
mean 6 SD). The regression also predicts the signals measured in strains
expressing only Cse4-GFP (green square) or Cse4-mCherry (red square,
95% confidence intervals represented by gray curves).
(B) Dependence of Cnp1-GFP recruited at the centromere in G2/M cells on
its intracellular concentration. Relative intracellular protein concentration
was quantified using western blot analysis (top inset) and normalized rela-
tive to the lowest expressing strain. Synchronized culture was not used,
because the majority of fission cells in an asynchronous culture are in
G2/M due to the long duration of this cell-cycle phase. The centromeric
Cnp1-GFP in G2/M cells was quantified using previously described
methods from the strains (representative images show clusters of six cen-
tromeres in G2/M cells) and normalized to the strain with the lowest centro-
meric signal (strain key: a: YWY277, b: AJY687, c: AJY686, d: AJY688, e:
JW3523). Gray curve displays fit to the data with a single exponential rising
to the maximum value (n = 4 for western blots, n > 30 for fluorescence mea-
surements, error bars represent SD. R2 = 0.93).
Current Biology Vol 23 No 9774
the Cse4-H4 tetramer exists at the centromere and, if not, thefunctional significance of two Cse4 molecules.
Our data prescribe the protein count for the budding yeastkinetochore and also for the fission yeast kinetochore nucle-ated by its regional centromeres [11]. The stoichiometry ofproteins within the budding yeast kinetochore is well definedand invariant. Intriguingly, the same stoichiometry isconserved in regional centromeres, despite the ability to incor-porate excess Cnp1 molecules. Thus, the count of two Cse4molecules per centromere provides a key parameter fordefining the kinetochore architecture at both point andregional centromeres.
Experimental Procedures
Strains and plasmids used in the study are listed in Table S1. Experimental
procedures are described in detail in Supplemental Experimental
Procedures.
Supplemental Information
Supplemental Information includes three figures, two notes, one table, two
movies, and Supplemental Experimental Procedures and can be found with
this article online at http://dx.doi.org/10.1016/j.cub.2013.03.042.
Acknowledgments
The authors thank Dr. SteveHenikoff and Dr. Xiangwei He for discussion, Dr.
Richard Baker for plasmids and guidance with plasmid construction, Dr.
Won-Ki Huh for the BiFC plasmids, and Dr. Mara Duncan for helpful com-
ments on the manuscript. A.P.J. is supported by a Career Award at the Sci-
entific Interface from the Burroughs-Wellcome Fund.
Received: November 28, 2012
Revised: February 15, 2013
Accepted: March 18, 2013
Published: April 25, 2013
References
1. Cho, U.-S., and Harrison, S.C. (2011). Recognition of the centromere-
specific histone Cse4 by the chaperone Scm3. Proc. Natl. Acad. Sci.
USA 108, 9367–9371.
2. Furuyama, T., and Henikoff, S. (2009). Centromeric nucleosomes induce
positive DNA supercoils. Cell 138, 104–113.
3. Xiao, H., Mizuguchi, G., Wisniewski, J., Huang, Y., Wei, D., and Wu, C.
(2011). Nonhistone Scm3 binds to AT-rich DNA to organize atypical
centromeric nucleosome of budding yeast. Mol. Cell 43, 369–380.
4. Black, B.E., Foltz, D.R., Chakravarthy, S., Luger, K., Woods, V.L., Jr.,
and Cleveland, D.W. (2004). Structural determinants for generating
centromeric chromatin. Nature 430, 578–582.
5. Shivaraju, M., Unruh, J.R., Slaughter, B.D., Mattingly, M., Berman, J.,
and Gerton, J.L. (2012). Cell-cycle-coupled structural oscillation of
centromeric nucleosomes in yeast. Cell 150, 304–316.
6. Coffman, V.C., Wu, P., Parthun, M.R., and Wu, J.Q. (2011). CENP-A ex-
ceeds microtubule attachment sites in centromere clusters of both
budding and fission yeast. J. Cell Biol. 195, 563–572.
7. Lawrimore, J., Bloom, K.S., and Salmon, E.D. (2011). Point centromeres
contain more than a single centromere-specific Cse4 (CENP-A) nucleo-
some. J. Cell Biol. 195, 573–582.
8. Black, B.E., and Cleveland, D.W. (2011). Epigenetic centromere propa-
gation and the nature of CENP-a nucleosomes. Cell 144, 471–479.
9. Kerppola, T.K. (2008). Bimolecular fluorescence complementation
(BiFC) analysis as a probe of protein interactions in living cells. Annu
Rev Biophys 37, 465–487.
10. Wei, R.R., Schnell, J.R., Larsen, N.A., Sorger, P.K., Chou, J.J., and
Harrison, S.C. (2006). Structure of a central component of the yeast
kinetochore: the Spc24p/Spc25p globular domain. Structure 14,
1003–1009.
11. Joglekar, A.P., Bouck, D.C., Molk, J.N., Bloom, K.S., and Salmon, E.D.
(2006). Molecular architecture of a kinetochore-microtubule attachment
site. Nat. Cell Biol. 8, 581–585.
12. Leake,M.C.,Wilson, D., Gautel, M., andSimmons, R.M. (2004). The elas-
ticity of single titin molecules using a two-bead optical tweezers assay.
Biophys. J. 87, 1112–1135.
13. Krassovsky, K., Henikoff, J.G., and Henikoff, S. (2012). Tripartite organi-
zation of centromeric chromatin in budding yeast. Proc. Natl. Acad. Sci.
USA 109, 243–248.
14. Furuyama, S., and Biggins, S. (2007). Centromere identity is specified by
a single centromeric nucleosome in budding yeast. Proc. Natl. Acad.
Sci. USA 104, 14706–14711.
15. Henikoff, S., and Henikoff, J.G. (2012). ‘‘Point’’ centromeres of
Saccharomyces harbor single centromere-specific nucleosomes.
Genetics 190, 1575–1577.
16. Lando, D., Endesfelder, U., Berger, H., Subramanian, L., Dunne, P.D.,
McColl, J., Klenerman, D., Carr, A.M., Sauer, M., Allshire, R.C., et al.
(2012). Quantitative single-molecule microscopy reveals that CENP-
A(Cnp1) deposition occurs during G2 in fission yeast. Open Biol. 2.
17. Scott, K.C., Merrett, S.L., and Willard, H.F. (2006). A heterochromatin
barrier partitions the fission yeast centromere into discrete chromatin
domains. Curr. Biol. 16, 119–129.
18. Carlsten, J.O., Szilagyi, Z., Liu, B., Lopez, M.D., Szaszi, E., Djupedal, I.,
Nystrom, T., Ekwall, K., Gustafsson, C.M., and Zhu, X. (2012). Mediator
promotes CENP-a incorporation at fission yeast centromeres. Mol. Cell.
Biol. 32, 4035–4043.
19. Castillo, A.G., Mellone, B.G., Partridge, J.F., Richardson, W., Hamilton,
G.L., Allshire, R.C., and Pidoux, A.L. (2007). Plasticity of fission yeast
CENP-A chromatin driven by relative levels of histone H3 and H4.
PLoS Genet. 3, e121.
20. Luconi, L., Araki, Y., Erlemann, S., and Schiebel, E. (2011). The CENP-A
chaperone Scm3 becomes enriched at kinetochores in anaphase inde-
pendently of CENP-A incorporation. Cell cycle. 10, 3369–3378.